Article

Vulnerability Assessment for Power Transmission Lines under Typhoon Weather Based on a Cascading Failure State Transition Diagram

1
State Key Laboratory of Disaster Prevention and Reduction for Power Grid Transmission and Distribution Equipment, Changsha 410129, China
2
School of Electric Power Engineering, South China University of Technology, Guangzhou 510640, China
*
Author to whom correspondence should be addressed.
Energies 2020, 13(14), 3681; https://doi.org/10.3390/en13143681
Submission received: 18 May 2020 / Revised: 29 June 2020 / Accepted: 12 July 2020 / Published: 17 July 2020
(This article belongs to the Section A1: Smart Grids and Microgrids)

Abstract

:
The analysis of the fault propagation path of transmission lines and the method of identification of vulnerable lines during typhoon weather conditions is of great significance. In this context, this paper introduces the failure probability model of transmission lines under such conditions by considering both wind speed and the load of the lines. The Monte Carlo simulation (MCS) and the DC model based on OPA are applied to simulate the failure of transmission lines. The cascading failure state transition diagram (CFSTD) is proposed based on the failure chains and the criticality ranking of nodes in CFSTD by the average weight coefficient (AWC) for identifying vulnerable lines of the power grid under such conditions. A new weight in CFSTD is proposed to describe the vulnerability of each line and a new resilience index is used to assess the impacts of a typhoon on the system. The proposed method is demonstrated by using the modified IEEE 118-bus test system. Results show that the method proposed in this paper can simulate the fault propagation path, and identify the critical components of power grid under a typhoon.

1. Introduction

The frequency and perniciousness of extreme weather events around the world have increased dramatically in recent years because of climate change [1]. These high-impact, low-probability (HILP) events may cause massive power outages due to vulnerable components under these events. Take Hurricane Harvey as an example. The strong wind caused great power outages in Texas lasting over two weeks [2]. This clearly highlights the importance to study the mechanism of the impacts on power systems under extreme events, understand failure forms, and identify the vulnerability of power systems in extreme weather to enhance their resilience.
Unlike the well-known concept of reliability for power systems, “resilience” is novel in the field of systems and was first applied to ecological systems in 1973, which is a measure of the persistence of ecological systems and of their ability to absorb change and disturbance [3]. In recent years, the ability of power systems to anticipate, absorb, adapt to, and/or rapidly recover from extreme weather events, namely resilience, has been commonly accepted because of the increasing occurrence of extreme weather events [4]. Compared with the performance of the systems under normal weather conditions, the failure probability of components in the systems under extreme events increased greatly, while the repair speed inversely reduced due to severe weather conditions.
With the increasing of frequency and intensity of HILP events, many researchers have focused on the resilience of the power systems under extreme events, including resilience definitions, methods for evaluating the impacts of extreme weather on the systems, quantitative evaluation metrics, and resilience enhancement strategies. Ref. [5] proposed the concept of a resilience trapezoid for the first time, which divided performance of the power system under extreme weather into three phases: disturbance progress, post-disturbance degraded and restorative state, reflecting the resistance, response, and recovery capability of the system, respectively. The MCS and the DC model based on OPA have been widely used in simulating the operation of components during extreme events [6,7,8,9]. Resilience metrics can be categorized into metrics based on resilience features, codes, and reliability [10]. These metrics evaluate resilience of the system in terms of its performance in extreme weather, consequences, efficiency, and economy of recovery. The Φ Λ E Π metric was proposed in [5] ( Φ denotes how fast resilience drops, Λ represents how low resilience drops, E means how extensive the post-disturbance degraded state is and Π expresses how promptly the network recovers) to assess the resilience trapezoid associated with an event. Based on that, an area metric was added in [11], and the residence index considering disruption (RICD), which considered the characteristics of an extreme event from the view of the disruption that impacts a target system as proposed in [12], along with the loss of energy expectation (LOEE) [8] and loss of load probability (LOLP), Ref. [13] proposed to evaluate the consequences of the systems. Ref. [14] considered the economic factor to propose the total cost ( T C O S T ) of the interdependent power and natural gas (NG) systems, and [15] used load importance as a basis to propose the RSE evaluating the ability to quickly and efficiently recover a system with minimal economic costs. Resilience enhancement strategies mainly include improving robustness and reducing response and recovery time [7]. Furthermore, the application of mobile emergency resources and energy storage units has been proven to enhance the resilience of the power grid, namely the optimal operation of mobile energy resources and transportable energy storage [16,17].
In recent studies, the performance of power systems under extreme events also takes into account the impacts of other related systems, such as NG systems. In [14], the highly interdependent model of power and NG systems was developed, and, in general, the interdependent networks are more vulnerable to extreme weather. The impacts of a typhoon on power systems is mainly its strong winds and heavy rain. Therefore, photovoltaic (PV) power generation equipment and wind turbines in the system will be greatly affected. Ref. [2] proposed that, as the capacity of PV and wind turbines increases, the resilience of the power grid decreases, and the recovery costs increase significantly. In addition, a cyber attack is a special kind of resilience event. The performance of cyber power physical systems under cyber attacks may become an important research direction in the future [18].
However, few studies exist addressing the vulnerability assessment of the power systems under extreme weather. In [19,20], a traversing method is adopted, which assumes that a transmission line is reliable enough to never fail, and the critical lines of the system are ranked according to the sequence of consequences. The traversing method, however, is limited because it takes much time and computing resources to identify the vulnerable lines in large-scale networks.
These studies mainly focus on the consequences of extreme events on the systems and ignore the failure development process. Moreover, few effective methods are presented to assess the vulnerability of systems to extreme weather. On the above premises, this paper presents a vulnerability assessment to identify the critical components of the power system under a typhoon. The main contributions of this research include: (1) A new vulnerability assessment index is proposed, which considers the importance of the lines in the developed cascading failure state transition diagram (CFSTD); (2) the construction of CFSTD is based on the cascading failure chains, which considers both the sequence of failed lines and the consequence of failure chains; and (3) the development of a cascading failure model of transmission lines under a typhoon using the derived failure probability. To illustrate applicability of the proposed framework, a test system located in the coastal areas of South China under a typhoon that hit China in 2013 is studied.
The rest of the paper is organized as follows: Section 2 describes the framework of the resilience assessment. Section 3 introduces the failure probability model of transmission lines under typhoon weather. The cascading failure model is proposed in Section 4. Section 5 develops a vulnerability assessment based on the CFSTD. In Section 6, the proposed method is implemented in a numerical case study. Finally, conclusions are given.

2. Framework Design Resilience Assessment

The proposed method for modeling the performance and identifying vulnerable components of a power system under a typhoon is shown Figure 1. This framework includes the typhoon impacts model, which calculates the failure probability of lines based on wind speed and power flow, a cascading failure model, which applies the MCS and the DC model based on OPA to simulate the operation of the grid, and the vulnerability assessment model, which builds the CFSTD for identifying the critical lines. Finally, resilience enhancement measures were proposed based on the vulnerability of the lines.
(1) The first part is the typhoon impacts model, which evaluates the effect of a typhoon on transmission lines, since the indoor substations and generators are considered 100% reliable during a typhoon. The failure probability considers both the disconnection and overload caused by strong wind and the change of the power flow, respectively.
(2) The second part is the cascading failure model, which uses the MCS to simulate the failure of transmission lines under a typhoon, and the DC model based on OPA to calculate the power flow and optimal load reduction. The output of this model are failure chains of lines and loss of load expectation (LOLE).
(3) The last part is the vulnerability assessment model. The CFSTD derived from the failure chains describes the transfer of the lines’ failure, and applies the AWC index to evaluate the importance of nodes in the CFSTD. Finally, the resilience enhancement measures based on the vulnerability of the lines are proposed.

3. Evaluation of Typhoon Impacts on Transmission Lines

The impacts of a typhoon on the power system are mainly due to its strong wind speed, which may lead to direct or indirect grounding of transmission lines, causing a short circuit or disconnection of such lines, and rendering them out of service. When portion of lines are out of service, the power flow of the system changes, and the remaining lines have the risk of exceeding the limit, which triggers a large-scale power outage. Therefore, this paper mainly focuses on the influence of wind speed and load of transmission lines in a typhoon, and does not consider derivative disasters.

3.1. Wind Speed Model of Typhoons

The modified Rankine vortex model has been proved to have its capability to reproduce the wind field data measured by buoy and aircraft for Hurricane Iniki [21]. It has been widely employed to simulate the wind field of typhoons [22,23]. The modified Rankine vortex model assumes that the wind flow in an idealized stationary tropical cyclone is represented by concentric circles. Its wind speed in the center is zero and increases steeply to its maximum at the radius of the maximum wind speed, and then decreases to zero as the radius continues to increase. The wind speed distribution of the modified Rankine vortex model is defined as follows:
V = V max r R mw X r < R mw V max R mw r X R mw r
where r is the radial distance from the center of a typhoon, R mw is the radius of the maximum winds, and V max is the max wind speed at that moment. This model requires user specified parameters as R mw and V max instead of calculating wind fields based on the central pressure. The shape parameter X is to adjust the wind speed distribution, which in a range of 0.4 < X < 0.6 [24].

3.2. Outage Model for Transmission Lines

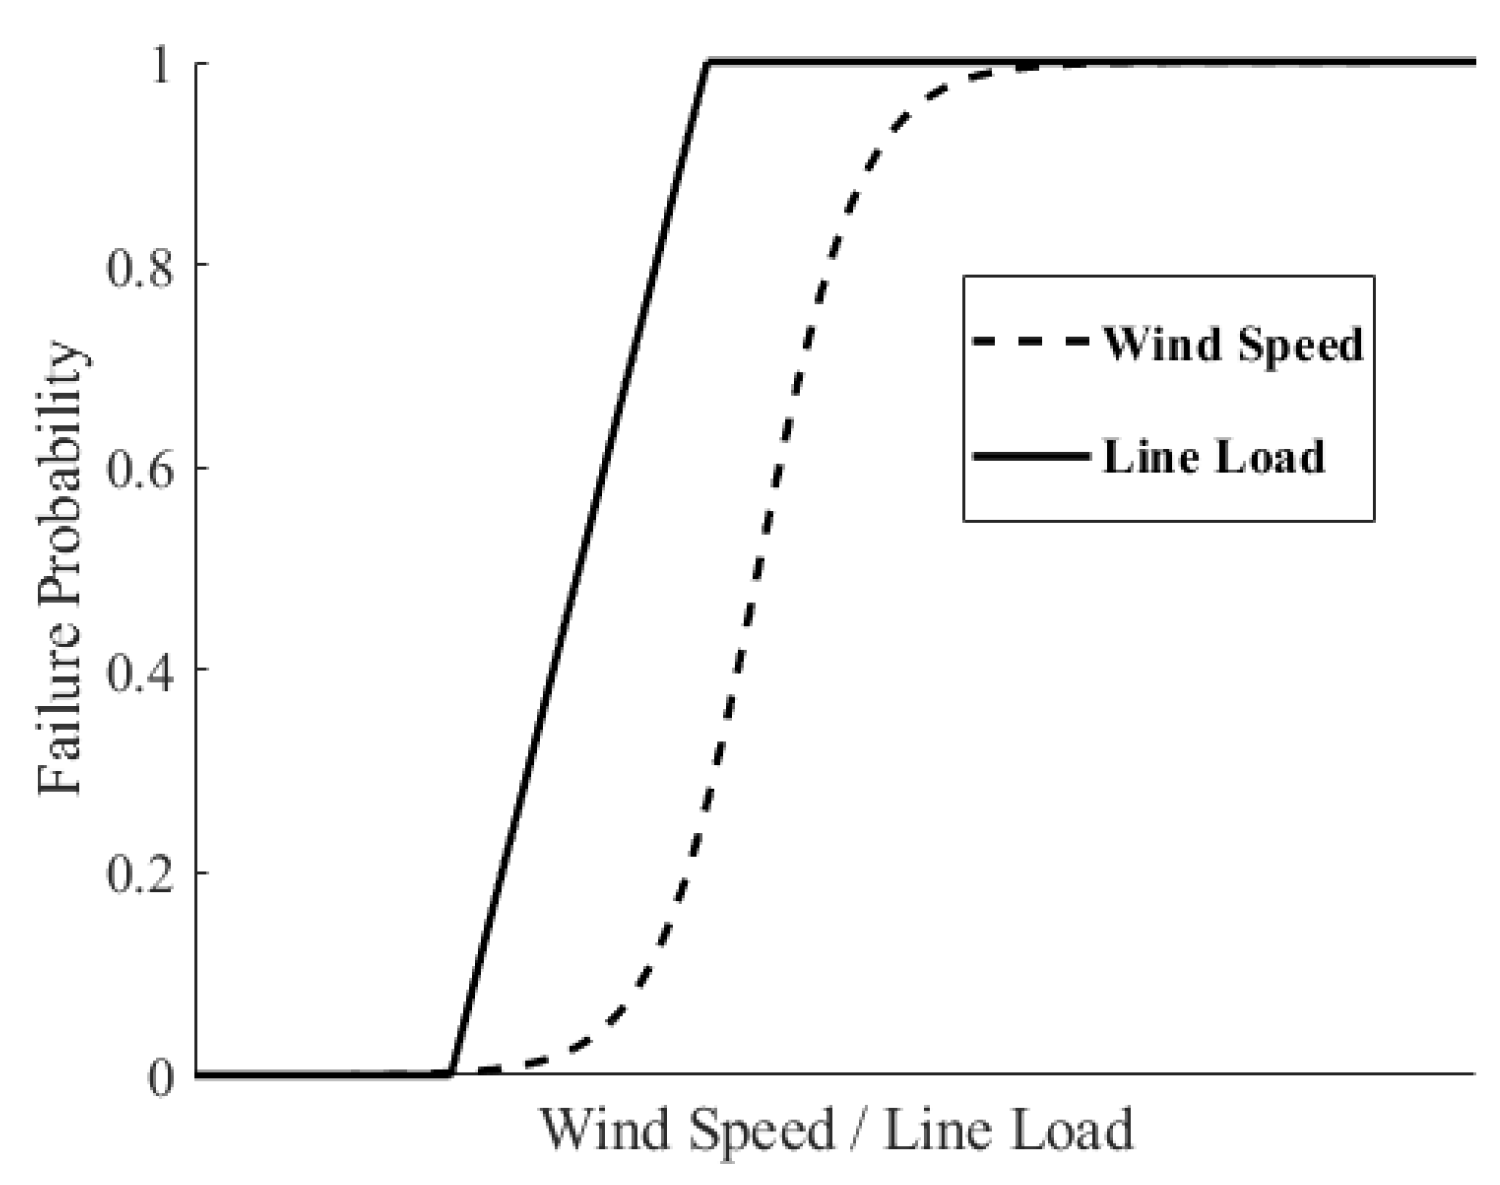
During a typhoon, the strong winds may cause faults such as a short circuit and disconnection in transmission lines. When some lines fail due to a typhoon, the power flow of some lines may be cut off and out of service due to the dramatic change of power flow. Therefore, this paper takes the impacts of wind speed and power flow on the lines into account. The fragility curves of a transmission line are shown (Figure 2 [6]).

3.2.1. Impacts of Weather Condition on Transmission Lines

During a typhoon, the fierce wind may cause the line to break, trees to collapse, and other damages that affect the operation of lines, and render them out of service. It can be seen from (1) that the wind speed on the transmission line is determined by its radial distance from the typhoon center. This is due to the long distance between two buses in a system, while the wind speed varies on the same transmission line. In order to improve the computational efficiency and without loss of generality, the transmission line is divided into an appropriate number of equal segments based on its location, with the wind speed of each segment being equal to its central wind speed. Then, the failure probability of segment i in line m caused by the weather conditions (wind speed) is as follows:
p m 1 i = 0 0 < v m i V d e s exp 0.6931 ( v m i V d e s ) V d e s 1 V d e s < v m i < 2 V d e s 1 2 V d e s v m i
where v m i is the wind speed of the center of segment i in line m, and V d e s is the design wind speed of the transmission line [25].
The failure probability of transmission line m is composed of k segments in a series that have the following form:
p m 1 = 1 i = 1 k 1 p m 1 i .

3.2.2. Impacts of Power Flow on Transmission Lines

When some transmission lines out of service due to strong wind, the topology of system changes and the power flow is redistributed. Ref. [26] shows that, when the power flow of a line exceeds its rated transmission capacity, the failure probability caused by hidden faults increases with the rising of the line’s power flow. The failure probability caused by power flow changes p m 2 is as follows:
p m 2 = p m 20 0 < P m P N 1 p m 20 P m P N P lim P N P N < P m P lim 1 P lim < P m
where p m 20 is the failure probability of line m under normal weather conditions, which highlights the impacts of a typhoon when assuming that p m 20 = 0 in this paper. Additionally, P m is the power of line m, and P N and P lim are the rated and ultimate power of line m, respectively.
Assuming that the failure probability of the lines caused by weather conditions and changes of power flow are independent, the failure probability of line m is:
p m = 1 i = 1 2 1 p m i .

4. Cascading Failure Model of Transmission Lines

The Monte Carlo-based cascading failure model evaluates the failure chains for transmission lines during a typhoon based on the location of the typhoon and the fragility curves of a transmission line. The MCS is a calculation method based on probability and statistics theory that can be used to provide approximate solutions to complex problems by massive simulations [27]. In this paper, the MCS is used to simulate the failure of transmission lines. To find more cascading failure chains for transmission lines in a typhoon, in each simulation step, all lines with failure probability greater than a random number are added to the candidate fault set, and, unlike [28], one of the lines is randomly selected as the failed line in the next step, in order to select the line with the highest fragility value as the failed line at the next step.
When the typhoon arrives, a portion of the transmission lines out of service and the power flow of the system is redistributed. Under both the line’s load and wind speed, more lines will drop out of service which may lead to power outages. As the typhoon wind field changes constantly with time, the failure probability of transmission lines also changes constantly. After obtaining the initial failure set, the line most likely to fail is selected as the subordinate fault line according to (5). The cascading failure model in this research is established by following three principles: (a) In each simulation step, only one of the lines in the candidate fault set is broken randomly, and the DC model based on OPA is used to adjust the generator output and load to ensure that the load of the remaining lines does not exceed the limit. (b) If there is no power plant in a sub-grid, all load in nodes cut down in that sub-grid; otherwise, the island reaches equilibrium based on DC-OPA. (c) When there are no more new failed lines, all sub-grids split or the impacts of the typhoon on the power system has ended, an MCS process will end and a chain of failure will be obtained.
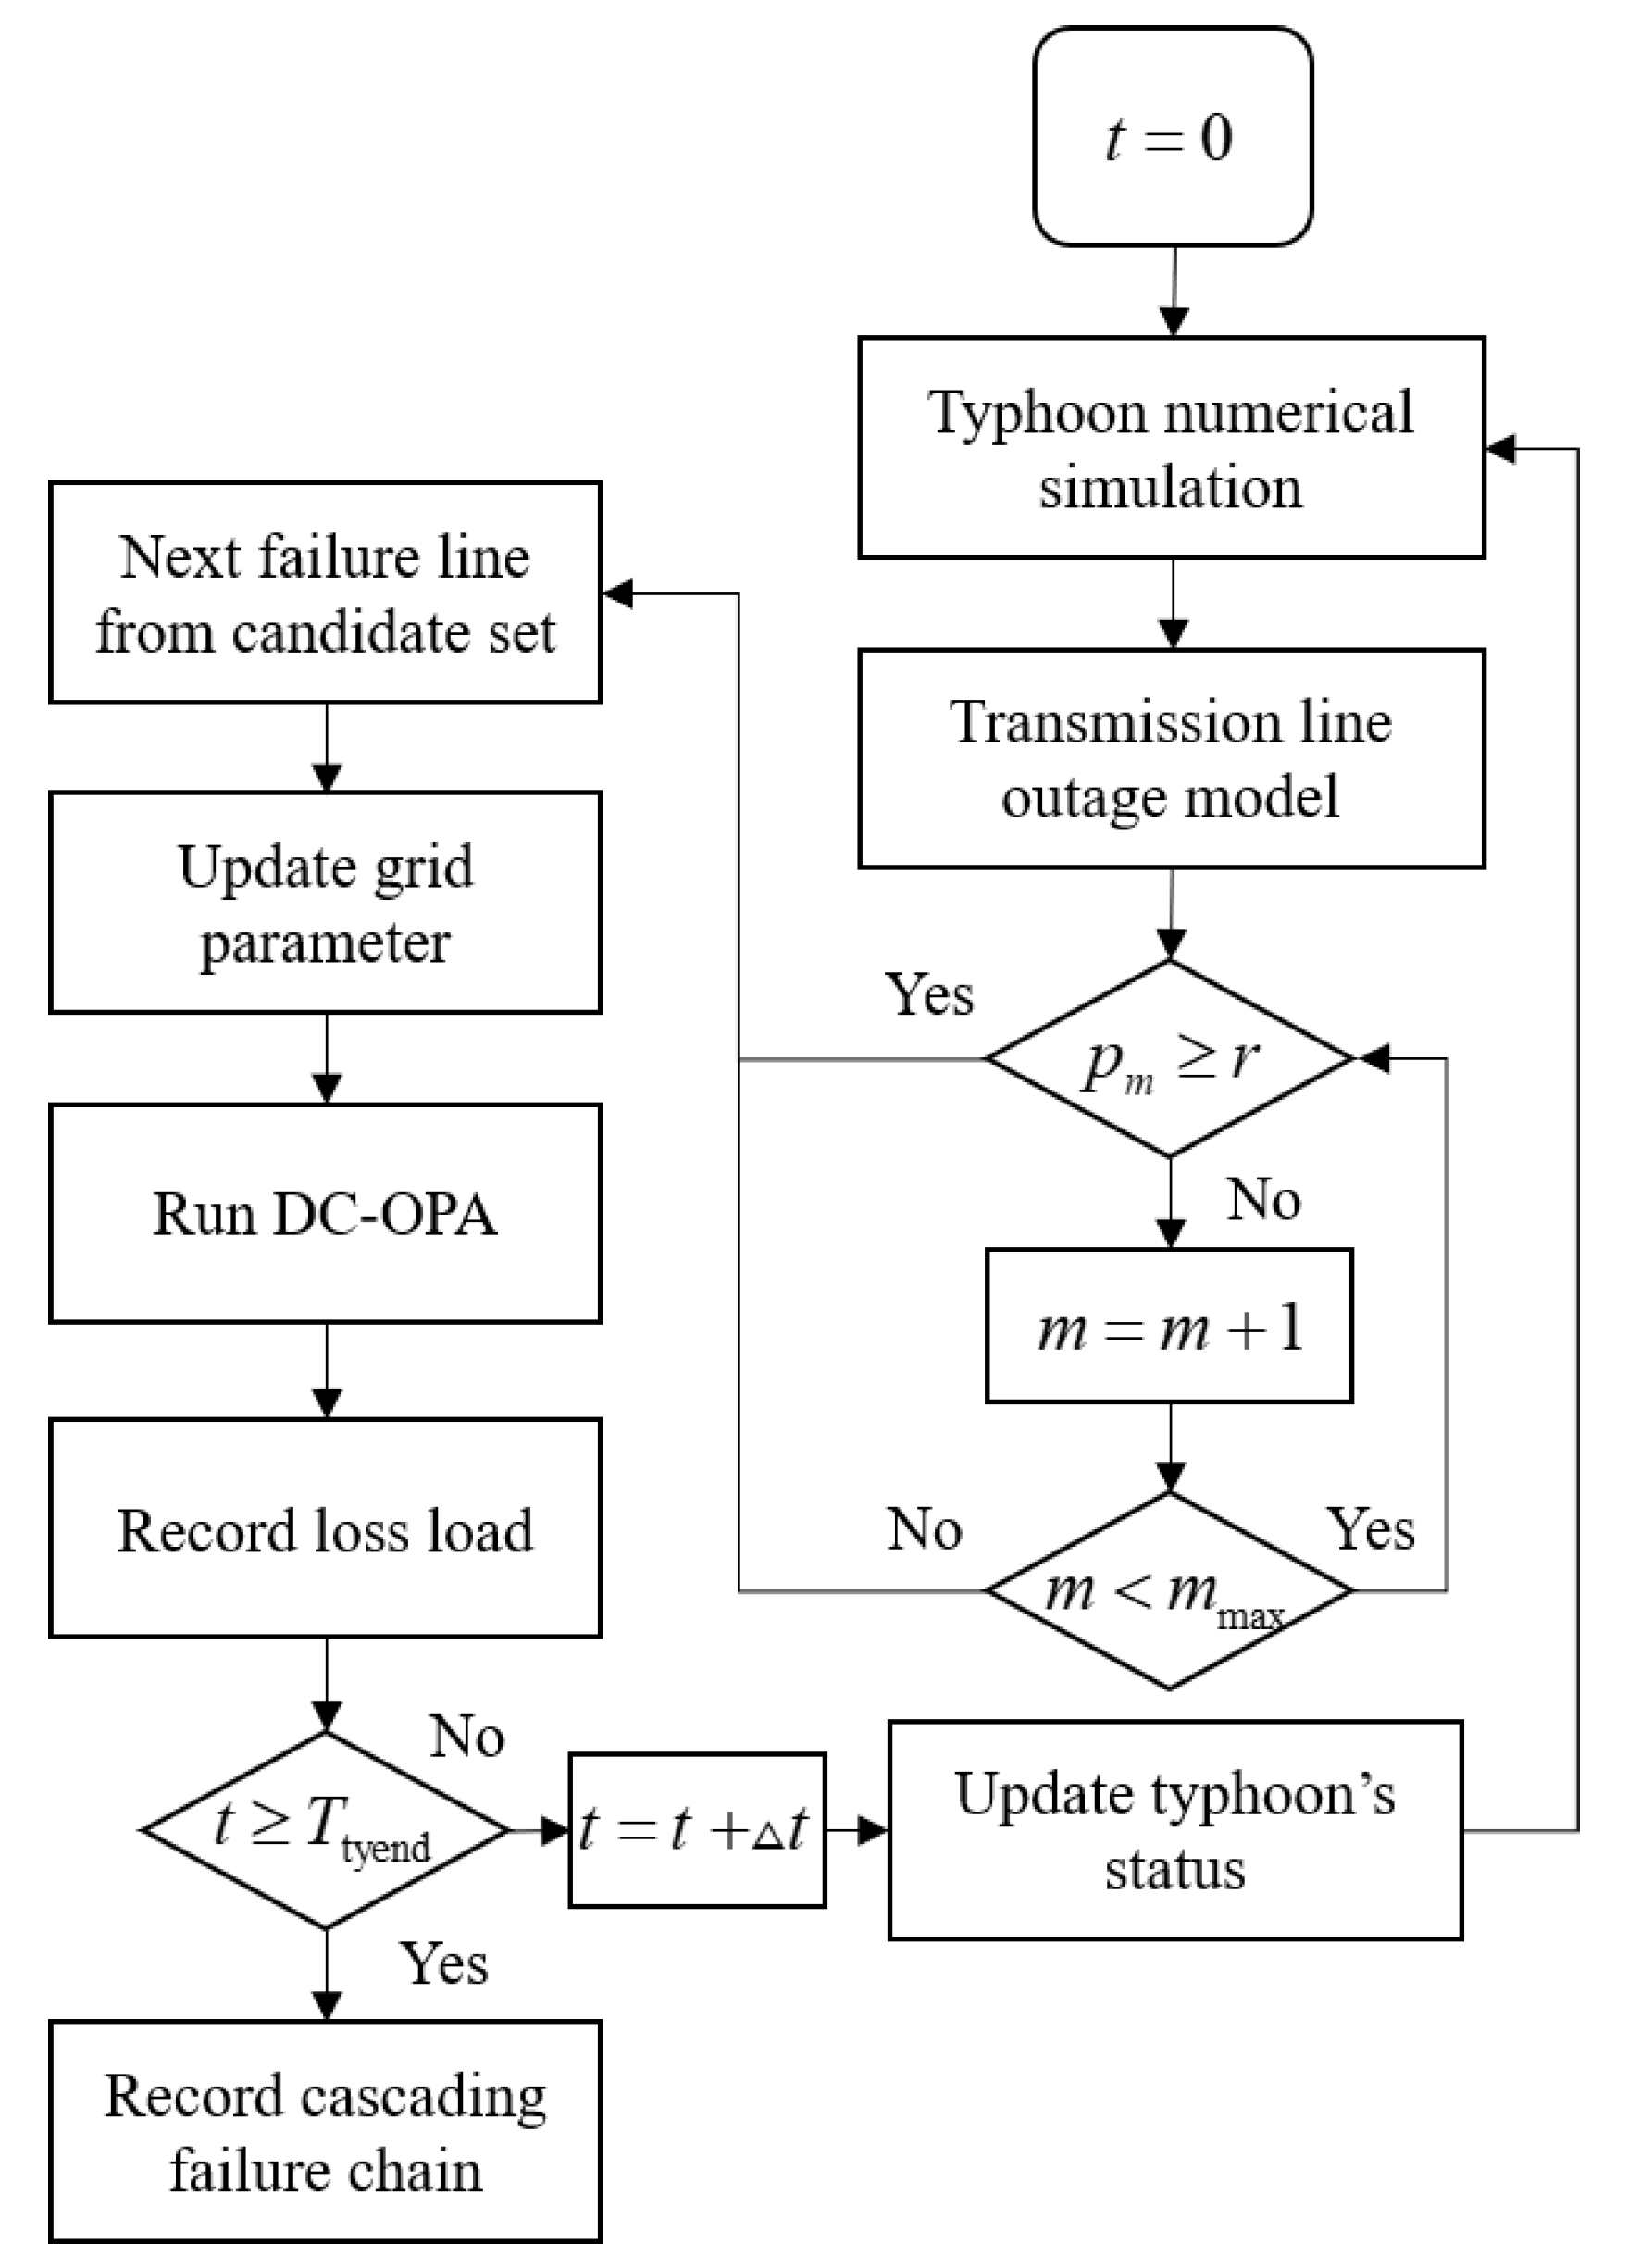
The cascading failure chains is obtained according to the proposed procedures for a cascading failure model (Figure 3). The MCS is applied to generate failure chains, while the appropriate dispatch tool is DC-OPA. In each step Δ t , the location and strength of the typhoon are updated. The failure probability of line m ( p m ) depends on its load and wind speed. To find more failure chains, p m compares with a random number r from a uniform distribution, if p m r , line m is added to the candidate fault set, and one of them is randomly selected as the subordinate disconnected line. Then, update the parameters of the grid, running DC-OPA and recording LOLE ( P loss ). If t is less than T tyend (the time that no more component failures because of the typhoon), the simulation increases one step ( Δ t ) and continues to run the loop until reaching the termination criterion. If t equals to T tyend , this simulation terminates and begins the next MCS. It is worth noting that the size of the simulation step ( Δ t ) is particularly important. If Δ t is too large, it is may ignore some failed lines, and a small Δ t may reduce the calculation efficiency greatly. After many attempts, it is determined that Δ t = 5 min would balance the above two points well.

5. Vulnerability Assessment Model

Based on research regarding cascading failure, it is found that the development of large-scale failures is always connected to vulnerable transmission lines, and the vulnerability of power grids is an important reason for cascading failure developing into outages. In this study, a novel vulnerability assessment method based on CFSTD is proposed.

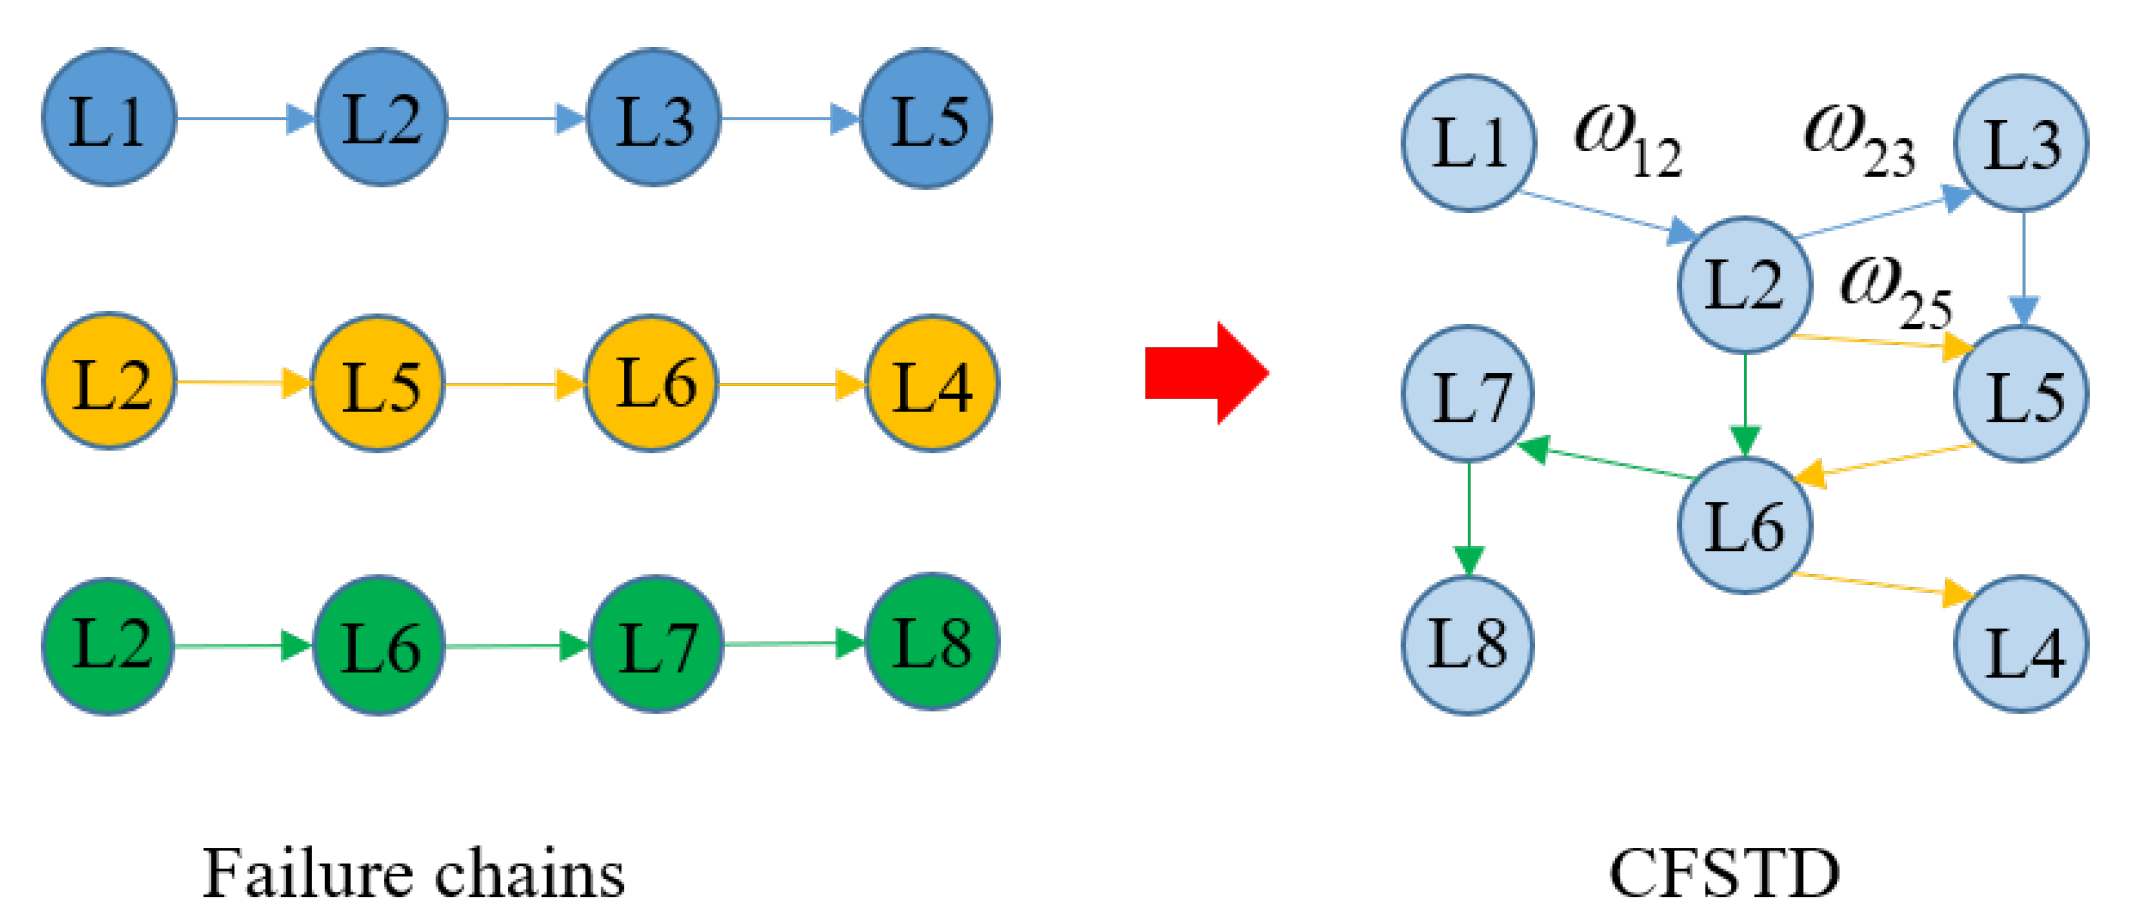
5.1. Cascading Failure State Transition Diagram

A cascading fault graph (CFG), which describes the relationship between failed lines is constructed by taking failed lines as virtual nodes, the correlation index as an edge weight, and an accident chain as a link [28]. The process of converting the accident chains into CFSTD is shown where L i is the transmission line number (Figure 4). There are several differences between failure chains in the typhoon scene and failure chains obtained by the traversal calculation method in [28]: (a) When a typhoon path is certain, the failure chain is relatively fixed, and the fault lines only account for a small part of the whole grid. (b) The ending condition is different while the ending condition in [28] is when LOLE of the system reaches a certain threshold. (c) The method described in [28] considers the possibility of all lines as initial faults, which is too redundant.
In this paper, the ending condition is when there are no more new failed lines or system splitting; therefore, the failure chain is not long enough to reflect the harm of the cascading failure. Additionally, if the typhoon’s influence area is larger, then the fault chain is long, leading to massive power outages. Thus, the weight between the node pair ( L i , L j ) of different failure chains in the CFSTD is defined as below:
ω i j = c = 1 h Δ P i j × p i j × P loss , F n F
where h is the number of failure chains contained in ( L i , L j ) , n F is the number of lines in chain F, which is the length of the failure chain. p i j and Δ P i j are the failure probability and the loss of load of line j from being out of service while line i faulted, respectively. The product of them represents the risk of fault transfer from line i to j, and it shows the importance of ( L i , L j ) in a failure chain. P loss , F is the loss of load of chain F (LOLF). The ratio between P loss , F and n F represents the damage of chain F to the power system. When n F is certain, the greater P loss , F is, the more serious the harm is, and vice versa. In addition, (6) fully considers the relationship between the length of the failure chain and its risk. w i j describes the consequences and probabilities of node pair ( L i , L j ) from both a single failure chain and all of them, and when ( L i , L j ) has a great w i j , the more likely it is that line i causes subsequent failures and line j is affected by other failed lines.

5.2. The Criticality Ranking of Nodes in CFSTD

CFSTD is a directed graph with power, the nodes, connection edges, and edge weights are represented as failed lines, fail-overs, and correlation indicators. The critical nodes in CFSTD reflect the vulnerability of lines in the system under a typhoon. In this paper, the average weight coefficient (AWC) is proposed to identify the critical nodes in CFSTD and considers both the weight and degree of the nodes. The AWC of node i in CFSTD is defined by the following:
AWC i = j = 1 D i ω i j D i
where D i is the degree of node i. The AWC of node 1 is the average weight of edges connected with it (Figure 4) that is AWC 2 = ( ω 12 + ω 23 + ω 25 ) / 3 . The higher the AWC for a node, the more important that node in CFSTD is and the transmission line it represents has more vulnerability under the typhoon.
To avoid the excessive difference of the AWC for each line, a unified method of AWC is applied:
AWC i = AWC i AWC min AWC max AWC min .

5.3. Average Load Loss of Failure Chains

To evaluate the impacts of a typhoon on the power system and identify the vulnerable lines of the grid, a new resilience index (average load loss of failure chains, ALFC) describes the severity of the disaster is proposed, which is defined by the following:
W F = P loss , F n F
where P loss , F represented the severity of the outage due to a typhoon, and the denominator means that the failure chains that have smaller n F are more disruptive while causing the same LOLF. Therefore, (9) can be used to evaluate the damage of different failure chains to the power system and to identify the critical components in a power grid under a typhoon.

6. Case Studies

To validate the effectiveness of the proposed method, the performance of IEEE 118-bus test system under Typhoon Usagi (which was the 19th super typhoon developed in the Western North Pacific Ocean and the South China Sea in 2013) is tested.

6.1. Test System and Data

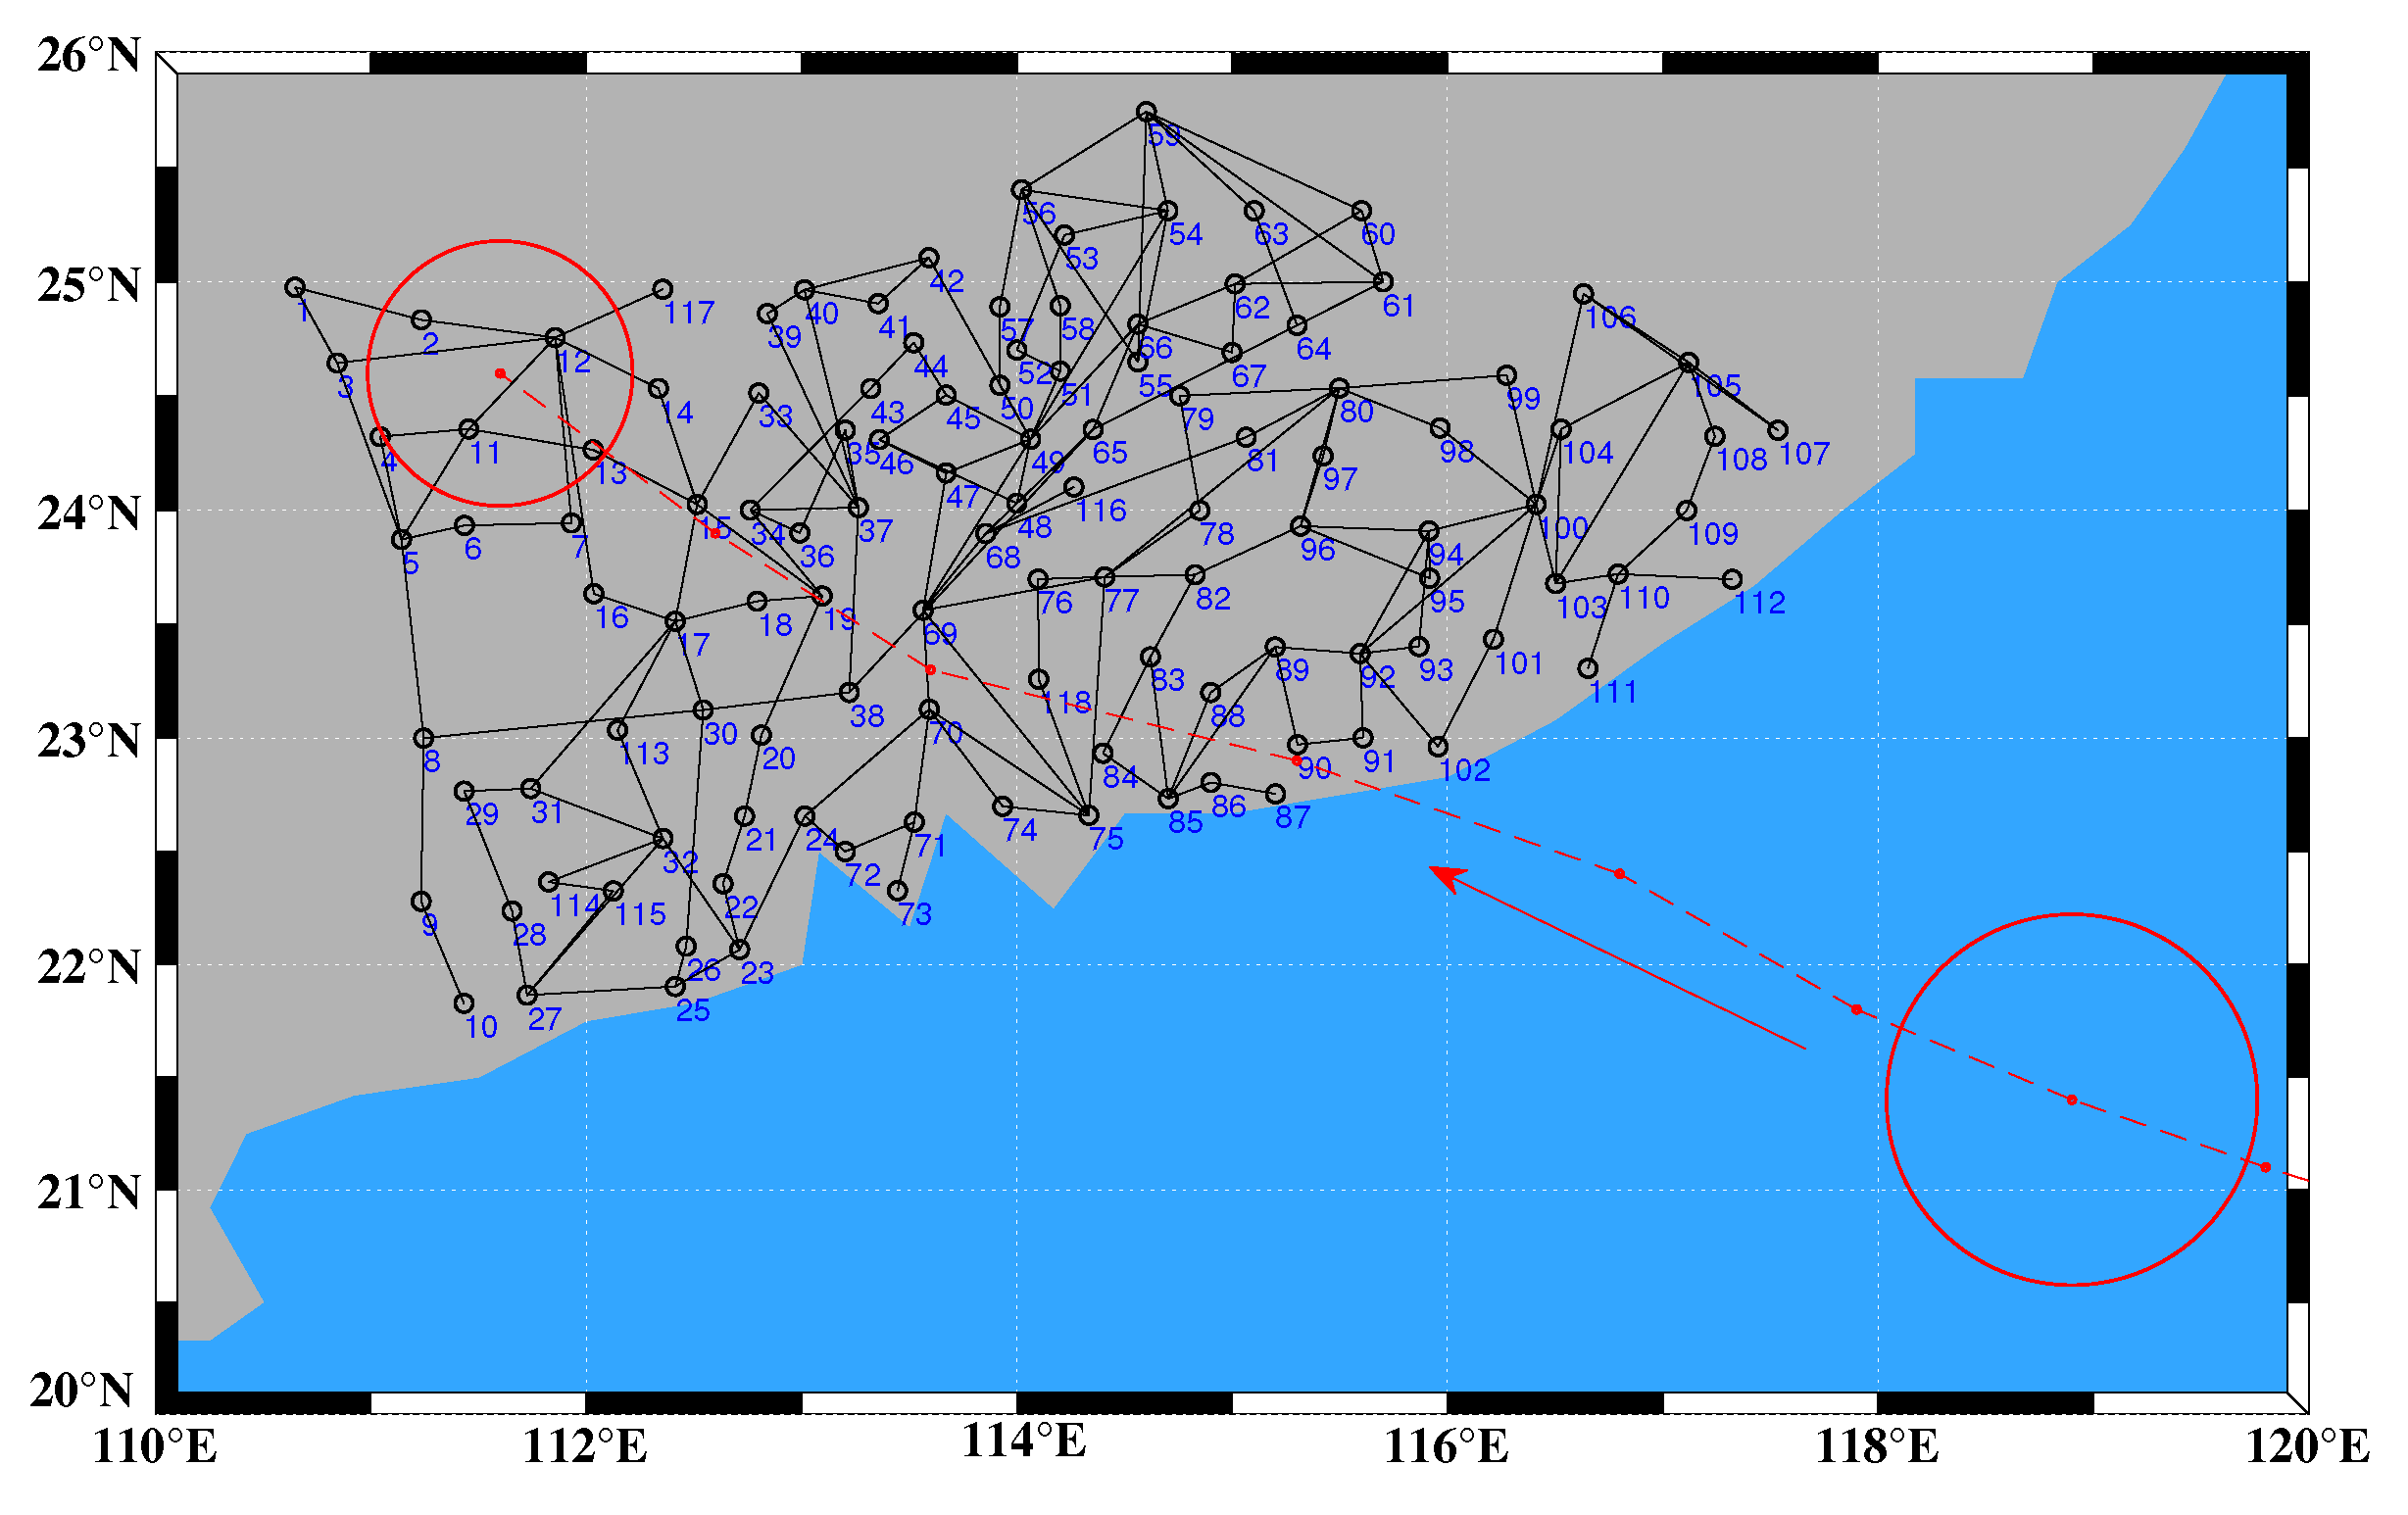
The proposed method is illustrated using the IEEE 118-bus test system [29]. Each node is assumed to be in the longitude and the latitude (Table A1 and Figure 5) to study the performance of power system under extreme weather. The red dashed line represents the path of the typhoon (Figure 5).
The data regarding Typhoon Usagi, including wind speed and location in times, are provided by the Joint Typhoon Warning Center (JTWC) [30]. The linear interpolation is applied to obtain the typhoon data between two analysis time intervals, while the typhoon data are updated every six hours in the event of a tropical cyclone. First, assume that all the transmission lines have the same V d e s = 30 m/s and P lim = 1.3 P N [25,31]. For modeling the failure probability of transmission lines, every 10 km is divided into a segment. To verify the importance of the failure probability of transmission lines by considering wind speed and its load, as well as the effectiveness of the cascading failure model proposed in this paper, two cases are studied.
(1) Case 1: Failure probability of lines only based on wind speed of Typhoon Usagi, and the overload of lines is eliminated by removing the capacity of generators and load curtailment;
(2) Case 2: Failure probability of lines considering both wind speed and its load, the overload lines may be considered out of service according to Section 3.

6.2. Simulation Results

The number of MCSs is set to 1000. Due to space limitations, only the 20 failure chains with the most LOLF are listed (Table 1). C 1 and C 2 are Case 1 and Case 2, respectively. It can be seen from the table that, when the influence of the line’s load on line faults is not considered, the number of failed lines, the amount of load loss, and the ALFC of the system under typhoon weather are much lower than Case 2 while the maximum of n F and W in Case 1 are 22 and 23.35, respectively. Conversely, these two indicators are 66 and 30.77 in Case 2. This is because a portion of lines out of service due to the flow exceeding the limit in Case 2 while the factor of failure in Case 1 is only based on wind speed. Furthermore, the total load of the IEEE 118-bus test system is 4242 MW, and the maximum of LOLF in Case 1 is 397 MW, which has not yet accounted for 10%. Therefore, the impacts of the typhoon on the system in Case 1 have been underestimated seriously. In addition, by comparing the 3rd and 4th failure chains in Case 2, the former appears to have fewer fault lines; however, it can cause greater load loss, which shows that the system is more vulnerable when these lines fail. This shows the necessity of the resilience index proposed in this paper to consider the length of a failure chain. The color bar in Figure 6 represents the failure rate of lines in 1000 simulations, while the black lines never fail.
In Case 1, the total number of possible failed lines is 30, and all of them are distributed near the typhoon path. As the wind speed reduces after landfall, the failure number of lines far away from the coastline decreases. It can be seen from Case 2 that some lines far away from the typhoon center are also at risk of failure. This is because cascading failures caused by fragile lines can be transmitted far away in terms of geographical distance [32]. By comparing the two cases, Case 2 appears to be more objective and better assesses the failure of the power system in typhoon weather conditions. The above conclusion supports that the effect of a typhoon is a continuous process, and the strong wind causes the line to be disconnected. Furthermore, there is a great risk of failure due to the power flow exceeding the limit, which leads to cascading failures.

6.3. Resilience Enhancement to a Typhoon

To identify the critical transmission lines of the power system under the typhoon, the method proposed in Section 5 is applied. Without loss of generality, converting all 1000 failure chains are converted to the CFSTD and the AWC of each node is calculated, which is the vulnerability ranking of the transmission line.
The vertical axis represents the AWC and failure probability, while the horizontal axis shows the circuits ranking (i.e., 1 to 30, the lines ranked with the top 30 AWC from left to right), their maximum failure probability only based on wind speed (PFW), and the mean of failure probability (MPF) during the typhoon (Figure 7). It can be seen from the figure that the lines closer to the coastline have a larger MPF and AWC, especially lines 138, 134, and 142, which indicates that these lines are more vulnerable. Some of them, however, are far from the typhoon center with little wind speed and have a great failure probability and AWC, especially lines 119, 89, 102, and 64. This means that the effect of the line’s load on the failure probability of a line is great. Combined with (6) and (7), the AWC value of line 119 is largest because it has a higher probability of failure and that causes a larger LOLF when experiencing failure.
To verify the vulnerability assessment method proposed in this paper and enhance the resilience of the system, a robustness measure is applied, that is, some transmission lines are assumed to be invulnerable under the typhoon. Considering the cost, it is impractical to improve the wind resistance level of all lines in the typhoon. In addition, instead of applying these hardening strategies to a single, individual line, the transmission lines are divided in resilience enhancement groups according to their AWC ranking; each group contains five lines (Figure 7). For example, the first group is composed of the first five lines with the highest AWC, the second group contains lines 6 to 10, and so on. Each case is simulated 100 times by the MCS. The results are shown (Table 2) where Group 0 is the case that no lines are invulnerable, and W a v is the average of W F in each case.
To verify the effectiveness of the method in this paper, a control method proposed in [28] is applied (that is, only the ratio between the associated factor and length of the cascading failure is considered in (6)). Clearly, Table 2 shows that W a v is reduced by applying the hardening strategies in M1 (the method proposed in this paper), but W a v of Group 1 is not the minimum of all the groups in M2, thus proving the validity of the proposed method. In addition, in M1, W a v is 8.66 when the first five critical lines are invulnerable, which is much less than the value of 17.47 in Group 0. In M2, after measures are taken for the lines in each group, the minimum value of W a v appears in Group 2 instead of Group 1, which means that the vulnerable lines identified in M2 cannot truly reflect the vulnerability of the power system. Combined with the previous values (Figure 7), these five lines have the highest AWC, indicating that the failure probability and LOLF are both great during the impacts of the typhoon, assuming these five lines are invulnerable can greatly improve the system’s resistance and reduce the vulnerability. Therefore, the 119th, 138th, 139th, 134th, and 107th transmission lines are the critical lines in the system under Typhoon Usagi, and the result verifies the effectiveness of the proposed method in this paper. In addition, by comparing Group 0 and Group 6, the W a v values of the two groups are close. This is because, when the lines in Group 6 are reinforced, the accident chain that caused the large-scale power outage event is not blocked, so its role is limited. This means that strengthening some lines without vulnerability may not enhance the resilience of the power system under the typhoon; it merely increases costs and waste. Different from the conventional method of reducing the area of resilience trapezoid to improve of the system resilience [5,33], this paper proposes a method to identify vulnerable lines and applies the enhancement measures of improving the wind resistance level of the vulnerable lines to reduce the impact of extreme events on power systems. This is the significance of assessing the vulnerability of the grid in extreme weather. Before a typhoon comes, it predicts the typhoon path, simulates the operation of the power system, identifies vulnerable lines, and takes reinforcement measures according to the AWC indicators, which can greatly improve reliability and enhance resilience of the power system under extreme weather.

6.4. Sensitivity Analysis

In this section, a parameter sensitivity analysis is undertaken for both the time step ( Δ t ) and the number of MCSs, which is used to evaluate how different Δ t and different values of the number of MCSs affect simulation results. As shown in Table 3, n F ¯ is the average number of failure chains. When Δ t = 20 min , the average line is 9.90, and ignores many possible failed lines, leading to over-optimistic results. In comparison, while Δ t is set to 2 min and n F ¯ is 30.44, reducing the computational efficiency and leading to pessimistic results. Therefore, to balance the accuracy and computational efficiency, Δ t is set as 5 min.
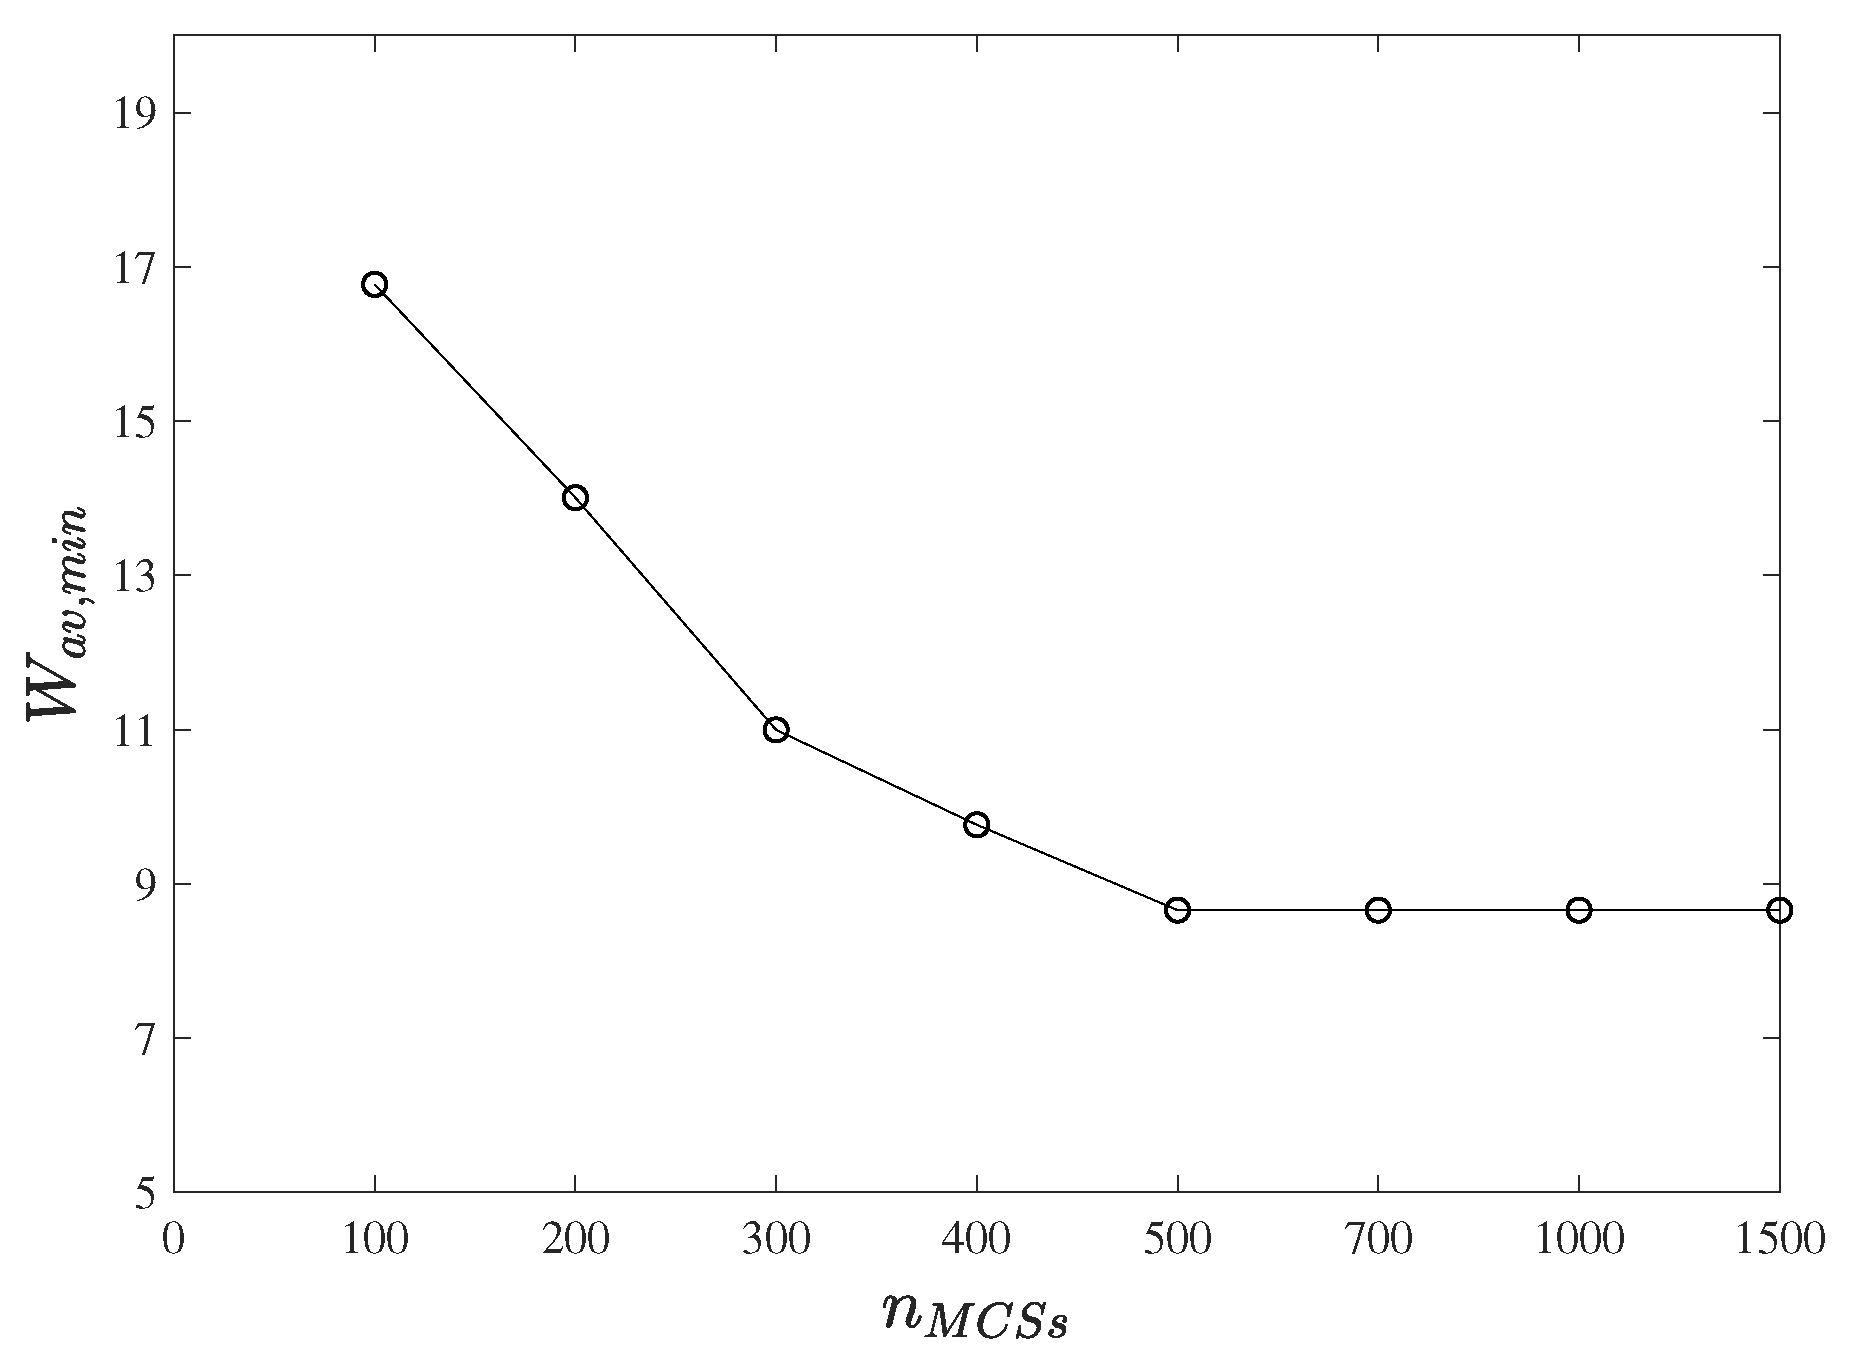
In addition, different values of the number of MCSs ( n MCSs ) are employed to analyze the sensitivity. Figure 8 shows how the value of n MCSs affects the performance. In each case, the five most vulnerable lines are found based on the method proposed in this research, and applying the proposed enhancement measure to improve the wind resistance level of these lines, and W a v , min is the average of W F in each case. As the value of n MCSs increases, W a v , min decreases and approaches to be a constant. It indicates that, when the number of MCSs is small, the CFSTD constructed by a small number of failure chains is insufficient to identify the most vulnerable lines. Therefore, the number of MCSs is set to 1000 in this particular research.

7. Conclusions

This paper presents an evaluation of resilience and vulnerability assessment of power systems under a typhoon. The failure probability of transmission lines are obtained by considering the wind speed and power flow, and then applying the MCS and DC model based on OPA to simulate the operation of the power system affected by Typhoon Usagi. According to the simulation results, the CFSTD is built based on failure chains and LOLF. By combining the CFSTD with the AWC, the vulnerability ranking of lines are obtained while the resilience enhancement strategy assumed that some lines were invulnerable. Finally, the proposed method is validated by using the IEEE 118-bus test system and the real data of Typhoon Usagi. The results show that lines with high wind speeds may not be the most vulnerable components, which are related to many factors, namely LOLF and the length of the failure chain. The transmission lines are divided in different groups based on their AWC ranking; the simulation results indicate that the system performs best ( W a v = 8.66) when the lines in Group 1 are assumed to be invulnerable, verifying that the proposed method is useful to identify the vulnerable transmission lines of in the power system under a typhoon.

Author Contributions

J.G. guided the framework of the paper and provided professional guidance. T.F. and Z.C. provided professional guidance and collected all the data. X.L. did simulation and wrote the paper. W.T. provided the academic assistance and revised the manuscript. All authors have read and agreed to the published version of the manuscript.

Funding

This research was funded by the Science and Technology Project of State Grid Electric Corporation (No. 5216A01800JF), the Open Fund of the State Key Laboratory of Disaster Prevention and Reduction for Power Grid Transmission and Distribution Equipment (No. B316AF190007), and the National Natural Science Foundation of China under Grant (No. 51977082).

Conflicts of Interest

The authors declare no conflict of interest.

Appendix A

The longitude and latitude of buses in the power system are shown in Table A1.
Table A1. The location of buses in the test system.
BusLongitude (°)Latitude (°)BusLongitude (°)Latitude (°)BusLongitude (°)Latitude (°)
1110.647824.976341113.356124.905181115.064724.3207
2111.234224.834242113.591425.105482114.828223.7180
3110.843424.645443113.321024.534283114.620223.3568
4111.043424.323444113.521024.734284114.400122.9322
5111.142323.872345113.671724.505185114.703122.7322
6111.434523.934246113.361224.310486114.901222.8035
7111.931223.945247113.671724.164187115.201222.7531
8111.245222.999248114.000024.031488114.900023.2000
9111.233222.278649114.063724.312089115.200123.4003
10111.432421.827450113.921424.548190115.303422.9703
11111.454624.356751114.201624.610291115.607423.0003
12111.856224.756752114.000024.702192115.594423.3713
13112.032424.265453114.221425.204193115.867423.4023
14112.335424.534454114.701225.310294115.914123.9098
15112.515424.026555114.562124.650195115.917223.7023
16112.035423.634556114.021425.401596115.317523.9314
17112.413523.513457113.921324.891497115.422324.2387
18112.793523.601458114.201524.895498115.965424.3611
19113.095623.624459114.601225.741199116.274924.5917
20112.813423.012460115.601225.3102100116.412124.0265
21112.735422.655461115.701225.0000101116.213423.4342
22112.635422.356562115.013724.9910102115.956422.9613
23112.712422.065163115.102125.3100103116.502123.6791
24113.015422.655464115.301224.8102104116.527624.3564
25112.413921.902165114.354124.3549105117.120124.6478
26112.464322.080166114.561724.8154106116.631724.9474
27111.725721.863567114.999924.6914107117.534724.3514
28111.655422.235868113.855623.8989108117.241824.3248
29111.433422.765369113.564723.5617109117.111123.9999
30112.543423.123570113.593423.1261110116.792323.7212
31111.742222.776571113.523822.6287111116.652323.3061
32112.356522.556272113.203122.4987112117.322523.6978
33112.801424.514273113.445822.3257113112.145523.0342
34112.761724.001274113.934222.6981114111.825522.3645
35113.203224.351475114.334122.6586115112.125522.3245
36112.991723.901276114.098723.6987116114.264924.1026
37113.264124.012477114.408123.7081117112.355624.9677
38113.221423.200078114.850024.0000118114.101323.2584
39112.841124.861479114.756424.5017
40113.013424.965480115.497424.5356

References

  1. Panteli, M.; Mancarella, P. Influence of extreme weather and climate change on the resilience of power systems: Impacts and possible mitigation strategies. Electr. Power Syst. Res. 2015, 127, 259–270. [Google Scholar] [CrossRef]
  2. Watson, E.B.; Etemadi, A.H. Modeling electrical grid resilience under hurricane wind conditions with increased solar and wind power generation. IEEE Trans. Power Syst. 2019, 35, 929–937. [Google Scholar] [CrossRef]
  3. Holling, C.S. Resilience and stability of ecological systems. Annu. Rev. Ecol. Syst. 1973, 4, 1–23. [Google Scholar] [CrossRef] [Green Version]
  4. Great Britain, Cabinet Office. Keeping the country running: Natural hazards and infrastructure: A guide to improving the resilience of critical infrastructure and essential services. Appl. Environ. Microbiol. 2011, 79, 7735–7744. [Google Scholar]
  5. Panteli, M.; Trakas, D.N.; Mancarella, P.; Hatziargyriou, N.D. Power systems resilience assessment: Hardening and smart operational enhancement strategies. Proc. IEEE 2017, 105, 1202–1213. [Google Scholar] [CrossRef] [Green Version]
  6. Yang, Y.; Tang, W.; Liu, Y.; Xin, Y.; Wu, Q. Quantitative resilience assessment for power transmission systems under typhoon weather. IEEE Access 2018, 6, 40747–40756. [Google Scholar] [CrossRef]
  7. Panteli, M.; Mancarella, P. Modeling and evaluating the resilience of critical electrical power infrastructure to extreme weather events. IEEE Syst. J. 2015, 11, 1733–1742. [Google Scholar] [CrossRef]
  8. Bhuiyan, M.; Allan, R. Inclusion of weather effects in composite system reliability evaluation using sequential simulation. IEE Proc. Gener. Transm. Distrib. 1994, 141, 575–584. [Google Scholar] [CrossRef]
  9. Dobson, I.; Carreras, B.A.; Lynch, V.E.; Newman, D.E. Complex systems analysis of series of blackouts: Cascading failure, critical points, and self-organization. Chaos Interdiscip. J. Nonlinear Sci. 2007, 17, 026103. [Google Scholar] [CrossRef]
  10. Bhusal, N.; Abdelmalak, M.; Kamruzzaman, M.; Benidris, M. Power system resilience: Current practices, challenges, and future directions. IEEE Access 2020, 8, 18064–18086. [Google Scholar] [CrossRef]
  11. Panteli, M.; Mancarella, P.; Trakas, D.N.; Kyriakides, E.; Hatziargyriou, N.D. Metrics and quantification of operational and infrastructure resilience in power systems. IEEE Trans. Power Syst. 2017, 32, 4732–4742. [Google Scholar] [CrossRef] [Green Version]
  12. Lu, J.; Guo, J.; Jian, Z.; Yang, Y.; Tang, W. Resilience assessment and its enhancement in tackling adverse impact of ice disasters for power transmission systems. Energies 2018, 11, 2272. [Google Scholar] [CrossRef] [Green Version]
  13. Sun, Y.; Wang, P.; Cheng, L.; Liu, H. Operational reliability assessment of power systems considering condition-dependent failure rate. IET Gener. Transm. Distrib. 2010, 4, 60–72. [Google Scholar] [CrossRef]
  14. Zhang, H.; Wang, P.; Yao, S.; Liu, X.; Zhao, T. Resilience assessment of interdependent energy systems under hurricanes. IEEE Trans. Power Syst. 2020. [Google Scholar] [CrossRef]
  15. Zhang, H.; Bie, Z.; Li, G.; Lin, Y. Assessment method and metrics of power system resilience after disasters. J. Eng. 2019, 2019, 880–883. [Google Scholar] [CrossRef]
  16. Kim, J.; Dvorkin, Y. Enhancing distribution system resilience with mobile energy storage and microgrids. IEEE Trans. Smart Grid 2018, 10, 4996–5006. [Google Scholar] [CrossRef]
  17. Yao, S.; Wang, P.; Zhao, T. Transportable energy storage for more resilient distribution systems with multiple microgrids. IEEE Trans. Smart Grid 2018, 10, 3331–3341. [Google Scholar] [CrossRef]
  18. Li, Z.; Shahidehpour, M.; Alabdulwahab, A.; Abusorrah, A. Bilevel model for analyzing coordinated cyber-physical attacks on power systems. IEEE Trans. Smart Grid 2015, 7, 2260–2272. [Google Scholar] [CrossRef]
  19. Espinoza, S.; Poulos, A.; Rudnick, H.; de la Llera, J.C.; Panteli, M.; Mancarella, P. Risk and resilience assessment with component criticality ranking of electric power systems subject to earthquakes. IEEE Syst. J. 2020, 14, 2837–2848. [Google Scholar] [CrossRef]
  20. Panteli, M.; Pickering, C.; Wilkinson, S.; Dawson, R.; Mancarella, P. Power system resilience to extreme weather: Fragility modeling, probabilistic impact assessment, and adaptation measures. IEEE Trans. Power Syst. 2016, 32, 3747–3757. [Google Scholar] [CrossRef] [Green Version]
  21. Phadke, A.C.; Martino, C.D.; Cheung, K.F.; Houston, S.H. Modeling of tropical cyclone winds and waves for emergency management. Ocean Eng. 2003, 30, 553–578. [Google Scholar] [CrossRef]
  22. Chen, W.B.; Chen, H.; Hsiao, S.C.; Chang, C.H.; Lin, L.Y. Wind forcing effect on hindcasting of typhoon-driven extreme waves. Ocean Eng. 2019, 188, 106260. [Google Scholar] [CrossRef]
  23. Ruiz-Salcines, P.; Salles, P.; Robles-Díaz, L.; Díaz-Hernández, G.; Torres-Freyermuth, A.; Appendini, C.M. On the use of parametric wind models for wind wave modeling under yropical cyclones. Water 2019, 11, 2044. [Google Scholar] [CrossRef] [Green Version]
  24. Huges, L. On the low level wind structure of tropical cyclones. J. Meteorol. 1952, 9, 422–428. [Google Scholar] [CrossRef] [Green Version]
  25. Tang, W.; Yang, Y.; Li, Y.; Lu, J.; Wu, Q. Investigation on resilience assessment and enhancement for power transmission systems under extreme meteorological disasters. Proc. CSEE 2020, 40, 2244–2254. [Google Scholar]
  26. Jiang, L.; Liu, J.; Wei, Z.; Gong, H.; Lei, C.; Li, C. Running state and its risk evaluation of transmission line based on markov chain model. Autom. Electr. Power Syst. 2015, 39, 51–57. [Google Scholar]
  27. Furness, P. Applications of monte carlo simulation in marketing analytics. J. Direct Data Digit. Mark. Pract. 2011, 13, 132–147. [Google Scholar] [CrossRef] [Green Version]
  28. Wei, X.; Zhao, J.; Huang, T.; Bompard, E. A novel cascading faults graph based transmission network vulnerability assessment method. IEEE Trans. Power Syst. 2017, 33, 2995–3000. [Google Scholar] [CrossRef]
  29. Power Flow Test Systems Repository. Available online: Https://al-roomi.org/power-flow (accessed on 15 January 2020).
  30. Naval Research Laboratory—Marine Meteorology Division; JTWC. Western North Pacific Ocean Best Track Data. Available online: http://www.metoc.navy.mil/jtwc/jtwc.html?western-pacific (accessed on 12 December 2019).
  31. Zhang, H.X.; Lü, F.P. Vulnerability evaluation of power grid based on the analysis of cascading failure sequence. Power Syst. Prot. Control 2013, 17, 32–38. [Google Scholar]
  32. Yang, Y.; Nishikawa, T.; Motter, A.E. Small vulnerable sets determine large network cascades in power grids. Science 2017, 358, eaan3184. [Google Scholar] [CrossRef] [Green Version]
  33. Sabouhi, H.; Doroudi, A.; Fotuhi-Firuzabad, M.; Bashiri, M. Electrical Power System Resilience Assessment: A Comprehensive Approach. IEEE Syst. J. 2019, 14, 2643–2652. [Google Scholar] [CrossRef]
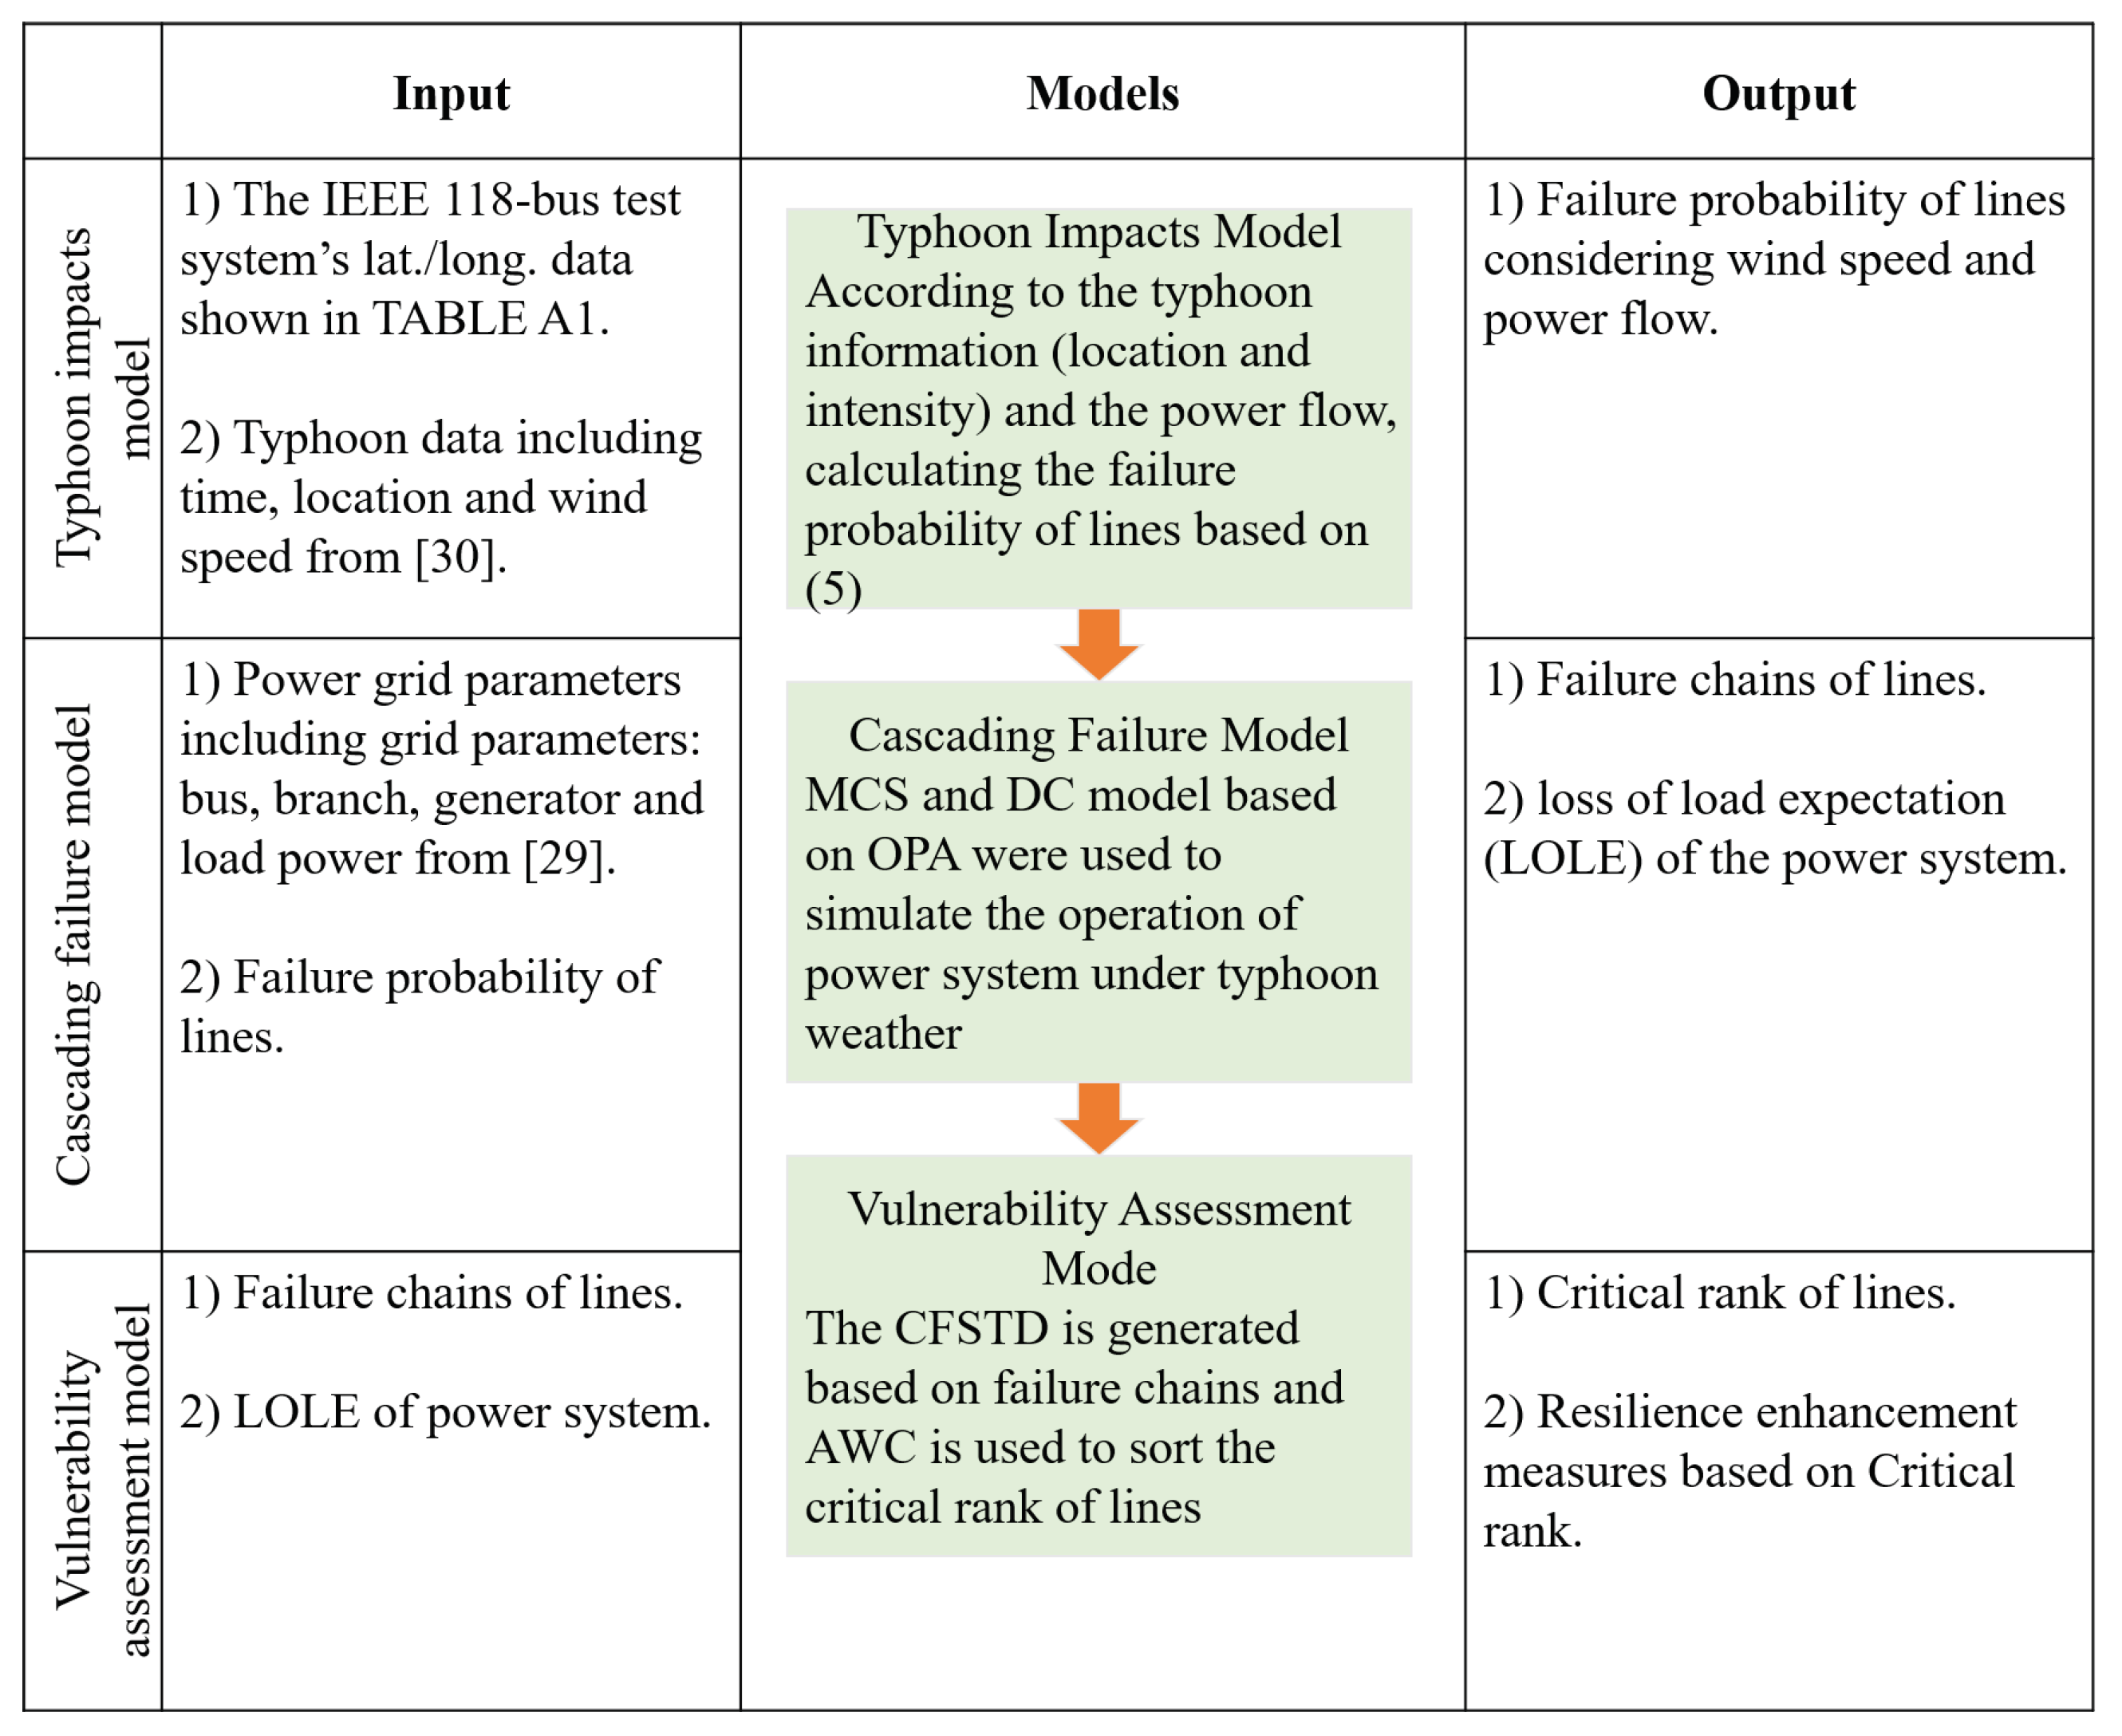
Figure 1. The resilience assessment framework during a typhoon.
Energies 13 03681 g001
Figure 2. Fragility curves of transmission line.
Energies 13 03681 g002
Figure 3. The proposed procedures for cascading failure model.
Energies 13 03681 g003
Figure 4. Turn failure chains into CFSTD.
Energies 13 03681 g004
Figure 5. Geographic diagram of the test system and the path of Usagi.
Energies 13 03681 g005
Figure 6. Failed lines under Usagi.
Energies 13 03681 g006
Figure 7. AWC, MPF, and PFW of transmission lines.
Energies 13 03681 g007
Figure 8. Sensitivity analysis of the number of MCSs.
Energies 13 03681 g008
Table 1. Top 20 failure chains with most LOLF in Case 1 and Case 2.
C 1 n F P loss , F (MW) W F C 2 n F P loss , F (MW) W F
11839722.05158174030.00
21839722.05253163130.77
31739723.35353153128.88
41737422.00459149525.33
51733519.70555142425.89
61833518.61664142022.18
71731518.52766135720.56
81831517.50852133025.57
92031515.75950131626.32
101931516.571055123422.43
111631519.681153122623.13
122031515.751257117720.64
131831517.501347117424.97
142231514.311455114320.78
151831517.501558114219.69
161831517.501651106120.80
171831517.501744105924.06
181731518.521851105720.72
191531521.001947103321.97
201931516.572044101723.11
Table 2. The change of the index after adopting resilience enhancement measures.
Group (M1)Invulnerable Lines (M1) W av Group (M2)Invulnerable Lines (M2) W av
Group 0None17.47Group 0None17.47
Group 1119,138,139,134,1078.66Group 1141,135,137,162,16115.27
Group 2131,89,102,64,3313.98Group 2140,136,143,138,1397.41
Group 336,142,137,136,14313.65Group 3133,134,131,142,13216.82
Group 4105,140,65,108,1515.12Group 4130,120,119,107,10415.40
Group 567,106,88,52,5515.27Group 5185,108,129,186,10515.02
Group 6111,129,133,135,14117.41Group 6106,116,102,65,9715.04
Table 3. Sensitivity analysis of Δ t .
Δ t 2 min5 min10 min20 min
n F ¯ 30.4423.5017.109.90