Optimal Power Flow Management System for a Power Network with Stochastic Renewable Energy Resources Using Golden Ratio Optimization Method
Abstract
1. Introduction
1.1. Background
1.2. Literature Review
1.3. Contributions
- A new GROM technique to solve the OPF problem incorporates with the highly volatile RES behavior and uncertainty in the RES power generation prediction to minimize the electricity cost, power losses and gas emissions.
- Prediction of the RES power generation by using Weibull and lognormal probability distribution functions, as stochastic prediction model, to improve the presenting of the forecast RES uncertainty and variability.
- Metaheuristics Optimization algorithms to solve single and multi objective functions a power network connected to a central ESS and compare their performance, unlike the optimization strategies in literature that focused only on single objective function.
- A comparison analysis for different RES location scenarios is conducted and presented to give power network operators a significant indicator regarding the possible locations of RES.
2. Proposed Work: Materials and Methods
2.1. Optimal Power Flow (OPF) Problem
- Case 1: Real power loss cost function
- Case 2: Gas emission cost function:Nowadays, one of the main targets of network operators is to improve the environmental performance of thermal power generation units and power networks by reducing the greenhouse gas emission. In Equation (2), the total gas emission in tons per hour (t/h) is presented [16]. The gas emission coefficients of thermal power generating units in Equation (2) are presented in Table 1 [43,44].
- Case 3: The economic power generation cost function at valve-point loading effect:The fuel cost of the power generation systems is formulated in Equation (3) based on two parts: firstly, the basic fuel cost as quadratic function . Secondly, to present the nonlinear and non-smooth behavior of fuel cost, the value-point loading term is added to Equation (3). The fuel cost coefficients of thermal power generating units in Equation (3) are presented in Table 2 [43,44].
- Case 4: Voltage stability cost function:The cost function in this case aims to keep bus voltage at each node within an acceptable limit during normal operating conditions, power disturbance problem or load level changing [16]. The cost function (), described in Equation (6), aims to determine the voltage deviations from 1.0 per unit. In Equation (4), the voltage stability index measures the system operating point close to the voltage collapse point. The values are between 0 and 1, where 0 is for no load condition, and 1 for voltage collapse condition. The voltage stability in the power system is guaranteed while is 1 and is a global indicator for the system stability [16,43].
- Case 5: The basic power generation systems cost:
- Case 6: Voltage deviation cost function:
- Case 7: Fuel power generation cost and voltage stability cost function:
- Case 8: Fuel power generation cost and voltage deviation cost function:
- Case 9: Thermal power loss and fuel generation cost:
- In this case, a complex objective function with four main targets is presented. The cost function, Equation (12), includes the fuel cost, environmental emission index, voltage deviation index and power transmission losses terms.where ,, and are weight factors and are assumed to be 22, 21 and 19 as in [16].
Constraints
- The thermal and renewable energy generating units limitation;
- The power transformer tap limitation;
- The shunt compensator limitation;
- The voltages limitation at load buses;
- The power transmission line limitation.
2.2. Mathematical Models of Wind and Solar Power Generating Units
2.2.1. Wind Power Units
2.2.2. Solar Power Units
2.3. Proposed Golden Ratio Optimization Method (GROM)
3. Results and Discussions
- Scenario 1: IEEE 30-bus without renewable energy sources.
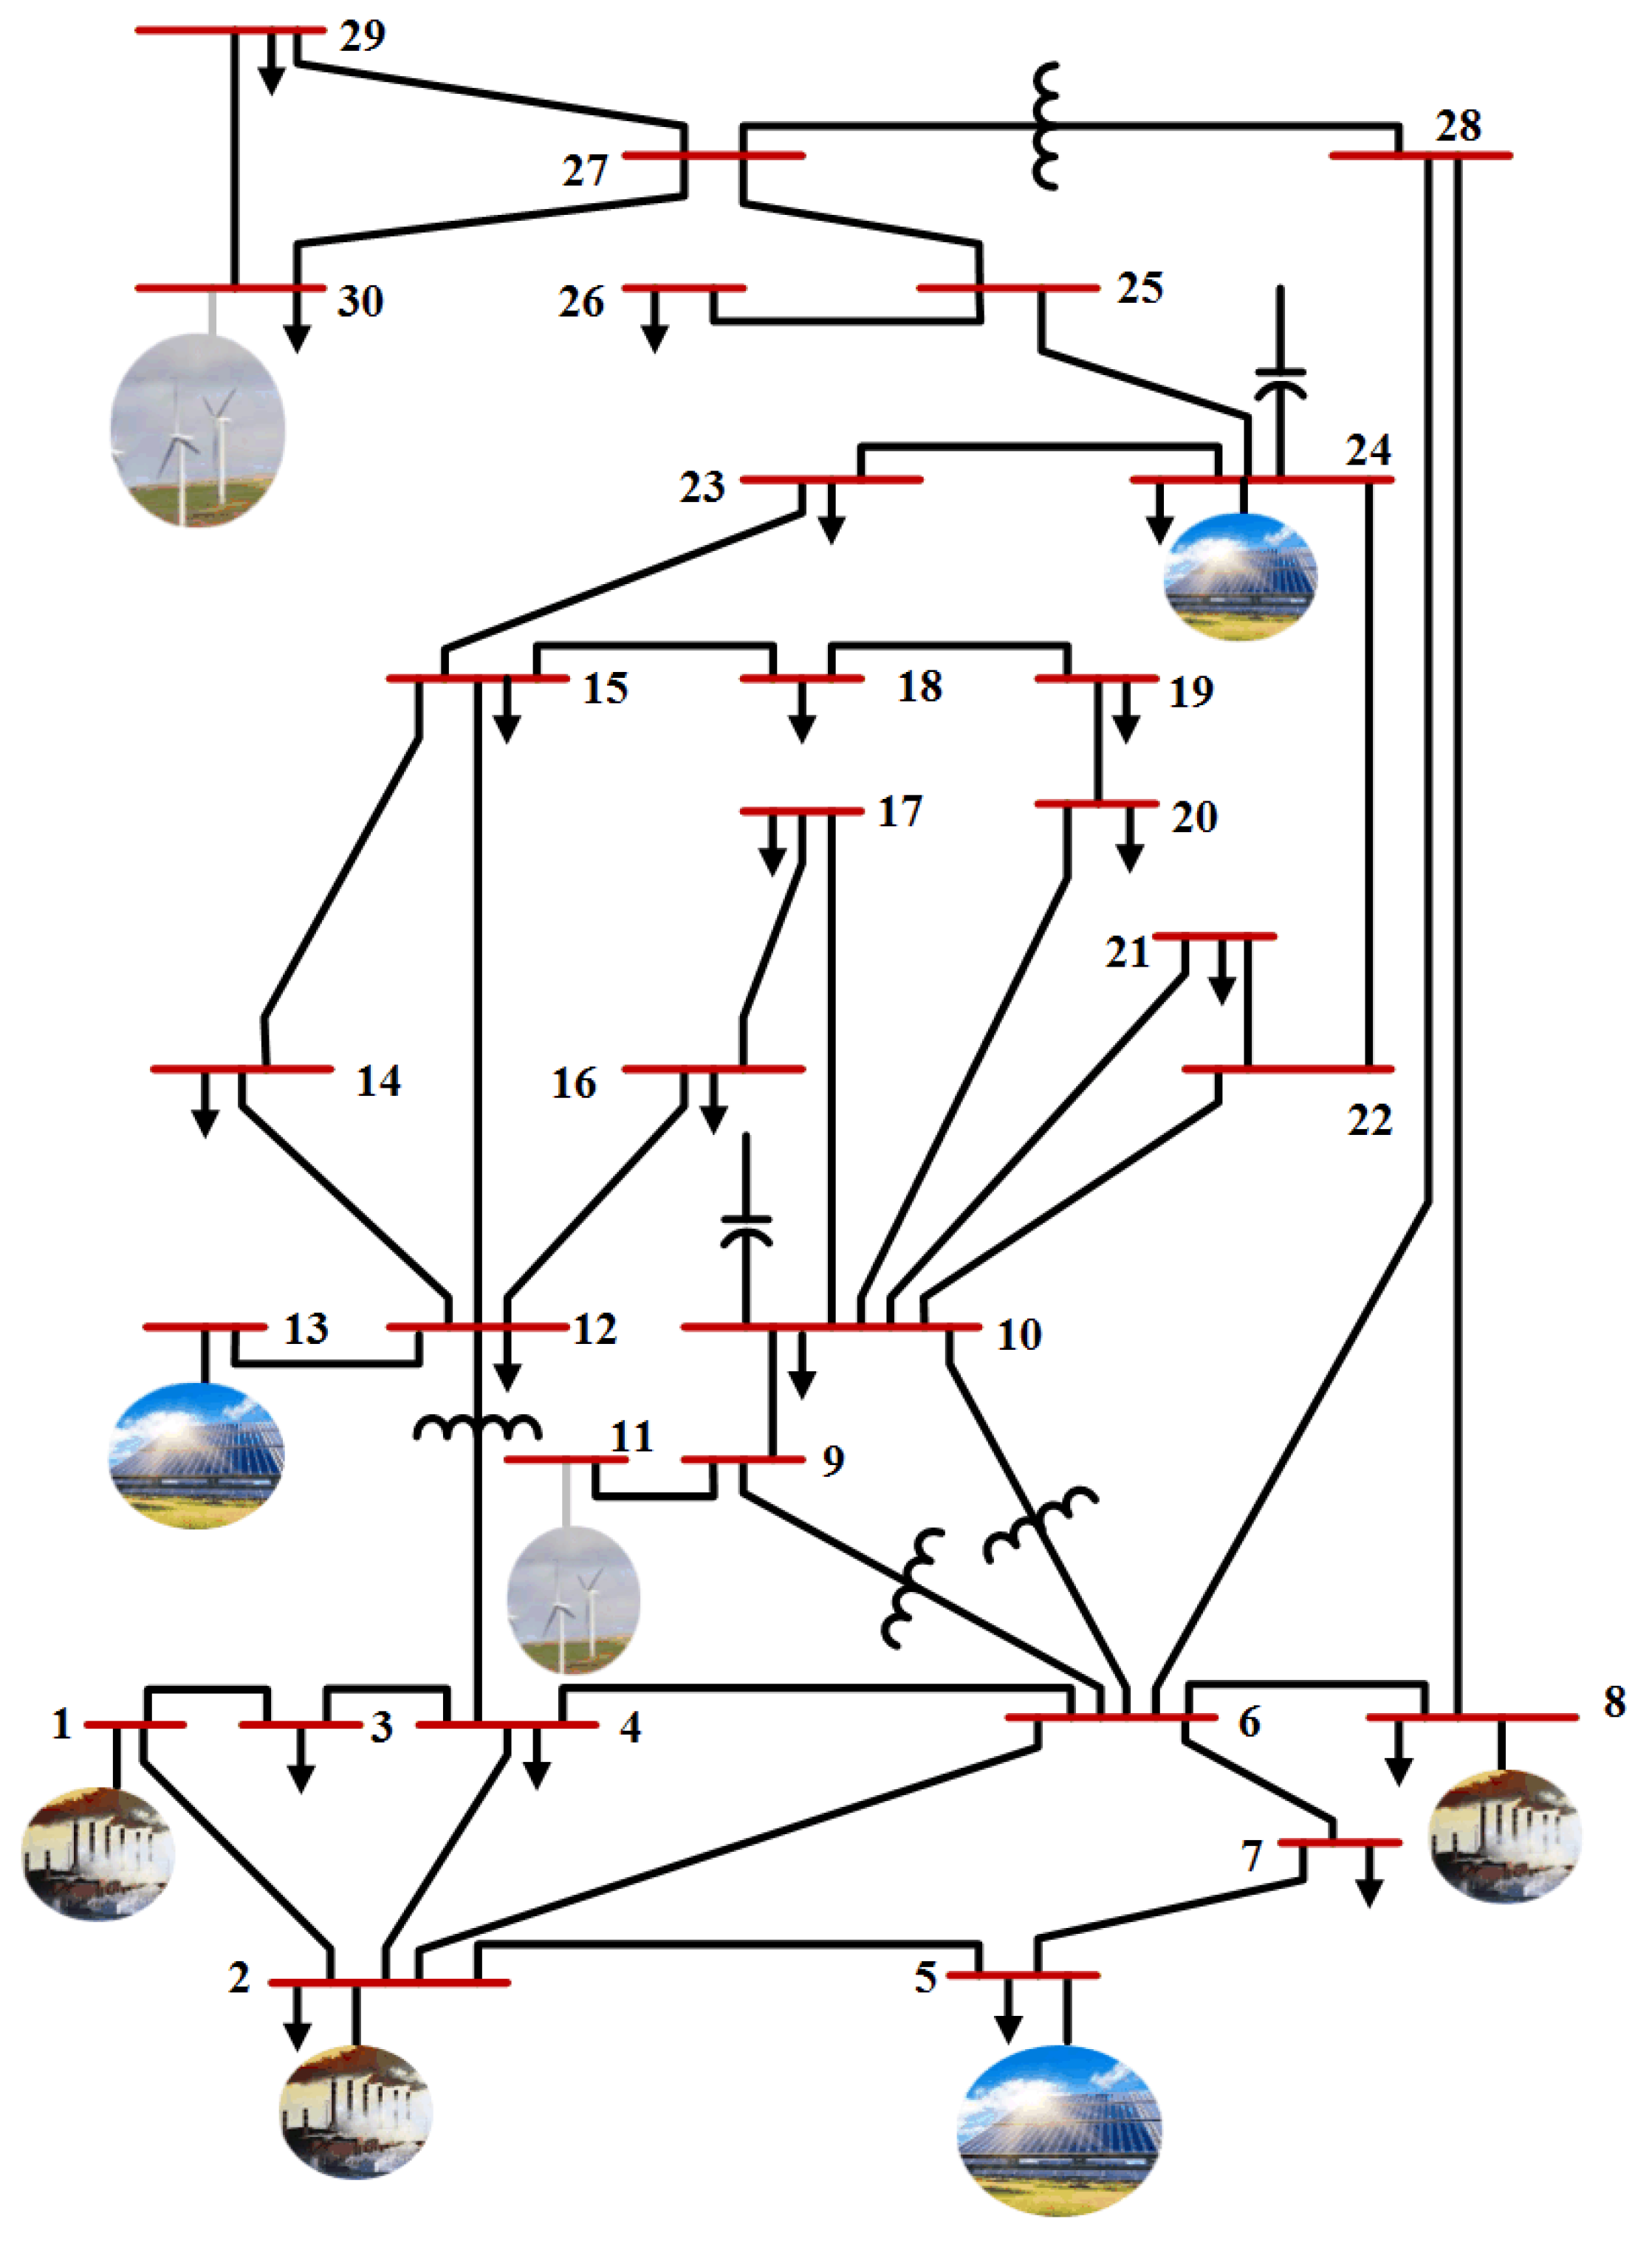
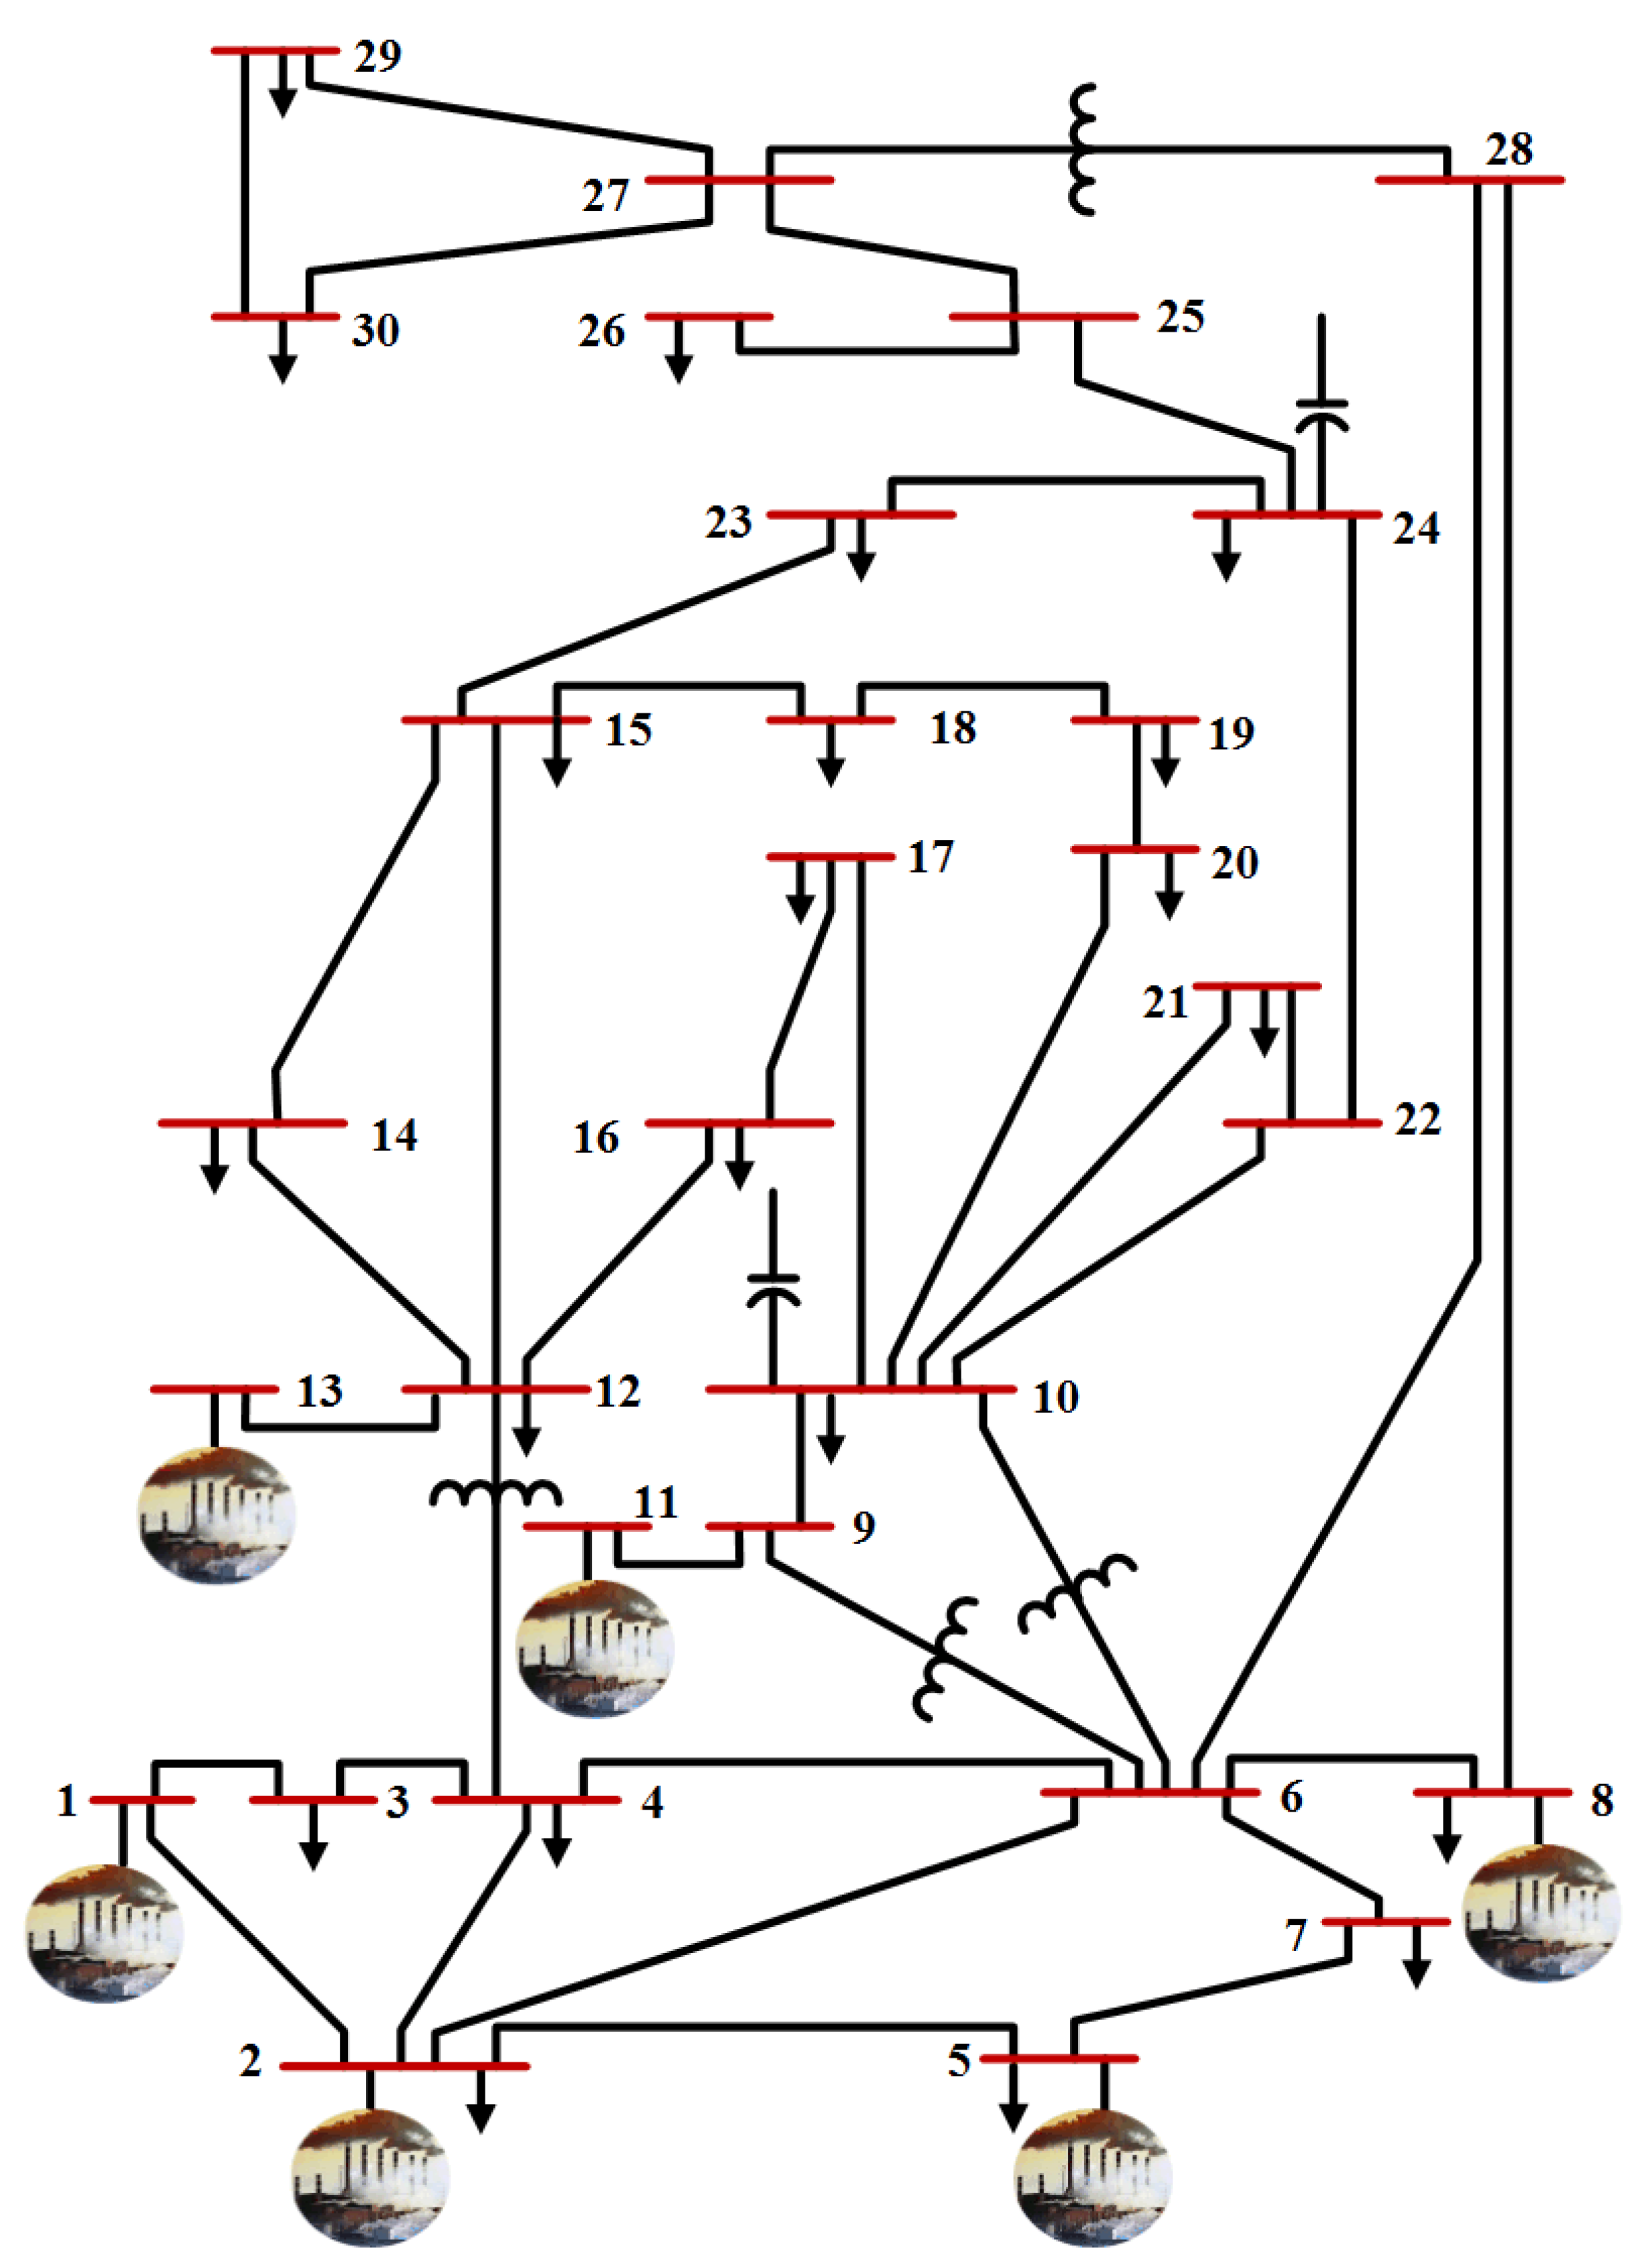
- Scenario 2: IEEE 30-bus Modified (1).An IEEE 30-bus Modified (1) is presented to investigate the impact of adding RES with stochastic power generation behavior to the reference power network, as seen in Figure A1. Here, the IEEE 30-bus system modified by replacing the thermal power generators at buses 5, 11, and 13 with solar PV at buses 5 and 13 as well as wind generator at bus 11. Furthermore, two new renewable generators (solar PV and wind generator) have been added at bus 24 and 30, respectively. The IEEE 30-bus Modified (1) specifications is described in Table A1. The general specifications and data for wind and solar system which connected to the IEEE 30-bus Modified (1) are presented in Table A2 and Table A3, respectively.
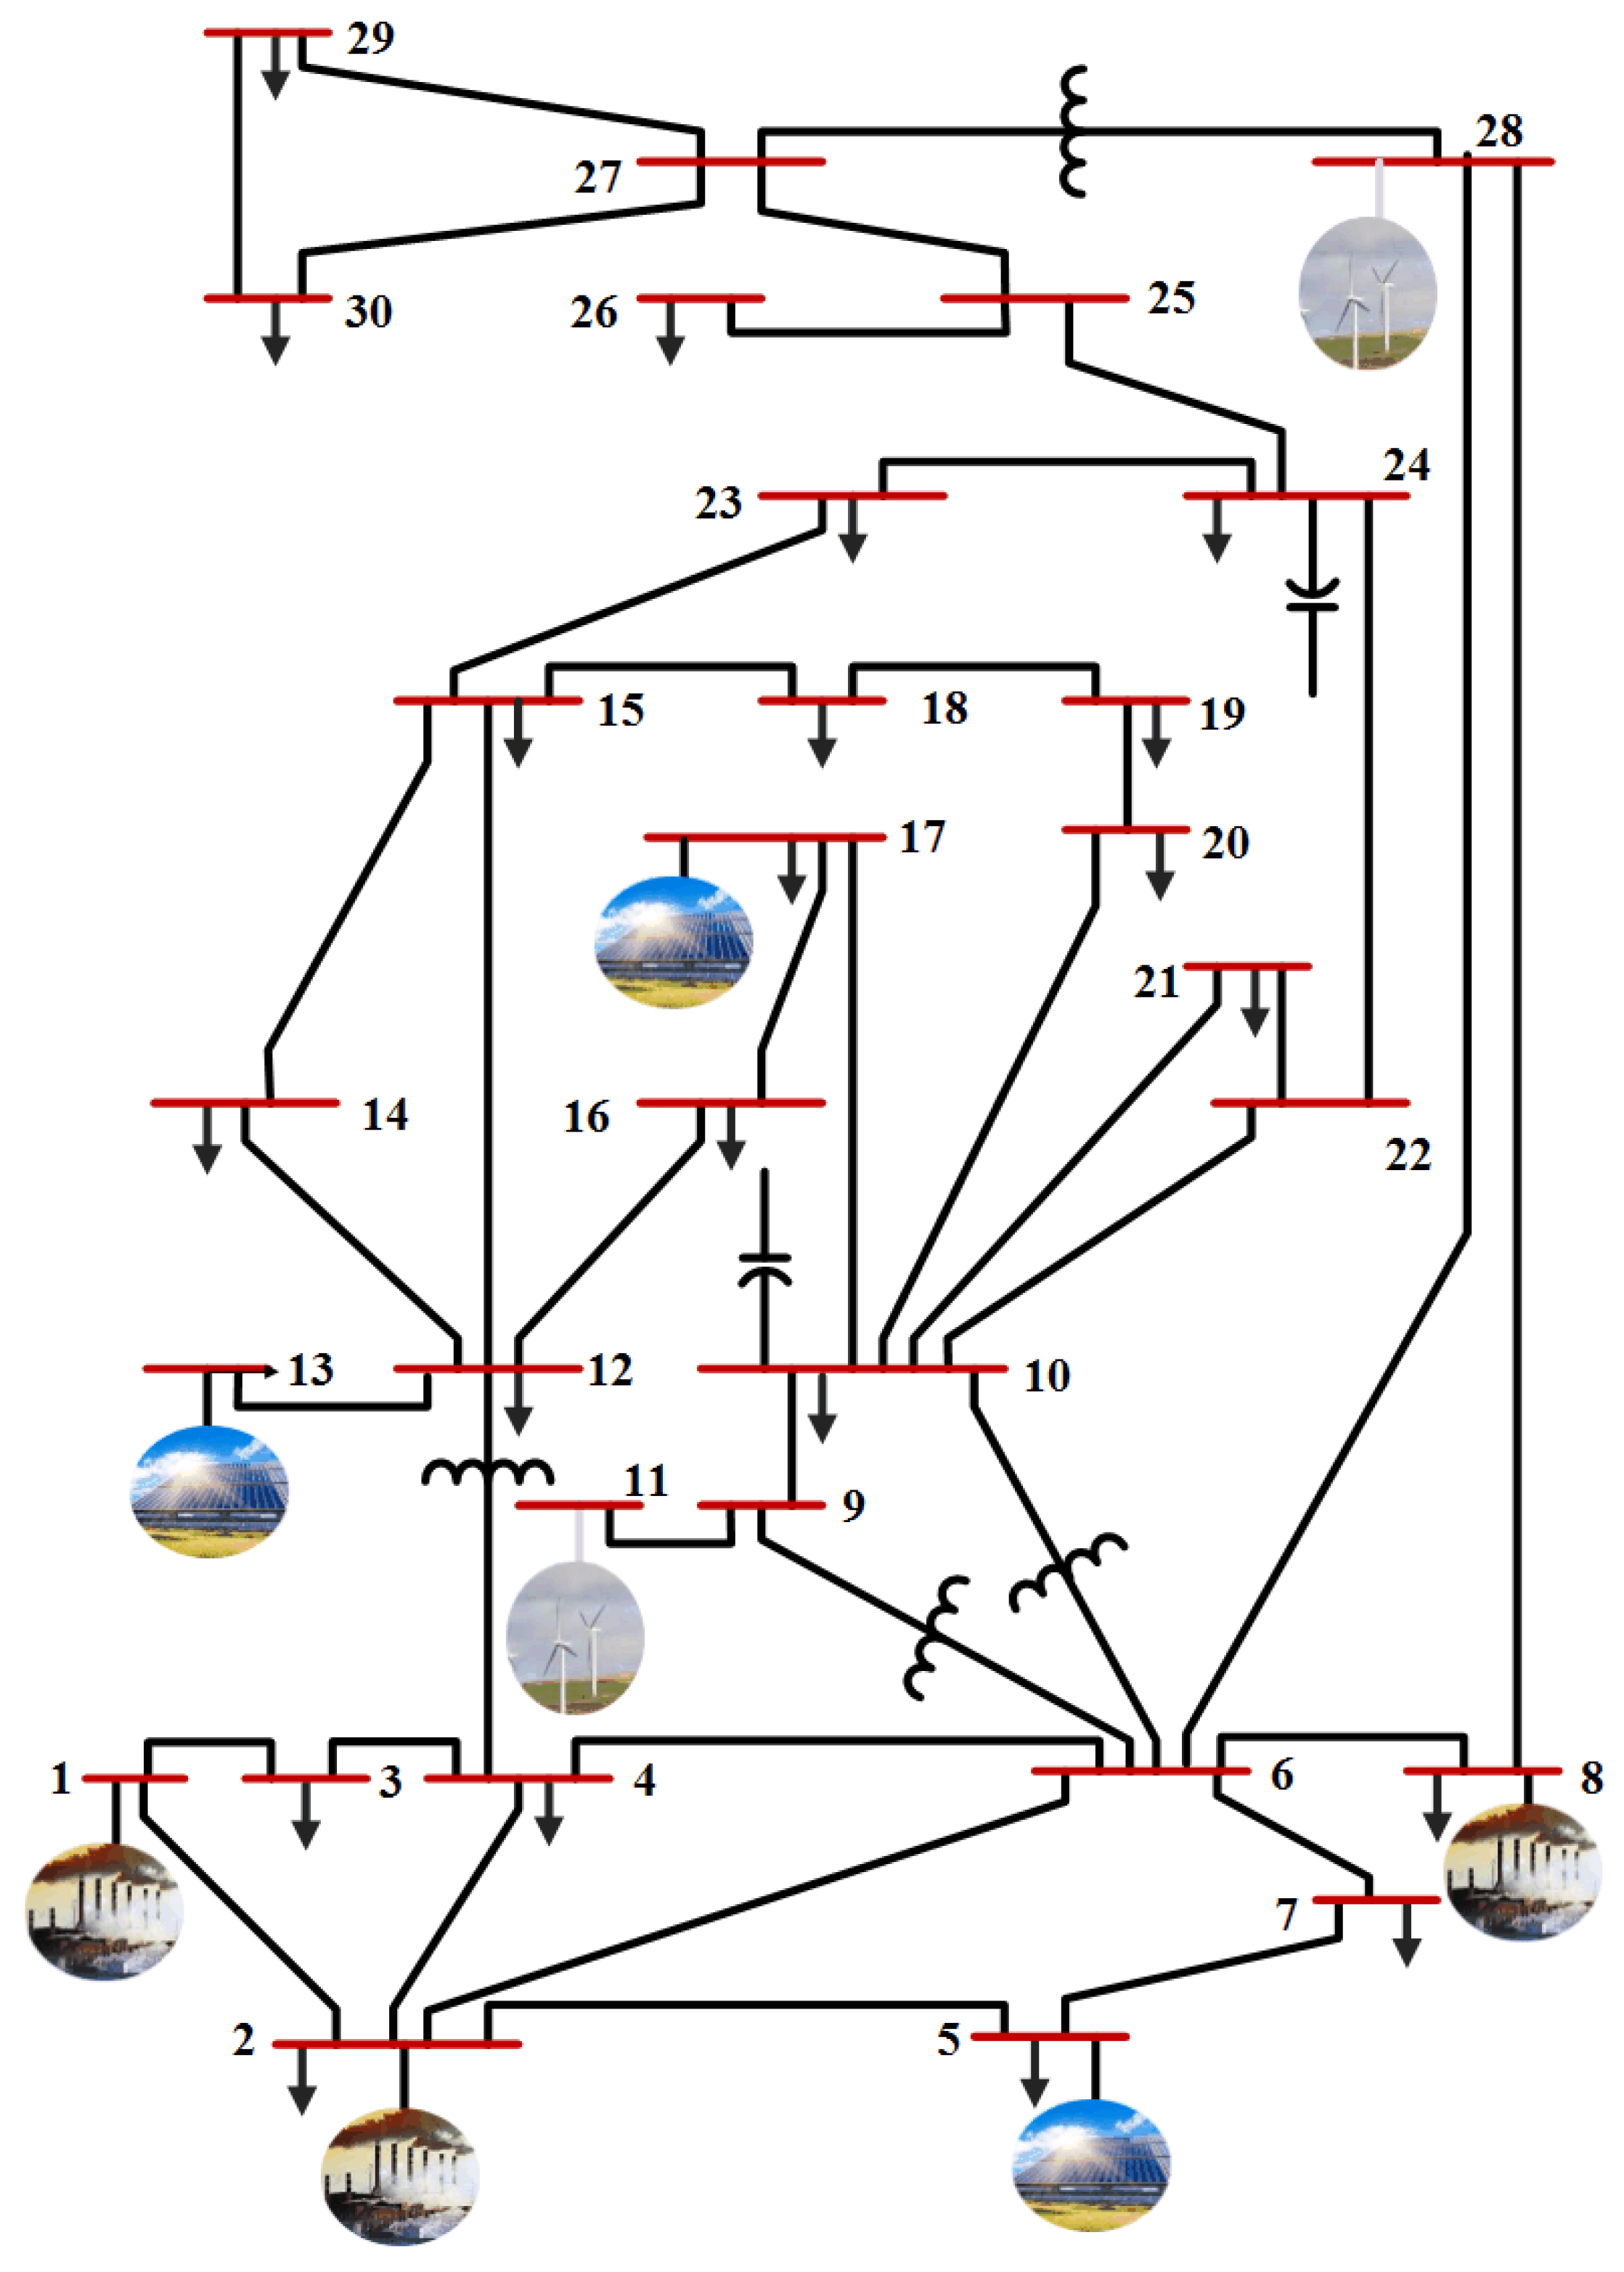
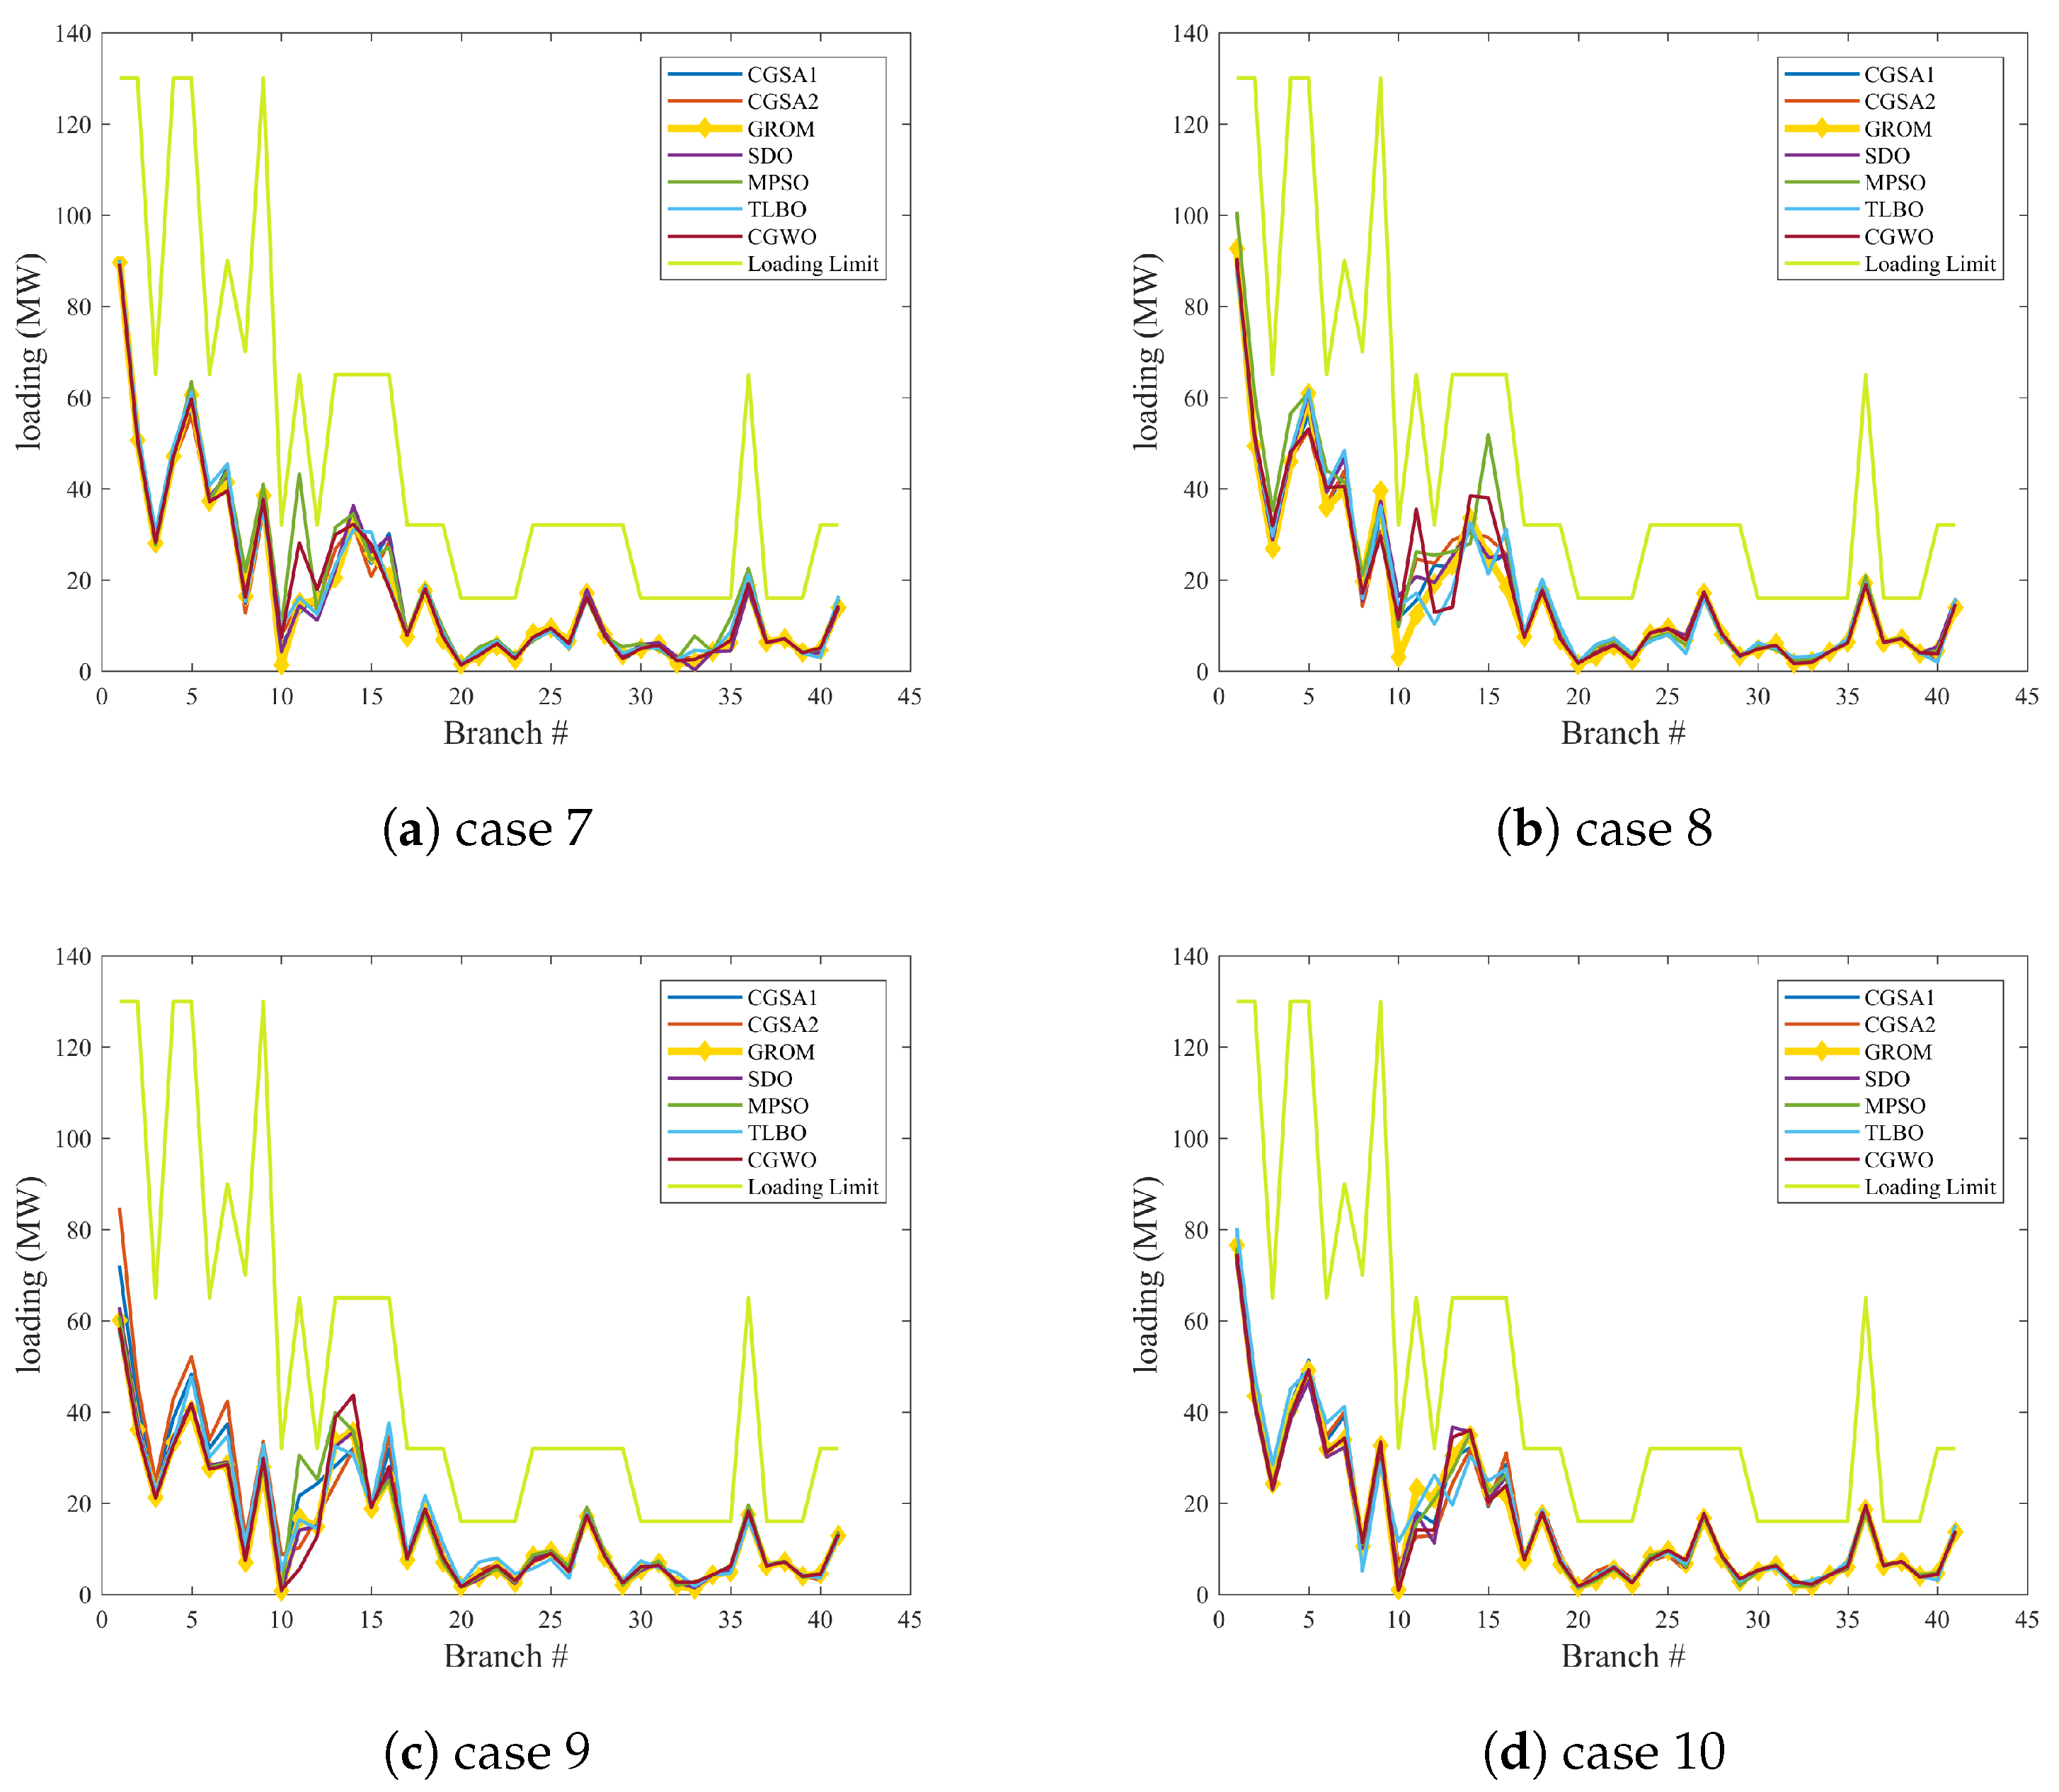
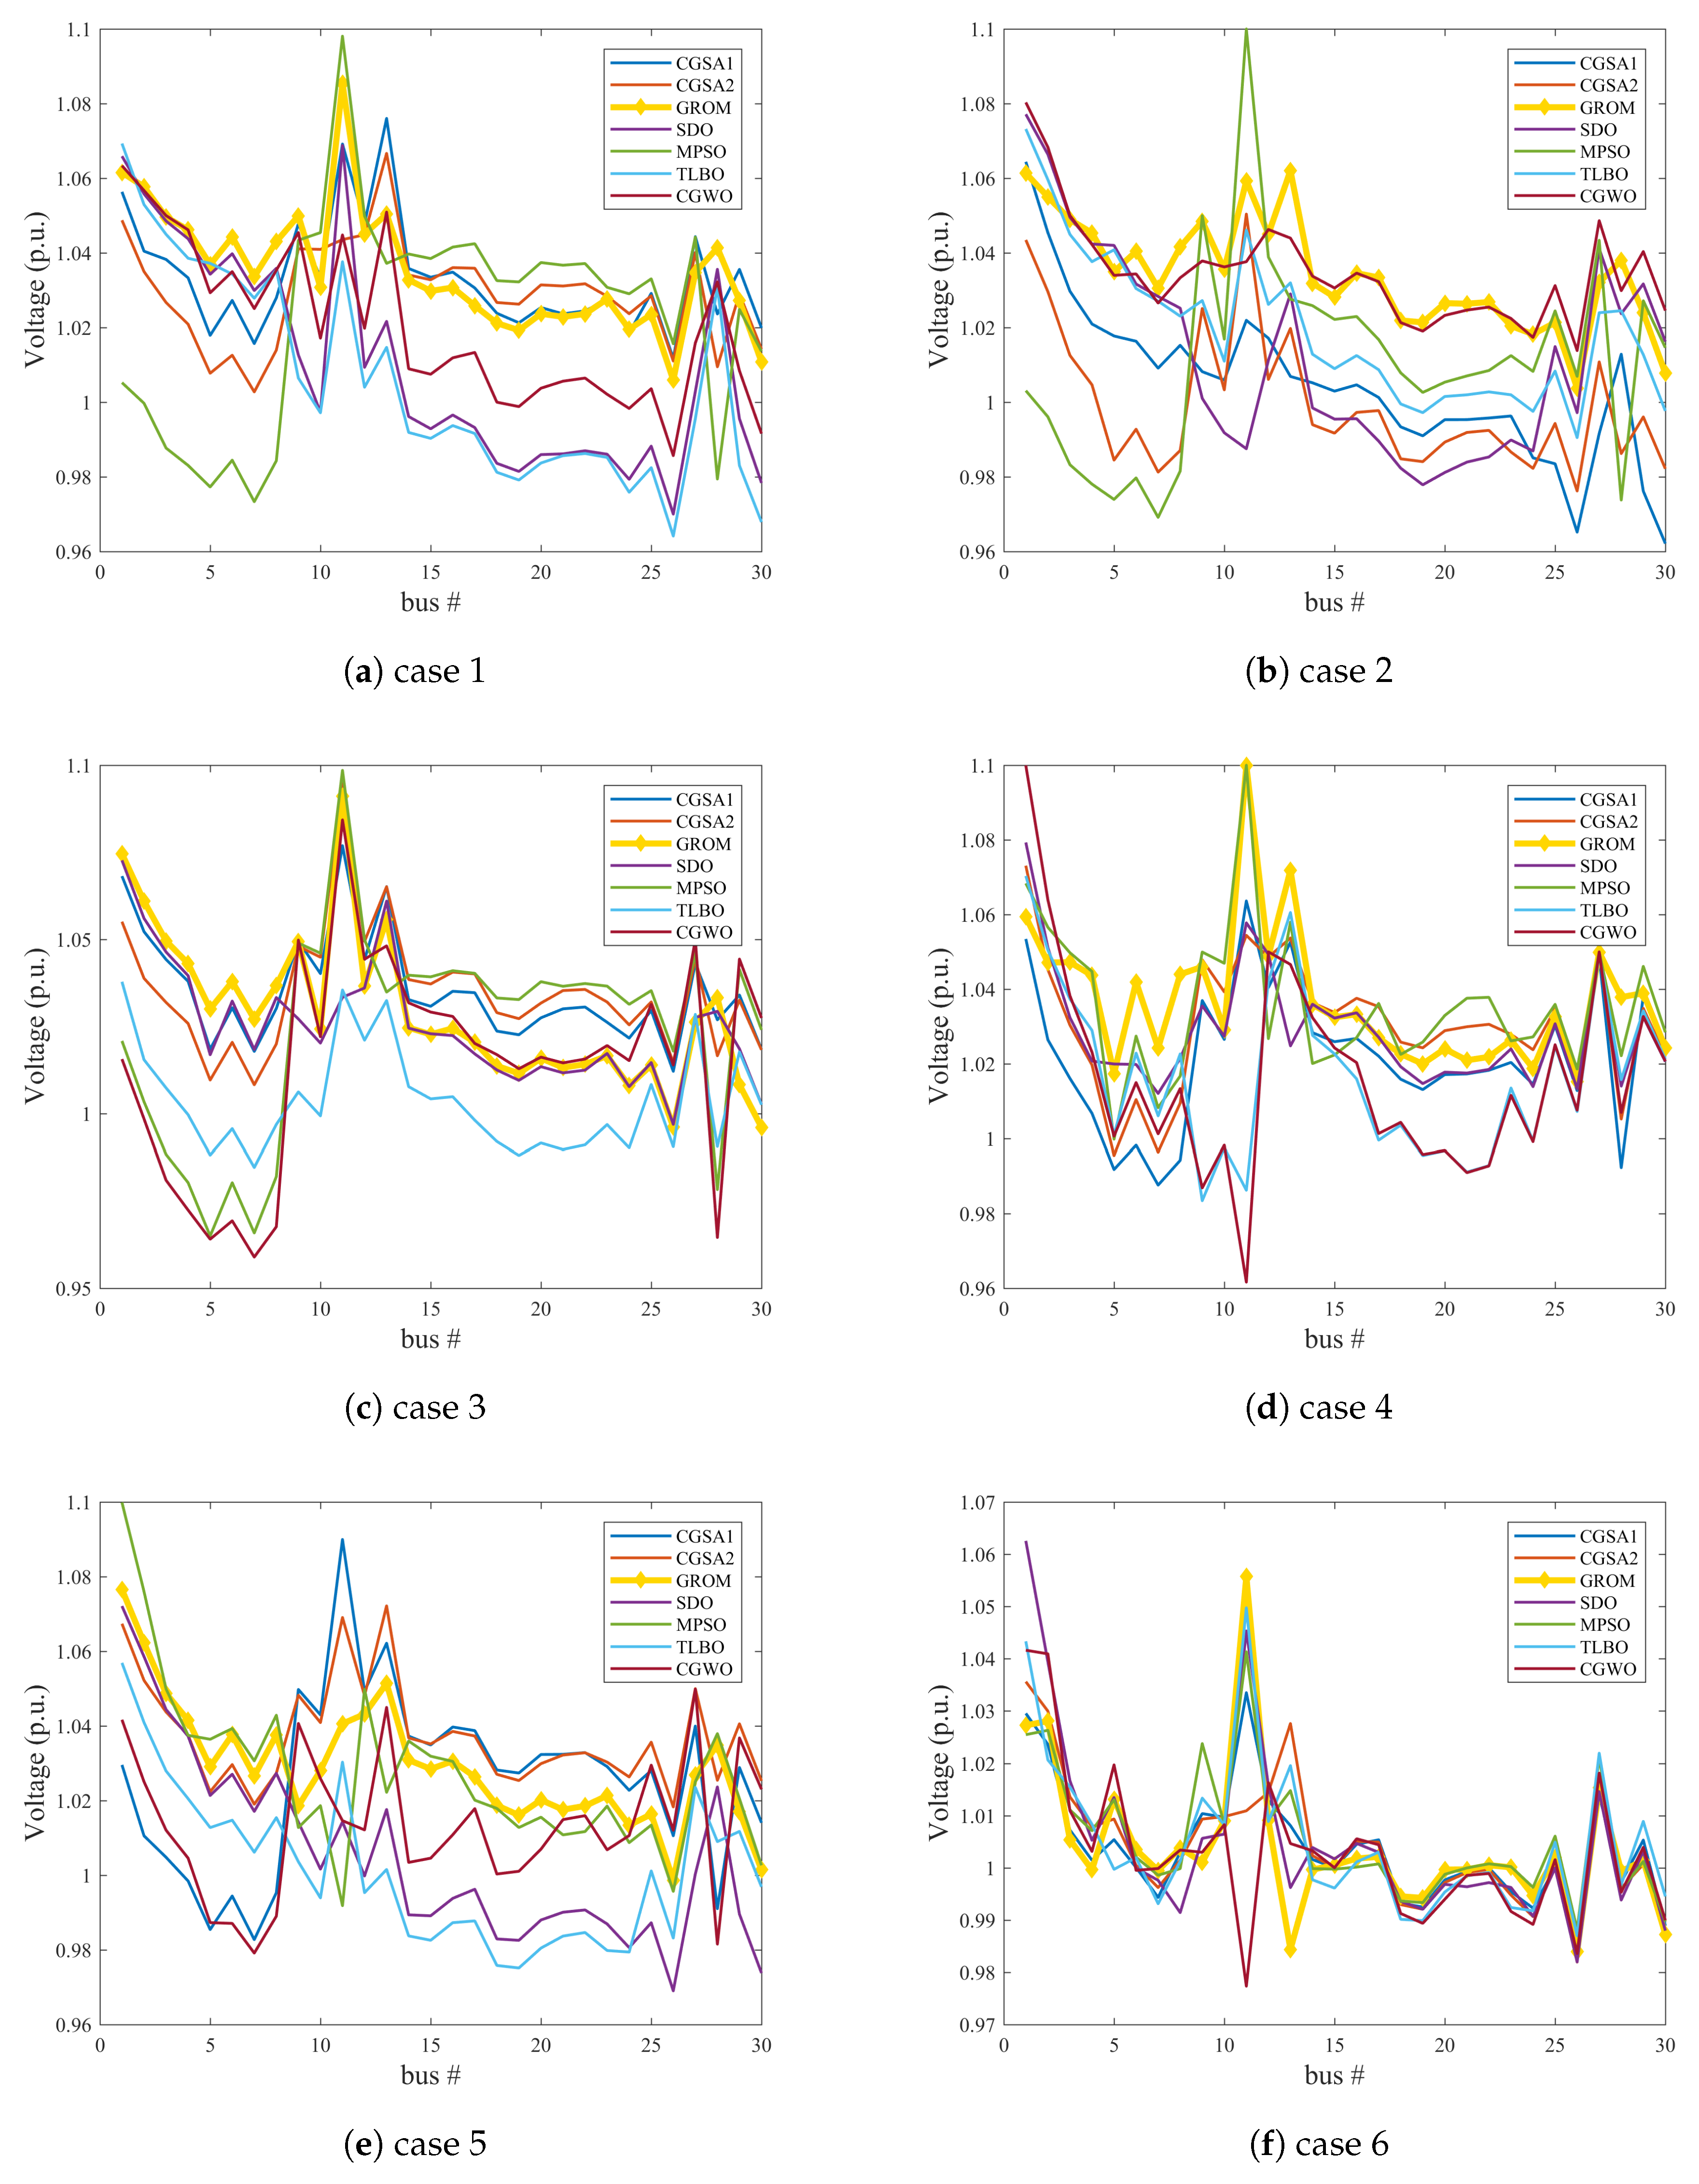
- Scenario 3: IEEE 30-bus Modified (2)An IEEE 30-bus Modified (2) is simulated to show the optimization performance over different RES location scenarios, as presented in Figure A2. The IEEE 30-bus system has been modified in this case by adding solar generator at buses 5 and 13, and wind generator at bus 11 instead of the old thermal power generators. In addition, a new solar PV and wind generators has been located at buses 17 and 28, respectively. Table A6 presents the IEEE 30-bus Modified (2) specifications. The general specifications and data for wind and solar system which connected to the IEEE 30-bus Modified (2) are presented in Table A4 and Table A5, respectively.For scenario (2) and scenario (3), the cases (3, 5, 7, 8, 9, and 10) in Section 2.1 will be modified to involve the effect of the presence of wind and solar sources by adding the total cost of wind power generations and the total cost of solar power generations to their equations.The IEEE 30-bus, IEEE 30-bus Modified (1) and IEEE 30-bus Modified (2) systems are used to address OPF problem then solve them by GROM algorithm and other optimizations algorithms over 10 cases, as summarized in Table 4. The simulation models have been implemented on 2.8-GHz i7 PC with 16 GB of RAM using using MATLAB 2016 and the maximum number of iterations is set to 100 for the GROM model as in [22].
3.1. Single-Objective OPF Problem Test Results
3.1.1. IEEE 30-Bus System without RES
3.1.2. IEEE 30-Bus System with RES
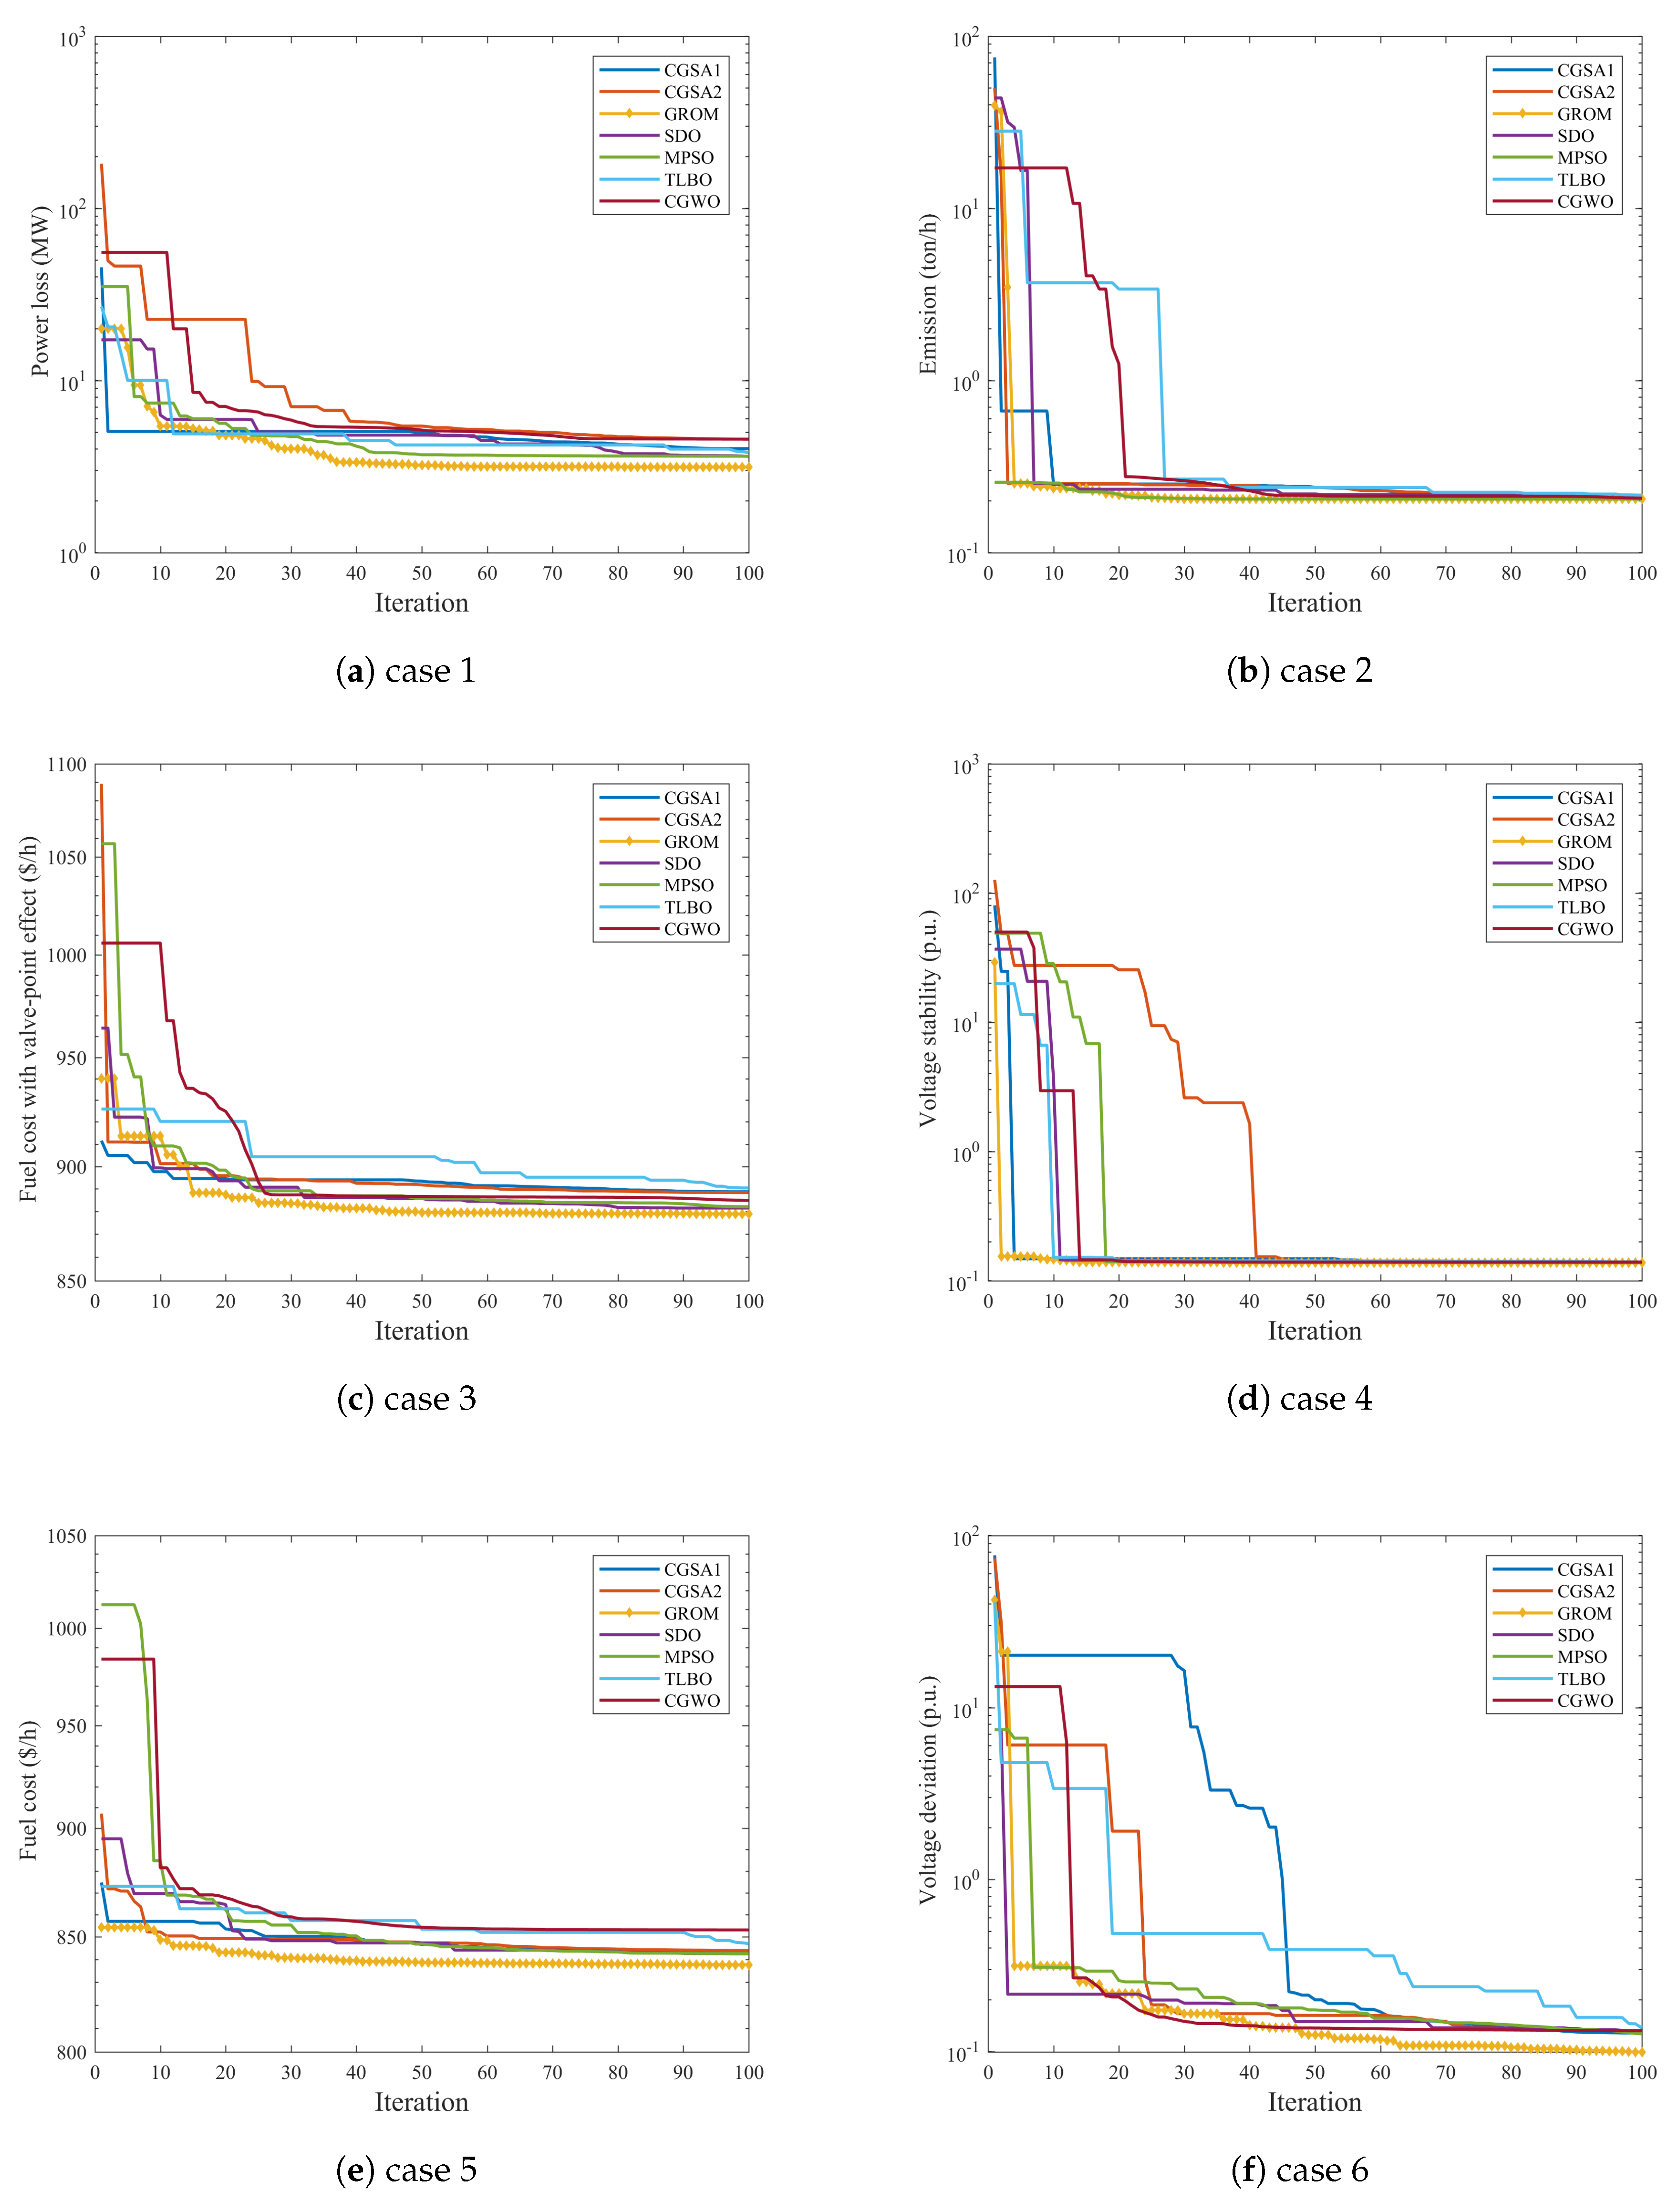
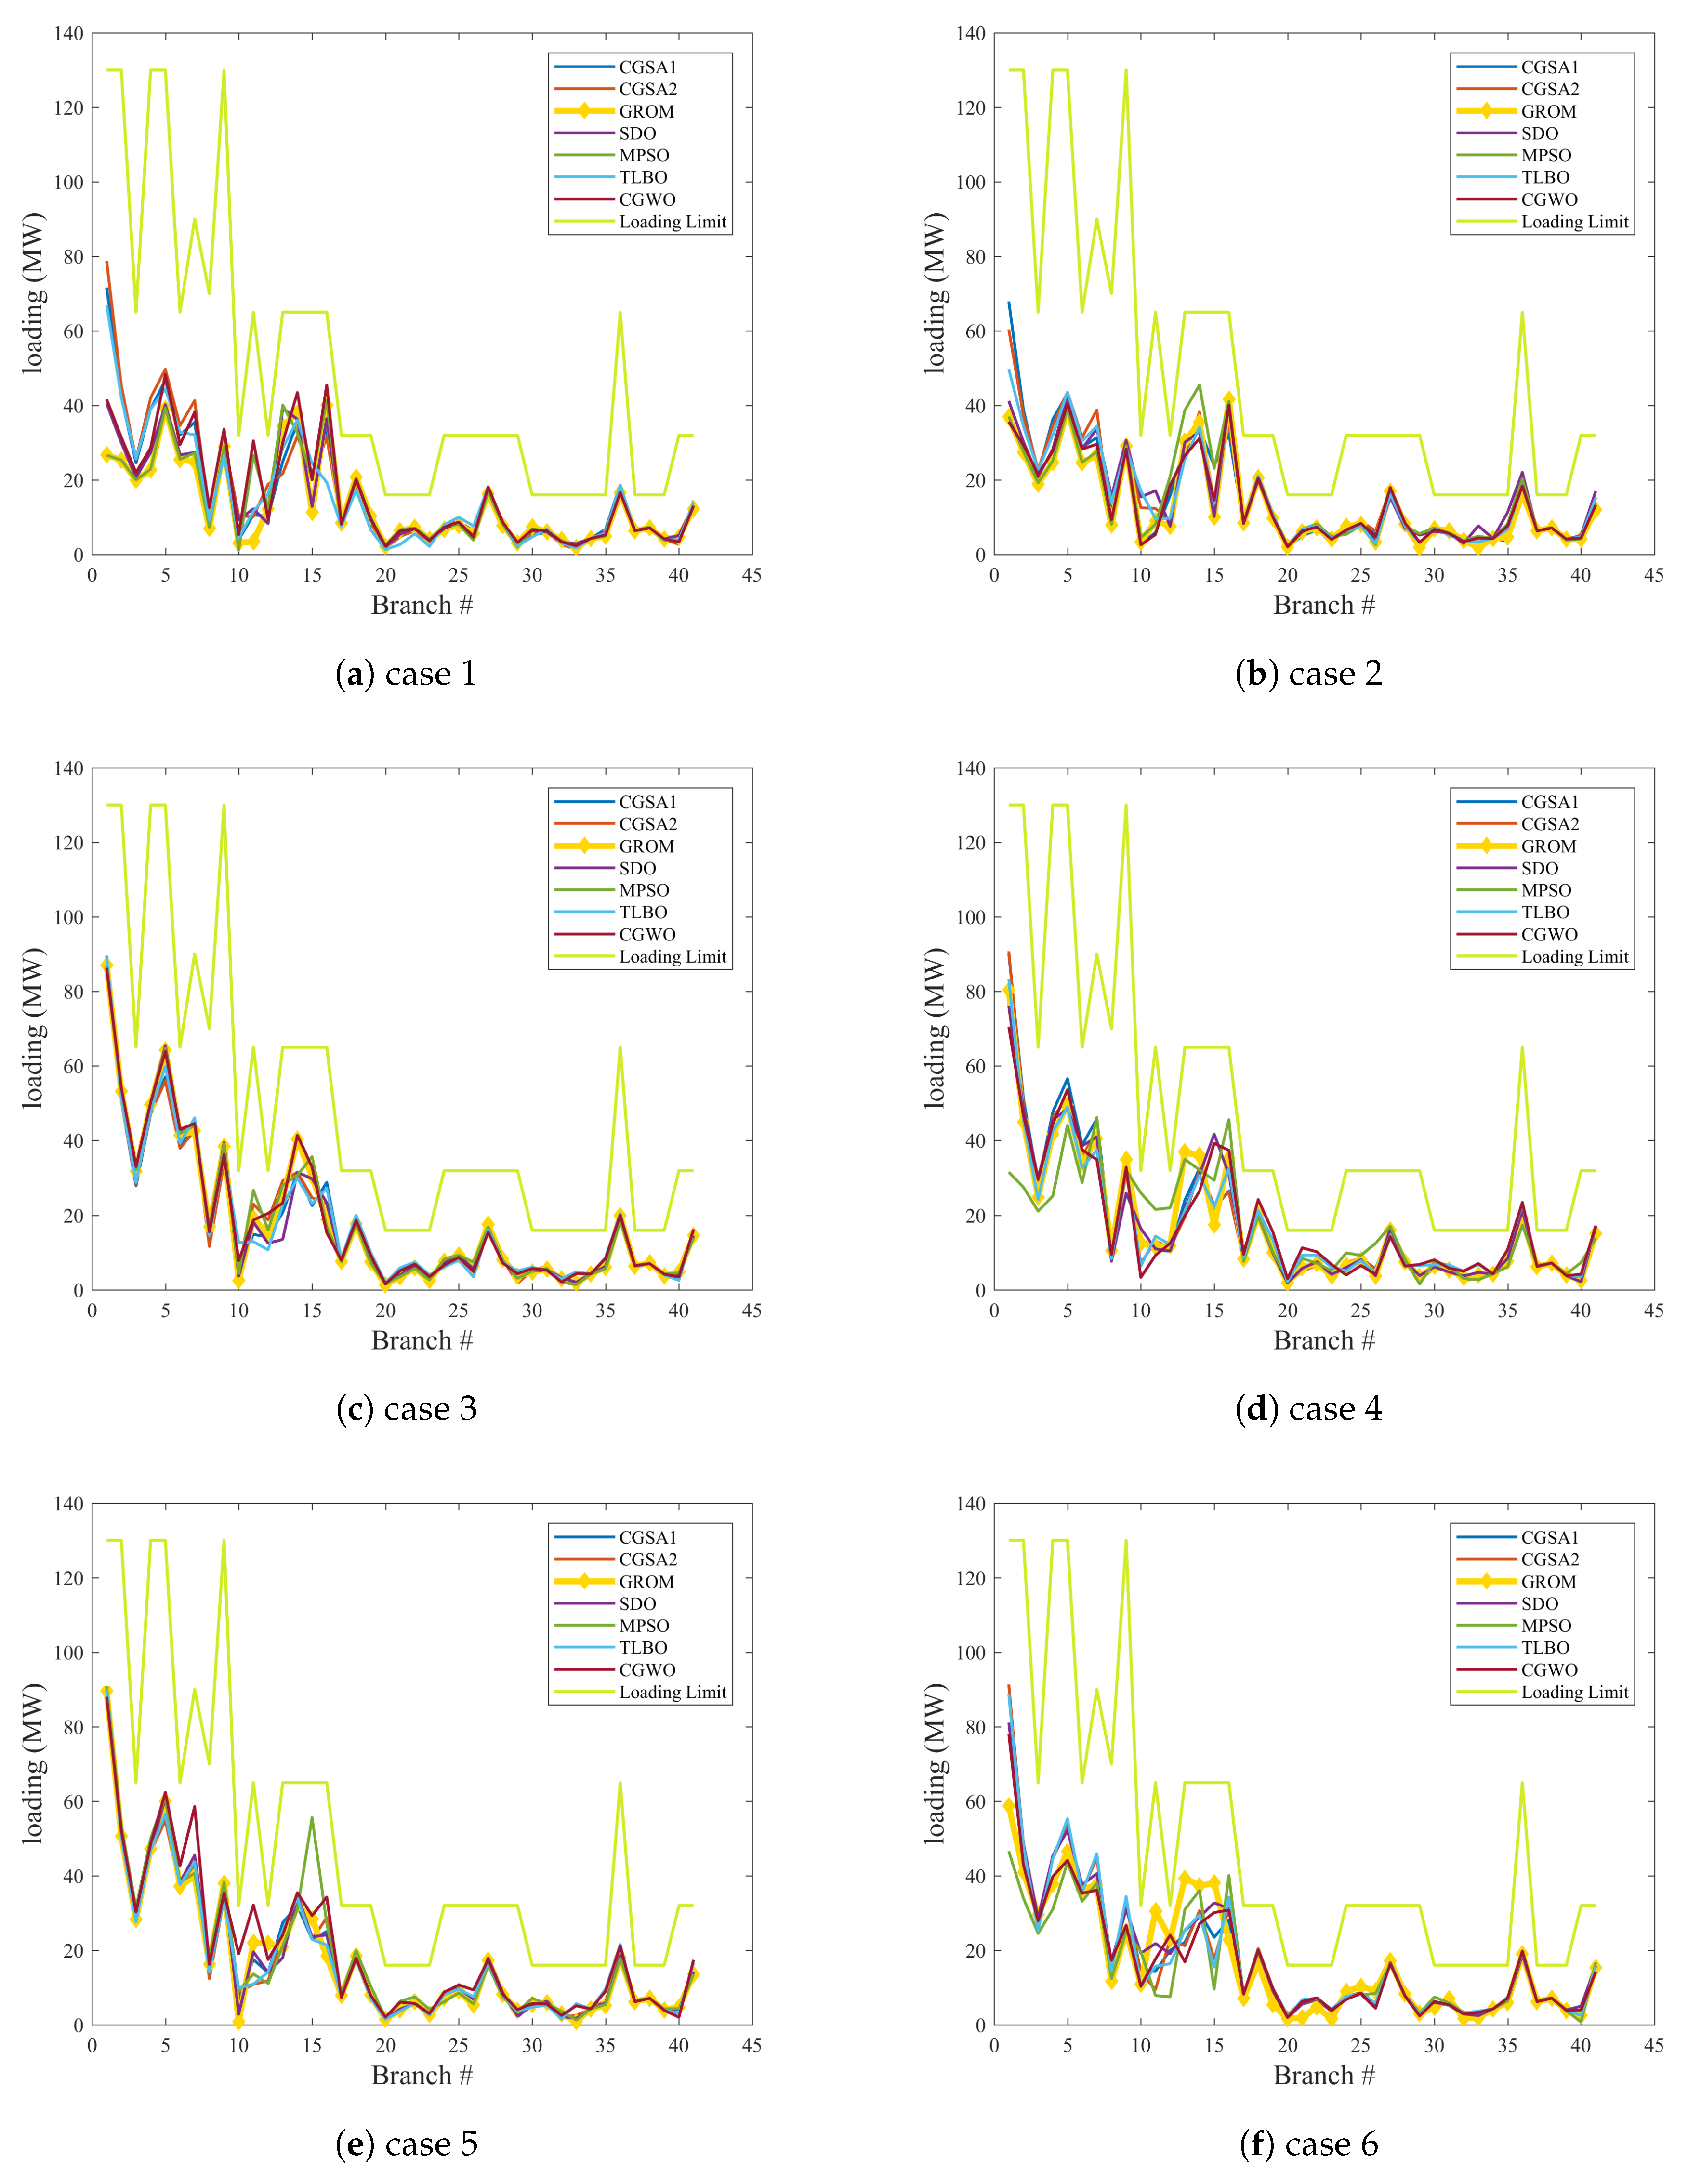
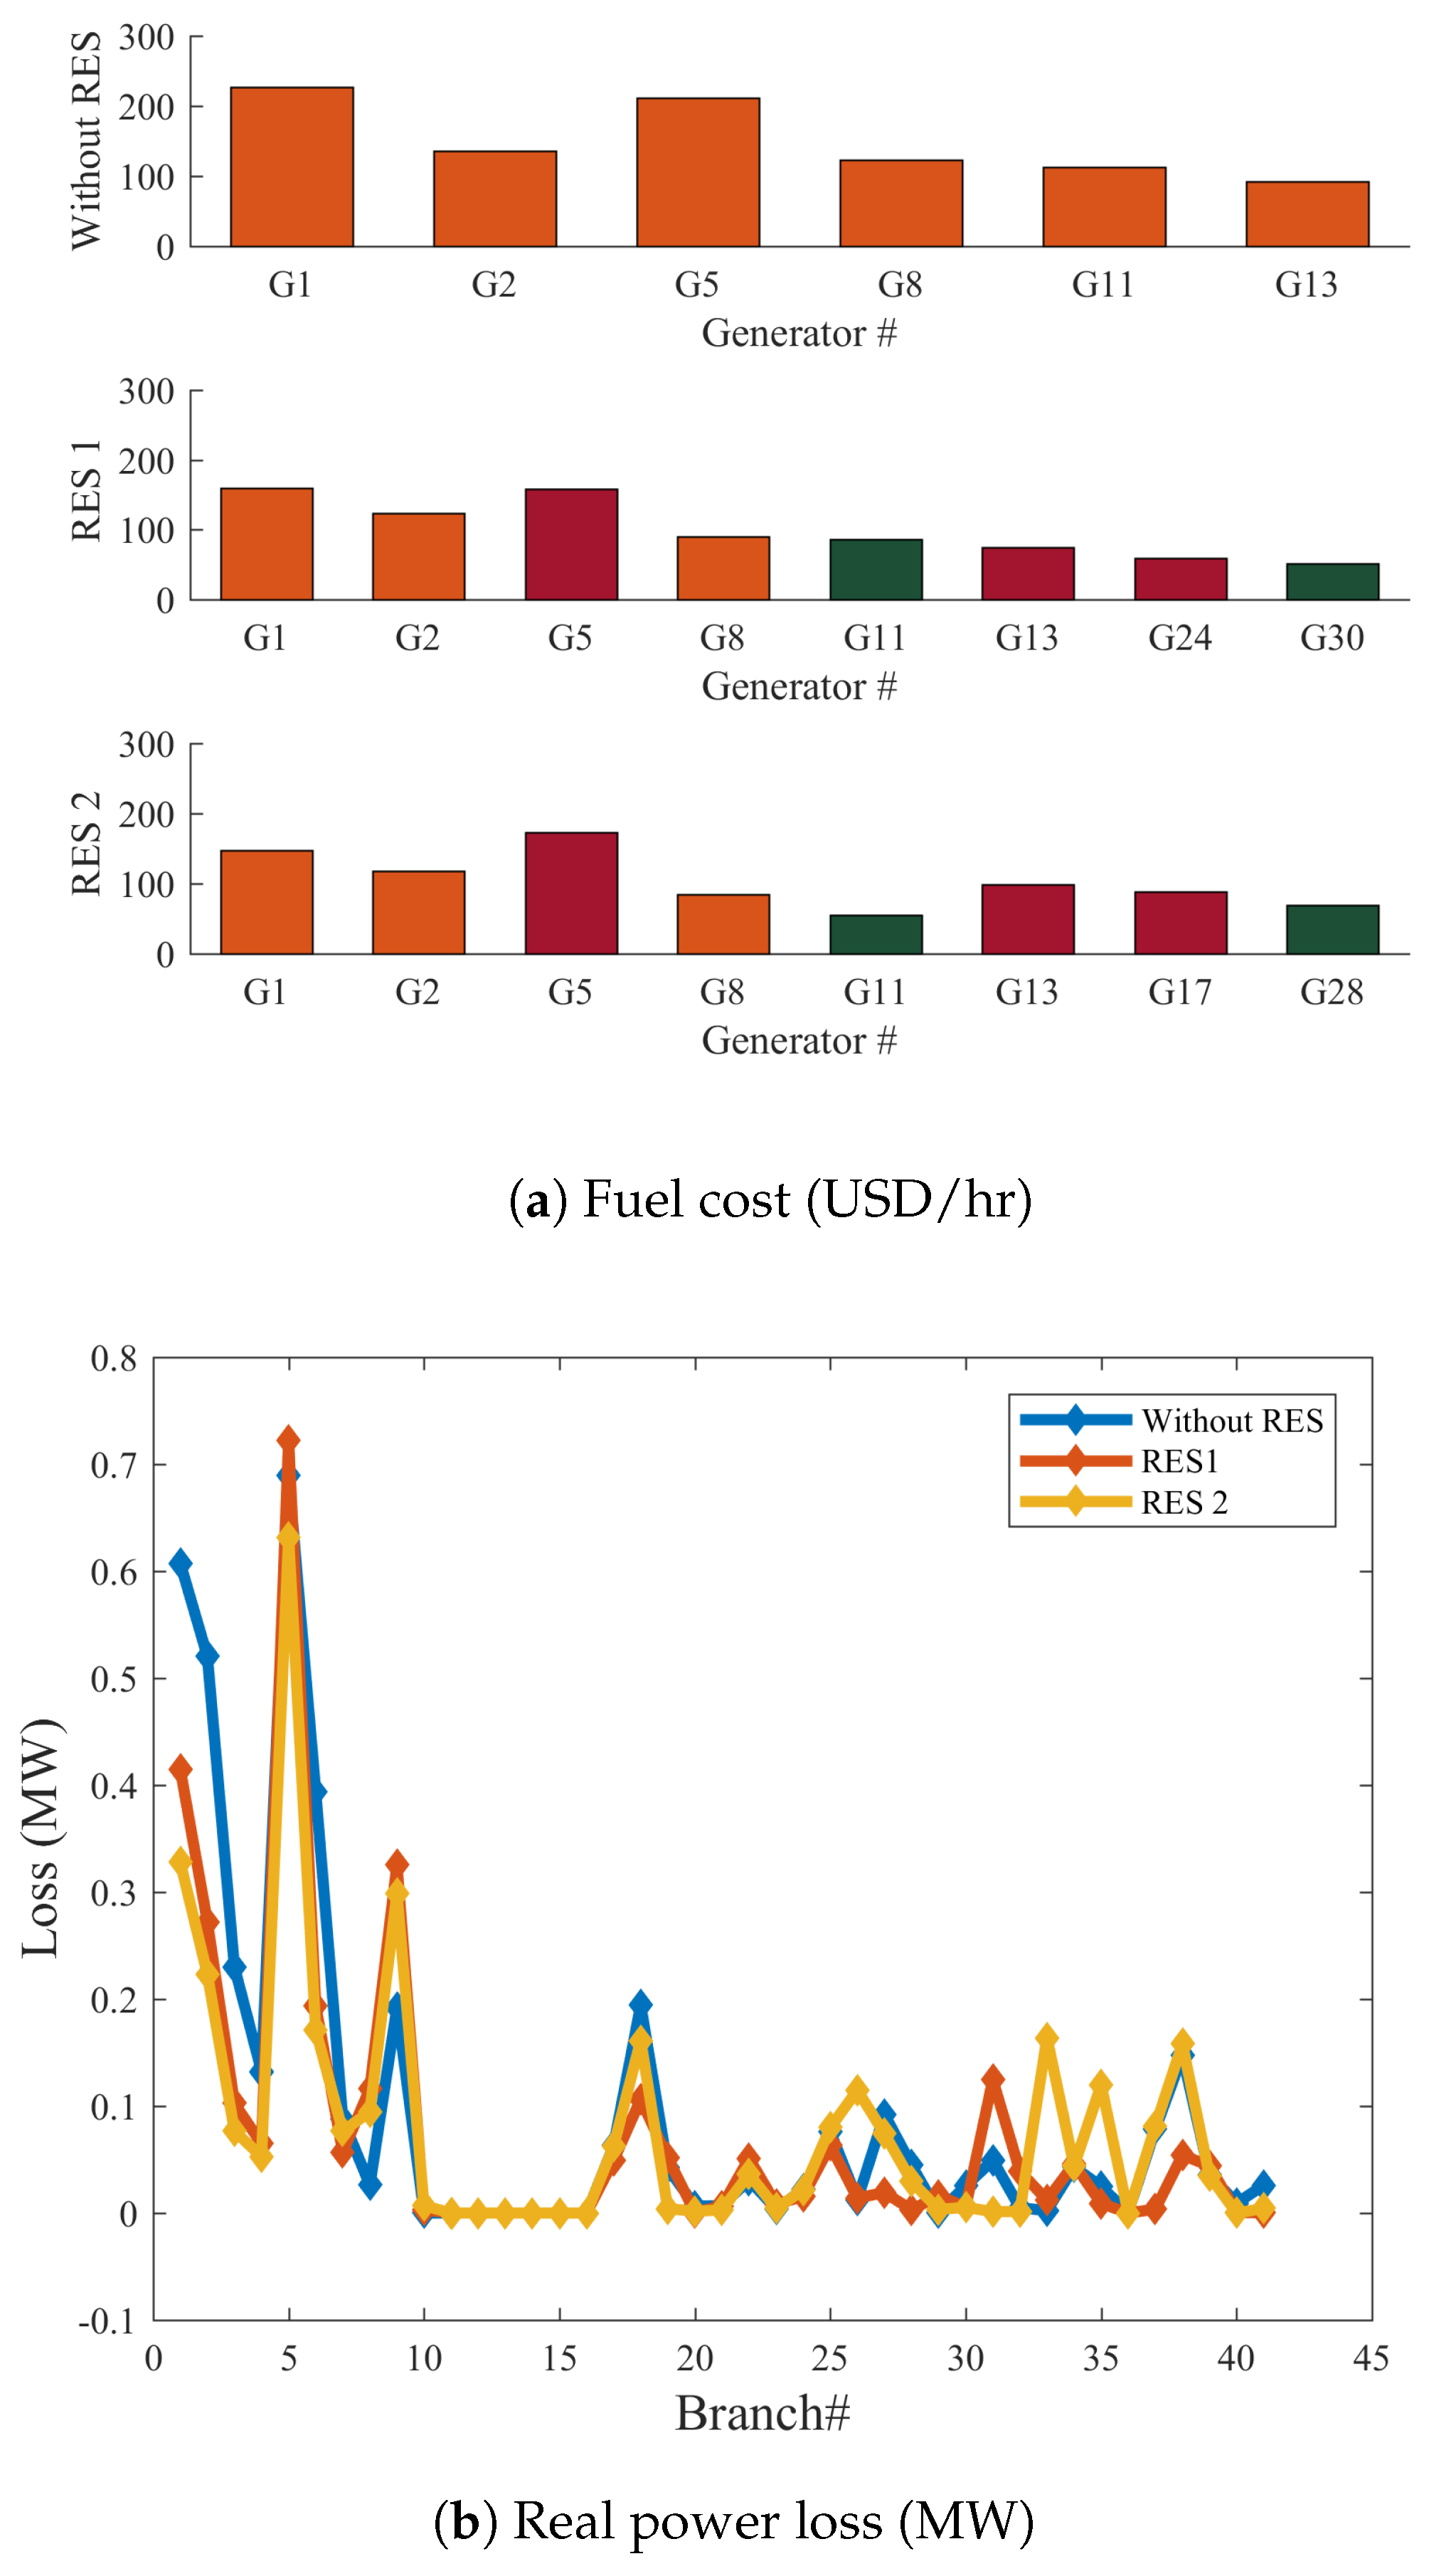
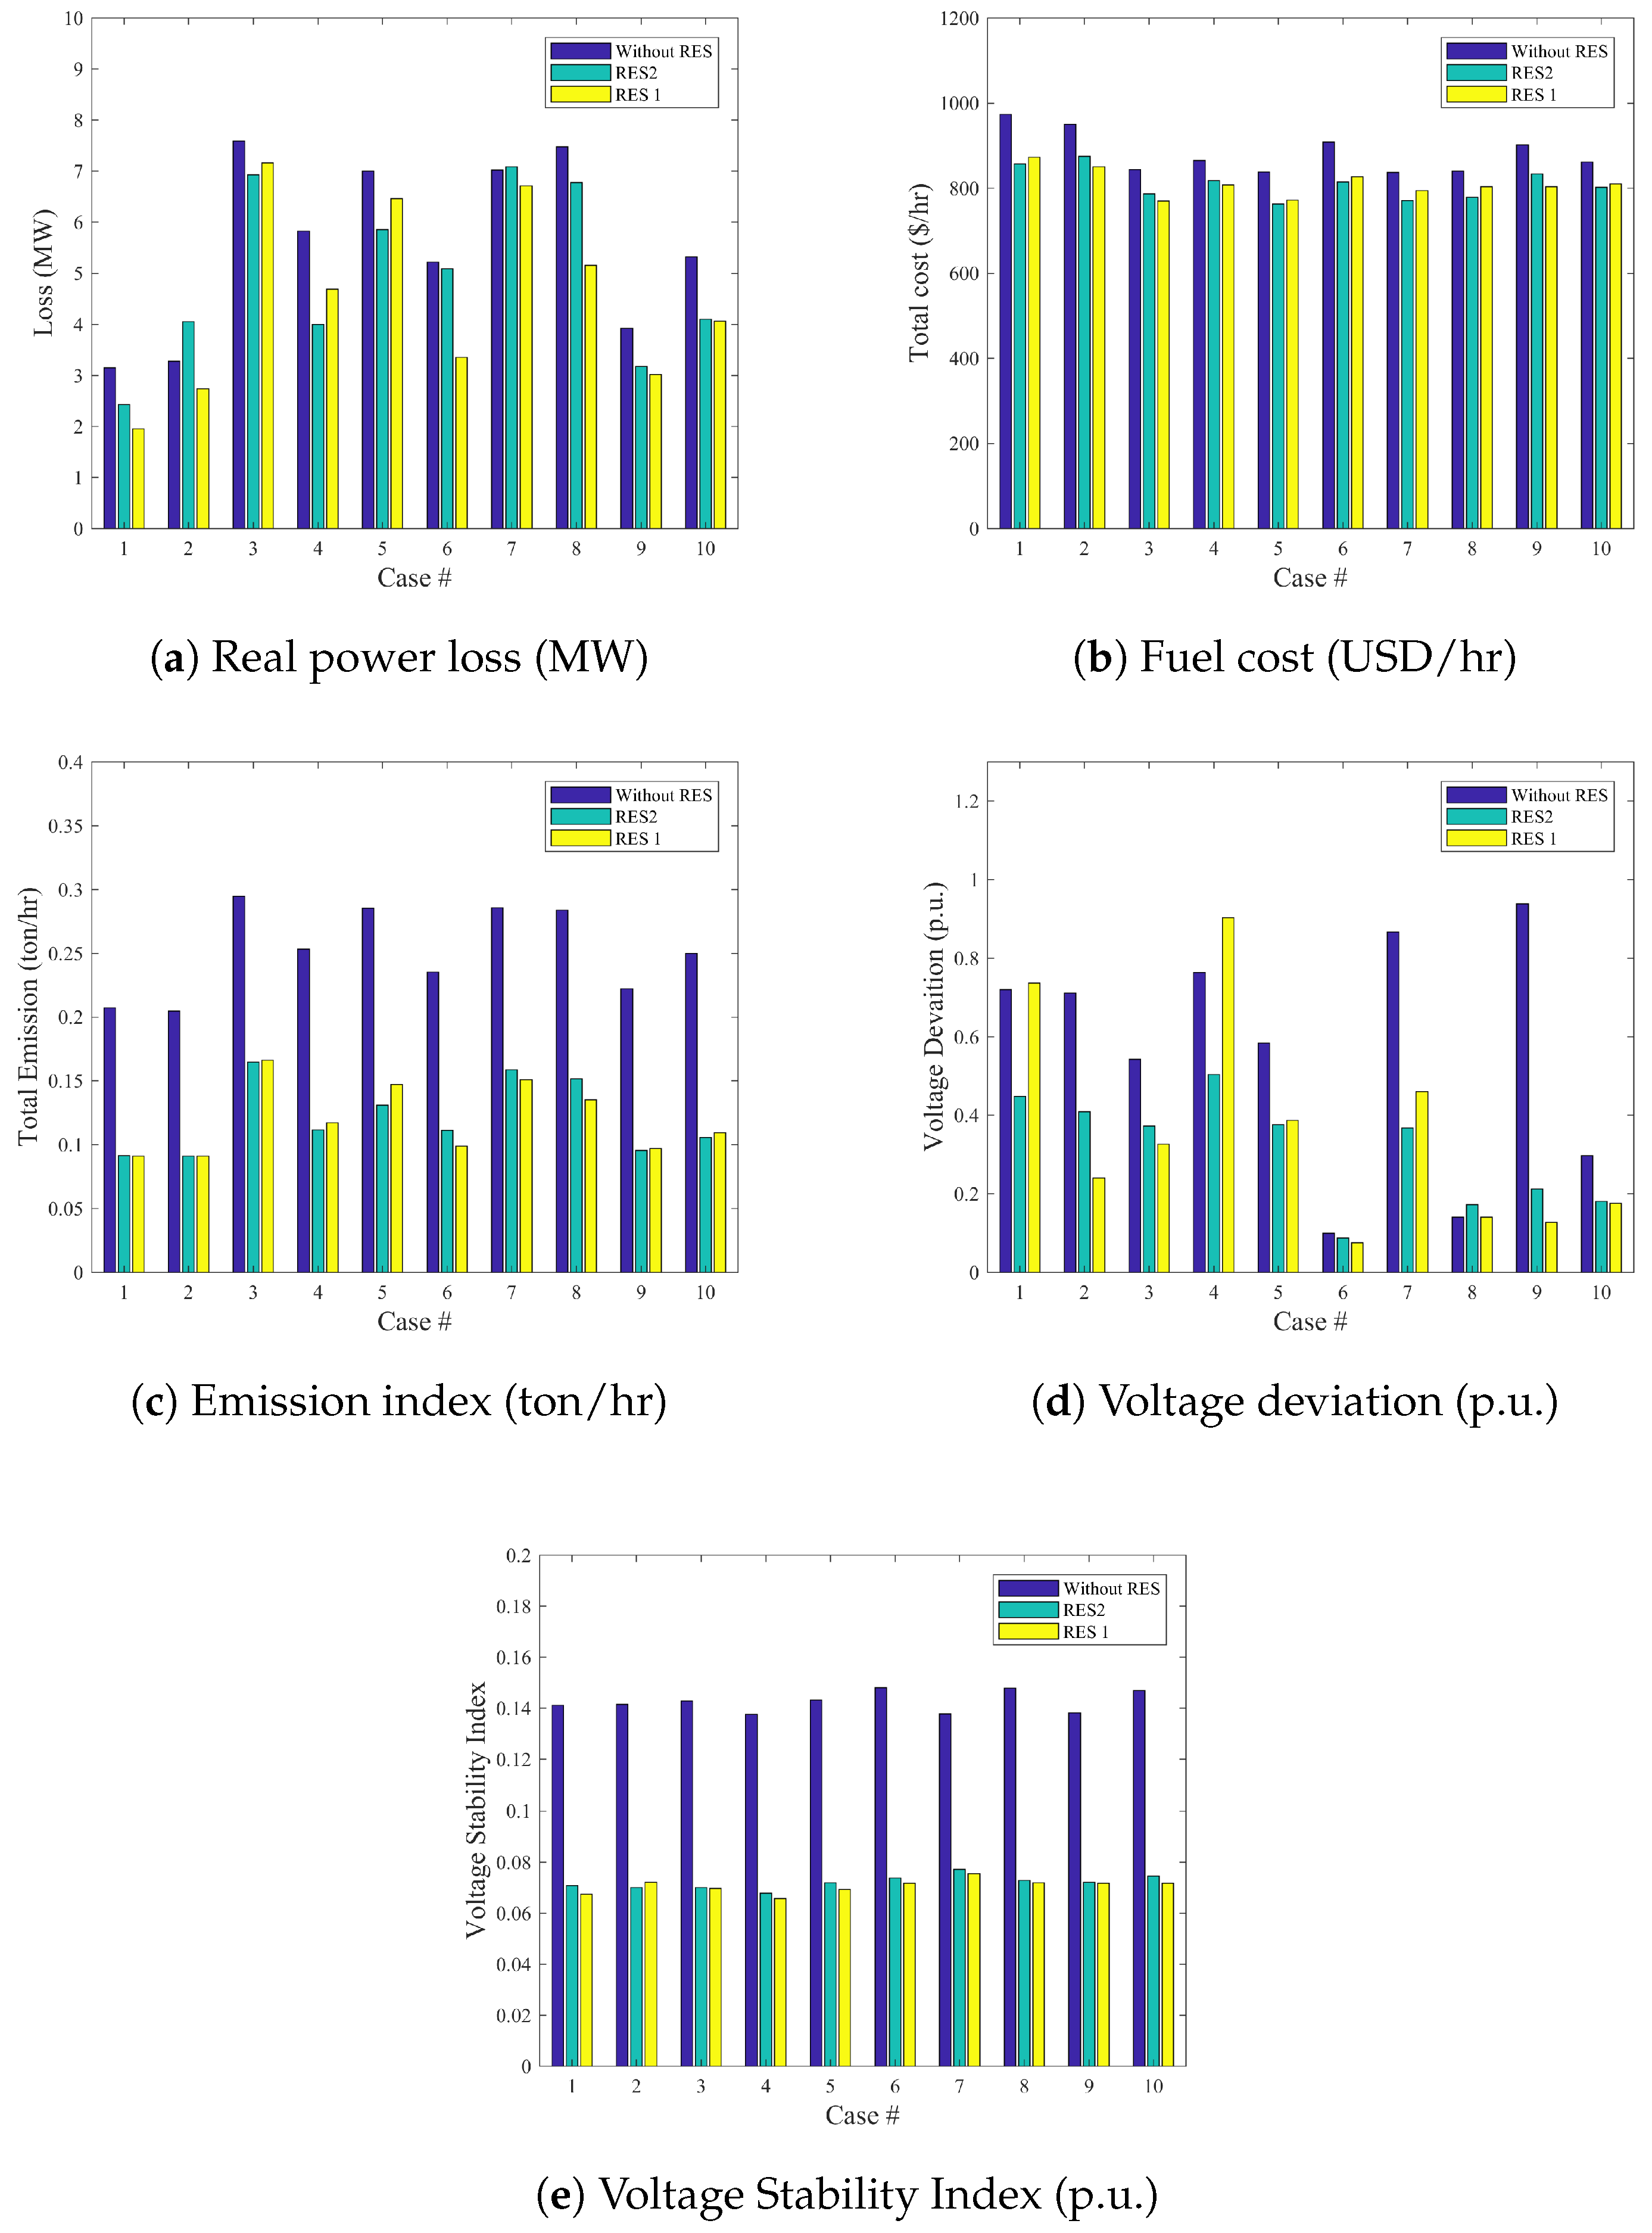
- Case 1: Real power loss minimizationIn this case the GROM is applied to solve the OPF problem for a power network with and without RES considering only the real power loss. By adding the wind and PV model as a negative load to the IEEE 30-bus system (Modified 1 and 2), the total load demand and power losses are reduced. Figure 6 shows the power loss and loading prolife for the three system cases: IEEE 30-bus system, IEEE 30-bus Modified (1) and IEEE 30-bus Modified (2). The power loss in IEEE 30-bus Modified (1) and IEEE 30-bus Modified (2) was reduced by 37.85% and 22.9%, respectively compared to IEEE 30-bus system without RES. The GROM results for case 1 and all other cases will be presented are compared to other proposed optimization methods in Section 3.3.
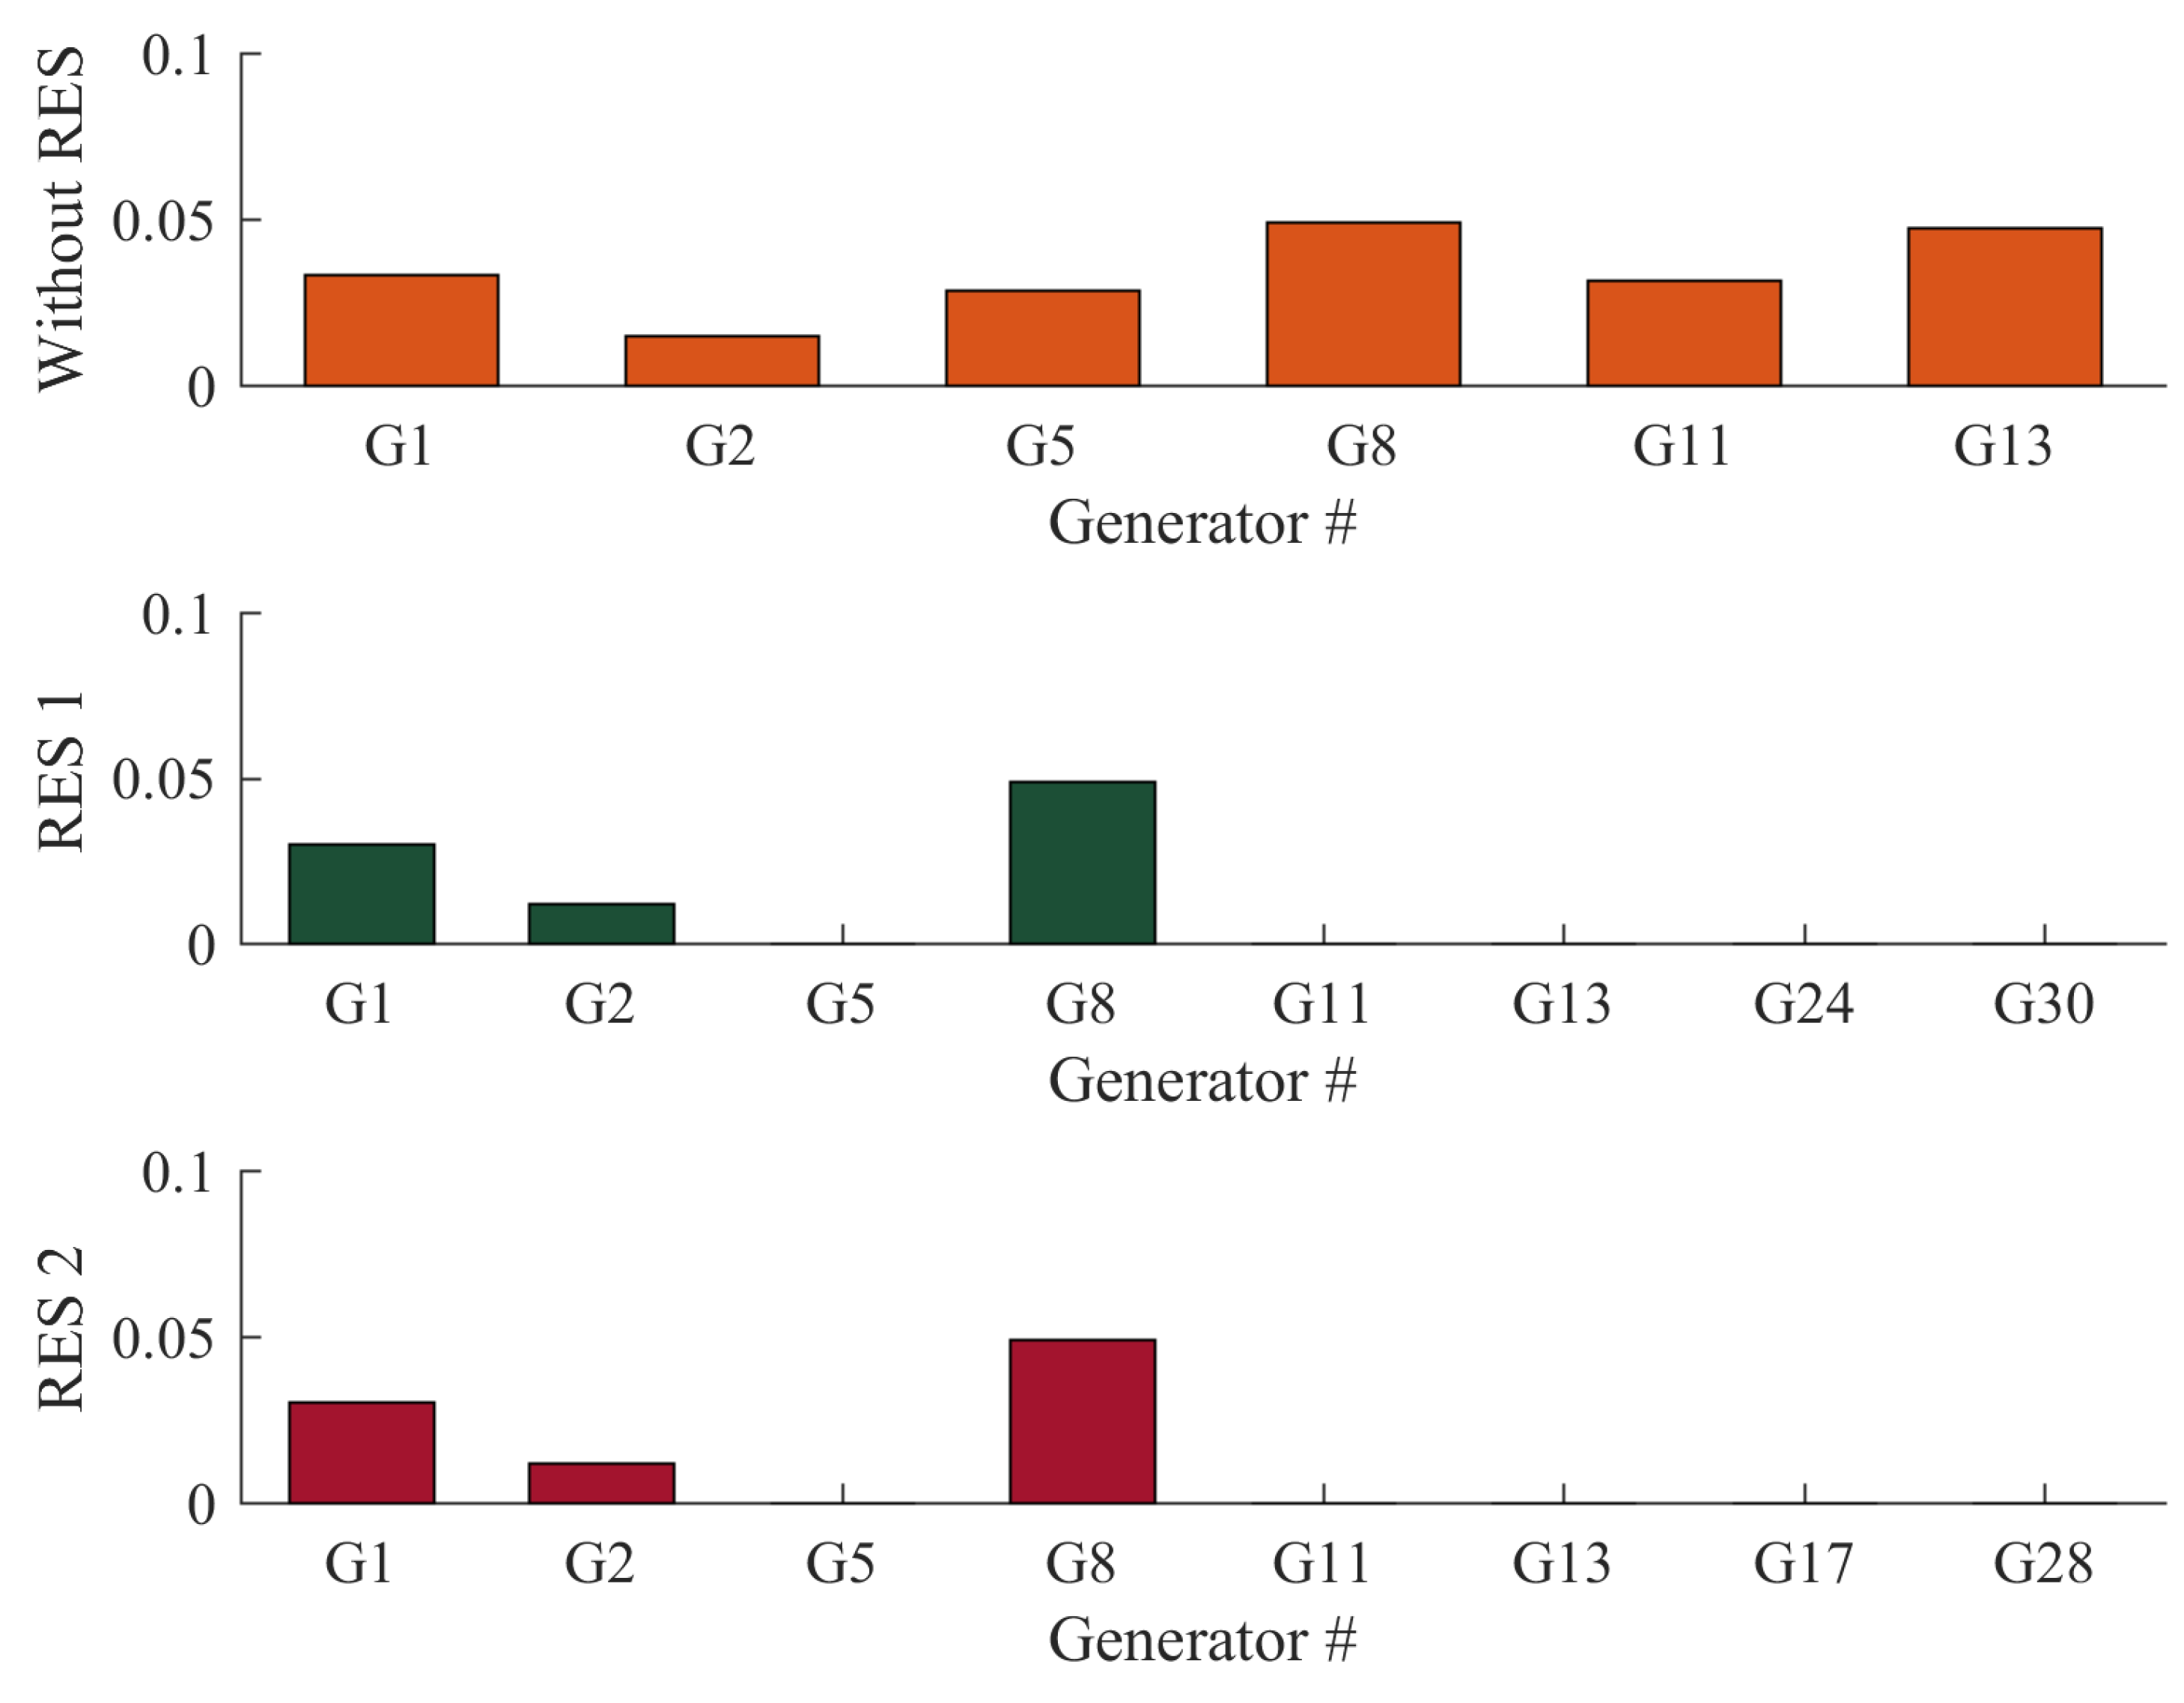
- Case 2: Emission index minimizationIn this case, the environmental impact in the power networks is considered and analysed. A gas emission analysis has been carried out for the three proposed IEEE systems to show the environmental benefits of optimally control the power generations. Figure 7 presents the emission index for GROM model in all network scenarios with or without RES. The GROM can achieve an emission index savings of around 55.54% for IEEE 30-bus model with RES (Modified (1) and (2)) compared to IEEE 30-bus model without RES. In IEEE 30-bus model with RES, the wind and PV system allows a reduction in the number of thermal power generation to meet the required load demand.
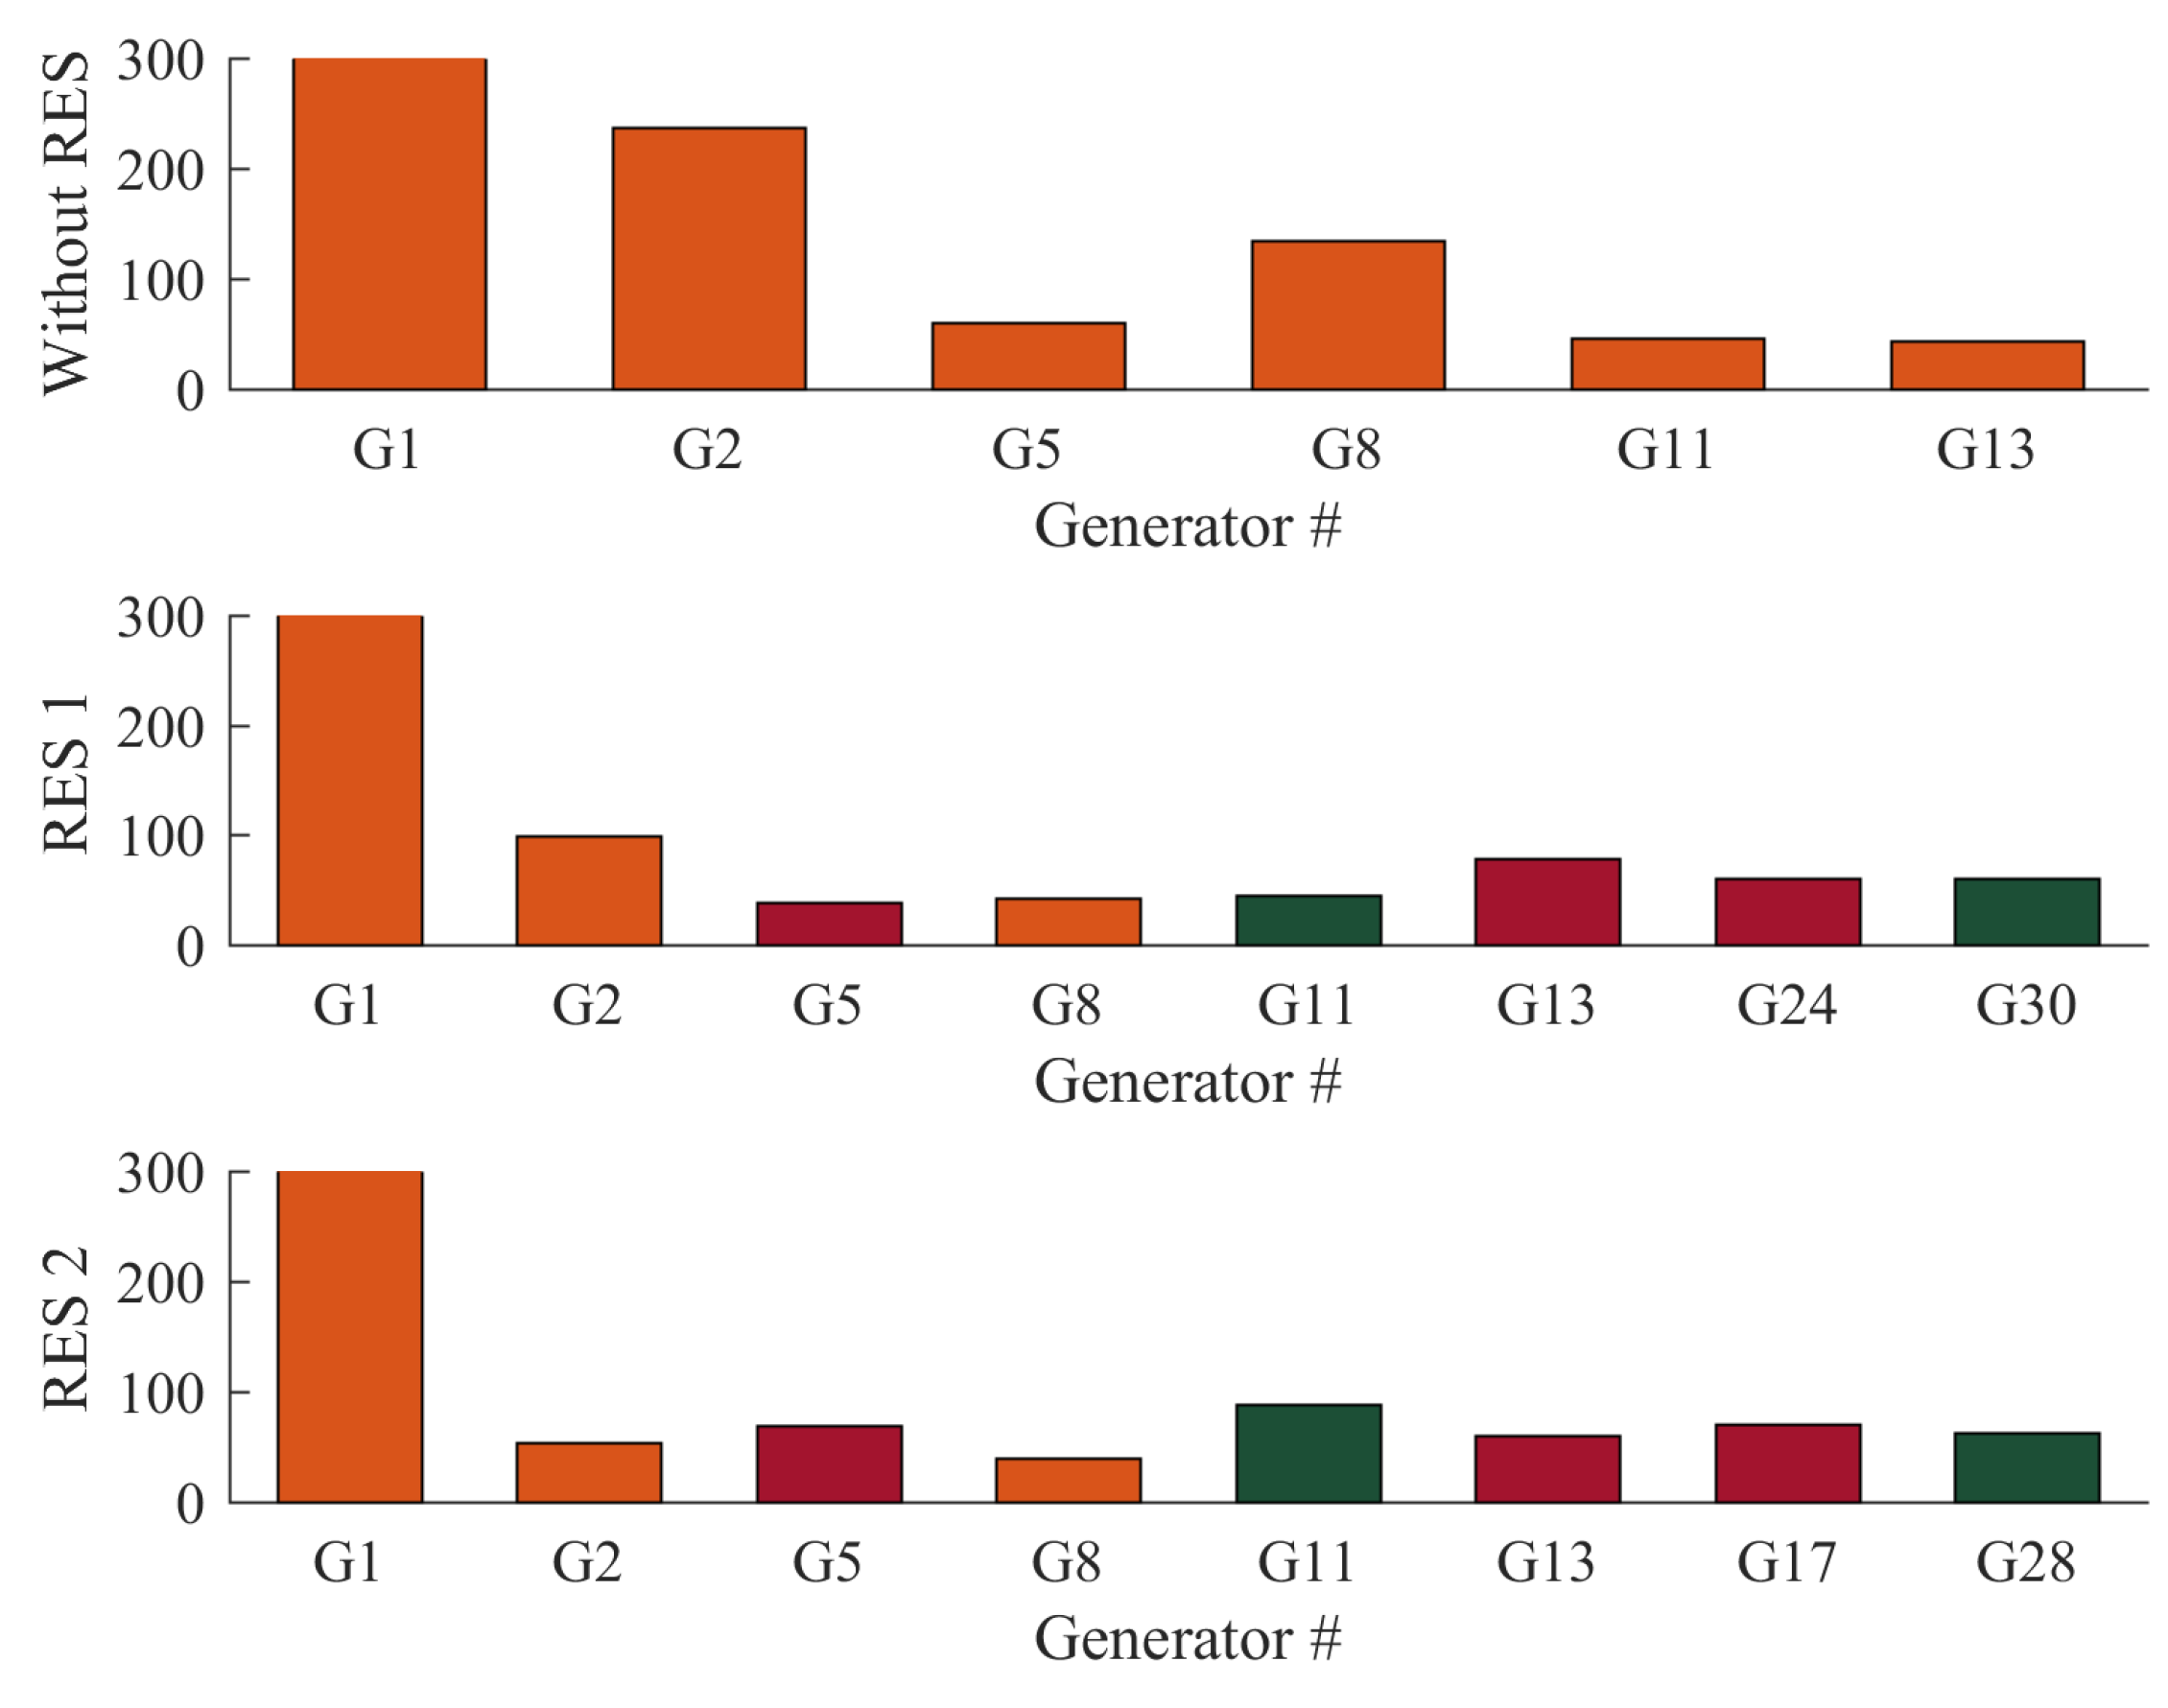
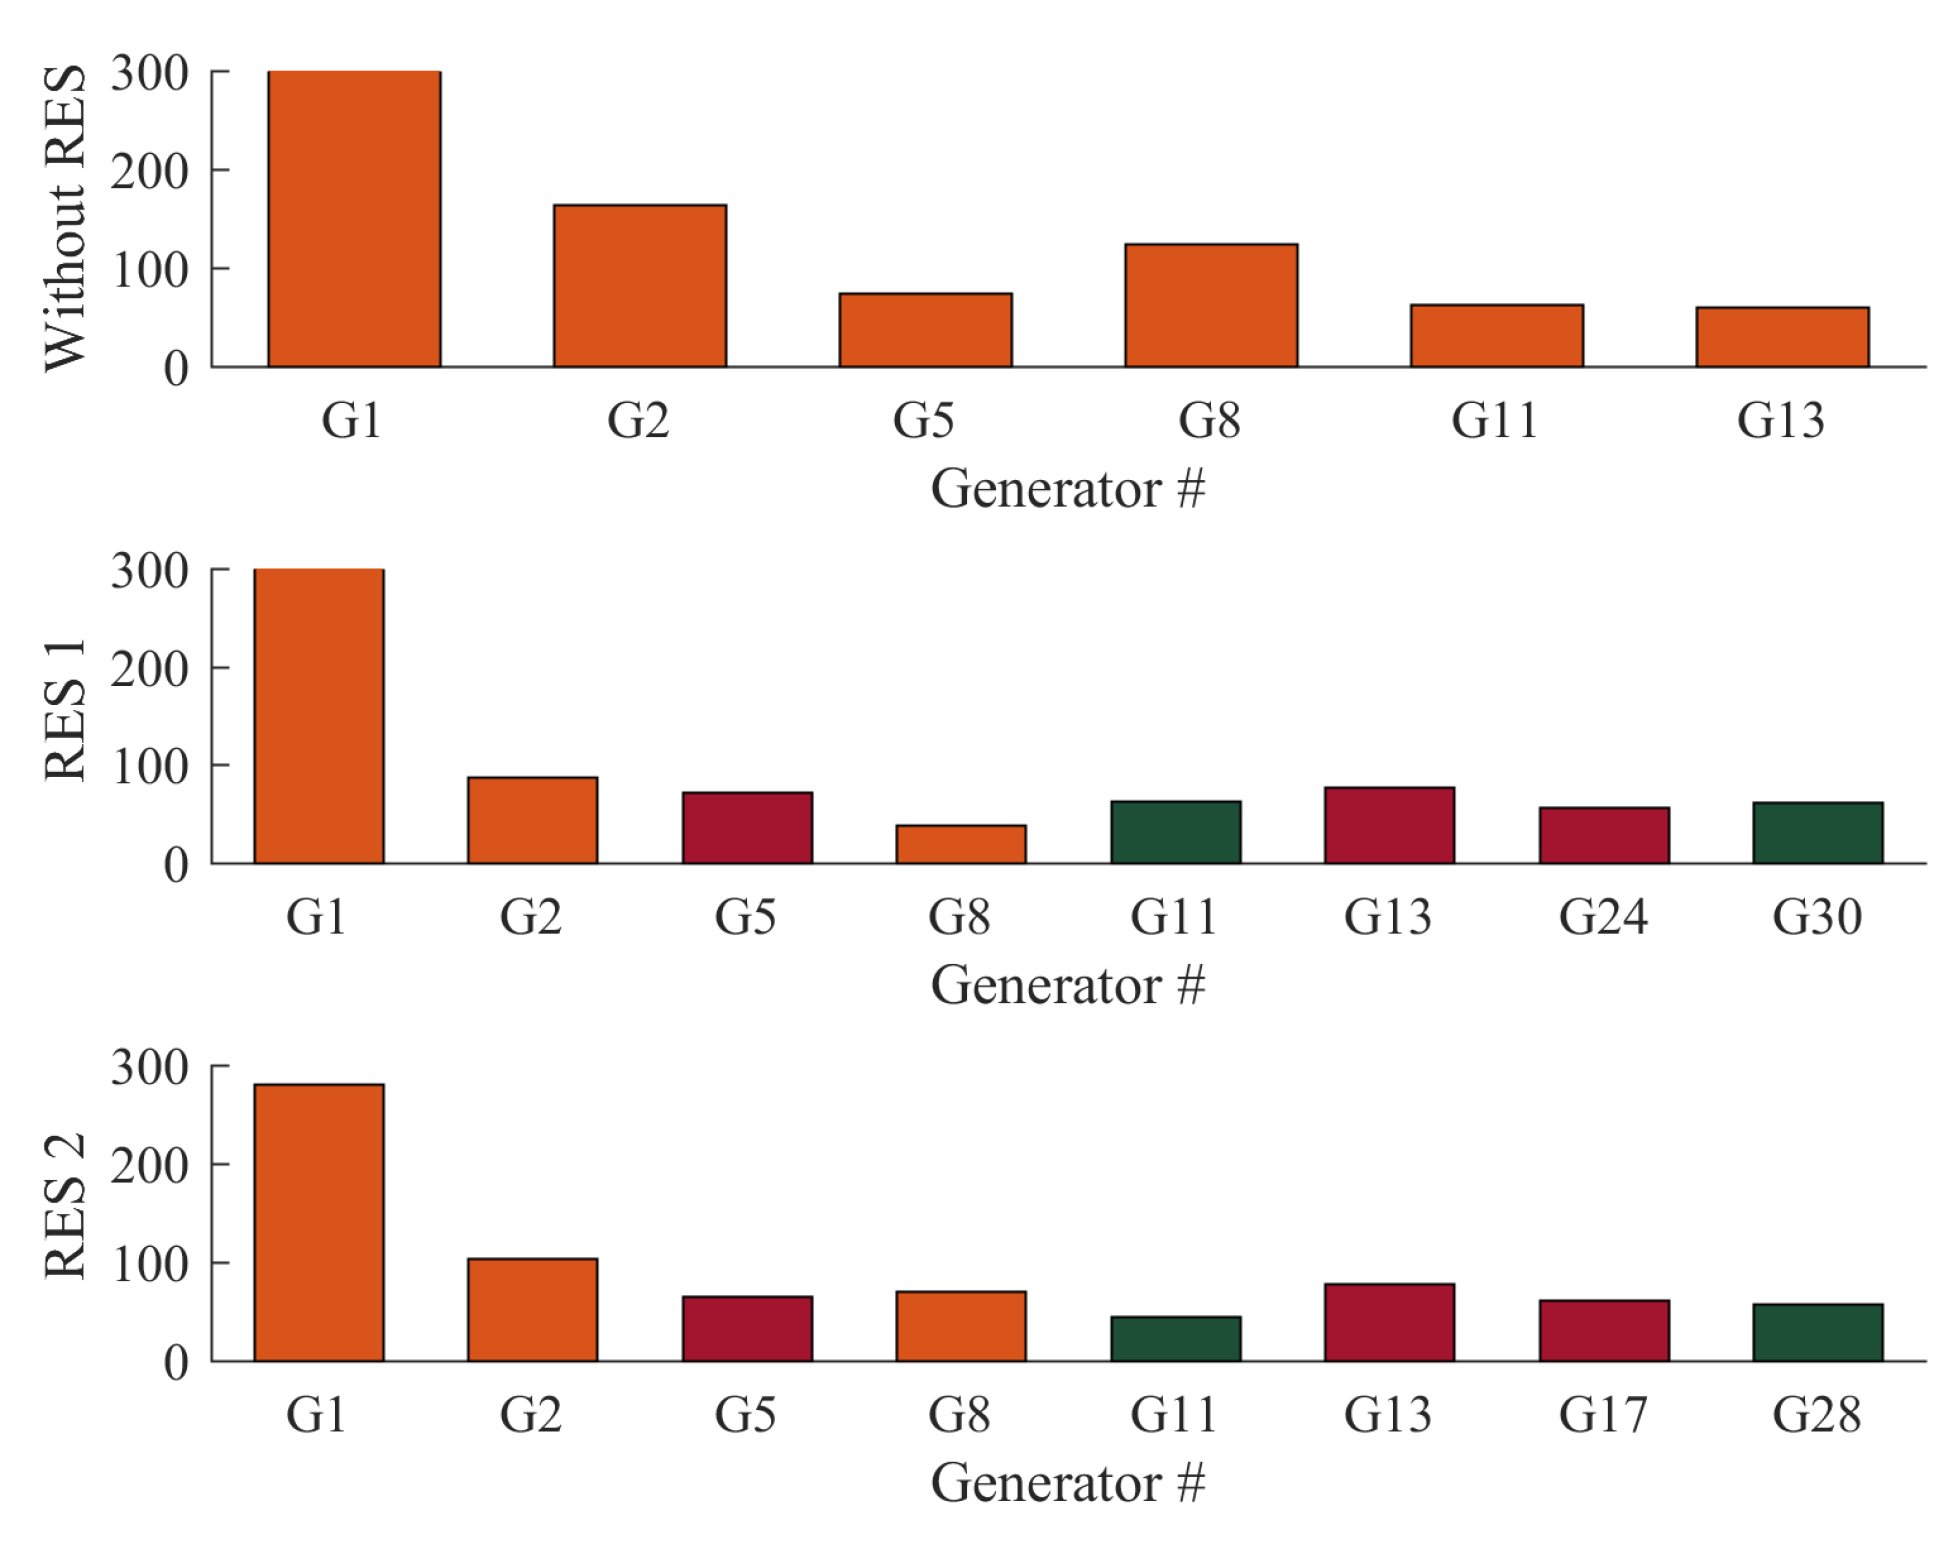
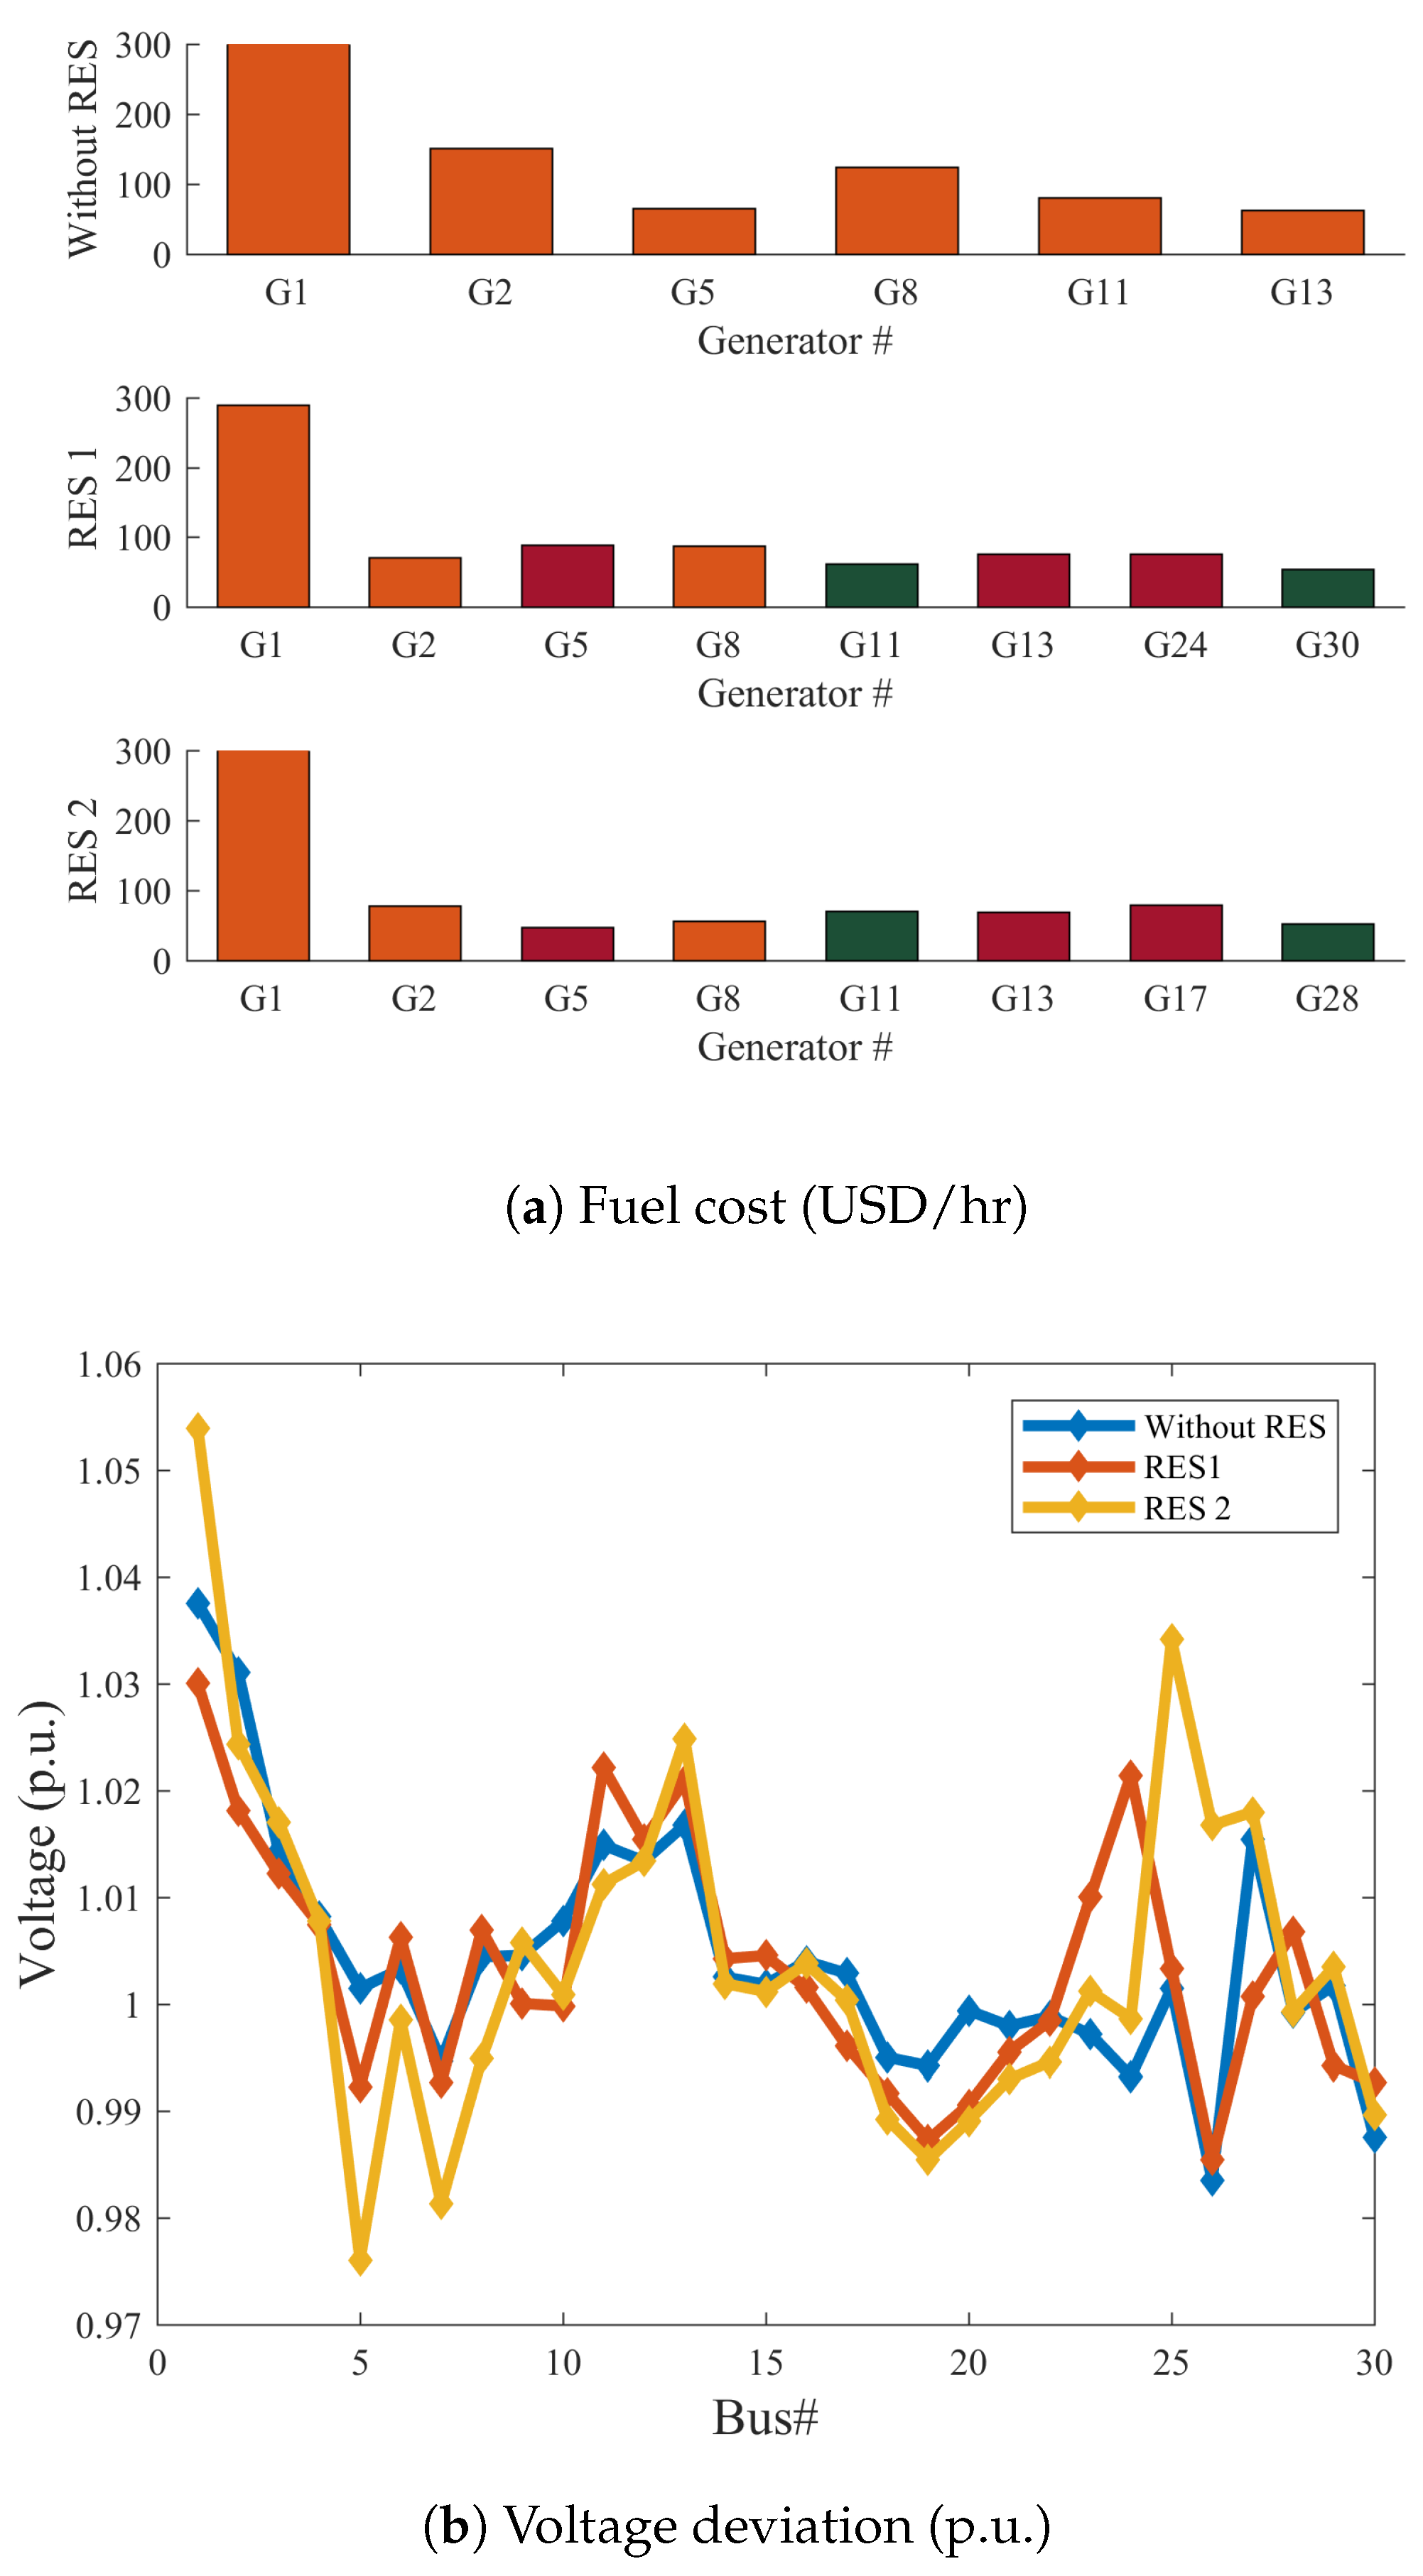
- Case 3: Minimization of the cost of Fuel with value point effect of thermal power, wind, and solar PV generating unitsIn case 3, the GROM algorithm is designed to achieve a substantial saving in the fuel and power generation costs. The economic power generation is considered and analysed in this section. The analysis of power generations cost with valve point effect of thermal power has been presented to show the commercial benefits of the optimality control IEEE power system with and without RES. In Figure 8, the total power generations cost has been computed and presented. The GROM algorithm can reduce the power generations cost in IEEE 30-bus Modified (1) and IEEE 30-bus Modified (2) by around 8.69% and 6.68%, respectively, compared to IEEE 30-bus without RES. The power generation cost saving results show that the RES networks improved the economic performance compared to power network without RES.
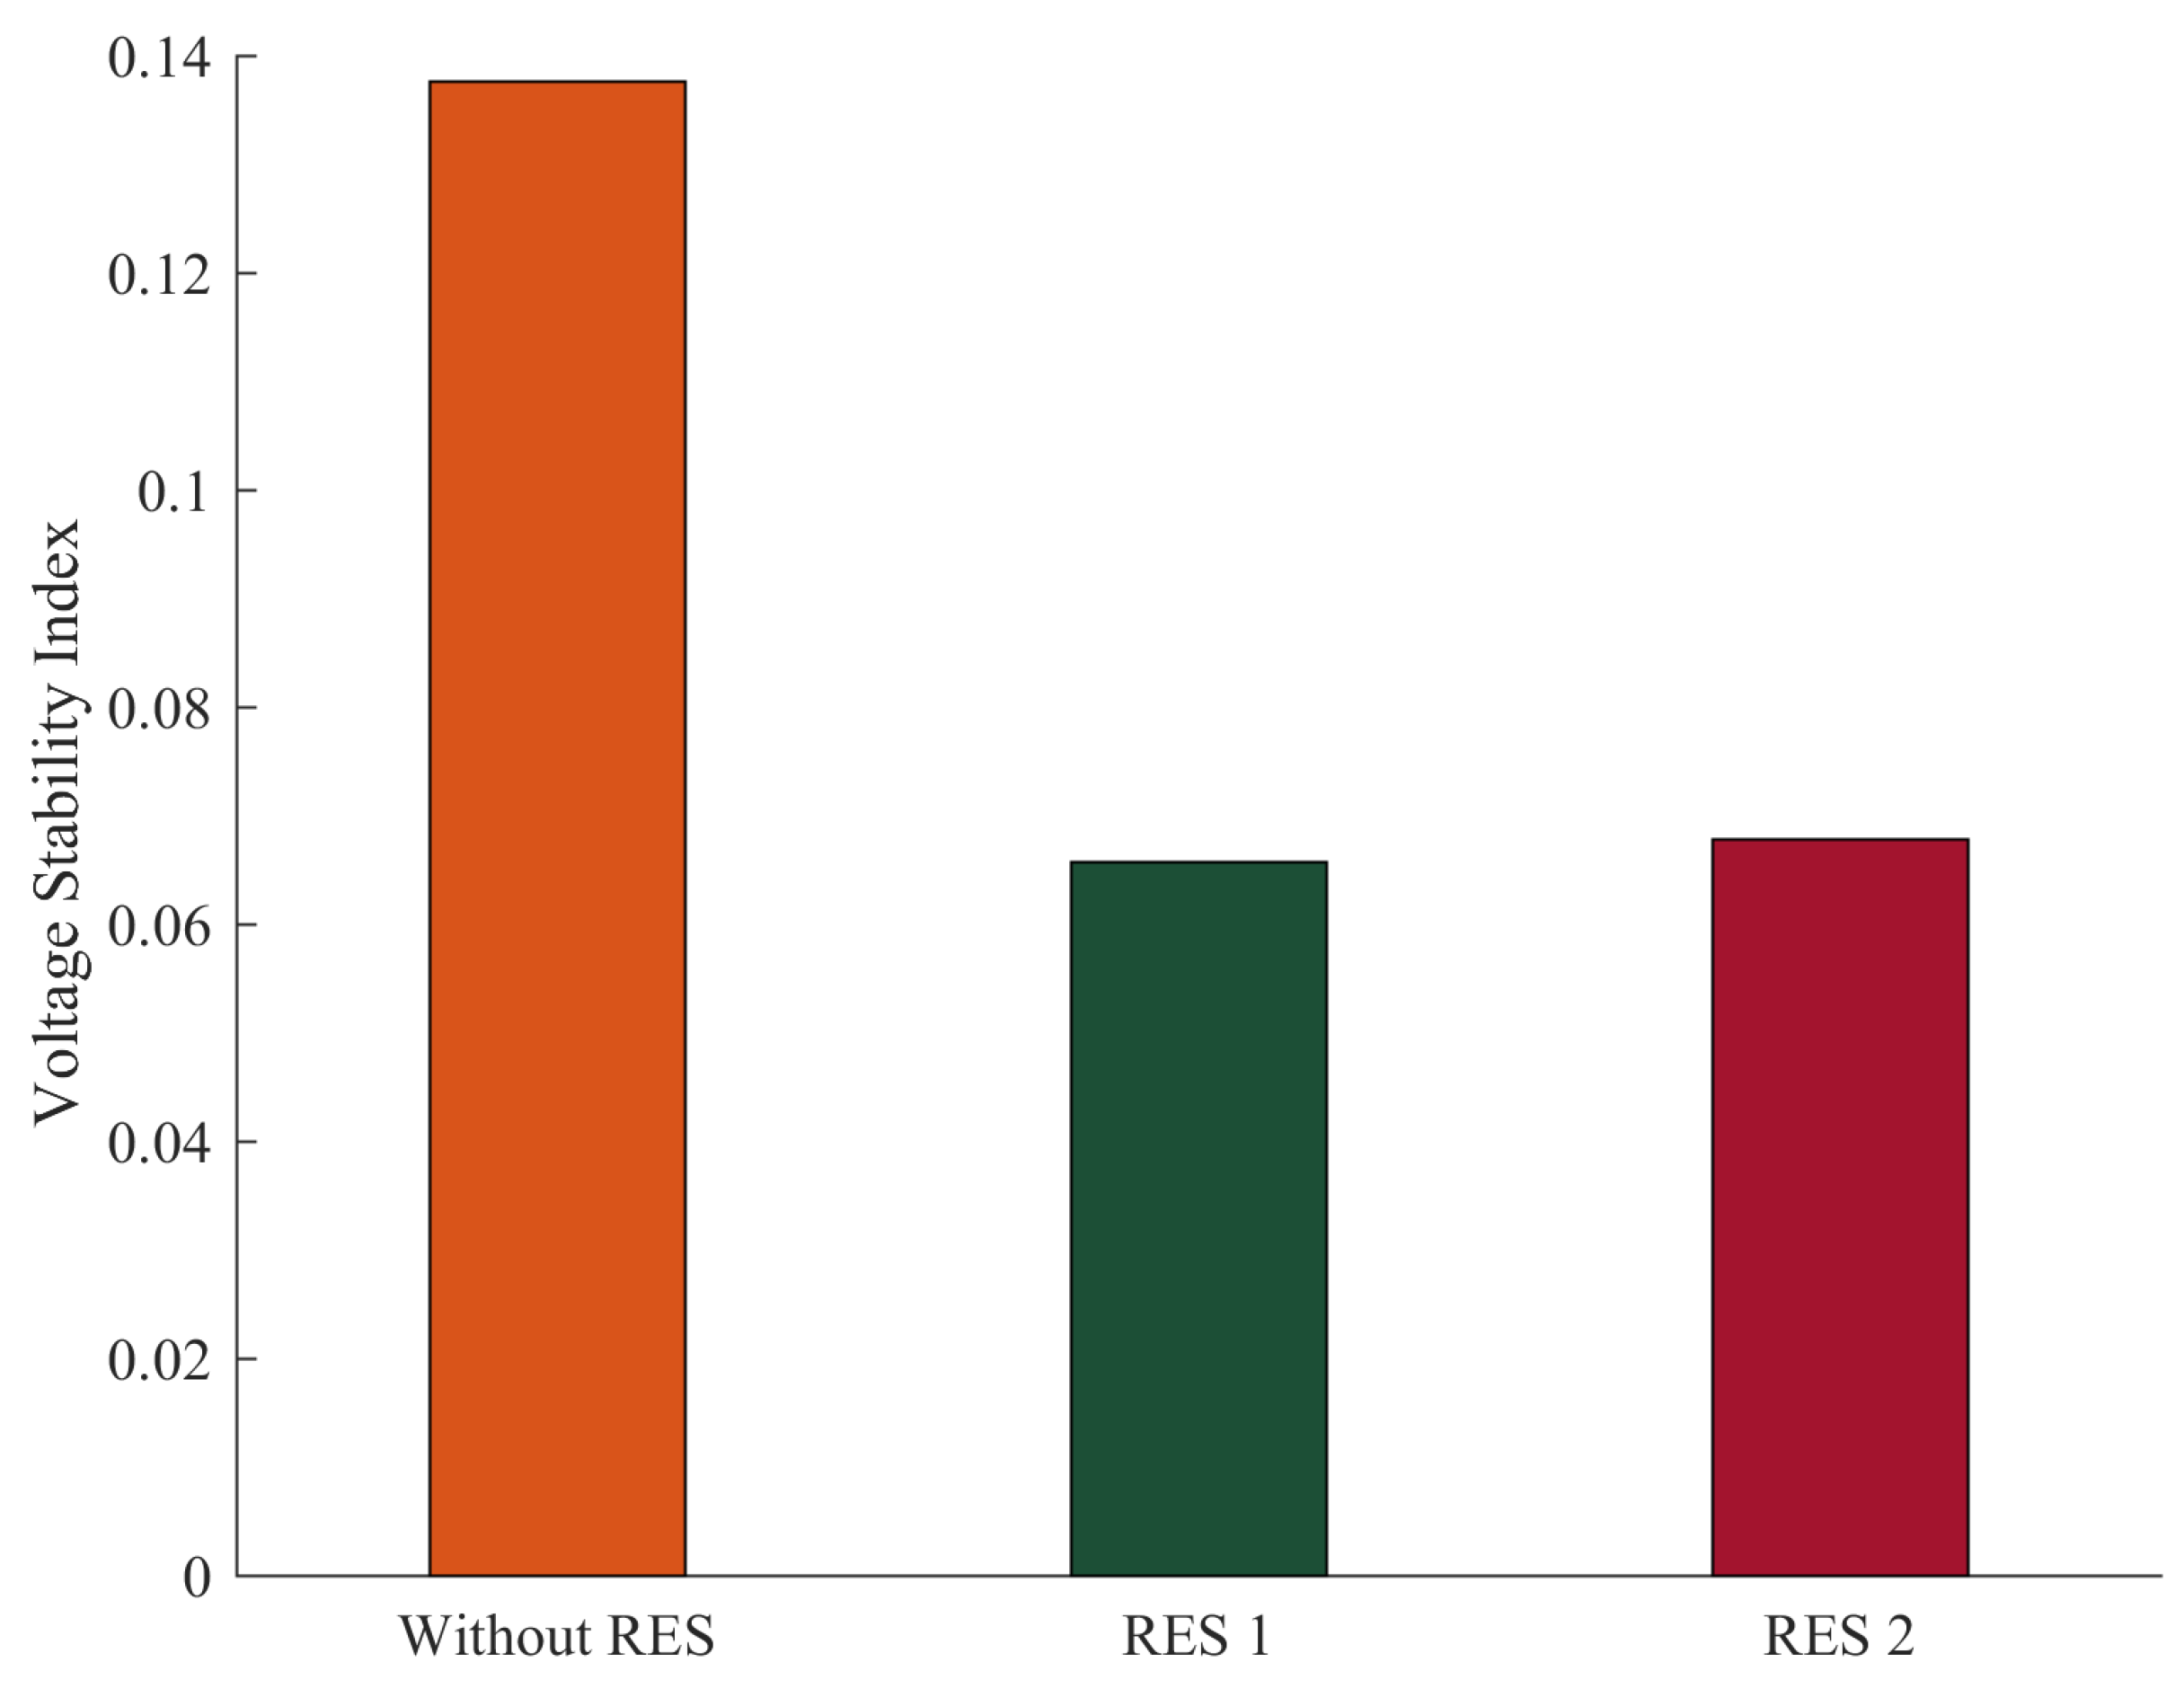
- Case 4: Minimization of voltage stability indexIn this case, the voltage stability index was optimized by using GROM algorithm for IEEE 30- bus network with and without RES. The power quality related to voltage stability is considered in this section. The analysis of voltage stability has been carried out to present the power quality benefits of optimality control IEEE power system with and without RES. Figure 9 shows that the GROM can improve the voltage stability index by 52% and 50% for IEEE 30-bus Modified (1) and IEEE 30-bus Modified (2), respectively, compared to IEEE 30-bus system without RES.
- Case 5: Minimization of the cost of Fuel of thermal power, wind, and solar PV generating unitsThe economic power generation based on the basic cost function is analysed in this section, as seen in Figure 10. The basic fuel cost, as discussed in Section 2, of thermal power generators, wind, and solar generating have optimized for power networks with and without RES. The GROM algorithm can reduce the total generation cost for IEEE 30-bus Modified (1) and (2) by 7.87% and 8.93%, respectively, compared to IEEE 30-bus without RES; in addition, the power generation contribution from renewable energy was 40% and 39%, respectively.
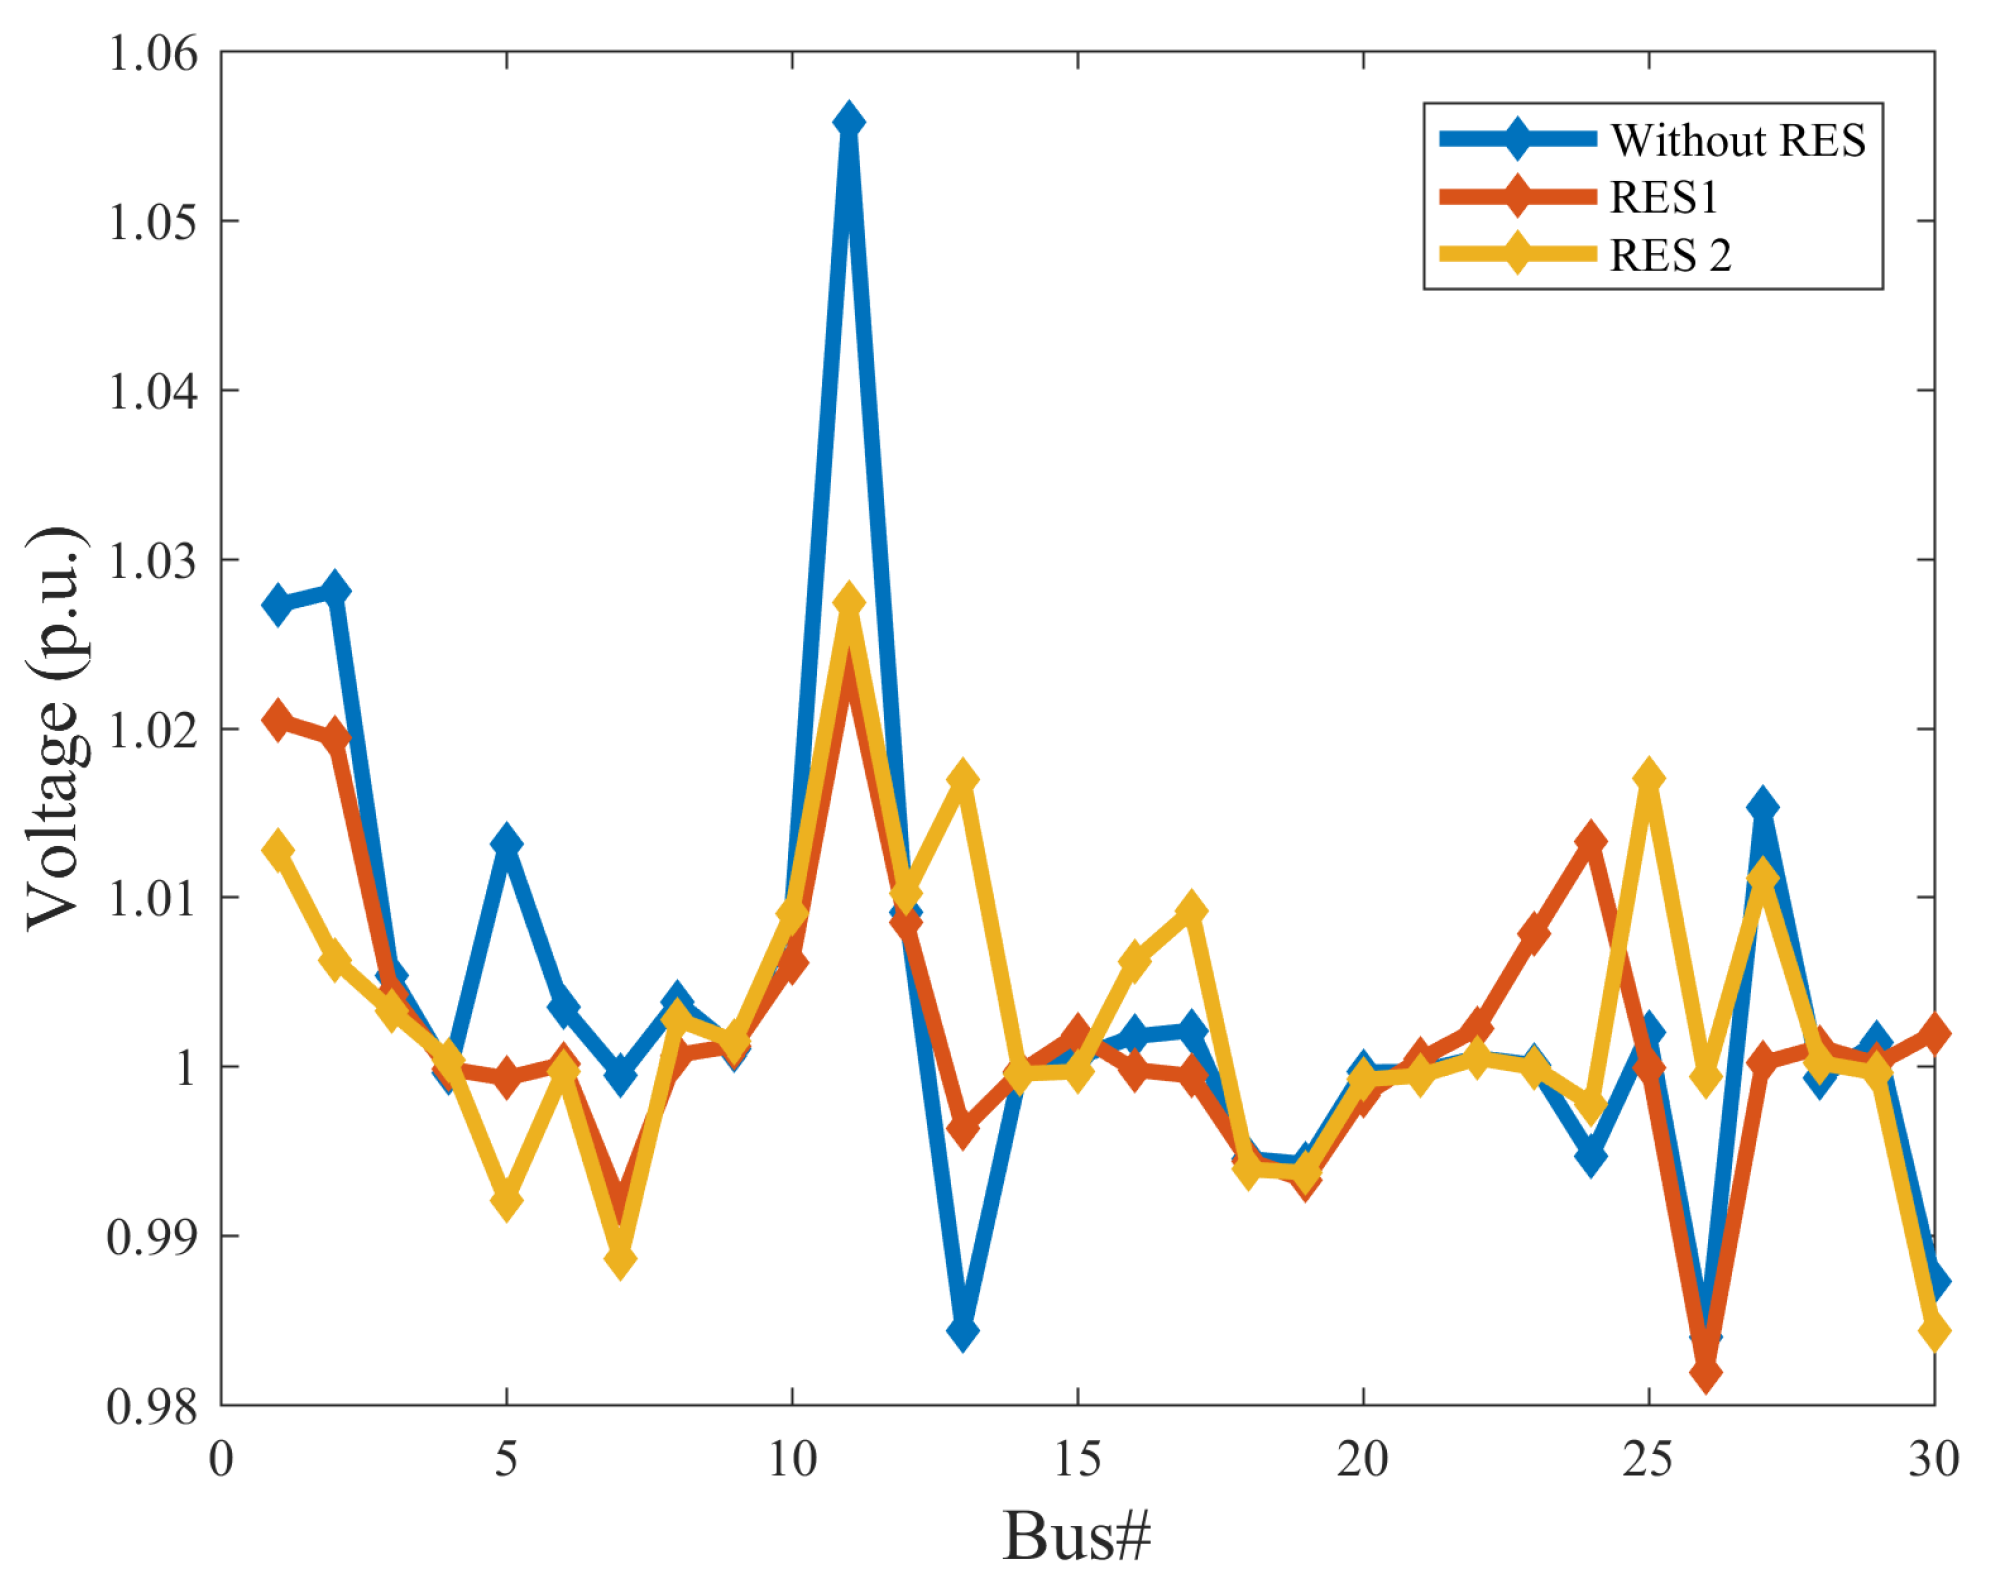
- Case 6: Voltage deviation minimizationIn this section, a cost function for voltage deviation has been used to show the impact of optimally control on power networks. Figure 11 presents the voltage profile for IEEE 30-bus system, IEEE 30-bus Modified (1) and IEEE 30-bus Modified (2). As seen in Figure 11, the GROM algorithm can improve the voltage profile behavior by reducing the voltage deviation. The voltage deviation was reduced by 23.9% and 12.1% for IEEE 30-bus Modified (1) and IEEE 30-bus Modified (2), respectively, compared to IEEE 30-bus system without RES.
3.2. Multi-Objective OPF Problem Test Results
3.2.1. IEEE 30-Bus System without RES
3.2.2. IEEE 30-Bus System with RES
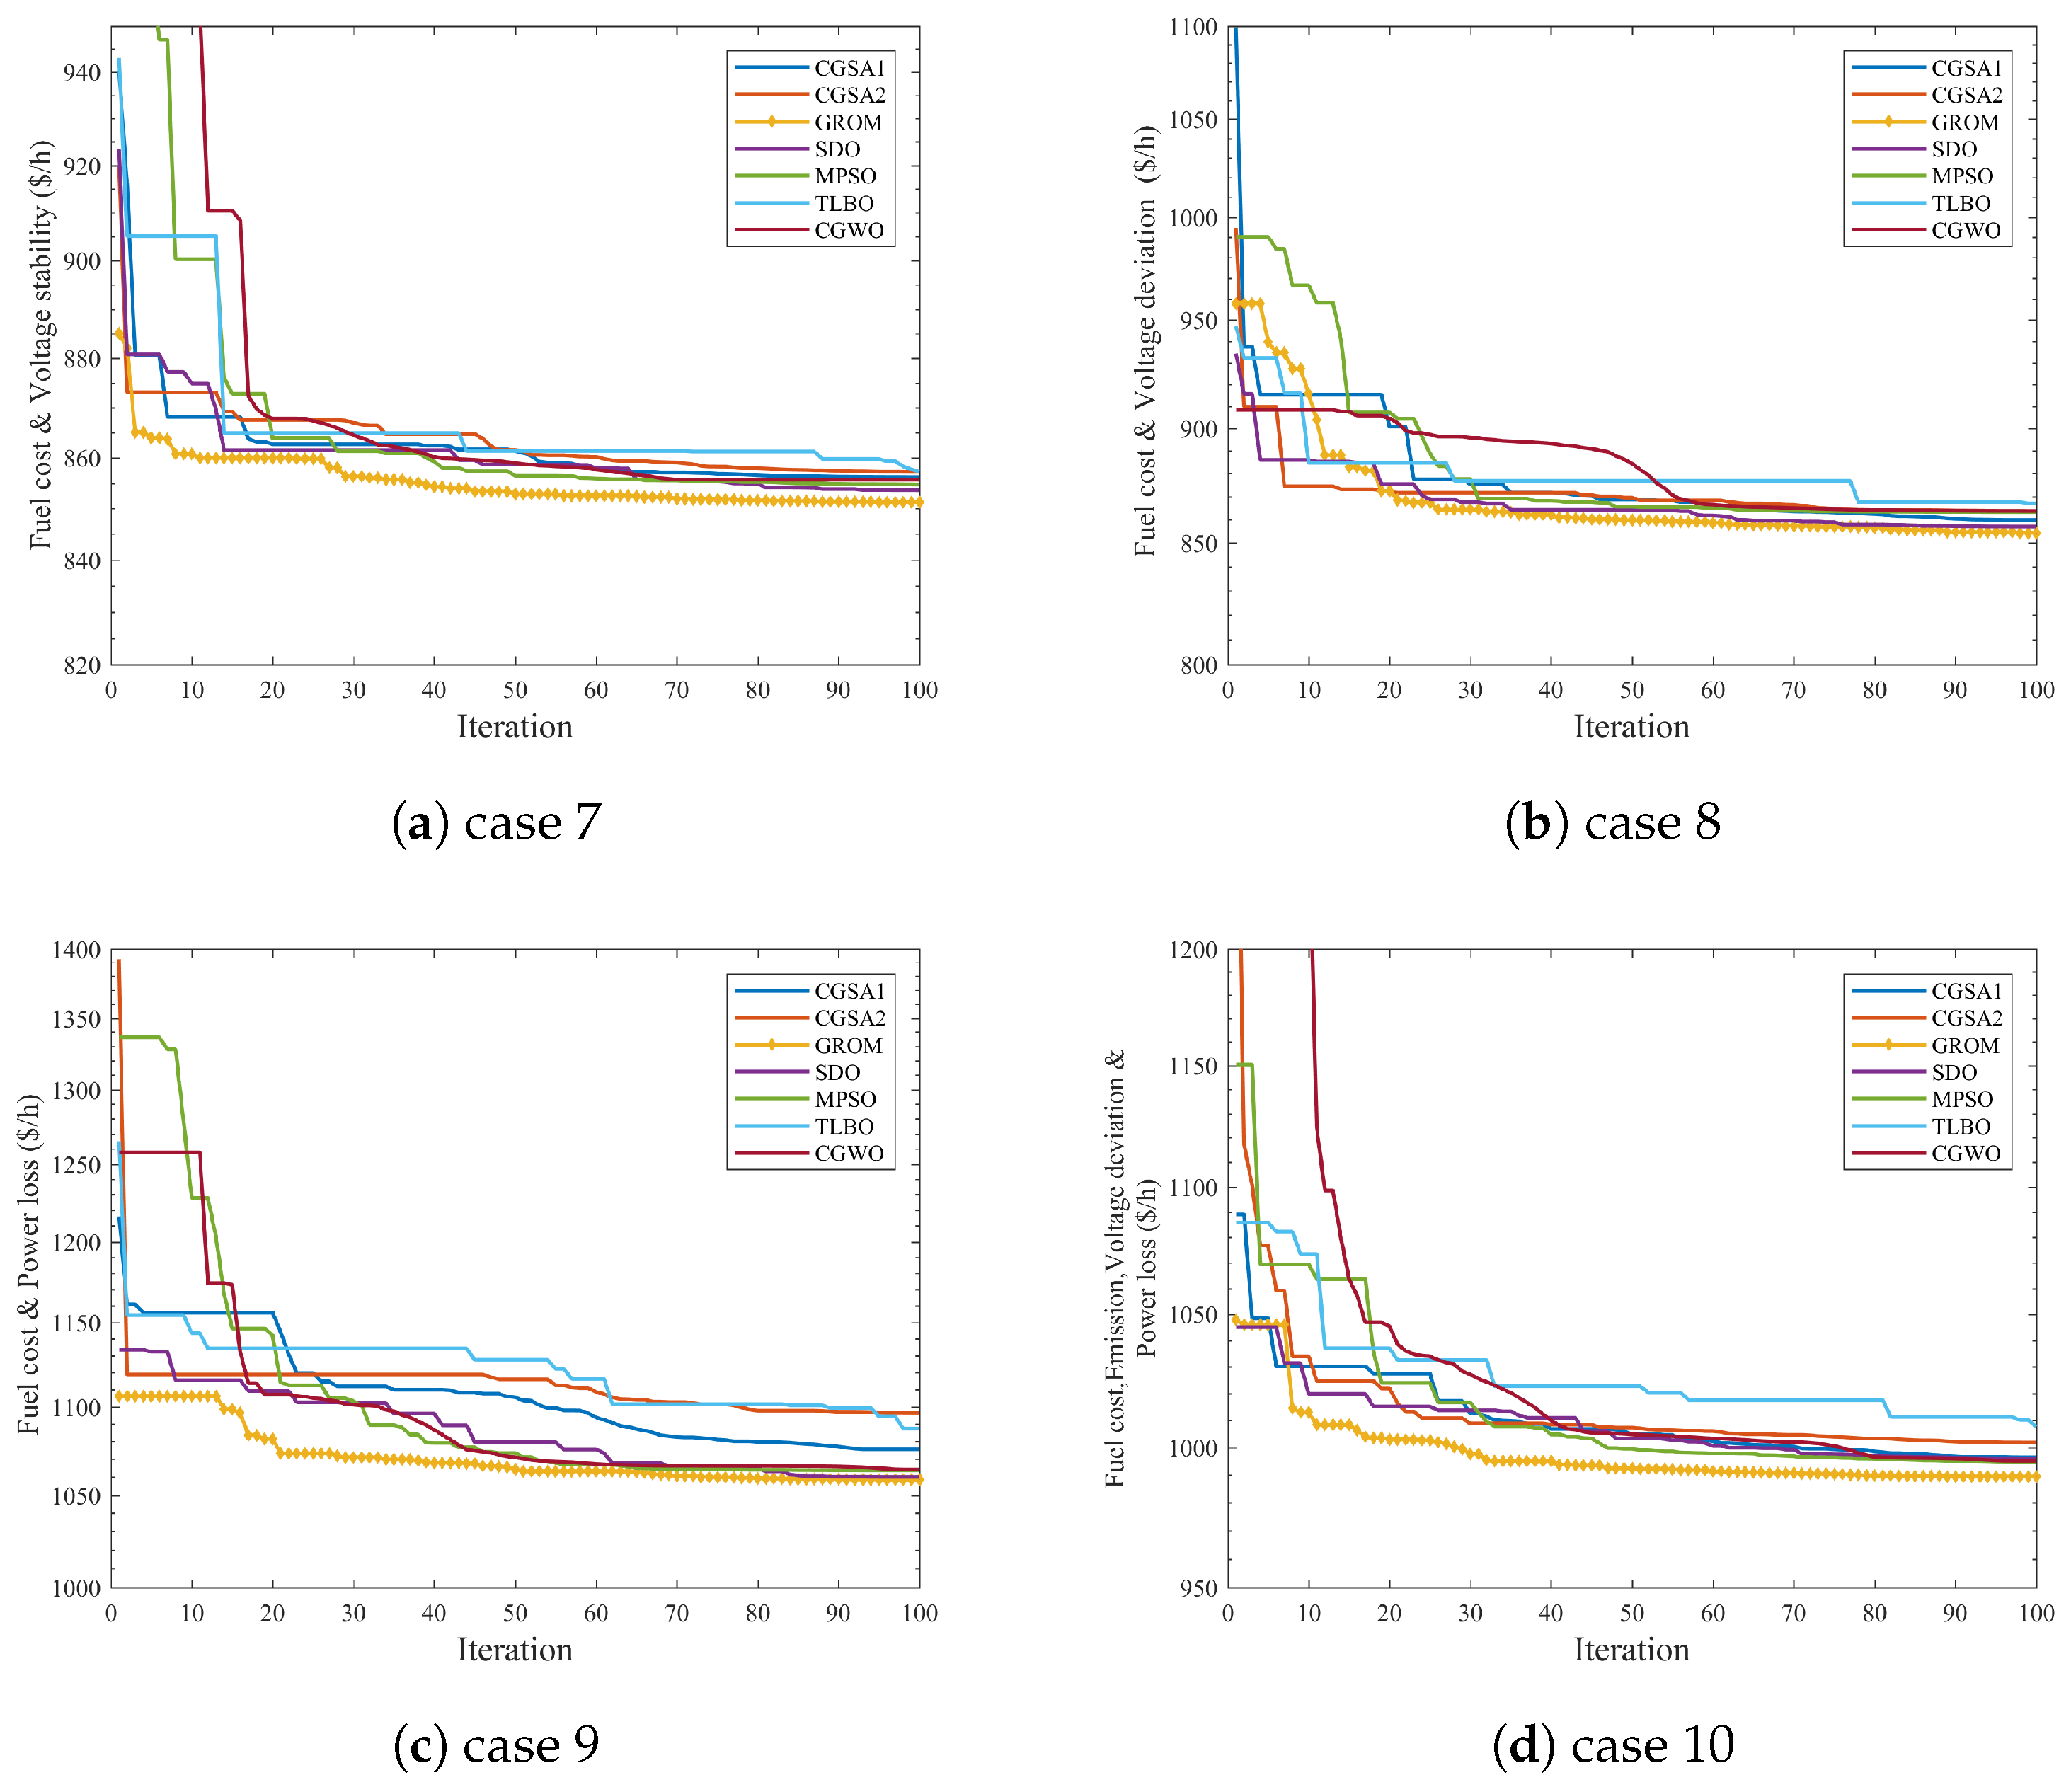
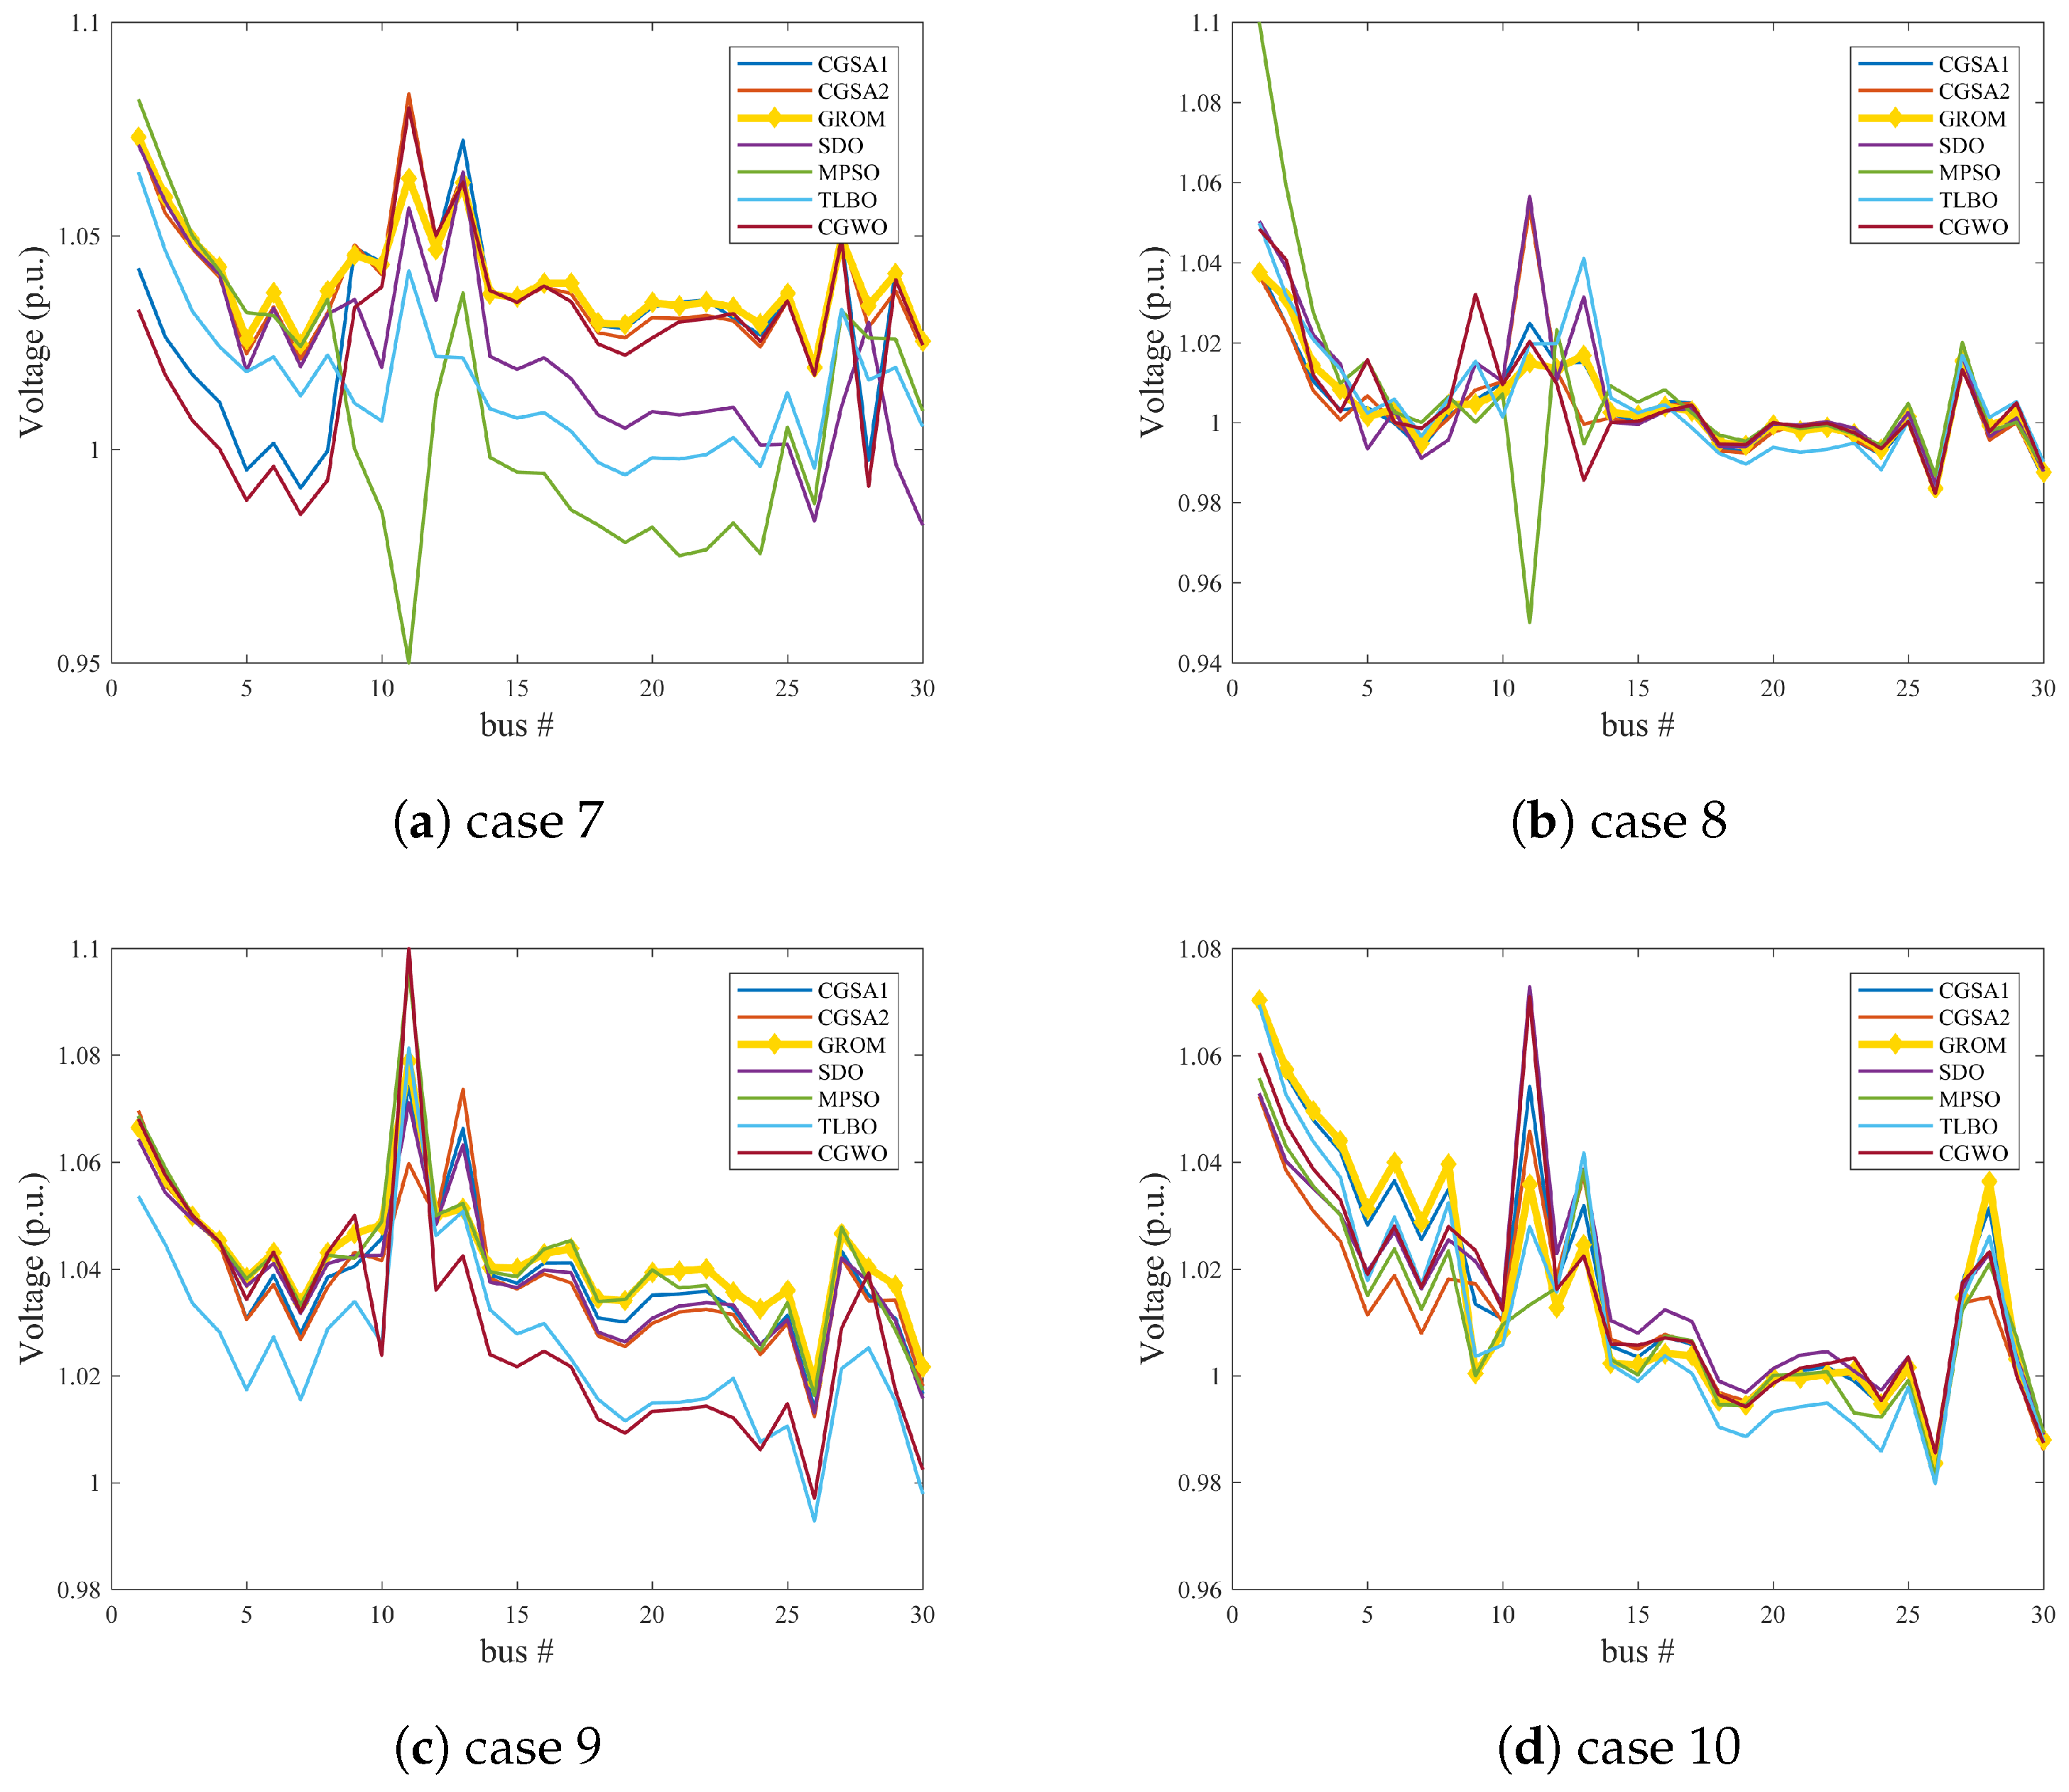
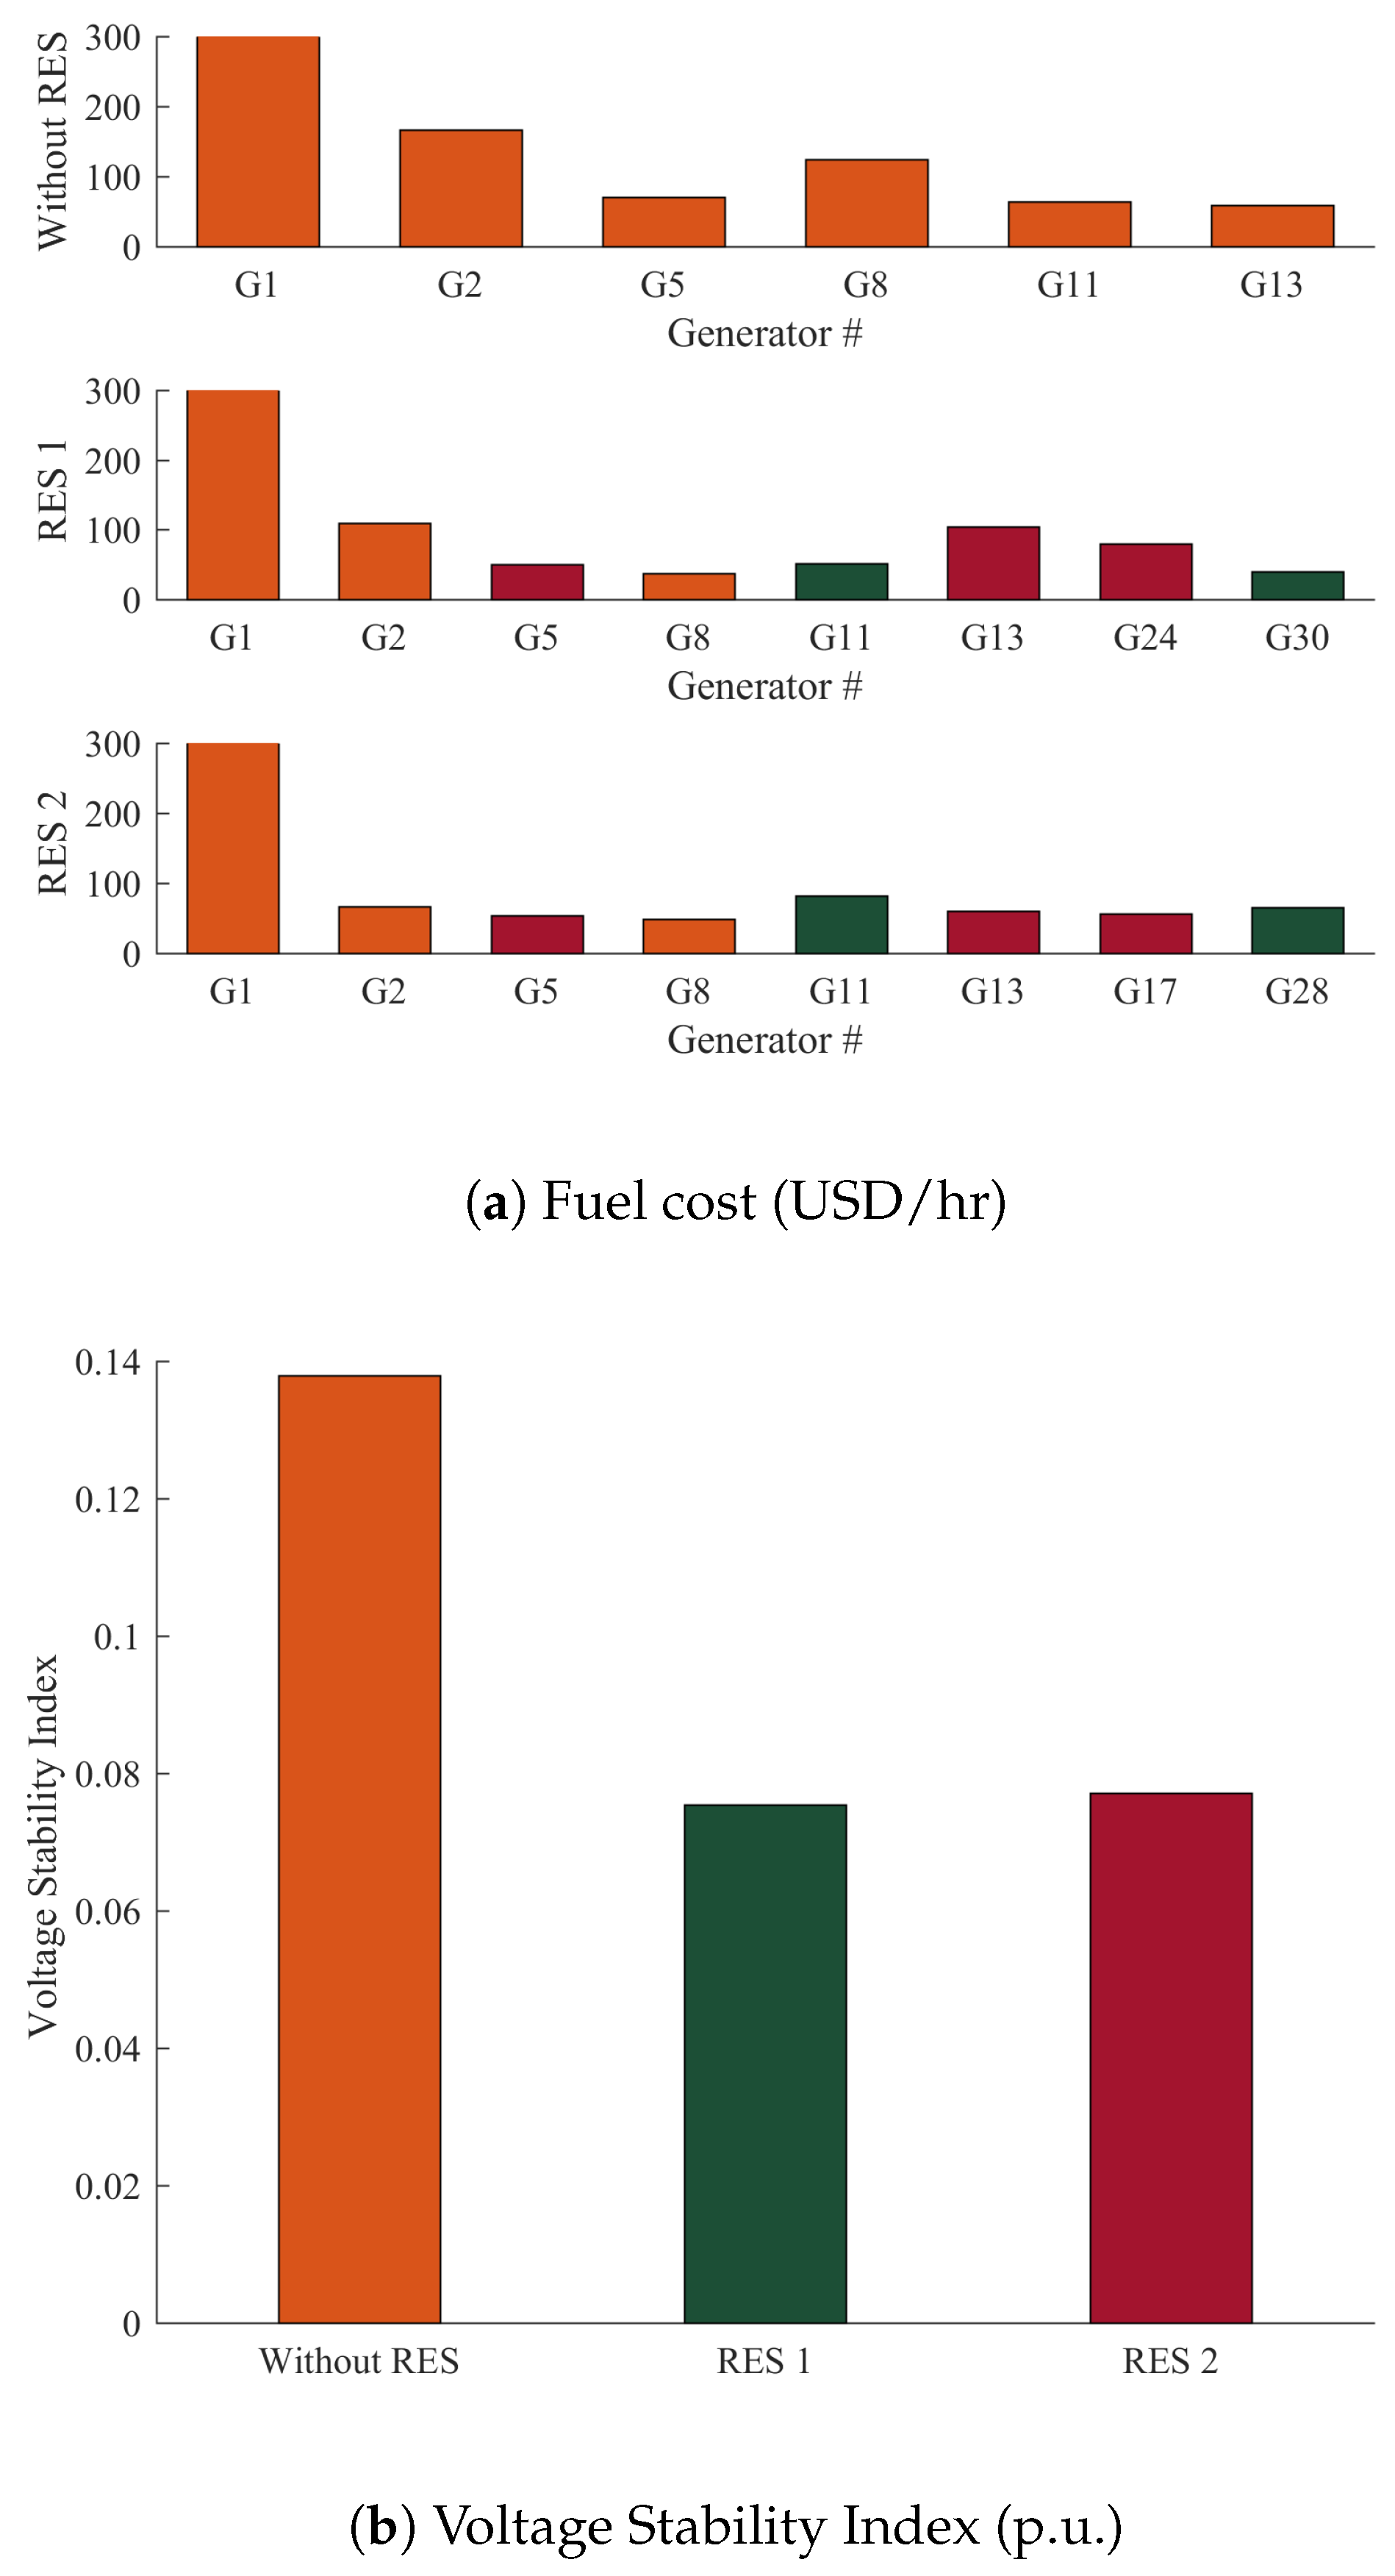
- Case 7: Minimization of the cost of fuel of thermal power, wind, and solar PV generating units and voltage stability index.In this case, energy generation cost and voltage stability index was minimized as a multi-objective function for a power network with and without RES, as presented in Figure 12. By adding the wind and PV model to the IEEE 30-bus system (Modified 1 and 2) and using the GROM to solve the multi-objective OPF problem in this section, the total power generation cost is reduced. Figure 12a shows the total generations cost for the three power system cases: IEEE 30-bus system, IEEE 30-bus Modified (1) and IEEE 30-bus Modified (2). The total generations cost in IEEE 30-bus Modified (1) and IEEE 30-bus Modified (2) was reduced by 5.16% and 8%, respectively, compared to IEEE 30-bus system without RES. The generations cost reduction is basically coming from the increase in RES contribution power network. The wind and solar power generations were increased by 36% and 39%, respectively. In addition, the voltage stability index, as shown in Figure 12b, for IEEE 30-bus Modified (1) and IEEE 30-bus Modified (2) systems were reduced by 45.3% and 44.1%, respectively, as compared to IEEE 30-bus system.
- Case 8: Minimization of the cost of Fuel of thermal power, wind, and solar PV generating units and voltage deviation.The economic power generation and voltage deviation terms are analysed in this section, as seen in Figure 13. A multi-objective cost function for voltage deviation and power generations cost has been used to show the impact of optimally power control on these terms. The GROM algorithm can reduce the total generations cost for IEEE 30-bus Modified (1) and (2) by 4.3% and 7.38%, respectively, compared to IEEE 30-bus without RES, as shown in Figure 13a. The voltage profiles, as presented in Figure 13b, for IEEE 30-bus system, IEEE 30-bus Modified (1) and IEEE 30-bus Modified (2) have been improved by reducing the voltage deviation. The voltage deviation was improved by 0.26% and 22.76% for IEEE 30-bus Modified (1) and IEEE 30-bus Modified (2), respectively, compared to IEEE 30-bus system without RES.
- Case 9: Minimization of power loss and total power generations cost.In this case the GROM is applied to solve multi-objective OPF problem for a power network with and without RES considering only the real power loss and the total power generations cost. Figure 14a shows that the total power generation cost in IEEE 30-bus Modified (1) and IEEE 30-bus Modified (2) was reduced by 10.87% and 7.56%, respectively, compared to IEEE 30-bus system without RES. In addition, the power loss in IEEE 30-bus Modified (1) and IEEE 30-bus Modified (2) was reduced by 23% and 19%, respectively, compared to IEEE 30-bus system without RES, as shown in Figure 14b.
- Case 10: Minimization of the total power generations cost, voltage deviation, real power loss, and emission index.In order to evaluate the GROM algorithm performance with highly complex multi-objective function, case 10 is presented in this section. Here, the multi-objective function describes four terms: the total power generations cost, voltage deviation, real power loss, and gas emission index. In this section, the GROM is applied to solve the multi-objective OPF problem for power network incorporating RES (IEEE 30-bus Modified (1) and IEEE 30-bus Modified (2)), as shown in Figure 15. Firstly, the total generation cost was reduced by 6% and 6.9% for RES networks (IEEE 30-bus Modified (1) and IEEE 30-bus Modified (2)), respectively, compared to IEEE 30-bus without RES, as shown in Figure 15a. Similarly, the power loss reduction and voltage deviation was also improved by 23.6% and 40.8% for IEEE 30-bus Modified (1), respectively, as presented in Figure 15b,c. Finally, the gas emission index was reduced by 56% and 57% for RES networks (IEEE 30-bus Modified (1) and IEEE 30-bus Modified (2)), respectively, compared to IEEE 30-bus without RES, as shown in Figure 15d.
3.3. Discussion and Comparison
3.3.1. Analysis of GROM and Other Meta-Heuristics Optimization Strategies
3.3.2. OPF for Largescale System
4. Conclusions
Author Contributions
Funding
Conflicts of Interest
Abbreviations
| OPF | Optimal Power Flow |
| RES | Renewable Energy Sources |
| PSO | Particle Swarm Optimization |
| GROM | Golden Ratio Optimization Method |
| GSA | Gravitational Search Algorithm |
| TLBO | Teaching–Learning-Based Optimization |
| SDO | Supply Demand-based Optimization |
| MPSO | Modified Particle Swarm Optimization |
| CGSA | Chaotic Gravitational Search Algorithm |
Nomenclature
| αi, βi, γi, ωi, µi | The emission coefficients for thermal generation units |
| θik | angle difference between bus i and k |
| ai, bi, ci | Fuel cost coefficients for the basic formula |
| Bik | transfer susceptance between bus i and k |
| CPs,k | penalty cost for jth solar PV plant |
| CPw,j | penalty cost for jth wind plant |
| CRs,k | reserve cost for jth solar PV plant |
| CRw,j | reserve cost for jth wind plant |
| total cost of solar power generations | |
| total cost of wind power generations | |
| di, ei | Fuel cost coefficients associated with the valve point loading effect |
| E | Total gas emission |
| E(Psav,k < Pss,k) | expectation of solar PV power below the scheduled power |
| E(Psav,k > Pss,k) | expectation of solar PV power above the scheduled power |
| f | The objective function to be minimized or maximized |
| fs(Psav,k < Pss,k) | probability of solar power shortage occurrence than the scheduled power |
| fs(Psav,k > Pss,k) | probability of solar power surplus than the scheduled power |
| fw(Pw,j) | probability density function for jth wind plant |
| FC | the fuel cost of the thermal power generator |
| FC_vtv | Fuel cost associated only with valve point loading effect |
| Gik | conductance between bus i and k |
| gi | direct cost coefficient for jth wind plant |
| Gq(ij) | conductance of qth branch |
| Gstd | solar irradiance in standard environment |
| hk | direct cost coefficient for kth solar PV plant |
| KPs,k | penalty cost coefficient for jth solar PV plant |
| KPw,j | penalty cost coefficient for jth wind plant |
| KRs,k | reserve cost coefficient for jth solar PV plant |
| KRw,j | reserve cost coefficient for jth wind plant |
| Lmax | voltage stability indicator |
| NC, NT | Number of shunt capacitors and branch transformer taps, respectively |
| NW | number of wind plants |
| NG | number of power generation units |
| NL | number of load buses |
| nl | number of branches |
| PD, QD | Active and reactive power of load buses, respectively |
| PG1, QG1 | Active and reactive power of slack bus generator |
| Ploss | active power loss in the power system network |
| Psr | rated output power of the solar PV plant |
| Pss,k | scheduled power from kth solar PV plant |
| Pwav,j | actual available power from jth wind plant |
| Pwr,j | rated output power from jth wind plant |
| Pws,j | scheduled power from jth wind plant |
| QC, TS | Shunt capacitor and branch transformer tap, respectively |
| Rc | certain irradiance point for the solar PV plant |
| Sl | loading of transmission lines |
| TFC_vlv | Fuel cost involving valve point loading effect |
| u | The controllable system variables |
| VG, VL | voltage magnitude at the generators and load buses, respectively |
| Vi, Vj | voltage magnitude of terminal buses of branch |
| VD | voltage deviation |
| x | state variables of the system |
| YLL, YLG | sub-matrices of the system YBUS |
| δij | the difference angle between the terminal buses of branch |
Appendix A
| Characteristics | Values | Details |
|---|---|---|
| Buses | 30 | |
| Branches | 41 | |
| Generators | 8 | Buses: 1, 2, 5, 8, 11, 13, 24 and 30 |
| Load voltage limits | 22 | [0.95–1.05] |
| Generator voltage limits | 8 | [0.9–1.1] |
| Shunt VAR compensation | 9 | Buses: 10, 12, 15, 17, 20, 21, 23, 24 and 29 |
| Transformer with tap ratio | 4 | Buses: 11, 12, 15 and 36 |
| Control variables | 28 |
| Unit | Bus | No. of Turbines | Pwr [MW] | c | k | gi [USD/MWh] | KRw,j [USD/MWh] | KPw,j [USD/MWh] | vin [m/s] | vout [m/s] | vr [m/s] |
|---|---|---|---|---|---|---|---|---|---|---|---|
| 1 | 11 | 10 | 2 | 9 | 2 | 1.65 | 2.8 | 1.7 | 4 | 25 | 13 |
| 2 | 30 | 12 | 2 | 10 | 2 | 1.7 | 2.8 | 1.7 | 4 | 25 | 13 |
| Unit | Bus | Psr [MW] | Gstd [W/m2] | Rc [W/m2] | µ | σ | hk [USD/MWh] | KPs,k [USD/MWh] | KRs,k [USD/MWh] |
|---|---|---|---|---|---|---|---|---|---|
| 1 | 5 | 25 | 800 | 120 | 6 | 0.6 | 1.55 | 1.3 | 3.2 |
| 2 | 13 | 30 | 800 | 200 | 6 | 0.6 | 1.45 | 1.3 | 2.8 |
| 3 | 24 | 30 | 800 | 170 | 6 | 0.6 | 1.6 | 1.45 | 3.1 |
| Unit | Bus | No.of Turbines | Pwr [MW] | c | k | gi [USD/MWh] | KRw,j [USD/MWh] | KPw,j [USD/MWh] | vin [m/s] | vout [m/s] | vr [m/s] |
|---|---|---|---|---|---|---|---|---|---|---|---|
| 1 | 11 | 10 | 2 | 9 | 2 | 1.65 | 2.8 | 1.7 | 4 | 25 | 13 |
| 2 | 28 | 12 | 2 | 10 | 2 | 1.7 | 2.8 | 1.7 | 4 | 25 | 13 |
| Unit | Bus | Psr [MW] | Gstd [W/m2] | Rc [W/m2] | µ | σ | hk [USD/MWh] | KPs,k [USD/MWh] | KRs,k [USD/MWh] |
|---|---|---|---|---|---|---|---|---|---|
| 1 | 5 | 25 | 800 | 120 | 6 | 0.6 | 1.55 | 1.3 | 3.2 |
| 2 | 13 | 30 | 800 | 200 | 6 | 0.6 | 1.45 | 1.3 | 2.8 |
| 3 | 17 | 30 | 800 | 170 | 6 | 0.6 | 1.6 | 1.45 | 3.1 |
| Characteristics | Values | Details |
|---|---|---|
| Buses | 30 | |
| Branches | 41 | |
| Generators | 8 | Buses: 1, 2, 5, 8, 11, 13, 17 and 28 |
| Load voltage limits | 22 | [0.95–1.05] |
| Generator voltage limits | 8 | [0.9–1.1] |
| Shunt VAR compensation | 9 | Buses: 10, 12, 15, 17, 20, 21, 23, 24 and 29 |
| Transformer with tap ratio | 4 | Buses: 11, 12, 15 and 36 |
| Control variables | 28 |
| Parameters | Min | Max | Case 1 | Case 2 | Case 3 | Case 4 | Case 5 | Case 6 |
|---|---|---|---|---|---|---|---|---|
| PG2 (MW) | 20 | 80 | 79.98599 | 67.52771 | 73.36567 | 48.56394 | 58.82989 | 79.35321 |
| PG5 (MW) | 15 | 50 | 49.99816 | 50.00000 | 16.62166 | 35.94720 | 21.12946 | 47.11245 |
| PG8 (MW) | 10 | 35 | 34.98890 | 34.99924 | 34.91363 | 23.16947 | 34.97487 | 22.40758 |
| PG11 (MW) | 10 | 30 | 29.97975 | 29.99914 | 13.36913 | 25.63985 | 18.02521 | 30.00000 |
| PG13 (MW) | 10 | 40 | 39.99990 | 39.99954 | 12.72009 | 31.21624 | 17.45023 | 14.06619 |
| VG1 (p.u.) | 0.95 | 1.1 | 1.06154 | 1.06134 | 1.07456 | 1.05941 | 1.07655 | 1.02726 |
| VG2 (p.u.) | 0.95 | 1.1 | 1.05770 | 1.05503 | 1.06094 | 1.04713 | 1.06225 | 1.02809 |
| VG5 (p.u.) | 0.95 | 1.1 | 1.03685 | 1.03494 | 1.03002 | 1.01737 | 1.02905 | 1.01312 |
| VG8 (p.u.) | 0.95 | 1.1 | 1.04303 | 1.04158 | 1.03676 | 1.04399 | 1.03757 | 1.00378 |
| VG11 (p.u.) | 0.95 | 1.1 | 1.08539 | 1.05931 | 1.09111 | 1.10000 | 1.04058 | 1.05579 |
| VG13 (p.u.) | 0.95 | 1.1 | 1.05042 | 1.06207 | 1.05568 | 1.07187 | 1.05141 | 0.984368989 |
| QC10 (MVAr) | 0 | 5 | 5.00000 | 1.01900 | 3.09998 | 2.06687 | 4.98100 | 4.59259 |
| QC12 (MVAr) | 0 | 5 | 4.94610 | 4.48520 | 2.12732 | 2.86169 | 1.76287 | 0.92649 |
| QC15 (MVAr) | 0 | 5 | 0.01188 | 0.09006 | 3.11593 | 1.24673 | 3.15533 | 4.36873 |
| QC17 (MVAr) | 0 | 5 | 0.00000 | 5.00000 | 2.07694 | 2.47628 | 4.33776 | 1.04128 |
| QC20 (MVAr) | 0 | 5 | 4.43235 | 4.54208 | 3.67991 | 4.80224 | 3.57435 | 4.87576 |
| QC21 (MVAr) | 0 | 5 | 5.00000 | 4.63226 | 0.18913 | 4.19956 | 0.84754 | 3.53346 |
| QC23 (MVAr) | 0 | 5 | 4.99730 | 0.17769 | 3.20377 | 2.88401 | 2.49263 | 4.99553 |
| QC24 (MVAr) | 0 | 5 | 5.00000 | 4.99130 | 3.45134 | 2.78014 | 5.00000 | 4.77105 |
| QC29 (MVAr) | 0 | 5 | 3.93393 | 3.75936 | 0.61614 | 2.67129 | 3.28759 | 2.03583 |
| TS11 (p.u.) | 0.9 | 1.1 | 0.99135 | 0.97702 | 0.98170 | 1.01534 | 1.05797 | 1.07354 |
| TS12 (p.u.) | 0.9 | 1.1 | 1.07299 | 1.00742 | 1.06962 | 1.06466 | 0.92993 | 0.905278904 |
| TS15 (p.u.) | 0.9 | 1.1 | 0.98900 | 1.00781 | 1.00829 | 1.00286 | 0.98073 | 0.93138 |
| TS36 (p.u.) | 0.9 | 1.1 | 0.99266 | 0.99163 | 0.98231 | 0.96275 | 0.99521 | 0.96196 |
| PG1 (MW) | 50 | 200 | 51.59125 | 64.15002 | 140.00119 | 124.69361 | 139.99680 | 95.68215 |
| QG1 (MVAr) | −20 | 150 | −5.56971 | −4.52100 | −3.32968 | −10.52310 | −0.41515 | −19.98950 |
| QG2 (MVAr) | −20 | 60 | 9.24622 | 8.12240 | 16.35530 | 3.33205 | 22.42903 | 34.50154 |
| QG5 (MVAr) | −15 | 62.5 | 20.19898 | 21.72073 | 26.66210 | 11.92303 | 23.45494 | 33.45856 |
| QG8 (MVAr) | −15 | 48 | 23.44640 | 30.44406 | 24.76445 | 37.37035 | 26.89262 | 32.51009 |
| QG11 (MVAr) | −10 | 40 | 19.32106 | 6.35770 | 22.03234 | 29.15432 | 11.32480 | 28.67011 |
| QG13 (MVAr) | −15 | 44 | 5.05864 | 13.93794 | 14.43758 | 18.22961 | 6.38072 | −17.23053 |
| Parameters | Min | Max | Case 7 | Case 8 | Case 9 | Case 10 |
|---|---|---|---|---|---|---|
| PG2 (MW) | 20 | 80 | 59.51533 | 55.72177 | 51.44303 | 51.33747 |
| PG5 (MW) | 15 | 50 | 20.14512 | 18.94197 | 49.76511 | 36.79839 |
| PG8 (MW) | 10 | 35 | 35.00000 | 35.00000 | 34.62251 | 34.99904 |
| PG11 (MW) | 10 | 30 | 18.45636 | 22.78070 | 29.93412 | 25.64743 |
| PG13 (MW) | 10 | 40 | 17.28464 | 18.34519 | 25.44889 | 20.02937 |
| VG1 (p.u.) | 0.95 | 1.1 | 1.07304 | 1.03755 | 1.06642 | 1.07029 |
| VG2 (p.u.) | 0.95 | 1.1 | 1.05901 | 1.03104 | 1.05690 | 1.05732 |
| VG5 (p.u.) | 0.95 | 1.1 | 1.02571 | 1.00149 | 1.03832 | 1.03116 |
| VG8 (p.u.) | 0.95 | 1.1 | 1.03700 | 1.00442 | 1.04302 | 1.03957 |
| VG11 (p.u.) | 0.95 | 1.1 | 1.06336 | 1.01488 | 1.07891 | 1.03580 |
| VG13 (p.u.) | 0.95 | 1.1 | 1.06234 | 1.01677 | 1.05127 | 1.02448 |
| QC10 (MVAr) | 0 | 5 | 3.91072 | 3.44810 | 3.70057 | 2.29771 |
| QC12 (MVAr) | 0 | 5 | 1.11532 | 5.00000 | 2.69825 | 0.54018 |
| QC15 (MVAr) | 0 | 5 | 2.43469 | 3.97511 | 4.57715 | 3.06608 |
| QC17 (MVAr) | 0 | 5 | 3.24257 | 2.51465 | 3.58127 | 3.49795 |
| QC20 (MVAr) | 0 | 5 | 4.53190 | 5.00000 | 4.58329 | 5.00000 |
| QC21 (MVAr) | 0 | 5 | 1.97091 | 2.69323 | 4.79084 | 4.93845 |
| QC23 (MVAr) | 0 | 5 | 3.28071 | 2.42094 | 2.03025 | 5.00000 |
| QC24 (MVAr) | 0 | 5 | 5.00000 | 5.00000 | 5.00000 | 4.63419 |
| QC29 (MVAr) | 0 | 5 | 3.54249 | 2.11182 | 3.08244 | 2.82682 |
| TS11 (p.u.) | 0.9 | 1.1 | 1.00279 | 1.01257 | 1.02834 | 1.09106 |
| TS12 (p.u.) | 0.9 | 1.1 | 0.95114 | 0.92504 | 0.94541 | 0.94823 |
| TS15 (p.u.) | 0.9 | 1.1 | 1.00166 | 0.98607 | 0.98590 | 1.02863 |
| TS36 (p.u.) | 0.9 | 1.1 | 0.97113 | 0.96135 | 0.97959 | 1.00178 |
| PG1 (MW) | 50 | 200 | 140.01610 | 140.09127 | 96.10856 | 119.90616 |
| QG1 (MVAr) | −20 | 150 | −3.43646 | −18.08737 | −4.98986 | −2.39023 |
| QG2 (MVAr) | −20 | 60 | 19.01079 | 39.43867 | 8.58822 | 11.82537 |
| QG5 (MVAr) | −15 | 62.5 | 22.67690 | 30.79428 | 22.80944 | 21.32114 |
| QG8 (MVAr) | −15 | 48 | 28.38891 | 31.16879 | 27.14174 | 26.40463 |
| QG11 (MVAr) | −10 | 40 | 9.47676 | 5.55952 | 17.57496 | 18.31573 |
| QG13 (MVAr) | −15 | 44 | 11.99685 | 2.67655 | 1.41552 | 8.89555 |
| Parameters | Min | Max | Case 1 | Case 2 | Case 3 | Case 4 | Case 5 | Case 6 |
|---|---|---|---|---|---|---|---|---|
| PG2 (MW) | 20 | 80 | 43.13525 | 47.15150 | 37.13751 | 34.95263 | 36.54377 | 50.89199 |
| PG5 (MW) | 15 | 50 | 49.89199 | 49.97734 | 15.00000 | 21.69741 | 24.06116 | 44.45154 |
| PG8 (MW) | 10 | 35 | 34.99745 | 35.00000 | 12.34600 | 16.54988 | 11.57425 | 23.04400 |
| PG11 (MW) | 10 | 30 | 29.96896 | 20.80660 | 14.67360 | 29.00113 | 19.42242 | 24.18801 |
| PG13 (MW) | 10 | 40 | 39.18625 | 38.01477 | 28.03444 | 35.17677 | 27.72137 | 29.19834 |
| PG24 (MW) | 10 | 30 | 23.52888 | 25.20854 | 23.13073 | 27.57714 | 23.25212 | 19.10671 |
| PG30 (MW) | 10 | 40 | 14.37509 | 19.93864 | 19.93997 | 23.39755 | 20.23461 | 21.76116 |
| VG1 (p.u.) | 0.95 | 1.1 | 1.05503 | 1.04276 | 1.05410 | 1.06312 | 1.05719 | 1.02042 |
| VG2 (p.u.) | 0.95 | 1.1 | 1.04995 | 1.04202 | 1.02926 | 1.05364 | 1.03102 | 1.01937 |
| VG5 (p.u.) | 0.95 | 1.1 | 1.03354 | 1.02969 | 0.96805 | 1.03241 | 0.98236 | 0.99929 |
| VG8 (p.u.) | 0.95 | 1.1 | 1.04420 | 1.01634 | 1.00354 | 1.03773 | 0.99934 | 1.00067 |
| VG11 (p.u.) | 0.95 | 1.1 | 1.07844 | 0.98464 | 1.02130 | 1.09694 | 1.04740 | 1.02388 |
| VG13 (p.u.) | 0.95 | 1.1 | 1.04005 | 1.01688 | 1.06955 | 1.05304 | 1.04340 | 0.99631 |
| VG24 (p.u.) | 0.95 | 1.1 | 1.03984 | 1.02997 | 1.02467 | 1.05915 | 1.02495 | 1.01329 |
| VG30 (p.u.) | 0.95 | 1.1 | 1.04042 | 1.00036 | 1.01257 | 1.02095 | 0.95000 | 1.00196 |
| QC10 (MVAr) | 0 | 5 | 3.98830 | 5.00000 | 1.42789 | 0.88011 | 3.66518 | 0.80069 |
| QC12 (MVAr) | 0 | 5 | 4.62703 | 1.00121 | 2.40694 | 0.88867 | 2.73493 | 0.41243 |
| QC15 (MVAr) | 0 | 5 | 4.67521 | 3.44207 | 0.51865 | 2.25796 | 3.02740 | 3.45568 |
| QC17 (MVAr) | 0 | 5 | 1.26130 | 2.00945 | 5.00000 | 4.82743 | 2.03045 | 0.80280 |
| QC20 (MVAr) | 0 | 5 | 2.11016 | 2.79317 | 2.71481 | 3.92633 | 3.13323 | 5.00000 |
| QC21 (MVAr) | 0 | 5 | 2.07685 | 4.95328 | 2.78348 | 3.71878 | 2.60418 | 4.37667 |
| QC23 (MVAr) | 0 | 5 | 0.90183 | 3.44746 | 1.83766 | 2.08102 | 2.90087 | 4.04854 |
| QC24 (MVAr) | 0 | 5 | 0.36086 | 1.37893 | 1.07033 | 3.55393 | 2.61399 | 4.17696 |
| QC29 (MVAr) | 0 | 5 | 3.13390 | 0.95174 | 4.26509 | 3.99085 | 2.56338 | 1.87705 |
| TS11 (p.u.) | 0.9 | 1.1 | 1.01312 | 1.02126 | 0.99711 | 1.05836 | 0.98741 | 1.02980 |
| TS12 (p.u.) | 0.9 | 1.1 | 0.98656 | 1.03553 | 0.96063 | 0.91363 | 0.97243 | 0.90643 |
| TS15 (p.u.) | 0.9 | 1.1 | 0.98511 | 1.00662 | 0.99487 | 0.98428 | 0.96346 | 0.95156 |
| TS36 (p.u.) | 0.9 | 1.1 | 1.01323 | 1.00223 | 1.00305 | 0.99109 | 1.00134 | 0.99393 |
| PG1 (MW) | 50 | 200 | 50.26989 | 50.03565 | 140.29710 | 99.73815 | 127.04859 | 74.11395 |
| QG1 (MVAr) | −20 | 150 | −5.82201 | −11.14378 | 18.73841 | −8.35131 | 28.37103 | −14.84702 |
| QG2 (MVAr) | −20 | 60 | 7.38541 | 25.40604 | 18.50536 | 13.56704 | 13.57301 | 31.99030 |
| QG5 (MVAr) | −15 | 62.5 | 21.54340 | 32.91351 | −0.81530 | 29.28370 | 9.46702 | 27.11298 |
| QG8 (MVAr) | −15 | 48 | 25.30716 | 7.58767 | 23.06266 | 17.18928 | 18.35214 | 30.55604 |
| QG11 (MVAr) | −10 | 40 | 18.54940 | −4.04267 | 3.46166 | 28.31998 | 11.41241 | 11.75221 |
| QG13 (MVAr) | −15 | 44 | −0.26764 | 5.83708 | 24.87585 | 3.11857 | 6.68733 | −8.08719 |
| QG24 (MVAr) | −15 | 44 | 8.74228 | 24.92909 | 10.90524 | 10.19412 | 12.42334 | 8.84980 |
| QG30 (MVAr) | −15 | 44 | 0.98839 | −4.31718 | −2.82756 | −8.94194 | −10.91402 | −3.06429 |
| VD (p.u.) | 0.73683 | 0.24004 | 0.32624 | 0.90306 | 0.38668 | 0.07566 | ||
| FC (USD/h) | 342.02105 | 354.84841 | 484.92875 | 375.39821 | 440.68270 | 382.53384 | ||
| Lmax (p.u.) | 0.06749 | 0.07218 | 0.06957 | 0.06578 | 0.06934 | 0.07170 | ||
| Ploss (MW) | 1.95376 | 2.73305 | 7.15936 | 4.69066 | 6.45829 | 3.35570 | ||
| E (ton/h) | 0.09118 | 0.09107 | 0.16617 | 0.11741 | 0.14732 | 0.09909 | ||
| FC_vlv (USD/h) | 365.35046 | 379.43060 | 499.45729 | 404.84421 | 456.10196 | 417.94861 | ||
| TC (USD/h) | 873.13697 | 849.86387 | 770.00163 | 807.36821 | 771.70583 | 826.51612 | ||
| (USD/h) | 150.20594 | 128.40715 | 105.88842 | 174.63419 | 123.98839 | 148.33950 | ||
| (USD/h) | 380.90998 | 366.60831 | 179.18445 | 257.33581 | 207.03473 | 295.64279 | ||
| f | 1.95376 | 0.09107 | 784.86028 | 0.06578 | 771.70583 | 0.07566 |
| Parameters | Min | Max | Case 7 | Case 8 | Case 9 | Case 10 |
|---|---|---|---|---|---|---|
| PG2 (MW) | 20 | 80 | 43.48255 | 31.10949 | 47.81723 | 47.52719 |
| PG5 (MW) | 15 | 50 | 18.07909 | 27.85351 | 43.27052 | 32.64769 |
| PG8 (MW) | 10 | 35 | 11.01280 | 25.15322 | 25.83359 | 23.99984 |
| PG11 (MW) | 10 | 30 | 16.60391 | 19.38779 | 25.36505 | 20.45355 |
| PG13 (MW) | 10 | 40 | 34.30468 | 24.94996 | 30.99488 | 27.07411 |
| PG24 (MW) | 10 | 30 | 23.98038 | 23.75004 | 25.34203 | 24.23129 |
| PG30 (MW) | 10 | 40 | 12.60912 | 17.98695 | 17.04502 | 19.29317 |
| VG1 (p.u.) | 0.95 | 1.1 | 1.04297 | 1.03001 | 1.02098 | 1.03035 |
| VG2 (p.u.) | 0.95 | 1.1 | 1.01595 | 1.01814 | 1.02001 | 1.02152 |
| VG5 (p.u.) | 0.95 | 1.1 | 0.97547 | 0.99225 | 1.00158 | 0.99121 |
| VG8 (p.u.) | 0.95 | 1.1 | 0.98837 | 1.00693 | 1.00143 | 1.00683 |
| VG11 (p.u.) | 0.95 | 1.1 | 1.02858 | 1.02217 | 1.01964 | 1.01557 |
| VG13 (p.u.) | 0.95 | 1.1 | 0.99770 | 1.02086 | 1.02643 | 1.03844 |
| VG24 (p.u.) | 0.95 | 1.1 | 0.99104 | 1.02143 | 1.01339 | 1.00948 |
| VG30 (p.u.) | 0.95 | 1.1 | 1.01962 | 0.99264 | 1.00050 | 1.02813 |
| QC10 (MVAr) | 0 | 5 | 0.96676 | 2.17636 | 2.61269 | 2.33000 |
| QC12 (MVAr) | 0 | 5 | 0.77808 | 3.51517 | 2.84748 | 2.17567 |
| QC15 (MVAr) | 0 | 5 | 2.15283 | 1.91562 | 3.00985 | 2.25397 |
| QC17 (MVAr) | 0 | 5 | 3.96092 | 1.65477 | 1.53303 | 3.05796 |
| QC20 (MVAr) | 0 | 5 | 0.83974 | 1.92032 | 3.99936 | 1.16709 |
| QC21 (MVAr) | 0 | 5 | 1.33926 | 1.80397 | 4.16411 | 3.56310 |
| QC23 (MVAr) | 0 | 5 | 1.57724 | 1.62124 | 2.81175 | 2.93532 |
| QC24 (MVAr) | 0 | 5 | 3.19293 | 2.51226 | 2.81287 | 1.89780 |
| QC29 (MVAr) | 0 | 5 | 2.88430 | 1.05923 | 2.72110 | 2.18069 |
| TS11 (p.u.) | 0.9 | 1.1 | 0.95509 | 1.02706 | 0.98166 | 0.96797 |
| TS12 (p.u.) | 0.9 | 1.1 | 0.98122 | 0.97278 | 0.99390 | 0.98277 |
| TS15 (p.u.) | 0.9 | 1.1 | 1.08571 | 0.97345 | 0.99255 | 1.00981 |
| TS36 (p.u.) | 0.9 | 1.1 | 1.02335 | 0.99712 | 0.98156 | 1.00805 |
| PG1 (MW) | 50 | 200 | 130.03797 | 118.36233 | 70.74683 | 92.23304 |
| QG1 (MVAr) | −20 | 150 | 24.08363 | −6.93601 | −17.57292 | −7.16579 |
| QG2 (MVAr) | −20 | 60 | −0.41638 | 16.09883 | 26.56623 | 18.35842 |
| QG5 (MVAr) | −15 | 62.5 | 18.42255 | 23.64670 | 27.92047 | 19.27716 |
| QG8 (MVAr) | −15 | 48 | 17.63806 | 30.54050 | 23.39430 | 30.57876 |
| QG11 (MVAr) | −10 | 40 | 8.82689 | 11.25143 | 4.59263 | 0.19001 |
| QG13 (MVAr) | −15 | 44 | 19.61288 | 4.38147 | 10.22400 | 18.19184 |
| QG24 (MVAr) | −15 | 44 | 7.09696 | 18.31047 | 7.07572 | 4.53542 |
| QG30 (MVAr) | −15 | 44 | 7.64489 | −3.55269 | −3.49674 | 3.02463 |
| VD (p.u.) | 0.45975 | 0.14084 | 0.12765 | 0.17566 | ||
| FC (USD/h) | 469.47332 | 447.66348 | 373.48160 | 421.87253 | ||
| Lmax (p.u.) | 0.07546 | 0.07182 | 0.07173 | 0.07162 | ||
| Ploss (MW) | 6.71050 | 5.15328 | 3.01515 | 4.05988 | ||
| E (ton/h) | 0.15082 | 0.13524 | 0.09717 | 0.10946 | ||
| FC_vlv (USD/h) | 485.70255 | 472.12623 | 407.76084 | 460.78868 | ||
| TC (USD/h) | 794.26013 | 803.90411 | 803.64378 | 809.62064 | ||
| (USD/h) | 91.46078 | 116.63063 | 137.97897 | 124.90499 | ||
| (USD/h) | 233.32603 | 239.61001 | 292.18320 | 262.84312 | ||
| f | 801.80579 | 817.98859 | 924.24990 | 904.70664 |
| Parameters | Min | Max | Case 1 | Case 2 | Case 3 | Case 4 | Case 5 | Case 6 |
|---|---|---|---|---|---|---|---|---|
| PG2 (MW) | 20 | 80 | 40.02539 | 46.52096 | 23.91095 | 36.65249 | 42.00643 | 74.95196 |
| PG5 (MW) | 15 | 50 | 49.07572 | 50.00000 | 23.46300 | 46.17352 | 22.21133 | 24.47224 |
| PG8 (MW) | 10 | 35 | 34.67318 | 35.00000 | 11.54974 | 22.77969 | 20.45939 | 28.14867 |
| PG11 (MW) | 10 | 30 | 30.00000 | 21.49005 | 25.67956 | 25.68228 | 14.51783 | 19.29034 |
| PG13 (MW) | 10 | 40 | 34.36451 | 37.56008 | 23.13983 | 18.91046 | 30.75100 | 23.20874 |
| PG17 (MW) | 10 | 30 | 29.01893 | 22.38399 | 24.62898 | 23.95732 | 24.66066 | 12.45122 |
| PG28 (MW) | 10 | 40 | 18.19266 | 24.48553 | 20.59833 | 19.27968 | 19.26301 | 18.88981 |
| VG1 (p.u.) | 0.95 | 1.1 | 1.05364 | 1.03942 | 1.01756 | 1.06729 | 1.04097 | 1.01279 |
| VG2 (p.u.) | 0.95 | 1.1 | 1.04863 | 1.02301 | 1.00556 | 1.05461 | 1.03248 | 1.00629 |
| VG5 (p.u.) | 0.95 | 1.1 | 1.03139 | 0.95000 | 0.98760 | 1.02436 | 0.99034 | 0.99205 |
| VG8 (p.u.) | 0.95 | 1.1 | 1.04080 | 0.97739 | 0.99071 | 1.02795 | 1.01486 | 1.00276 |
| VG11 (p.u.) | 0.95 | 1.1 | 1.01409 | 1.03960 | 1.07928 | 0.98967 | 1.01054 | 1.02740 |
| VG13 (p.u.) | 0.95 | 1.1 | 1.04110 | 1.04025 | 0.96933 | 1.05308 | 1.01018 | 1.01694 |
| VG17 (p.u.) | 0.95 | 1.1 | 1.02540 | 1.01431 | 0.99616 | 1.02056 | 0.98858 | 1.00917 |
| VG28 (p.u.) | 0.95 | 1.1 | 1.03697 | 1.05940 | 1.02243 | 1.06514 | 1.03544 | 1.01704 |
| QC10 (MVAr) | 0 | 5 | 3.54296 | 0.83870 | 0.17086 | 4.14137 | 4.29830 | 4.64040 |
| QC12 (MVAr) | 0 | 5 | 4.75066 | 4.88395 | 2.05641 | 0.55606 | 2.46217 | 4.60089 |
| QC15 (MVAr) | 0 | 5 | 0.83225 | 0.03260 | 3.44835 | 0.42284 | 3.77925 | 1.92878 |
| QC17 (MVAr) | 0 | 5 | 3.72170 | 4.73071 | 2.99352 | 3.90725 | 2.65623 | 2.87648 |
| QC20 (MVAr) | 0 | 5 | 3.01213 | 4.57182 | 4.34071 | 0.30984 | 1.53640 | 4.78579 |
| QC21 (MVAr) | 0 | 5 | 4.60041 | 0.89705 | 3.20054 | 3.09955 | 2.55970 | 2.33673 |
| QC23 (MVAr) | 0 | 5 | 4.24710 | 5.00000 | 4.57624 | 3.06937 | 1.89264 | 4.11514 |
| QC24 (MVAr) | 0 | 5 | 2.37751 | 0.00000 | 3.00126 | 1.07710 | 2.35402 | 3.80665 |
| QC29 (MVAr) | 0 | 5 | 4.76023 | 1.54553 | 1.50466 | 4.97224 | 2.28808 | 2.87199 |
| TS11 (p.u.) | 0.9 | 1.1 | 1.04170 | 0.98821 | 0.96062 | 1.01068 | 1.02540 | 1.03837 |
| TS12 (p.u.) | 0.9 | 1.1 | 0.96366 | 0.98600 | 0.97980 | 1.03942 | 1.02831 | 0.90957 |
| TS15 (p.u.) | 0.9 | 1.1 | 1.04033 | 0.90000 | 1.01901 | 0.99969 | 1.03855 | 0.99000 |
| TS36 (p.u.) | 0.9 | 1.1 | 1.02003 | 0.96187 | 0.90000 | 1.00952 | 0.99905 | 0.98482 |
| PG1 (MW) | 50 | 200 | 50.47301 | 50.01089 | 137.35607 | 93.95666 | 115.38641 | 87.07505 |
| QG1 (MVAr) | −20 | 150 | −7.93203 | 33.06018 | −11.76560 | 4.53656 | −13.89121 | −12.63818 |
| QG2 (MVAr) | −20 | 60 | 7.21829 | 47.45303 | 18.32026 | 19.31724 | 29.42169 | 0.04135 |
| QG5 (MVAr) | −15 | 62.5 | 21.41301 | −16.71205 | 35.31498 | 15.95113 | 11.16683 | 34.05198 |
| QG8 (MVAr) | −15 | 48 | 21.47653 | 0.18131 | 37.51703 | 10.70643 | 24.83413 | 36.56736 |
| QG11 (MVAr) | −10 | 40 | 1.66928 | 13.31679 | 26.87939 | −8.08038 | 8.58785 | 13.18120 |
| QG13 (MVAr) | −15 | 44 | 14.39545 | −2.72192 | −3.37207 | 16.54988 | 12.91913 | 5.27851 |
| QG17 (MVAr) | −15 | 44 | 3.97139 | −4.19670 | −2.34354 | 6.55973 | 1.37956 | 3.23787 |
| QG28 (MVAr) | −15 | 44 | 7.02760 | 16.12879 | −4.87200 | 17.67173 | 15.03961 | 2.91594 |
| VD (p.u.) | 0.44744 | 0.40903 | 0.37205 | 0.50413 | 0.37616 | 0.08747 | ||
| FC (USD/h) | 331.29367 | 352.65254 | 435.96090 | 387.03094 | 455.07515 | 530.15158 | ||
| Lmax (p.u.) | 0.07086 | 0.06996 | 0.07006 | 0.06784 | 0.07190 | 0.07377 | ||
| Ploss (MW) | 2.42341 | 4.05151 | 6.92645 | 3.99209 | 5.85606 | 5.08803 | ||
| E (ton/h) | 0.09143 | 0.09106 | 0.16462 | 0.11157 | 0.13106 | 0.11148 | ||
| FC_vlv (USD/h) | 353.39255 | 377.01753 | 440.79444 | 420.99242 | 484.29103 | 570.44878 | ||
| TC (USD/h) | 857.54912 | 875.59526 | 786.97231 | 818.42852 | 762.78060 | 814.31135 | ||
| (USD/h) | 161.35619 | 147.13159 | 150.60917 | 146.26535 | 103.15927 | 119.09272 | ||
| (USD/h) | 364.89926 | 375.81112 | 200.40224 | 285.13223 | 204.54618 | 165.06705 | ||
| f | 2.42341 | 0.09106 | 792.29044 | 0.06784 | 762.78060 | 0.08747 |
| Parameters | Min | Max | Case 7 | Case 8 | Case 9 | Case 10 |
|---|---|---|---|---|---|---|
| PG2 (MW) | 20 | 80 | 29.40596 | 33.45072 | 45.98365 | 45.99520 |
| PG5 (MW) | 15 | 50 | 19.31505 | 17.65284 | 46.41269 | 37.18199 |
| PG8 (MW) | 10 | 35 | 14.39820 | 16.53447 | 24.50547 | 22.91120 |
| PG11 (MW) | 10 | 30 | 24.26073 | 21.42012 | 17.37594 | 20.69407 |
| PG13 (MW) | 10 | 40 | 26.76983 | 27.15997 | 34.00737 | 35.27468 |
| PG17 (MW) | 10 | 30 | 20.14625 | 26.06022 | 30.01277 | 22.62152 |
| PG28 (MW) | 10 | 40 | 21.35415 | 17.29802 | 22.43730 | 16.54459 |
| VG1 (p.u.) | 0.95 | 1.1 | 1.03607 | 1.05395 | 1.03798 | 1.03754 |
| VG2 (p.u.) | 0.95 | 1.1 | 1.01626 | 1.02432 | 1.03164 | 1.03326 |
| VG5 (p.u.) | 0.95 | 1.1 | 0.98430 | 0.97604 | 1.01275 | 0.99365 |
| VG8 (p.u.) | 0.95 | 1.1 | 0.97369 | 0.99489 | 1.01255 | 1.00667 |
| VG11 (p.u.) | 0.95 | 1.1 | 1.05984 | 1.01125 | 1.04217 | 1.05139 |
| VG13 (p.u.) | 0.95 | 1.1 | 1.02184 | 1.02487 | 1.03988 | 1.00795 |
| VG17 (p.u.) | 0.95 | 1.1 | 1.03681 | 1.00034 | 1.01192 | 1.01398 |
| VG28 (p.u.) | 0.95 | 1.1 | 0.99598 | 1.03413 | 1.02500 | 1.01833 |
| QC10 (MVAr) | 0 | 5 | 3.03368 | 1.92345 | 2.37236 | 3.18892 |
| QC12 (MVAr) | 0 | 5 | 2.82405 | 2.08664 | 2.76141 | 2.27456 |
| QC15 (MVAr) | 0 | 5 | 2.33486 | 3.19222 | 1.36233 | 2.36574 |
| QC17 (MVAr) | 0 | 5 | 4.25529 | 3.07350 | 4.45485 | 2.72502 |
| QC20 (MVAr) | 0 | 5 | 1.73124 | 1.06813 | 3.47874 | 1.95957 |
| QC21 (MVAr) | 0 | 5 | 0.44924 | 2.21276 | 1.60014 | 2.28635 |
| QC23 (MVAr) | 0 | 5 | 4.57959 | 4.15362 | 1.75133 | 2.79851 |
| QC24 (MVAr) | 0 | 5 | 2.83987 | 2.46593 | 2.61995 | 2.46354 |
| QC29 (MVAr) | 0 | 5 | 3.32730 | 1.80855 | 1.42525 | 3.11270 |
| TS11 (p.u.) | 0.9 | 1.1 | 0.94466 | 0.98782 | 0.97252 | 0.95733 |
| TS12 (p.u.) | 0.9 | 1.1 | 0.90907 | 0.94856 | 1.00501 | 1.00209 |
| TS15 (p.u.) | 0.9 | 1.1 | 0.97219 | 0.98317 | 1.02366 | 0.97871 |
| TS36 (p.u.) | 0.9 | 1.1 | 0.97839 | 0.99202 | 0.96630 | 1.01296 |
| PG1 (MW) | 50 | 200 | 134.83941 | 130.60643 | 65.83571 | 86.28033 |
| QG1 (MVAr) | −20 | 150 | 12.47811 | 34.31531 | −5.76716 | −10.65614 |
| QG2 (MVAr) | −20 | 60 | 26.07263 | 7.73899 | 14.79083 | 42.49872 |
| QG5 (MVAr) | −15 | 62.5 | 31.62343 | 12.41189 | 25.86380 | 12.68659 |
| QG8 (MVAr) | −15 | 48 | 6.15492 | 20.55468 | 21.85341 | 23.59581 |
| QG11 (MVAr) | −10 | 40 | 10.35611 | 3.13706 | 8.10241 | 9.67273 |
| QG13 (MVAr) | −15 | 44 | 1.86616 | 8.92206 | 19.03313 | −1.71578 |
| QG17 (MVAr) | −15 | 44 | 10.28838 | −5.92523 | −2.80662 | 1.16630 |
| QG28 (MVAr) | −15 | 44 | −5.97690 | 14.00241 | 1.26901 | 8.00192 |
| VD (p.u.) | 0.36726 | 0.17245 | 0.21189 | 0.18099 | ||
| FC (USD/h) | 452.97603 | 459.31797 | 350.05138 | 396.82990 | ||
| Lmax (p.u.) | 0.07709 | 0.07281 | 0.07209 | 0.07457 | ||
| Ploss (MW) | 7.08959 | 6.78278 | 3.17091 | 4.10359 | ||
| E (ton/h) | 0.15881 | 0.15156 | 0.09550 | 0.10558 | ||
| FC_vlv (USD/h) | 460.97903 | 473.47524 | 380.64659 | 434.30593 | ||
| TC (USD/h) | 770.49104 | 778.21434 | 833.45357 | 801.84999 | ||
| (USD/h) | 147.23236 | 122.50350 | 123.89302 | 117.38415 | ||
| (USD/h) | 170.28266 | 196.39287 | 359.50917 | 287.63594 | ||
| f | 778.19986 | 795.45935 | 960.28996 | 897.93590 |
References
- Shi, L.; Wang, C.; Yao, L.; Ni, Y.; Bazargan, M. Optimal power flow solution incorporating wind power. IEEE Syst. J. 2011, 6, 233–241. [Google Scholar] [CrossRef]
- Alasali, F.; Haben, S.; Holderbaum, W. Energy management systems for a network of electrified cranes with energy storage. Int. J. Electr. Power Energy Syst. 2019, 106, 210–222. [Google Scholar] [CrossRef]
- Roy, R.; Jadhav, H. Optimal power flow solution of power system incorporating stochastic wind power using Gbest guided artificial bee colony algorithm. Int. J. Electr. Power Energy Syst. 2015, 64, 562–578. [Google Scholar] [CrossRef]
- Biswas, P.P.; Suganthan, P.N.; Mallipeddi, R.; Amaratunga, G.A. Optimal reactive power dispatch with uncertainties in load demand and renewable energy sources adopting scenario-based approach. Appl. Soft Comput. 2019, 75, 616–632. [Google Scholar] [CrossRef]
- Biswas, P.P.; Suganthan, P.; Amaratunga, G.A. Optimal power flow solutions incorporating stochastic wind and solar power. Energy Convers. Manag. 2017, 148, 1194–1207. [Google Scholar] [CrossRef]
- Dommel, H.; Tinney, W. Optimal Power Flow solutions. IEEE Trans. Power Appar. Syst. 1968, PAS–87, 1866–1876. [Google Scholar] [CrossRef]
- Alasali, F.; Haben, S.; Holderbaum, W. Stochastic optimal energy management system for RTG cranes network using genetic algorithm and ensemble forecasts. J. Energy Storage 2019, 24, 100759. [Google Scholar] [CrossRef]
- Lin, W.M.; Huang, C.H.; Zhan, T.S. A hybrid current-power optimal power flow technique. IEEE Trans. Power Syst. 2008, 23, 177–185. [Google Scholar] [CrossRef]
- Glavitsch, H.; Spoerry, M. Quadratic loss formula for reactive dispatch. IEEE Trans. Power Appar. Syst. 1983, 102, 3850–3858. [Google Scholar] [CrossRef]
- Burchett, R.; Happ, H.; Wirgau, K. Large scale optimal power flow. IEEE Trans. Power Appar. Syst. 1982, 10, 3722–3732. [Google Scholar] [CrossRef]
- Shargh, S.; Mohammadi-Ivatloo, B.; Seyedi, H.; Abapour, M. Probabilistic multi-objective optimal power flow considering correlated wind power and load uncertainties. Renew. Energy 2016, 94, 10–21. [Google Scholar] [CrossRef]
- Lobato, E.; Rouco, L.; Navarrete, M.; Casanova, R.; Lopez, G. An LP-based optimal power flow for transmission losses and generator reactive margins minimization. In Proceedings of the 2001 IEEE Porto Power Tech Proceedings (Cat. No. 01EX502), Porto, Portugal, 10–13 September 2001; Volume 3, p. 5. [Google Scholar]
- Duman, S.; Güvenç, U.; Sönmez, Y.; Yörükeren, N. Optimal power flow using gravitational search algorithm. Energy Convers. Manag. 2012, 59, 86–95. [Google Scholar] [CrossRef]
- El Ela, A.A.; Abido, M.; Spea, S. Optimal power flow using differential evolution algorithm. Electr. Power Syst. Res. 2010, 80, 878–885. [Google Scholar] [CrossRef]
- Bouchekara, H. Optimal power flow using black-hole-based optimization approach. Appl. Soft Comput. 2014, 24, 879–888. [Google Scholar] [CrossRef]
- Mohamed, A.A.A.; Mohamed, Y.S.; El-Gaafary, A.A.; Hemeida, A.M. Optimal power flow using moth swarm algorithm. Electr. Power Syst. Res. 2017, 142, 190–206. [Google Scholar] [CrossRef]
- Shilaja, C.; Arunprasath, T. Optimal power flow using Moth Swarm Algorithm with Gravitational Search Algorithm considering wind power. Future Gener. Comput. Syst. 2019, 98, 708–715. [Google Scholar]
- Hazra, J.; Sinha, A. A multi-objective optimal power flow using particle swarm optimization. Eur. Trans. Electr. Power 2011, 21, 1028–1045. [Google Scholar] [CrossRef]
- Aien, M.; Fotuhi-Firuzabad, M.; Rashidinejad, M. Probabilistic optimal power flow in correlated hybrid wind–photovoltaic power systems. IEEE Trans. Smart Grid 2014, 5, 130–138. [Google Scholar] [CrossRef]
- Aien, M.; Rashidinejad, M.; Firuz-Abad, M.F. Probabilistic optimal power flow in correlated hybrid wind-PV power systems: A review and a new approach. Renew. Sustain. Energy Rev. 2015, 41, 1437–1446. [Google Scholar] [CrossRef]
- Bhattacharya, A.; Roy, P. Solution of multi-objective optimal power flow using gravitational search algorithm. IET Gener. Transm. Distrib. 2012, 6, 751–763. [Google Scholar] [CrossRef]
- Nematollahi, A.F.; Rahiminejad, A.; Vahidi, B. A novel meta-heuristic optimization method based on golden ratio in nature. Soft Comput. 2019, 24, 1117–1151. [Google Scholar] [CrossRef]
- Kumar, S.; Chaturvedi, D. Optimal power flow solution using fuzzy evolutionary and swarm optimization. Int. J. Electr. Power Energy Syst. 2013, 47, 416–423. [Google Scholar] [CrossRef]
- Liang, R.H.; Tsai, S.R.; Chen, Y.T.; Tseng, W.T. Optimal power flow by a fuzzy based hybrid particle swarm optimization approach. Electr. Power Syst. Res. 2011, 81, 1466–1474. [Google Scholar] [CrossRef]
- Khorsandi, A.; Hosseinian, S.; Ghazanfari, A. Modified artificial bee colony algorithm based on fuzzy multi-objective technique for optimal power flow problem. Electr. Power Syst. Res. 2013, 95, 206–213. [Google Scholar] [CrossRef]
- Shabanpour-Haghighi, A.; Seifi, A.R.; Niknam, T. A modified teaching–learning based optimization for multi-objective optimal power flow problem. Energy Convers. Manag. 2014, 77, 597–607. [Google Scholar] [CrossRef]
- Oliveira, E.J.; Oliveira, L.W.; Pereira, J.; Honório, L.M.; Junior, I.C.S.; Marcato, A. An optimal power flow based on safety barrier interior point method. Int. J. Electr. Power Energy Syst. 2015, 64, 977–985. [Google Scholar] [CrossRef]
- Akbari, T.; Bina, M.T. Linear approximated formulation of AC optimal power flow using binary discretisation. IET Gener. Transm. Distrib. 2016, 10, 1117–1123. [Google Scholar] [CrossRef]
- Jadhav, H.; Bamane, P. Temperature dependent optimal power flow using g-best guided artificial bee colony algorithm. Int. J. Electr. Power Energy Syst. 2016, 77, 77–90. [Google Scholar] [CrossRef]
- Ghasemi, M.; Ghavidel, S.; Ghanbarian, M.M.; Gharibzadeh, M.; Vahed, A.A. Multi-objective optimal power flow considering the cost, emission, voltage deviation and power losses using multi-objective modified imperialist competitive algorithm. Energy 2014, 78, 276–289. [Google Scholar] [CrossRef]
- Narimani, M.R.; Azizipanah-Abarghooee, R.; Zoghdar-Moghadam-Shahrekohne, B.; Gholami, K. A novel approach to multi-objective optimal power flow by a new hybrid optimization algorithm considering generator constraints and multi-fuel type. Energy 2013, 49, 119–136. [Google Scholar] [CrossRef]
- Ghasemi, M.; Ghavidel, S.; Akbari, E.; Vahed, A.A. Solving non-linear, non-smooth and non-convex optimal power flow problems using chaotic invasive weed optimization algorithms based on chaos. Energy 2014, 73, 340–353. [Google Scholar] [CrossRef]
- Krishnanand, K.; Hasani, S.M.F.; Panigrahi, B.K.; Panda, S.K. Optimal power flow solution using self–evolving brain–storming inclusive teaching–learning–based algorithm. In International Conference in Swarm Intelligence; Springer: Berlin/Heidelberg, Germany, 2013. [Google Scholar]
- Sivasubramani, S.; Swarup, K. Sequential quadratic programming based differential evolution algorithm for optimal power flow problem. IET Gener. Transm. Distrib. 2011, 5, 1149–1154. [Google Scholar] [CrossRef]
- Biswas, P.P.; Suganthan, P.N.; Qu, B.Y.; Amaratunga, G.A. Multiobjective economic-environmental power dispatch with stochastic wind-solar-small hydro power. Energy 2018, 150, 1039–1057. [Google Scholar] [CrossRef]
- Hu, F.; Hughes, K.J.; Ma, L.; Pourkashanian, M. Combined economic and emission dispatch considering conventional and wind power generating units. Int. Trans. Electr. Energy Syst. 2017, 27, e2424. [Google Scholar] [CrossRef]
- Hu, F.; Hughes, K.J.; Ingham, D.B.; Ma, L.; Pourkashanian, M. Dynamic economic and emission dispatch model considering wind power under Energy Market Reform: A case study. Int. J. Electr. Power Energy Syst. 2019, 110, 184–196. [Google Scholar] [CrossRef]
- Mirjalili, S.; Lewis, A.; Sadiq, A.S. Autonomous particles groups for particle swarm optimization. Arab. J. Sci. Eng. 2014, 39, 4683–4697. [Google Scholar] [CrossRef]
- Mirjalili, S.; Gandomi, A.H. Chaotic gravitational constants for the gravitational search algorithm. Appl. Soft Comput. 2017, 53, 407–419. [Google Scholar] [CrossRef]
- Zhao, W.; Wang, L.; Zhang, Z. Supply-demand-based Optimization: A Novel Economics-inspired Algorithm for Global Optimization. IEEE Access 2019, 7, 73182–73206. [Google Scholar] [CrossRef]
- Rao, R.V.; Savsani, V.J.; Vakharia, D. Teaching–learning-based optimization: An optimization method for continuous non-linear large scale problems. Inf. Sci. 2012, 183, 1–15. [Google Scholar] [CrossRef]
- Kohli, M.; Arora, S. Chaotic grey wolf optimization algorithm for constrained optimization problems. J. Comput. Des. Eng. 2018, 5, 458–472. [Google Scholar] [CrossRef]
- Biswas, P.P.; Suganthan, P.N.; Mallipeddi, R.; Amaratunga, G.A. Optimal power flow solutions using differential evolution algorithm integrated with effective constraint handling techniques. Eng. Appl. Artif. Intell. 2018, 68, 81–100. [Google Scholar] [CrossRef]
- Bouchekara, H.; Chaib, A.; Abido, M. Multiobjective optimal power flow using a fuzzy based grenade explosion method. Energy Syst. 2016, 7, 699–721. [Google Scholar] [CrossRef]
- Shaheen, A.M.; El-Sehiemy, R.A.; Farrag, S.M. Solving multi-objective optimal power flow problem via forced initialised differential evolution algorithm. IET Gener. Transm. Distrib. 2016, 10, 1634–1647. [Google Scholar] [CrossRef]
- Panda, A.; Tripathy, M. Security constrained optimal power flow solution of wind-thermal generation system using modified bacteria foraging algorithm. Energy 2015, 93, 816–827. [Google Scholar] [CrossRef]
- Taha, I.B.; Elattar, E.E. Optimal reactive power resources sizing for power system operations enhancement based on improved grey wolf optimiser. IET Gener. Transm. Distrib. 2018, 12, 3421–3434. [Google Scholar] [CrossRef]
- Alsac, O.; Stott, B. Optimal load flow with steady-state security. IEEE Trans. Power Appar. Syst. 1974, 3, 745–751. [Google Scholar] [CrossRef]
- Zimmerman, R.D.; Murillo-Sánchez, C.E.; Gan, D. MATPOWER: A MATLAB Power System Simulation Package; Manual, Power Systems Engineering Research Center: Ithaca, NY, USA, 1997; Volume 1. [Google Scholar]


| Generator | Bus | |||||
|---|---|---|---|---|---|---|
| G1 | 1 | 4.091 | −5.554 | 6.49 | 0.0002 | 2.857 |
| G2 | 2 | 2.543 | −6.047 | 5.638 | 0.0005 | 3.333 |
| G3 | 5 | 4.258 | −5.094 | 4.586 | 0.000001 | 8 |
| G4 | 8 | 5.326 | −3.55 | 3.38 | 0.002 | 2 |
| G5 | 11 | 4.258 | −5.094 | 4.586 | 0.000001 | 8 |
| G6 | 13 | 6.131 | −5.555 | 5.151 | 0.00001 | 6.667 |
| Generator | Bus | a | b | c | d | e |
|---|---|---|---|---|---|---|
| G1 | 1 | 0 | 2 | 0.00375 | 18 | 0.037 |
| G2 | 2 | 0 | 1.75 | 0.0175 | 16 | 0.038 |
| G3 | 5 | 0 | 3 | 0.025 | 14 | 0.04 |
| G4 | 8 | 0 | 3.25 | 0.00834 | 12 | 0.045 |
| G5 | 11 | 0 | 3 | 0.025 | 13 | 0.042 |
| G6 | 13 | 0 | 3 | 0.025 | 13.5 | 0.041 |
| Characteristics | Values [47,48,49] |
|---|---|
| Branches | 41 |
| Number of buses | 30 |
| Generators | 6 (Buses:1, 2, 5, 8, 11 and 13) |
| Swing bus | Bus 1 |
| Generator voltage limits | 0.95–1.1 p.u |
| Load voltage limits | 0.95–1.05 p.u |
| Setting of tap changer in transformer | 0.9–1.1 p.u |
| Transformer with tap ration | 4 (Buses: 11, 12, 15 and 36) |
| Voltage Automatic Regulator | 0–5 p.u |
| Shunt VAR compensation | 9 Buses: 10, 12, 15, 17, 20, 21, 23, 24 and 29 |
| Real demand | 2.834 p.u |
| Reactive demand | 1.262 p.u |
| Load | 100 MVA |
| Control variables | 24 |
| Name | Objective Function | Test Systems |
|---|---|---|
| case 1 | Real power loss minimization | All scenarios |
| case 2 | Emission index minimization | All scenarios |
| case 3 | Quadratic fuel cost with valve point loading minimization | All scenarios |
| case 4 | Enhancement of the voltage stability | All scenarios |
| case 5 | Basic fuel cost minimization | All scenarios |
| case 6 | Voltage deviation minimization | All scenarios |
| case 7 | Fuel cost minimization and voltage stability enhancement | All scenarios |
| case 8 | Fuel cost and voltage deviation minimization | All scenarios |
| case 9 | Minimization of basic fuel cost and active power loss | All scenarios |
| case 10 | Minimization of basic fuel cost, emission index, voltage deviation, and real power losses | All scenarios |
| Case # | Objective Functions | CGSA1 | CGSA2 | GROM | SDO | MPSO | TLBO | CGWO |
|---|---|---|---|---|---|---|---|---|
| case 1 | VD (p.u.) | 0.70714 | 0.66033 | 0.71999 | 0.42466 | 0.76014 | 0.91679 | 0.45222 |
| FC (USD/h) | 872.15567 | 862.70849 | 973.92220 | 937.68429 | 974.61528 | 973.81103 | 882.43800 | |
| Lindex (p.u.) | 0.13921 | 0.14057 | 0.14115 | 0.14983 | 0.14049 | 0.13807 | 0.15171 | |
| Ploss (MW) | 4.02199 | 4.56792 | 3.14395 | 3.62014 | 3.63387 | 3.30616 | 3.81476 | |
| E (ton/h) | 0.24129 | 0.25443 | 0.20728 | 0.20859 | 0.20731 | 0.20727 | 0.23832 | |
| FC_vlv (USD/h) | 938.22643 | 919.87682 | 1034.34424 | 1010.80552 | 1035.17883 | 1034.19025 | 948.79631 | |
| f | 4.02199 | 4.56792 | 3.14395 | 3.62014 | 3.63387 | 3.30616 | 3.81476 | |
| case 2 | VD (p.u.) | 0.30358 | 0.26136 | 0.71076 | 0.43636 | 0.47812 | 0.85723 | 0.34289 |
| FC (USD/h) | 893.51907 | 904.71244 | 950.66290 | 937.92776 | 952.22920 | 950.84888 | 922.64268 | |
| Lindex (p.u.) | 0.15305 | 0.14919 | 0.14162 | 0.14172 | 0.14156 | 0.13870 | 0.14467 | |
| Ploss (MW) | 4.75735 | 4.86732 | 3.27565 | 4.13267 | 3.72861 | 3.24525 | 4.35506 | |
| E (ton/h) | 0.21014 | 0.21175 | 0.20484 | 0.20833 | 0.20498 | 0.20954 | 0.21590 | |
| FC_vlv (USD/h) | 966.67831 | 979.85891 | 1022.44605 | 1011.69196 | 1024.07955 | 1022.49926 | 996.83934 | |
| f | 0.21014 | 0.21175 | 0.20484 | 0.20833 | 0.20498 | 0.20954 | 0.21590 | |
| case 3 | VD (p.u.) | 0.74420 | 0.76043 | 0.54279 | 0.48761 | 0.82239 | 0.87906 | 0.21039 |
| FC (USD/h) | 841.77721 | 841.43518 | 843.27611 | 845.83292 | 847.23728 | 843.45433 | 845.28956 | |
| Lindex (p.u.) | 0.13925 | 0.13894 | 0.14295 | 0.14344 | 0.14049 | 0.13830 | 0.14515 | |
| Ploss (MW) | 6.92302 | 6.91765 | 7.59137 | 7.78547 | 8.40996 | 7.55869 | 7.85219 | |
| E (ton/h) | 0.28202 | 0.28216 | 0.29454 | 0.29500 | 0.29544 | 0.29499 | 0.28347 | |
| FC_vlv (USD/h) | 888.61875 | 888.26826 | 878.81470 | 881.40390 | 882.00880 | 880.27966 | 890.33615 | |
| f | 888.61875 | 888.26826 | 878.81470 | 881.40390 | 882.00880 | 880.27966 | 890.33615 | |
| case 4 | VD (p.u.) | 0.52152 | 0.69797 | 0.76302 | 0.61286 | 0.77076 | 0.80003 | 0.41698 |
| FC (USD/h) | 847.68847 | 857.20269 | 865.24315 | 878.07633 | 965.79266 | 842.18148 | 868.30374 | |
| Lindex (p.u.) | 0.13961 | 0.13843 | 0.13763 | 0.13833 | 0.13831 | 0.13780 | 0.13955 | |
| Ploss (MW) | 7.35211 | 6.53377 | 5.83031 | 6.16208 | 4.06270 | 7.63168 | 6.21642 | |
| E (ton/h) | 0.27847 | 0.27138 | 0.25335 | 0.25025 | 0.20972 | 0.28532 | 0.25784 | |
| FC_vlv (USD/h) | 893.86133 | 904.43303 | 923.05396 | 935.29245 | 1028.15088 | 884.27804 | 922.55697 | |
| f | 0.13961 | 0.13843 | 0.13763 | 0.13833 | 0.13831 | 0.13780 | 0.13955 | |
| case 5 | VD (p.u.) | 0.65735 | 0.81414 | 0.58429 | 0.37576 | 0.55693 | 0.87181 | 0.34863 |
| FC (USD/h) | 842.67436 | 843.95553 | 837.59102 | 842.46418 | 842.54683 | 840.67292 | 847.02139 | |
| Lindex (p.u.) | 0.14093 | 0.13784 | 0.14318 | 0.15094 | 0.14409 | 0.13837 | 0.14615 | |
| Ploss (MW) | 7.31461 | 6.64161 | 7.00648 | 7.28322 | 7.46838 | 6.96988 | 7.15725 | |
| E (ton/h) | 0.28127 | 0.27959 | 0.28517 | 0.28468 | 0.28550 | 0.28551 | 0.28116 | |
| FC_vlv (USD/h) | 890.30092 | 892.37037 | 882.09685 | 884.12811 | 883.49168 | 881.53172 | 891.18054 | |
| f | 842.67436 | 843.95553 | 837.59102 | 842.46418 | 842.54683 | 840.67292 | 847.02139 | |
| case 6 | VD (p.u.) | 0.12821 | 0.13251 | 0.09950 | 0.13142 | 0.12680 | 0.12699 | 0.13714 |
| FC (USD/h) | 851.54629 | 855.78998 | 908.24429 | 861.13868 | 950.00101 | 868.79324 | 854.19234 | |
| Lindex (p.u.) | 0.14838 | 0.14789 | 0.14810 | 0.14825 | 0.14658 | 0.14753 | 0.14635 | |
| Ploss (MW) | 7.07079 | 6.94105 | 5.22157 | 6.68247 | 4.58518 | 5.90128 | 7.03471 | |
| E (ton/h) | 0.27491 | 0.27301 | 0.23516 | 0.25901 | 0.21851 | 0.25806 | 0.27187 | |
| FC_vlv (USD/h) | 899.37305 | 903.61970 | 970.73639 | 915.38549 | 1014.22195 | 922.65231 | 901.26322 | |
| f | 0.12821 | 0.13251 | 0.09950 | 0.13142 | 0.12680 | 0.12699 | 0.13714 |
| Case # | Objective Functions | CGSA1 | CGSA2 | GROM | SDO | MPSO | TLBO | CGWO |
|---|---|---|---|---|---|---|---|---|
| case 7 | VD (p.u.) | 0.71956 | 0.81489 | 0.86632 | 0.43614 | 0.45958 | 0.77051 | 0.27146 |
| FC (USD/h) | 842.34211 | 843.56498 | 837.44271 | 838.93332 | 840.32568 | 840.22379 | 843.02072 | |
| Lindex (p.u.) | 0.13874 | 0.13754 | 0.13789 | 0.14714 | 0.14368 | 0.13820 | 0.14311 | |
| Ploss (MW) | 7.13032 | 6.72718 | 7.01754 | 7.16570 | 7.68514 | 7.11366 | 7.67649 | |
| E (ton/h) | 0.28088 | 0.27965 | 0.28556 | 0.28438 | 0.28570 | 0.28491 | 0.29099 | |
| FC_vlv (USD/h) | 890.25298 | 891.98861 | 881.63306 | 884.05295 | 884.44747 | 882.83589 | 883.69004 | |
| f | 856.21598 | 857.31884 | 851.23146 | 853.64758 | 854.69399 | 854.04331 | 857.33158 | |
| case 8 | VD (p.u.) | 0.14185 | 0.13693 | 0.14047 | 0.16387 | 0.16498 | 0.11196 | 0.20062 |
| FC (USD/h) | 845.70694 | 850.00253 | 840.25665 | 840.62723 | 846.76444 | 843.16209 | 846.84117 | |
| Lindex (p.u.) | 0.14816 | 0.14788 | 0.14795 | 0.14730 | 0.14672 | 0.14838 | 0.14738 | |
| Ploss (MW) | 7.21634 | 7.01876 | 7.48091 | 7.62987 | 8.79324 | 7.58708 | 7.86412 | |
| E (ton/h) | 0.27951 | 0.27932 | 0.28370 | 0.28525 | 0.28767 | 0.28371 | 0.28564 | |
| FC_vlv (USD/h) | 894.33354 | 898.18813 | 886.12943 | 885.16084 | 889.46656 | 886.40801 | 889.31964 | |
| f | 859.89232 | 863.69596 | 854.30414 | 857.01426 | 863.26244 | 854.35856 | 866.90351 | |
| case 9 | VD (p.u.) | 0.85180 | 0.81605 | 0.93868 | 0.83308 | 0.89428 | 0.92644 | 0.50486 |
| FC (USD/h) | 870.88439 | 855.92392 | 901.66376 | 894.05610 | 900.12790 | 901.38918 | 896.53237 | |
| Lindex (p.u.) | 0.13870 | 0.13923 | 0.13814 | 0.13913 | 0.13735 | 0.13779 | 0.14444 | |
| Ploss (MW) | 5.12427 | 6.01478 | 3.92221 | 4.15095 | 4.09287 | 3.98993 | 4.77420 | |
| E (ton/h) | 0.24102 | 0.26299 | 0.22229 | 0.22631 | 0.22344 | 0.22257 | 0.22338 | |
| FC_vlv (USD/h) | 937.37032 | 907.60089 | 976.76381 | 967.69190 | 973.03795 | 973.72474 | 971.58135 | |
| f | 1075.85533 | 1096.51494 | 1058.55236 | 1060.09426 | 1063.84270 | 1060.98618 | 1087.50030 | |
| case 10 | VD (p.u.) | 0.31594 | 0.22964 | 0.29715 | 0.29599 | 0.24263 | 0.22534 | 0.30006 |
| FC (USD/h) | 858.18018 | 865.49723 | 861.40594 | 873.46881 | 865.78551 | 866.33761 | 862.24483 | |
| Lindex (p.u.) | 0.14591 | 0.14746 | 0.14696 | 0.14638 | 0.14809 | 0.14747 | 0.14697 | |
| Ploss (MW) | 5.75921 | 5.76015 | 5.31786 | 5.07336 | 5.41304 | 5.37209 | 6.09696 | |
| E (ton/h) | 0.25409 | 0.24952 | 0.24968 | 0.24182 | 0.24795 | 0.24776 | 0.26427 | |
| FC_vlv (USD/h) | 916.24654 | 926.00808 | 922.20928 | 936.71876 | 925.34475 | 925.32501 | 909.59909 | |
| f | 996.34524 | 1001.78360 | 989.38294 | 995.89322 | 994.67865 | 993.96323 | 1007.70037 |
| Case 1 | Case 2 | Case 3 | Case 4 | Case 5 | Case 6 | Case 7 | Case 8 | Case 9 | Case 10 | |
|---|---|---|---|---|---|---|---|---|---|---|
| CGSA1 | 21.831% | 2.526% | 1.103% | 1.418% | 0.603% | 22.392% | 0.582% | 0.650% | 1.608% | 0.699% |
| CGSA2 | 31.173% | 3.266% | 1.064% | 0.577% | 0.754% | 24.910% | 0.710% | 1.087% | 3.462% | 1.238% |
| SDO | 13.154% | 1.679% | 0.294% | 0.506% | 0.578% | 24.284% | 0.283% | 0.316% | 0.145% | 0.654% |
| MPSO | 13.482% | 0.069% | 0.362% | 0.496% | 0.588% | 21.528% | 0.405% | 1.038% | 0.497% | 0.532% |
| TLBO | 4.906% | 2.244% | 0.166% | 0.123% | 0.367% | 21.642% | 0.329% | 0.006% | 0.229% | 0.461% |
| CGWO | 17.584% | 5.124% | 1.294% | 1.375% | 1.113% | 27.444% | 0.712% | 1.453% | 2.662% | 1.818% |
| Case 1 | Case 2 | Case 3 | Case 4 | Case 5 | Case 6 | Case 7 | Case 8 | Case 9 | Case 10 |
|---|---|---|---|---|---|---|---|---|---|
| 37.856% | 55.542% | 10.691% | 52.202% | 7.866% | 23.966% | 5.806% | 4.251% | 12.687% | 8.558% |
| Case 1 | Case 2 | Case 3 | Case 4 | Case 5 | Case 6 | Case 7 | Case 8 | Case 9 | Case 10 |
|---|---|---|---|---|---|---|---|---|---|
| 22.918% | 55.544% | 9.846% | 50.710% | 8.932% | 12.095% | 8.580% | 6.888% | 9.283% | 9.243% |
| Min | Max | Median | Standard Devaition | |
|---|---|---|---|---|
| CGSA1 | 4.767784 | 5.77408 | 5.303694 | 0.2887 |
| CGSA2 | 5.126046 | 6.078505 | 5.500868 | 0.2809 |
| GROM | 3.086593 | 3.141349 | 3.092469 | 0.0130 |
| SDO | 3.459937 | 3.98322 | 3.639853 | 0.1424 |
| MPSO | 3.101988 | 4.640072 | 3.414303 | 0.3657 |
| TLBO | 3.093546 | 3.175361 | 3.119197 | 0.0206 |
| CGWO | 3.098536 | 3.491199 | 3.297122 | 0.1221 |
| Min | Max | Median | Standard Devaition | |
|---|---|---|---|---|
| CGSA1 | 993.5015 | 1004.872 | 996.5863 | 3.0276 |
| CGSA2 | 994.9444 | 1002.978 | 1000.033 | 2.0206 |
| GROM | 989.1602 | 990.6765 | 989.7054 | 0.3787 |
| SDO | 991.742 | 994.6512 | 993.0029 | 0.8192 |
| MPSO | 990.0802 | 1009.702 | 991.5875 | 6.1010 |
| TLBO | 989.1987 | 992.033 | 989.8508 | 0.7791 |
| CGWO | 989.3301 | 993.7202 | 990.8954 | 1.0713 |
| Algorithm | Parameters | Values | Testing Range and Notes |
|---|---|---|---|
| TLBO [41] | Teaching factor (TF) Maximum Number of Iterations Population Size Random number (r) | Selected randomly between 1 and 2 100 50 A uniformly distributed random number (0, 1) | [50, 100, 200] [25, 50, 100] |
| MPSO [38] | Inertia coefficient (w) Number of search agents Maximum number of iteration acceleration coefficient (c1, c2) | linearly reducing from 0. 9 to 0.4 50 100 c1 = 1 and c2 = 2 | [50, 100, 200] [25, 50, 100] |
| Udapting factors (C1, C2) | Descriped in [38] | Depending on: 1-the maximum number of iterations 2-the current iteration 3- random number ranges between 0 and 1 | |
| SDO [39] | Weights α and β | Descriped in [39] | Depending on: 1-the maximum number of iteration 2-the current iteration |
| The size of markets The maximum number of iterations Random number (r) | 50 100 ranged from 0 and 1 | [50, 100, 200] [25, 50, 100] | |
| CGWO [42] | Random vectors (r1, r2) Number of search agents Maximum number of iteration chaotic function variables (a, b) controlling parameter (a) | ranged from 0 and 1 50 100 a = 0.5 and b = 0.2 decreasing linearly from 2 to 0 | [50, 100, 200] [25, 50, 100] |
| CGSA1 [39] | initial gravitational constant (G0) the descending coefficient (α) Number of search agents The maximum number of iterations choatic map | 100 10 50 100 defined by chebyshev | [50, 100, 200] [25, 50, 100] |
| CGSA2 [39] | initial gravitational constant (G0) Number of search agents The maximum number of iterations the descending coefficient (a) choatic map | 100 50 100 10 defined by circle | [50, 100, 200] [25, 50, 100] |
| GROM [22] | Golden ratio (ϕ) Number of search agents Maximum number of iteration | 1.618 50 100 | [50, 100, 200] [25, 50, 100] |
| Objective Function | CGWO | GROM | SDO | MPSO | CGSA1 | CGSA2 | TLBO |
|---|---|---|---|---|---|---|---|
| FC (USD/h) | 142,997 | 135,861 | 140,023 | 141,772 | 146,287 | 143,381 | 135,911 |
| Parameters | Range | Values | Parameters | Values | Parameters | Values |
|---|---|---|---|---|---|---|
| PG1 | 30–100 | 32.21186 | VG1 | 0.95 | QC5 | 0.950906 |
| PG4 | 30–100 | 30 | VG4 | 0.95 | QC34 | 6.314366 |
| PG6 | 30–100 | 30.04239 | VG6 | 0.95 | QC37 | 25 |
| PG8 | 30–100 | 30.09265 | VG8 | 0.950009897 | QC44 | 25 |
| PG10 | 165–550 | 311.3139 | VG10 | 0.950003187 | QC45 | 14.47493 |
| PG12 | 55.5–185 | 61.43965 | VG12 | 0.950003586 | QC46 | 5.190185 |
| PG15 | 30–100 | 30.2096 | VG15 | 0.953660848 | QC48 | 0.006565 |
| PG18 | 30–100 | 30 | VG18 | 0.950017838 | QC74 | 3.810963 |
| PG19 | 30–100 | 30 | VG19 | 0.950095893 | QC79 | 1.942429 |
| PG24 | 30–100 | 30.59164 | VG24 | 0.953394037 | QC82 | 2.659867 |
| PG25 | 96–320 | 135.8435 | VG25 | 0.95621796 | QC83 | 18.53097 |
| PG26 | 124.2–414 | 223.4098 | VG26 | 0.950713633 | QC105 | 24.82019 |
| PG27 | 30–100 | 30.13422 | VG27 | 0.950069414 | QC107 | 1.935545 |
| PG31 | 32.1–107 | 32.10123 | VG31 | 0.954585313 | QC110 | 24.99855 |
| PG32 | 30–100 | 30 | VG32 | 0.950058989 | TS8 | 0 |
| PG34 | 30–100 | 30.18909 | VG34 | 0.952406433 | TS32 | 0.900319 |
| PG36 | 30–100 | 30.30491 | VG36 | 0.950089208 | TS36 | 0.900039 |
| PG40 | 30–100 | 30.06914 | VG40 | 0.95185859 | TS51 | 0.902047 |
| PG42 | 30–100 | 30.07363 | VG42 | 0.95 | TS93 | 0.900013 |
| PG46 | 35.7–119 | 35.7 | VG46 | 0.950000035 | TS95 | 0.901979 |
| PG49 | 91.2–304 | 166.7628 | VG49 | 0.95 | TS102 | 0.900152 |
| PG54 | 44.4–148 | 48.39637 | VG54 | 0.950197974 | TS107 | 0.90142 |
| PG55 | 30–100 | 30.33253 | VG55 | 0.950411434 | TS127 | 0.90332 |
| PG56 | 30–100 | 30.08466 | VG56 | 0.95 | PG69 | 372.5248 |
| PG59 | 76.5–255 | 92.1767 | VG59 | 0.950126059 | FC | 135861.6 |
| PG61 | 78–260 | 129.9819 | VG61 | 0.954125271 | ||
| PG62 | 30–100 | 30.07884 | VG62 | 0.950029822 | ||
| PG65 | 147.3–491 | 302.9139 | VG65 | 0.9500037 | ||
| PG66 | 147.6–492 | 304.2236 | VG66 | 0.950033728 | ||
| PG70 | 30–100 | 30 | VG70 | 0.950327527 | ||
| PG72 | 30–100 | 30 | VG72 | 0.95 | ||
| PG73 | 30–100 | 30.20381 | VG73 | 0.950007126 | ||
| PG74 | 30–100 | 30 | VG74 | 0.950003692 | ||
| PG76 | 30–100 | 30.62061 | VG76 | 0.95 | ||
| PG77 | 30–100 | 30.04887 | VG77 | 0.950010968 | ||
| PG80 | 173.1–577 | 370.2427 | VG80 | 0.950099868 | ||
| PG85 | 30–100 | 31.42712 | VG85 | 0.950001805 | ||
| PG87 | 31.2–104 | 31.20093 | VG87 | 0.951705271 | ||
| PG89 | 212.1–707 | 387.9401 | VG89 | 0.95 | ||
| PG90 | 30–100 | 30.13136 | VG90 | 0.95 | ||
| PG91 | 30–100 | 30.26185 | VG91 | 0.95 | ||
| PG92 | 30–100 | 30.01491 | VG92 | 0.950829199 | ||
| PG99 | 30–100 | 30 | VG99 | 0.950158643 | ||
| PG100 | 105.6–352 | 168.2852 | VG100 | 0.95 | ||
| PG103 | 42–140 | 42.08391 | VG103 | 0.95144805 | ||
| PG104 | 30–100 | 30.65275 | VG104 | 0.952230011 | ||
| PG105 | 30–100 | 30.03129 | VG105 | 0.950045069 | ||
| PG107 | 30–100 | 33.67704 | VG107 | 0.95 | ||
| PG110 | 30–100 | 30.00487 | VG110 | 0.95001117 | ||
| PG111 | 40.8–136 | 40.94514 | VG111 | 0.950369113 | ||
| PG112 | 30–100 | 31.75673 | VG112 | 0.950006161 | ||
| PG113 | 30–100 | 30 | VG113 | 0.950247127 | ||
| PG116 | 30–100 | 30.49714 | VG116 | 0.9500221 |
© 2020 by the authors. Licensee MDPI, Basel, Switzerland. This article is an open access article distributed under the terms and conditions of the Creative Commons Attribution (CC BY) license (http://creativecommons.org/licenses/by/4.0/).
Share and Cite
Nusair, K.; Alasali, F. Optimal Power Flow Management System for a Power Network with Stochastic Renewable Energy Resources Using Golden Ratio Optimization Method. Energies 2020, 13, 3671. https://doi.org/10.3390/en13143671
Nusair K, Alasali F. Optimal Power Flow Management System for a Power Network with Stochastic Renewable Energy Resources Using Golden Ratio Optimization Method. Energies. 2020; 13(14):3671. https://doi.org/10.3390/en13143671
Chicago/Turabian StyleNusair, Khaled, and Feras Alasali. 2020. "Optimal Power Flow Management System for a Power Network with Stochastic Renewable Energy Resources Using Golden Ratio Optimization Method" Energies 13, no. 14: 3671. https://doi.org/10.3390/en13143671
APA StyleNusair, K., & Alasali, F. (2020). Optimal Power Flow Management System for a Power Network with Stochastic Renewable Energy Resources Using Golden Ratio Optimization Method. Energies, 13(14), 3671. https://doi.org/10.3390/en13143671


