Abstract
The paper presents a research method concerning the application of statistical prognostic models for assessment of material durability and operational reliability of steel for steam pipelines, whose operation has exceeded the working time of 100,000 h. Decisions on the admission of long-lived materials to work for power industry results from extensive diagnostic examinations are based on the results of tests of mechanical properties, microstructure degradation, and corrosion processes. Considering the economic reasons and available data published in diagnostic reports, the determination of failure-free operating time of steam pipelines is based on the results of static tensile tests—tensile strength (Rm); conventional yield point (Rp); elongation (A) and Vickers hardness (V), correlated with the operating time and the media type (fresh steam and secondarily super-heated steam) for the most sensitive element of a pipeline, namely the elbow. The results of changes in strength properties during operation are presented in the form of graphs of the analyzed material feature vs. operating time in the range from zero hours (for a new material) to 300,000 h, taking into account the impact of random and systematic disturbances within the adopted tolerance limits. It has been found that because of the R2 factor and significance level in the t-Student test for regression and correlation coefficients, exponential, hyperbolic and quadratic models are best fitted to empirical points. Based on the tensile strength results (Rm), it has been found that the forecast time of the steam pipeline ranges from 193,400 to 258,300 h. Taking the yield strength (Rp) into account, it has been ascertained that the time ranges from 225,000 to 293,000 h, and for the working time forecast of steam pipelines based on Vickers hardness results, it ranges from 192,100 to 246,800 h.
1. Introduction
Proper operation of any element in the space-time continuum is based on a set of factors determining the possibility of occurrence of undesirable events. These events affect the operation of equipment from the moment of its first activation according to its intended use, up to its replacement or decommissioning [1,2].
The realization of all functionalities during a given time and under operating conditions of a system or a single element depends on, among other factors, reliability. Reliability of a facility means its ability to perform the planned functions (e.g., utility functions), or to be operated failure-free for a given time, together with diagnostics and repairs [2]. However, it should be noted that the operation time between failures and the reconditioning time under the defined operating conditions are treated as variables in the reliability theory [2].
Quantitative reliability analysis may be carried out using reliability measures or “reliability functions vs. time” [2]. To determine the reliability function, it is necessary to know the form of distribution of the variables characterizing a given element (e.g., its properties) and values of parameters of these distributions (expected value, standard deviation), obtained by experimental studies [3,4].
In the studies on a facility’s reliability, various computational techniques are used, including, among others, the methods by: Lee (1980), Lawless (1982), Nelson (1990), Dodson (1994) [5]. Statistical analyses are based on, among others, regression, correlation, variance analysis (with a single factor and multiple factors/ANOVA/MANOVA) [6,7,8]. In numerical analysis with n-element matrix of random parameters for evaluation of reliability, Monte Carlo method is used [9]. Its “Importance Sampling” version finds application for analysis of parameters with a low variance [10]. For estimation of failure-free operation time of a device, methods based on specific properties of standard Gaussian space are used [11]. Markov chains method is another example of stochastic processes defined in the time change function as a countable set [12]. In probabilistic models, random variables based on various probability distributions are used, including, most often, exponential distribution, Gaussian distribution, and Weibull distribution [13,14,15,16].
The mentioned methods for investigation of reliability of facilities may be used for evaluation of duration of their failure-free operation. Every facility has its life cycle, and the period of its reliability depends on numerous factors. In our work, a heating pipeline constitutes the research object.
In order to ensure safe operation of power systems and required level of production, proper diagnostics is necessary, aimed for assessment of the degradation degree of structure of materials used for pressurized elements. Maintaining a proper level of exploitation of materials operating above critical temperature is particularly relevant, because it pertains to those installations which have exceeded the calculated operating time of 100,000 h, which has taken place already in 1980s. This situation includes about 90% of power units utilized in Poland, among which a large share has reached the threshold of 200,000 h and still has further exploitation planned [17]. This time, equated with the service life of materials, is calculated based on standardized methods [18,19,20,21], creep resistance tests [22,23,24,25,26,27,28], and tests of mechanical properties (e.g., Robinson’s life-fractions) [29]. Admission of exploitation of materials for power industry (particularly critical elements), exceeding their calculated operating time, is based on positive results of extensive diagnostic tests, as well as environmental and economic considerations. They decide, among others, on increasing the frequency of technical inspections and admitting pressure equipment and installations to further operation in the phase of prolonged wear.
Prolonged operation under nominal operating parameters induces destruction processes in the native material, and a complete assessment of material durability is possible thanks to use of materials science tests and technological and construction tests. General knowledge and applied engineering practices concerning extension of operating time of heating and mechanical equipment indicate that in this scope, application of creep strength tests is the most complex solution [23,30,31,32]. However, as other sources report [33,34,35,36], creep tests are burdened with numerous inconveniences, because of, among others, prolonged full test duration and high costs.
Therefore, a need to increase the knowledge on development of computational methods has arisen in engineering practice, which, while based on real results of mechanical properties, enable “rapid” assessment of failure-free operating time of materials exploited under conditions of forced lifetime.
An alternative for such a situation is constituted by probabilistic methods for assessment of material durability based on standard tests of mechanical properties [37,38,39,40,41], as a derivative of the degree of material degradation, correlated with the operating time. However, any assessment of its wear and tear is not very accurate without a full history of operating parameters of critical elements over the entire period of use. A lack of such data leads to discrepancies in the analysis of change in strength test results, and, in consequence, erroneous decisions concerning estimation of remaining time for safe operation of pressure installations.
An attempt to correlate more than one pair of variables is enabled by statistical methods for evaluation of acceptable damage risk (survival probability) of pressure elements (e.g., elbows of steam pipelines), operated under real conditions and having strength in accordance with a proper distribution of variables. At present, testing of statistical hypotheses is an interdisciplinary element supporting tests of operational safety of construction materials subjected to high loads, as an aid in the decision-making process concerning extension of operation of power installation sections beyond the normative (calculated) time of use.
Determination of correlations between the major mechanical properties and computer-aided forecast durability of the material for elements of pressure installations will contribute to the management of production knowledge. Additionally, it will allow for connecting quantitative methods for production planning with deciding on required maintenance downtime for replacement of exhausted elements of pressure installations for fresh steam (FS) and secondarily super-heated steam (SSS), represented by pipeline elbows.
Thus, the main goal of the paper was to determine the statistical dependencies between the strength properties and the failure-free operating time of elbows of steam pipelines (using computer forecast and mathematical models), which will facilitate taking strategic decisions on long-term management of production potential.
The detailed goals were the following:
- Collection of results of diagnostic tests (mechanical properties of steam pipelines) from various power units.
- Creation of a database containing the following results: tensile strength (Rm), conventional yield point (Rp), elongation (A), and Vickers hardness (V) correlated with the operating time and medium type (FS and SSS) for elbows of steam pipelines.
- Selection of nonlinear-linearized models, which may be reduced to a linear form after transformation and treated (approximately) as linear models.
- Selection of statistical linear models defining the course of changes between the selected strength properties and the operating time of steam pipeline elbows.
- Forecast determination of the number of hours, after which further exploitation of the pipeline should cease or the pipeline should be subjected to a thorough inspection of diagnostic supervision services.
The publication presents selected models, only for FS steel group (models for SSS steel group are similar). Exponential models are statistically significant and the authors recommend them for use in the studied sector. Although the publication was based on the empirical data of the energy company in Poland, the authors believe, however, that the methodology used may be useful for the sector in other countries. The analysis of the operating time of the tested installation can be used as a case study or comparative analysis for other companies in the analyzed sector.
The area of modeling of power grids using econometric methods is discussed in numerous publications and the operating time forecast is calculated in various ways [42,43,44,45]. The research scope of a wet steam pipeline was a subject of a publication [46]. The authors studied damages of a (ruptured) pipeline at welded elements. Another publication presents a ratio σ 20 u/σ 550 u as a recommended parameter determining the degree of loss of strength of the metal and exhaustion of the heat-resistance resource of steam pipelines of thermal power plants [47]. On the other hand, operational reliability of elbow bends in steam pipelines was the subject of a paper [48]. Studying various areas, the authors presented results of a microstructure analysis and tests of mechanical properties of elbow metal, including publication of elbow calculations at low cyclic thermal fatigue. Another scientific team studied strength of low-alloy heat resistant steels (12Kh1MF) in steam pipelines of thermal power stations [47]. In turn, the next team studied the X20 CrMoV 12-1 (X20) high-alloy steel under conditions of pipeline operation. The impact of working conditions was analyzed by testing a new material and a material which had been operated already for 116,000 h [49].
Pipeline network transferring steam from its sources to recipients may be a system of any degree of complication: the network may consist of one section, multiple branching sections, or even a network with closed circuits (also called loops or rings), fed from one or multiple sources. The research themes include the issue of pipeline damages. It is necessary to shorten the network operation downtimes to improve the reliability of supplying the recipients, and energetic safety is of priority significance for development strategies of key branches of national industry. Starting from historical publications [50] to contemporary directions of the power industry development in the EU [51] and Poland [52], use of thermal equipment is connected inseparably with methods for determination of safe prolongation of their failure-free operation to next years. It is forecast that by 2040 the world economy will be growing by 2.8% annually, inducing an increase in the power generation efficiency by 1.1% every year [52].
While reviewing the available scientific publications on network damages, the book [53] has been considered basic. In this work, the author lists types of damage of steam pipeline networks supplying heat. The main types include: critical strains, intercrystalline corrosion, and loss of plasticity of power industry steels.
Another important research area relates to heat supply [54,55,56,57] and reliability of network systems. Because of increasing requirements for process control in automated power stations, energy recipients are becoming more and more sensitive to quality and reliability of network systems, including steam pipelines [58,59,60,61]. Apart from requirements of standards, the quality is also a subjective impressions of energy recipients, concerning reliability of heat supply and its price. Under market economics conditions, quality issues are particularly important because of the manufacturers’ customer orientation and the customer’s expectations. This field of studies falls within the area of management and is realized by the individual heat suppliers within the framework of their internal quality assessment of customer service.
2. Materials and Methods
The main assumptions of the paper included reliable collection of test results which have become the basis for creation of a statistical database of mechanical properties. The forecast of failure-free operating time of steam pipelines was prepared based on the results of Vickers hardness (V) tests and the results of a static tensile test (Rm, Rp, A).
It is significant that the data for statistical investigations are drawn from reports prepared by certified laboratories of diagnostic companies. The tests have been carried out in power plants where steam pipelines have been operated for more than 25 years (about 200,000 working hours), envisioned for further operation.
The Vickers hardness tests were carried out according to the PN-EN ISO 6507 standard, part 1, and the tested area included various spots of pipeline elbows both from the side of maximum, and minimum bend zone. Static tensile tests according to the PN-EN ISO 6892-1 standard. Based on the static tensile test, the following parameters were determined: tensile strength Rm, MPa, conventional yield point (for unidimensional stress state) Rp, MPa, and elongation percentage of the sample at break A%—as these material parameters which reflect the degree of material exhaustion in a more comprehensive way.
The methodology of the calculations carried out assumed collection of results for selected strength properties and analysis of the changes in time. For this purpose, statistical forecasting methods were used, based on mathematical models, which reflect best the dynamics of the course of changes in these properties during operation of the pipeline.
The statistical database was created as divided according to the following factor types:
- Type of steam flowing through the pipeline:
- Fresh steam (steel grades: 14MoV6-3, 13CrMo4-5)—designation FS;
- Secondarily super-heated steam (steel grade 10CrMo9-10)—designation SSS;
- Sampling location for tests of mechanical properties in the elbow area (Figure 1a):
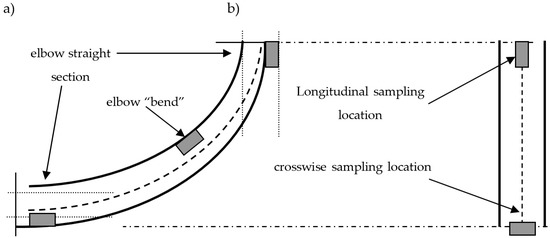 Figure 1. Steam pipe elbow: (a) area of sampling; (b) sample location method
- Elbow “bend” on the side of maximum bending zone (compression or stretching);
- Elbow straight section;
- Location of sample cutting for static tensile test (Figure 1b):
- Longitudinal—along the steam pipeline axis;
- Crosswise—across the pipeline axis.
Pipeline elements in which the areas of highest stresses occur include, among others, elbows, welded joints, bridges and orifices—as zones subject to detailed diagnostic supervision. The degree of material degradation is highest in these spots, particularly in pipeline bends and straight sections adjacent to them, therefore the results of tests carried out for these areas are an indicator of technical condition of the entire pressure installation.
The statistical database was implemented into licensed statistical software packages: Statistica and Excel, in which the statistical calculations (tests, hypotheses) were carried out and graphs prepared. In the statistical analysis, the following significance level (type I error) was assumed: p (α) < 0.05.
After an analysis of real time graphs, depicting the dependence of selected mechanical properties (dependent variable or response variable), i.e.,: Rm, Rp, A on the operating time of the tested elements (independent variable—argument) for model assessment of material durability forecast of the individual steam pipeline elbows, the following nonlinear models were chosen [62,63,64]:
- -
- Exponential:
- -
- Hyperbolic:
- -
- Quadratic:
- -
- Modified exponential:which—because the course of changes in mechanical properties is “inversely proportional” to the exponential model—better reflects the occurring changes in properties during the operation of pipe elbows,
where:
- y—selected mechanical property (Vickers hardness, Rm, Rp, A);
- x—operating time of the tested steam pipeline elbow;
- a, b—coefficients of the given function;
- c—correction coefficient, obtained by maximization (to a value equal to 1) of the coefficient of determination R2 of the exponential, hyperbolic, or quadratic function.
After required transformations [65,66,67,68,69,70,71,72,73], these models were linearized to the following forms:
Based on the normative values, consistent with the PN-75/H-84024 standard, the range from the upper specification limit (USL) to the lower specification limit (LSL), which amounts to, for corresponding properties:
- Rm: 640 (USL)–440 (LSL) MPa for FS and 590(USL)–440 (LSL) MPa for SSS,
- Rp: 440 (USL)–295 (LSL) MPa for FS and 410 (USL)–275 (LSL) MPa for SSS,
- A: 0 (LSL)–21 (USL) % for FS and 0 (LSL)–20 (USL) % for SSS,
- V: above 140 V for FS and for SSS steel group.
3. Results
3.1. Determining the Forecast of Operating Time on the Statistical Results of Tensile Strength (Rm) Change
Graphical course of the function of change in the Rm value vs. time during operation of an elbow bend made of 14MoV6-3 and 13CrMo4-5 steel groups with FS for samples from the longitudinal location is shown in Figure 2.
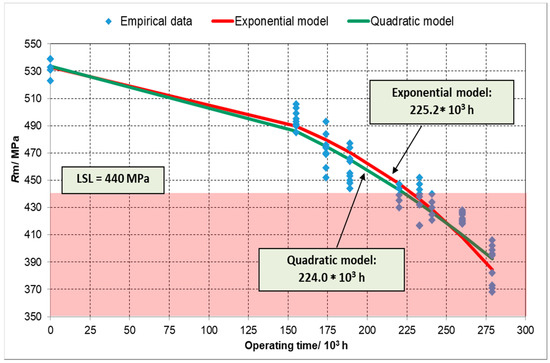
Figure 2.
The course of the Rm change depending on the operating time for the elbow bend made of fresh steam (FS) group steel at the longitudinal location of the samples tested.
It was found that both a model based on exponential function (1):
and a model based on quadratic function (3):
may be useful, because both these models describe the course of the Rm value depending on the operating time of an elbow bend of a steam pipeline in a highly statistically significant way (p(α) < 0.05).
y = 550 − e0.00815x+2.865; R2 = 0.9247
y = −0.0016x2 − 0.0597x + 533.63; R2 = 0.9151
The hyperbolic (2) and modified exponential (4) models proved to be statistically insignificant in this case. The change in the Rm value for all statistical functions (for FS and SSS) has been determined in the same way.
A summary set of mathematical models for the change of the Rm value, per the steel group: FS and SSS, taking into account the place, the sampling location, and the R2 coefficient value, as well as the operating time forecast (for p (α) < 0.05), are shown in Table 1. For models (1 and 2 from Table 1) from each group, the performed assessment of statistical significance was presented. Such an analysis was carried out for all models and was a mandatory part of the tests. All presented models are statistically significant. Table 2 and Table 3 are prepared in MS Excel while determining the statistical significance.

Table 1.
Summary set of prognostic models of Rm for FS and secondarily super-heated steam (SSS) steel groups designated.
Table 2.
The statistical significance for the model: y = −0.0018x2 + 0.0899x + 509.66.
Table 3.
The statistical significance for the model: y = −0.0024x2 + 0.0921x + 546.62.
Significance test of regression coefficients allows for defining the statistical significance of their values when the zero hypothesis is rejected. It results from Table 2 and Table 3 that the a and c coefficients are statistical significant for the type I error probability lower than 0.0001, while the b coefficient is statistical significant for the type I error probability lower than 0.05.
3.2. Determining the Forecast of Operating Time on the Statistical Results of Conventional Yield Point (Rp) Change
Graphical course of the function of changing the value of Rp during operation for pipe elbow “bend” made of steel from the FS group for samples with longitudinal location is shown in Figure 3. It was found that both a model based on exponential function R2 = 0.9103 and a model based on the quadratic function for p (α) < 0.05, R2 = 0.8904 are statistically significant.
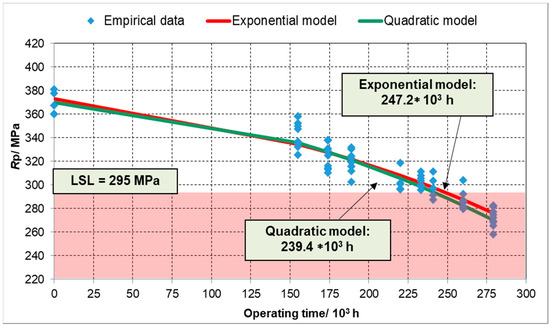
Figure 3.
The course of the Rp change depending on the operating time for the elbow bend made of FS group steel at the longitudinal location of the samples tested.
A summary set of mathematical models for the Rp value, per the steel group: FS and SSS, taking into account the place, the sampling location, and the R2 coefficient value, as well as the operating time forecast, is shown in Table 4.
Table 4.
Summary set of prognostic models of Rp for FS and SSS steel groups designated.
3.3. Determining the Forecast of Operating Time on the Statistical Results of Elongation (A) Change
Graphical course of the function of changing the value of A during operation for pipe elbow “bend” made of steel from the FS group for samples with longitudinal location is shown in Figure 4. The results indicate that the model based on the quadratic function is highly statistically significant R2 = 0.9394, as well as a model based on a modified exponential function R2 = 0.9075 (for p (α) < 0.05). The hyperbolic model in the discussed case turned out to be statistically insignificant.
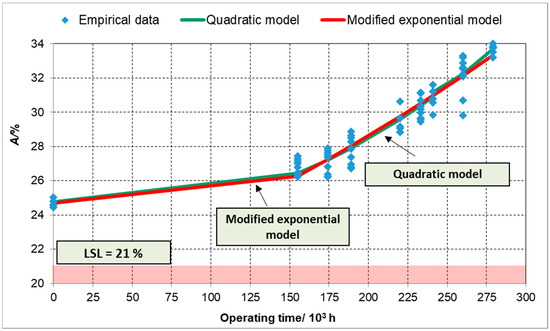
Figure 4.
The course of the elongation change depending on the operating time for the elbow bend made of FS group steel at the longitudinal location of the samples tested.
As it results from Figure 4, the course of change in the elongation value of the tested elbow bend element of the pipeline operated up to 155,000 h is of “almost linear” nature, reaching an elongation value of about 26.5 %. Above 155,000 h, further operation of the pipeline leads to a significant increase in elongation, which results in procedures of increased diagnostic control.
A summary set of prognostic models of elongation change divided into FS and SSS groups, taking into account the spot and sampling location, as well as statistical verification of the models, are shown in Table 5.
Table 5.
Summary set of prognostic models of elongation for FS and SSS steel groups.
Table 5 does not present the forecasted lifetime determined based on the change in elongation results because according to Polish Standard: PN-75/H-84024 there is no threshold for intersection of the prognostic curve with the lower tolerance limit (LSL = 21%), while the upper limit for elongation is not specified in the standard.
3.4. Determining the Forecast of Operating Time on the Statistical Results of Vickers Hardness Change
Graphical course of the function of changing the value of Vickers hardness during operation for pipe elbow “bend” made of steel from the FS group for samples with longitudinal location is shown in Figure 5. The results indicate that the model based on the exponential function (R2 = 0.9295) as well as the model based on the quadratic function (R2 = 0.8987) is highly statistically significant (for p (α) < 0.05). Other models in the discussed case turned out to be statistically insignificant.
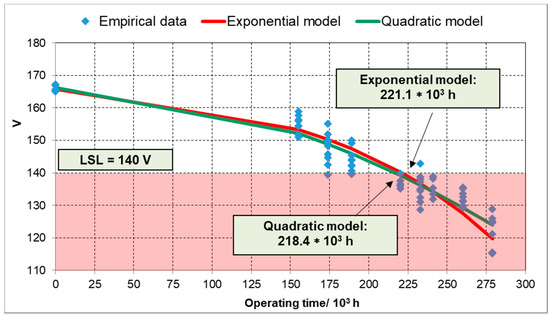
Figure 5.
The course of the Vickers hardness change depending on the operating time for the elbow bend made of FS group steel at the longitudinal location of the samples tested.
A summary set of prognostic models of hardness divided into FS and SSS groups, taking into account the spot and sampling location, as well as statistical verification of the forecast model, are shown in Table 6.
Table 6.
Summary set of prognostic models of Vickers hardness (V) for steel FS and SSS groups.
4. Discussion
The elements selected for the tests of mechanical properties were determined based on the analysis of stress conditions occurring in transmission installations for heating steam. The areas exhibiting the highest degree of internal stresses are located in elbows, which constitute the weakest link in the whole steam pipeline system.
The tests were carried out in power plant, operated for more than 200,000 h of working time, to assess a durability forecast of the individual steam pipelines. The database contains results for 125 pipeline installations (for fresh steam and secondarily super-heated steam), which makes it unique for the sake of its size. The methodology of the applied mathematical models was selected so as to enable its further updating with the results of new tests and entering data from other energy group enterprises, which will increase its qualitative values and allow for more accurate substantive assessing of material exhaustion.
For the steel group used for fresh steam (FS) pipelines (14MoV6-3 and 13CrMo4-5), one may ascertain that both the sampling spot (“bend” and straight section of the elbow), and the sampling location (longitudinal or crosswise) for Rm have a similar forecast operating time of the pipeline, amounting to from 215,000 h to 228,400 h. When the listed time periods are exceeded, Rm strength drops below the acceptable minimum specification limit LSL, amounting to 440 MPa. Further operation of the steam pipeline becomes dangerous which should be taken into account in procedures of special diagnostic supervision.
In case of steels used for secondarily super-heated steam (SSS) pipelines (10CrMo9-10), the test results indicate that the sampling spot and location affect the forecast operating time of the pipeline (from 193,400 h to 258,300 h)—Table 1.
In the case of steel group used for fresh steam pipelines, one may ascertain based on the Rp results that the operating time of a steam pipeline estimated using circumferential sampling location of samples cut out from the elbow straight sections amounts to from 225,800 to 247,200 h and is by about 30,000 h shorter than that of the other combinations. In case of steels used for SSS pipelines, the results indicate that the sampling spot and location affect the forecast operating time of the pipeline. While the longitudinal sampling location is used for the bend and the straight section, and while the circumferential sampling location is used for the elbow’s straight section, this time amounts 245,300 to 260,900 h. On the other hand, the results of the forecast operating time for the circumferential location of the elbow bend reach significantly higher values, approximately 284,300 to 293,200 h—Table 4.
As is evident from the graphs illustrating the elongation tests, no working time forecast has been determined, because the lower specification limit is defined normatively, and the function plots shown in Figure 4 do not intersect the acceptable limit and they do not exhibit such a tendency. As it results from Table 5, the quadratic model and the modified form of the exponential model are best suited for assessment of the failure-free working time forecast based on the change in elongation vs. time. Taking into account the coefficient of determination R2 value and the significance level obtained in the t-Student test for regression coefficients, it turned out that quadratic models are those mapping the positions of empirical points of the elongation change in time, both for the fresh steam group, and for secondarily super-heated steam pipelines.
As it results from Table 6, exponential, hyperbolic, and quadratic models are best suited for assessment of the failure-free working time forecast based on the change in hardness vs. time. Taking into account the coefficient of determination R2 value and the significance level obtained in the t-Student test for regression coefficients, it was found that exponential models are the functions mapping best the positions of empirical points of the hardness change in time, both for the FS steel group, and for the SSS steel group.
In the case of steel groups used for FS pipelines, one may ascertain that the result of operating time of the circumferential location for the elbow straight sections estimated on the basis of Vickers hardness does not exceed 200,000 h and is by 10,000 to 20,000 h shorter while compared to the other values. In case of steels used for secondarily super-heated steam pipelines, one may note that the sampling spot and location affect the forecast operating time of the pipeline. The obtained results indicate that for each of the variants, large discrepancies exist, up to 50,000 working hours. The lowest value is found for the circumferential location-straight section combination (192,100 h), and the highest—the longitudinal location-bend combination (246,800 h).
It should be noted that the models obtained may have a different form of function for other empirical data. Different empirical data will be obtained for a steam pipeline with a relatively short operation time and steel type from which the studied pipelines have been constructed. Thus, further research to study other cases in the scope of duration of steam pipelines operation constructed from materials having different properties may be necessary.
Creep tests have not been performed in the investigation of the steam pipeline durability, as they are burdened with numerous inconveniences, because of, among others, prolonged full test duration and high costs.
Creep is another factor influencing the operational reliability of steam pipelines [38,74,75]. In the paper [75], a study on the impact of the final (system) load on creep behaviour of thick-walled joints under internal pressure using the finite element (FE) method with simplified axis-symmetrical models is described. The analysis of evaluation of microstructure degradation resulting from prolonged creep was in realized in in power plant in Great Britain [76]. In their research, authors have used material data for low-alloy steels for CrMoV welds which are fully serviceable and reparable at 640 °C. In the tested steels, tear stress has exhibited a very low variability in the explosion hazard zone, in the areas dominating in the case of failure, for a closed load. However, the change is more significant when an additional axial load is applied. In the tested welds, an excessive value of this load causes (apart from internal pressure) a high probability of intercrystalline fracture.
Moreover, we did not analyse the problem corrosion of metals during pipeline exploration. In the field of materials engineering, research on corrosion of materials should be considered a significant area of studies on steam pipeline reliability. Papers related to this subject pertain to corrosion resistance of the individual chromium–molybdenum steels type, from which steam pipelines in various supply networks are constructed locally and abroad [77].
Another area of assessment of steam pipelines usability for their further operation is constituted by durability of welds of connected (metal) elements. The authors of this publication have not studied this issue at the connection of a pipeline elbow with a straight section, but are aware of the significance of this research field, particularly in long heat networks. The problem of control of weld connections in their prolonged operation has been taken in account in other publication [78]. Authors have proved that it is advantageous to use the ultrasonic test method for manufacturing and assembly of steam pipelines. The microcrack index test period should be selected based on calculated stresses and values of long-term durability [78].
Additionally, the dynamic load of the steam pipeline is an important research area. The most loaded sections are those in which there was an abrupt change in the direction of the flow of the working medium (turbine steam feed system, valves, pipeline elbows) [79]. In these parts, forces cause a transverse pressure gradient, leading to a flow separation. The separations induce pressure oscillations with a broad frequency spectrum, with amplitude which may reach more than 10% of initial pressure. The studies have resulted in a proposal of a special device for stabilisation of the flow. Members of the other scientific team designed aerodynamic filters and a direct action modifying the behaviour of the process medium flow in the areas adjacent to the walls [80]. They proved that application of the proposed design of pulsation dampers could improve the vibrational reliability of the installation and pipelines connected to them by from two to three times. Application of a tensometer for online monitoring of deformations of high-temperature pipes was also of practical significance. The operational reliability at a high temperature was confirmed by online monitoring of deformations of a main steam pipe operating at 540 °C under industrial conditions [81].
In conclusion, the reliability assessment methods of steam pipelines are very extensive. More information about research subjects there are in scientific publications (Web of Science (WoS) and Scopus databases, where about 10% of the publications were available as open access. The subject: “reliability of steam pipelines” is very important the field of research because the results of the researches may be used in practice.
Our presented models for material durability assessment by statistical methods may be used in the management of heat distribution networks maintenance. The assessment of material durability on the basis of material strength is particularly important for long-term network operation. However, it does not mean that other methods for assessment of steam pipelines condition (e.g., creep tests) should be excluded. They should expand the comparative analysis of the results.
Additionally, current diagnostic sheets used in the Polish heating industry could be expanded with information from econometric models. Every diagnostic sheet contains the number of operation hours of the pipeline, and empirical information is useful in building models. Such an approach is valuable for diagnostic supervisory personnel in forecasting of material durability or estimating the probability of failures.
In the studied case, the further operation of steam pipelines for subsequent years—even after reaching 350,000 h—will be possible and safe provided that the rule of “continuous monitoring” of the most important material parameters will be observed. To avoid, or at least to limit the possibility of an uncontrolled failure to a significant degree, assessment of strength status of the material becomes necessary apart from thermodynamic diagnostics. The material strength may be tested using the presented statistical models.
The superiority of the presented tests consists in the fact that they may be implemented easily in the failure-free process of heat distribution network maintenance. Previously, the decisions on prolongation of the pipeline operating time have been made mainly on the basis of the diagnosticians’ experience. The developed models are based on available information on mechanical properties of the materials, which has not been used hitherto in Polish heating systems for such forecast of the failure-free operating times of facilities.
5. Conclusions
Based on the research carried out and the analysis of the obtained results, the following conclusions were formulated:
- The presented methodology fort statistical tests may be used for estimation of operational reliability forecast, as a derivative of evaluation of material durability of elements of pressurized facilities, including the elbows of steam pipelines.
- Statistical forecasting of failure-free operation time (in the range reported) should be considered a method supporting the decision process, supplementing conventional tests of structure degradation of steel used for steam pipelines.
- Statistical calculations on the base of the Rm results indicate that the working time forecast is from about 200,000 to 228,000 h (for fresh steam) and from about 193,000 to 258,000 h for secondarily super-heated steam. Based on a comparison of the obtained Rm results, one may ascertain that the shortest operating time of the tested elbow element of a steam pipeline is determined on the basis of circumferential location for secondarily super-heated steam, while the longest operating time may be forecast using the results pertaining to fresh steam.
- Statistical calculations on the base of Rp results for fresh steam indicate that the working time forecast is from about 226,000 to 247,000 h. For secondarily super-heated steam: from 245,000 to 293,000 h.
- Statistical calculations on the base of Vickers hardness results for fresh steam indicate that the working time forecast is from about 192,000 to 221,000 h. For secondarily super-heated steam: from 193,000 to 247,000 h.
- The results of elongation indicate that on the basis of the course of the studied functions, a forecast of failure-free operation time of steam pipeline elbows is not possible.
Author Contributions
Conceptualization, A.M., J.P. and B.G.; methodology, A.M. and J.P.; software, A.M. and J.P.; validation, A.M.; formal analysis, A.M. and J.P.; investigation, J.P.; resources, A.M.; data curation, A.M., J.P. and B.G.; writing—original draft preparation, J.P. and B.G.; writing—review and editing, B.G. and J.P.; visualization, B.G. and J.P.; supervision, B.G. and J.P.; funding acquisition, J.P. and B.G. (Silesian University of Technology). All authors have read and agreed to the published version of the manuscript.
Funding
This research was funded by Silesian University of Technology (Faculty of Materials Engineering), supported this work as a part of Statutory Research BK-11/990/BK_20/0074).
Acknowledgments
The research work realized by A. Mesjasz in his research work Zastosowanie statystycznych metod wspomagania decyzji dotyczących oszacowania trwałości materiałowej rurociągów parowych (Application of statistical methods for decision support pertaining to estimation of material durability of steam pipelines). Doctoral thesis. Faculty of Materials Engineering and Metallurgy, Silesian University of Technology, Katowice. Supervisor: Jarosław Piątkowski—Silesian University of Technology.
Conflicts of Interest
The authors declare no conflict of interest.
References
- Będkowski, L.; Dąbrowski, T. Basics of Operation. P. II Basics of Operational Reliability; Military University of Technology Publishing House: Warsaw, Poland, 2006. [Google Scholar]
- Szopa, T. Reliability and Safety; Warsaw University of Technology Publishing House: Warsaw, Poland, 2009. [Google Scholar]
- Sołowiej, A.D. Analytical Methods in Reliability Theory; WNT: Warsaw, Poland, 1983. [Google Scholar]
- Warszyński, M. Reliability in Structural Calculations; PWN: Warsaw, Poland, 1988. [Google Scholar]
- Available online: http://www.statsoft.pl/textbook/stprocan.html (accessed on 28 January 2018).
- Kleinbaum, D.G.; Kupper, L.L.; Muller, K.E.; Nizam, A. Applied Regression Analysis and Other Multivariable Methods; Duxbury Press: Pacific Grove, CA, USA, 1998. [Google Scholar]
- Konecki, W. Statistics for Engineers; PWN: Warsaw, Poland, 1999. [Google Scholar]
- Maliński, M. Computer-Aided Mathematical Statistics; Silesian University of Technology Publishing House: Gliwice, Poland, 2000. [Google Scholar]
- Sobol, I.M. Monte Carlo Method; Science Publishing House: Moscow, Russia, 2017. (In Russian) [Google Scholar]
- Winkelmann, K. Calculation of Reliability of Engineering Structures by Simulation Methods and the Response Surface Method; Gdańsk University of Technology: Gdańsk, Poland, 2013; Available online: www.pbc.gda.pl/Kontent/34300/phd (accessed on 22 February 2018).
- Kolanek, K. Analysis and Reliability Optimization of Structures by Adaptive Simulation Methods. Ph.D. Thesis, PAS Institute of Fundamental Technological Research, Warsaw, Poland, 2006. [Google Scholar]
- Pacut, A. Probability, Theory, Probabilistic Modeling in Technology; WNT: Warsaw, Poland, 1985. [Google Scholar]
- Akram, M.; Hayat, A. Comparison of Estimators of the Weibull Distribution; Financial Econometrics Series; School Working Paper; Deakin University Australia: Geelong, Australia, 2013. [Google Scholar]
- Almeida, J.B. Application of Weibull statistics to the failure of coatings. J. Mater. Process. Technol. 1999, 93, 257–263. [Google Scholar] [CrossRef]
- Balakrishnan, N.; Kateri, M. On the maximum likelihood estimation of parameters of Weibull distribution based on complete and censored data. Stat. Probab. Lett. 2008, 78, 2971–2975. [Google Scholar] [CrossRef]
- Basu, B.; Tiwari, D.; Kundu, D.; Prasad, R. Is Weibull distribution the most appropriate statistical strength distribution for brittle materials? Ceram. Int. 2009, 35, 237–246. [Google Scholar] [CrossRef]
- Dobosiewicz, J. (Ed.) Guidelines for Life Extension of Thermo-Mechanical Equipment of 200 MW Power Units; Sprawozdanie PN/20.2900; Pro Novum sp. z o.o.: Katowice, Poland, 2013. [Google Scholar]
- Polish Standard PN-EN 12952:2015. Water-Tube Boilers and Auxiliary Installations—Part 1: General. Part 2: Materials for Pressure Parts of Boilers and Accessories. Part 3: Design and Calculation for Pressure Parts; Polish Committee for Standardization: Warsaw, Poland, 2015.
- Polish Standard PN-EN 13480-3:2017-10. Metallic Industrial Piping—Part 3: Design and Calculation; Polish Committee for Standardization: Warsaw, Poland, 2017.
- Polish Standard PN-EN 10216-2:2014. Seamless Steel Tubes for Pressure Purposes—Technical Delivery Conditions—Part 2: Non-Alloy and Alloy Steel Tubes with Specified Elevated Temperature Properties; Polish Committee for Standardization: Warsaw, Poland, 2014.
- Polish Standard PN-83 N-04041/10:2011. Reliability in Technical Engineering—Reliability Structures of Technical Systems; Data Collection and Handling System, and N-04041/05 General Testing Principles; Polish Committee for Standardization: Warsaw, Poland, 2011.
- UDT Guidelines, No. 1/2015. Principles of Diagnostics and Operational Durability Assessment of Boiler and Pipeline Elements Working in Creep Conditions; Publisher UDT: Warsaw, Poland, 2015; Available online: www.dt-b.pl/wytyczne-udt-nr-1-2015 (accessed on 20 May 2020).
- Dobrzański, J. Materials science interpretation of the life of steels for power plants. Open Access Libr. J. 2011, 3, 1–228. [Google Scholar]
- Dobrzański, J. Material diagnostics of components in the pressure part of steam boilers and pipelines operating under creep conditions much beyond the design service life. Energetyka 2002, 12, 937–946. [Google Scholar]
- Hernas, A.; Dobrzański, J. Durability and Deterioration of Elements of Steam Boilers and Turbines; Monograph; Silesian University of Technology Publishing House: Gliwice, Poland, 2003. [Google Scholar]
- Dobrzański, L.A.; Sroka, M.; Dobrzański, J. Application of neural networks to classification of internal damages in steel working in creep service. J. Achiev. Mater. Manuf. Eng. 2007, 20, 303–306. [Google Scholar]
- Dobrzański, L.A.; Dobrzański, J.; Sroka, M.; Sitek, W.; Krupiński, M. Computer aided for classification of damage of steel working in creep conditions. Hut. Wiadomości Hut. 2005, 3, 176–181. [Google Scholar]
- Hernas, A. Heat Durability of Steels and Alloys; Silesian University of Technology Publishing House: Gliwice, Poland, 2000. [Google Scholar]
- Dobrzański, J.; Purzyńska, H. The life-time fractures rule in the assessment of exhaustion degree. Energetyka 2015, 10, 653–656. Available online: http://www.elektroenergetyka.pl (accessed on 26 February 2018).
- Dobrzański, J. Diagnostics of Damages to Pressure Components of Powder Devices in Assessment of Reasons for Failures Based on Materials Testing; Institute for Ferrous Metallurgy: Gliwice, Poland, 2009; Volume 61, pp. 36–45. [Google Scholar]
- Hernas, A. Material and technological issues in development of power industry. In Proceedings of the III Scientific and Technical Conference Energo-Tech-Mat, Ustroń, Poland, 20–24 May 1998; pp. 8–15. [Google Scholar]
- Dobrzański, J.; Zieliński, A. Assessment of Operational Durability of Power Engineering Steels Working above the Boundary Temperature Based on Shortened Creep Tests; Institute for Ferrous Metallurgy: Gliwice, Poland, 2009. [Google Scholar]
- Klepacki, F. Methodology of Calculations of Durability Elements Working in Creep Conditions Based on Harmonized European Standards; Dozór Techniczny: Warsaw, Poland, 2015. [Google Scholar]
- Brunne, W.; Rajca, S. Usefulness of Non-destructive Tests for Life Time Forecasting of HP Steam Pipelines. Energetyka 2002, 20, 929–933. [Google Scholar]
- Gause, D.C.; Weinberg, G.M. Exploring Requirements; Dorset House: New York, NY, USA, 1989. [Google Scholar]
- Trzeszczyński, J. Material diagnosis on-line of power station thermo-mechanical installations. Energetyka 2008, 4, 279–283. [Google Scholar]
- Słowiński, B. Fundamentals of Testing and Assessment of the Reliability of Technical Objects; Koszalin University of Technology: Koszalin, Poland, 2002. [Google Scholar]
- Bucior, J. Fundamentals of Reliability Theory and Engineering; Publishing House Rzeszow University of Technology: Rzeszów, Poland, 2004. [Google Scholar]
- Szymszal, J. Reliability Assessment of AlSi(Me) Alloys Casts on the Basis of Statistical Material Reliability Indices Based on Weibull Analysis; Monograph; Silesian University of Technology Publishing House: Gliwice, Poland, 2009. [Google Scholar]
- Nelson, W. Accelerated Testing: Statistical Models, Test Plans, and Data Analysis; John Wiley & Sons: New York, NY, USA, 1990. [Google Scholar]
- Mesjasz, A.; Piątkowski, J. The reasons of steam pipeline rupture. Arch. Foundry Eng. 2016, 16, 67–70. [Google Scholar] [CrossRef]
- Anaya-Lara, O.; Acha, E. Modeling and analysis of custom power systems by PSCAD/EMTDC Power Delivery. IEEE Trans. Power Deliv. 2002, 17, 266–272. [Google Scholar] [CrossRef]
- McCarthy, R.W.; Ogden, J.M.; Sperling, D. Assessing reliability in energy supply systems. Energy Policy 2007, 35, 2151–2162. [Google Scholar] [CrossRef]
- Park, S.-Y.; Park, J.-K. The modeling and analysis of shunt type custom power device. In Proceedings of the 2000 IEEE Power Engineering Society Winter Meeting, Columbus, OH, USA, 28 January–1 February 2001; Volume 1, pp. 186–191. [Google Scholar]
- Pohjenheimo, P.; Lakervi, E. Steady State Modeling of Custom Power Components in Power Distribution Networks. In Proceedings of the 2001 IEEE Power Engineering Society Winter Meeting, Singapore, 23–27 January 2000. [Google Scholar]
- Celin, R.; Kmetric, D. A wet-steam pipeline fracture. Mater. Technol. 2007, 41, 151–154. [Google Scholar]
- Balyts’kyi, O.I.; Ripei, I.V.; Protsakh, K.A. Reliability of steam pipelines of thermal power plants in the course of long-term operation. Mater. Sci. 2006, 42, 421–425. [Google Scholar] [CrossRef]
- Rudzinskas, V.; Valiulis, A.V.; Chernashejus, O. Operation reliability of bent elbows of steam pipelines. In Mechatronic Systems and Materials, Solid State Phenomena Book Series, Proceedings of the 1st International Conference on Mechatronic Systems and Materials, Vilnius, 20–23 October 2006; Trans Tech Publications Ltd.: Baech, Switzerland, 2006; Volume 113, pp. 577–582. [Google Scholar]
- Burzić, Z.; Gačo, D.; Burzić, M.; Prokić-Cvetković, R. The effect of operating conditions on service behaviour of high alloyed steel X20. In Proceedings of the 12th International Research/Expert Conference: Trends in the Development of Machinery and Associated Technology, Istanbul, Turkey, 26–30 August 2008; pp. 1365–1368. [Google Scholar]
- Electricity—Today’s Technologies—Tomorrow’s Alternatives; Electric Power Research Institute: Palo Alto, CA, USA, 1987.
- Agenda 2030, Sustainability Development Program for UE. Available online: https://www.gov.pl/web/rozwoj/agenda-2030 (accessed on 20 May 2020).
- Polish Information and Foreign Investment Agency. Energy Sector in Poland. Available online: www.paiz.gov.pl (accessed on 20 April 2020).
- Viswanathan, R. Damage Mechanisms and Life Assessment of High Temperature Components, 3rd ed.; ASM International: Metals Park, OH, USA, 1989; Available online: https://books.google.pl/books?hl=pl&lr=&id=psNWNNXB02EC&oi=fnd&pg=PA1&dq=Demage+of+steam+pipies&ots=0UFs_rUUUf&sig=AtPjfJGJVX9HEe88J7JhIVHG2xM&redir_esc=y#v=onepage&q=Demage%20of%20steam%20pipies&f=false (accessed on 20 March 2020).
- Clouston, J.; Sundaram, A.; Woodley, N.H. Eletricity Today, Custom Power: The Utility Solution to Distribution Power Quality. In Proceedings of the CIRED 13 International Conference on Electricity Distribution, Brussels, Belgium, 20 May 1995. [Google Scholar]
- Shankran, C. Power Quality; CRC Press: Boca Raton, FL, USA, 2001. [Google Scholar]
- Ghosh, A.; Ledwich, G. Power Quality Enhancement Using Custom Power Devices; Kluwer Acadamic Publishers: New York, NY, USA, 2002; pp. 114–116. [Google Scholar]
- Hingorani, N.G. Overview of Custom Power Applications. In Proceedings of the Summer Meeting Panel Session on Application of Custom Power Devices for Enhanced Power Quality; IEEE/PES: Piscataway, NJ, USA, 1998. [Google Scholar]
- He, C.; Li, F. Static Transfer Switch (STS) Model in EMTP Works RV. In Proceedings of the Canadian Conference on Electrical and Computer Engineering 2004 (CCECE 2004), Niagara Falls, ON, Canada, 2–5 May 2004; pp. 111–116. [Google Scholar]
- Rusin, A.; Bieniek, M. Maintenance planning of power plant elements based on avoided risk value. Energy 2017, 134, 672–680. [Google Scholar] [CrossRef]
- Zhong, W.; Feng, H.; Wang, X.; Wu, D.; Xue, M. Online hydraulic calculation and operation optimization steam heating networks considering heat dissipation in pipes. Energy 2015, 87, 566–577. [Google Scholar] [CrossRef]
- Dong, Z.Y.; Saha, T. Power Quality & Equipment Protection. ELEC4301 2004, 1–34. [Google Scholar] [CrossRef]
- Dittmann, P. Forecasting in an Enterprise; Oficyna Ekon.: Cracow, Poland, 2004. [Google Scholar]
- Zeliaś, A. Statistical Methods; PWE Publisher: Warsaw, Poland, 2000. [Google Scholar]
- Goryl, A.; Jędrzejczyk, A.; Kukuła, K.; Osiewalski, J.; Walkosz, A. Introduction to Econometrics in Examples and Problems; PWN Publisher: Warsaw, Poland, 2007. [Google Scholar]
- De Smith, M.J. Statistical Analysis Handbook; The Winchelsea Press, Drumlin Security Ltd.: Edinburgh, UK, 2018. [Google Scholar]
- Altman, D.G. Practical Statistics for Medical Research; Chapman and Hall: London, UK, 1991. [Google Scholar]
- Stanisz, A. An Easy Course of Statistics Using STATISTICA PL on Examples from Medicine; StatSoft Publisher: Cracow, Poland, 2006. [Google Scholar]
- Wieczorkowska, G. Statistics; Scholar Publisher: Warsaw, Poland, 2003. [Google Scholar]
- Snarska, A. Statistics, Econometrics, Forecasting—Exercises with Excel; Placet Publisher: Warsaw, Poland, 2005. [Google Scholar]
- Aczel, A.D. Statistics in Management; Polish Scientific Publishers PWN: Warsaw, Poland, 2000. [Google Scholar]
- Hong, Y. Probability and Statistics for Economists; World Scientific: Singapore, 2017. [Google Scholar]
- Keller, G. Statistics for Management and Economics; Cenage Learning: Boston, MA, USA, 2017. [Google Scholar]
- Peck, R.; Short, T. Statistics—Learning from Data; Cengage: Boston, MA, USA, 2018. [Google Scholar]
- Hayhurst, D.R. The Role of Creep Damage in Structural Mechanics. Engineering Approaches to High Temperature; Wilshire, B., Owen, D.R.J., Eds.; Pineridge Press: Swansea, UK, 1983; pp. 85–176. [Google Scholar]
- Hyde, T.H.; Sun, W.; Becker, A. Effects of End Loading on the Creep Failure Behaviour of CrMoV Welds in Main Steam Pipelines—Damage & Fracture Mechanics VI.; Brebbia, C.A., Selvadurai, A.P.S., Eds.; WIT Press: Southampton, UK, 2000; pp. 415–424. [Google Scholar]
- Pearson, J.M.; Anderson, R.W. Reliability and durability from large heat recovery steam generators. Proc. Inst. Mech. Eng. Part A 1999, 213, 151–168. [Google Scholar] [CrossRef]
- Chicherin, S.V. New approach to determination of corrosion damage degree of pipeline system elements. Bull. Tomsk Polytech. Univ.—GEO Assets Eng. 2016, 327, 110–115. [Google Scholar]
- Gofman, Y.M. Estimation of the reliability of testing welded joints of steam pipelines of thermal power plants. Russ. J. Nondestruct. Test. 2003, 39, 230–231. [Google Scholar] [CrossRef]
- Rogalev, A.; Kocherova, A.; Komarov, I.; Garanin, I.; Kurdiukova, G. Development of new flow stabilizers for increasing the reliability and efficiency of power equipment. WIT Trans. Ecol. Environ. 2015, 195, 475–484. [Google Scholar]
- Zaryankin, A.; Rogalev, N.; Rogalev, A.; Kocherova, A.; Strielkowski, W. Line summary of approaches for improving vibrational reliability of thermomechanical equipment and its interconnecting pipelines at thermal power plant. Contemp. Eng. Sci. 2014, 7, 1793–1806. [Google Scholar] [CrossRef][Green Version]
- Hu, X.Y.; Jia, J.H.; Wang, N.; Xia, X.M.; Wang, Z.D.; Tu, S.T. Design and test of an extensometer for strain monitoring of high temperature pipelines. J. Press. Vessel Technol. Trans. ASME 2012, 134, 044501. [Google Scholar] [CrossRef]
© 2020 by the authors. Licensee MDPI, Basel, Switzerland. This article is an open access article distributed under the terms and conditions of the Creative Commons Attribution (CC BY) license (http://creativecommons.org/licenses/by/4.0/).