Case Report

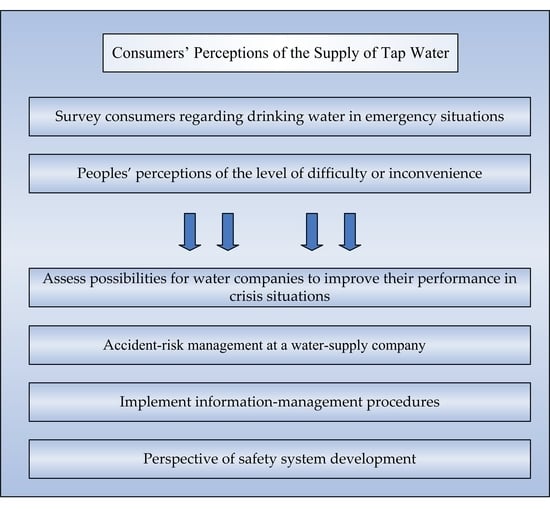
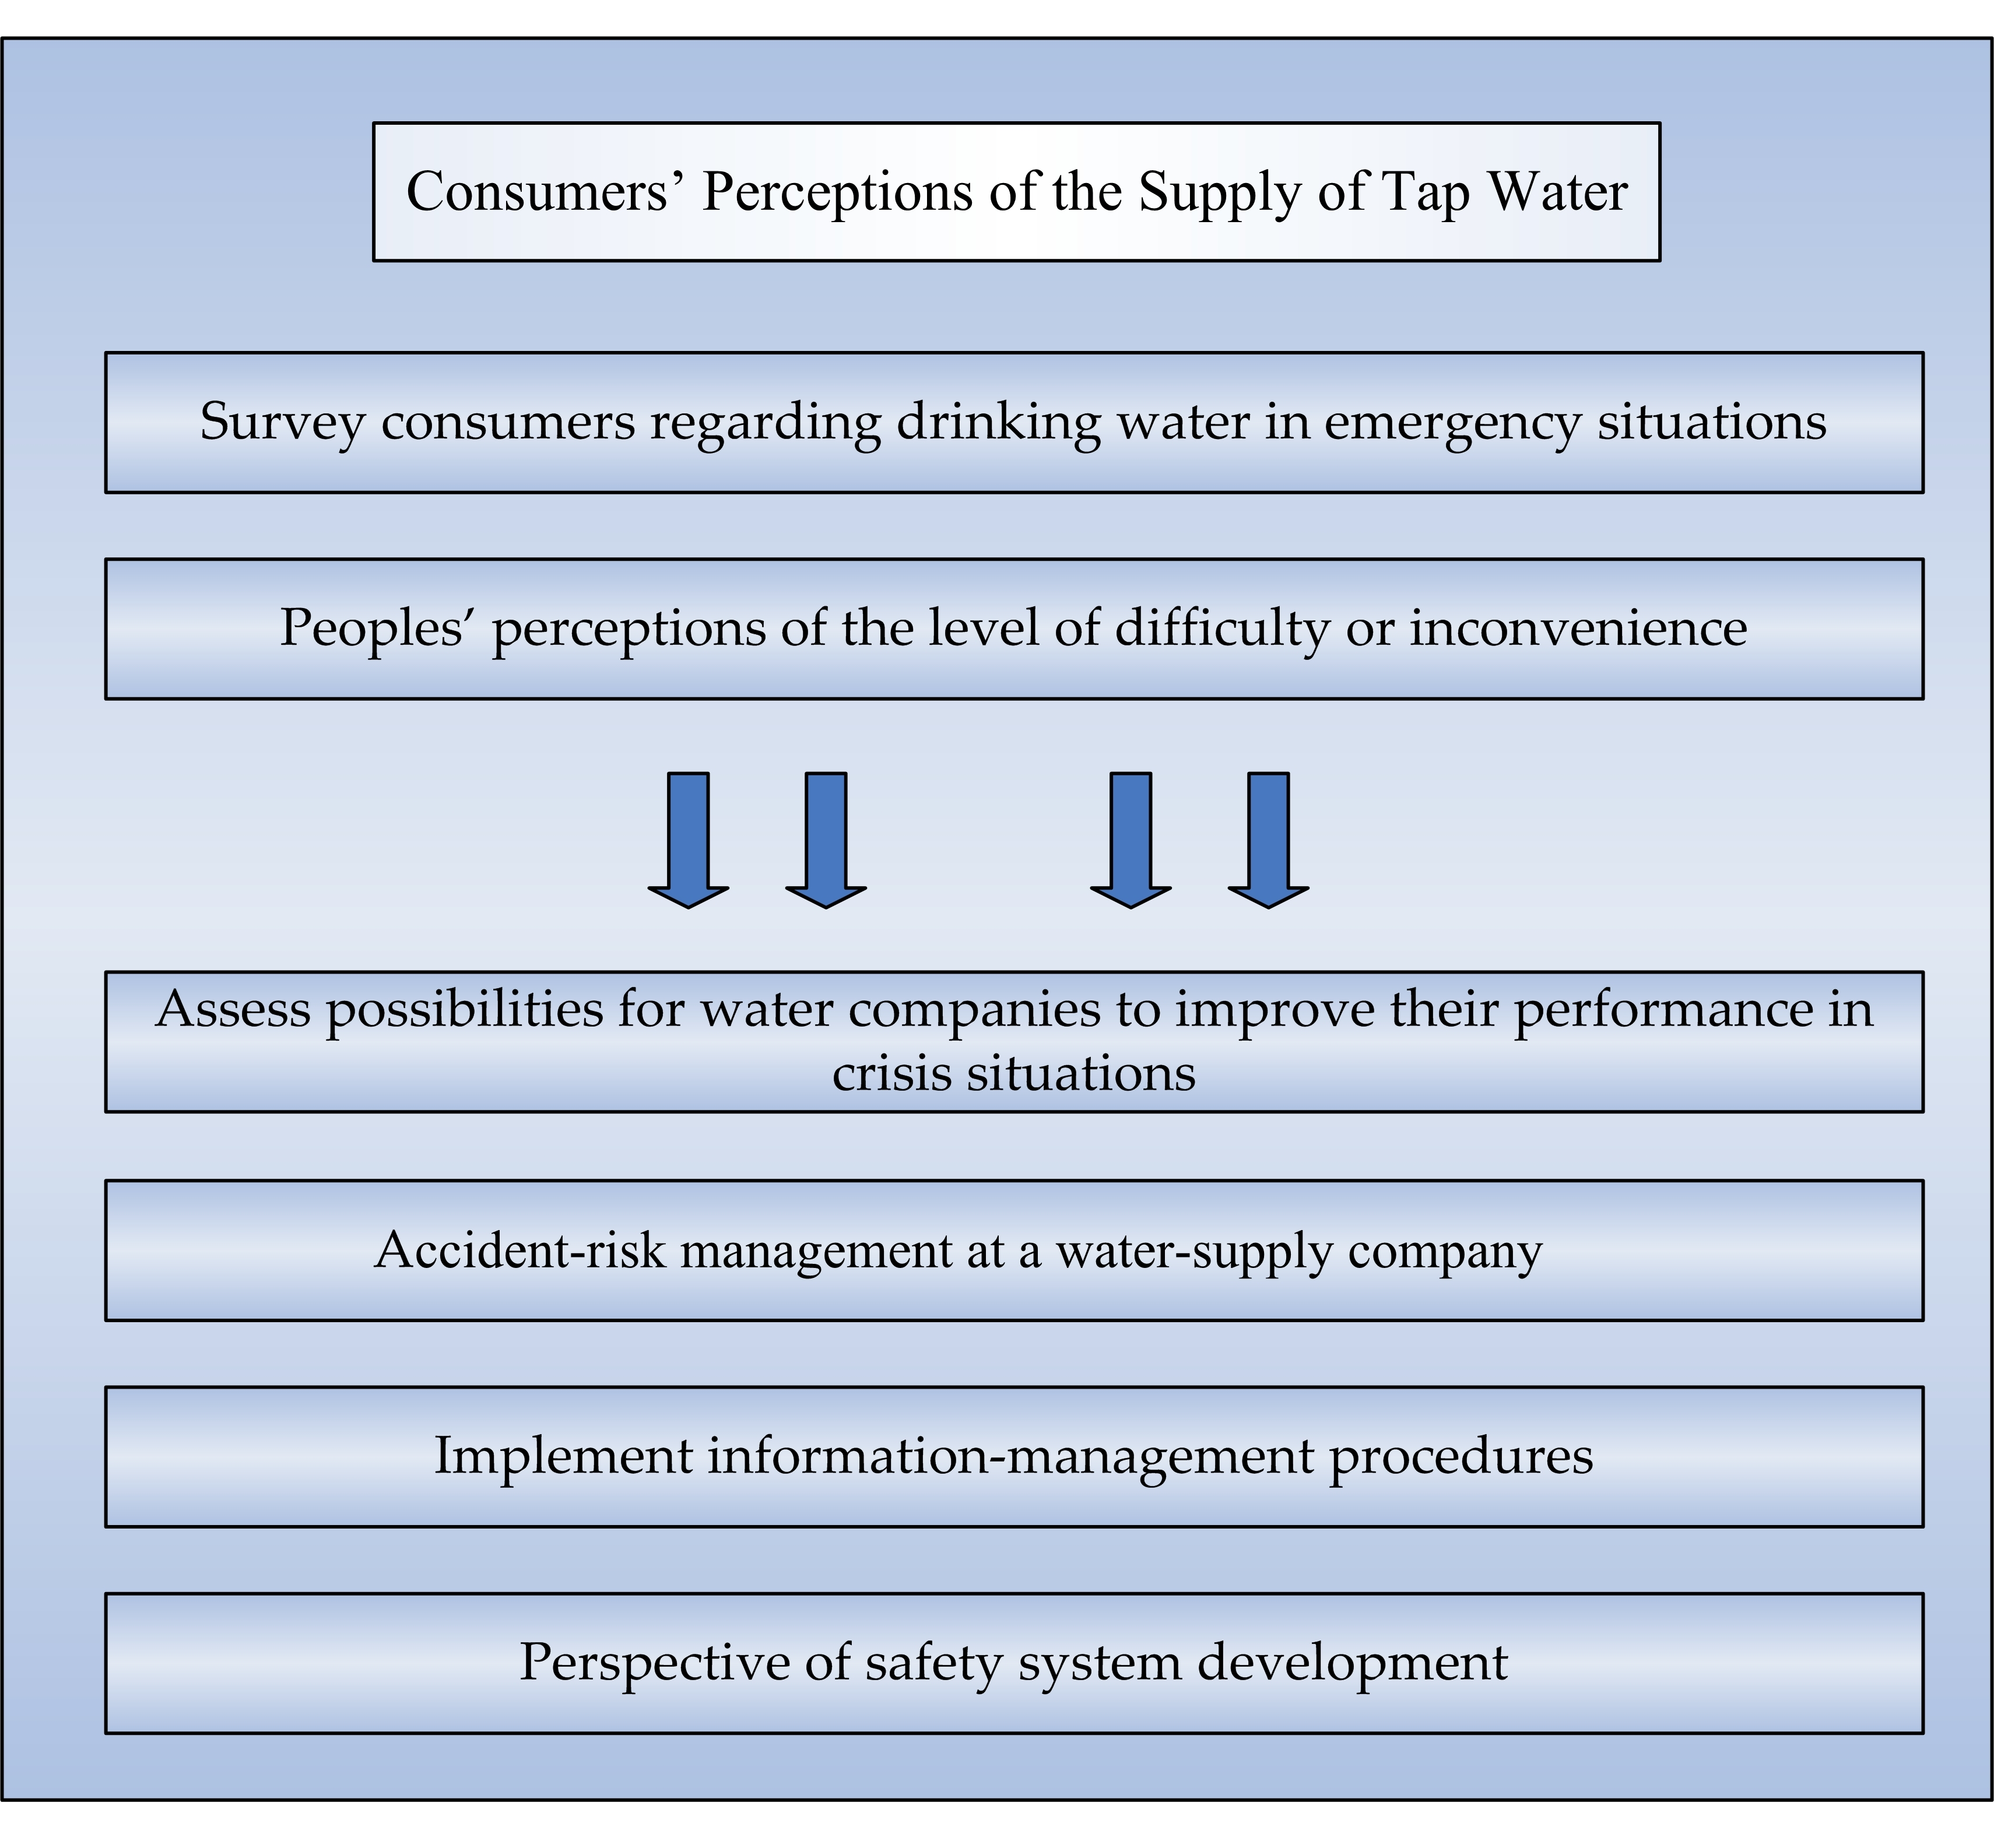
Consumers’ Perceptions of the Supply of Tap Water in Crisis Situations

by
Katarzyna Pietrucha-Urbanik
* and
Janusz R. Rak
Department of Water Supply and Sewerage Systems, Faculty of Civil, Environmental Engineering and Architecture, Rzeszow University of Technology, 35-959 Rzeszow, Poland
*
Author to whom correspondence should be addressed.
Energies 2020, 13(14), 3617; https://doi.org/10.3390/en13143617
Submission received: 1 June 2020 / Revised: 8 July 2020 / Accepted: 12 July 2020 / Published: 14 July 2020
(This article belongs to the Special Issue A New Water-Energy Nexus: The Transition to Sustainable Energy)

Abstract

:
This paper first presents the results of polling on the subject of potable water in crisis situations, with respondents from south-eastern Poland’s Subcarpathian region asked for their opinions on the level of nuisance associated with water supply interruptions and water quality, levels of consumption and water companies’ quality of service. Among the respondents 53% regard the quality of the water they receive as satisfactory, while a quarter see it as only average. However, respondents are relatively satisfied with the corporate response when supplies are interrupted, as methods and means of notification are judged effective by 60%. Continuing with work to assess possibilities for water companies to improve their performance in crisis situations, the present study generates an Analytical Hierarchy Process allowing recipients to determine importance criteria where quality of service is concerned. This could facilitate management by water companies, providing for centralised control and comparison that help secure services of appropriate quality. The process can also help protect different groups of recipients, as safety is evaluated through analysis of functioning, and of failures and losses.

Graphical Abstract

1. Introduction

Key conditioning of an agglomeration of people’s continued functioning in times of crisis entails the safeguarding of the supply of water available for consumption via the public system [1]. In line with norms on this security of the drinking-water supply, as well as guidelines relating to risk and crisis management [2], we can consider a crisis to be an event or situation with the potential to affect a supplier of drinking water so seriously that other organisational structures may be required, and possibly unusual means of operation in response to the emergency. The occurrence (and likely accumulation) of undesirable events is what ultimately threatens a system’s autonomous functioning; or is at best unhelpful to its development [3,4]. In this context, it is worth underlining the human right to water as the right of everyone to sufficient, safe, acceptable and physically accessible and affordable water for personal and domestic uses [5]. This can be achieved if financial resources are allocated, as well as help with capacity-building, and transfers of technology to countries (in particular in the developing world), with the key aim of safe, clean, accessible and affordable drinking water and sanitation being made available to all [6]. It should be remembered that guarantees regarding water supply apply not only apply to developing countries, but also to developed countries. The commercialisation and privatisation of water management have ensured that those able to pay find water readily affordable, just as many people simply cannot afford it, and therefore lack access. Yet water should not be treated as a commodity, given the truly fundamental human right to it, and consequent trend towards public participation of users. Good examples here might be the Blue Communities in Canada, as well as city-council remunicipalisation of water management in cities like Paris, London, etc.
In general, Polish policy relating to security of the water supply falls within the so-called management of critical infrastructure pursued by the state (or a region or urban agglomeration), in line with definitions set out in the Crisis Management Act [7]. As improper functioning of a water-supply system may pose a threat to human health or life, such systems must be characterised by a high level of reliability and safety. Steps in the process to ensure the protection of critical infrastructure include risk assessment, and a prioritisation of activity in line with the latter’s outcomes. This leaves the subject matter of this paper as a crucial one, if proper functioning of the water-supply system is to be assured.
Legal regulations regarding safety of the water supply for consumers revolve around the Drinking Water Directive (Council Directive 98/83/EC of 3 November 1998 on the quality of water intended for human consumption), whose latest amendments include Commission Directive (EU) 2015/1787 of 6 October 2015 [8]. In turn, in 2004, the World Health Organization (WHO) published its guidelines for the application of water safety plans, which proposed analysis of the chain of water supply intended for human consumption [9]. Returning to the European Union, its recommendations are that Member States should implement standards as regards security of the supply of drinking water that have regard to risk and crisis management via the EN 15975-1,-2 standard [10,11]. The Water Framework Directive (WFD) requires Member States to engage all interested parties in its implementation [12]. For this to happen, it is important that the way local communities live in their catchments and use water should be understood (Article 14 of the WFD). And in this regard there is always a need to recall that water is not a commercial product like any other, but rather an inherited good. Likewise, water supply is a service of general interest.
Guidelines utilities use in the development of emergency plans for water supply see crisis situations as those associated with increased doses of disinfectant, and with alternative technologies mobilised as treatment plants may be bypassed, with delivery potentially taking place by tanker or barrel. In this context, the organisation seeks to supply the populace with a certain minimum amount of water over several days, with one person obtaining 7.5 dm3 daily, or 15 dm3 where a period of several weeks’ duration is involved. Public utilities thus ensure that 50% of normal demand is achieved, while industrial plants receive assurances permitting operations, and water-supply for their own purposes at a level between 5% and 15% of typical daily output.
This paper presents heuristics used by consumers of tap water, i.e. simplified ways of formulating opinions as decisions are made regarding the level of comfort (reliability, safety) charcaterising supply. The behavioural approach takes account of the errors consumers make as they express opinions and preferences. The results of empirical surveys offer insight into aspects of consumer behaviour where supplies of water supply are concerned. Inclinations articulated in surveys should be examined currently, to ensure that a new quality may be conferred upon the services water companies offer. Consumer opinions can be formulated in the following conditions: certainty, if each action invariably leads to a specific goal; and risk, if each action leads to a result from a specific one set. A probability of occurrence can be estimated for each of these. As Bernstein [13] notes the perception of crisis risk by consumers of water differing both qualitatively and quantitatively, key issues must be survey-respondents’ assessment of the nuisance that interruptions to the water supply actually represent for them, as well as knowledge of the causes of breaks in water supply, and the discomforts and losses these cause [14,15]. Against that background, crisis needs to be seen as having a variety of common meanings—as the probability of undesirable event, health risk and maximum assumed loss. That in turn means that a number of parameters may be used in its definition [16]. Within the framework of the developing science of security, specialised crisis-assessment techniques have taken shape, involving both quantitative and qualitative methods [17]. Crisis to drinking-water quality include those posed by pollution with hazardous substances that threaten life, health or the environment [18,19]. The life-threatening crisis associated with water consumption is mostly a matter of short exposure times. Health risk partly overlaps with the other two risk areas. Health complications may occur where there is consumption of water failing to meet normative requirements (e.g. in time of flood). Environmental crisis risk is the kind least documented from a medical point of view, and is associated with more subtle and longlasting degradation of the aquatic environment in line with civilisational progress. Crisis threats are also imposed by natural disasters, major technical failures, social unrest and terrorist attacks.
A company supplying water is to develop theoretical solutions that shape and control supply, as well as the service processes engaged in vis-à-vis victims of crises. The priority is for the water supply to reach the affected population at the right time, in the right place, in the right form and in the necessary quantities and quality. Water supply in a crisis situation consists in helping people affected by the consumption of contaminated water, creating conditions for survival in situations where a public water supply is lacking, collecting and protecting water stocks, and distributing the latter in a regulated manner [20,21].
Surveys represent a basic source of information for water companies, and these can be carried out using the various methods, techniques and research tools described in publications, e.g., [22,23,24]. Increasingly, utilities engage in this type of research because, thanks to surveys, real insight into water-supply systems can be gained, with the input then utilised to improve quality of service [25]. A survey may form part of the water safety plan (WSP) that synthesises all important information on the construction of water-supply systems, and the principles by which they operate and are maintained [26,27]. The result is a positive impact on proper functioning – in regard to consumer safety in particular [9,28,29]. Likewise, according to the U.S. Centers for Disease Control and Prevention [30], surveys can be helpful tools because they facilitate evaluation of customer satisfaction and allow for better gauging of opinions. Surveys can also provide information on community concerns, with perceptions of alternative sources supplied, and therefore available to refer back to, should a crisis situation arise [31]. Specifically, collected information can prove useful as management procedures under a WSP are made ready. Surveys offer insights into recipients’ current and future needs, allowing requirements to be met and expectations anticipated and exceeded. Improvements are achievable thanks to continuous analysis and assessment of processes, as well as the achievement of goals set through the deployment of all sources [32,33], e.g., by measuring customer satisfaction or complaints that they lodge when supplies are intermittent [33,34]. A key issue relating to water supply in crisis situations is risk, which the principles of auditing must also perceive as possible opportunity, and thus success (revenue); as well as threat and failure [35,36,37,38,39,40].
The concept underpinning this paper was put in place before the emergence of the pandemic involving the SARS-CoV-2 coronavirus. At present, the Polish government provides additional permissions, i.a. for specific employers responsible for elements of critical infrastructure. In the event of an epidemic threat or epidemic status, they may engage in specific activity under Labour Law allowing for continuous operation. The introduction of a state of epidemic threat in Poland saw water companies informed that, in justified cases, entrepreneurs will be able to take advantage of deferred payment for thermal energy resulting from invoices issued, or a redistribution of payments into convenient instalments, taking into account real possibilities for liabilities to a Company to be repaid. Moreover, there may be postponement of payments arising from invoices issued from 1 March 2020 to the end of the month in which the epidemic is finally cancelled.
The WHO assumed that remedies relating to coronavirus include risk communication on the matter of system preparedness by which public perceptions can be listened to with a view to disinformation being prevented [41]. Thus, in the case of this epidemiological threat, additional procedures have been put in place, with a likelihood that these will gain the acceptance of consumers.
An important element of accident-risk management at a water-supply company should be the analysis of consumers’ perceptions regarding the supply of tap water. On this basis, water utilities can implement information-management procedures. The results of surveys carried out in Poland’s Subcarpathian province-region that are presented here represent a continuation of research already detailed in [42]. They were analysed using Statsoft software [43], as supported by Super Decision Program 2.10.0 [44].
The aim was to survey consumers regarding drinking water in emergency situations. Users’ satisfaction with the quality and quantity of supplied water was examined at the same time, and checks made on peoples’ perceptions of the level of difficulty or inconvenience actually constituted by interruptions in water delivery.

2. Materials and Methods

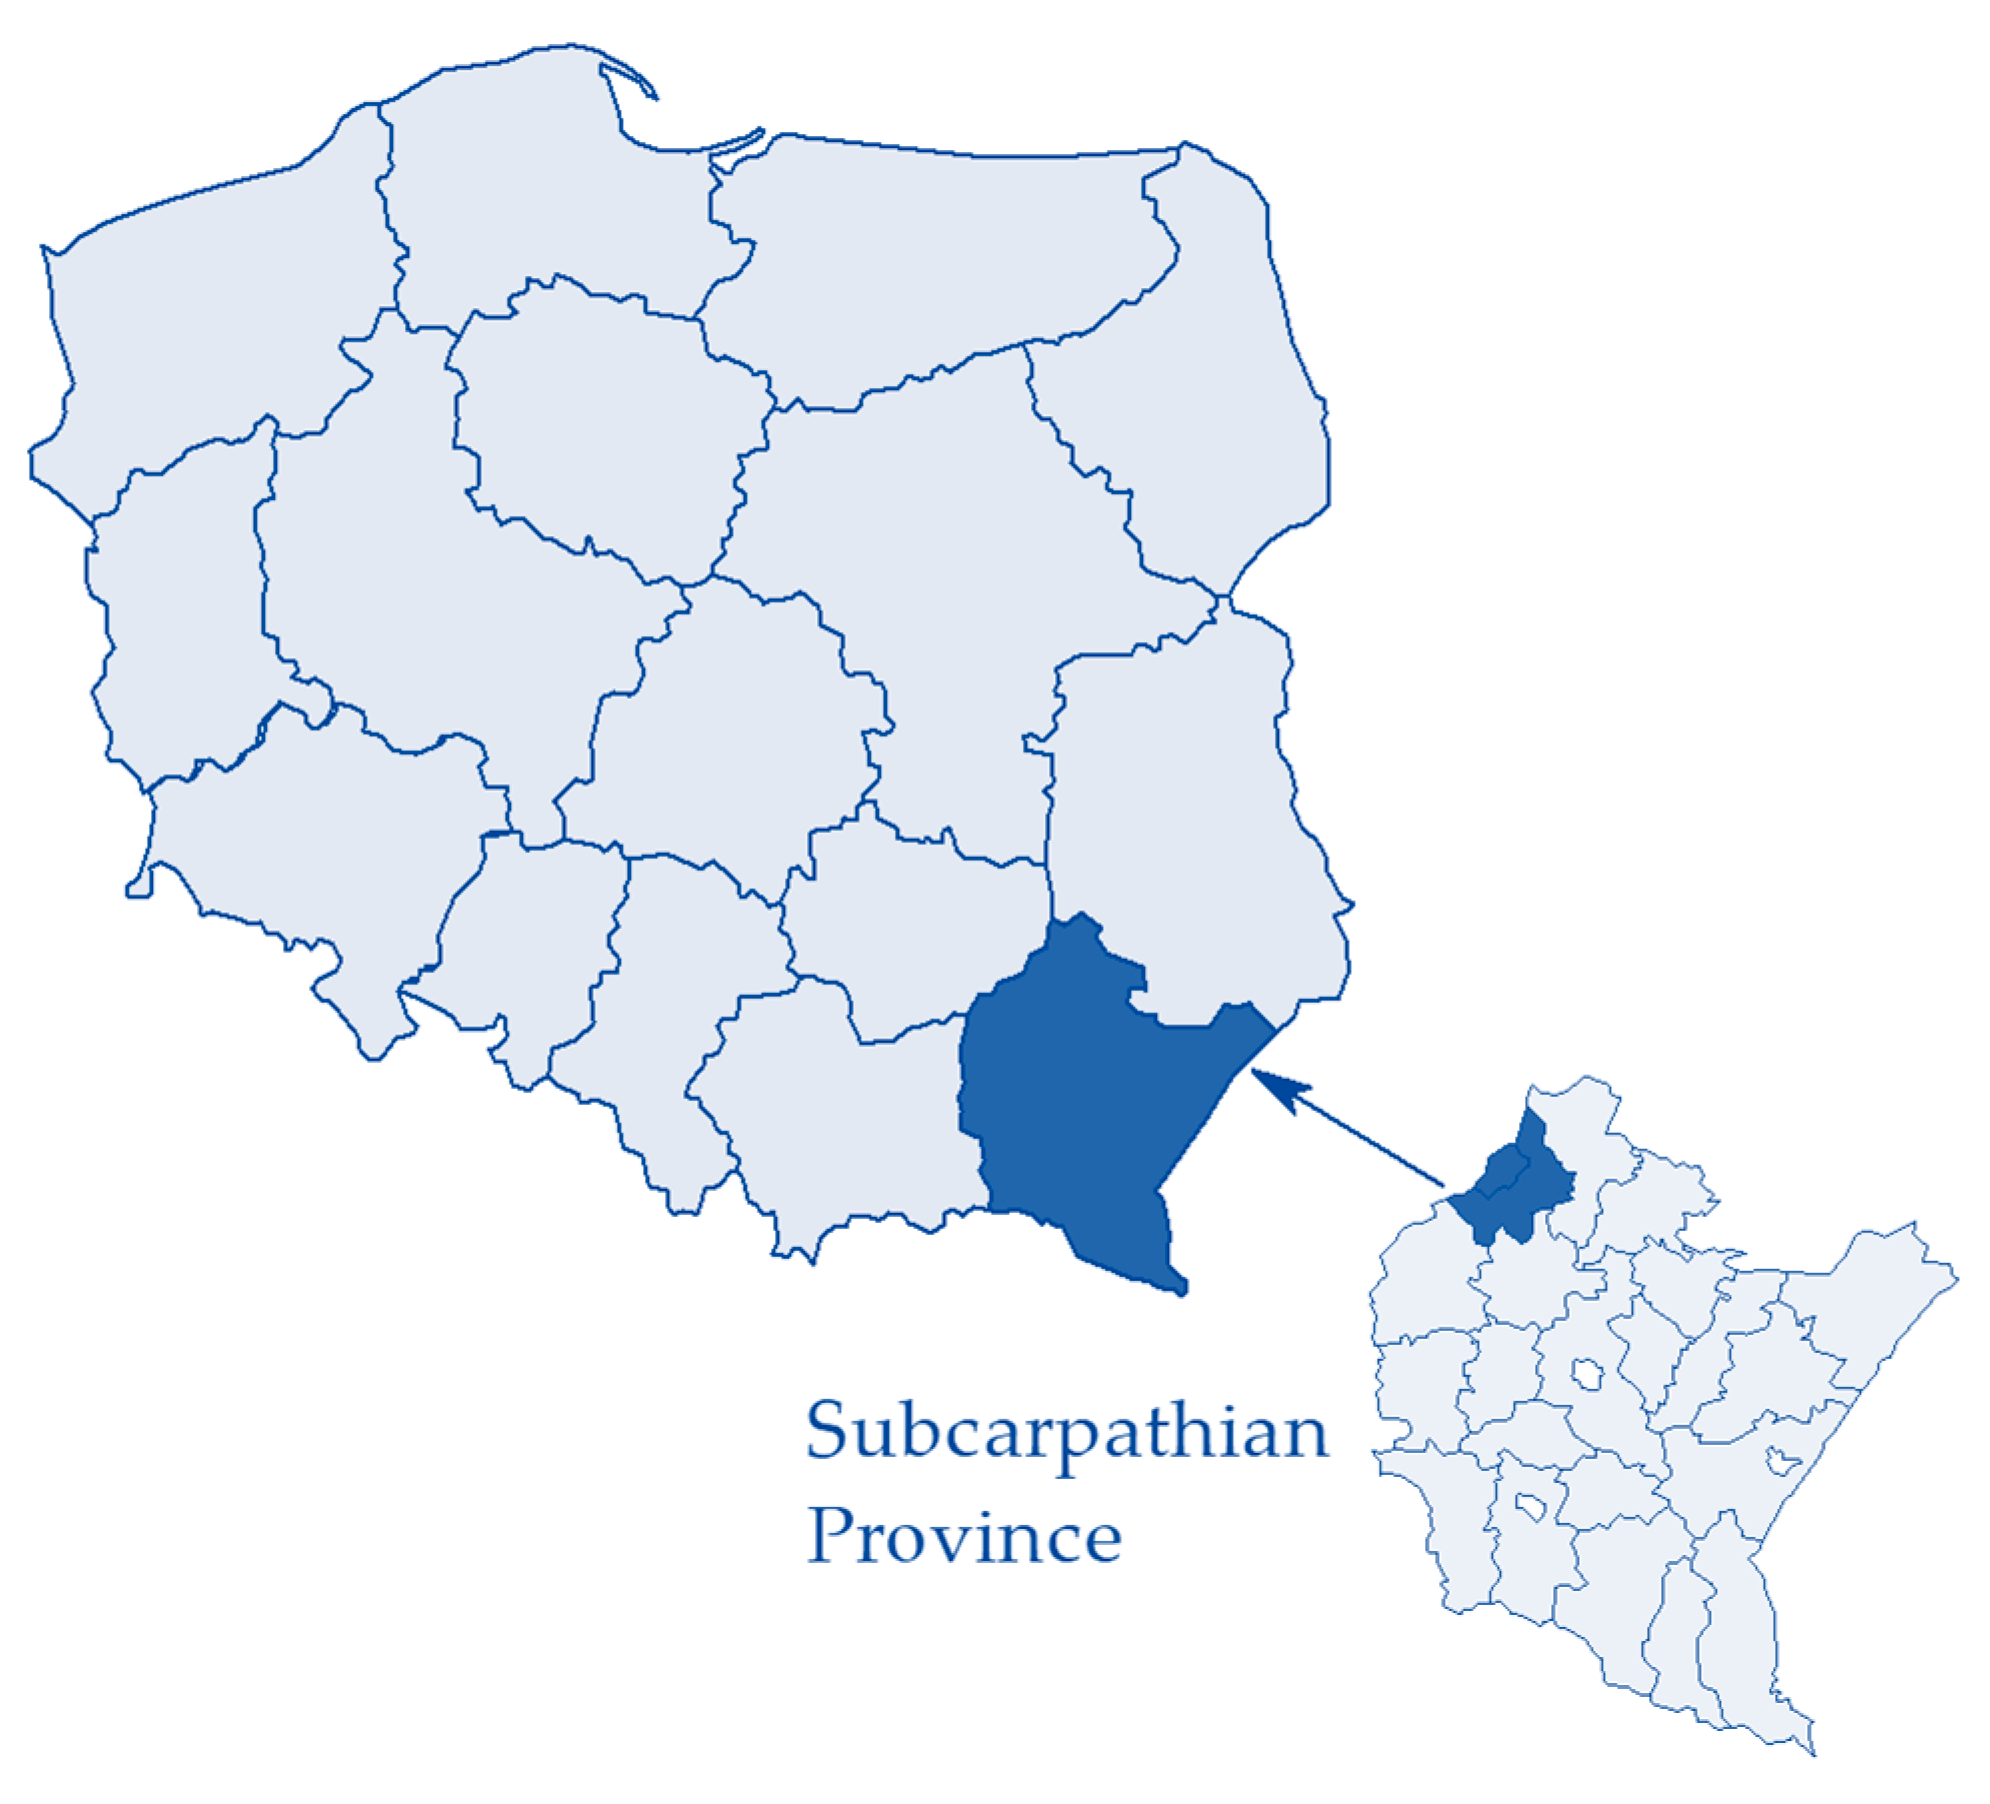
2.1. Description of Study Area

The identified water-supply system is located in Poland’s Subcarpathian province-region, and relates to a supplied city located on the right bank of the Vistula and covering 127 km2 around 50°02′N and 22°00’E (Figure 1). The city under study comprises some 180,000 inhabitants supplied with water. It has 1546 inhabitant/km2 and is at 197–384 m above sea level. This area has hot summers, relatively small amounts of rainfall (ca. 510 mm) and winters that are not especially severe.

2.2. Characteristics of the Research Object

By reference to allowable error, a sample size representative of this population of n = 215 was arrived at, with these people being surveyed regarding the supply of tap water during crisis situations. In determining the required number of participants for the study, a 95% confidence level was assumed. The fraction size adopted was 0.5.
Women and men were represented equally in the sample; while 55% of those surveyed were in technical professions and 45% in non-technical ones. Age structure was even; with people educated to primary, secondary and tertiary levels accounting respectively for 3%, 49% and 48%. The division by place of residence was in turn of multi-storey blocks (55%), tenement houses (13%), and single-family houses (32%). A rule of the survey was that respondents might indicate more than one answer [45].
The city is supplied with water from the river using a boundary-chamber water intake of capacity 90,000 m3/d. The water is treated at modernised water treatment plants, and fulfills the quality requirements for water intended for human consumption. The water company also has an emergency deep-lying intake of capacity of 260 m3/d, as well as a local water intake of capacity 450 m3/d. Average water consumption per citizen and day is about 0.150 m3. Water sales are divided into three groups: other purposes, industrial and household. Other purposes include administrative points, healthcare units, public institutions, commercial establishments and service companies. The largest amount of water is used by households, on average 74% of total consumption. Water sold to industry accounts for 9% on average, leaving 17% as the share of total water consumption taken by other customers. The total length of the water-supply network is approx. 890 km, with 50 km of main network, distributional pipes extending for around 470 km, and 350 km of water connections. The main network is made of cast iron and steel pipes. Distribution pipes are made of cast iron, galvanised steel, polyethylene (PE) and polyvinyl chloride (PVC); and water connections are mainly made of galvanised steel, cast iron PE and PVC. The water-supply network consists of four mains transporting treated water from a second pumping station. 80% of the network operates in a ring system, in which the supply system cooperates with two sets of tanks located in the eastern and western parts. The region analysed can in some sense be seen as typical, being supplied with water by a single enterprise whose status is as an independent commercial-law company, albeit one in which all the shares are held by the city.
In the last 15 years there have been 6 crisis situations affecting a maximum of 17% of the entire group of recipients, and lasting from 8 h to 36 h. The most likely crises here would relate to one kind of natural disaster or another, or else to accidental contamination of the network. The development of resilience by way of new investment is here a matter of own financing by the company, but also of funding from central, provincial, municipal and foreign budgets, as well as ecological funds, domestic loans and credits, and so on. As has been noted, local authorities play the dominant role in the company’s ownership structure. In this context, possible profits constitute a specific type of tax, thanks to a dividend payment mechanism. This circumstance tends to reduce the likelihood of privatisation taking place.

2.3. Proposal to Implement an Analytical Hierarchy Process in Relation to the Quality of the Water-Supply Service

To assess importance criteria among recipients where the level of quality of the water-supply service was concerned, use was made of the method developed by Saaty [46]—of comparing AHP (Analytical Hierarchy Process) criteria, with a 1–9 preference rating scale applied [46,47]. AHP entails comparison of pairs of selected features, with relative preferences assigned to them. Pairwise comparisons of criteria allow for an assessment of how much better one criterion is than another, in both qualitative and quantitative terms.
The following scale is applied in the pairwise comparison of selected elements, with relative preference expressed in words, along with a definition and reference to the degree of importance [46]:
  • equal importance—both activities contribute equally to the achievement of the objective (1)
  • moderate dominance—one element is slightly more significant than the other (3)
  • strong dominance—clear dominance of one element over the other (5)
  • strong plus—very major dominance of one element over the other (7)
  • extreme dominance—absolutely greater importance of one element over the other (9)
  • intermediate values—middle values of the scale to express compromise opinions (2), (4), (6), (8)
  • reciprocals of the above assessment—If element i receives a rating on the above scale, which is a comparison with element j, then j has the inverse value (1/2)–(1/9)
To compare pairs of individual criteria, a square matrix A = [aij] of paired comparisons with dimensions n × n was created, in which n(n − 1)/2 of these comparisons are made. A characteristic feature of this matrix is the diagonal, which has the property of aji = 1/aij. There are inverse pairwise comparisons below the main diagonal of the matrix, with the latter taking the following form [46]:
A = [ 1   a 12 a 1 n 1   a 12 1 a 2 n . . . . . . . . . . . . 1   a 1 n 1   a 2 n 1 ]
The inverse of pairwise comparisons occurs, so the i-th row is the inverse of the i-th column, with this fact capable of being expressed in writing as:
A w = n w
One measure of compliance comparisons reflecting preferences in terms of proportionality is the principal eigenvalue of the matrix λmax:
λ max = 1 w i j n a i j w j ,
Pairwise comparisons are consistent if λmax is close to n.
Deviation from compliance is described by the Consistency Index (CI):
C I = λ max n n 1 ,
The next indicator of the consistency of pairwise comparisons is the Consistency Ratio (CR), which determines how incompatible with each other comparisons of the importance of characteristics are, as determined using the formula:
C R = C I R I ,
where RI is a Random Index of non-compliance according to the matrix dimensions. RI values were as estimated by Saaty [46].
In assessing importance criteria relating to quality of service in water supply (in the view of a water recipient), AHP results are set against the experience and knowledge of experts to form a basis for expert opinions. Indeed, our preparation of categories and subcategories of criteria involved cooperation with designers, recipients and operators of the water-distribution network. The key variables were also based on the relevant literature [8,40,42,47,48]. The expert opinion developed then provides an opportunity for the experience of experts to be brought together, such that all the most important factors affecting quality (and safety/security) of a water-supply service are represented.
In the above context, the main identified criteria and sub-criteria were:
  • The organoleptic quality of water (C1)
    Taste attributes (C1.1.)
    Smell attributes (C1.2.)
    Clarity (C1.3.)
  • Customer-friendliness—the quality of services provided by the water company (C2)
    Office service work (C2.1.)
    Readability and comprehensibility of bills (C2.2.)
    Possibility of discounts being negotiated for company non-compliance with water-supply standards (C2.3.)
  • Price per m3 of water (C3)
  • Reliability, i.e., lack of interruptions in supply (C4)
Respondents did not assess criteria relating to water’s physico-chemical or microbiological properties because, under the current regulation with its clear-cut provisions, there is no room for interpretation [8]. In essence, poor water quality understood in this way should always lead to cessation of supply and/or to the public being warned, and notified regarding remedial steps.

3. Results and Discussion

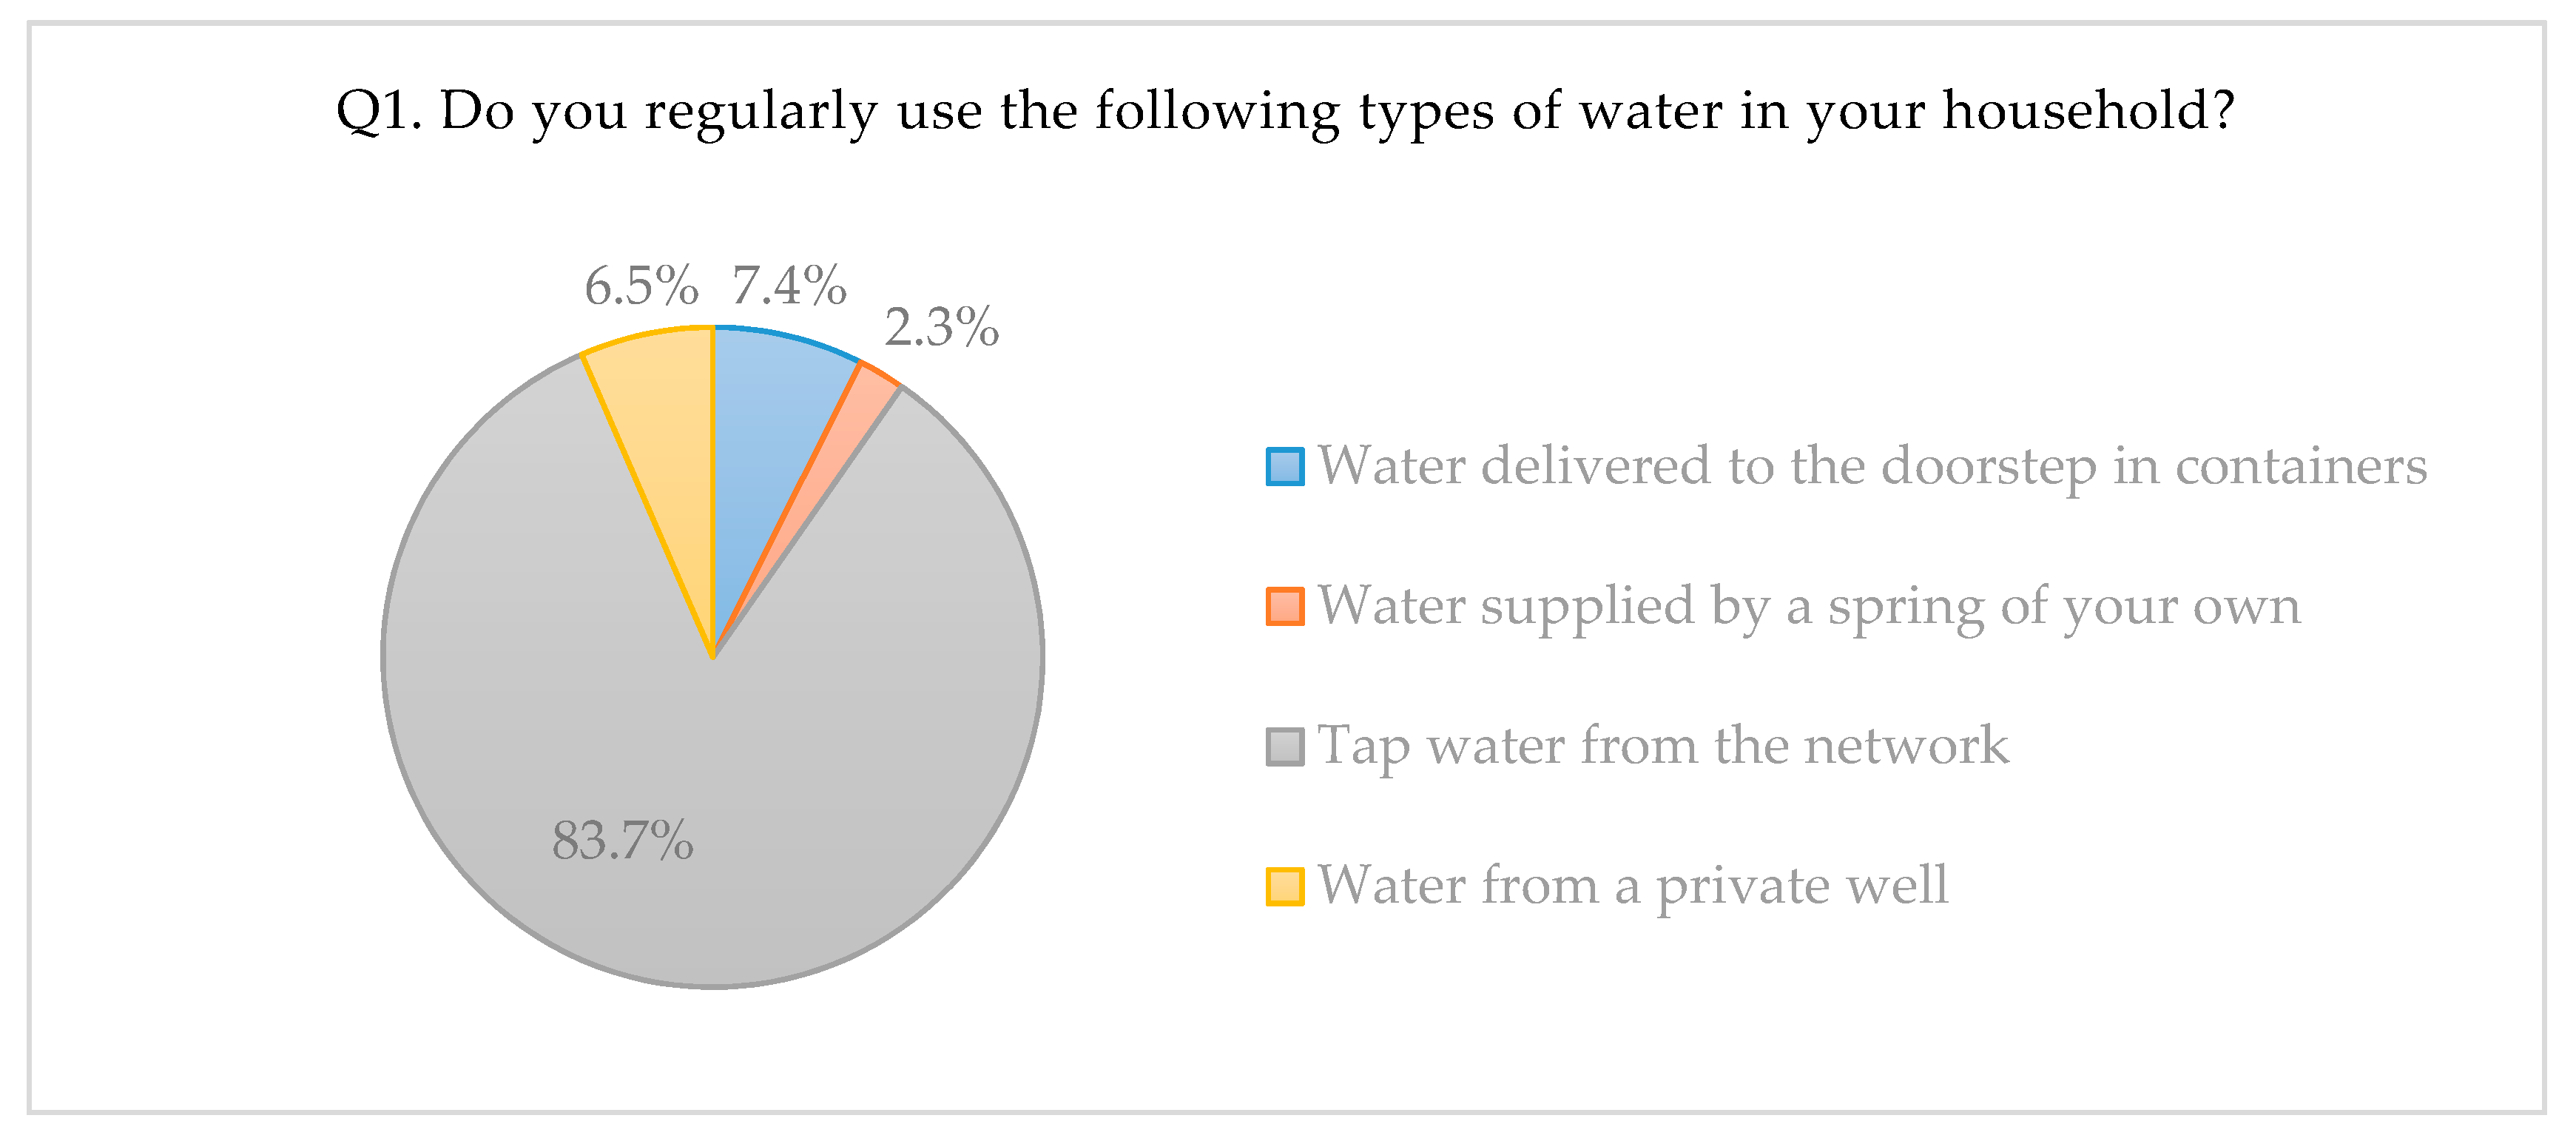
3.1. Consumer Perceptions of the Supply of Tap Water

The results of the survey was presented in the Appendix A. In the first question, related to a normal water-supply situation, respondents were asked about their regularity of use of household water from different sources.
Q1. Do you regularly use the following types of water in your household?
  • Water delivered to the doorstep in containers (19 answers)
  • Water supplied by a spring of your own (six answers)
  • Tap water from the network (211 answers)
  • Water from a private well (16 answers)
Respondents’ answers indicate the household use of water from various sources. About 7.4% use water supplied to the door in containers, while 2.3% avail themselves of supplies from a spring. While private wells were in use among about 6.5% of respondents, 83.7% of them simply used tap water. However, an initial thesis on this basis would be that around 16.5% of respondents were aware of alternative ways of procuring water in the event of a crisis.
Among those using tap water, a further question entailed an assessment of quality on 1–5 scale.
Q2. How do you assess the smell of your drinking water?
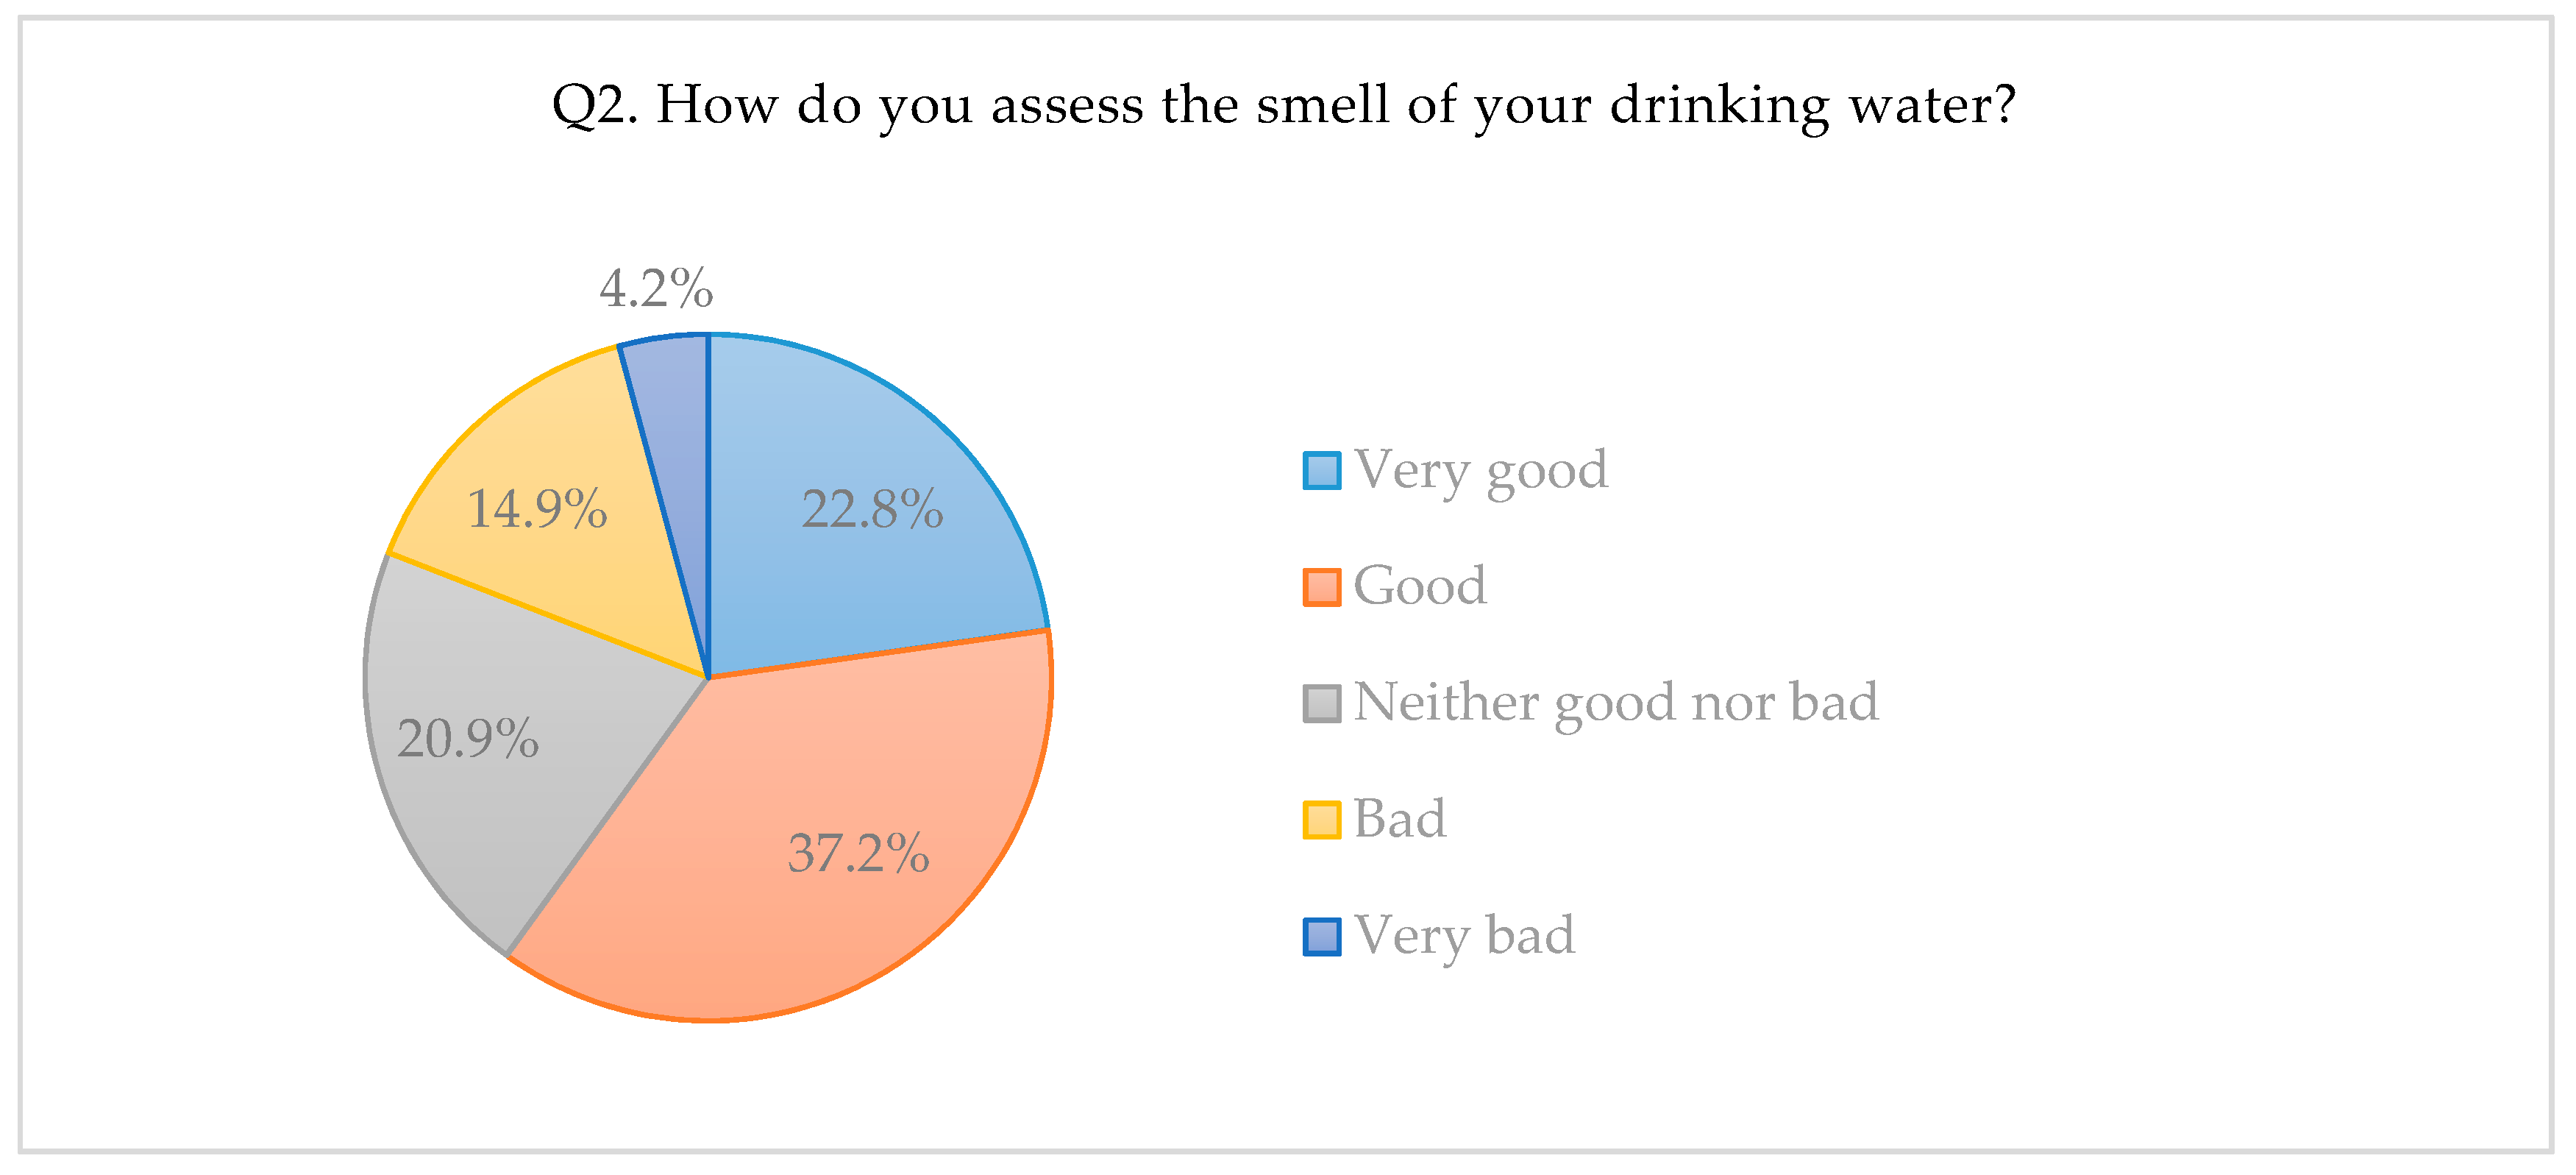
  • Very good (49 answers)
  • Good (80 answers)
  • Neither good nor bad (45 answers)
  • Bad (32 answers)
  • Very bad (nine answers)
Q3. How do you assess the taste of your drinking water?
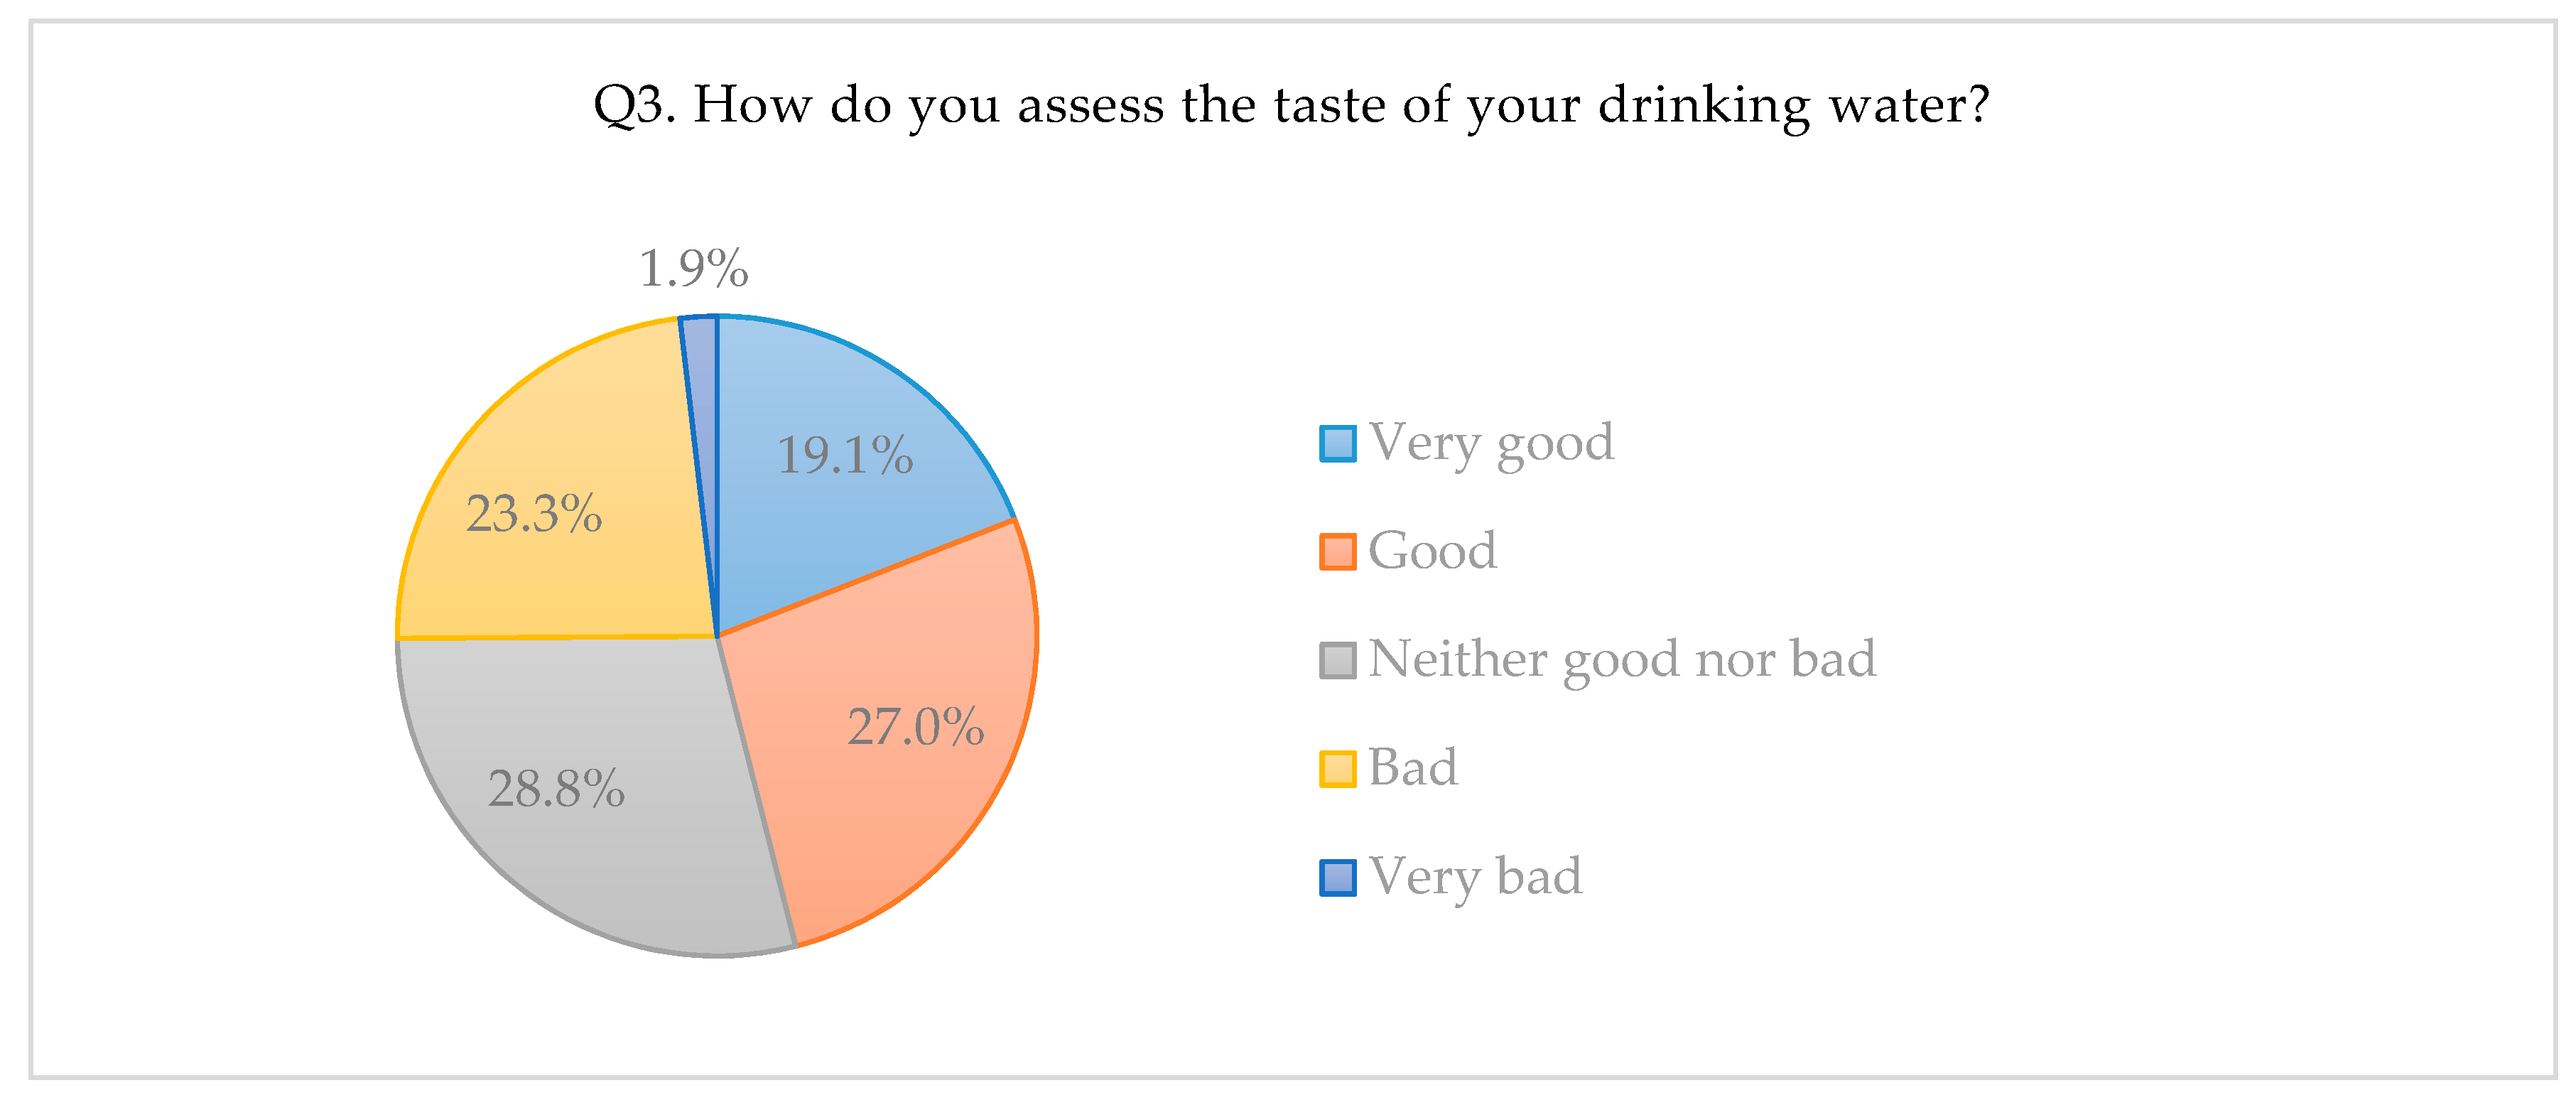
  • Very good (41 answers)
  • Good (58 answers)
  • Neither good nor bad (62 answers)
  • Bad (50 answers)
  • Very bad (four answers)
A score of 1 denotes a negative assessment of water quality (as “very bad”), while a 5 denotes “very good”. Water quality was assessed by reference to smell and taste, and responses make it clear that respondents fail to rate quality especially highly. As many as 19% claimed the smell was “bad”, while 25% referred to a bad taste. The fourth question asked respondents about sources from which they extract water as and when tap water is absent.
Q4. In the case of a lack of tap water, you use:
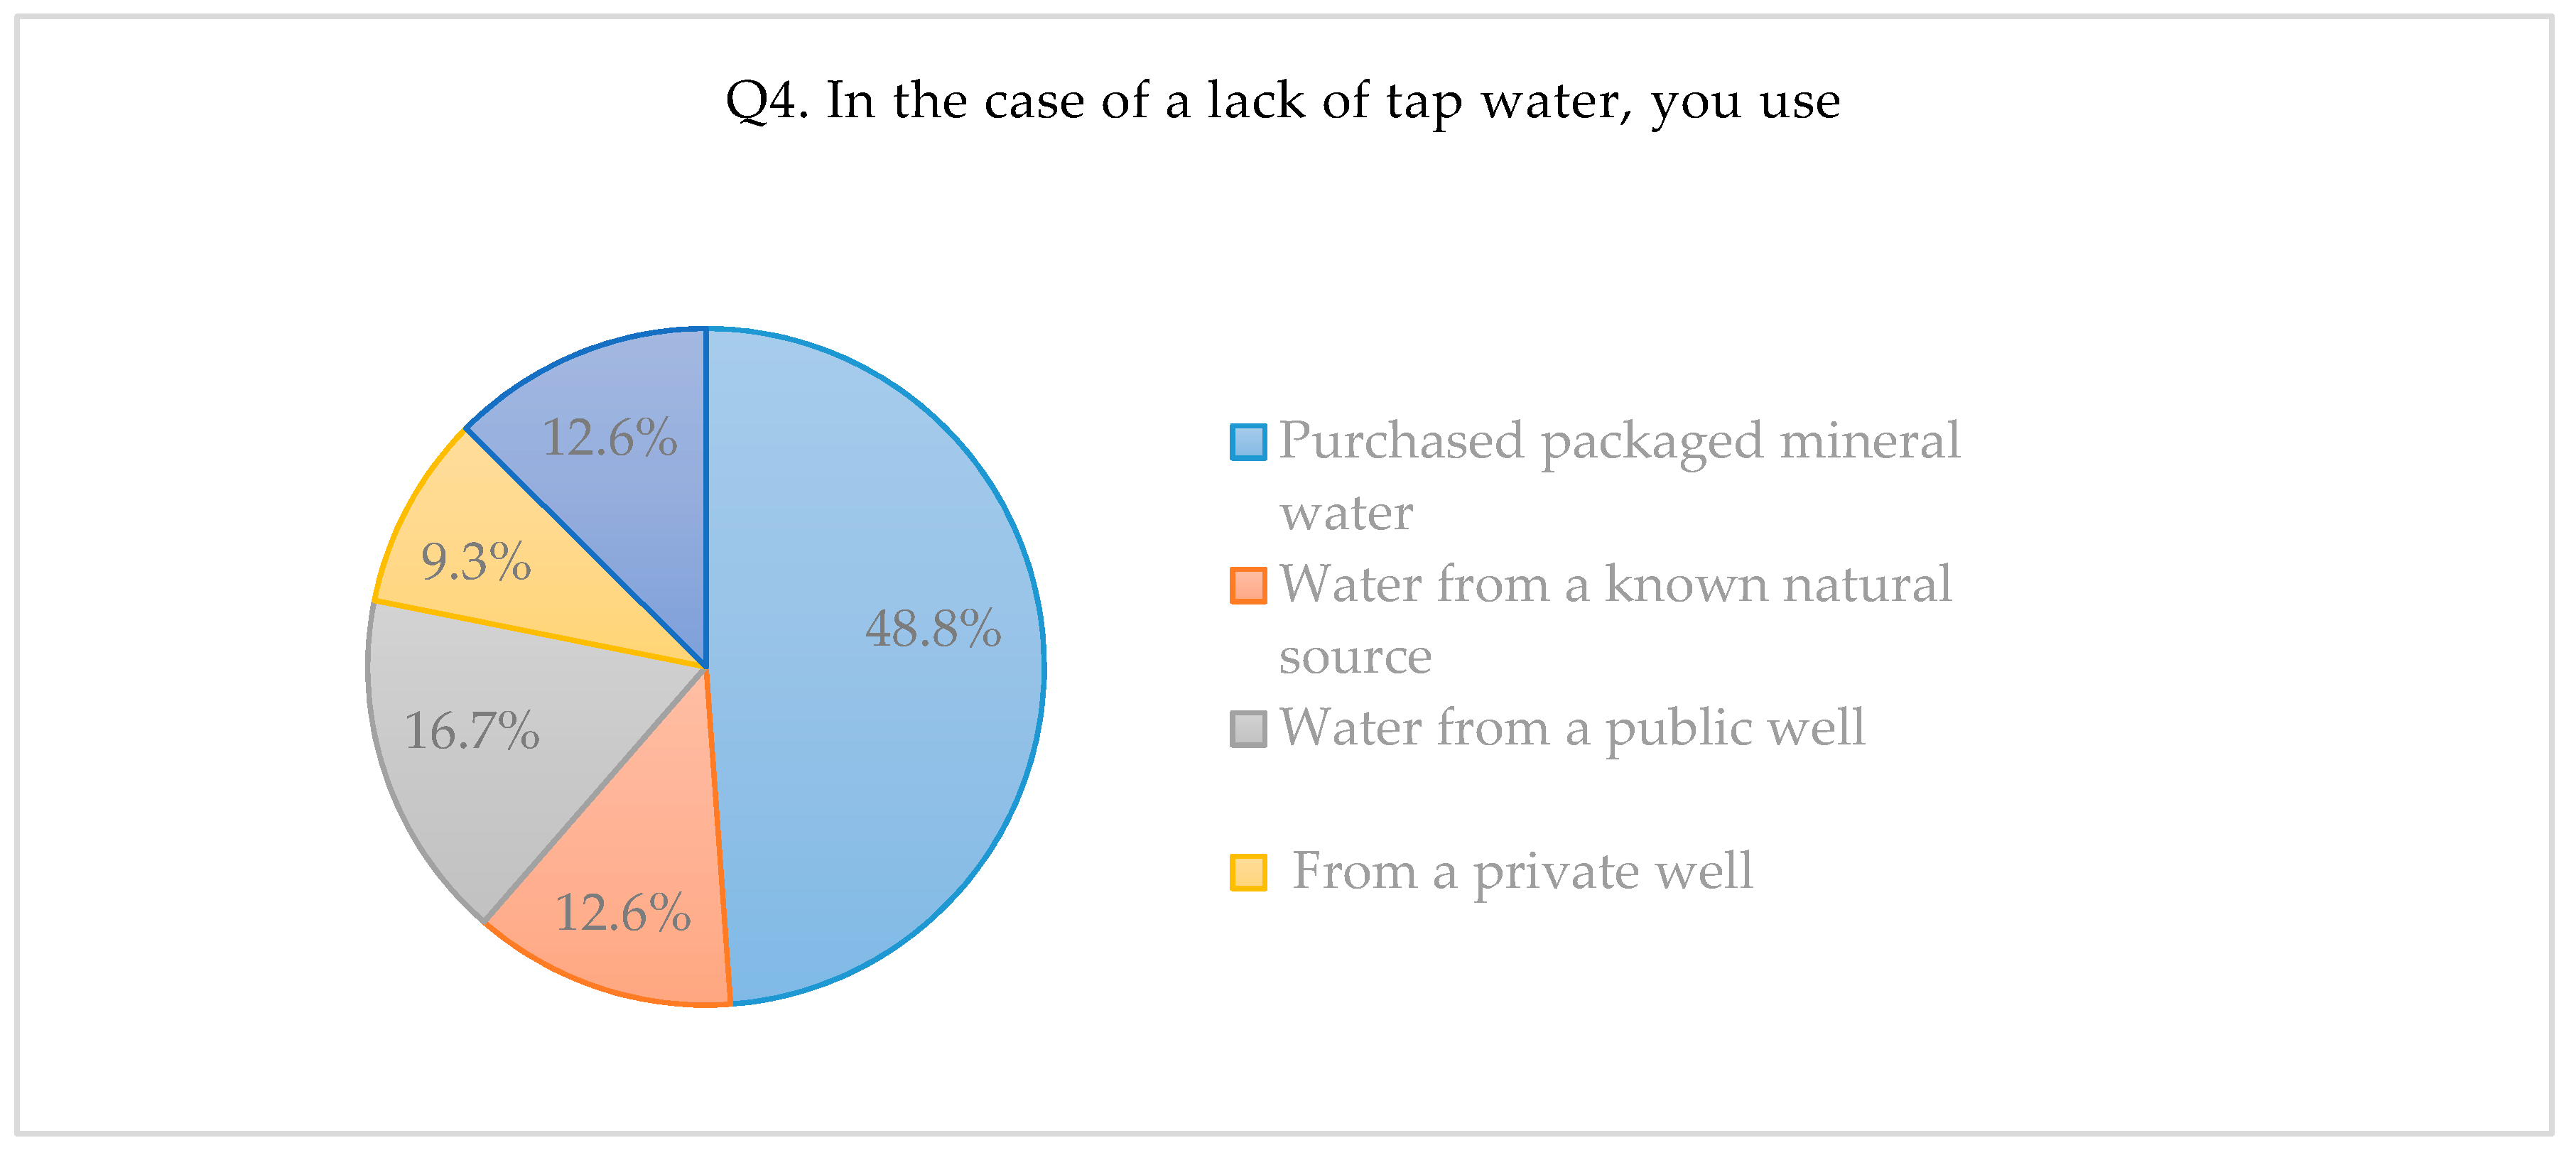
  • Purchased packaged mineral water (105 answers)
  • Water from a known natural source (27 answers)
  • Water from a public well (36 answers)
  • Water from a private well (20 answers)
  • None of the above or others (27 answers)
The largest group (about 49%) replied that, in the absence of water from the network, it was bottled water that they made use of. This mainly reflects the easy accessibility of this source. However, 12.6% used a well-known natural source of water, 16.7% water from a public well, and 9.3% a private well. The limited interest in natural sources of water in the event of a water-supply network failure may reflect issues with access to these sources, given their principal presence beyond cities; as well as people’s fear of poor-quality water being obtained from such sources. Other sources not mentioned in the question were used by 12.6% of respondents, usually when they stay in a place other than their place of residence.
The next (fifth) question concerned the assessment of the water-supply company, and more specifically, the nature and effectiveness of methods by which it might inform people of an interruption in supply.
Q5. Does the water company provide information on the estimated time for which the supply of water will be lacking…
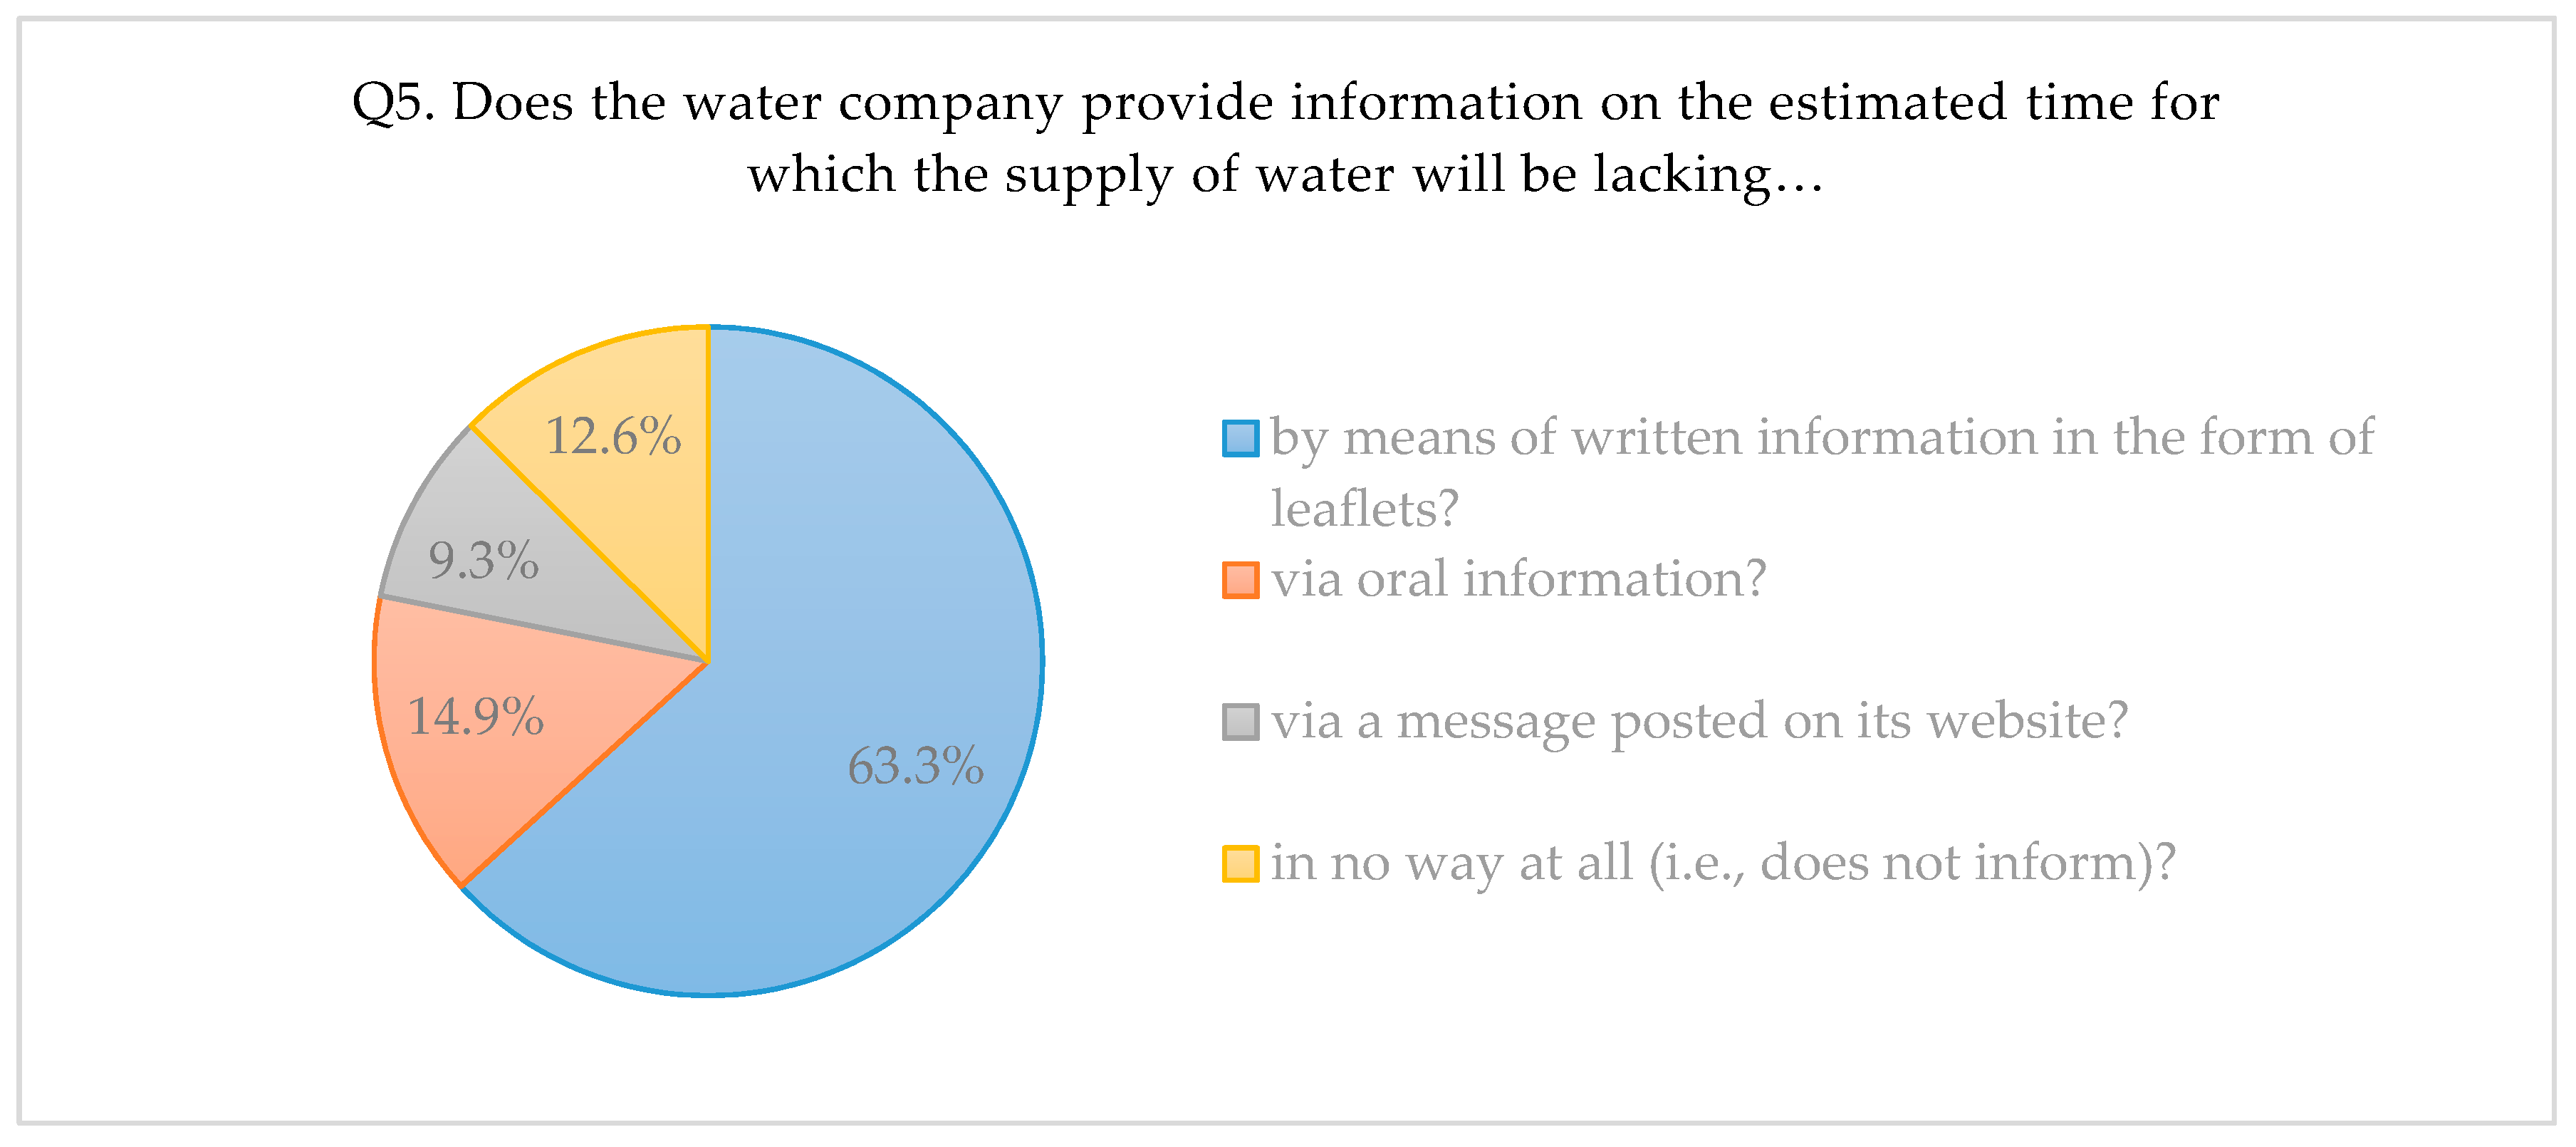
  • by means of written information in the form of leaflets? (136 answers)
  • via oral information? (32 answers)
  • via a message posted on its website? (20 answers)
  • in no way at all (i.e., does not inform)? (27 answers)
The functioning of the water-supply company was also assessed in terms of notification of interruptions in supply.
Q6. Is the method of notification of an interruption in water supply effective?
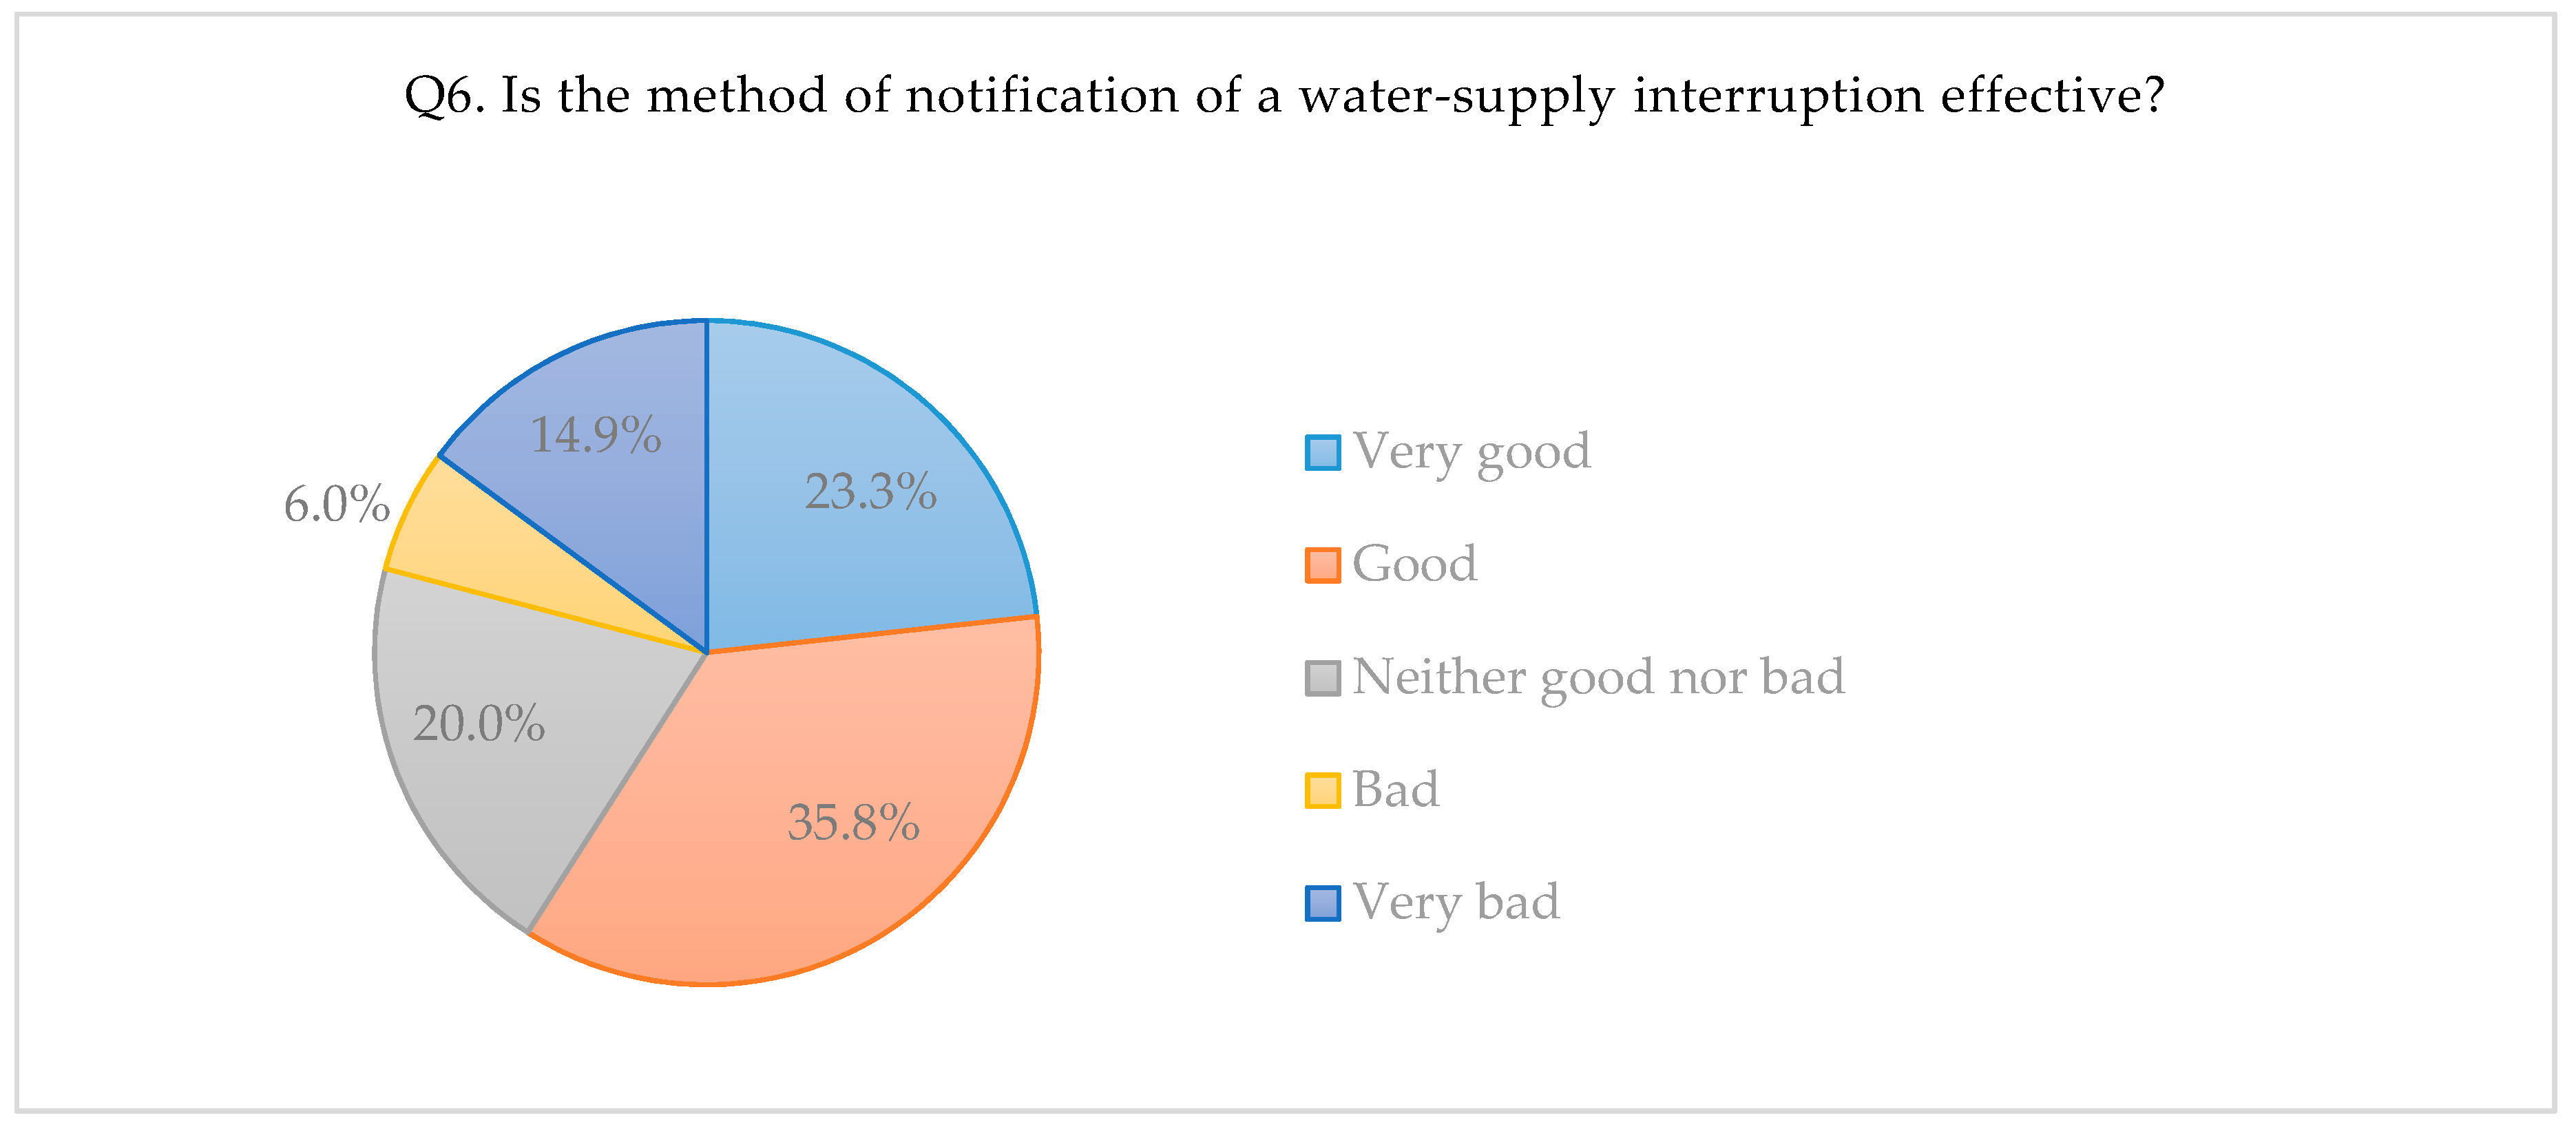
  • Very good (50 answers)
  • Good (77 answers)
  • Neither good nor bad (43 answers)
  • Bad (13 answers)
  • Very bad (32 answers)
Most people (63.3%) replied that they learn about an interruption in the water supply in writing, often in the form of a leaflet. Of those surveyed, 14.9% claimed to obtain information from repair workers verbally, and 9.3% of water recipients encountered such information online. Up to 12.6% of respondents did not receive information about planned interruptions to the water supply. About 60% felt the method used to inform people was effective. The highest efficiency of information on interruptions in the supply of water by means of leaflets and oral information may be due to the fact that a majority of respondents (55%) live in multi-storey blocks of flats. A leaflet posted on the entrance door to a block immediately draws the attention of most or all residents. Equally, where information is supplied orally, employees of water companies can still make more progress rapidly by telling residents of blocks, as opposed to those dwelling in single-family homes. The answers also show that some 75% of respondents feel continuity and pressure of the water supply are “good”.
While internet access is ever-more universal, only 10% of people surveyed claimed to find out about interruptions in the supply of water in this way, presumably because many are not in the habit of browsing (or lack time to browse) the websites of water companies. The dispatch of information by e-mail or SMS would therefore seem worth considering—if there is to be an increase in the efficiency with which recipients of water are informed of expected interruptions in supply.
In the next (7th) question, water companies were assessed from the point of view of their ensuring a supply of water from other sources, should there be an event involving interruption of supply.
Q7. Does the water-supply company offer water…
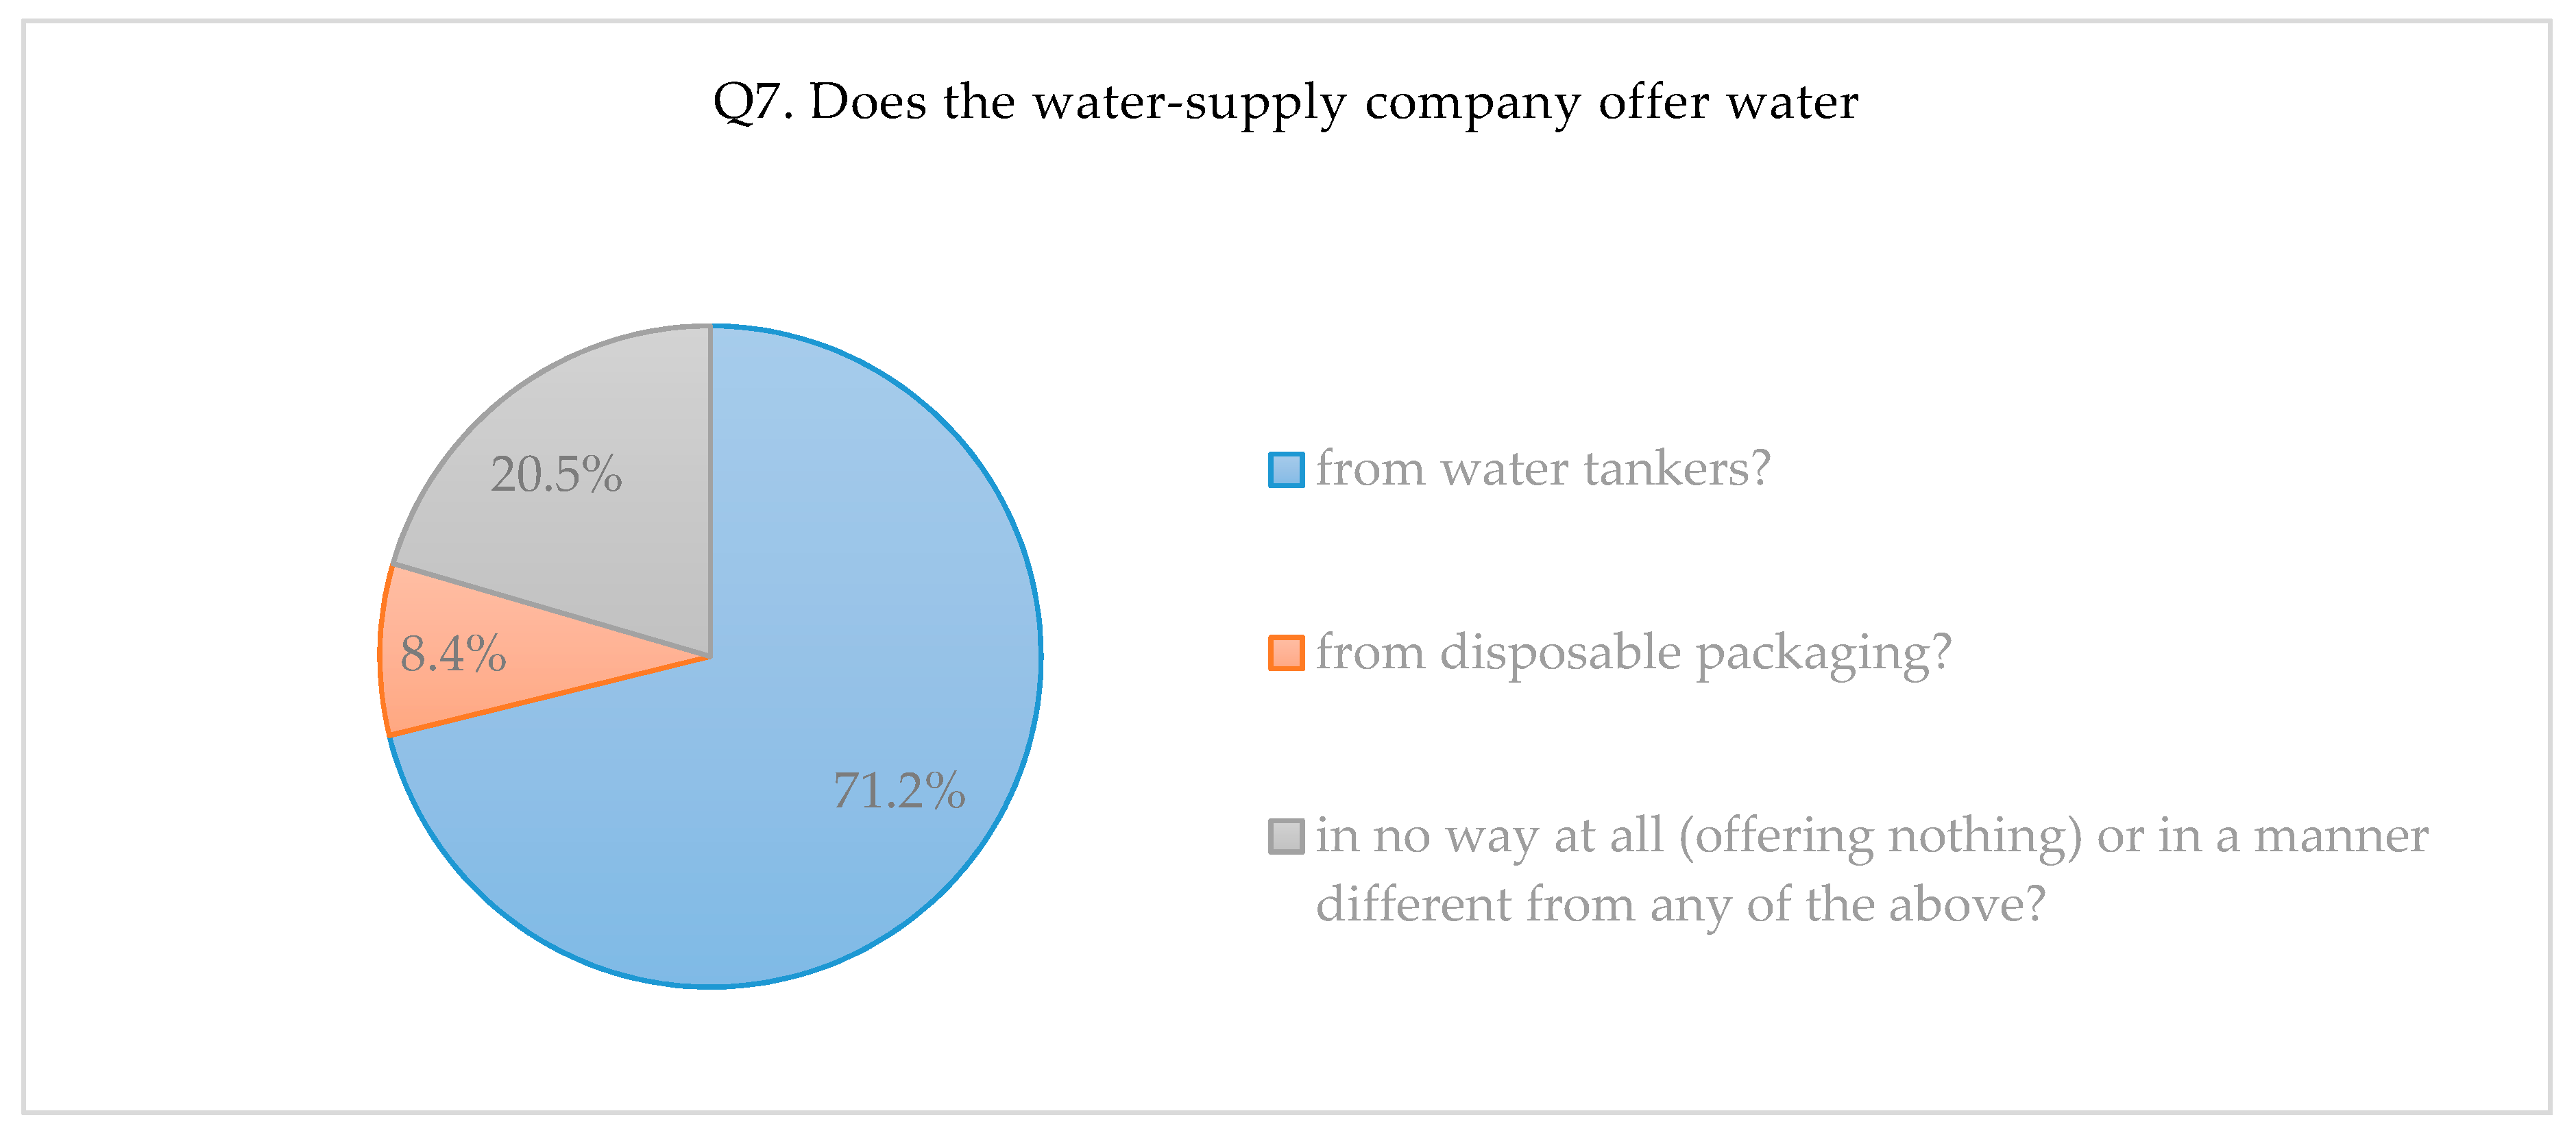
  • from water tankers? (153 answers)
  • from disposable packaging? (18 answers)
  • in no way at all (offering nothing), or in a manner different from any of the above? (44 answers)
Each water-supply company should have regulations laying down the method of supplying water to customers if continuity is impaired. Most consumers surveyed (71.2%) stated that they received water from barrel-wagons when there was this kind of interruption in their supply. Furthermore, 8.4% of respondents received water in disposable packaging, while no help reached 20.5% of those surveyed. Such a large percentage of people claiming not to be offered anything by a water-supply company in the event of a failure may not in fact be genuine, instead reflecting a lack of information as to the place and time of delivery in barrel-wagons or disposable packaging. The fact that much water is supplied by water carts appears to be justified in financial terms, as in this case the water company does not bear the costs of packaging water.
In the event of an interruption in the supply of water (5th question), it is reasonable that recipients accumulate a supply to meet their most basic needs (e.g. hygiene and cooking). The method of storing water in the event of breaks in delivery being announced was determined using Question 8.
Q8. You store your household water supplies in …
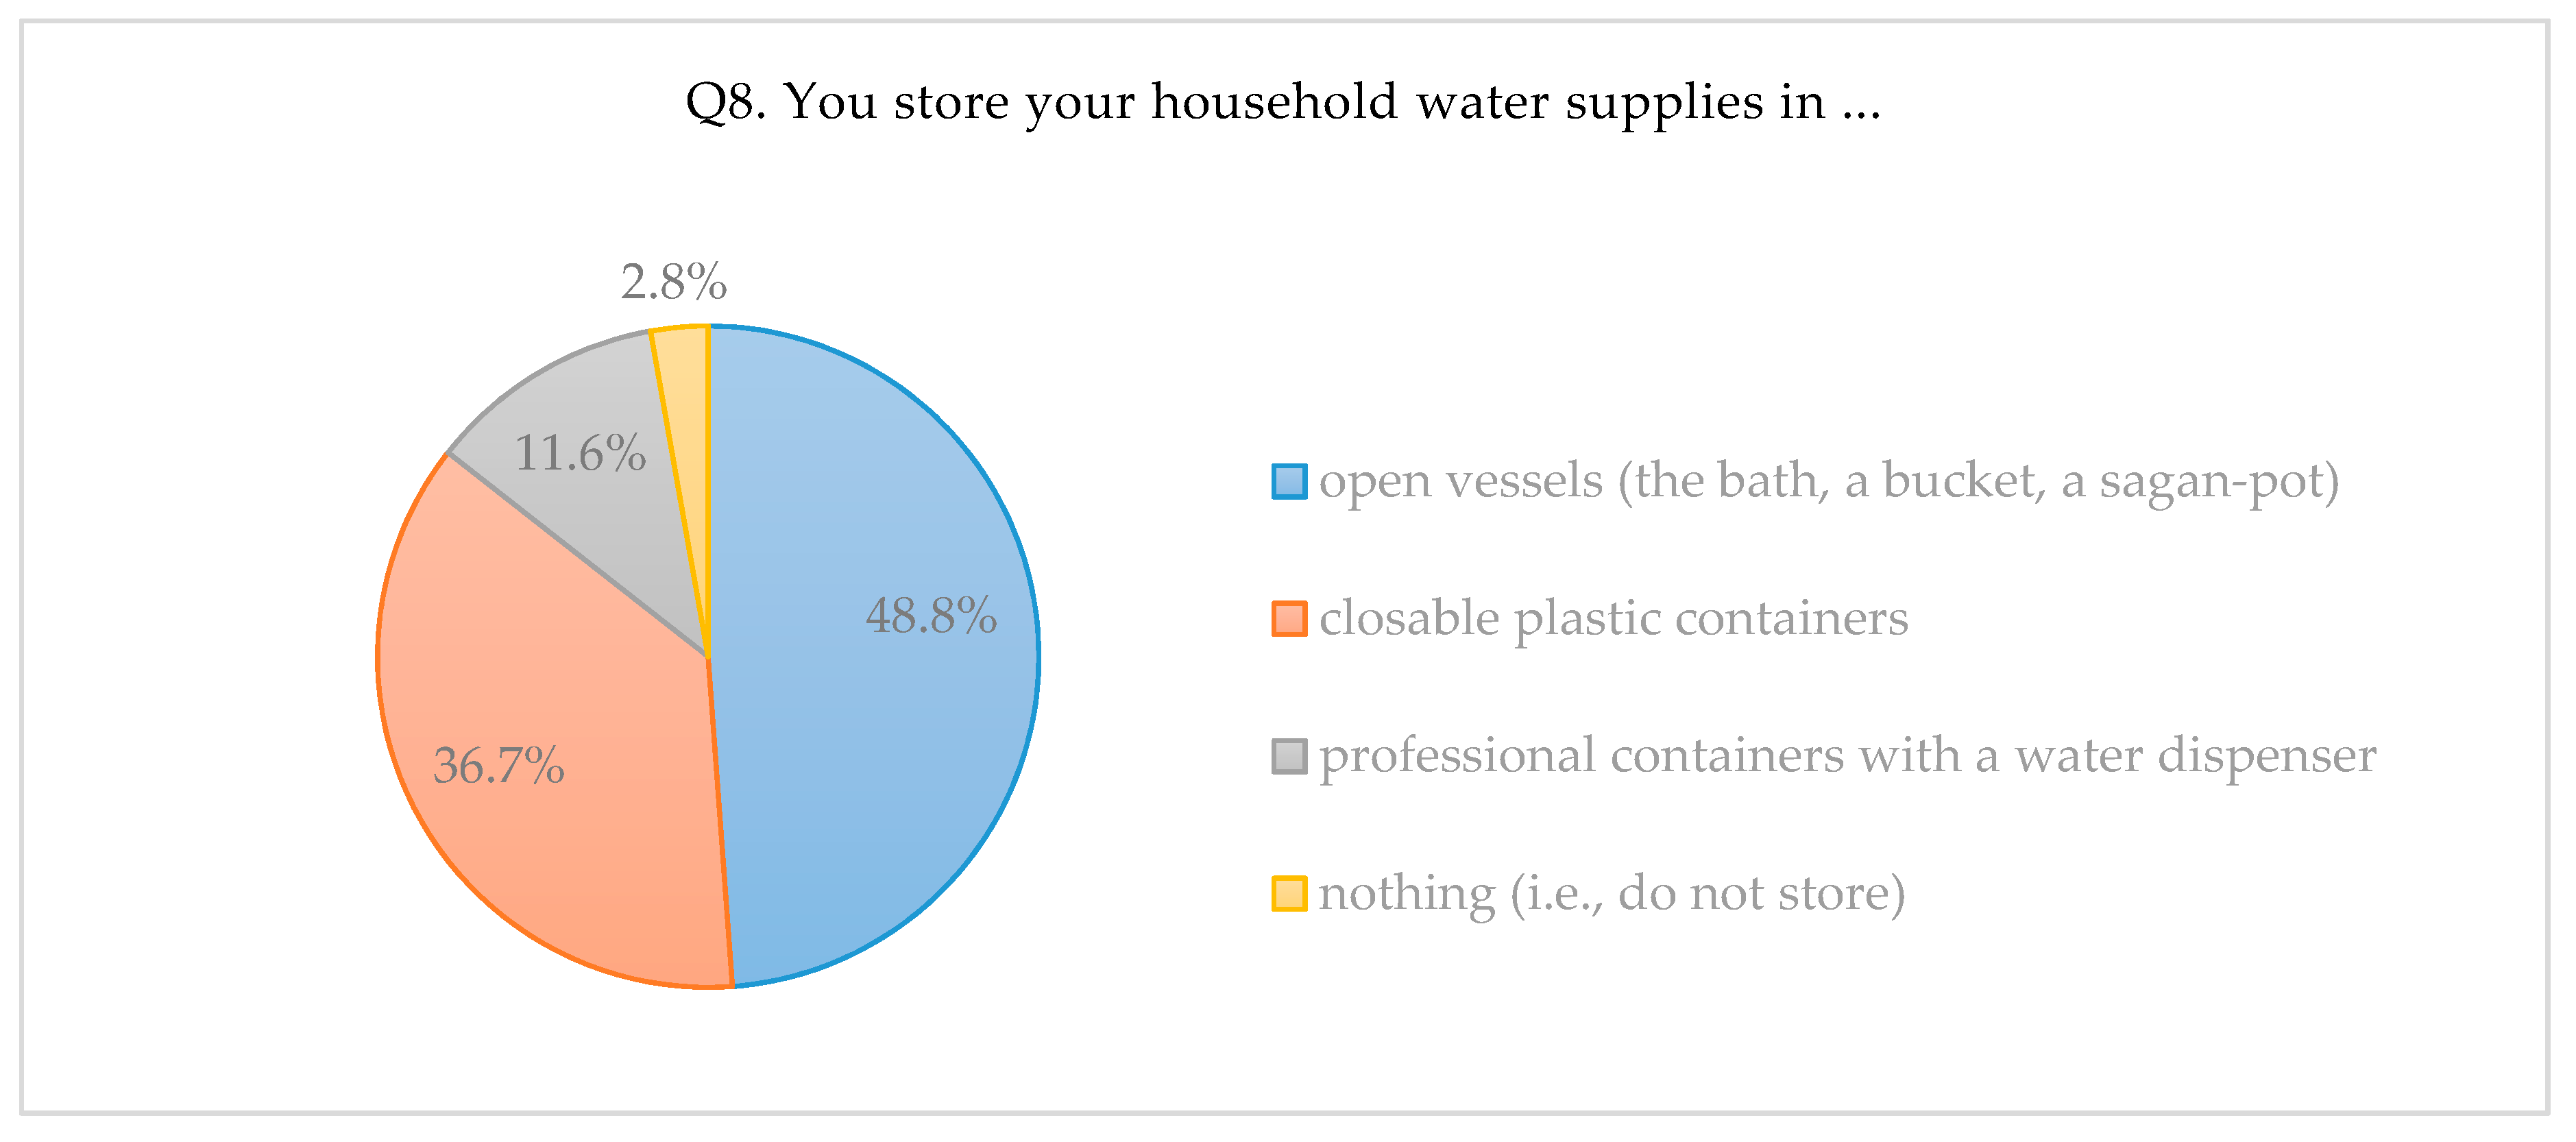
  • open vessels (the bath, a bucket, a sagan-pot) (105 answers)
  • closeable plastic containers (79 answers)
  • professional containers with a water dispenser (25 answers)
  • nothing (i.e. do not store) (6 answers)
Most respondents (48.8%) stored water in open vessels (e.g. bath-tubs or buckets). This is the commonest way of accumulating water, given the costs. Also, 36.7% of those completing the survey stored water in plastic containers closed with a screw cap. Storage of a supply of water in professional containers with a dispenser was applied less commonly (by just 11.6% of people), given that advance notification is mostly required. Water reserves by which to respond to an upcoming announced interruption in supply were only not kept by about 3% of those surveyed. Such people may, for example, expect to be at work for all or most of the time supply is due to be interrupted.
Should the supply of water be interrupted, this is deemed a nuisance by (non-)recipients (9th question). The level of that nuisance naturally depends mainly on the duration of the interruption in supply. Furthermore, where water is lacking beyond a certain length of time, this should entitle recipients to compensation in some form, usually a reduction in price to account for the water that went undelivered. In the survey, respondents had the opportunity to state after what period of interruption in supply they would anticipate receiving compensation.
Q9. Knowing that a lack of supply of tap water results in non-payment for its consumption, at what level of duration of such an event do you think you should be entitled to compensation from a water-supply company?
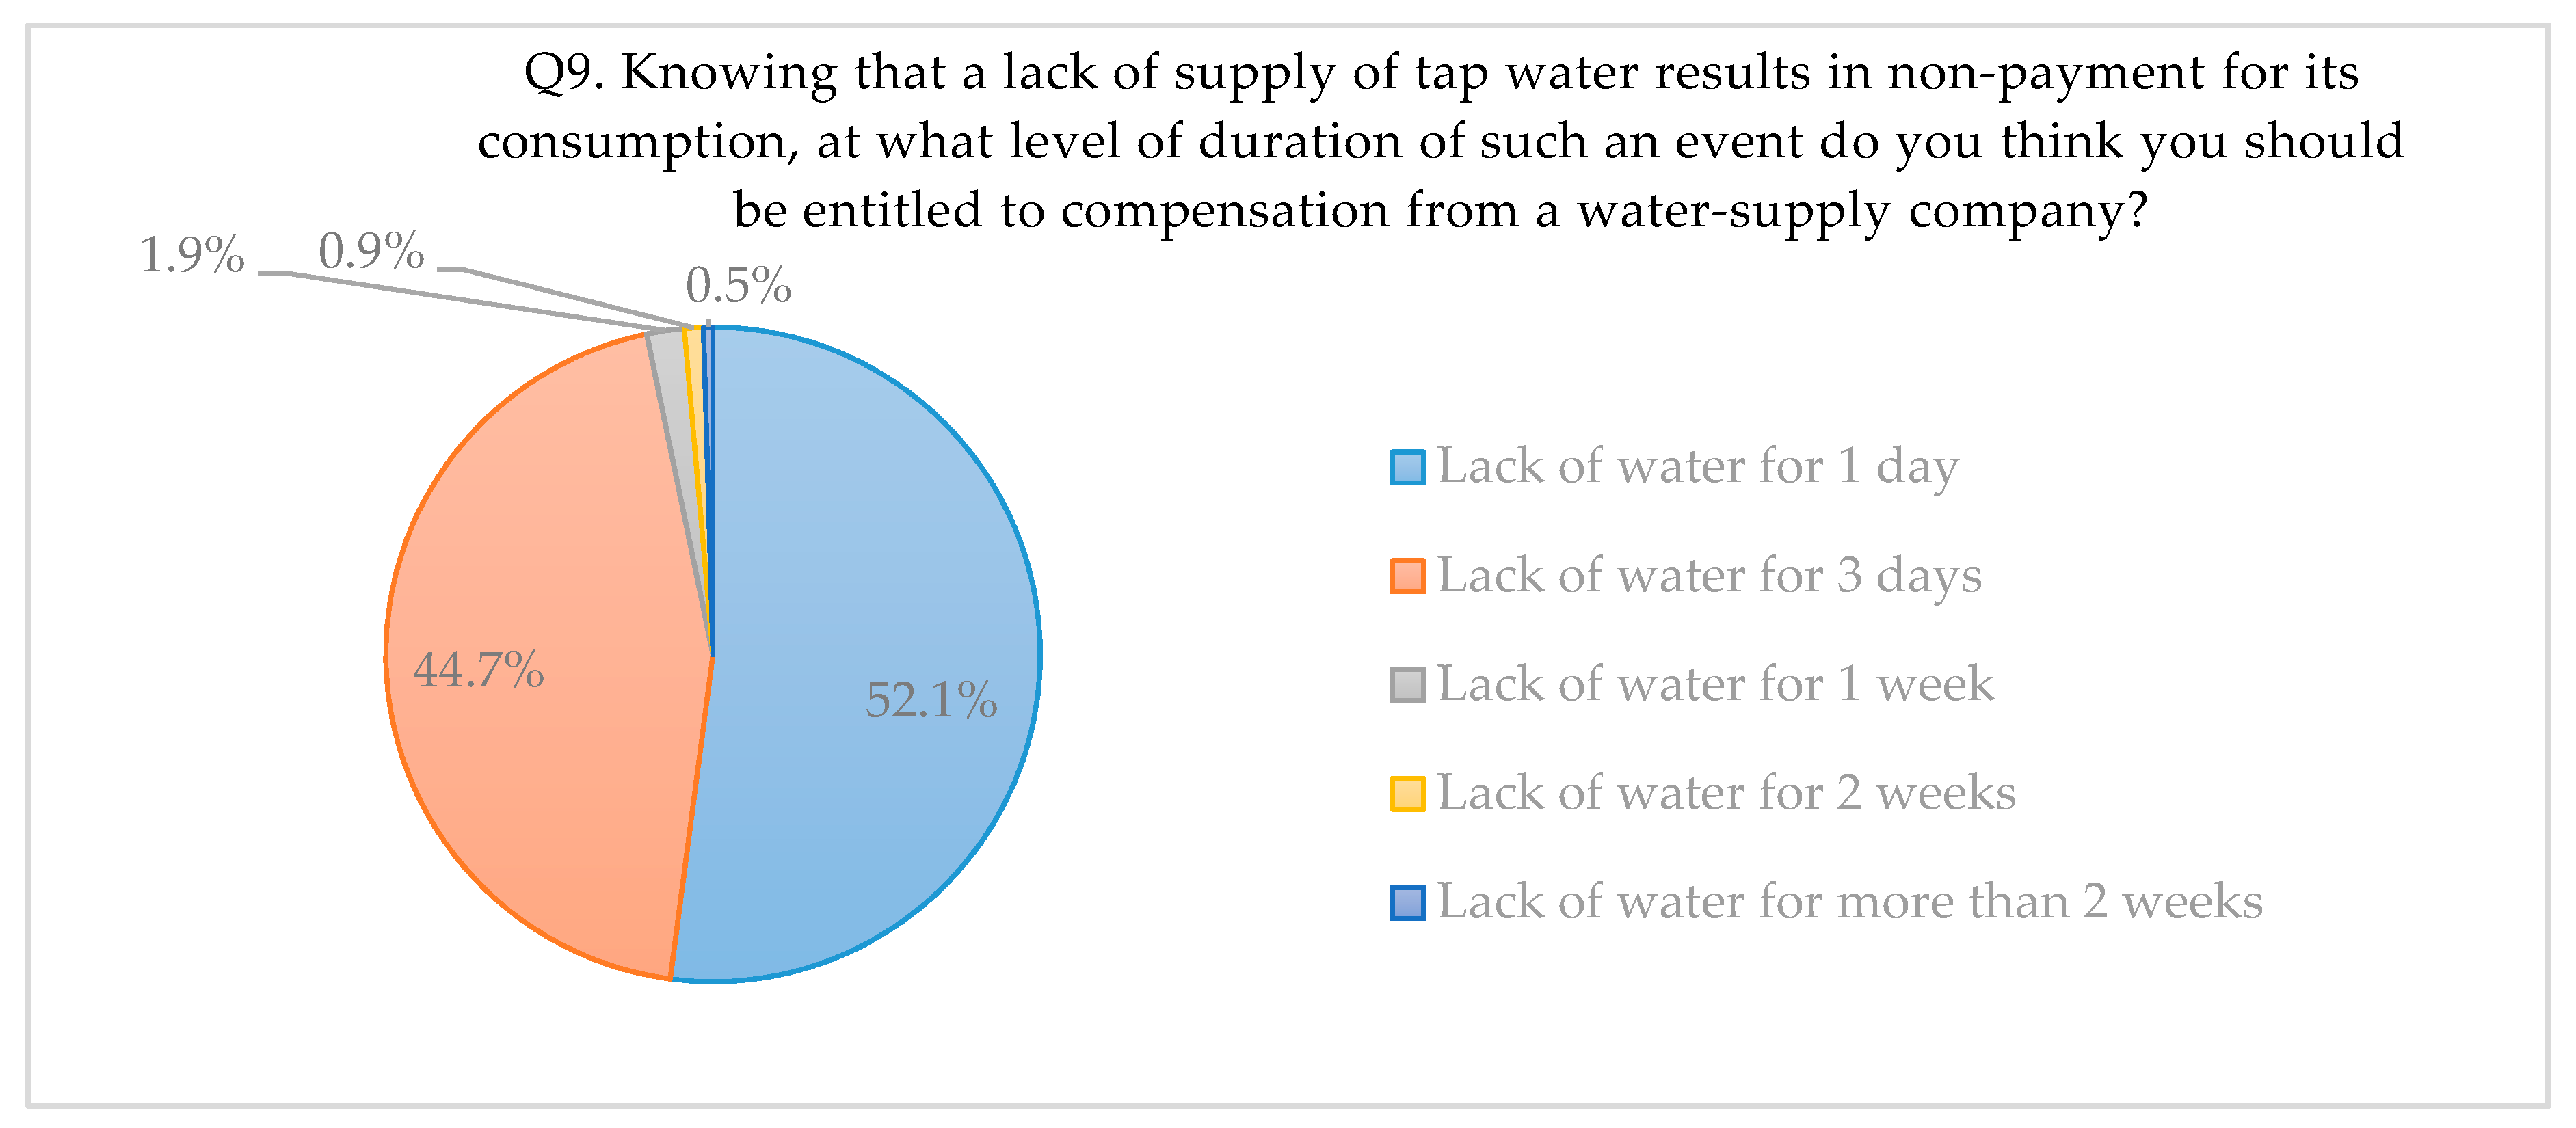
  • Lack of water for 1 day (112 answers)
  • Lack of water for 3 days (96 answers)
  • Lack of water for 1 week (four answers)
  • Lack of water for 2 weeks (two answers)
  • Lack of water for more than 2 weeks (one answer)
Most respondents (52%) would expect compensation from a water-supply company where water is cut off for more than one day. In turn, 44.7% of respondents thought that they should be entitled where the break in the supply of tap water lasts more than 3 days. Surprisingly, 2% of survey participants thought they should only be rewarded after a week of water-supply interruption, while about 1% said that time would only come after two weeks or even more than two weeks of interrupted supply.
It should be remembered that, in practice, it is impossible to eliminate interruptions in water supply altogether, if only because maintenance work takes place, while new customers are also connected. Equally, unpredictable cuts in supply will happen because of unforeseen failures independent of the action of the water-supply company, e.g., as a reflection of climatic conditions or human action, or as supply networks are damaged by work carried out.
On the other hand, a company should make every effort to minimise the duration of interruptions in supply, and—in the event of breaks becoming prolonged—to ensure provision of the alternative water sources referred to above, and to determine appropriate compensation for consumers. A new approach in this regard seeks to provide a guarantee for the length of time water is not supplied.
The time needed to rectify a given failure depends on the damage to supply that has been sustained, as well as the time over which repairs continue. In Question 10, respondents were asked what length of time without water supply would prove acceptable to them in the context of a failure in water supply needing to be rectified.
Q10. What guaranteed time-limit for a lack of water supply would you accept, in association with the need for a failure in supply to be rectified?
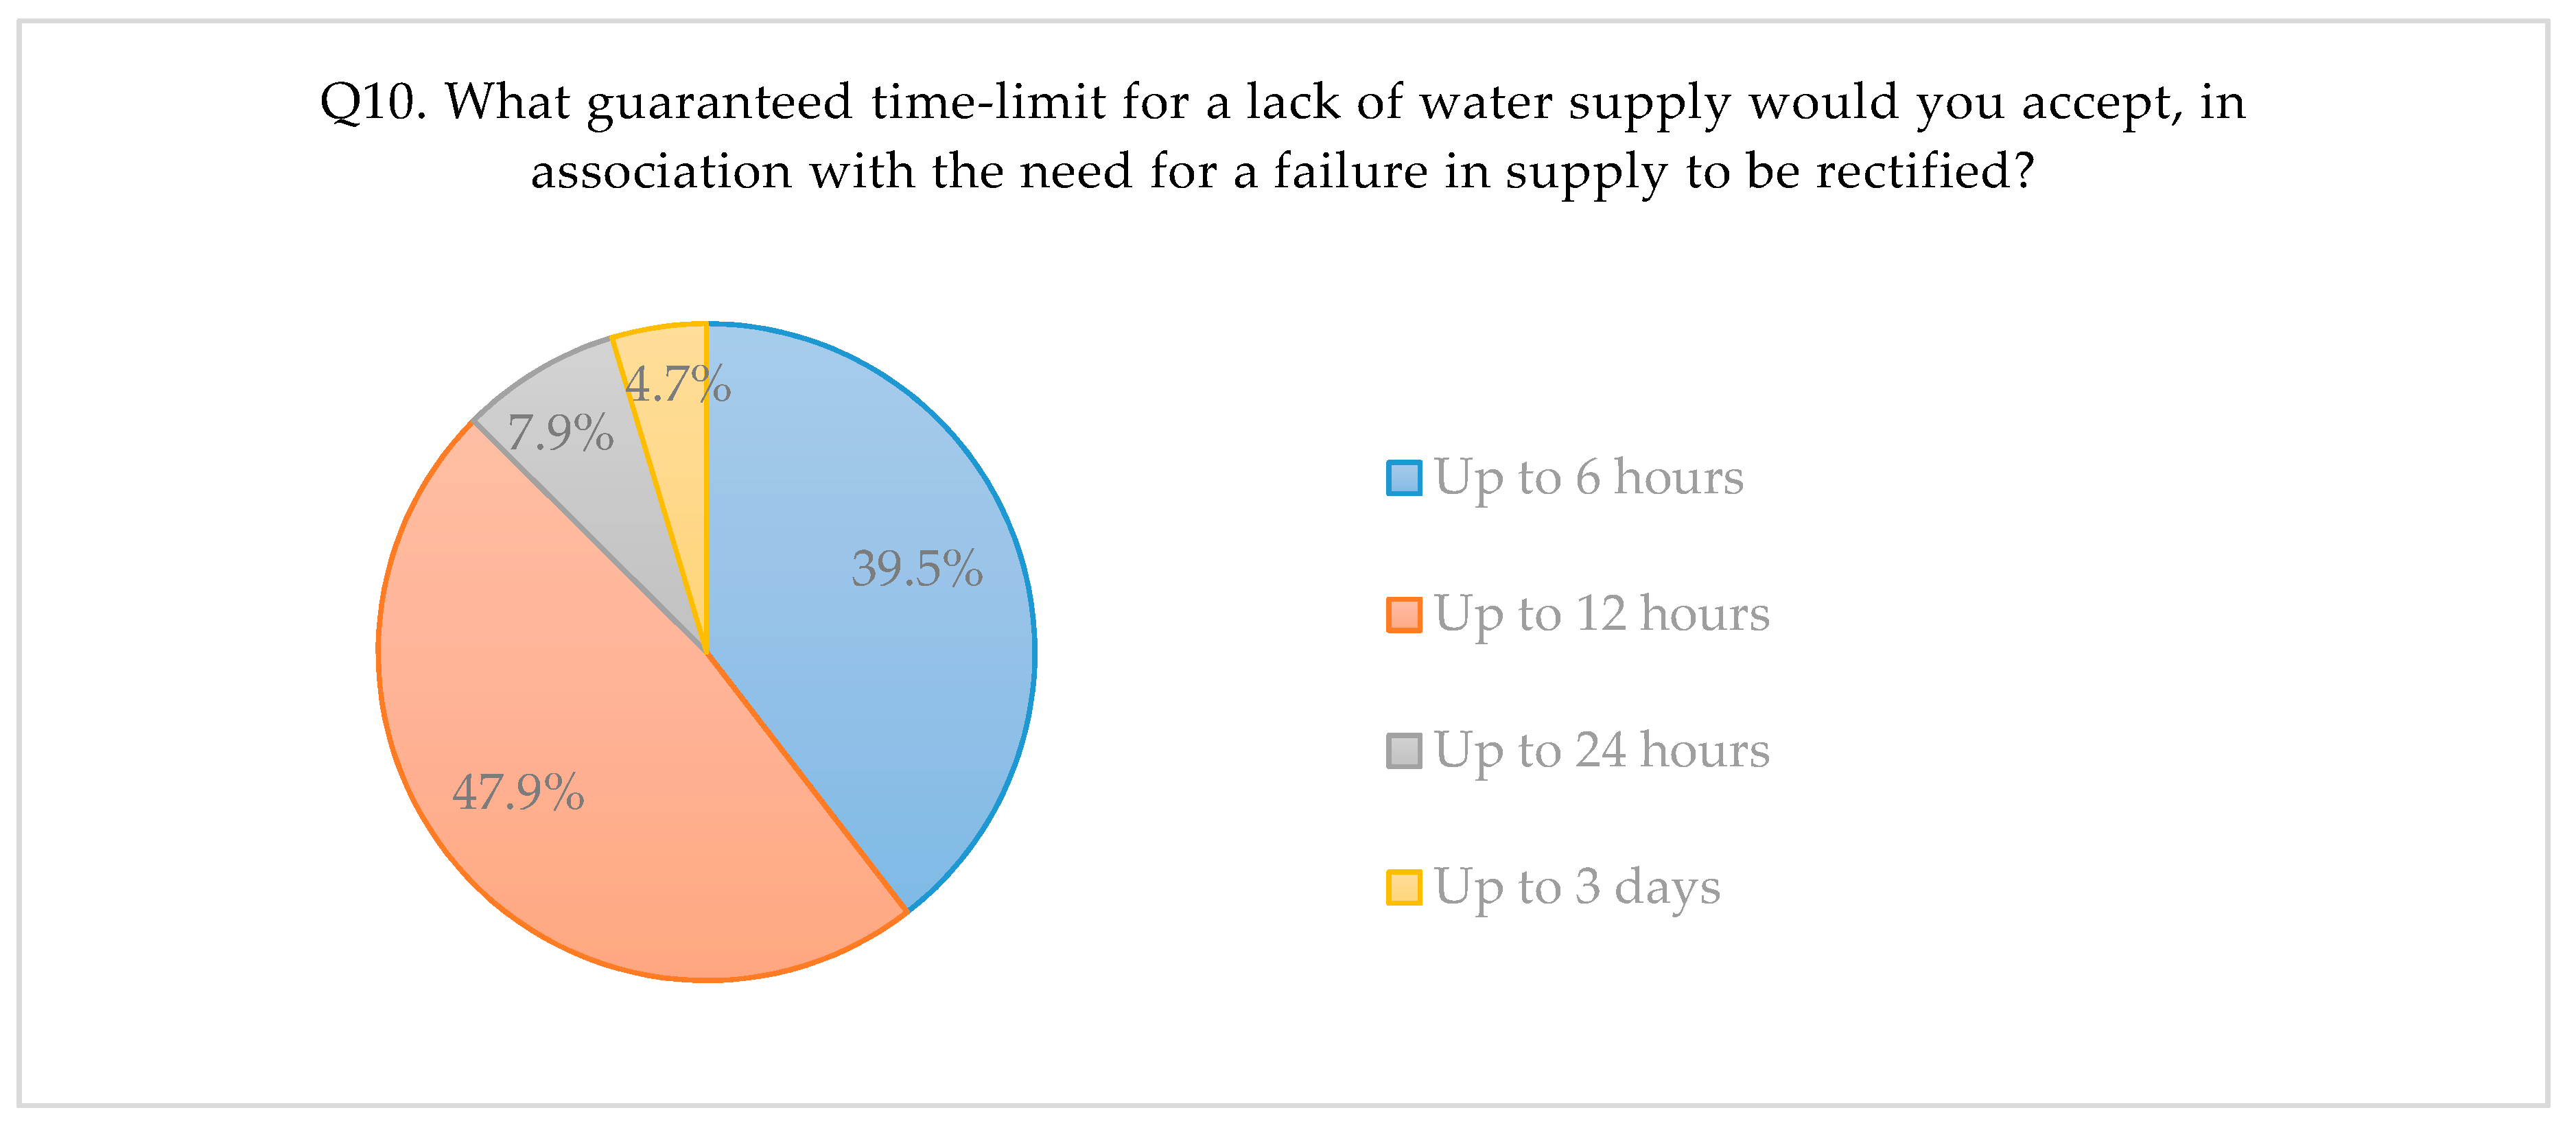
  • Up to 6 h (85 answers)
  • Up to 12 h (103 answers)
  • Up to 24 h (17 answers)
  • Up to 3 days (10 answers)
The largest category of responses comprised the 48% saying that a “good” result would apply where the cause of a failure interrupting supply was removed or put right within 12 h. A further large (39.5%) share of respondents opined that 6 h should be enough time to remove defects, while just 8% of respondents believed in removal within 24 h. Only 4.7% accepted that as much as 3 days might reasonably be required.
A water-supply company should thus specify in its regulations the guaranteed maximum time of lack of supply in connection with a failure. Then, if that removal proves impossible within the prescribed time, recipients should be notified.
In the context of the eleventh question, respondents were asked about the demand for water in a crisis situation.
Q11. How would you rate your water needs during a crisis situation?
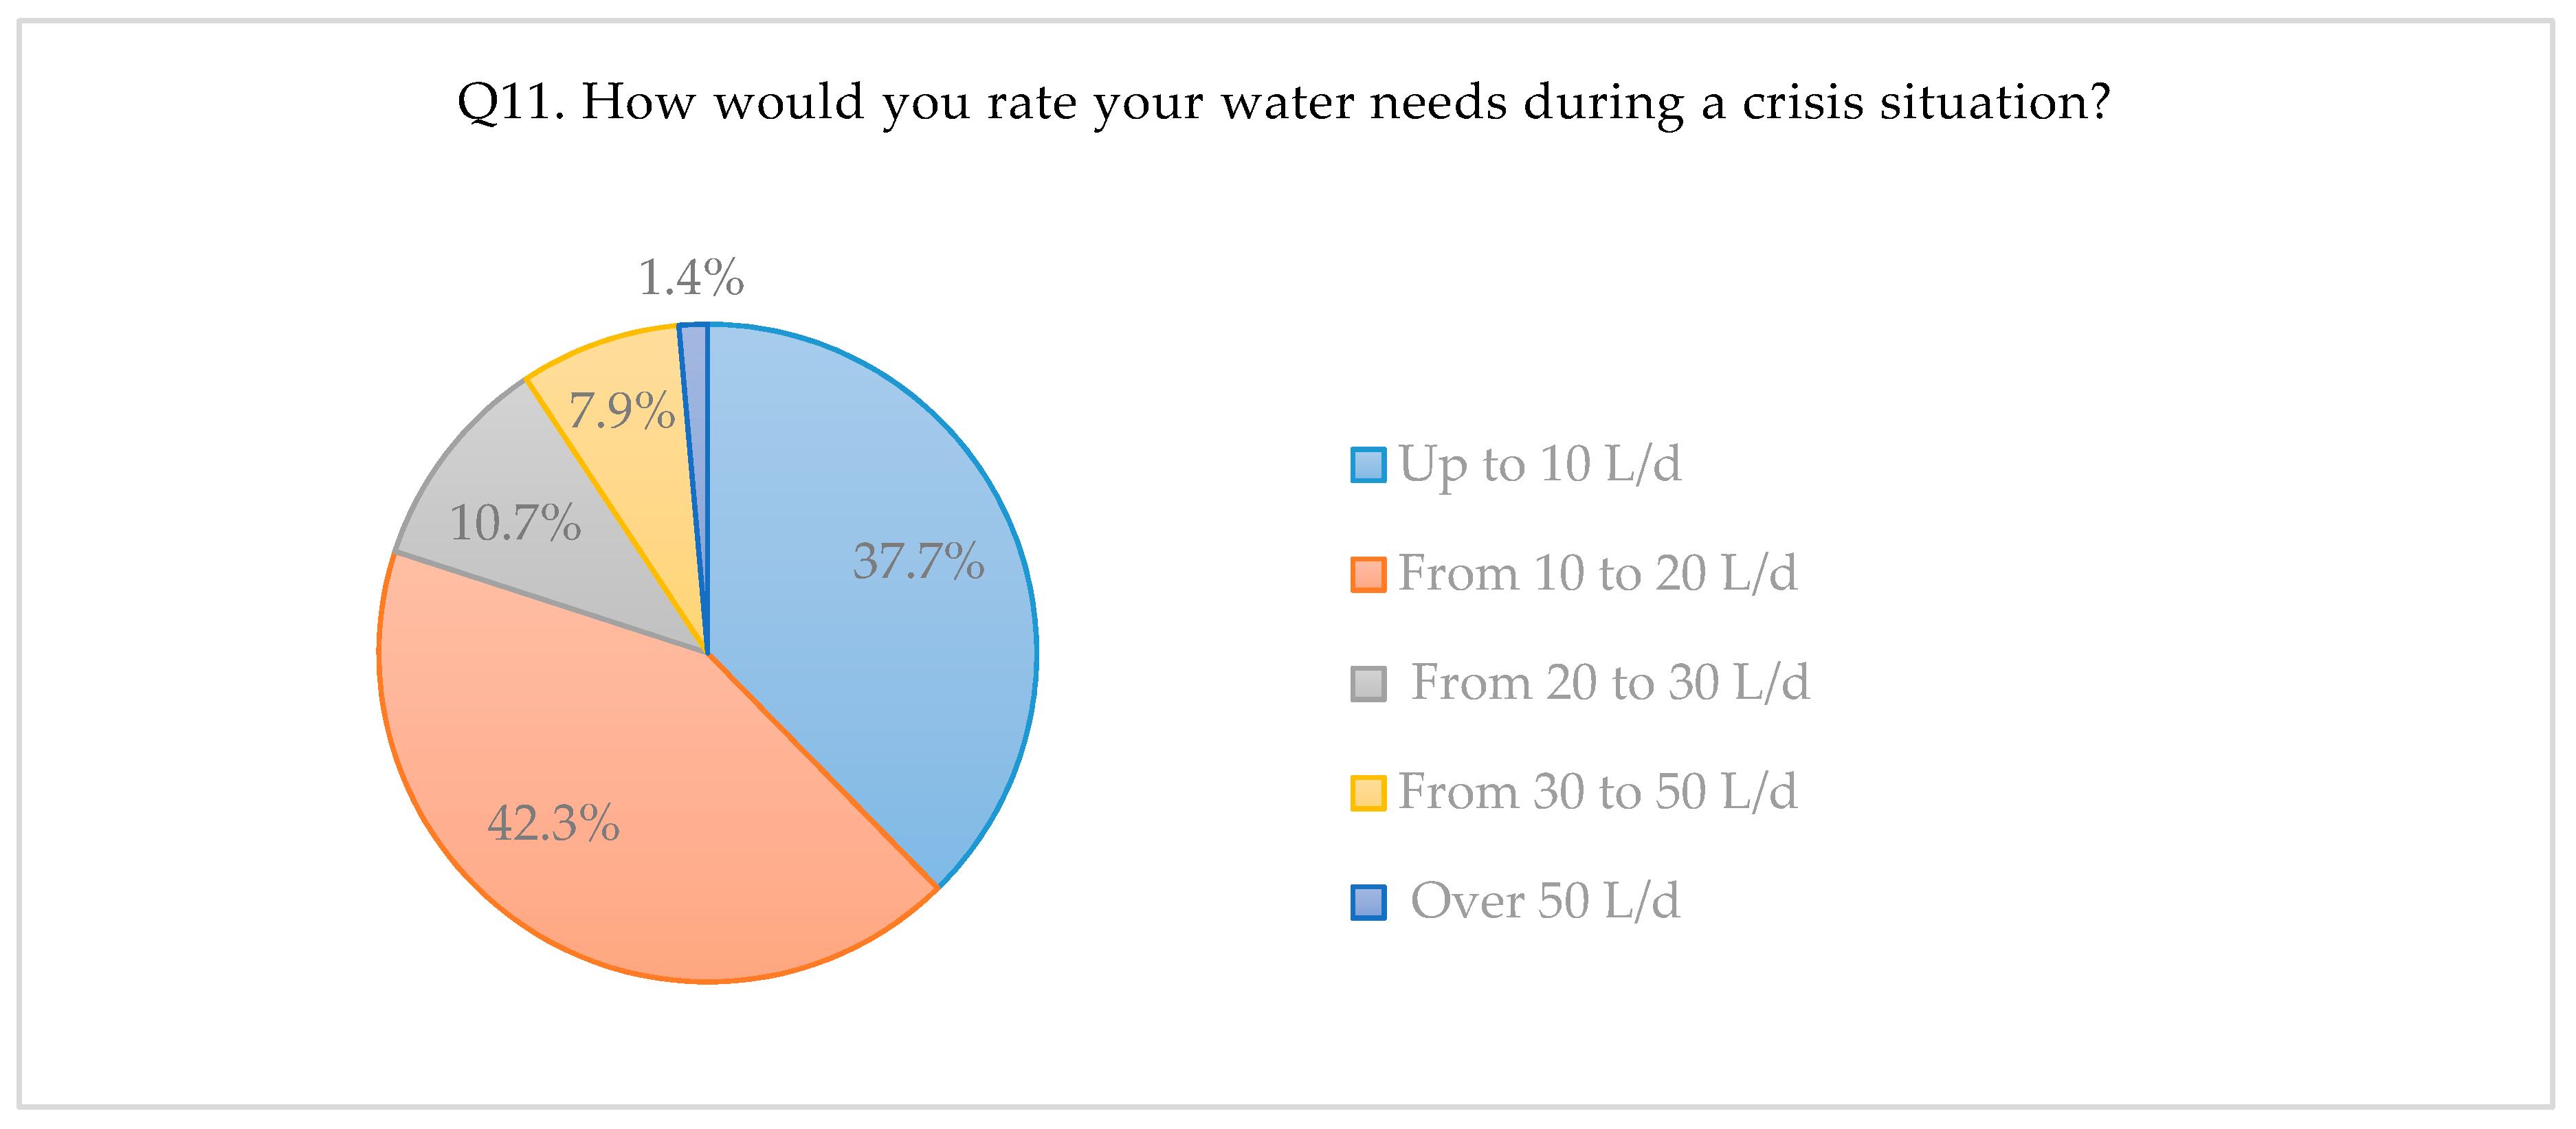
  • Up to 10 L/d (81 answers)
  • From 10 to 20 L/d (91 answers)
  • From 20 to 30 L/d (23 answers)
  • From 30 to 50 L/d (17 answers)
  • Over 50 L/d (three answers)
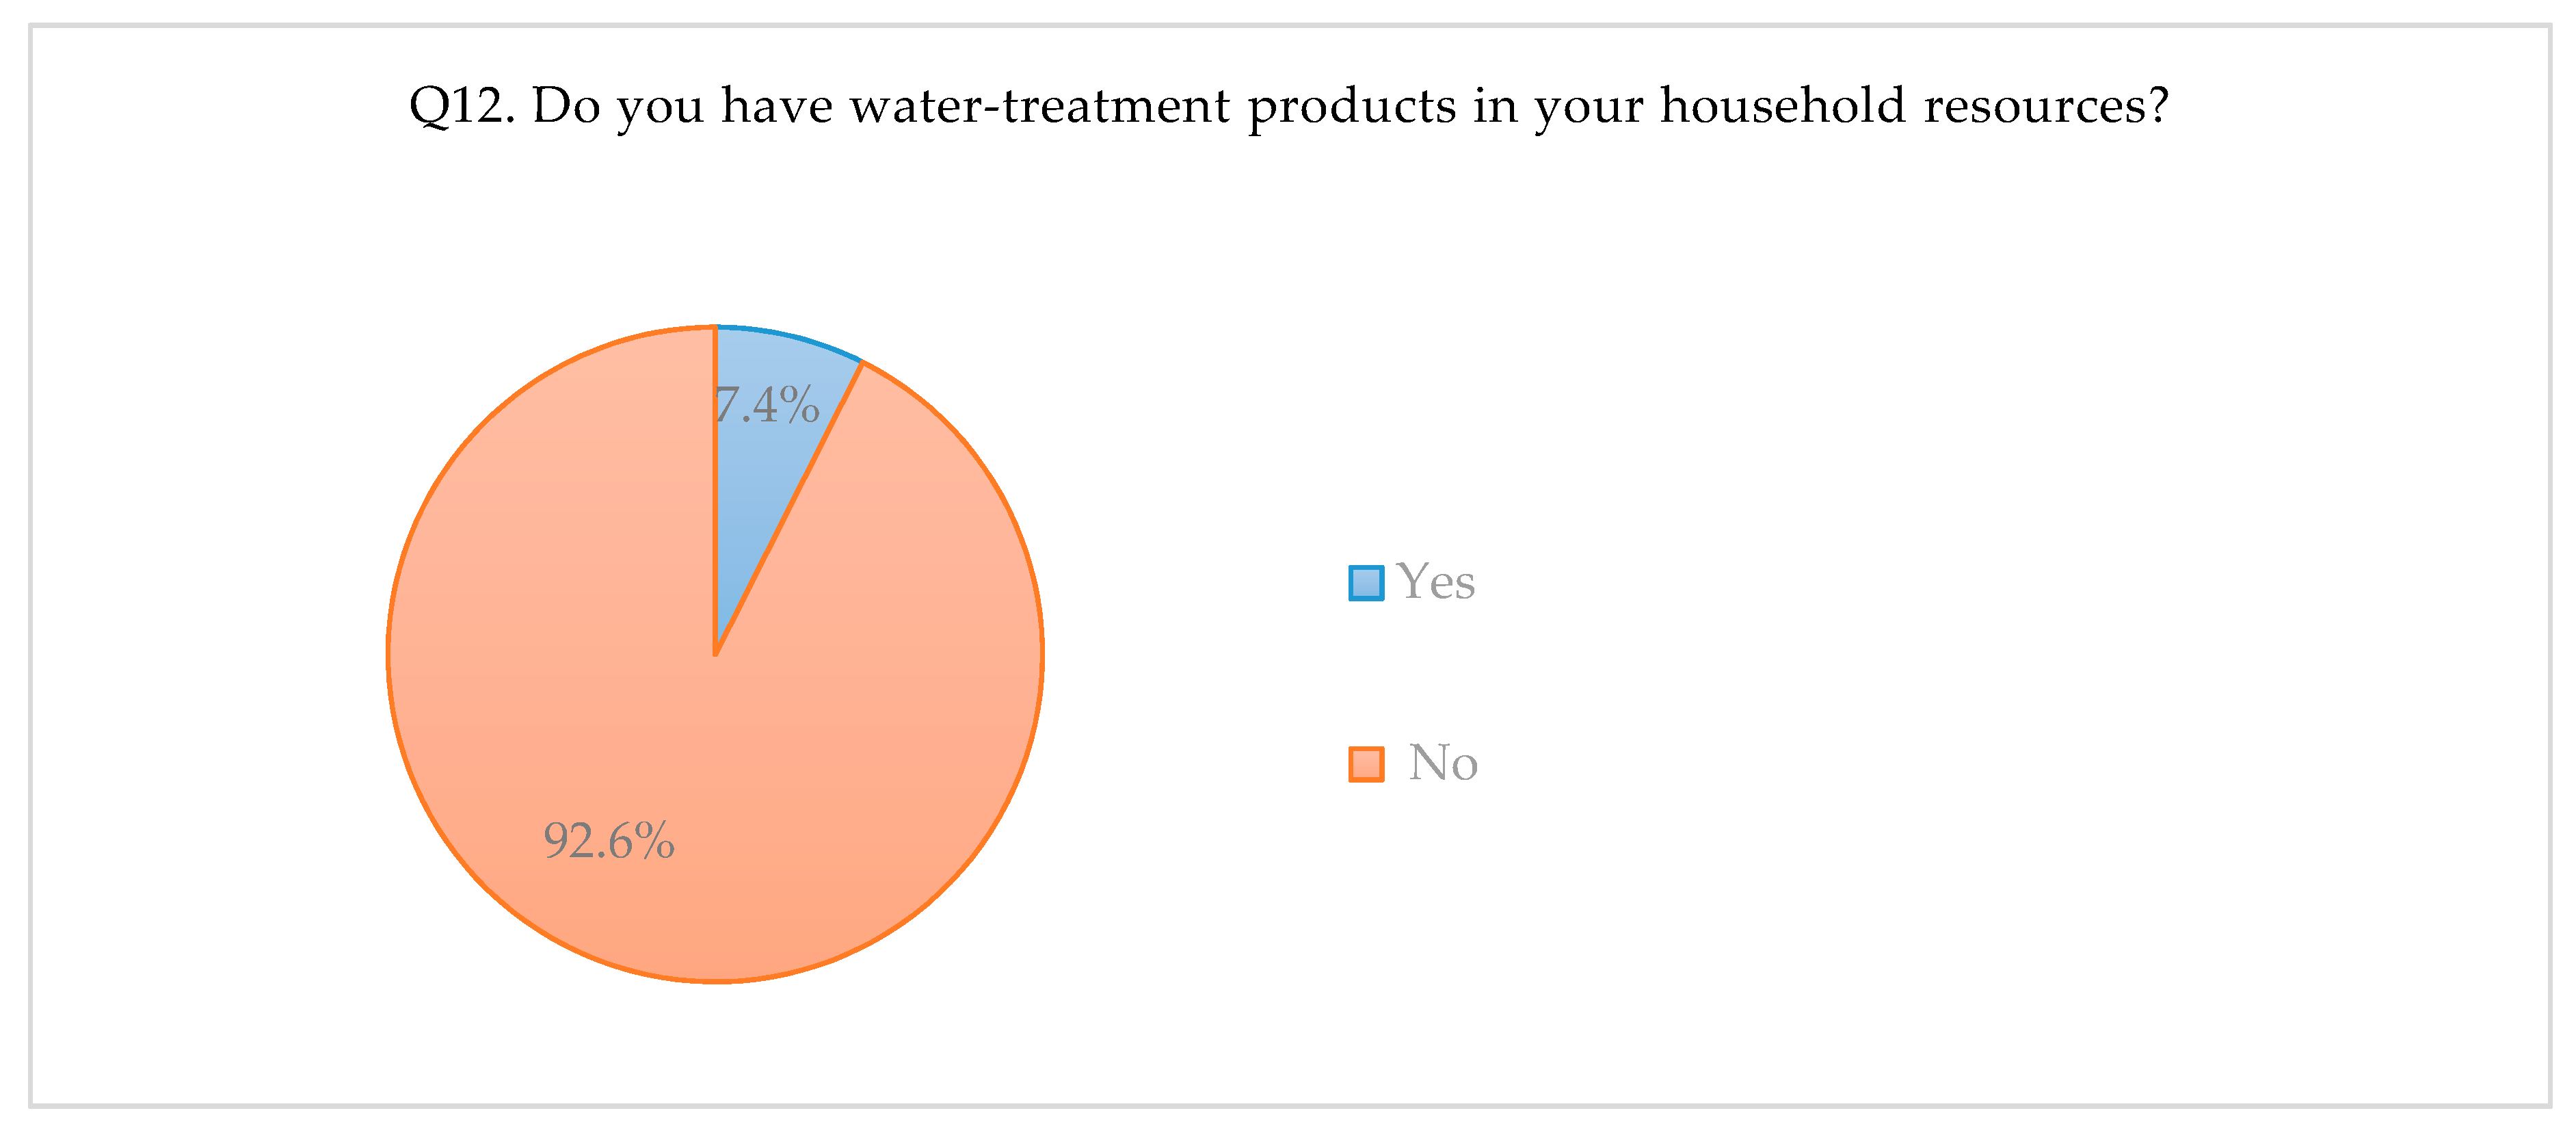
The largest group (comprising about 42.3% of those surveyed) said that a crisis situation would curb their needs for water to something in the 10–20 L/d range. In such a situation, 37.7% claimed to need 10 L/d or less, while 10.7% would use 20–30 L/d. In contrast, 8% of respondents selected an answer involving emergency consumption still being at between 30 L/d and 50 L/d, with over 50 L/d mentioned by about 1.4% of survey participants.
In this case, it is probable that some people choosing an answer suggested their own needs for water, which result, for example, from a desire to maintain personal comfort. In turn, another group of respondents may have overstated the need for larger water reserves to be accumulated in the event of a prolonged failure. This question should therefore offer indications as a water company seeks to determine the quantity of water needing to be supplied in the event of an interruption. It is important to mention that, under the “water for life” concept, recipients can except water to be available in all spheres of life. All remedies should be implemented to ensure that recipients have access to water, even during unpredictable crisis situations, in line with the fundamental human right to water.
The quality of supplied water was assessed by means of a question worded as follows:
Q12. Do you have water-treatment products in your household resources?
  • Yes (16 answers)
  • No (199 answers)
Among all respondents, just 7.4% responded that they had made such preparations, while 92.6% of those completing the survey admitted that no such measures were in place. This means that the vast majority of participants were not aware that such steps could be taken; or did not display the necessary sense of caution. A question put to the aforementioned 7.4% involved the kinds of preparation they deemed most suitable. After all, water of inadequate quality can be treated physically, for example, by means of filtration and chemical methods (e.g. tablets), with a quality of water achieved that at least does not endanger health or imply disturbances should it be consumed.
It is known that sudden water-supply interruptions are particularly inclined to cause some inconvenience. With this kept in mind, in the 13th question, respondents were asked about activities posing the most problems, should an interruption in water supply arise. They had the opportunity to mark more than one answer in this case.
Q13. What areas of loss or inconvenience arise where a household faces a crisis-related lack of water supply?
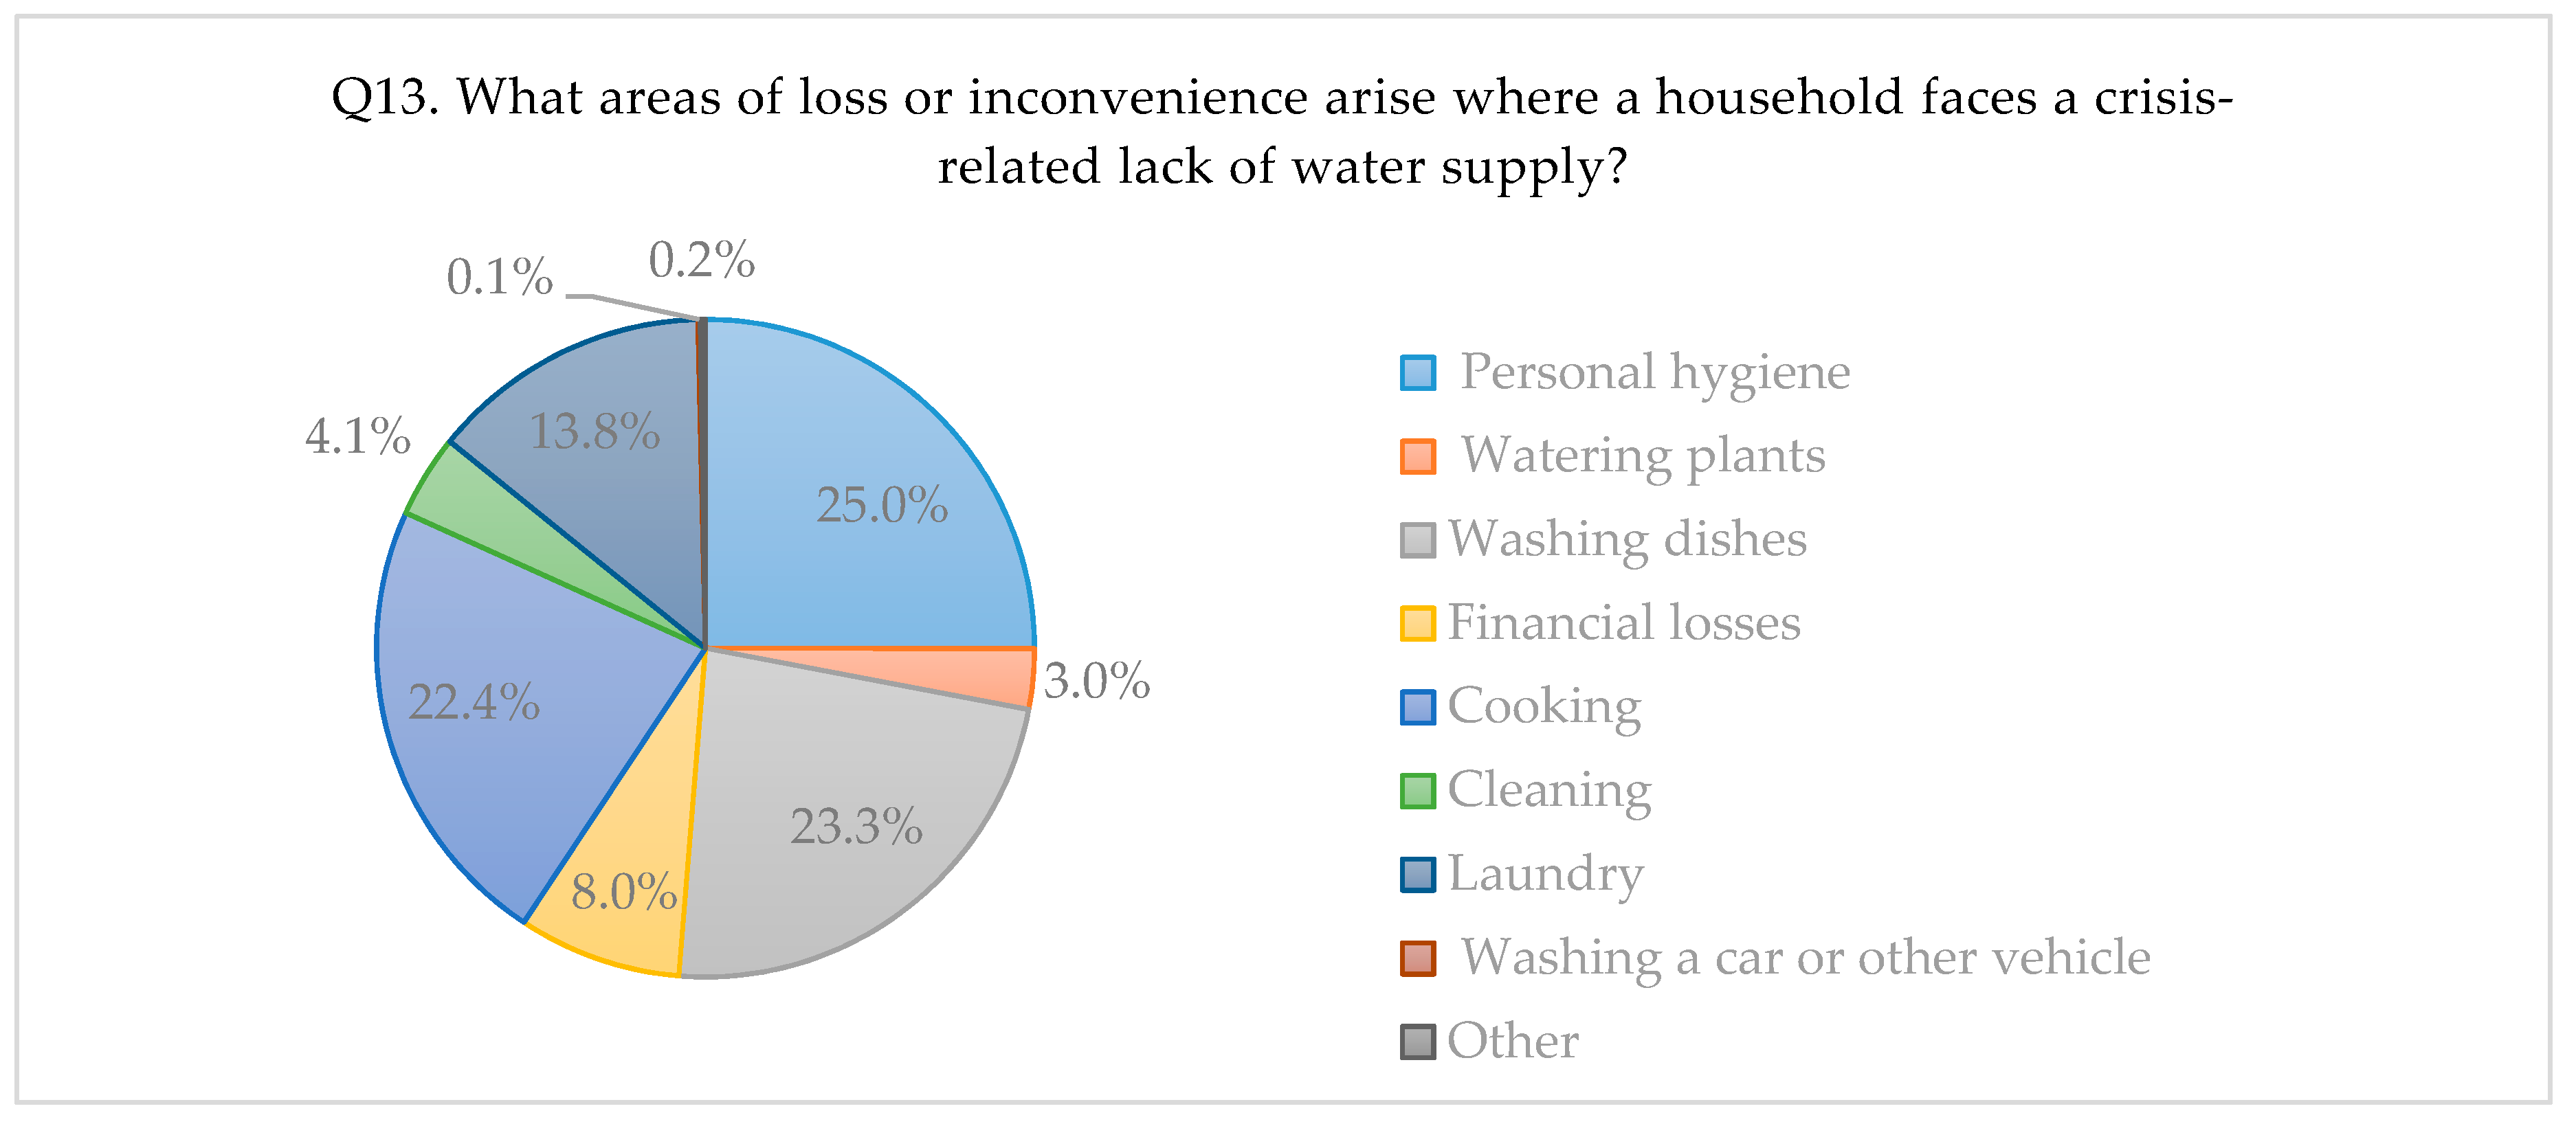
  • Personal hygiene (203 answers)
  • Watering plants (24 answers)
  • Washing dishes (189 answers)
  • Financial losses (65 answers)
  • Cooking (182 answers)
  • Cleaning (33 answers)
  • Laundry (112 answers)
  • Washing a car or other vehicle (1 answer)
  • Other (2 answers)
A further question was as follows:
Q14. Would you agree to water bills rising in order to finance a programme seeking to limit crisis situations and the related number of water-supply interruptions?
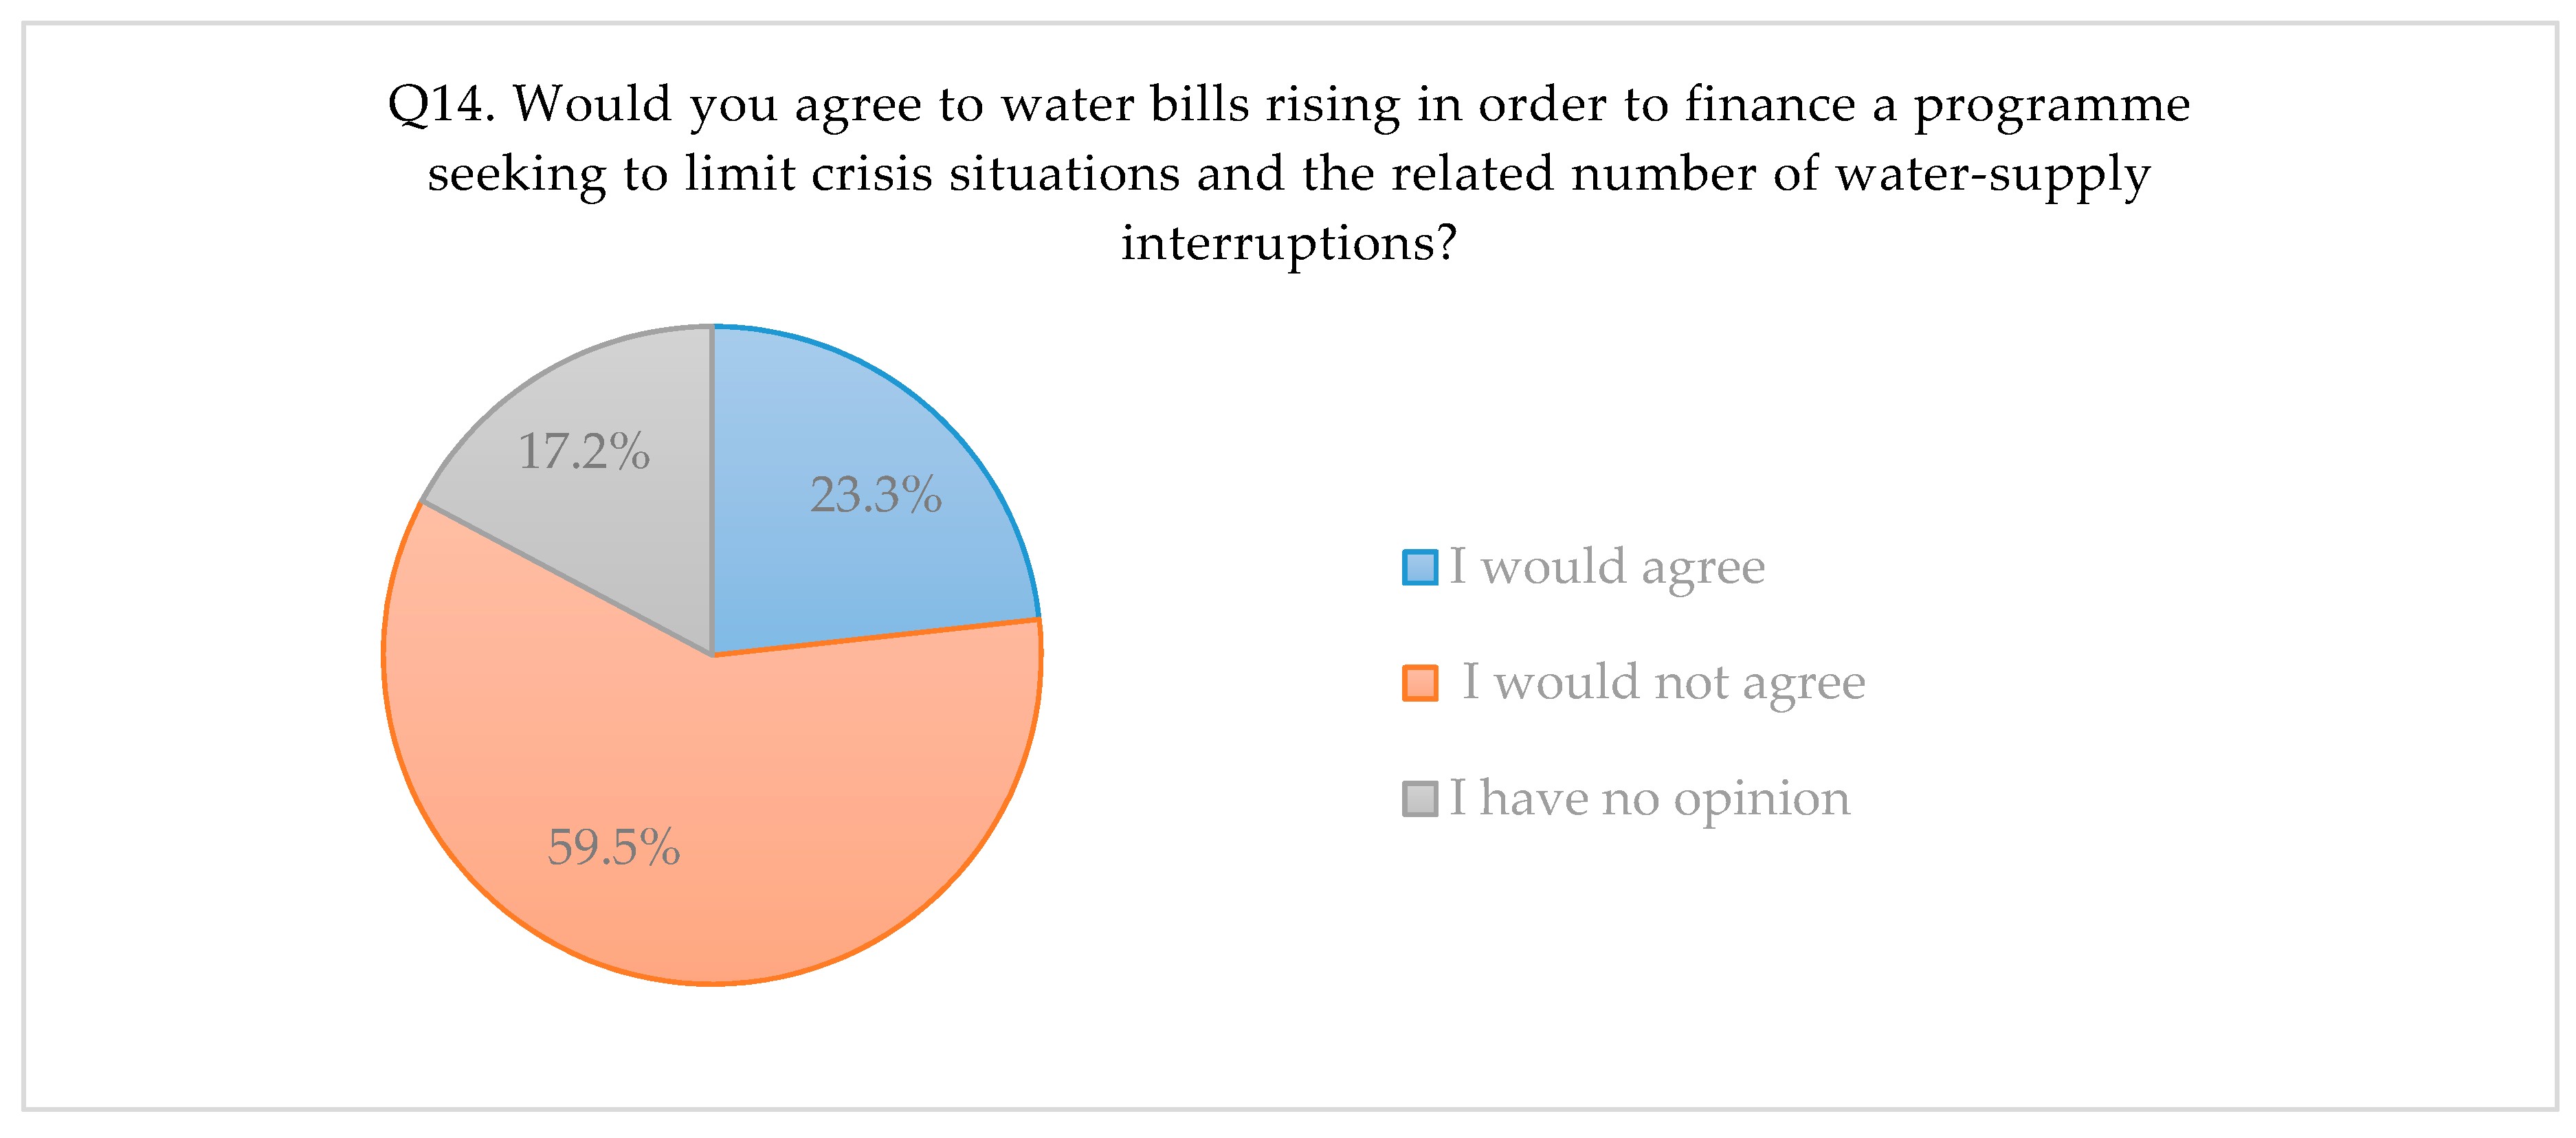
  • I would agree (50 answers)
  • I would not agree (128 answers)
  • I have no opinion (37 answers)
Among those surveyed, the problems arising from interruptions in water supply cited most regularly were those associated with daily activities. These include personal hygiene (indicated by 25% of respondents), washing dishes (ca. 23%) and cooking (ca. 22%). Laundering is affected to a less onerous extent, being indicated by 19% of those completing the survey. In turn, the least frequently problematical consequences arising out of a lack of water were: watering plants (as mentioned by just 3% of respondents), financial losses (8%), cleaning (ca. 4%), and washing a car or agricultural equipment (less than 1%).
About 23.3% of respondents would agree to an increased fee for a more-secure water supply, provided that the bill did not rise by more than 10% above the current level. Analysis of the distribution of responses in line with characteristics supplied in the metric sustains the conclusion that neither level of education nor gender were important in determining types of inconvenience experienced/anticipated in the event of interruptions in water supply.
Application of the Analytical Hierarchy Process brought to light key pairs of main-criteria comparison as follows:
  • for the 1st criterion of water quality concerning organoleptic characteristics (0.4326)
  • for the 2nd criterion of customer-friendliness and quality of service on the part of water companies (0.0698)
  • for the 3rd criterion of price per m3 of water (0.1989)
  • for the 4th criterion of reliability of water supply (0.2987)
As the determined consistency ratio (0.0965) and consistency index (0.0859) are acceptable where values remain below 0.1, the obtained results can be accepted. The principal eigenvalue is 4.2576, and the random index 0.89. The analysis thus shows that the predominant impact on perceived quality of water-supply service is exerted by water’s organoleptic quality (0.4326) (taste and smell respectively at 0.299 and 0.1095), as well as reliability (0.2987). In third place, respondents most often place unit water price.
Features such as customer friendliness prove least important to a considerable proportion of consumers, with office service work and possibility of discounts being negotiated for companies’ non-compliance with water-supply standards at 0.0169 and 0.0025 respectively. Recipients’ most-important criteria can constitute a basis for a detailed contract to be concluded with the supplier.
In this regard, it should be noted how the market economy is linked with growing awareness among recipients, who expect improved quality of service, and are thus potentially capable of impacting upon a water company’s reliability of operations. The costs of achieving improved quality of service may raise water prices, but that impact on the economics of a given enterprise would most likely prove positive. A water company should nevertheless choose an appropriate form of insurance so as to be able to compensate water recipients, wherever quality of service has suffered more markedly.
The results of other research [49] indicate how relevant to consumer assessment is the factor of reliability of water supply expressed in both qualitative and quantitative terms. The test results contained in [50] likewise point to the importance of continuity of water supply as assessments are made by consumers, who are seen to be willing to pay more if the effect is a reduction in the frequency and duration of interruptions in supply.
The aim of safety operations within a water-supply system is to counteract situations in which lack of water or poor quality threaten the health of mains-water users, and to supervise action using processes and resources of information relating to given operating conditions, in compliance with law in force, and as justified economically [51]. However, legal regulations do not control the operations of water companies or the conditions where the receipt of water with certain deficiencies is concerned. One example is the lack of clear rules defining the minimum level of service to customers that water companies may supply. Rules of this kind that do exist reflect local legislation approved by local authorities.

3.2. Limitations and Usefulness of the Proposed Approach

The surveying of water consumers can offer comprehensive insight into the quality and functioning of collective water-supply systems (CWSS), as well as checking consumers’ perceptions. The approach can be useful in supplying information vis-à-vis standards of customer service [52]. A CWSS is usually redundant, in that nominal production exceeds the maximum daily demand for drinking water. Therefore, in countries where a CWSS is present, the proposed approach allows for orientation in regard to consumer opinions, and for checks on consumers’ satisfaction with operations. Case studies presented in works [53,54,55] indicate that the identification of preferences will be helpful for cost-benefit analysis and allow interruptions in water supply to be assessed. A limitation of the method used relates to populations served, and also therefore to sample size, in line with [45].
A further limit reflects the inadequacy of certain questions in systems with water shortages, as we do not then ask about the quality of water-supply services in the event of interrupted supply. Where water supply is still developing, a pro-consumer attitude is also needed to improve service [56], but the situation is obviously still different from one in which a continuous water supply is taken for granted [57]. A lack of access to safe tap water must denote resort to alternative technologies by which water from potentially contaminated sources can be purified, with citizens in crisis situations perhaps even forced to source their own water for consumption. In such a crisis, a lack of network water denotes the possibility of supply from alternative sources, such as residential and home wells, barrels, water carts, retail sale (of bottled water), or suburban sources. Therefore, the conducted surveys can help in developing a plan for water supply in emergency situations, covering the balance of water demand under normal conditions and in a period of limited supply, both regarding the necessary and minimum quantities. The prepared balance sheet should contain the qualitative and quantitative characteristics of the water-supply services necessary for servicing in full readiness, taking into account the organisation of communications in the state of full readiness for the purpose of notification, and the schedule of water delivery in the event of a supply failure. On this basis, it becomes possible to draw up a list of tasks arising out of the assumed schedule, and related to the protection of the population within the area supplied.

4. Conclusions and Prospects

Water companies should survey recipients of their water, because correct assessment of the operation of water-supply systems in crisis situations is to some degree a matter of how people feel. Conducted surveys provide at least an indication as to how high consumers’ feelings run when supplies are disturbed. Results will allow for better adjustment of conditions of water supply to recipients’ needs, in the event of an adverse event that proves life-threatening. The approach proposed here can therefore facilitate management, in such a way that service provision at a certain level could be better ensured.
Efforts to ensure the safe operation of a water-supply system are helped by the use of surveys, which allow for an assessment of the relationship between emerging threats, security applied, and safety barriers. Furthermore, relevant legislation is tending to move towards systemic safety assurances, through the introduction of standard analyses and assessments of technical systems. Encompassed in this way are crisis management, early-warning systems in crisis situations and the security of information systems. Results obtained from a survey of the kind advocated here will help with the management of risky situations through early warning and the monitoring of threats. As is clear from the real-life survey presented in this article, great emphasis is put on the reliability and safety of operations involving water supply. As recipients were clear about the importance of these services being provided, this confirms the importance and validity of scientific research into reliability and security of water supply. Indeed, surveys should become a matter of daily practice, as they gauge customer satisfaction, in this way offering valuable material for water-supply companies intent on improving quality.
If the safe operation of water-supply systems is to be fully ensured, knowledge should not only be gathered, but also disseminated, with public dialogue run inter alia to develop opportunities for effective action when crises arise. The survey proposed here can offer information on water supply, and will help with development of the safety plans representing a key element of any strategy to reduce the likelihood and impact of adverse water-supply events.
A condition for the rationalisation of an anti-crisis strategy is that surveys should relate to the lack of supply of tap water, given that this approach contributes to the safe functioning of supply systems, and allows effective safety- and protection-related barriers to be planned.
The subject-matter of this article can develop further in the direction of quality standards for levels of water service in crisis situations that take account of both consumer opinions and those of water companies themselves. The research presented here offers an important set of data relating to consumers’ points of view. A proposal arising from it would take an applied direction, with a pilot programme for a selected water supply that would seek to confirm conclusions. That would further facilitate proper management of public water supply, as well as the monitoring of quality of service when it comes to the supply of drinking water of required parameters.

Author Contributions

K.P.-U. and J.R.R. equally contributed to the development of this manuscript. All authors have read and agreed to the published version of the manuscript.

Funding

This research received no external funding.

Acknowledgments

We thank the reviewers for their feedback, which helped to improve the manuscript quality.

Conflicts of Interest

The authors declare no conflict of interest.

Appendix A

Figure A1. Q1. The regularity of use of different sources of water in households.
Energies 13 03617 g0a1
Figure A2. Q2. Assessments of water quality (smell), according to respondents.
Energies 13 03617 g0a2
Figure A3. Q3. Assessments of water quality (taste), according to respondents.
Energies 13 03617 g0a3
Figure A4. Q4. Sources of water in the case of the failure of the water-supply network.
Energies 13 03617 g0a4
Figure A5. Q5. Ways in which the water company informs consumers about the estimated duration of interruptions in supply.
Energies 13 03617 g0a5
Figure A6. Q6. Effectiveness of the way the water company informs consumers about interruptions in supply.
Energies 13 03617 g0a6
Figure A7. Q7. The water company’s provision of water from other sources in the course of a supply failure.
Energies 13 03617 g0a7
Figure A8. Q8. Ways of gathering a supply of water in advance of announced interruptions in delivery.
Energies 13 03617 g0a8
Figure A9. Q9. Gratification for interruptions in water supply, according to respondents.
Energies 13 03617 g0a9
Figure A10. Q10. Satisfactory guaranteed time for the rectification of a failure in supply, according to respondents.
Energies 13 03617 g0a10
Figure A11. Q11. Demand for water in a crisis situation, according to respondents.
Energies 13 03617 g0a11
Figure A12. Q12. Possession of household water-treatment measures among respondents.
Energies 13 03617 g0a12
Figure A13. Q13. Views on the nuisance an interruption in water supply denotes, with account taken of respondents’ gender.
Energies 13 03617 g0a13
Figure A14. Q14. Consumers’ willingness to pay higher water bills in order to limit crisis situations.
Energies 13 03617 g0a14

References

  1. Amorocho-Daza, H.; Cabrales, S.; Santos, R.; Saldarriaga, J. A New Multi-Criteria Decision Analysis Methodology for the Selection of New Water Supply Infrastructure. Water 2019, 11, 805. [Google Scholar] [CrossRef] [Green Version]
  2. EN 15975. Security of Drinking Water Supply—Guidelines for Risk and Crisis Management. Part 1 & 2; BSI: London, UK, 2011. [Google Scholar]
  3. Ondrejka Harbulakova, V.; Estokova, A.; Kovalcikova, M. Correlation Analysis between Different Types of Corrosion of Concrete Containing Sulfate Resisting Cement. Environments 2017, 4, 44. [Google Scholar] [CrossRef]
  4. Geng, Z.; Hu, X.; Han, Y.; Yanhua, Z. A Novel Leakage-Detection Method Based on Sensitivity Matrix of Pipe Flow: Case Study of Water Distribution Systems. J. Water Resour. Plan. Manag. ASCE. 2019, 145, 04018094. [Google Scholar] [CrossRef]
  5. UN Committee on Economic, Social and Cultural Rights General Comment No. 15. The Right to Water. November 2002. Available online: https://www.refworld.org/pdfid/4538838d11.pdf (accessed on 29 April 2020).
  6. United Nations General Assembly. Resolution A/RES/64/292. July 2010. Available online: https://www.un.org/ga/search/view_doc.asp?symbol=A/RES/64/292 (accessed on 29 April 2020).
  7. The Act of 26 April 2007 on Crisis Management (OJ 2007, No. 89, item 590, as amended). Available online: https://rcb.gov.pl/wp-content/uploads/WERYF_-ACT_Crisis_Management_English-1.pdf (accessed on 29 April 2020).
  8. Council Directive 98/83/EC of 3 November 1998 on the Quality of Water Intended for Human Consumption. UR-Lex Web site. 1998. Available online: https://eur-lex.europa.eu/legal-content/EN/TXT/?uri=CELEX%3A31998L0083 (accessed on 29 April 2020).
  9. World Health Organization. Guidelines for Drinking-Water Quality, 4th ed.; World Health Organization: Geneva, Switzerland, 2011. [Google Scholar]
  10. EN 15975-1. Security of Drinking Water Supply. Guidelines for Risk and Crisis Management. Part 1 Crisis Management; British Standards Institution: London, UK, 2011. [Google Scholar]
  11. EN 15975-2. Security of Drinking Water Supply. Guidelines for Risk and Crisis Management. Part 2. Risk Management; British Standards Institution: London, UK, 2013. [Google Scholar]
  12. Directive 2000/60/EC of the European Parliament and of the Council of 23 October 2000 Establishing a Framework for Community Action in the Field of Water Policy; OJ L 327, 22/12/2000; The European Parliament and of the Council: Brussels, Belgium, 2000.
  13. Bernstein, P.L. Against The Gods: The Remarkable Story of Risk; John Wiley & Sons: New York, NY, USA, 1996. [Google Scholar]
  14. Ociepa, E.; Mrowiec, M.; Deska, I. Analysis of Water Losses and Assessment of Initiatives Aimed at Their Reduction in Selected Water Supply Systems. Water 2019, 11, 1037. [Google Scholar] [CrossRef] [Green Version]
  15. Geng, Z.Q.; Chen, N.; Han, Y.M.; Ma, B. An improved intelligent early warning method based on MWSPCA and its application in complex chemical processes. Can. J. Chem. Eng. 2020, 98, 1307–1318. [Google Scholar] [CrossRef]
  16. Paté-Cornell, E. Uncertainities in risk analysis: Six levels of treatment. Reliab. Eng. Syst. Saf. 1996, 54, 95–111. [Google Scholar] [CrossRef]
  17. Kabsch-Korbutowicz, M.; Kutylowska, M. Use of Artificial Intelligence in Predicting the Turbidity Retention Coefficient during Ultrafiltration of Water. Environ. Prot. Eng. 2011, 2, 75–84. [Google Scholar]
  18. Bai, S.; Wang, X.; Zhao, X.; Ren, N. Characterizing Water Pollution Potential in Life Cycle Impact Assessment Based on Bacterial Growth and Water Quality Models. Water 2018, 11, 1621. [Google Scholar] [CrossRef] [Green Version]
  19. Geng, Z.Q.; Wang, Z.; Hu, H.X.; Han, Y.M.; Lin, X.Y.; Zhong, Y.H. A fault detection method based on horizontal visibility graph-integrated complex networks: Application to complex chemical processes. Can. J. Chem. Eng. 2019, 97, 1129–1138. [Google Scholar] [CrossRef]
  20. Kwietniewski, M. Assessment of the Reliability of Water Supply from the Point of View of its Recipients on the Example of Tests in a Selected Housing Estate. In Proceedings of the 16th Conference of Water Supply, Water Quality and Protection, Cracow-Poznan, Poland, 11–13 September 2000; PZITS Wielkopolska: Cracow-Poznan, Poland, 2000; pp. 705–712. [Google Scholar]
  21. Hill, N.; Roche, G.; Allen, R. Customer Satisfaction: The Customer Experience through the Customer’s Eyes; Cogent Publishing: London, UK, 2007. [Google Scholar]
  22. Kassa, K.; Chernet, M.; Kelemework, G.; Zewde, B.; Woldemedhin, A. Customer Satisfaction Survey: The Case of Urban Water Supply Services in Southern Ethiopia. Water Pract. Tech. 2017, 12, 1009–1017. [Google Scholar] [CrossRef] [Green Version]
  23. Parasuraman, A.; Zeithaml, V.A. Understanding and Improving Service Quality: A Literature Review and Research Agenda. In Handbook of Marketing; Weitz, B., Wensley, R., Eds.; Sage Publications: London, UK, 2005; pp. 339–367. [Google Scholar]
  24. Han, S.; Hwang, H.; Kim, S.; Baek, G.S.; Park, J. Sustainable Water Infrastructure Asset Management: A Gap Analysis of Customer and Service Provider Perspectives. Sustainability 2015, 7, 13334–13350. [Google Scholar] [CrossRef] [Green Version]
  25. Wedgworth, J.C.; Brown, J.; Johnson, P.; Olson, J.B.; Elliott, M.; Forehand, R.; Stauber, C.E. Associations between Perceptions of Drinking Water Service Delivery and Measured Drinking Water Quality in Rural Alabama. Int. J. Environ. Res. Public Health 2014, 11, 7376–7392. [Google Scholar] [CrossRef] [PubMed]
  26. Oluwasanya, G.O.; Carter, R.C. Water Safety Planning for Small Water Supply Systems: The Framework and Control Measures. Water Sci. Technol.-Water Supply 2017, 17, 1524–1533. [Google Scholar] [CrossRef]
  27. Polaskova, K.; Hlavinek, P.; Haloun, R. Integrated Approach for Protection of an Urban Catchment Area. Desalination 2006, 1, 51–59. [Google Scholar] [CrossRef]
  28. World Health Organization. Water Safety Plans. Managing Drinking-Water Quality from Catchment to Consumer, Water, Sanitation and Health. Protection and the Human Environment; World Health Organization: Geneva, Switzerland, 2005. [Google Scholar]
  29. Urbanik, M.; Tchórzewska-Cieślak, B.; Pietrucha-Urbanik, K. Analysis of the Safety of Functioning Gas Pipelines in Terms of the Occurrence of Failures. Energies 2019, 12, 3228. [Google Scholar] [CrossRef] [Green Version]
  30. U.S. Centers for Disease Control and Prevention (CDC). A Guide to Conducting Household Surveys for Water Safety Plans; U.S. Department of Health and Human Services: Atlanta, GA, USA, 2008.
  31. Roeger, A.; Tavares, A.F. Water Safety Plans by Utilities: A review of research on implementation. Util. Policy 2018, 53, 15–24. [Google Scholar] [CrossRef]
  32. Ondrejka Harbulakova, V.; Zelenakova, M.; Purcz, P.; Olejnik, A. Selection of the Best Alternative of Heating System by Environmental Impact Assessment—Case Study. Environments 2018, 5, 19. [Google Scholar] [CrossRef] [Green Version]
  33. Wang, J.; Ge, J.; Gao, Z. Consumers’ Preferences and Derived Willingness-to-Pay for Water Supply Safety Improvement: The Analysis of Pricing and Incentive Strategies. Sustainability 2018, 10, 1704. [Google Scholar] [CrossRef] [Green Version]
  34. Cicatiello, C.; Secondi, L.; Principato, L. Investigating Consumers’ Perception of Discounted Suboptimal Products at Retail Stores. Resources 2019, 8, 129. [Google Scholar] [CrossRef] [Green Version]
  35. da Silva, W.T.P.; de Souza, M.A.A. A Decision Support Model to Aid the Management of Crises in Urban Water Supply Systems (the UWC-MODEL). Urban Water J. 2017, 14, 612–620. [Google Scholar] [CrossRef]
  36. Ghandi, M.; Roozbahani, A. Risk Management of Drinking Water Supply in Critical Conditions Using Fuzzy Promethee V Technique. Water Resour. Manag. 2020, 34, 595–615. [Google Scholar] [CrossRef]
  37. Okumah, M.; Yeboah, A.S.; Nkiaka, E.; Azerigyik, R.A. What Determines Behaviours towards Water Resources Management in a Rural Context? Results of a Quantitative Study. Resources 2019, 8, 109. [Google Scholar] [CrossRef] [Green Version]
  38. Jang, D.; Park, H.; Choi, G. Estimation of Leakage Ratio Using Principal Component Analysis and Artificial Neural Network in Water Distribution Systems. Sustainability 2018, 10, 750. [Google Scholar] [CrossRef] [Green Version]
  39. Rodrigues, F.; Borges, M.; Rodrigues, H. Risk Management in Water Supply Networks: Aveiro Case Study. Environ. Sci. Pollut. Res. 2020, 27, 4598–4611. [Google Scholar] [CrossRef] [PubMed]
  40. Tchorzewska-Cieslak, B.; Wlodarczyk-Makula, M.; Rak, J. Safety Analysis of the Wastewater Treatment Process in the Field of Organic Pollutants Including PAHs. Desalin. Water Treat. 2017, 72, 146–155. [Google Scholar] [CrossRef] [Green Version]
  41. Pernitsky, D.; Umble, A.; McLellan, N. Stantec. Introduction to Coronaviruses. Available online: https://www.stantec.com/en/ideas/content/blog/2020/coronavirus-and-the-water-cycle-here-is-what-treatment-professionals-need-to-know (accessed on 1 March 2020).
  42. Rak, J.; Pietrucha-Urbanik, K. Survey Research Associated with Lack of Water Supply in Crisis Situations. Instal 2016, 2, 54–58. [Google Scholar]
  43. StatSoft, Inc. STATISTICA (Data Analysis Software System), Version 13.3; StatSoft, Inc.: Tulsa, OK, USA, 2019. [Google Scholar]
  44. Saaty, L.T.; Saaty, W.R. (Eds.) Super Decision Program, Version 2.10.0; Creative Decisions Foundation: Pittsburgh, PA, USA, 2019. Available online: www.superdecisions.com (accessed on 10 August 2019).
  45. Kaden, R.J. Marketing Research; Polish Economic Publisher: Warsaw, Poland, 2008. [Google Scholar]
  46. Saaty, L.T. The Analytic Hierarchy Process; McGraw-Hill: New York, NY, USA, 1980. [Google Scholar]
  47. Saaty, L.T. A Scaling Method for Priorities in Hierarchical Structures. J. Math. Psychol. 1977, 15, 234–281. [Google Scholar] [CrossRef]
  48. Okeola, O.G.; Sule, B.F. Evaluation of Management Alternatives for Urban Water Supply System using Multicriteria Decision Analysis. J. King Saud Univ. Eng. Sci. 2012, 24, 19–24. [Google Scholar] [CrossRef] [Green Version]
  49. MacDonald, D.H.; Barnes, M.; Bennett, J.; Morrison, M.; Young, M.D. Using a Choice Modelling Approach for Customer Service Standards in Urban Water. J. Am. Water Resour. Assoc. 2005, 41, 719–728. [Google Scholar] [CrossRef]
  50. Molinos-Senante, M.; Sala-Garrido, R. How Much Should Customers be Compensated for Interruptions in the Drinking Water Supply? Sci. Total Environ. 2017, 586, 642–649. [Google Scholar] [CrossRef] [PubMed]
  51. Willis, K.G.; Scarpa, R.; Acutt, M. Assessing Water Company Customer Preferences and Willingness to pay for Service Improvements: A Stated Choice Analysis. Water Resour. Res. 2005, 41, W02019. [Google Scholar] [CrossRef]
  52. Chenoweth, J.; Barnett, J.; Capelos, T.; Fife-Schaw, C.C.; Kelay, T. Comparison of Consumer Attitudes Between Cyprus and Latvia: An Evaluation of Effect of Setting on Consumer Preferences in the Water Industry. Water Resour. Manag. 2010, 24, 4339–4358. [Google Scholar] [CrossRef]
  53. Kodikara, P.N.; Perera, B.J.C.; Kularathna, M.D.U.P. Stakeholder Preference Elicitation and Modelling in Multi-Criteria Decision Analysis—A Case Study on Urban Water Supply. Eur. J. Oper. Res. 2010, 206, 209–220. [Google Scholar] [CrossRef]
  54. Ciaponi, C.; Murari, E.; Todeschini, S. Modularity-Based Procedure for Partitioning Water Distribution Systems into Independent Districts. Water Resour. Manag. 2016, 30, 2021–2036. [Google Scholar] [CrossRef]
  55. Sjostrand, K.; Lindhe, A.; Soderqvist, T.; Rosen, L. Cost-Benefit Analysis for Supporting Intermunicipal Decisions on Drinking Water Supply. J. Water Resour. Plan. Manag.-ASCE 2019, 145, 04019060. [Google Scholar] [CrossRef] [Green Version]
  56. Franceys, R.W.A.; Gerlach, E. Consumer involvement in water services regulation. Util. Policy 2011, 19, 61–70. [Google Scholar] [CrossRef]
  57. Islam, M.S.; Sadiq, R.; Rodriguez, M.J.; Najjaran, H.; Hoorfar, M. Reliability Assessment for Water Supply Systems under Uncertainties. J. Water Resour. Plan. Manag.-ASCE 2014, 140, 468–479. [Google Scholar] [CrossRef]
Figure 1. Location of the examined water-supply system.
Energies 13 03617 g001

