Evaluating Patterns of Building Envelope Air Leakage with Infrared Thermography

 and
and
Abstract
1. Introduction
2. Objective
3. Methodology
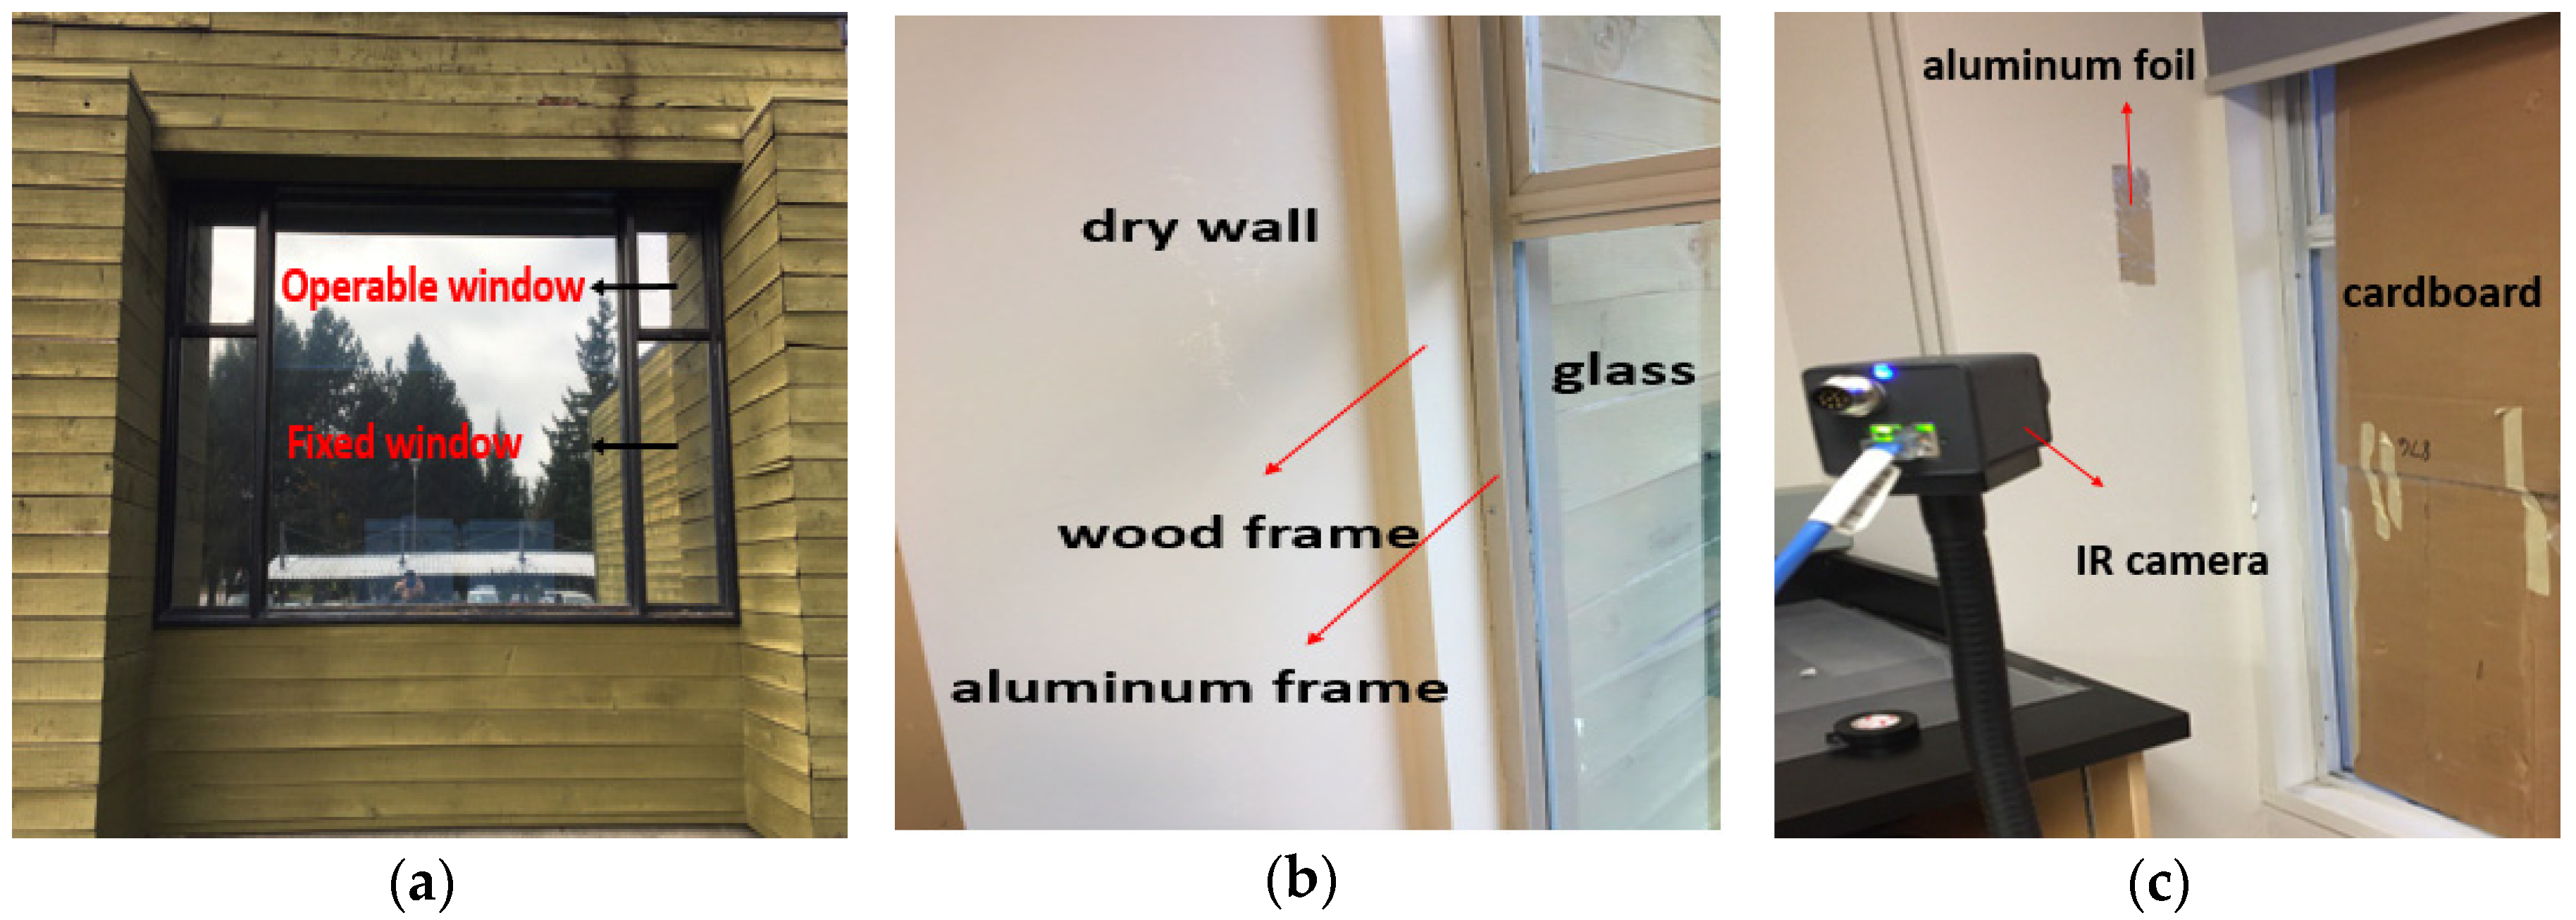
3.1. Test Object
3.2. Equipment
3.3. Test Procedure
4. Results and Discussion
4.1. Air Leakage Evaluation
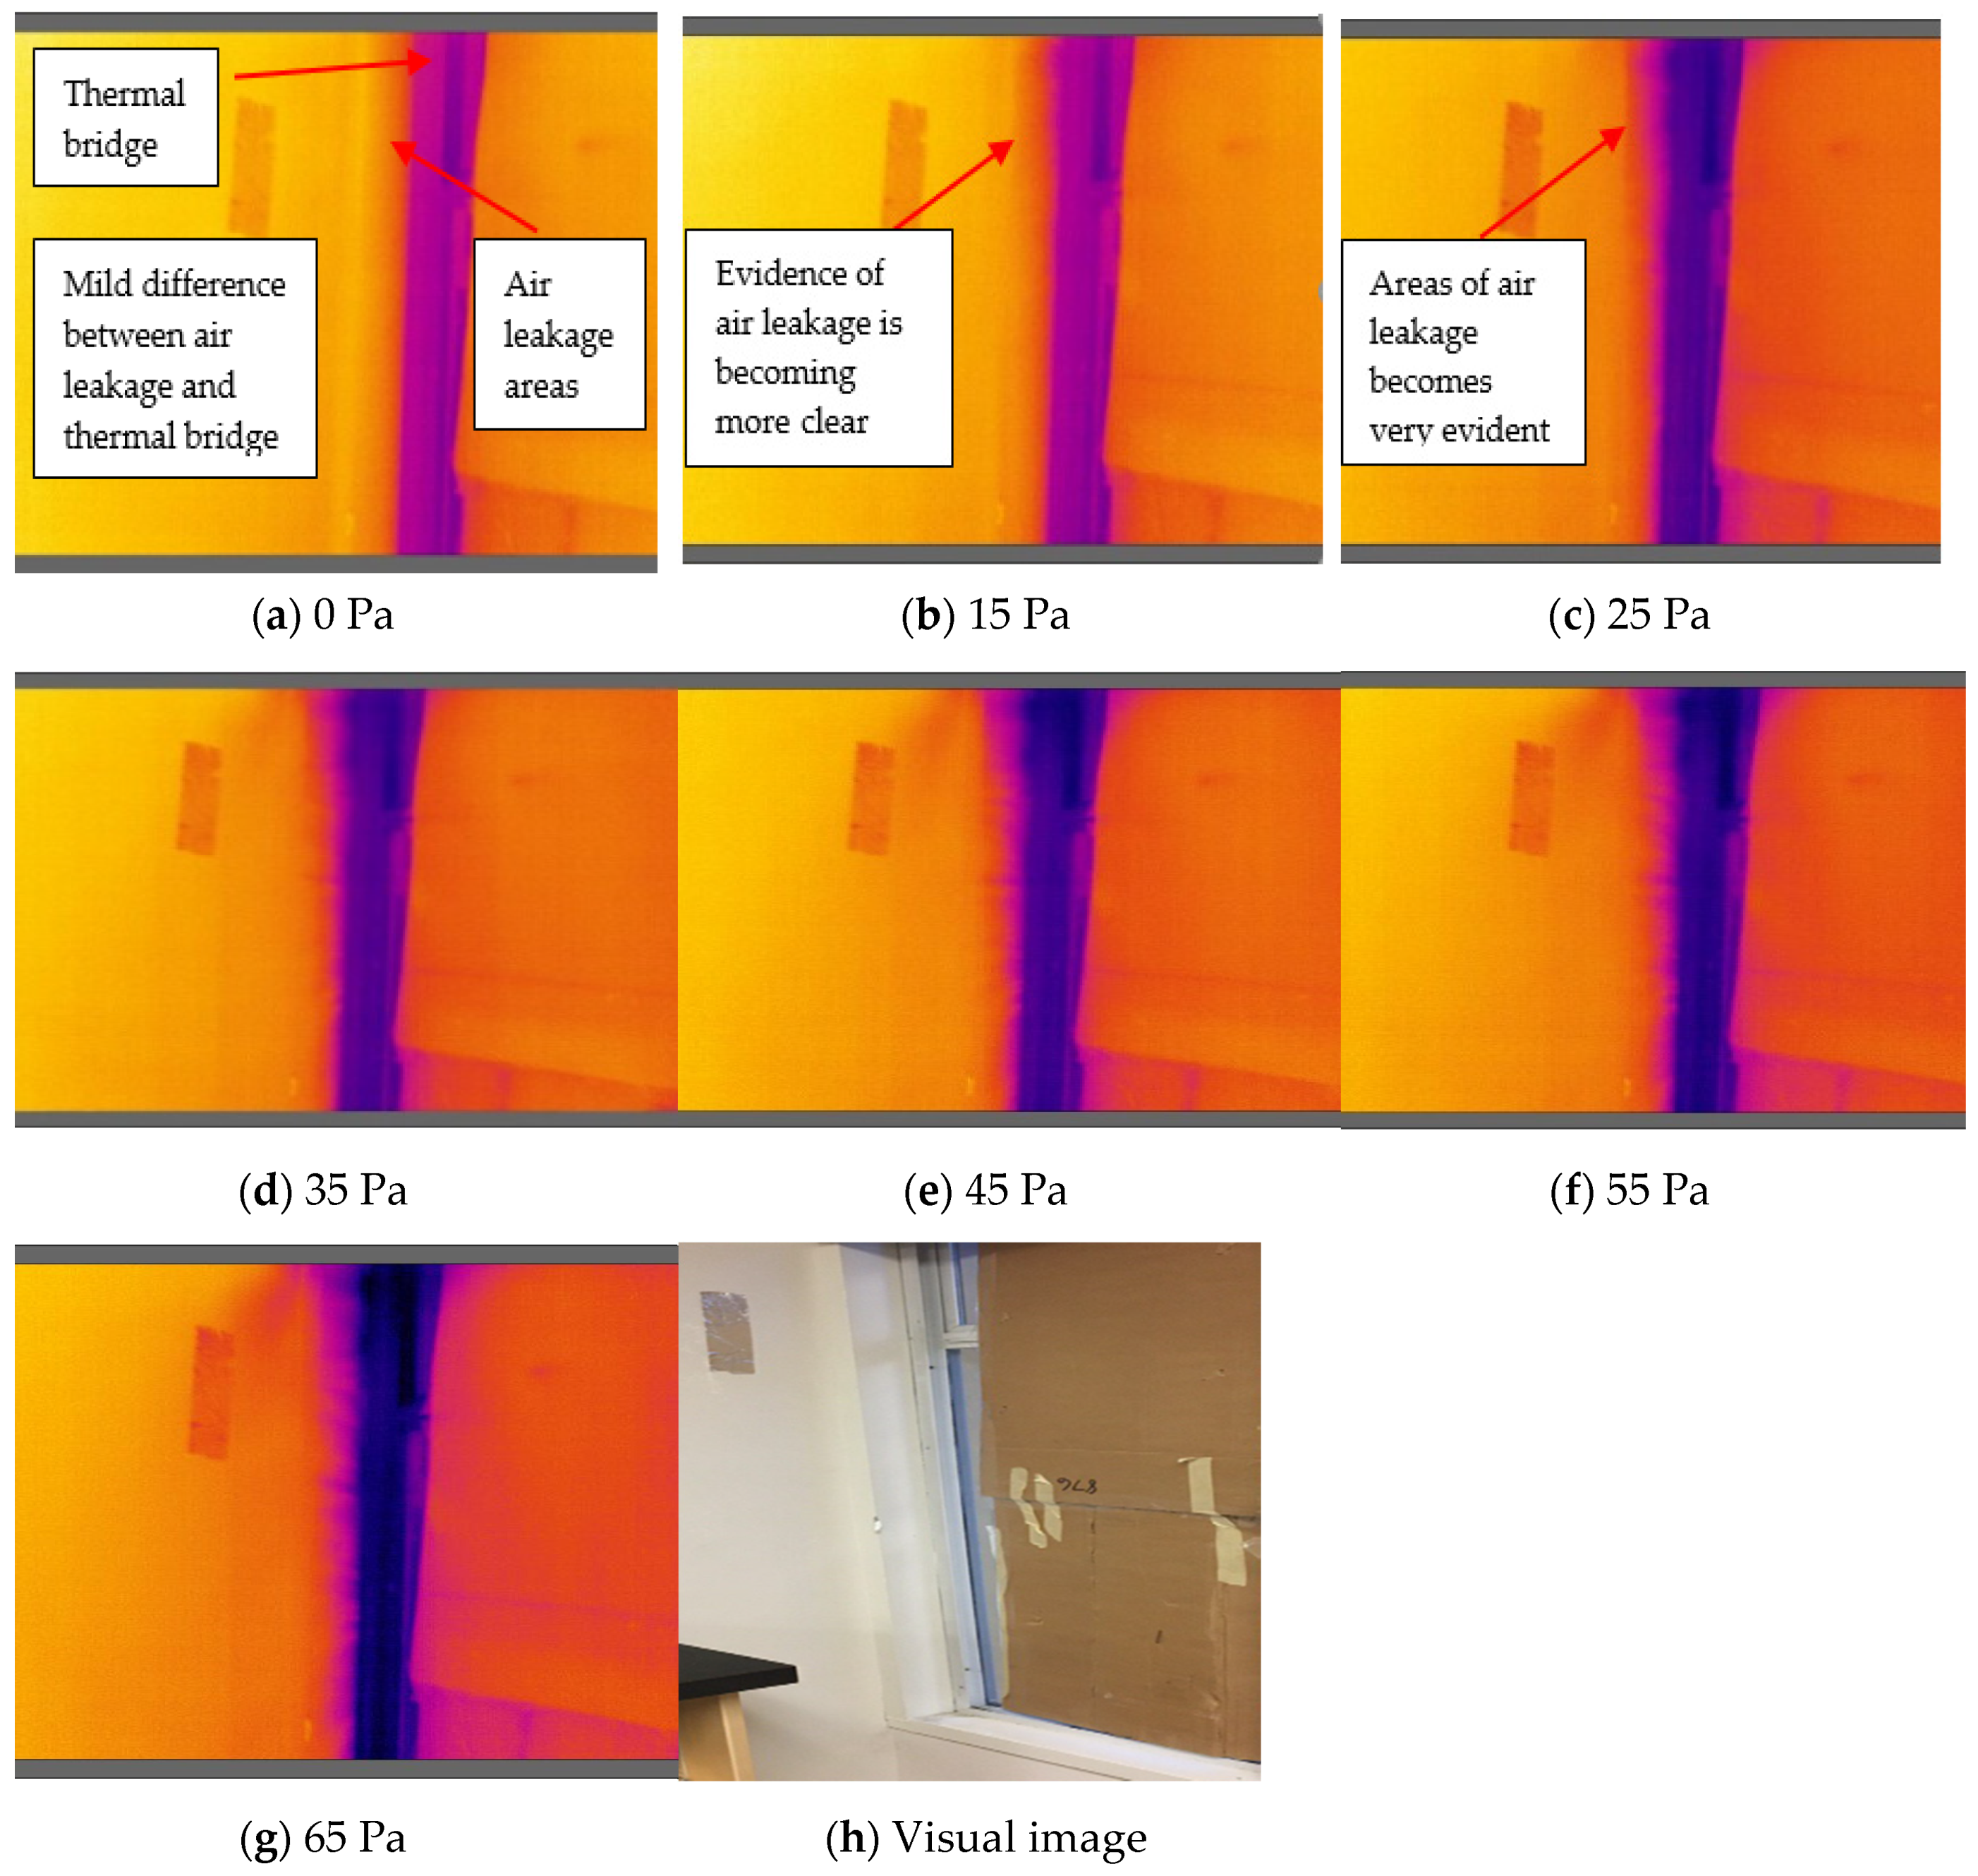
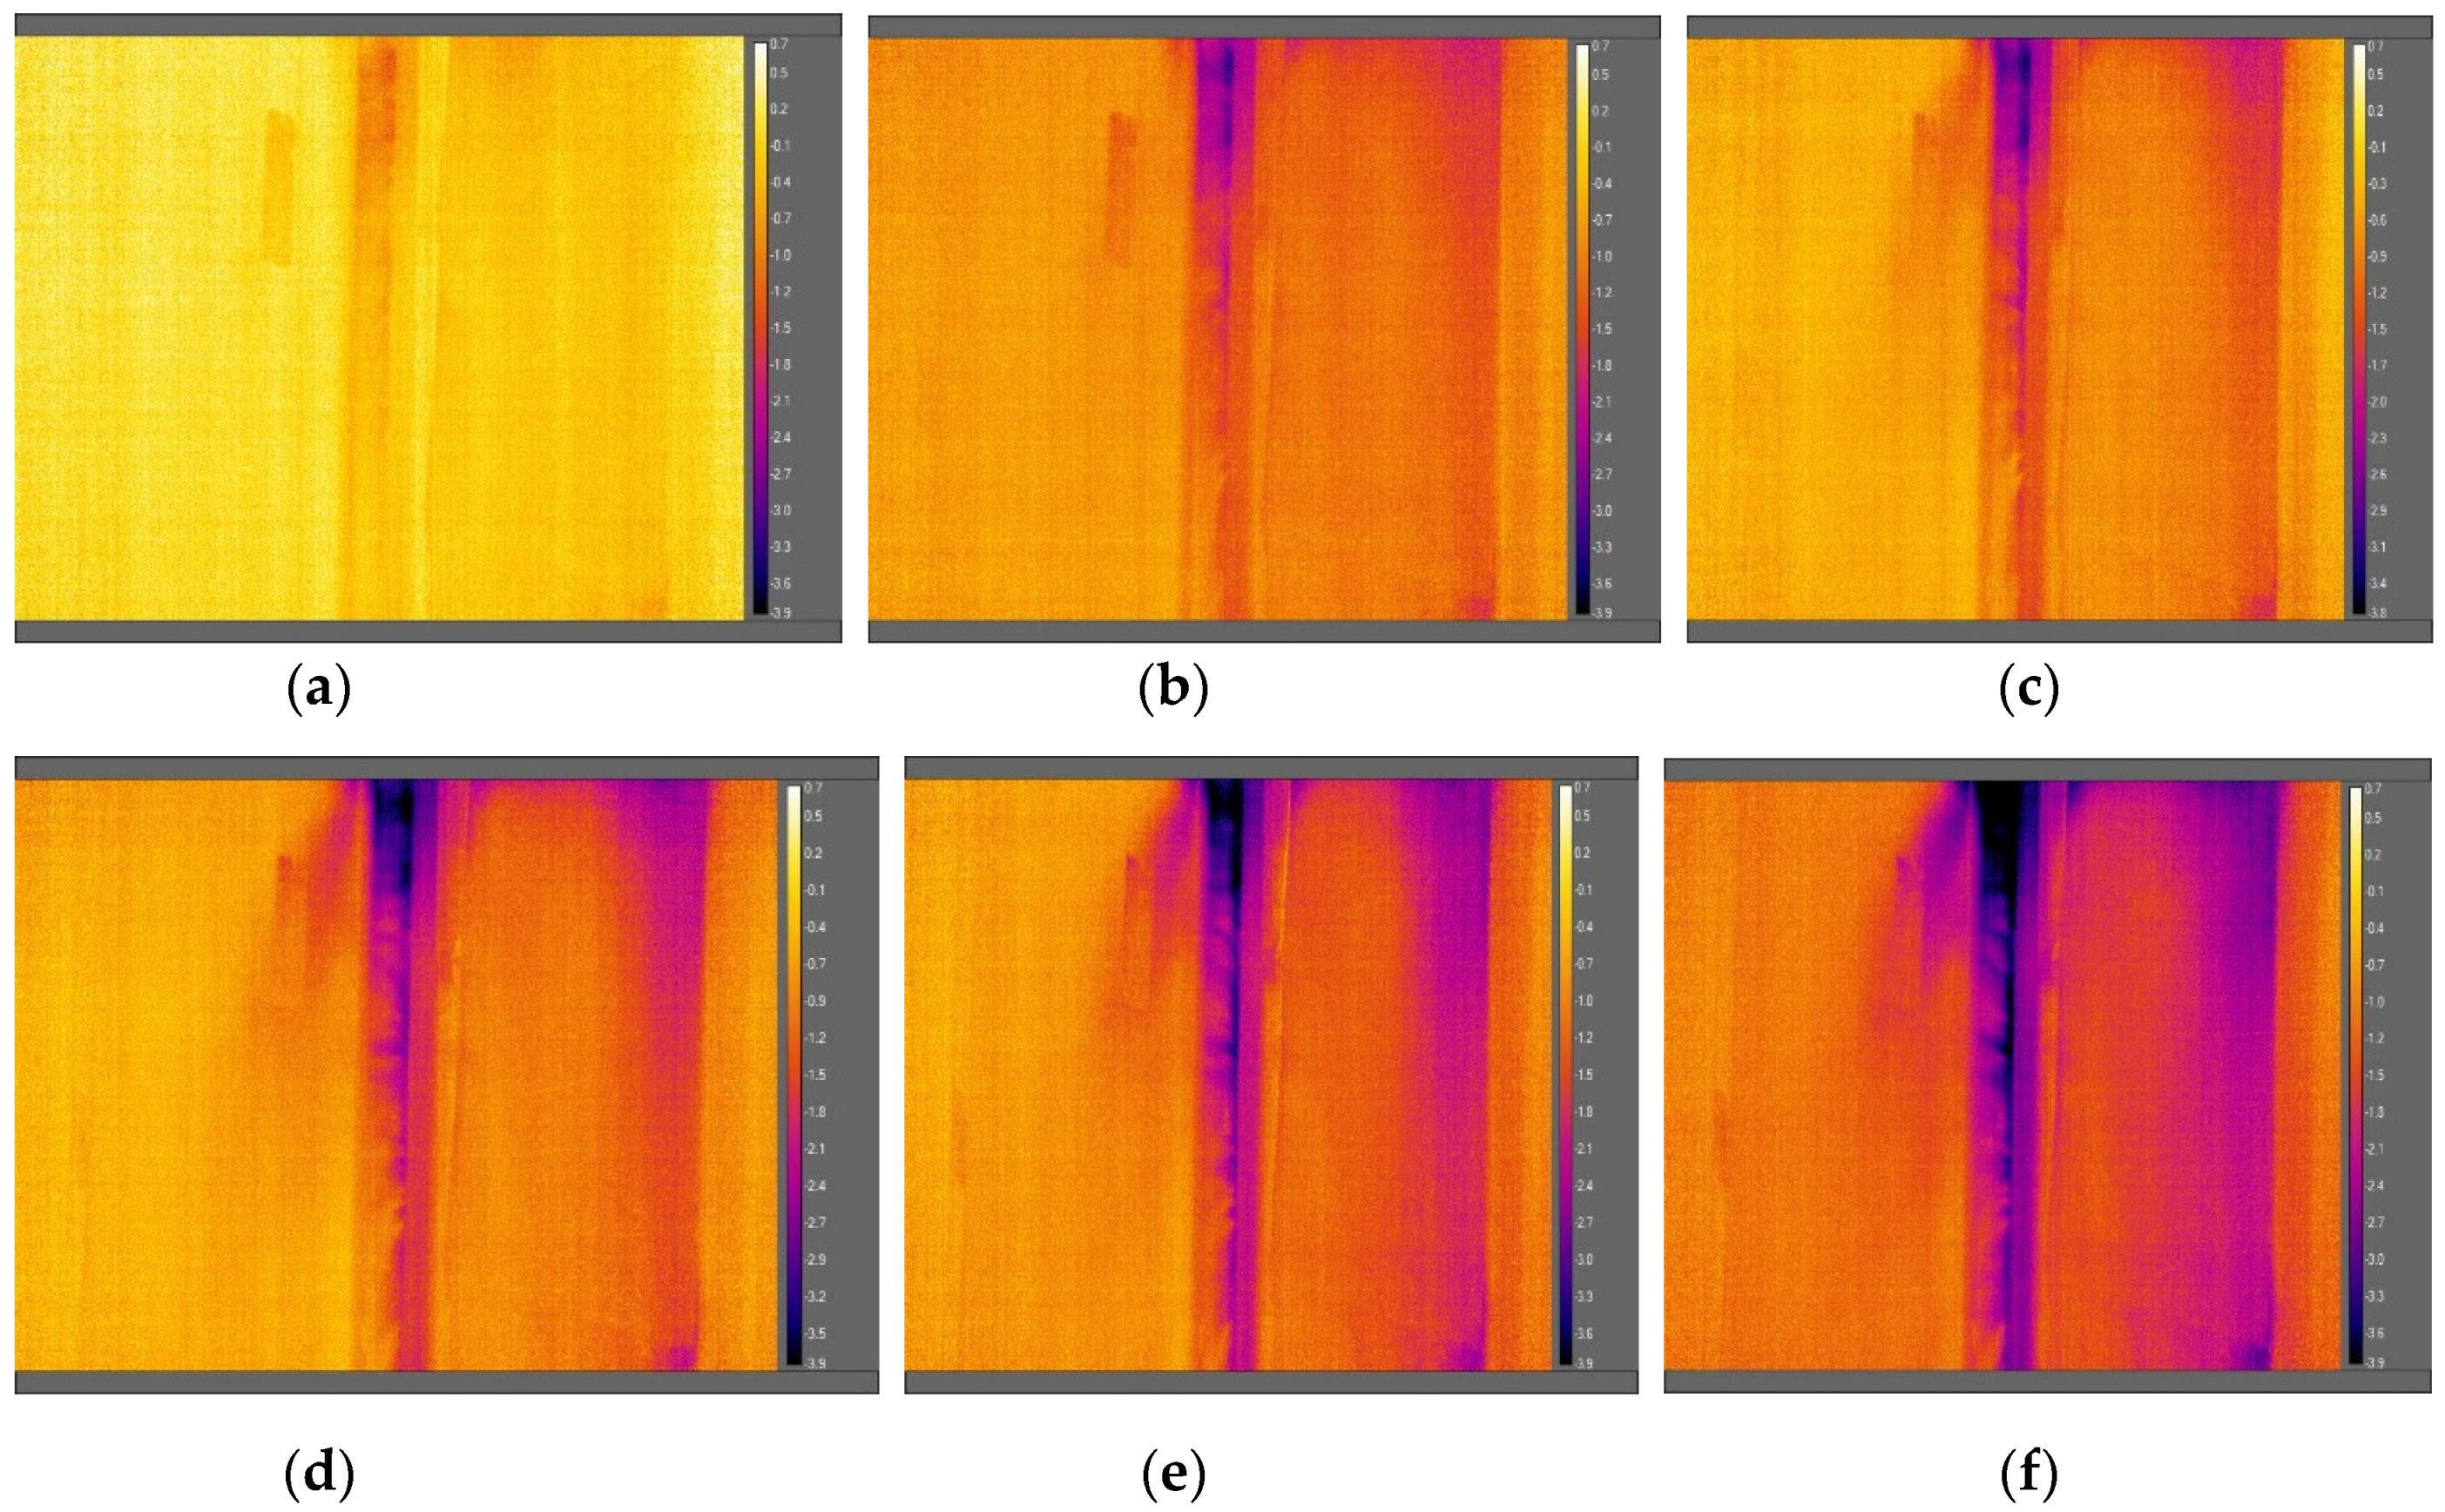
4.2. Qualitative Observations of Infrared Thermography
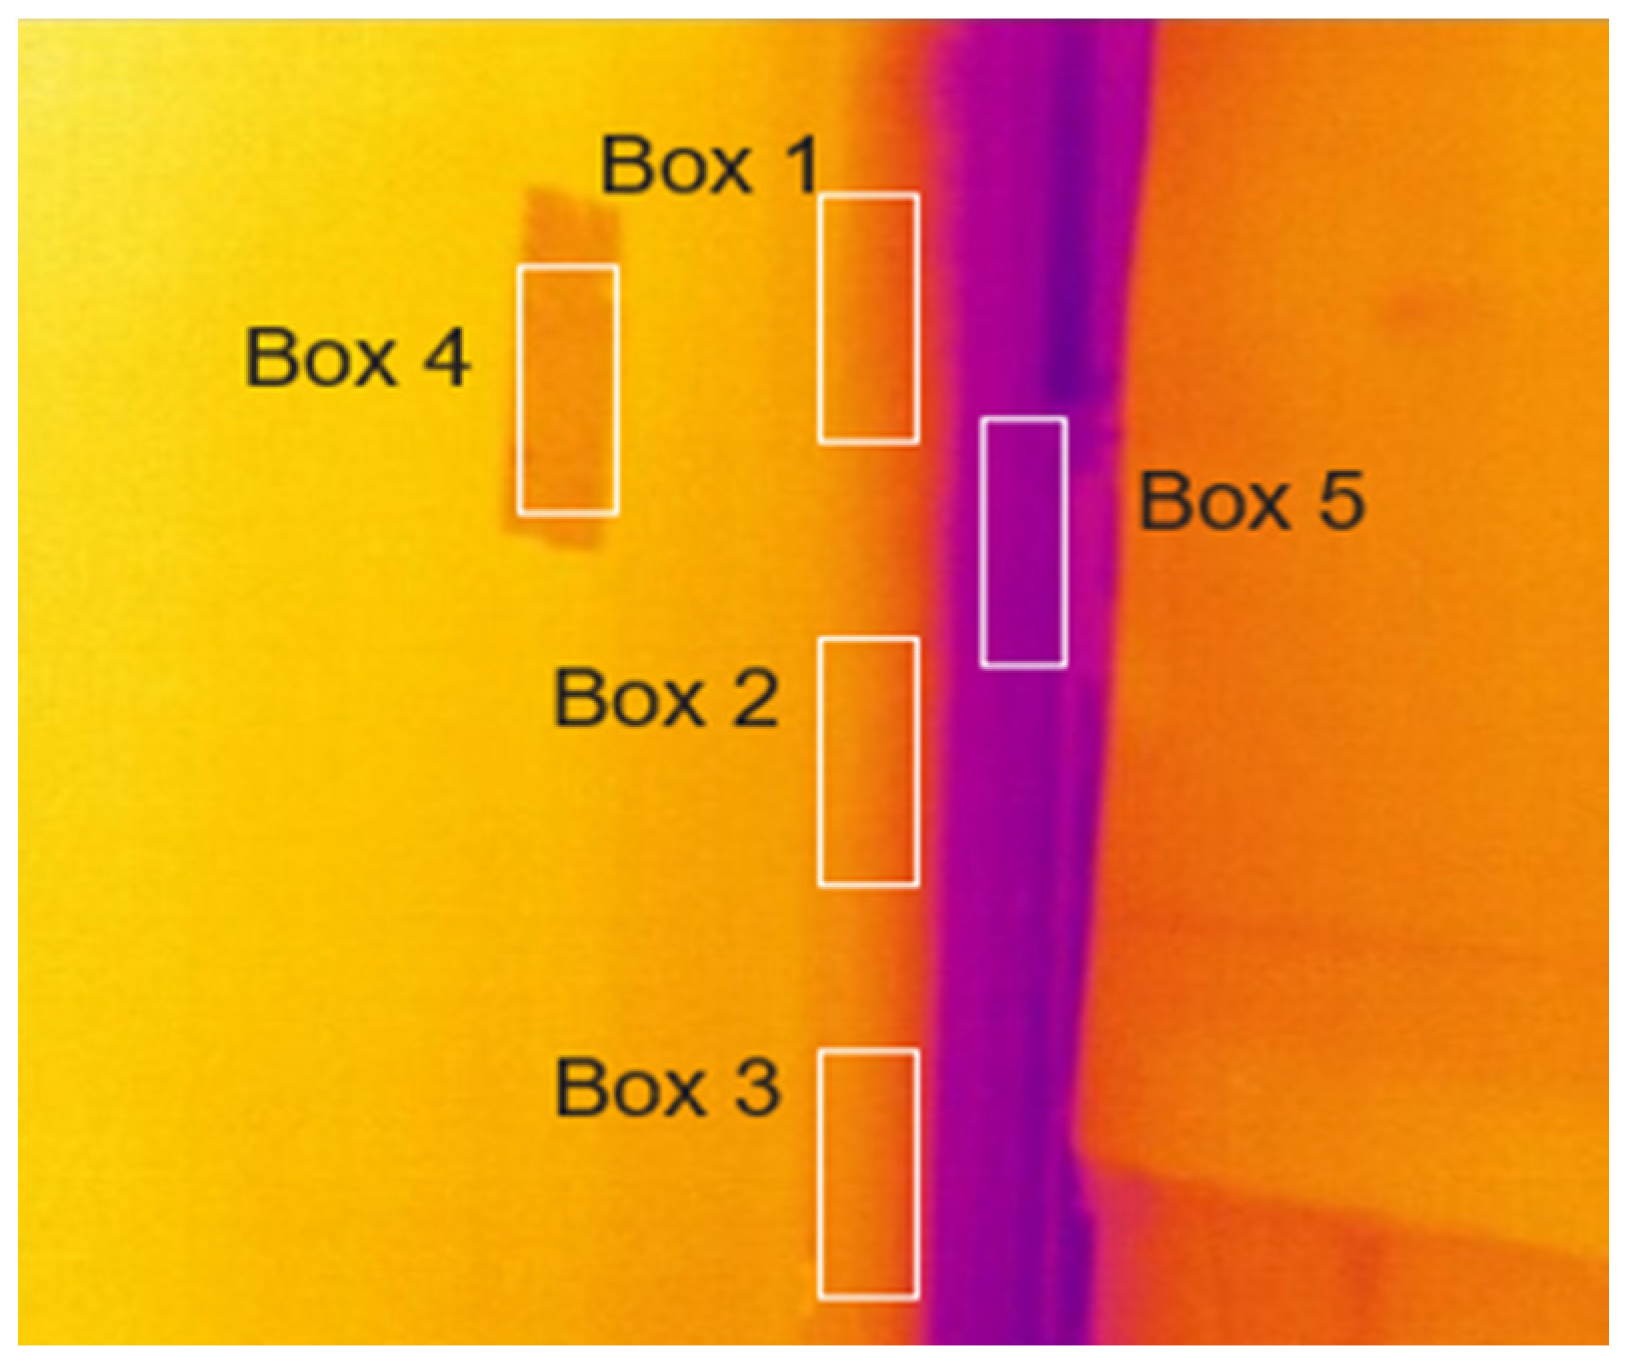
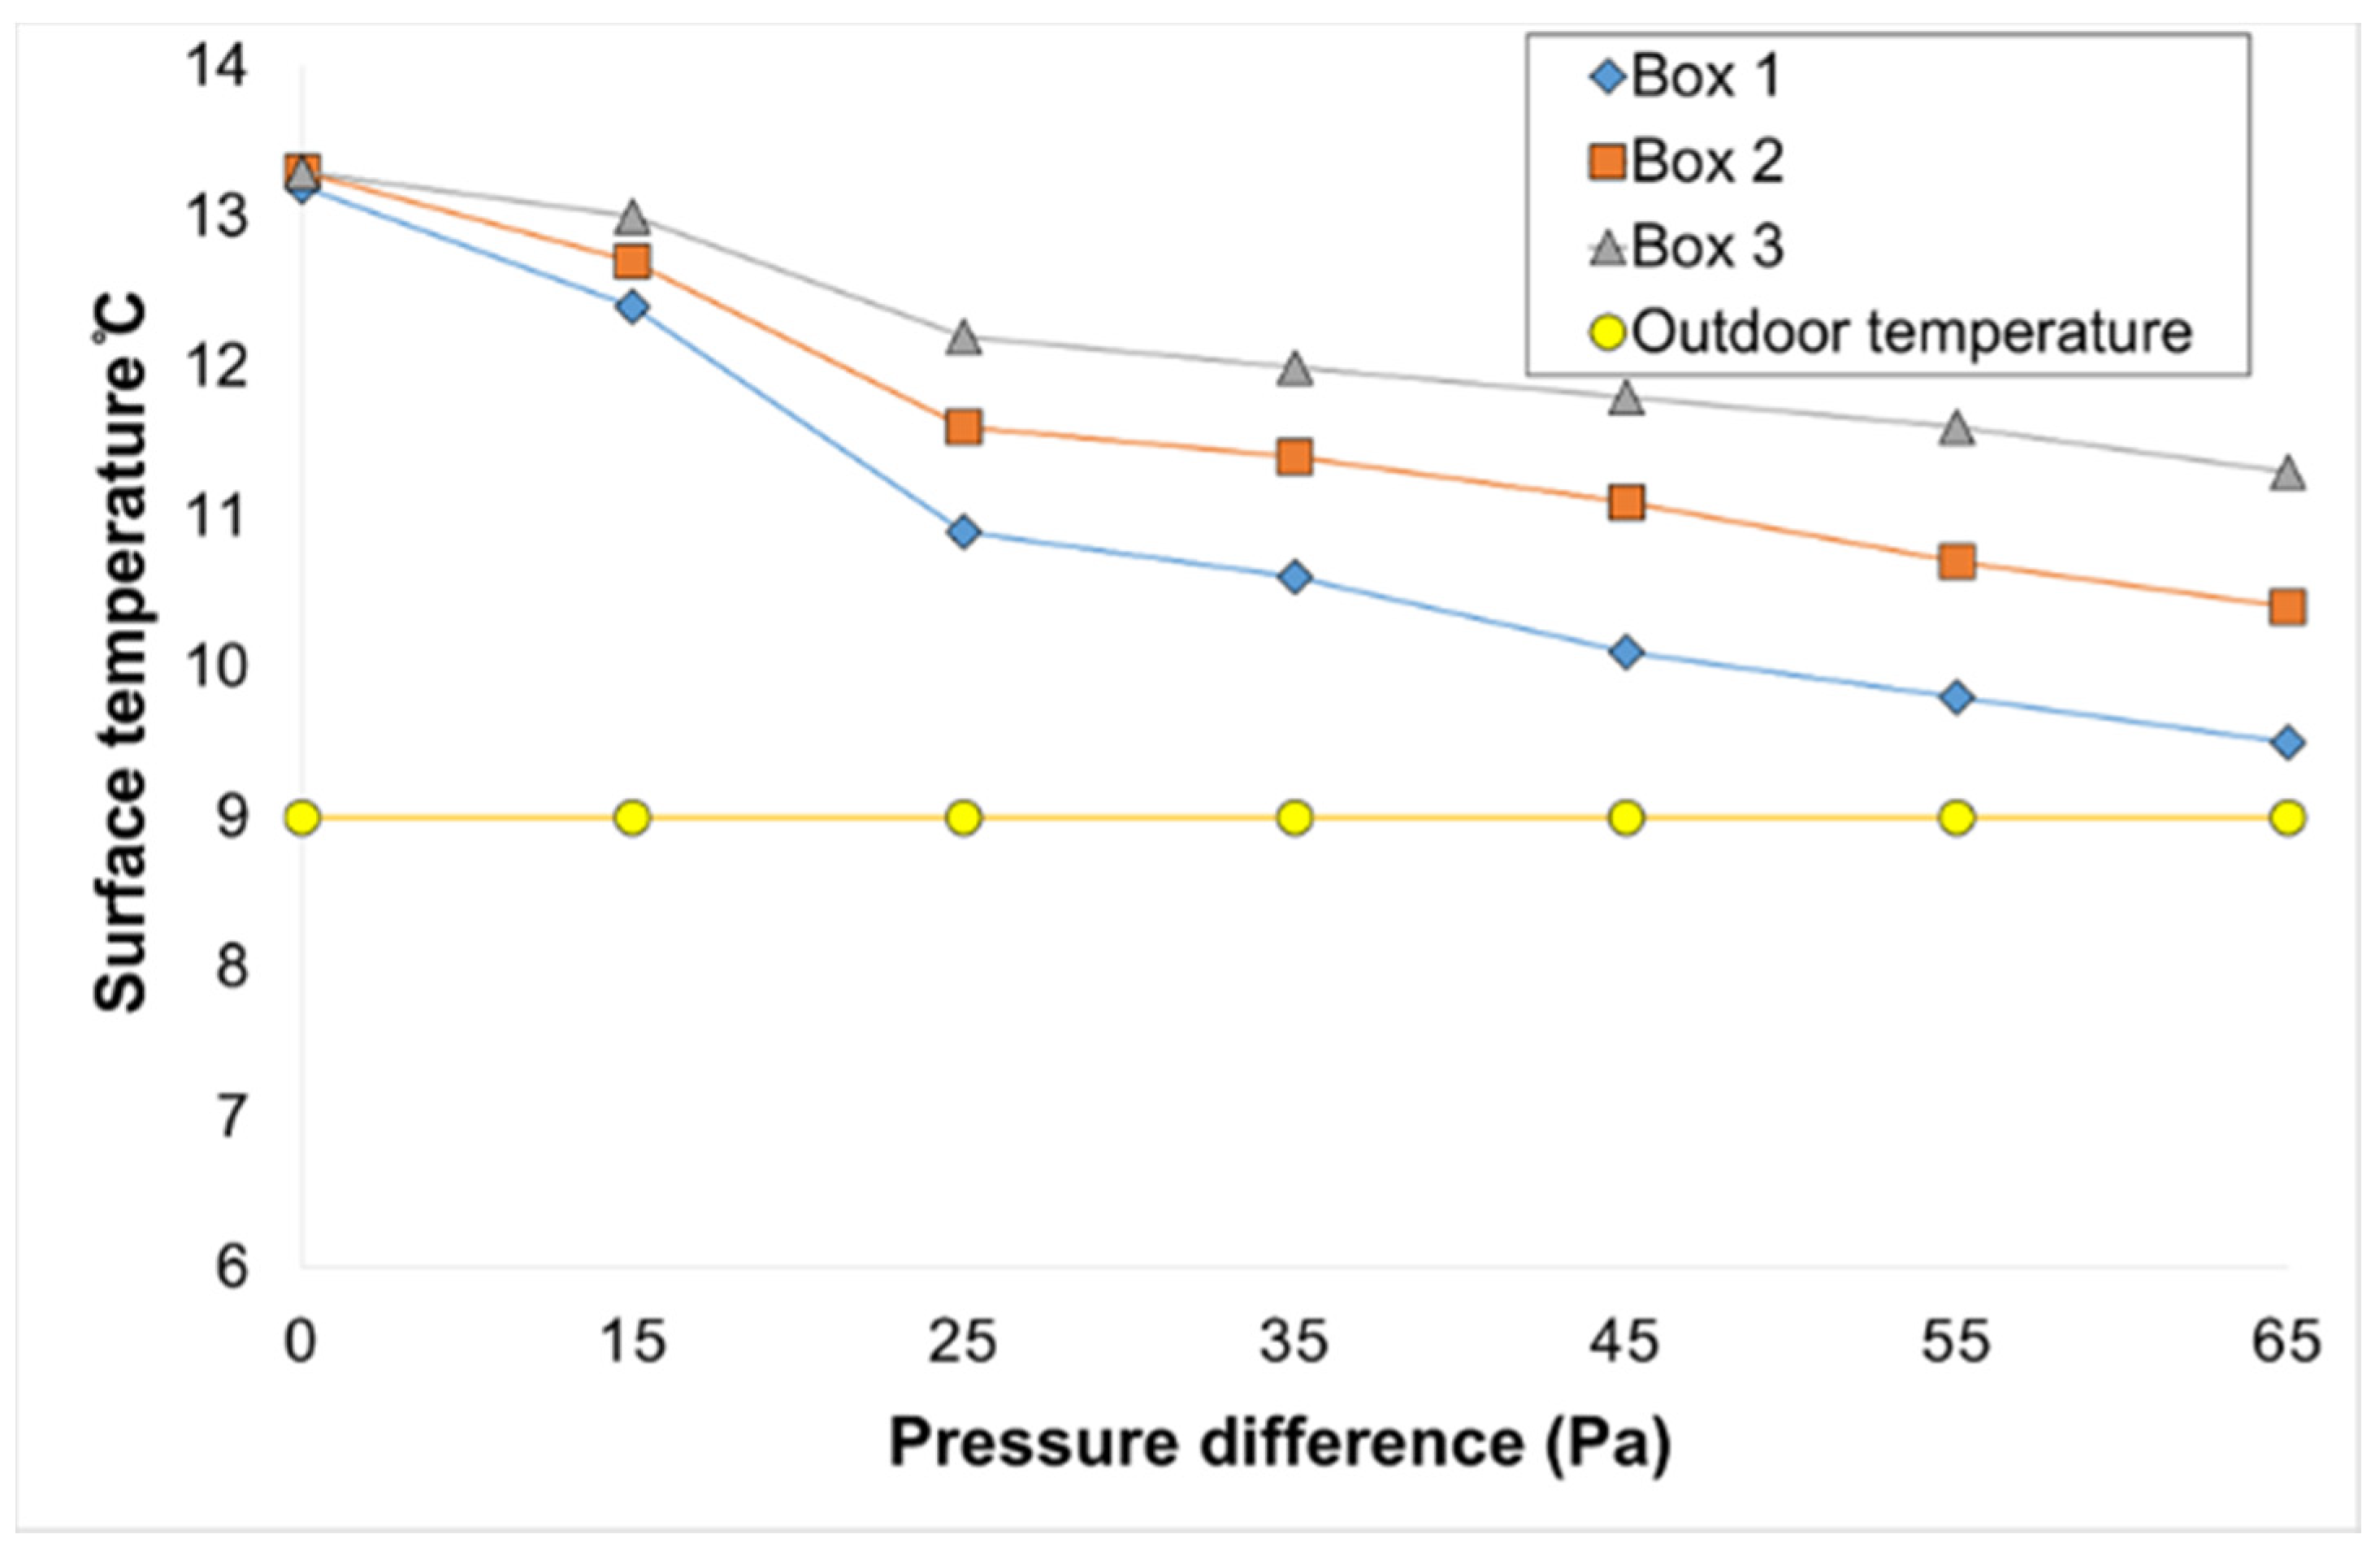
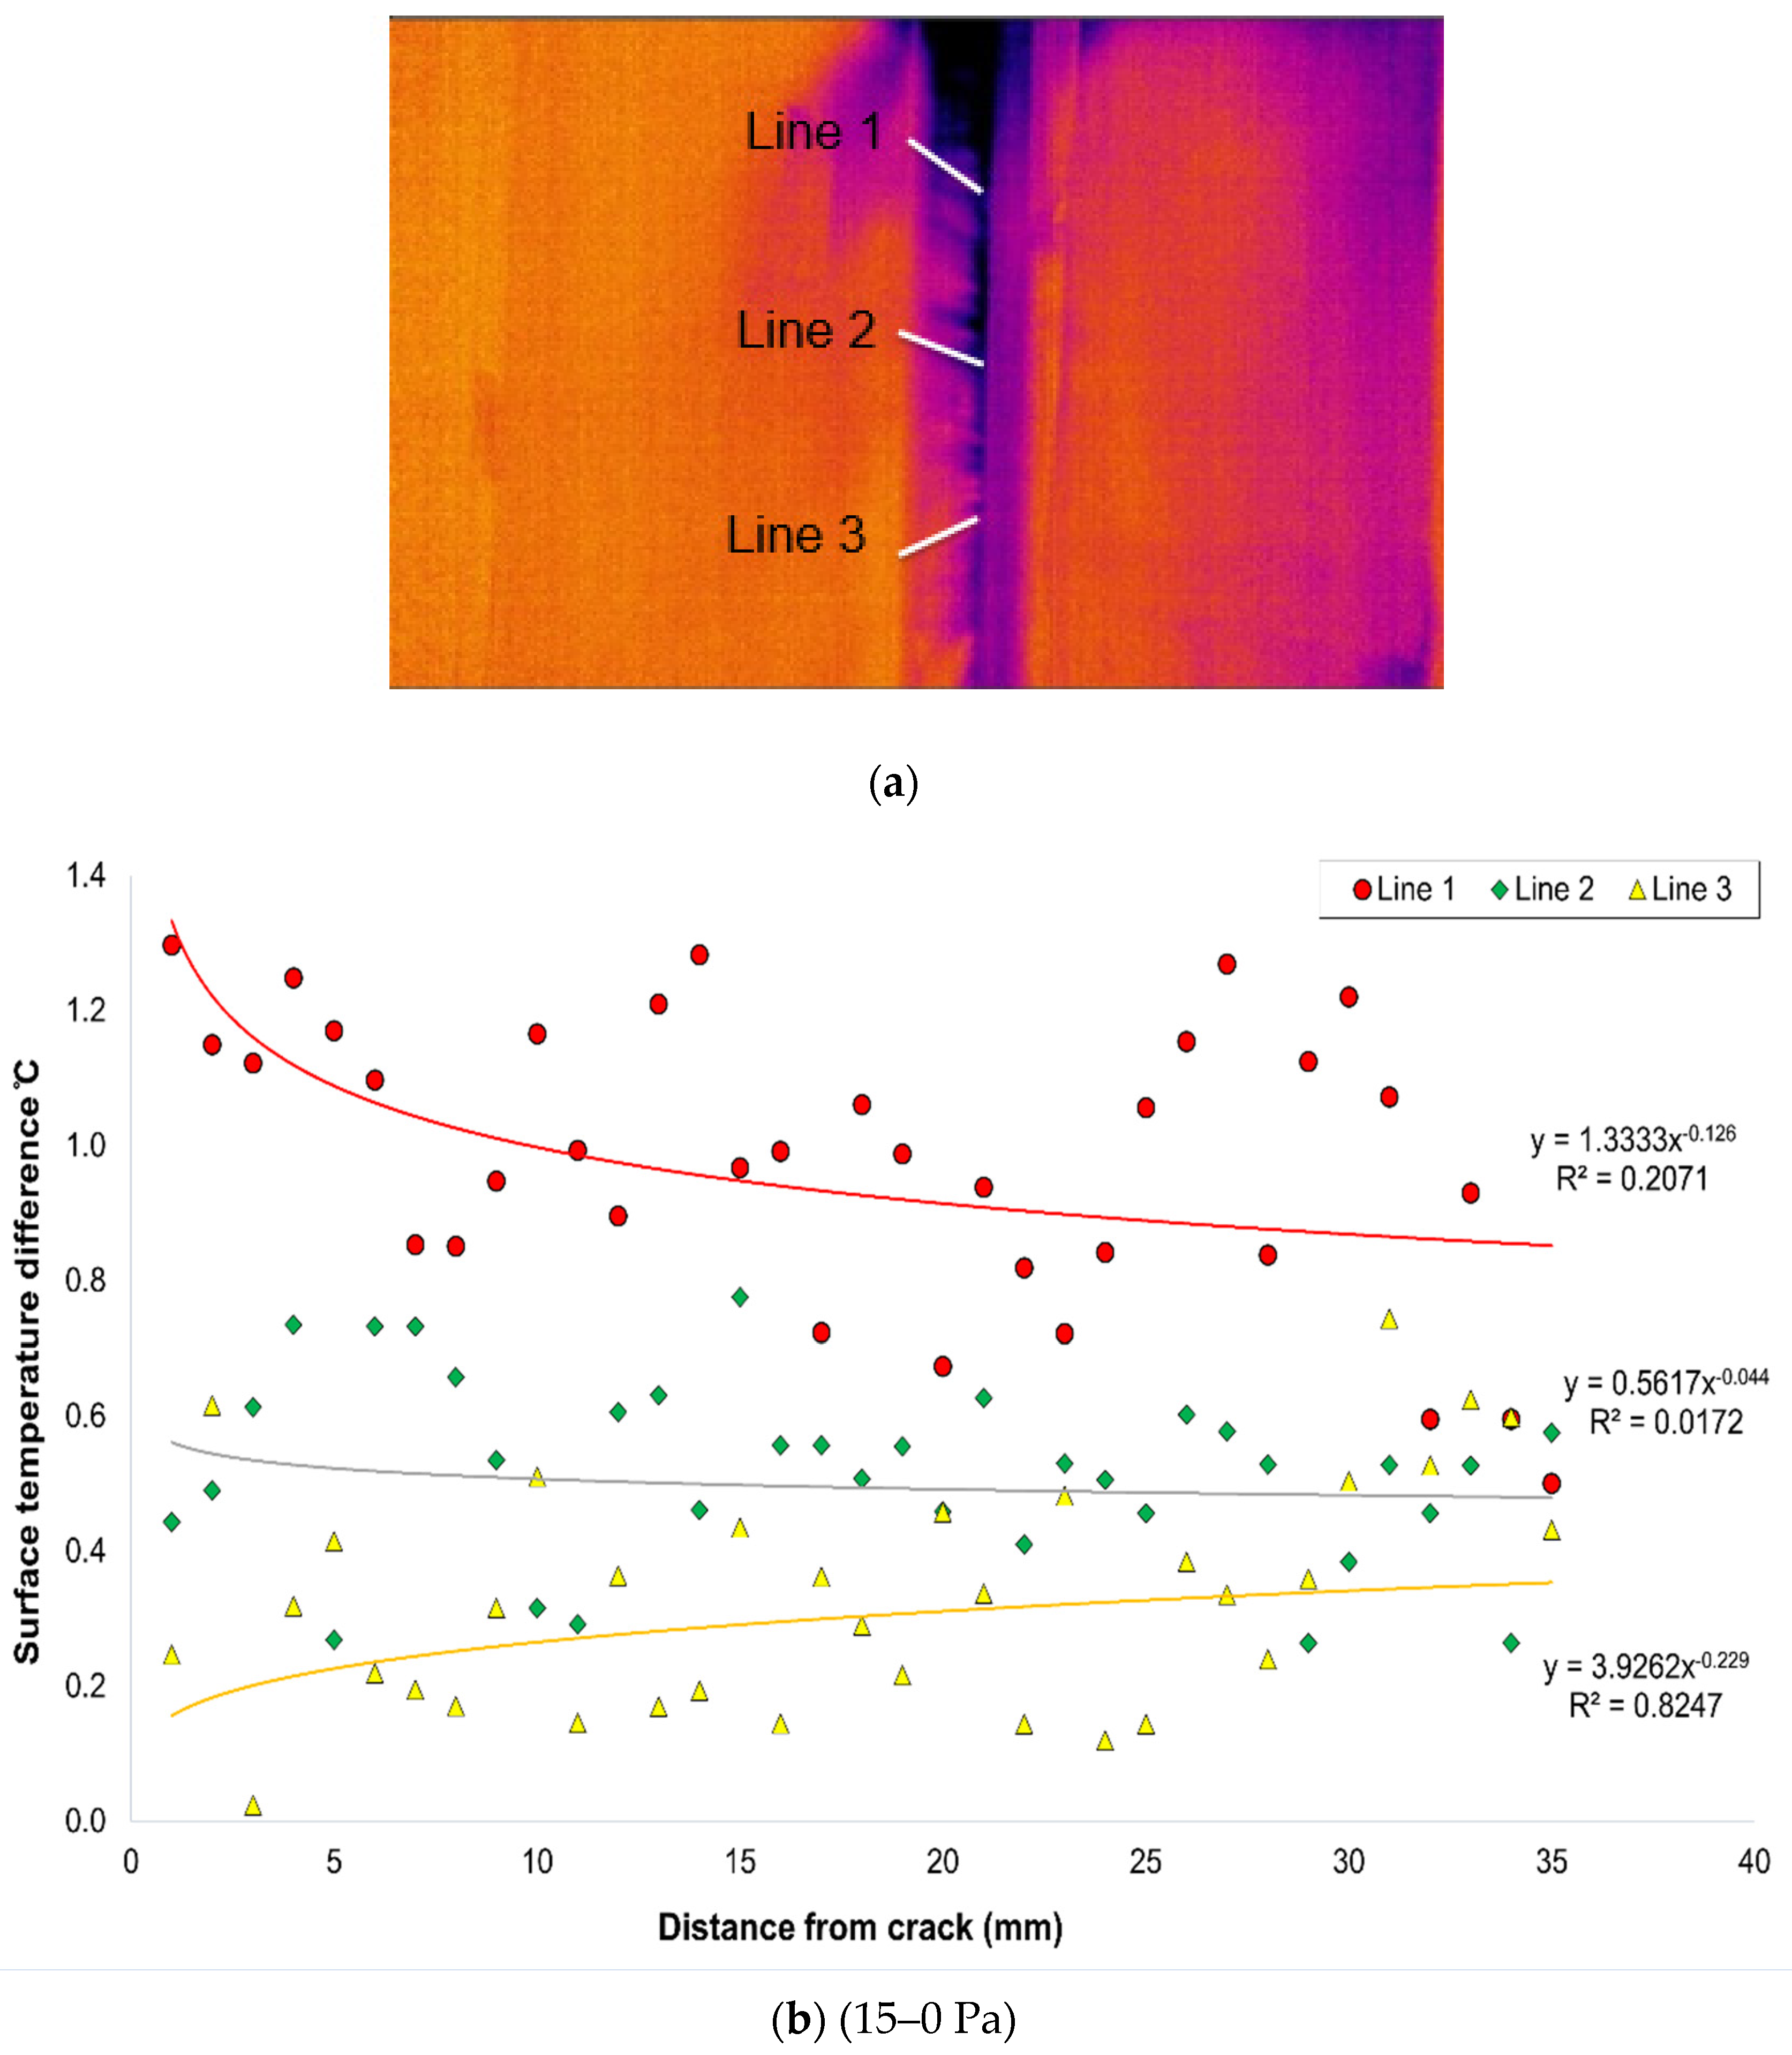
4.3. Quantitative Results of Infrared Thermography
5. Conclusions
Author Contributions
Funding
Acknowledgments
Conflicts of Interest
References
- International Energy Agency. Available online: https://www.iea.org/topics/energyefficiency/buildings/ (accessed on 28 April 2020).
- ASHRAE. ASHRAE Guideline 0–2019, The Commissioning Process; American Society of Heating, Refrigerating and Air-Conditioning Engineers: Atlanta, GA, USA, 2019. [Google Scholar]
- McKenzie-Mohr, D. Fostering Sustainable Behavior: An Introduction to Community-Based Social Marketing, 3rd ed.; New Society Publishers: Gabriola Island, BC, Canada, 2011. [Google Scholar]
- Cho, K.H.; Kim, S.S. Energy Performance Assessment According to Data Acquisition Levels of Existing Buildings. Energies 2019, 12, 1149. [Google Scholar] [CrossRef]
- RDH Building Science Inc. Illustrated Guide: Achieving Airtight Buildings; BC Housing, BC Hydro, and the City of Vancouver: Burnaby, BC, Canada, 2017. [Google Scholar]
- Pinto, M.; Viegas, J.; de Freitas, V. Air permeability measurements of dwellings and building components in Portugal. Build. Environ. 2011, 46, 2480–2489. [Google Scholar] [CrossRef]
- Lerma, C.; Barreira, E.; Almeida, R.M. A discussion concerning active infrared thermography in the evaluation of buildings air infiltration. Energy Build. 2018, 168, 56–66. [Google Scholar] [CrossRef]
- Meiss, A.; Feijó-Muñoz, J. The energy impact of infiltration: A study on buildings located in north central Spain. Energy Effic. 2015, 8, 51–64. [Google Scholar] [CrossRef]
- Kalamees, T. Air tightness and air leakages of new lightweight single-family detached houses in Estonia. Build. Environ. 2007, 42, 2369–2377. [Google Scholar] [CrossRef]
- Barreira, E.; Almeida, R.M.; Moreira, M. An infrared thermography passive approach to assess the effect of leakage points in buildings. Energy Build. 2017, 140, 224–235. [Google Scholar] [CrossRef]
- National Research Council (NRC). National Energy Code of Canada for Buildings; National Research Council Canada: Ottawa, ON, Canada, 2015. [Google Scholar]
- ASTM International (American Society for Testing and Materials). E779-19; Standard Test Method for Determining Air Leakage Rate by Fan Pressurization; ASTM: West Conshohocken, PA, USA, 2019. [Google Scholar]
- International Organization for Standardization (ISO). EN ISO 9972: 2015-Determination of Air Permeability of Buildings-Fan Pressurization Method; ISO: Geneva, Switzerland, 2015. [Google Scholar]
- US Army Corps of Engineers (USACE). Air Leakage Test Protocol for Building Envelopes—Version 3; US Army Corps of Engineers: Champaign, IL, USA, 2012.
- Emanuela, G.; Sanjuan, C.; Blanco, E.; Heras, M.R. Experimental assessment and modelling of the performance of an open joint ventilated façade during actual operating conditions in Mediterranean climate. Energy Build. 2012, 54, 363–375. [Google Scholar]
- Balaras, C.A.; Argiriou, A. Infrared thermography for building diagnostics. Energy Build. 2002, 34, 171–183. [Google Scholar] [CrossRef]
- Asdrubali, F.; Baldinelli, G.; Bianchi, F. A quantitative methodology to evaluate thermal bridges in buildings. Appl. Energy 2012, 97, 365–373. [Google Scholar] [CrossRef]
- Gonçalves, M.D.; Gendron, P.; Colantonio, A. Commissioning of Exterior Building Envelopes of Large Buildings for Air Leakage and Resultant Moisture Accumulation Using Infrared Thermography and Other Diagnostic Tools; Thermal Solutions: Sarasota, FL, USA, 2007. [Google Scholar]
- Van De Vijver, S.; Steeman, M.; Carbonez, K.; Van Den Bossche, N. On the Use of Infrared Thermography to Assess Air Infiltration in Building Envelopes, International Workshop: Quality of Methods for Measuring Ventilation and Air Infiltration in Buildings, Proceedings; Air Infiltration and Ventilation Centre (AIVC): Brussels, Belgium, 2014. [Google Scholar]
- Ascione, F.; Bianco, N.; De Masi, R.F.; de’Rossi, F.; Vanoli, G.P. Energy retrofit of an educational building in the ancient center of Benevento. Feasibility study of energy savings and respect of the historical value. Energy Build. 2015, 95, 172–183. [Google Scholar] [CrossRef]
- Liu, W.; Zhao, X.; Chen, Q. A novel method for measuring air infiltration rate in buildings. Energy Build. 2018, 168, 309–318. [Google Scholar] [CrossRef]
- Hart, J. A Practical Guide to Infrared Thermography for Building Surveys; Building Research Establishment: Watford, UK, 1991. [Google Scholar]
- Wahlgren, P.; Sikander, E. In Methods and materials for an airtight building. In Proceedings of the 11th International Conference on Thermal Performance of the Exterior Envelopes of Whole Buildings, Buildings XI, Clearwater Beach, FL, USA, 5–9 December 2010. [Google Scholar]
- Dufour, M.B.; Derome, D.; Zmeureanu, R. Analysis of thermograms for the estimation of dimensions of cracks in building envelope. Infrared Phys. Technol. 2009, 52, 70–78. [Google Scholar] [CrossRef]
- Residential Energy Services Network (RESNET). RESENET Interim Guidelines for Thermographic Inspections of Buildings; Residential Energy Services Network: Oceanside, CA, USA, 2012. [Google Scholar]
- ASTM International (American Society for Testing and Materials). E1186-17; Standard Practices for Air Leakage Site Detection in Building Envelopes and Air Barrier Systems; ASTM: West Conshohocken, PA, USA, 2017. [Google Scholar]
- National Master Specification (NMS). NMS 022713 Thermographic Assessment- Building Envelope; National Research Council Canada: Ottawa, ON, Canada, 2007. [Google Scholar]
- ASTM International (American Society for Testing and Materials). C1060-11a; Standard Practice for Thermographic Inspection of Insulation Installations in Envelope Cavities of Frame Buildings; ASTM: West Conshohocken, PA, USA, 2015. [Google Scholar]
- International Organization for Standardization (ISO). ISO 6781-3: 2015, Performance of Buildings—Detection of Heat, Air and Moisture Irregularities in Buildings by Infrared Methods—Part 3: Qualifications of Equipment Operators, Data Analysts and Report Writers; ISO: Geneva, Switzerland, 2015. [Google Scholar]
- British Standards Institution (BSI). BS EN 13187:1999, Thermal Performance of Buildings-Qualitative Detection of Thermal Irregularities in Building Envelops-Infrared Method, Brussels; BSI: London, UK, 1999. [Google Scholar]
- ASTM International (American Society for Testing and Materials). E1933-14; Standard Practice for Measuring and Compensating for Emissivity Using Infrared Imaging Radiometers; ASTM: West Conshohocken, PA, USA, 2014. [Google Scholar]
- ASTM International (American Society for Testing and Materials). E1862-14; Standard Practice for Measuring and Compensating for Reflected Temperature Using Infrared Imaging Radiometers; ASTM: West Conshohocken, PA, USA, 2014. [Google Scholar]
- Mill, P.A.D. Thermographic Diagnosis of Building Envelope Deficiencies, Fathers of Confederation Center; Report Series No. 28; Public Works Canada: Ottawa, ON, Canada, 1979; ISBN 0-662-50335-X. [Google Scholar]


| Standard | Recommended Minimum ∆T for Detection of Air Leakage | Recommended Pressure Difference (∆P) |
|---|---|---|
| RESNET [25] | 1.7 °C | 10 Pa |
| ASTM E1186-03 [26] | 5 °C | 10–50 Pa |
| NMS 022713 [27] | 20 °C | 5–10 Pa |
| 10 °C | 10–25 Pa | |
| ASTM C 1060-11a [28]; ISO 6781 [29]; EN 13187 [30] | None (10 °C minimum for IRT) | 5 Pa (IRT from low-pressure side) |
| Sensor | Measurement Range | Uncertainties | Resolution |
|---|---|---|---|
| Thermocouple Type k | −200 °C to 1250 °C | ±2.2 °C or ± 0.75% | 0.01 °C |
| Data logger | −200 °C to 1372 °C | ±1% | 0.1 °C < 1000, 1 °C > 1000 |
| Hot wire anemometer | 20 mm/sec to 40 m/sec | ±3% | 0.01 m/s |
| Measuring Range | −25 °C to 100 °C |
| Accuracy | ±5 °C (±9 °F) or 5% of reading |
| Observation display range | 0.05 °C at 30 °C |
| Wavelength range | 7.5–13 µm |
| IR resolution | 640 × 512 |
| Field of view | 45 °× 37 ° |
| Instantaneous field of view (IFOV) | 1.31 mrad |
| Detector | Uncooled VOx microblometer |
| Day 1 | Day 2 | Day 3 | Day 4 | Day 5 | ||
|---|---|---|---|---|---|---|
| Outdoor | Temperature (°C) | 9 | 8 | 7 | 12 | 6 |
| Humidity (%) | 85 | 90 | 93 | 75 | 80 | |
| Wind speed (m/s) | 1.6 | 1.2 | 2 | 2.5 | 1 | |
| Sky condition | Cloudy | Cloudy | Cloudy | Sunny day and clear sky | Sunny day and clear night sky | |
| Time of test | before sunrise; 5:00 a.m. | after sunset 8:00 p.m. | before sunrise 5:00 a.m. | after sunrise 10:00 a.m. | after sunset 8:30 p.m. | |
| Inside | Temperature (°C) | 20 | 19.6 | 19.6 | 19.8 | 20 |
| Humidity (%) | 45 | 45 | 47 | 48 | 50 |
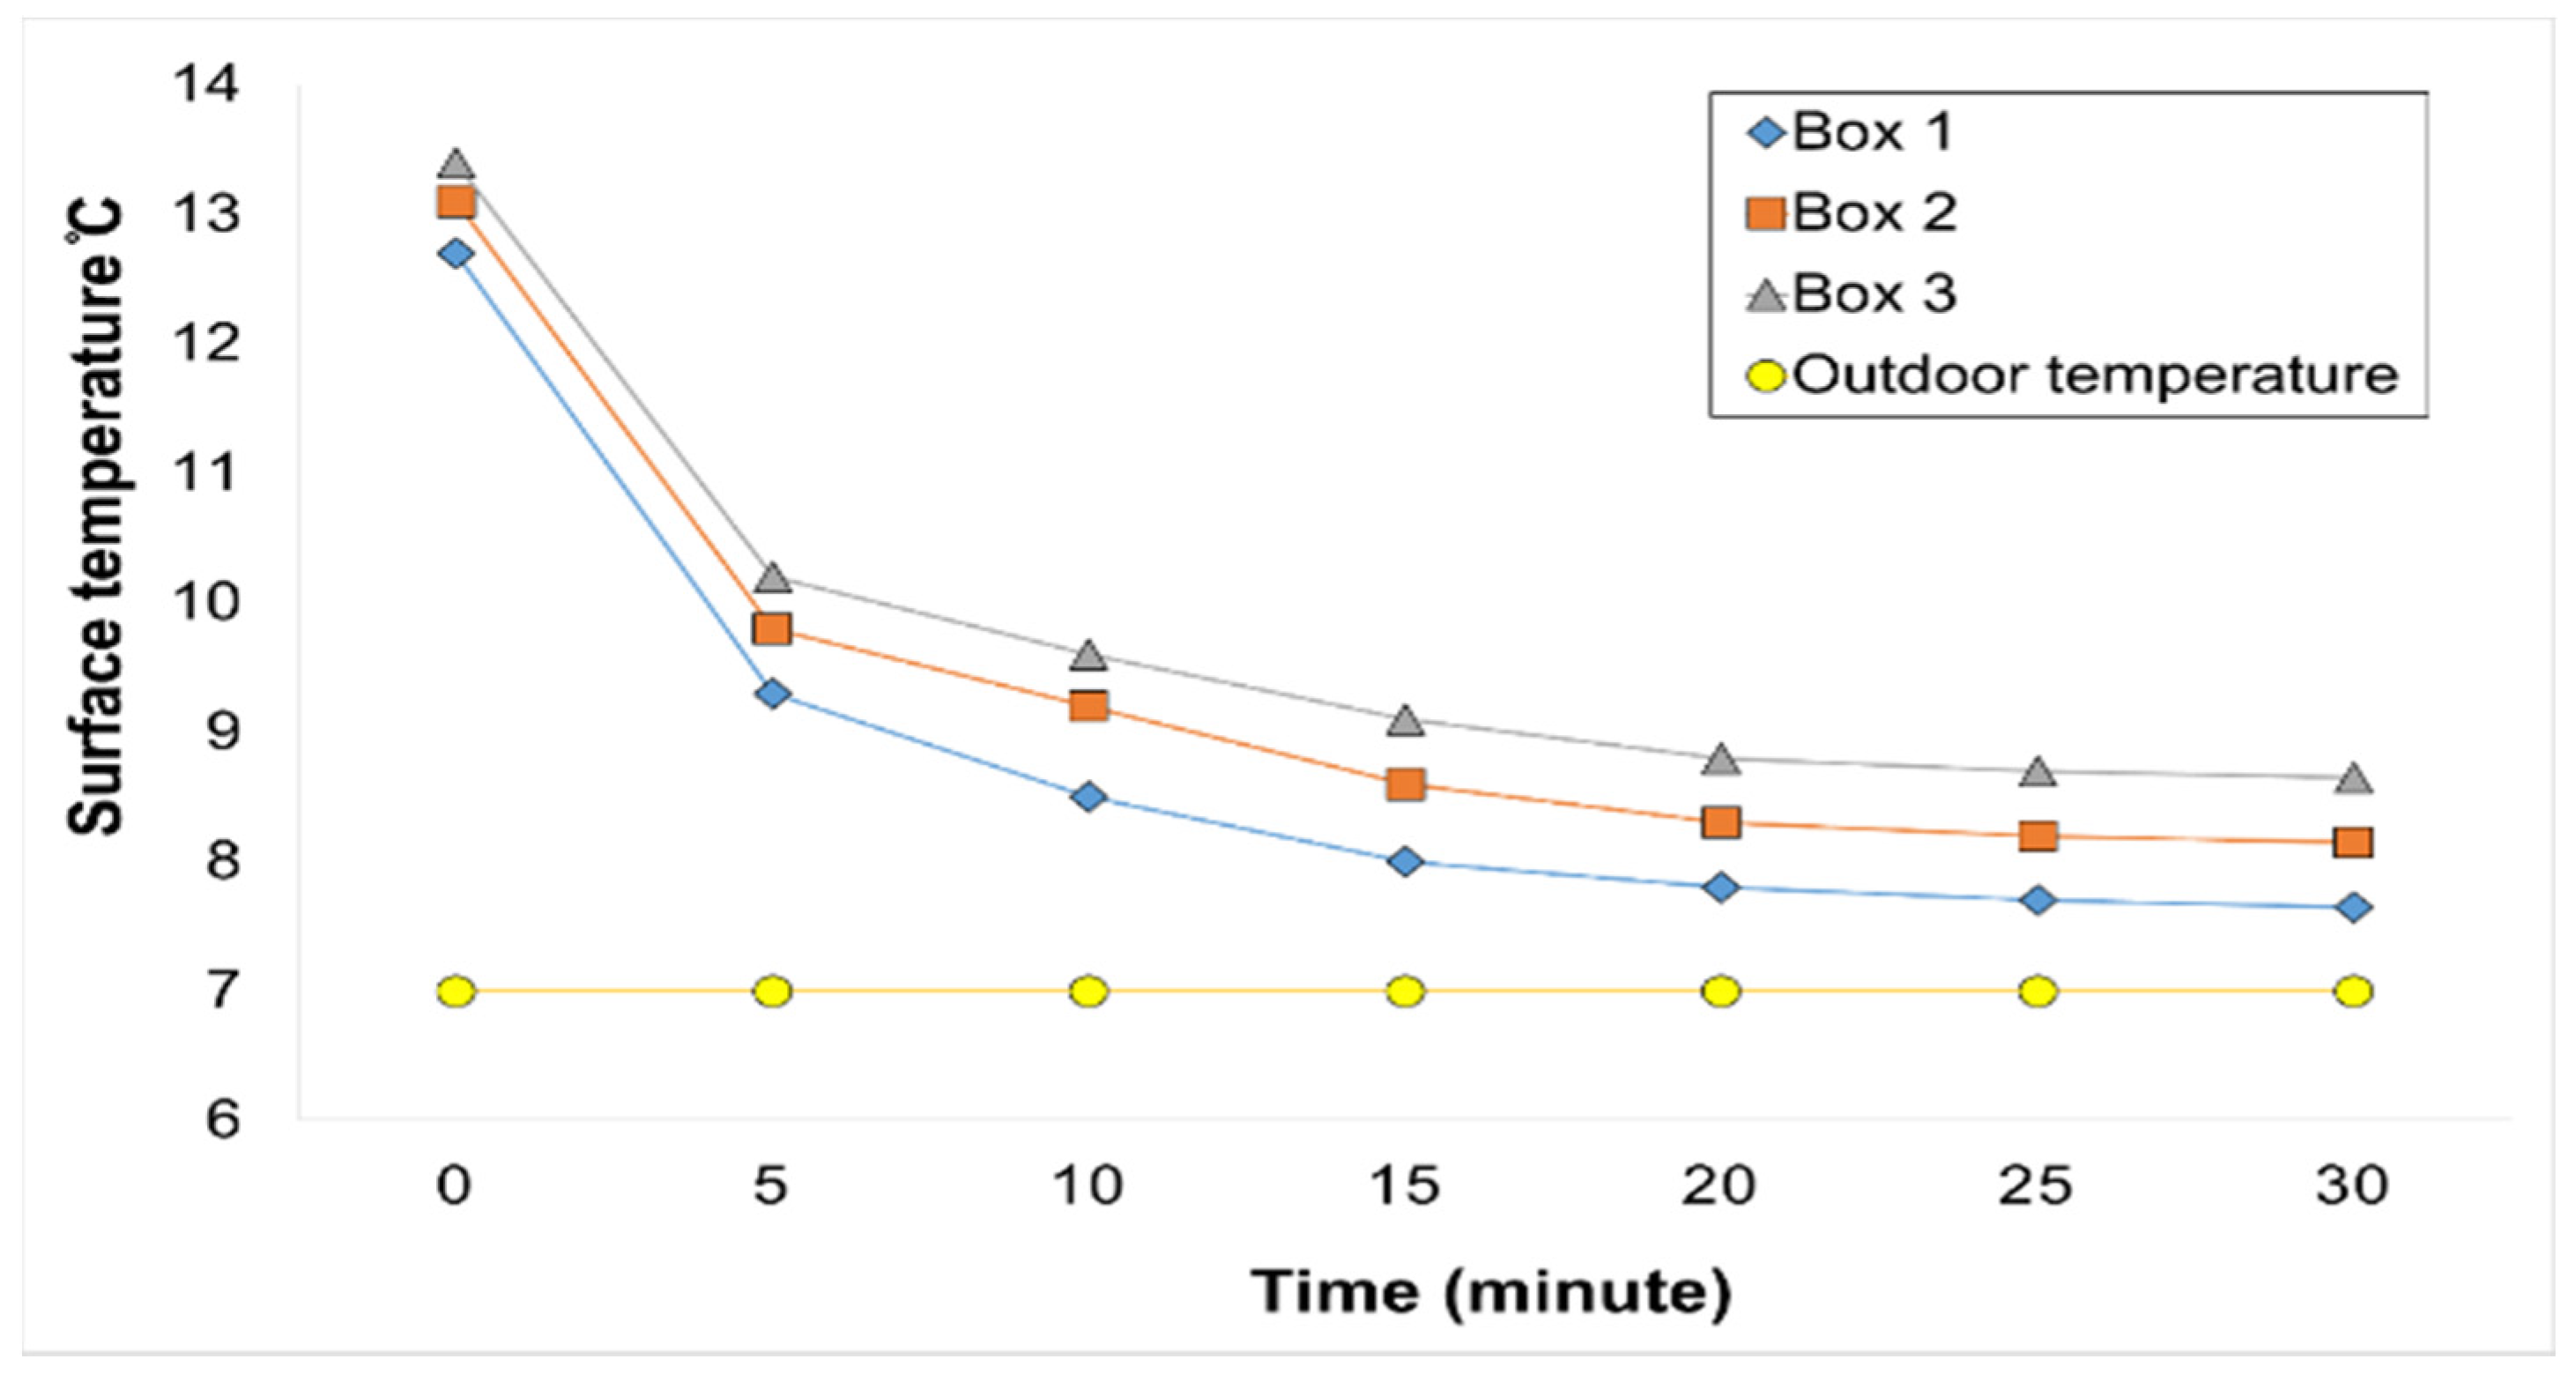
| Time (minutes) | Surface Temperature (°C) | Temperature Index (TI) | Outdoor Temperature (°C) | Indoor Temperature (°C) | ||||
|---|---|---|---|---|---|---|---|---|
| Box 1 | Box 2 | Box 3 | Box 1 | Box 2 | Box 3 | |||
| 0 | 12.72 | 13.12 | 13.41 | 0.45 | 0.48 | 0.51 | 7 | 19.60 |
| 30 | 7.65 | 8.15 | 8.65 | 0.06 | 0.10 | 0.14 | 7 | 18.60 |
| Subtracted Pressure Differential (∆(∆P)) | a* | b** | R2 | ||||||
|---|---|---|---|---|---|---|---|---|---|
| Line 1 | Line 2 | Line 3 | Line 1 | Line 2 | Line 3 | Line 1 | Line 2 | Line 3 | |
| 15–0 Pa | 1.33 | 0.56 | 0.15 | −0.13 | −0.04 | 0.22 | 0.20 | 0.01 | 0.09 |
| 25–0 Pa | 3.19 | 2.02 | 1.57 | −0.11 | −0.09 | −0.13 | 0.54 | 0.35 | 0.38 |
| 35–0 Pa | 3.69 | 2.58 | 1.82 | −0.13 | −0.15 | −0.24 | 0.59 | 0.53 | 0.47 |
| 45–0 Pa | 4.36 | 3.04 | 2.77 | −0.09 | −0.13 | −0.32 | 0.56 | 0.42 | 0.76 |
| 55–0 Pa | 4.60 | 3.91 | 3.21 | −0.08 | −0.11 | −0.24 | 0.60 | 0.61 | 0.79 |
| 65–0 Pa | 4.99 | 4.73 | 3.92 | −0.07 | −0.10 | −0.23 | 0.64 | 0.63 | 0.82 |
© 2020 by the authors. Licensee MDPI, Basel, Switzerland. This article is an open access article distributed under the terms and conditions of the Creative Commons Attribution (CC BY) license (http://creativecommons.org/licenses/by/4.0/).
Share and Cite
Mahmoodzadeh, M.; Gretka, V.; Wong, S.; Froese, T.; Mukhopadhyaya, P. Evaluating Patterns of Building Envelope Air Leakage with Infrared Thermography. Energies 2020, 13, 3545. https://doi.org/10.3390/en13143545
Mahmoodzadeh M, Gretka V, Wong S, Froese T, Mukhopadhyaya P. Evaluating Patterns of Building Envelope Air Leakage with Infrared Thermography. Energies. 2020; 13(14):3545. https://doi.org/10.3390/en13143545
Chicago/Turabian StyleMahmoodzadeh, Milad, Voytek Gretka, Stephen Wong, Thomas Froese, and Phalguni Mukhopadhyaya. 2020. "Evaluating Patterns of Building Envelope Air Leakage with Infrared Thermography" Energies 13, no. 14: 3545. https://doi.org/10.3390/en13143545
APA StyleMahmoodzadeh, M., Gretka, V., Wong, S., Froese, T., & Mukhopadhyaya, P. (2020). Evaluating Patterns of Building Envelope Air Leakage with Infrared Thermography. Energies, 13(14), 3545. https://doi.org/10.3390/en13143545