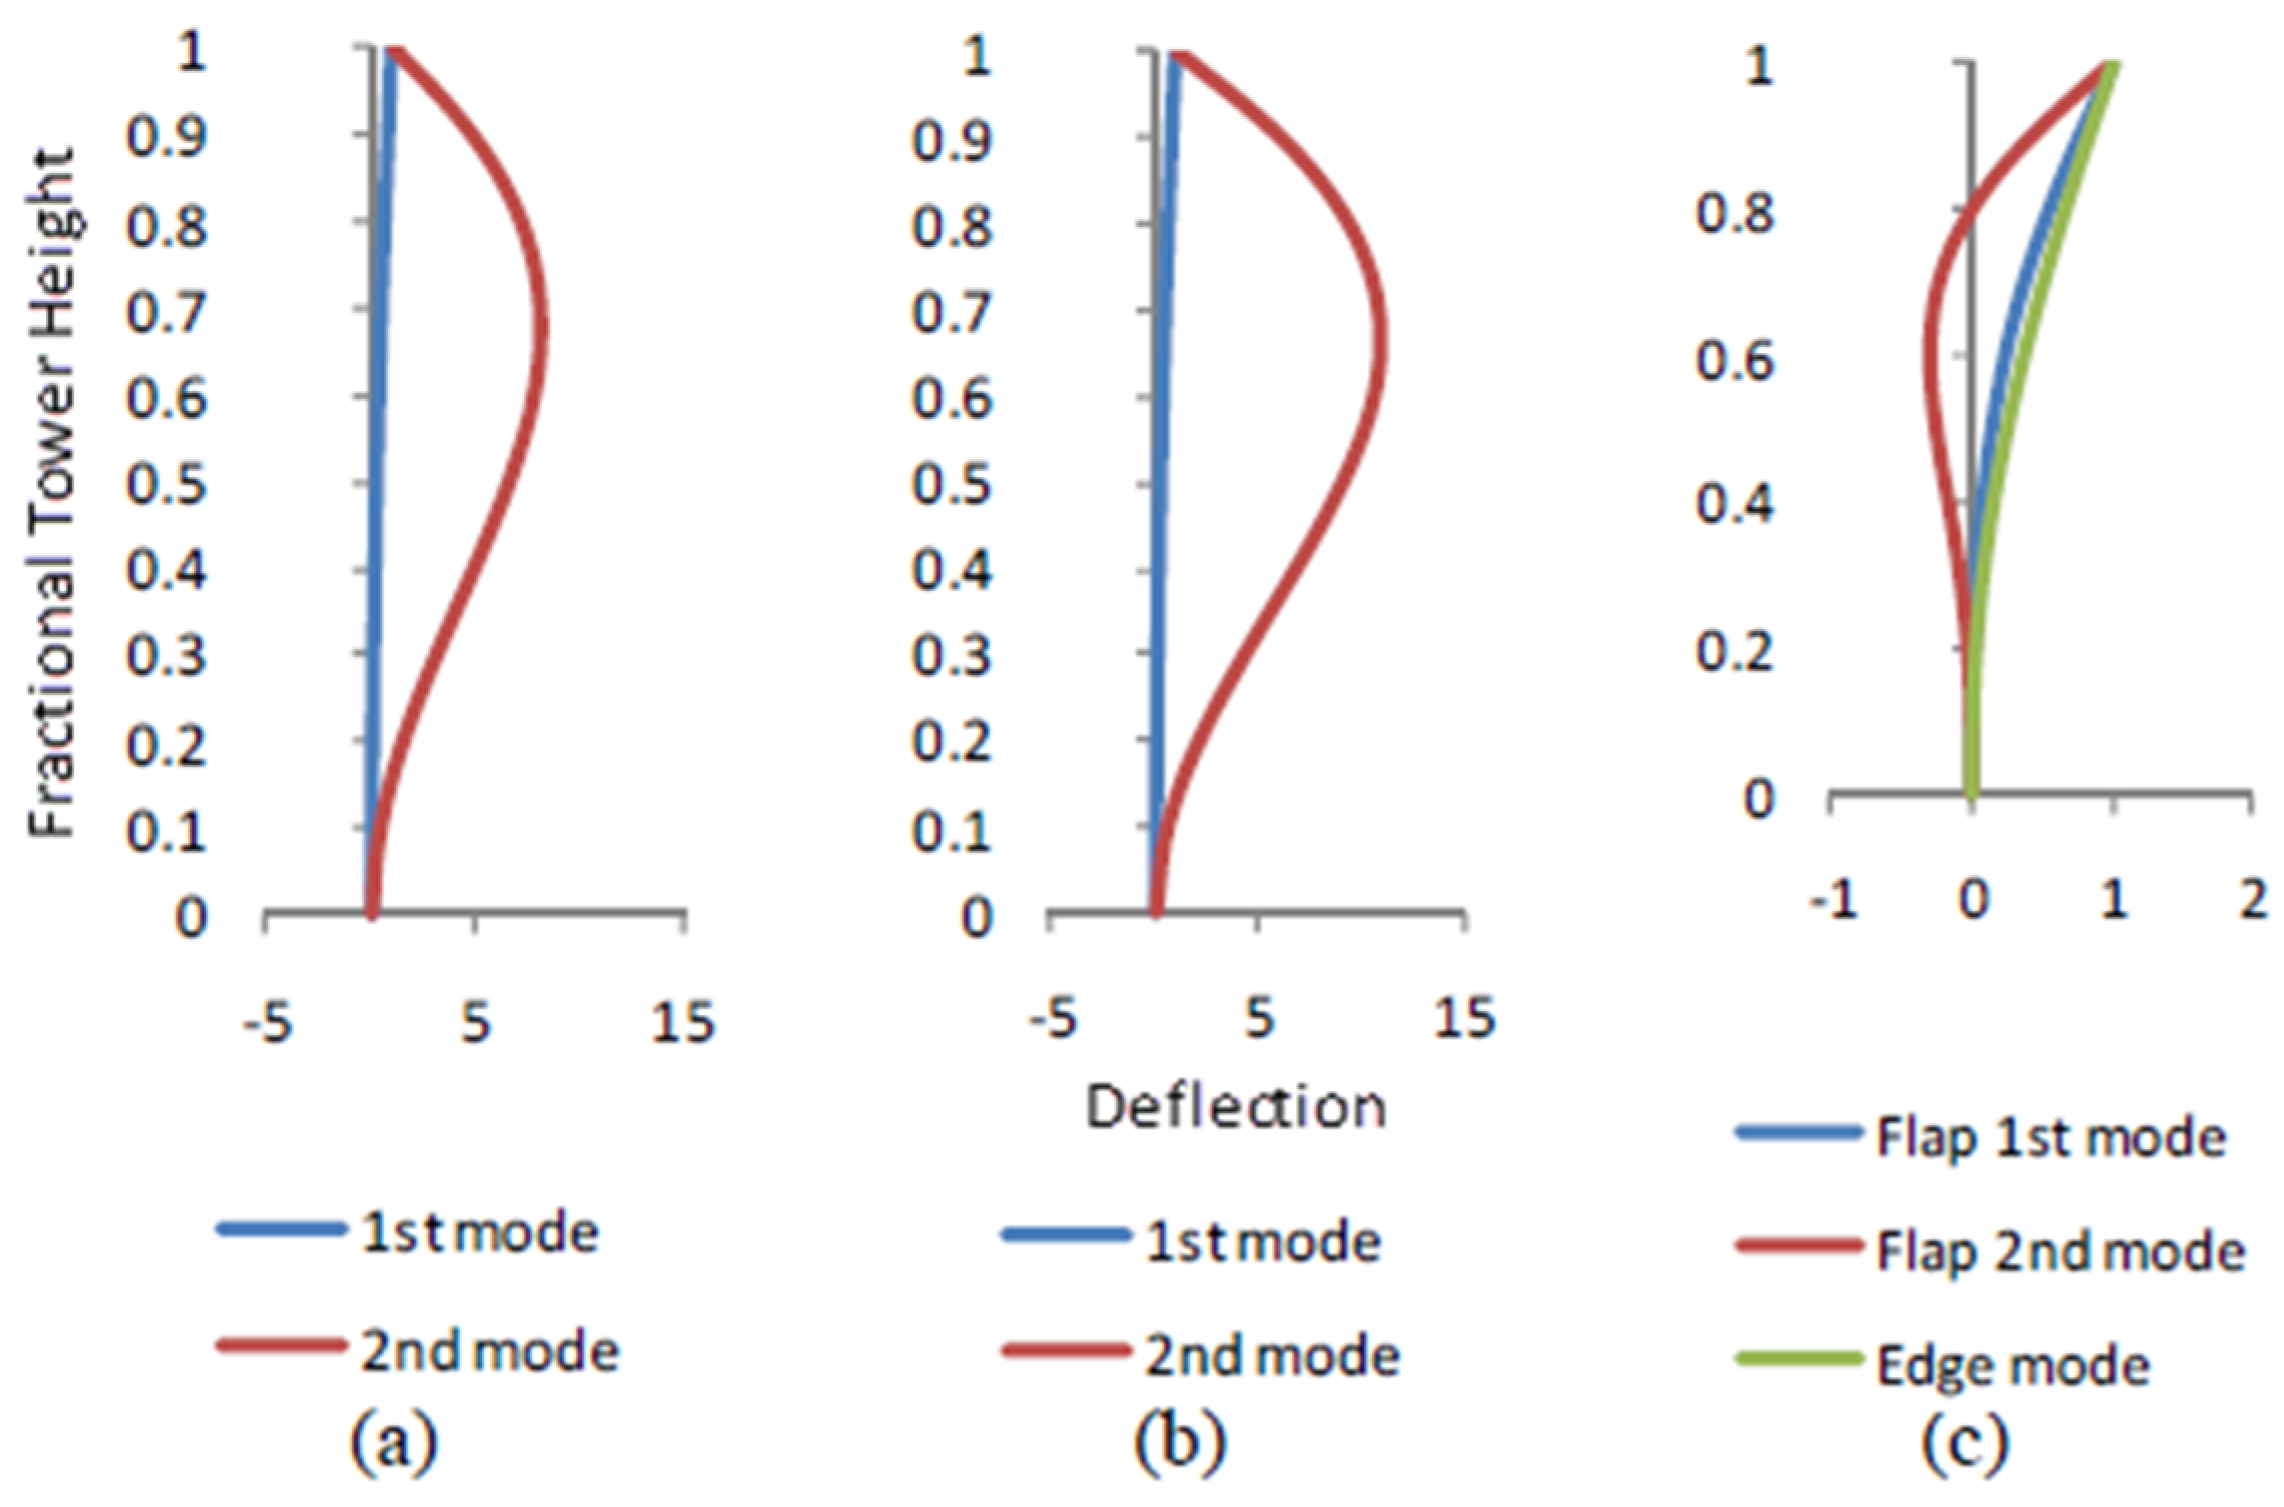
Figure 1.
Normalized mode shapes: (a) tower fore-aft; (b) tower side-to-side; (c) blades flapwise and edgewise mode.
Figure 1.
Normalized mode shapes: (a) tower fore-aft; (b) tower side-to-side; (c) blades flapwise and edgewise mode.
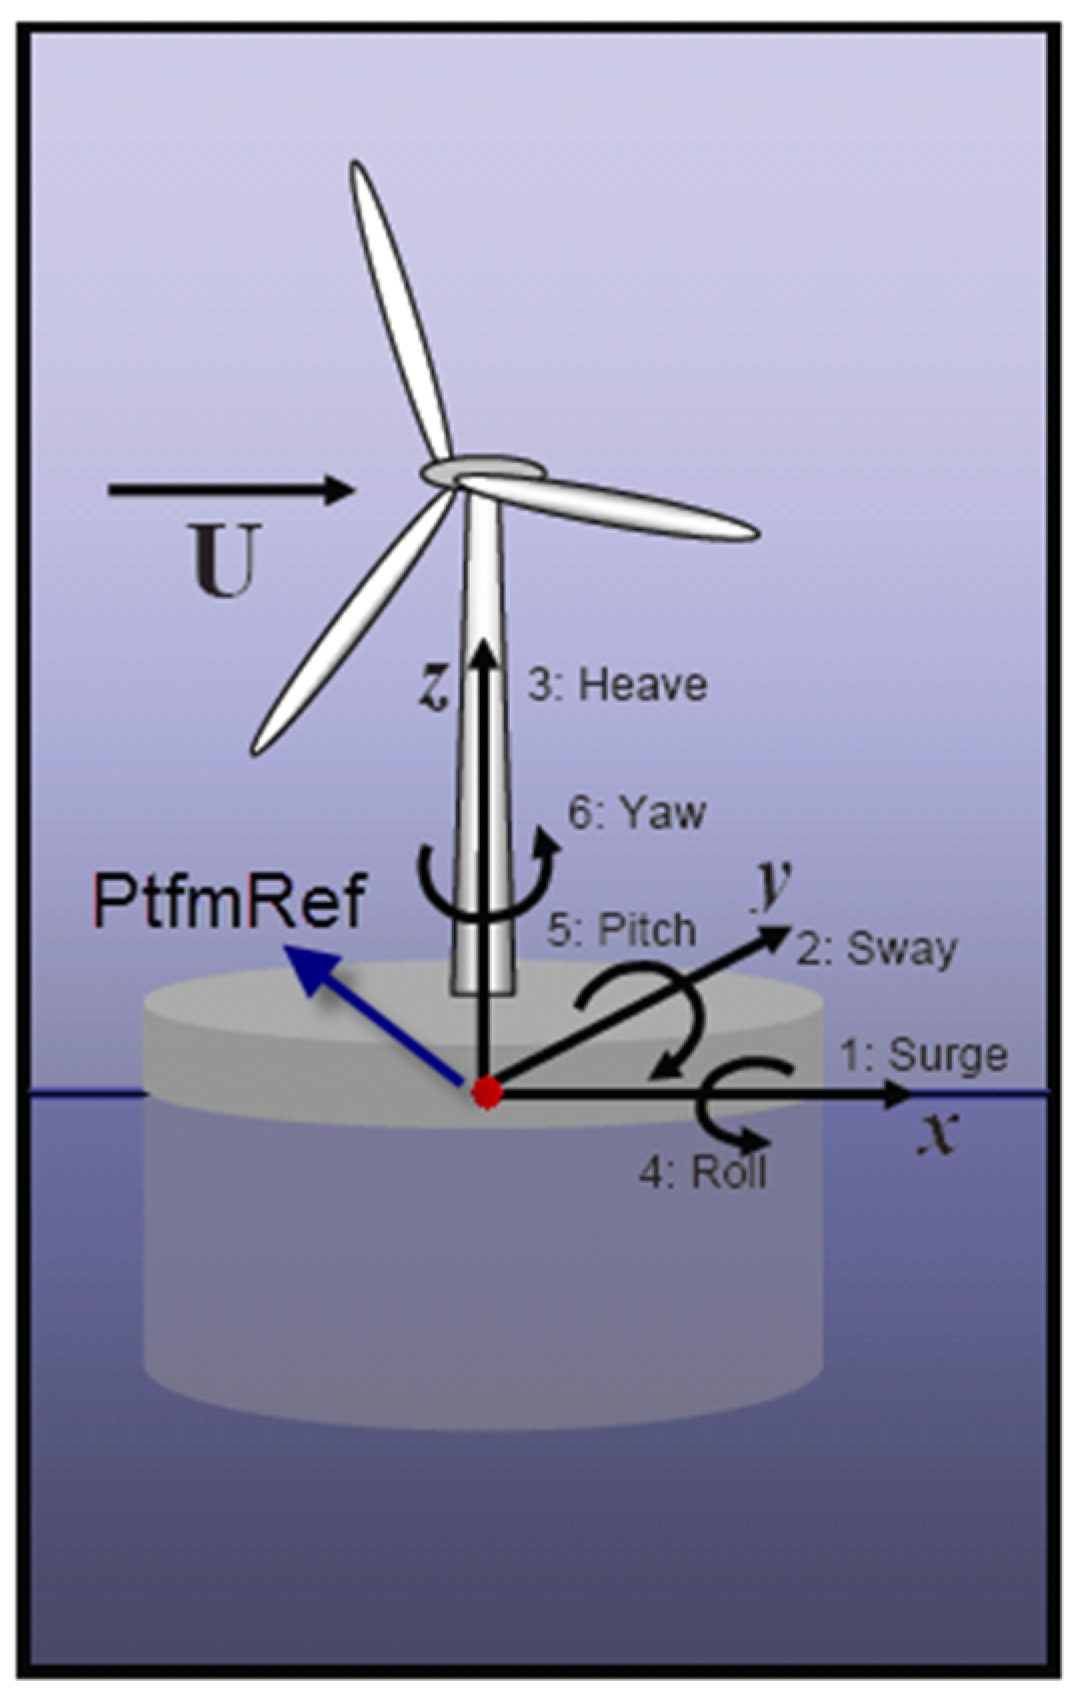
Figure 2.
Six degrees of freedom motions of the oceanic floating offshore wind turbines (FOWT).
Figure 2.
Six degrees of freedom motions of the oceanic floating offshore wind turbines (FOWT).
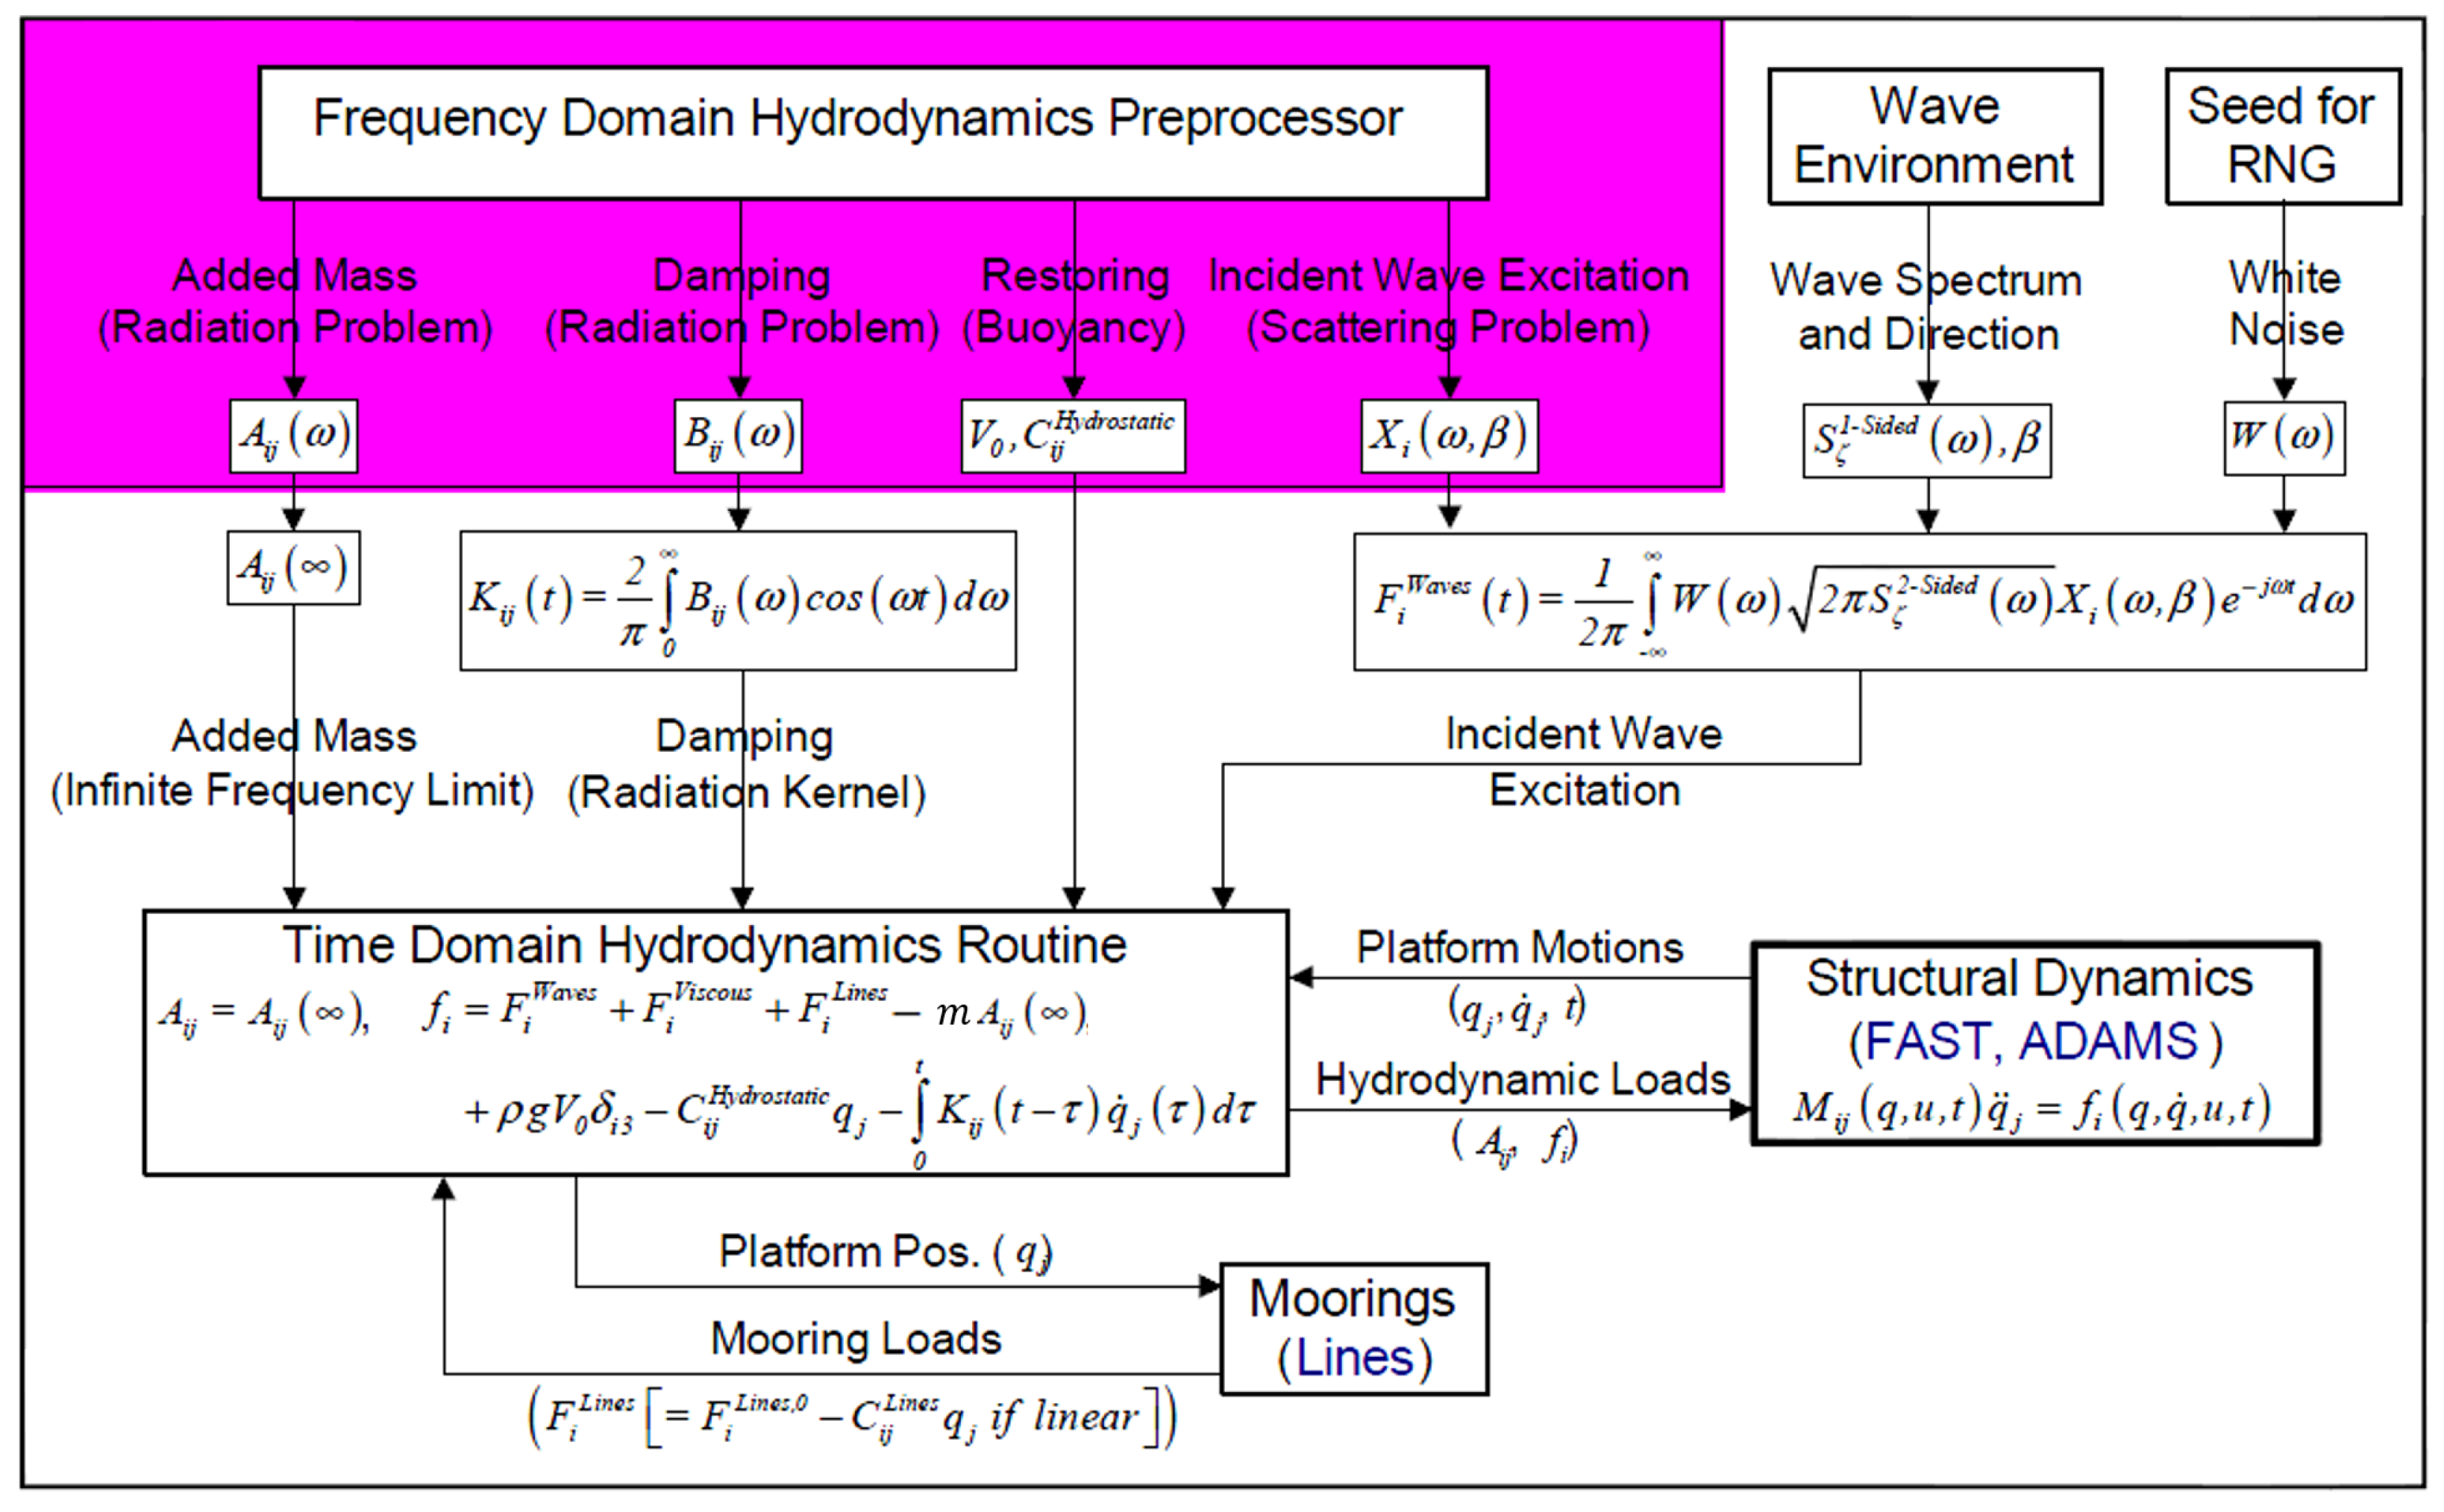
Figure 3.
Flowchart of calculations for the total external loads on the support platform.
Figure 3.
Flowchart of calculations for the total external loads on the support platform.
Figure 4.
Sketch of support platform for the SWAY model.
Figure 4.
Sketch of support platform for the SWAY model.
Figure 5.
Hydrostatic stiffness and total cost for three cases: (a) platform steel wall thickness (SWT) = 0.015 m; (b) SWT = 0.0253 m; (c) SWT = 0.045 m. The solid line without a marker represents the upper and lower limits for the platform cost of the corresponding Hconcrete. The black dash line represents when hydrostatic coefficient equals 0.
Figure 6.
Optimized mass property ratio for three cases with SWT = (a) 0.015 m; (b) 0.0253 m and (c) 0.045 m. The region between the black dash lines represents the optimized cost regions.
Figure 6.
Optimized mass property ratio for three cases with SWT = (a) 0.015 m; (b) 0.0253 m and (c) 0.045 m. The region between the black dash lines represents the optimized cost regions.
Figure 7.
Surge and pitch restoring stiffness for three cases with SWT = (a) 0.015 m, (b) 0.0253 m, (c) 0.045 m. The solid black line is the lower limit for C11, while the black dash line represents the lower limit for C55.
Figure 7.
Surge and pitch restoring stiffness for three cases with SWT = (a) 0.015 m, (b) 0.0253 m, (c) 0.045 m. The solid black line is the lower limit for C11, while the black dash line represents the lower limit for C55.
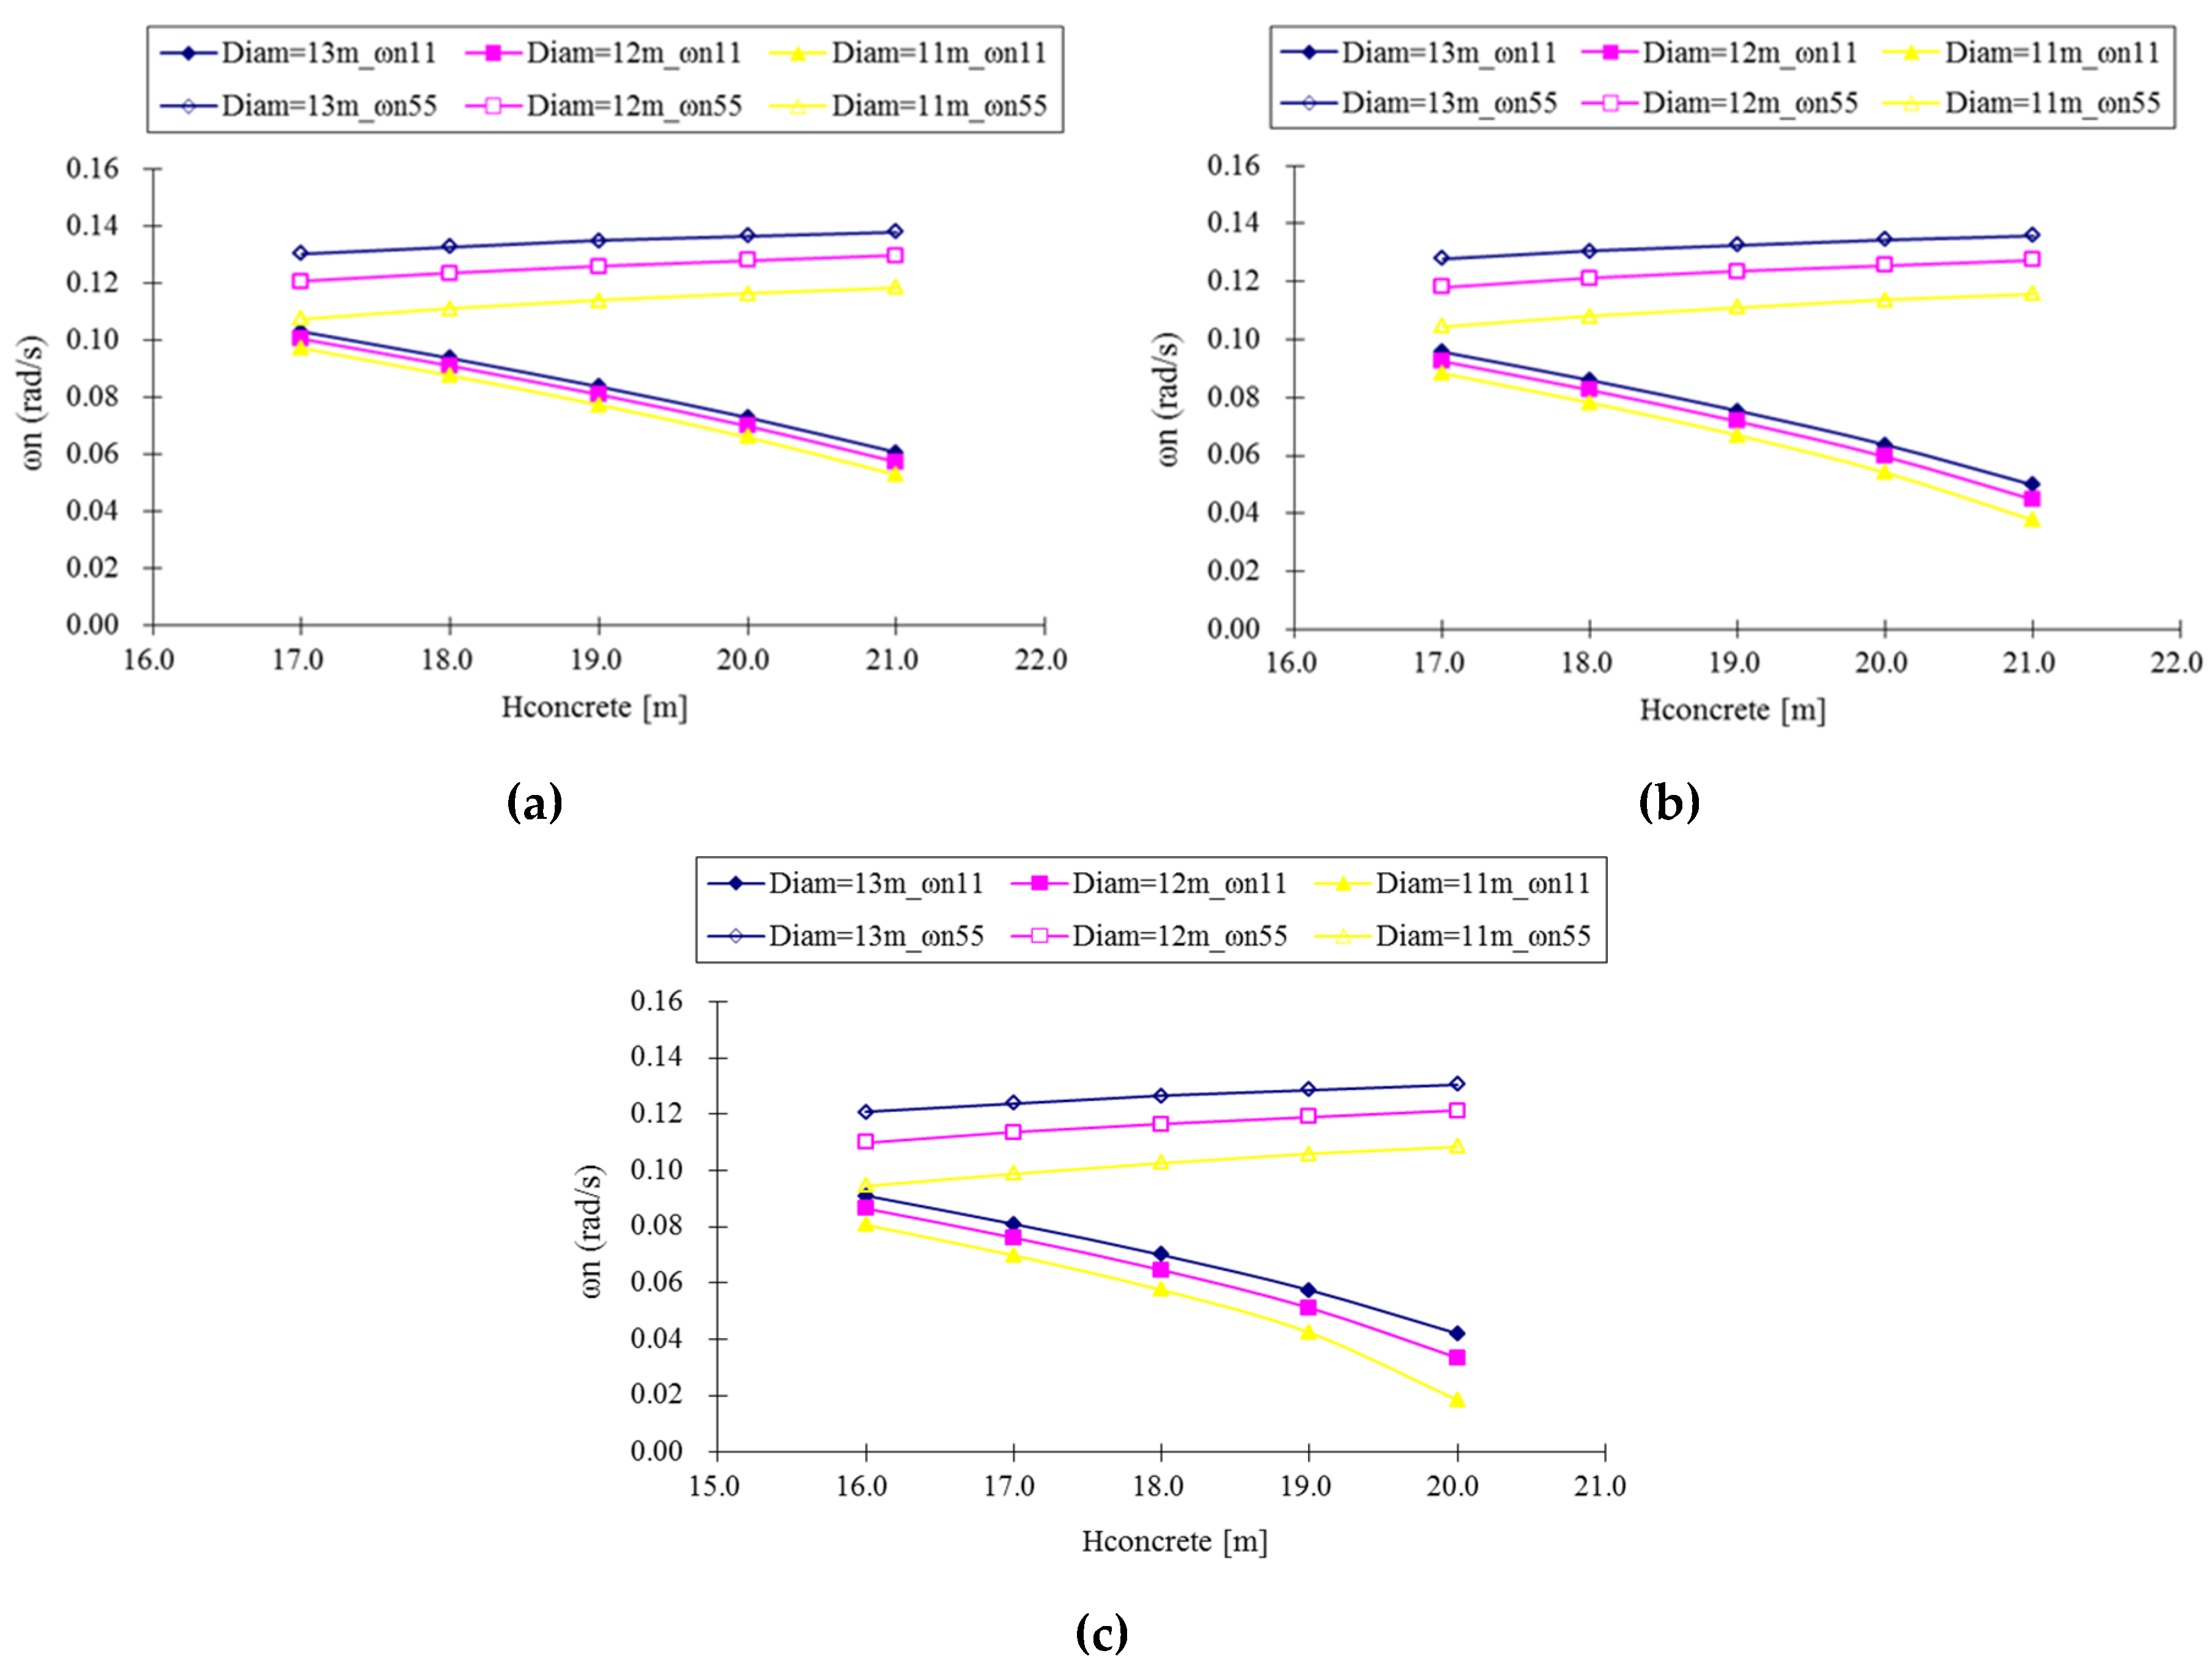
Figure 8.
Surge and pitch natural frequencies for three cases with SWT = (a) 0.015 m, (b) 0.0253 m, (c) 0.045 m.
Figure 8.
Surge and pitch natural frequencies for three cases with SWT = (a) 0.015 m, (b) 0.0253 m, (c) 0.045 m.
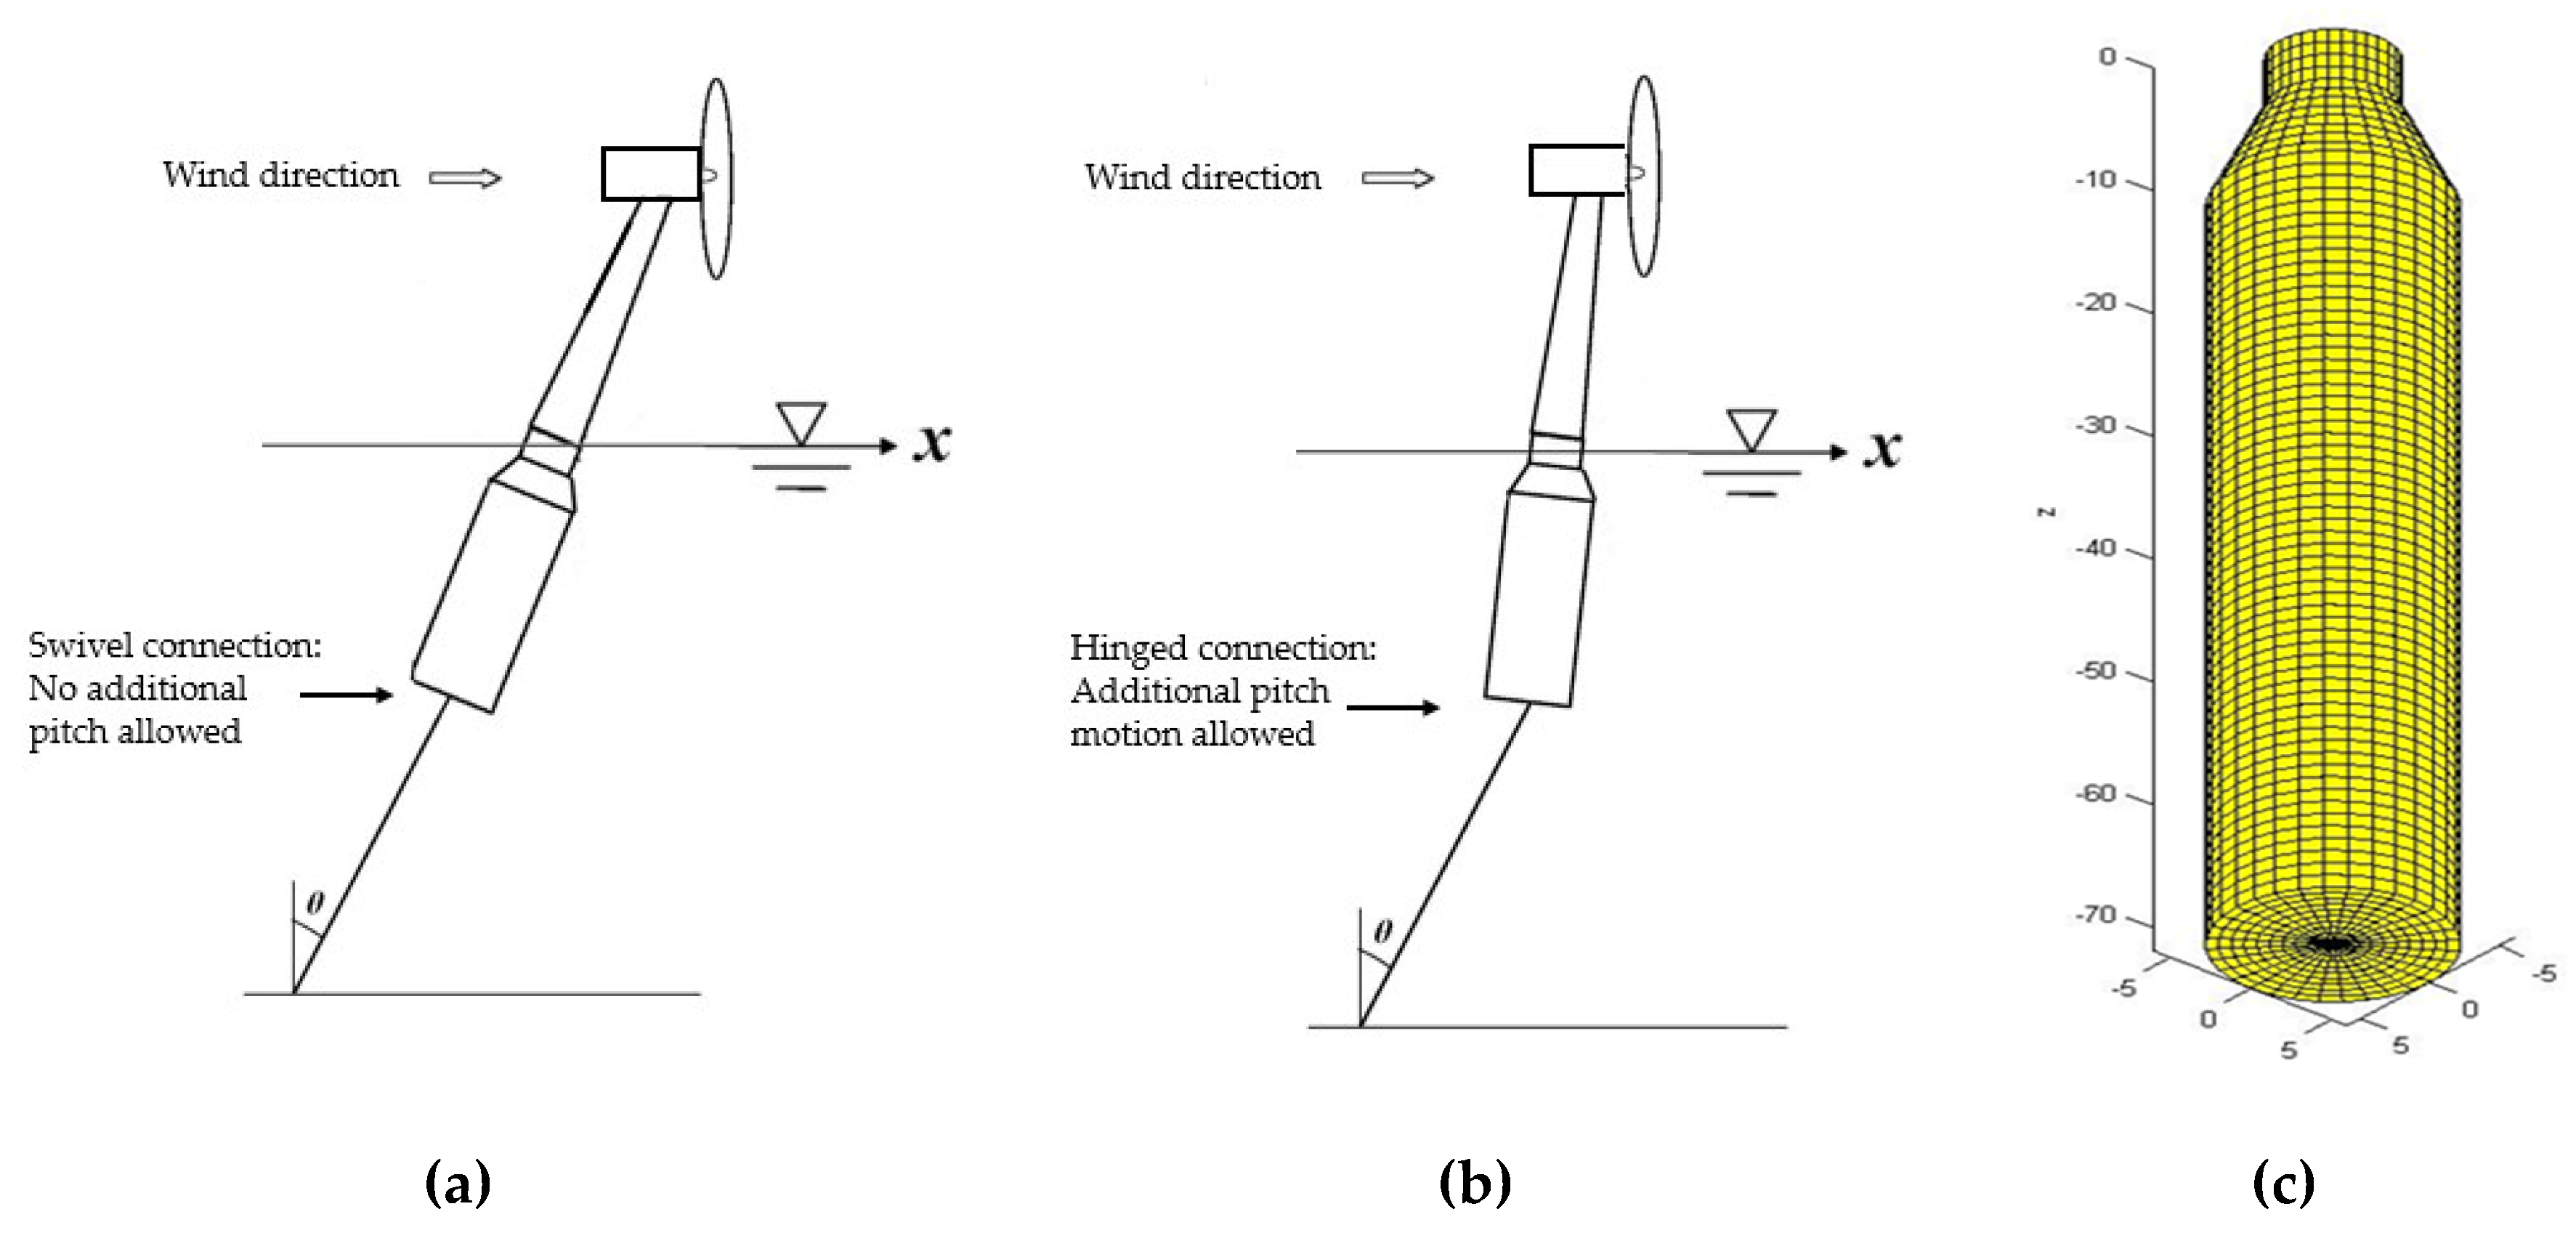
Figure 9.
(a) Swivel connection model; (b) Hinged connection model; (c) numerical panel mesh for the support platform of FOWT.
Figure 9.
(a) Swivel connection model; (b) Hinged connection model; (c) numerical panel mesh for the support platform of FOWT.
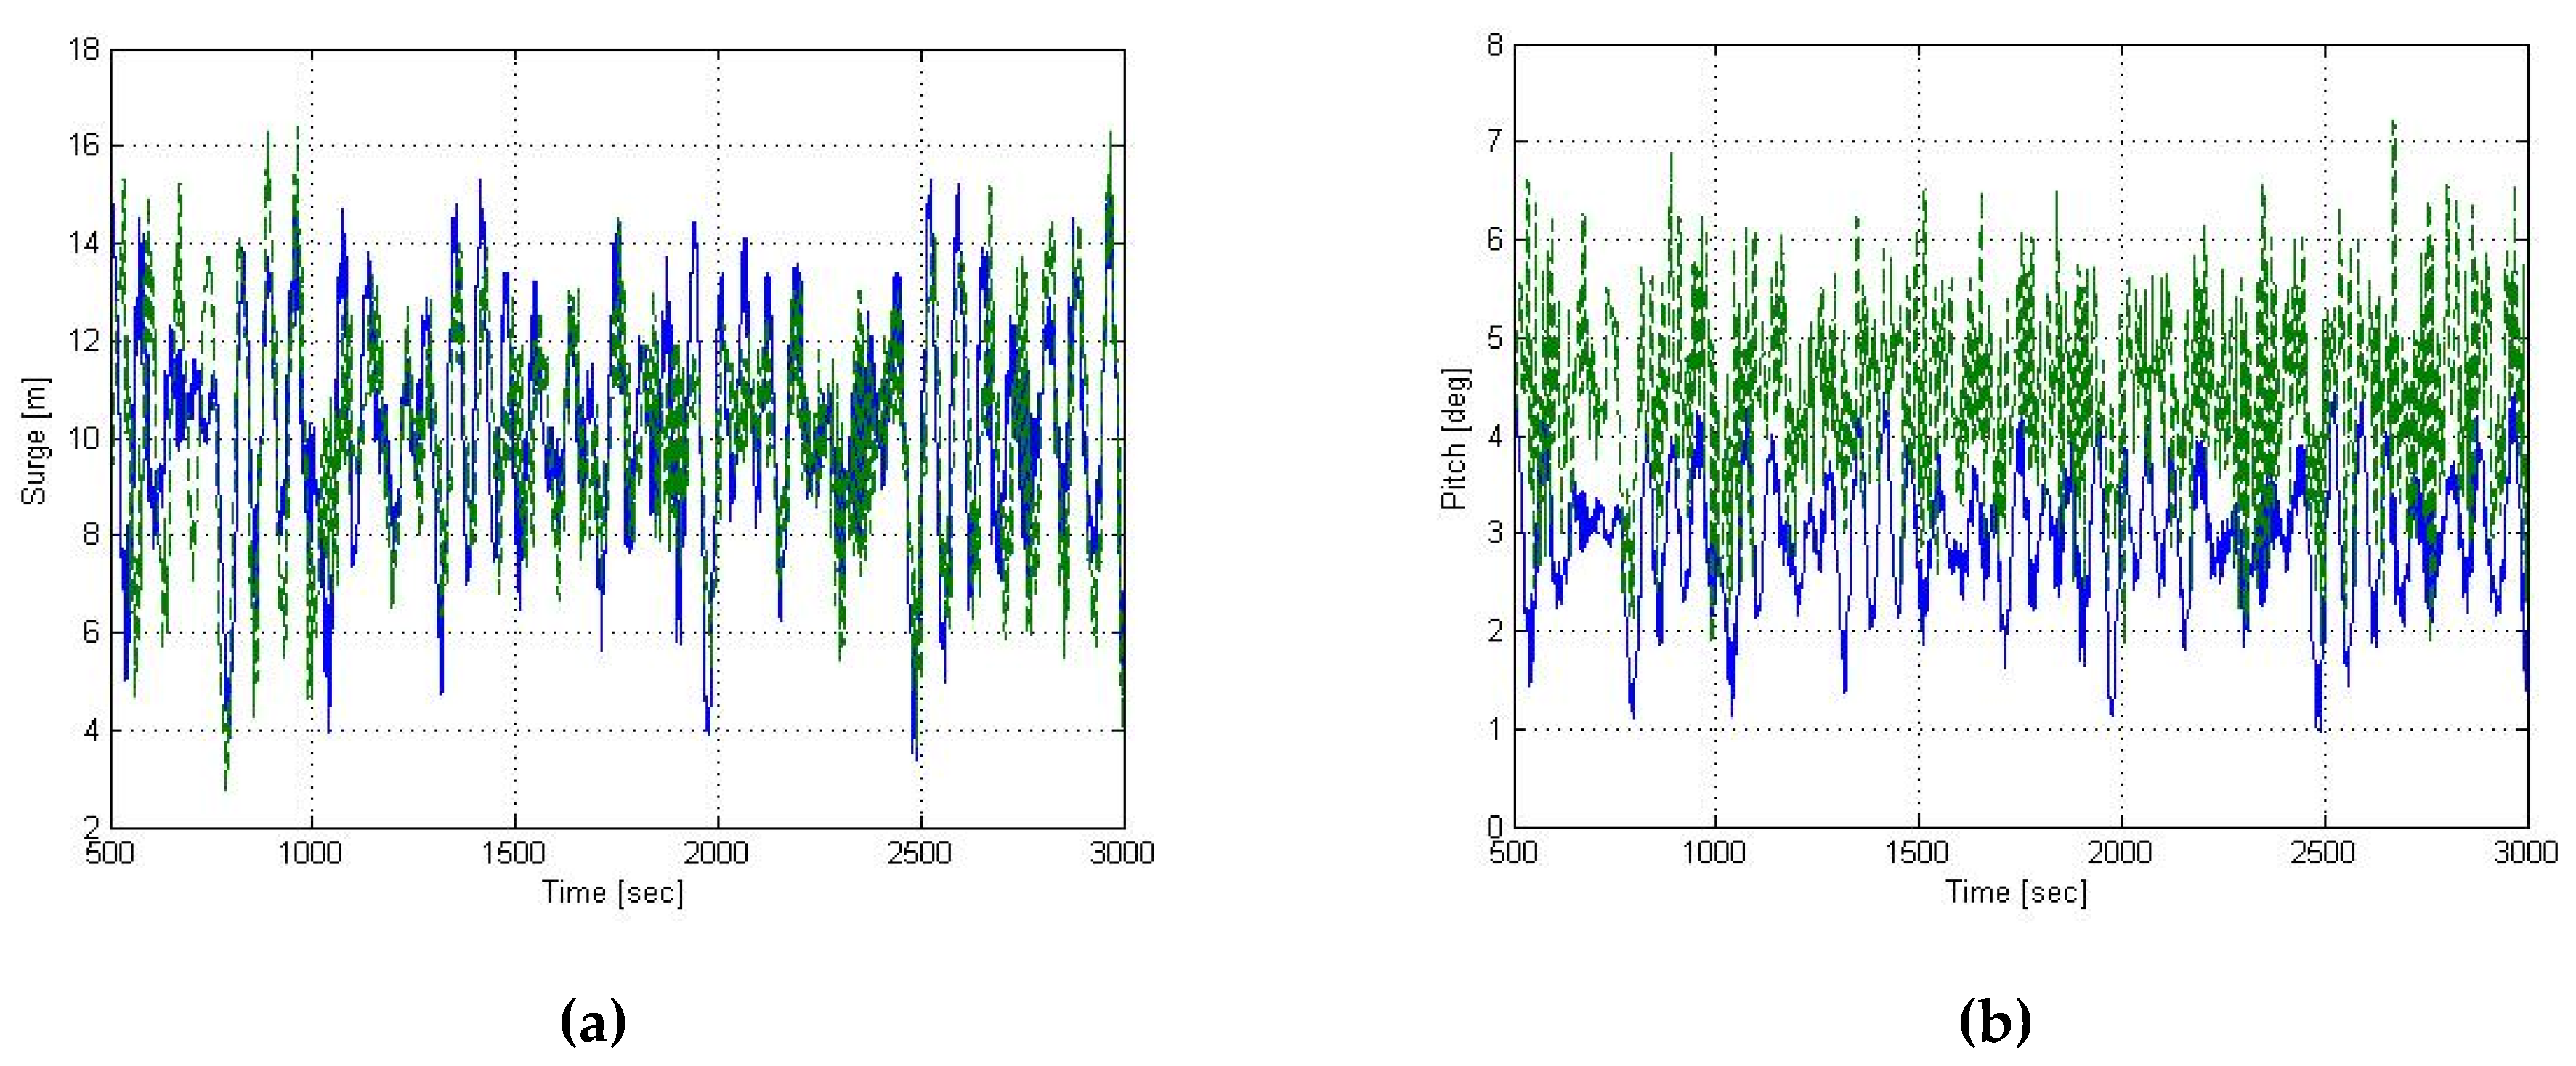
Figure 10.
Platform responses time series of SWAY swivel and reference hinged model. (Solid blue: swivel model; Dash green: reference hinged model): (a) Surge. (b) Pitch.
Figure 10.
Platform responses time series of SWAY swivel and reference hinged model. (Solid blue: swivel model; Dash green: reference hinged model): (a) Surge. (b) Pitch.
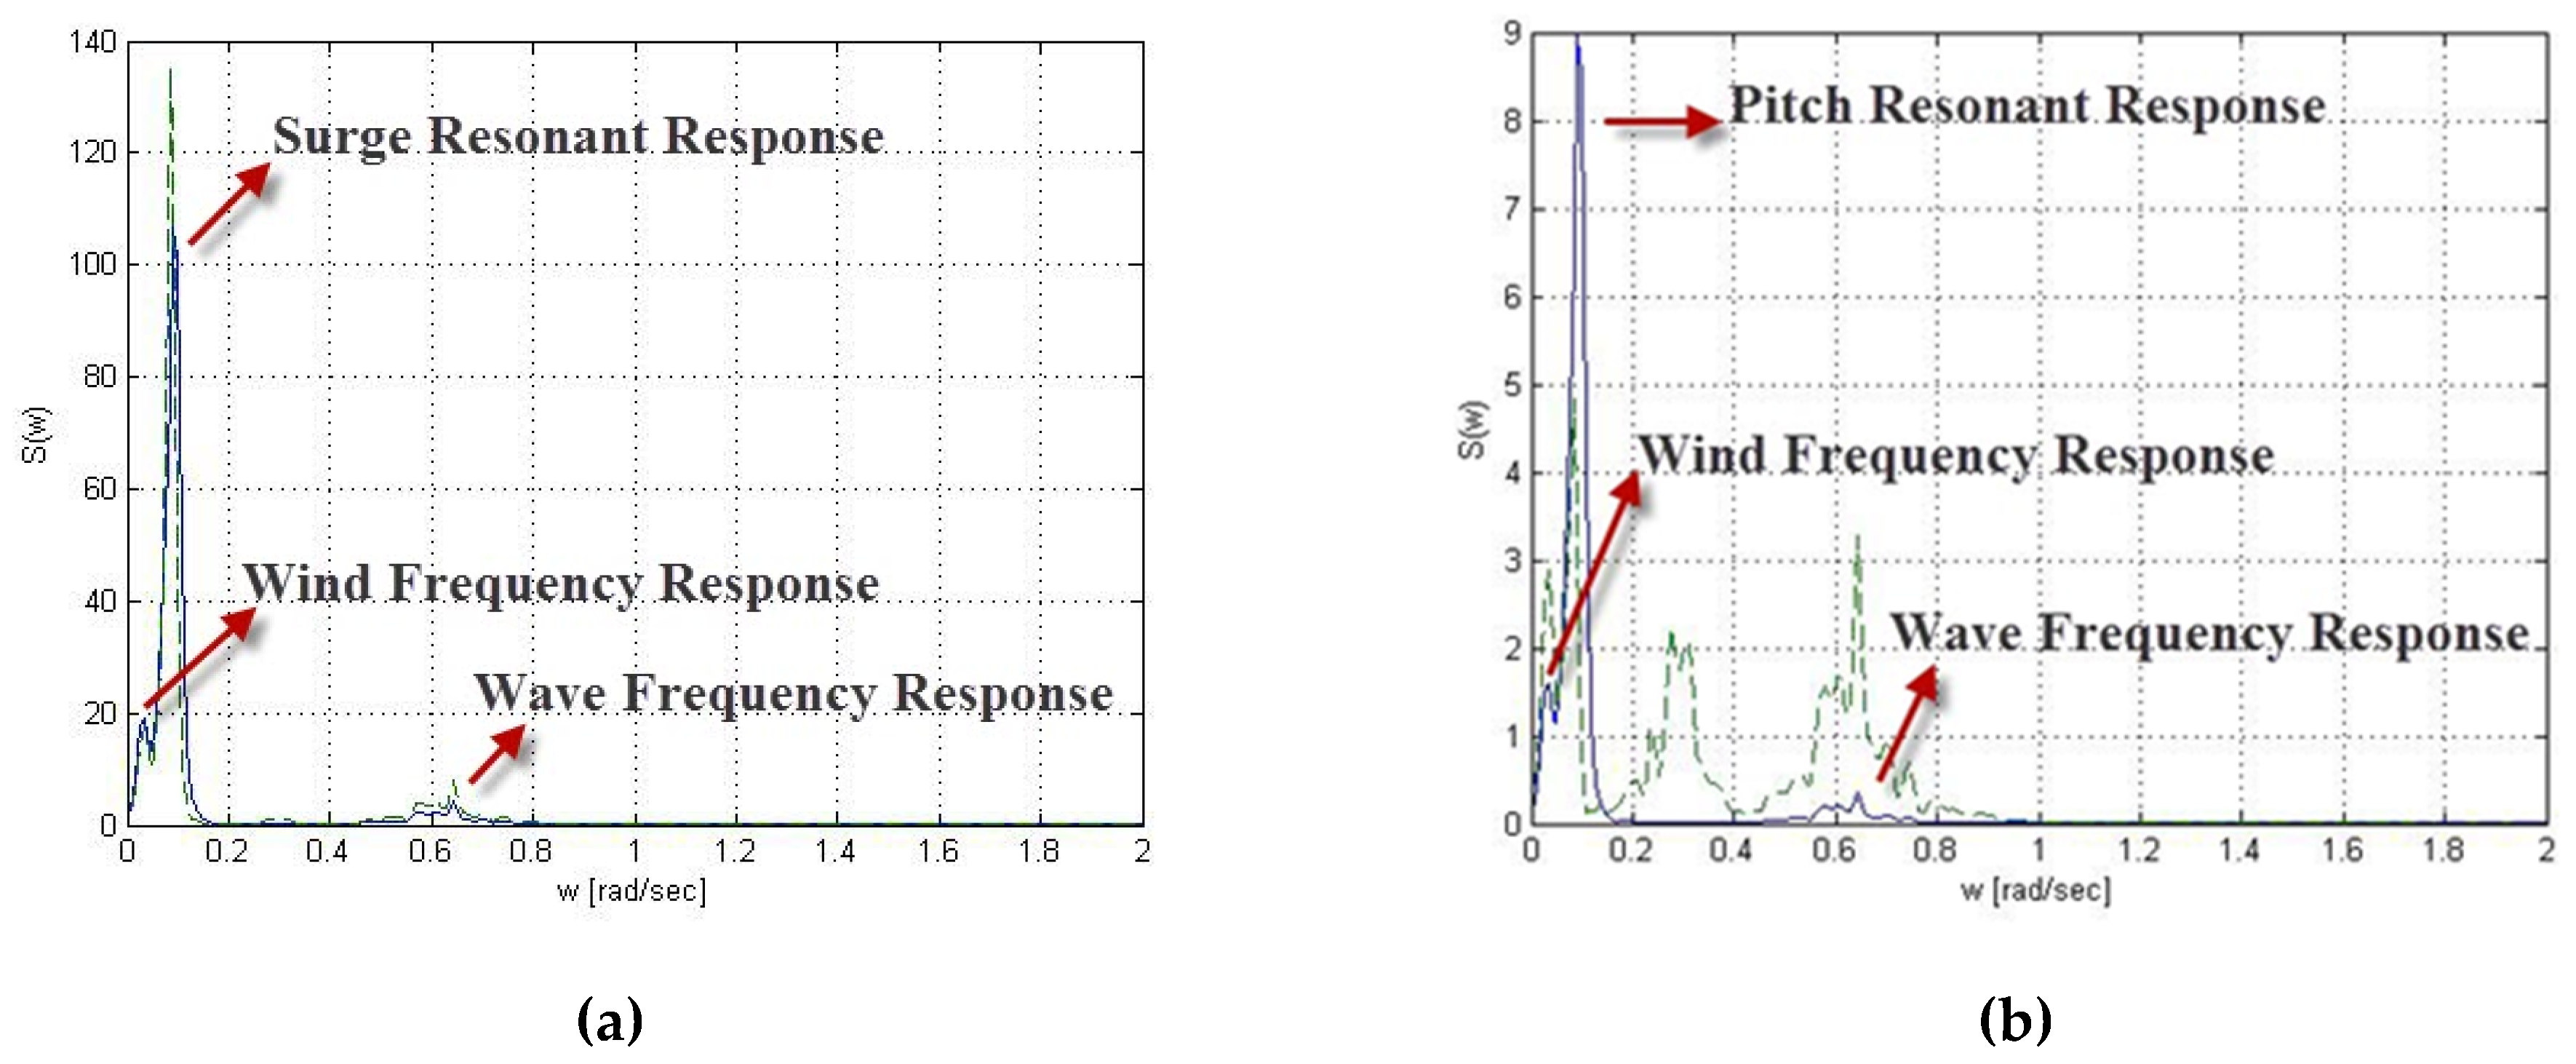
Figure 11.
Platform response spectra of SWAY swivel and reference hinged model Case 2. (Solid blue: swivel model; Dash green: hinged model): (a) Surge. (b) Pitch.
Figure 11.
Platform response spectra of SWAY swivel and reference hinged model Case 2. (Solid blue: swivel model; Dash green: hinged model): (a) Surge. (b) Pitch.
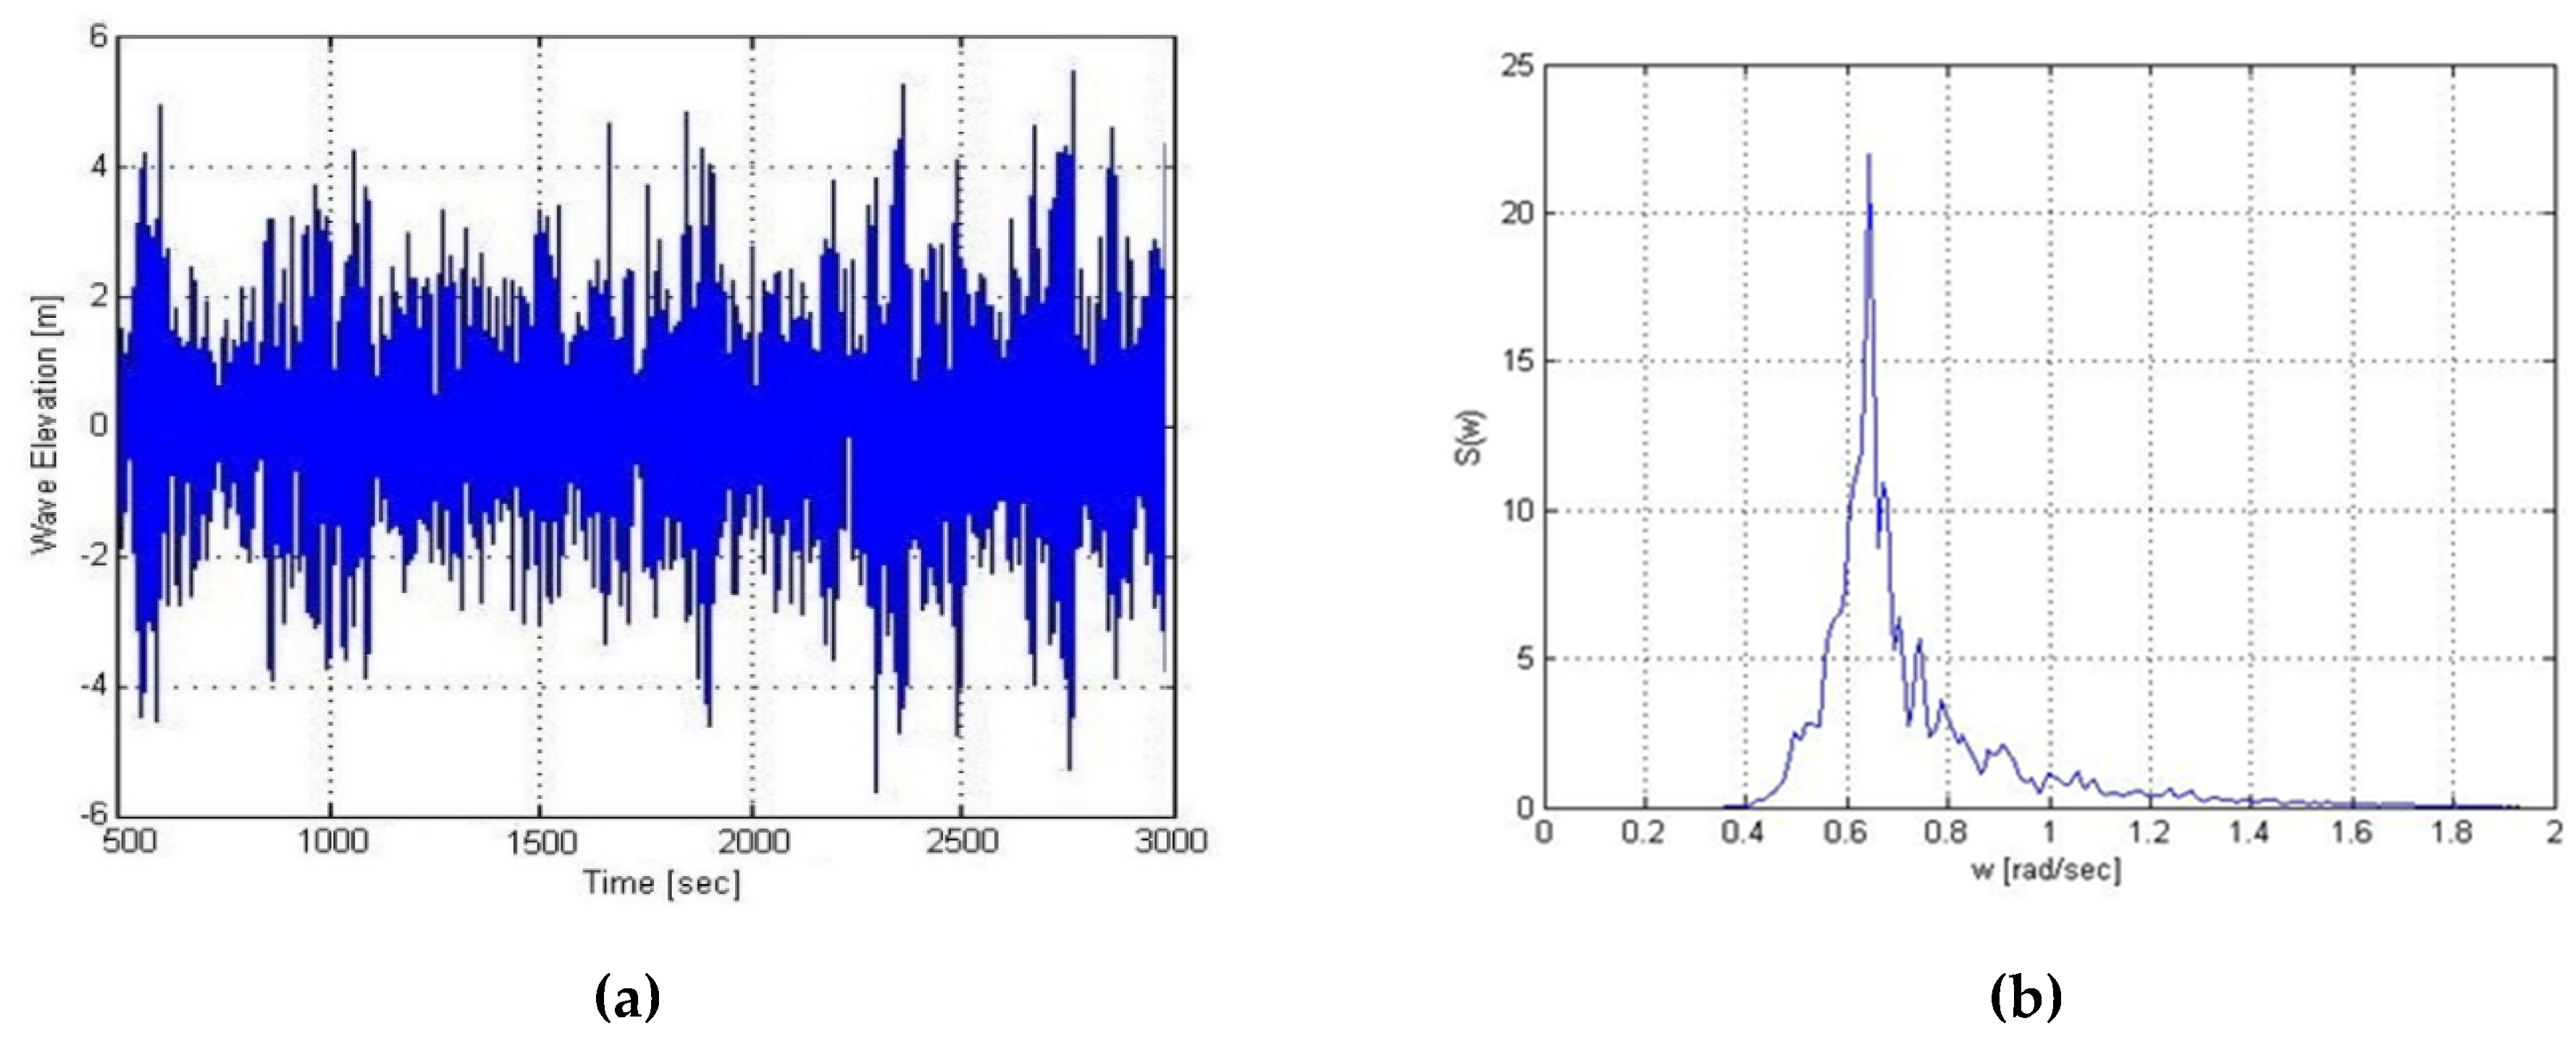
Figure 12.
Environmental conditions for case 2: (a) Time series of wave elevation. (b) Wave spectrum.
Figure 12.
Environmental conditions for case 2: (a) Time series of wave elevation. (b) Wave spectrum.
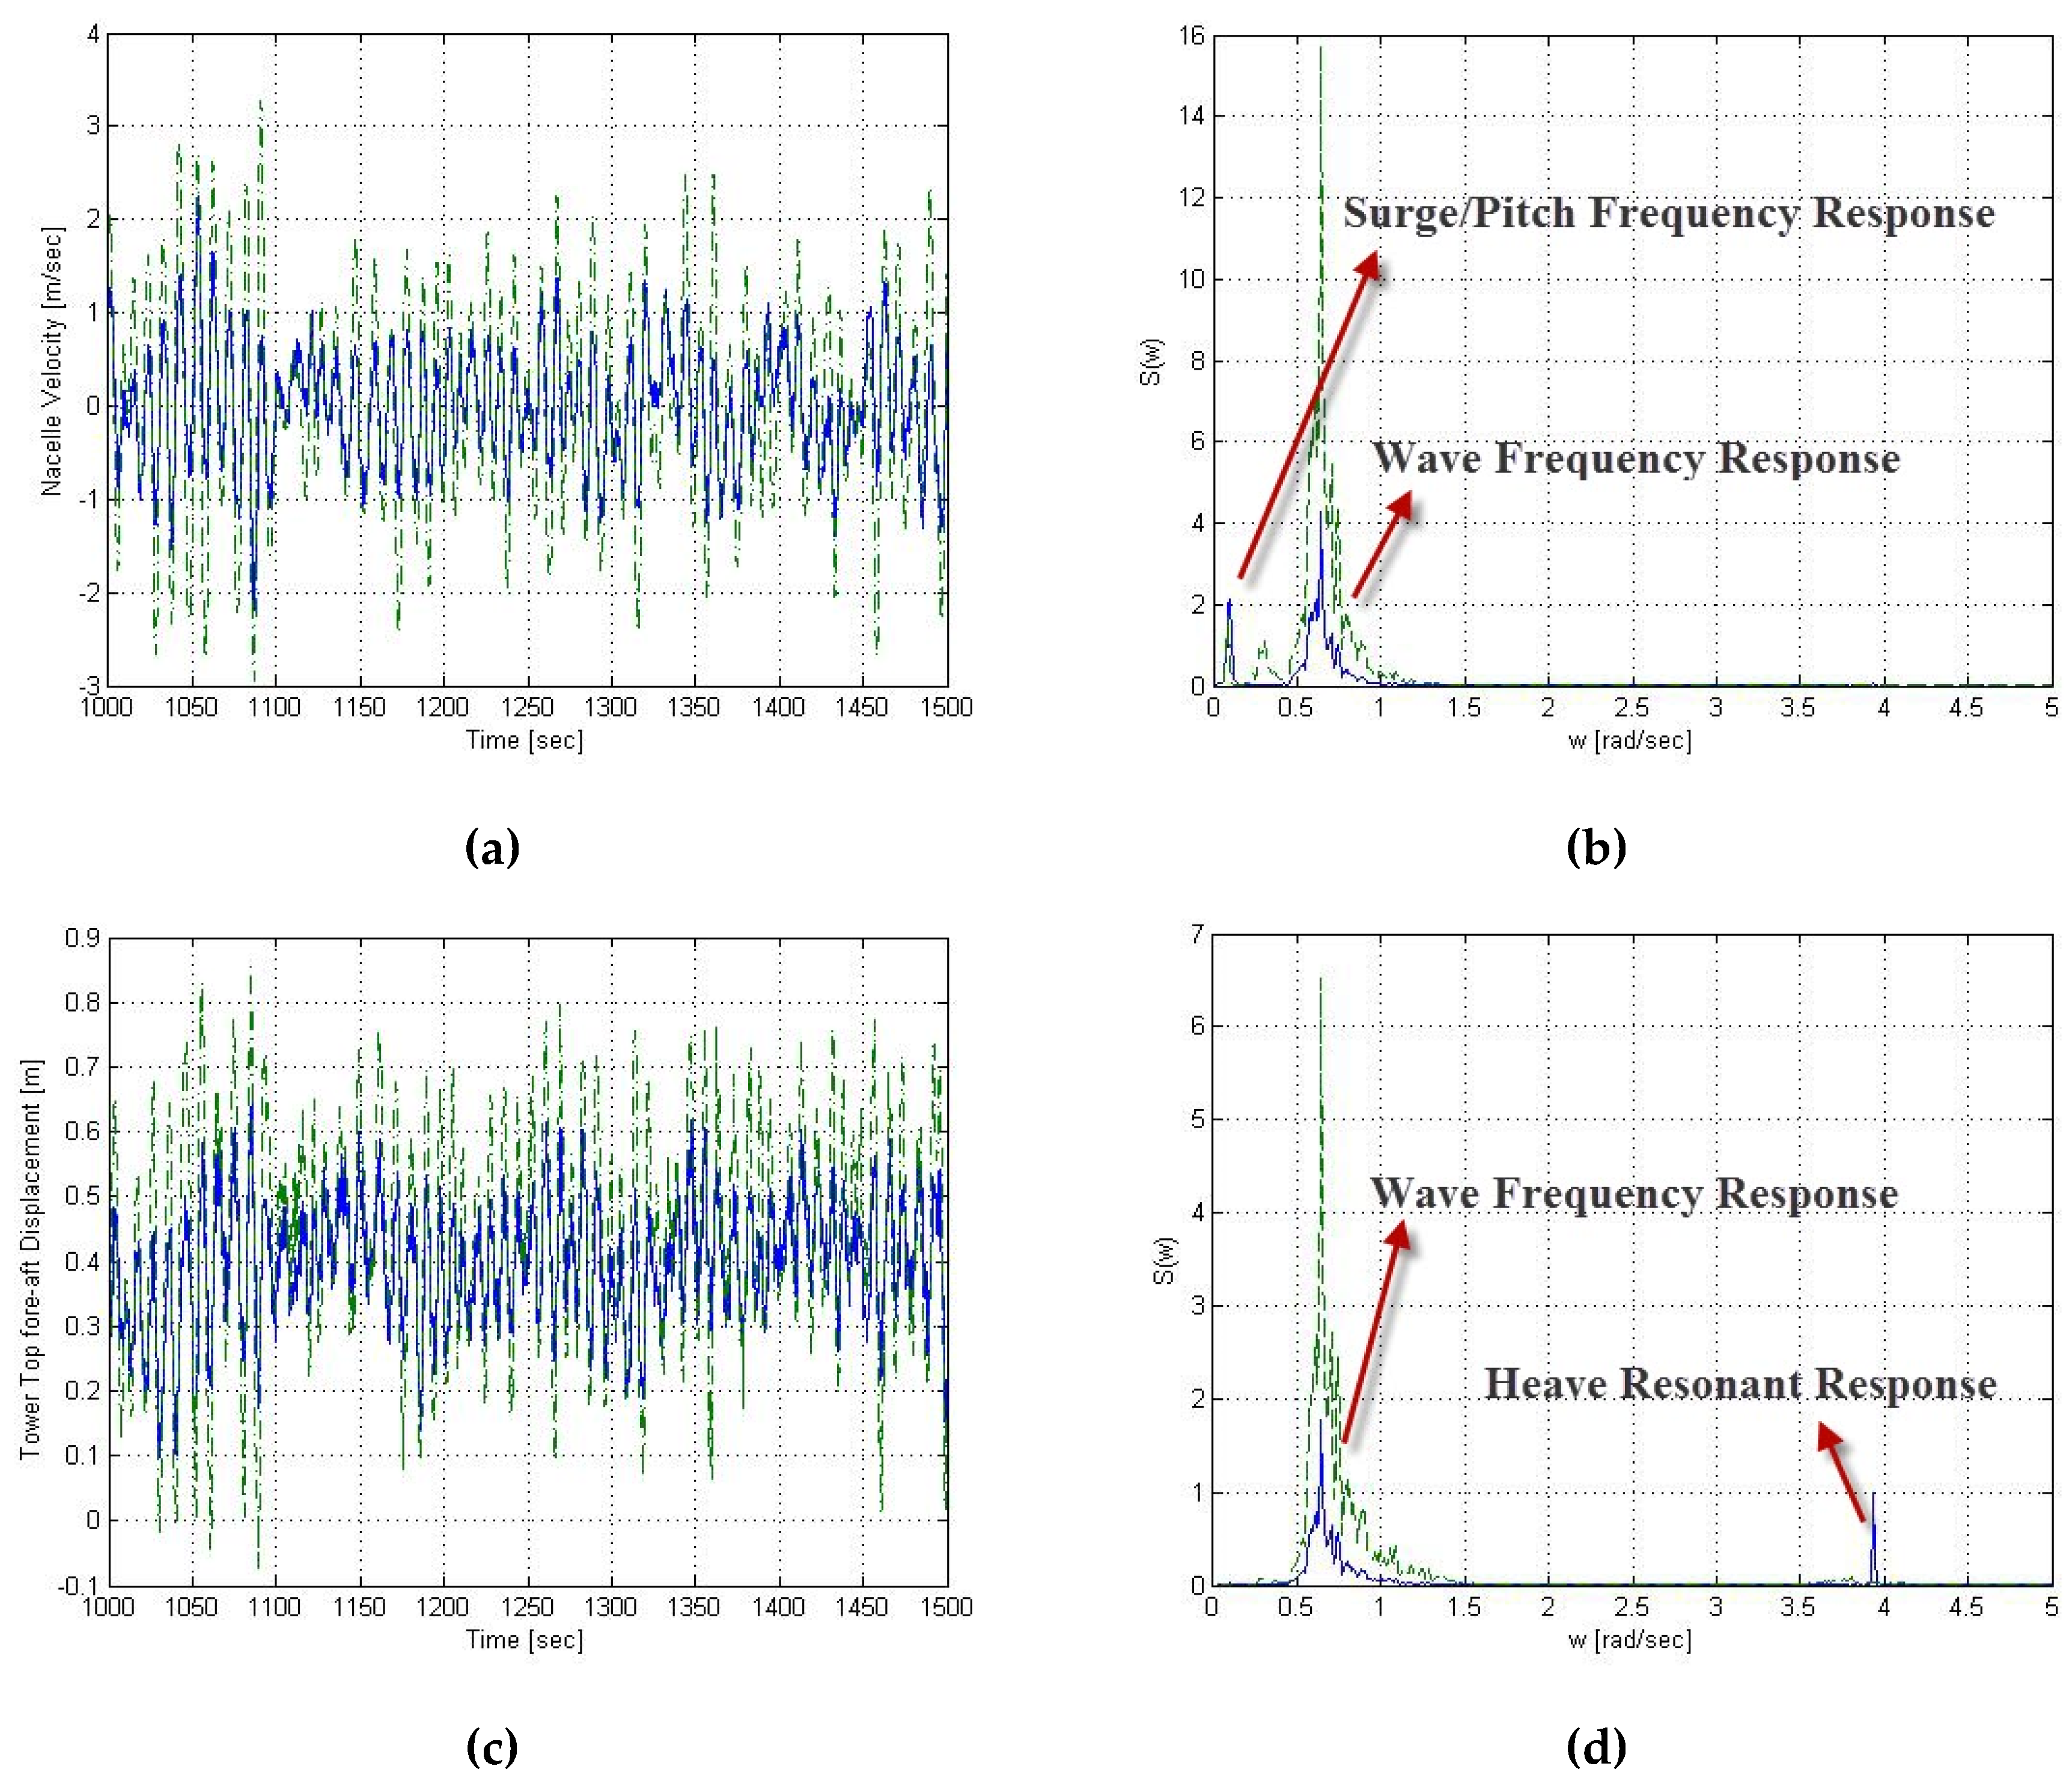
Figure 13.
Tower top displacements of SWAY swivel model and reference model. (Solid blue: SWAY model; Dash green: reference hinged model): (a) Nacelle velocity time series. (b) Nacelle velocity spectrum. (c) Nacelle acceleration time series. (d) Nacelle acceleration spectrum.
Figure 13.
Tower top displacements of SWAY swivel model and reference model. (Solid blue: SWAY model; Dash green: reference hinged model): (a) Nacelle velocity time series. (b) Nacelle velocity spectrum. (c) Nacelle acceleration time series. (d) Nacelle acceleration spectrum.
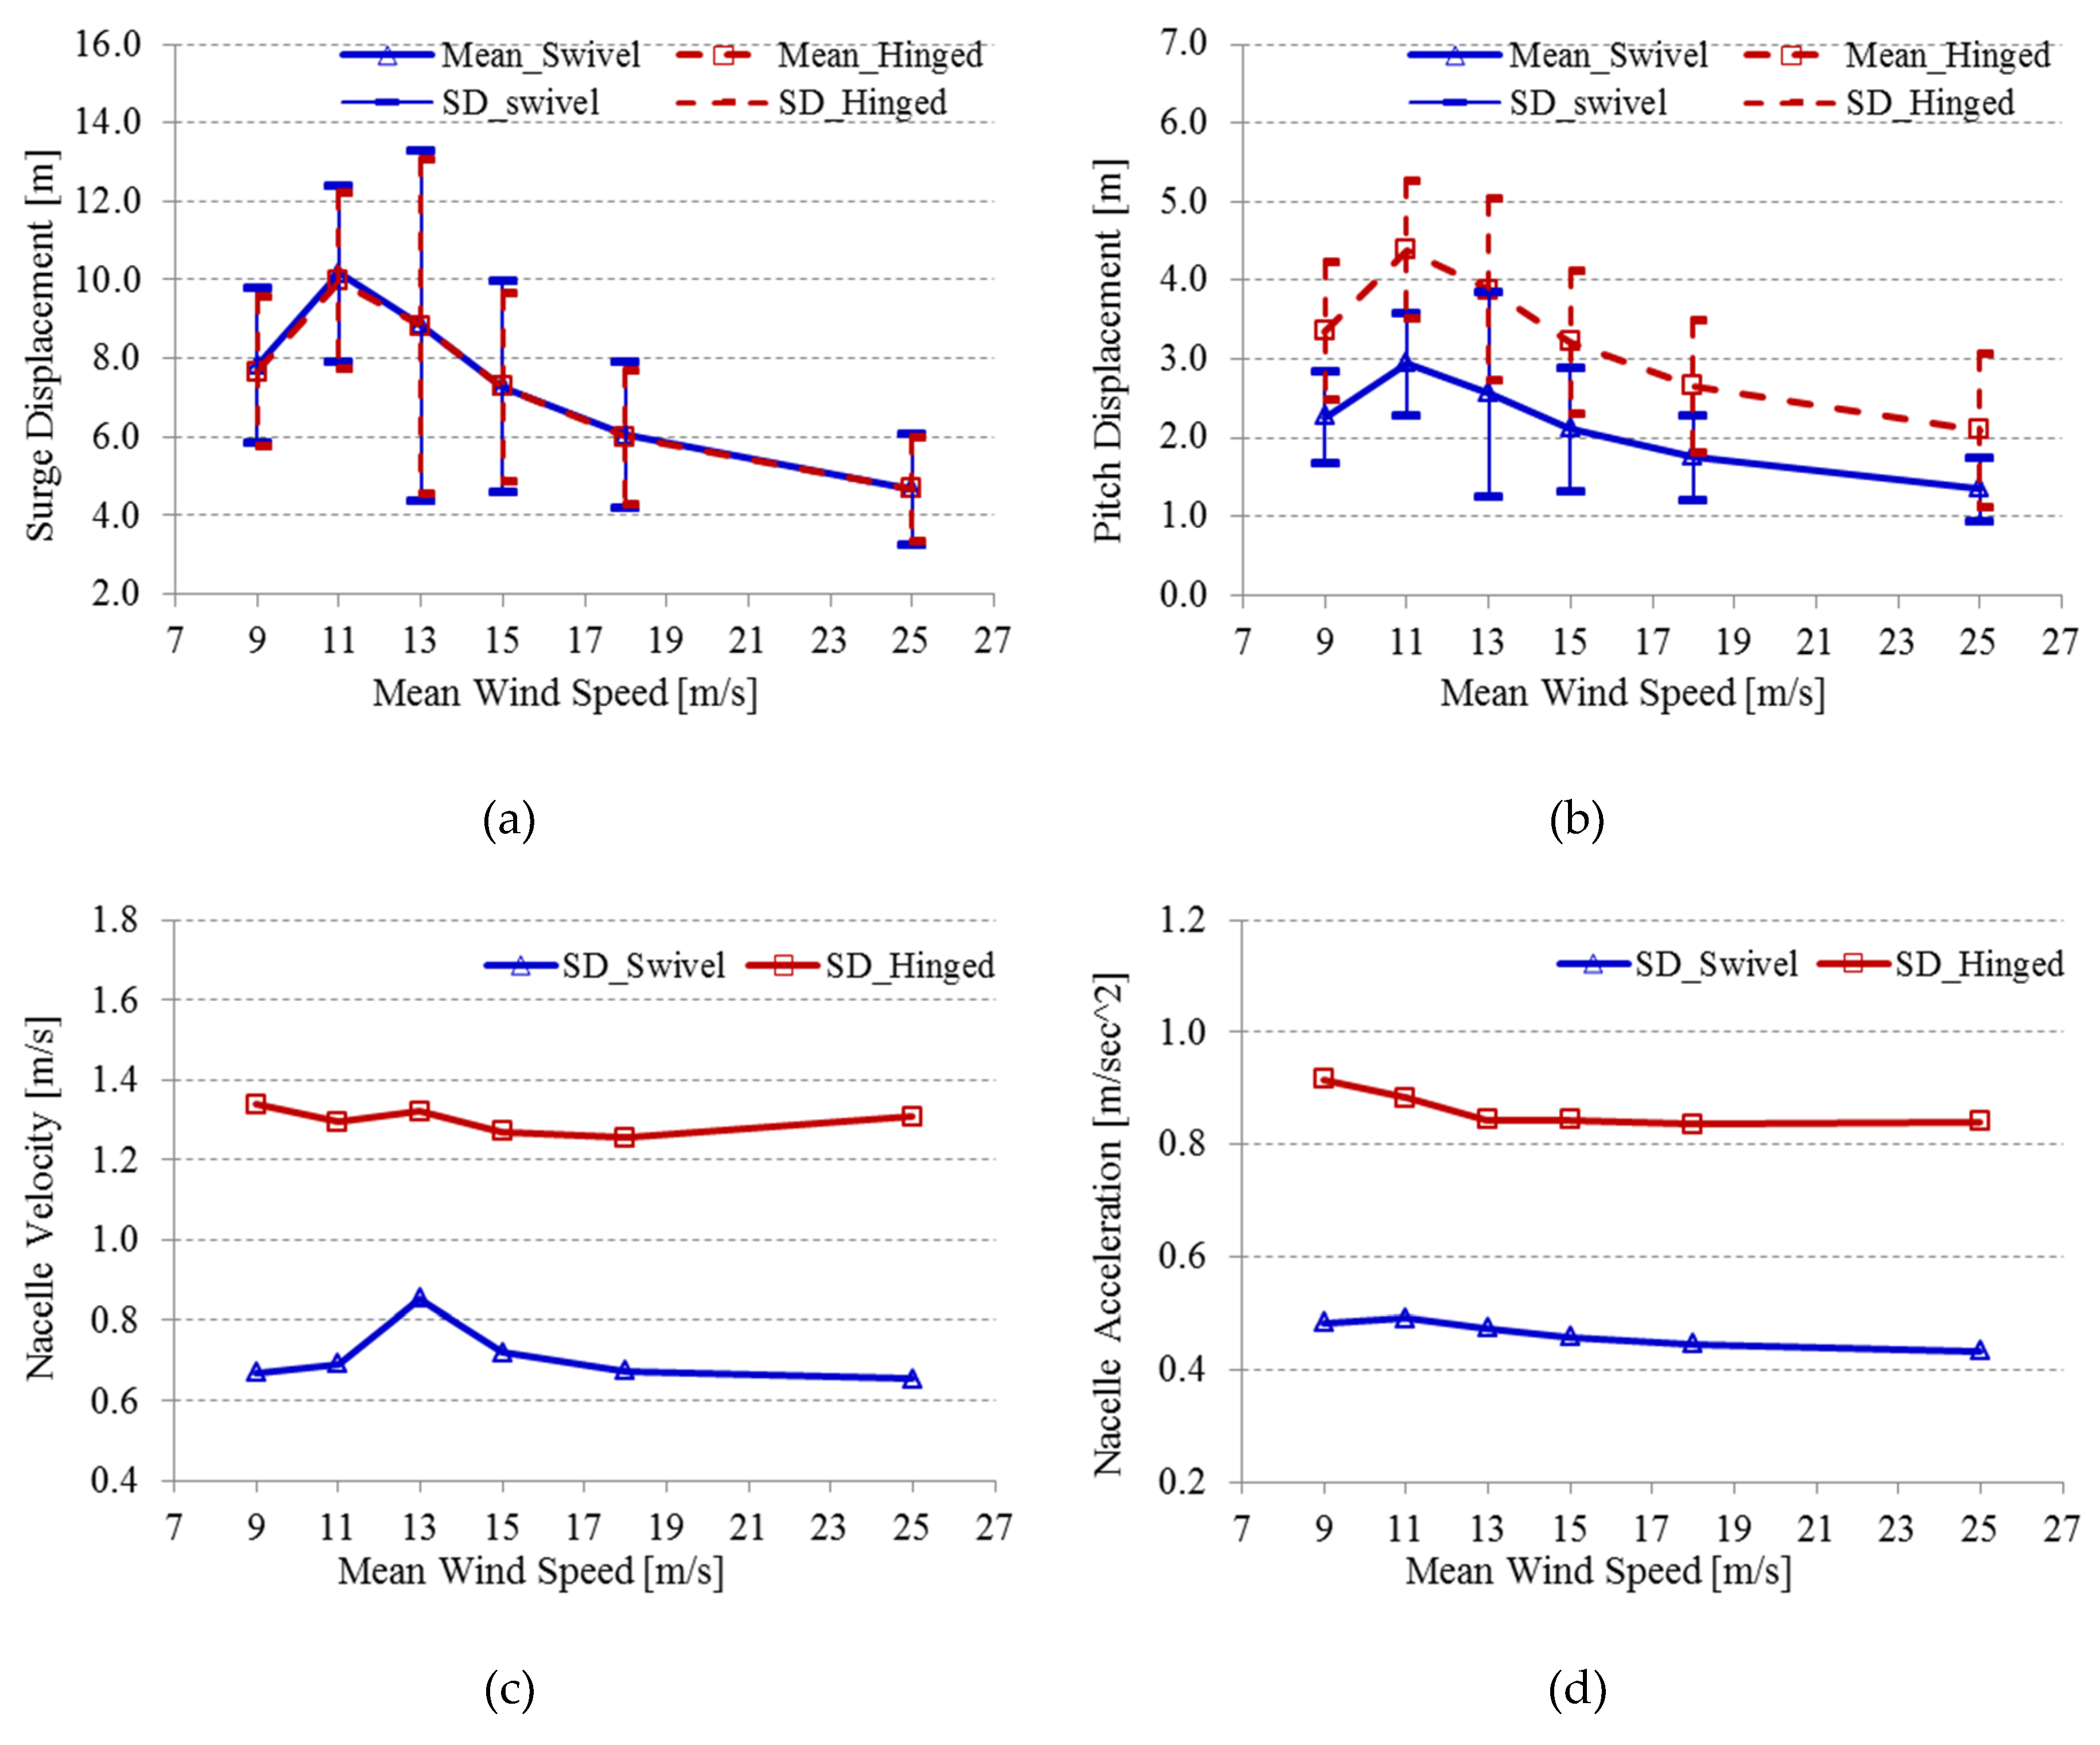
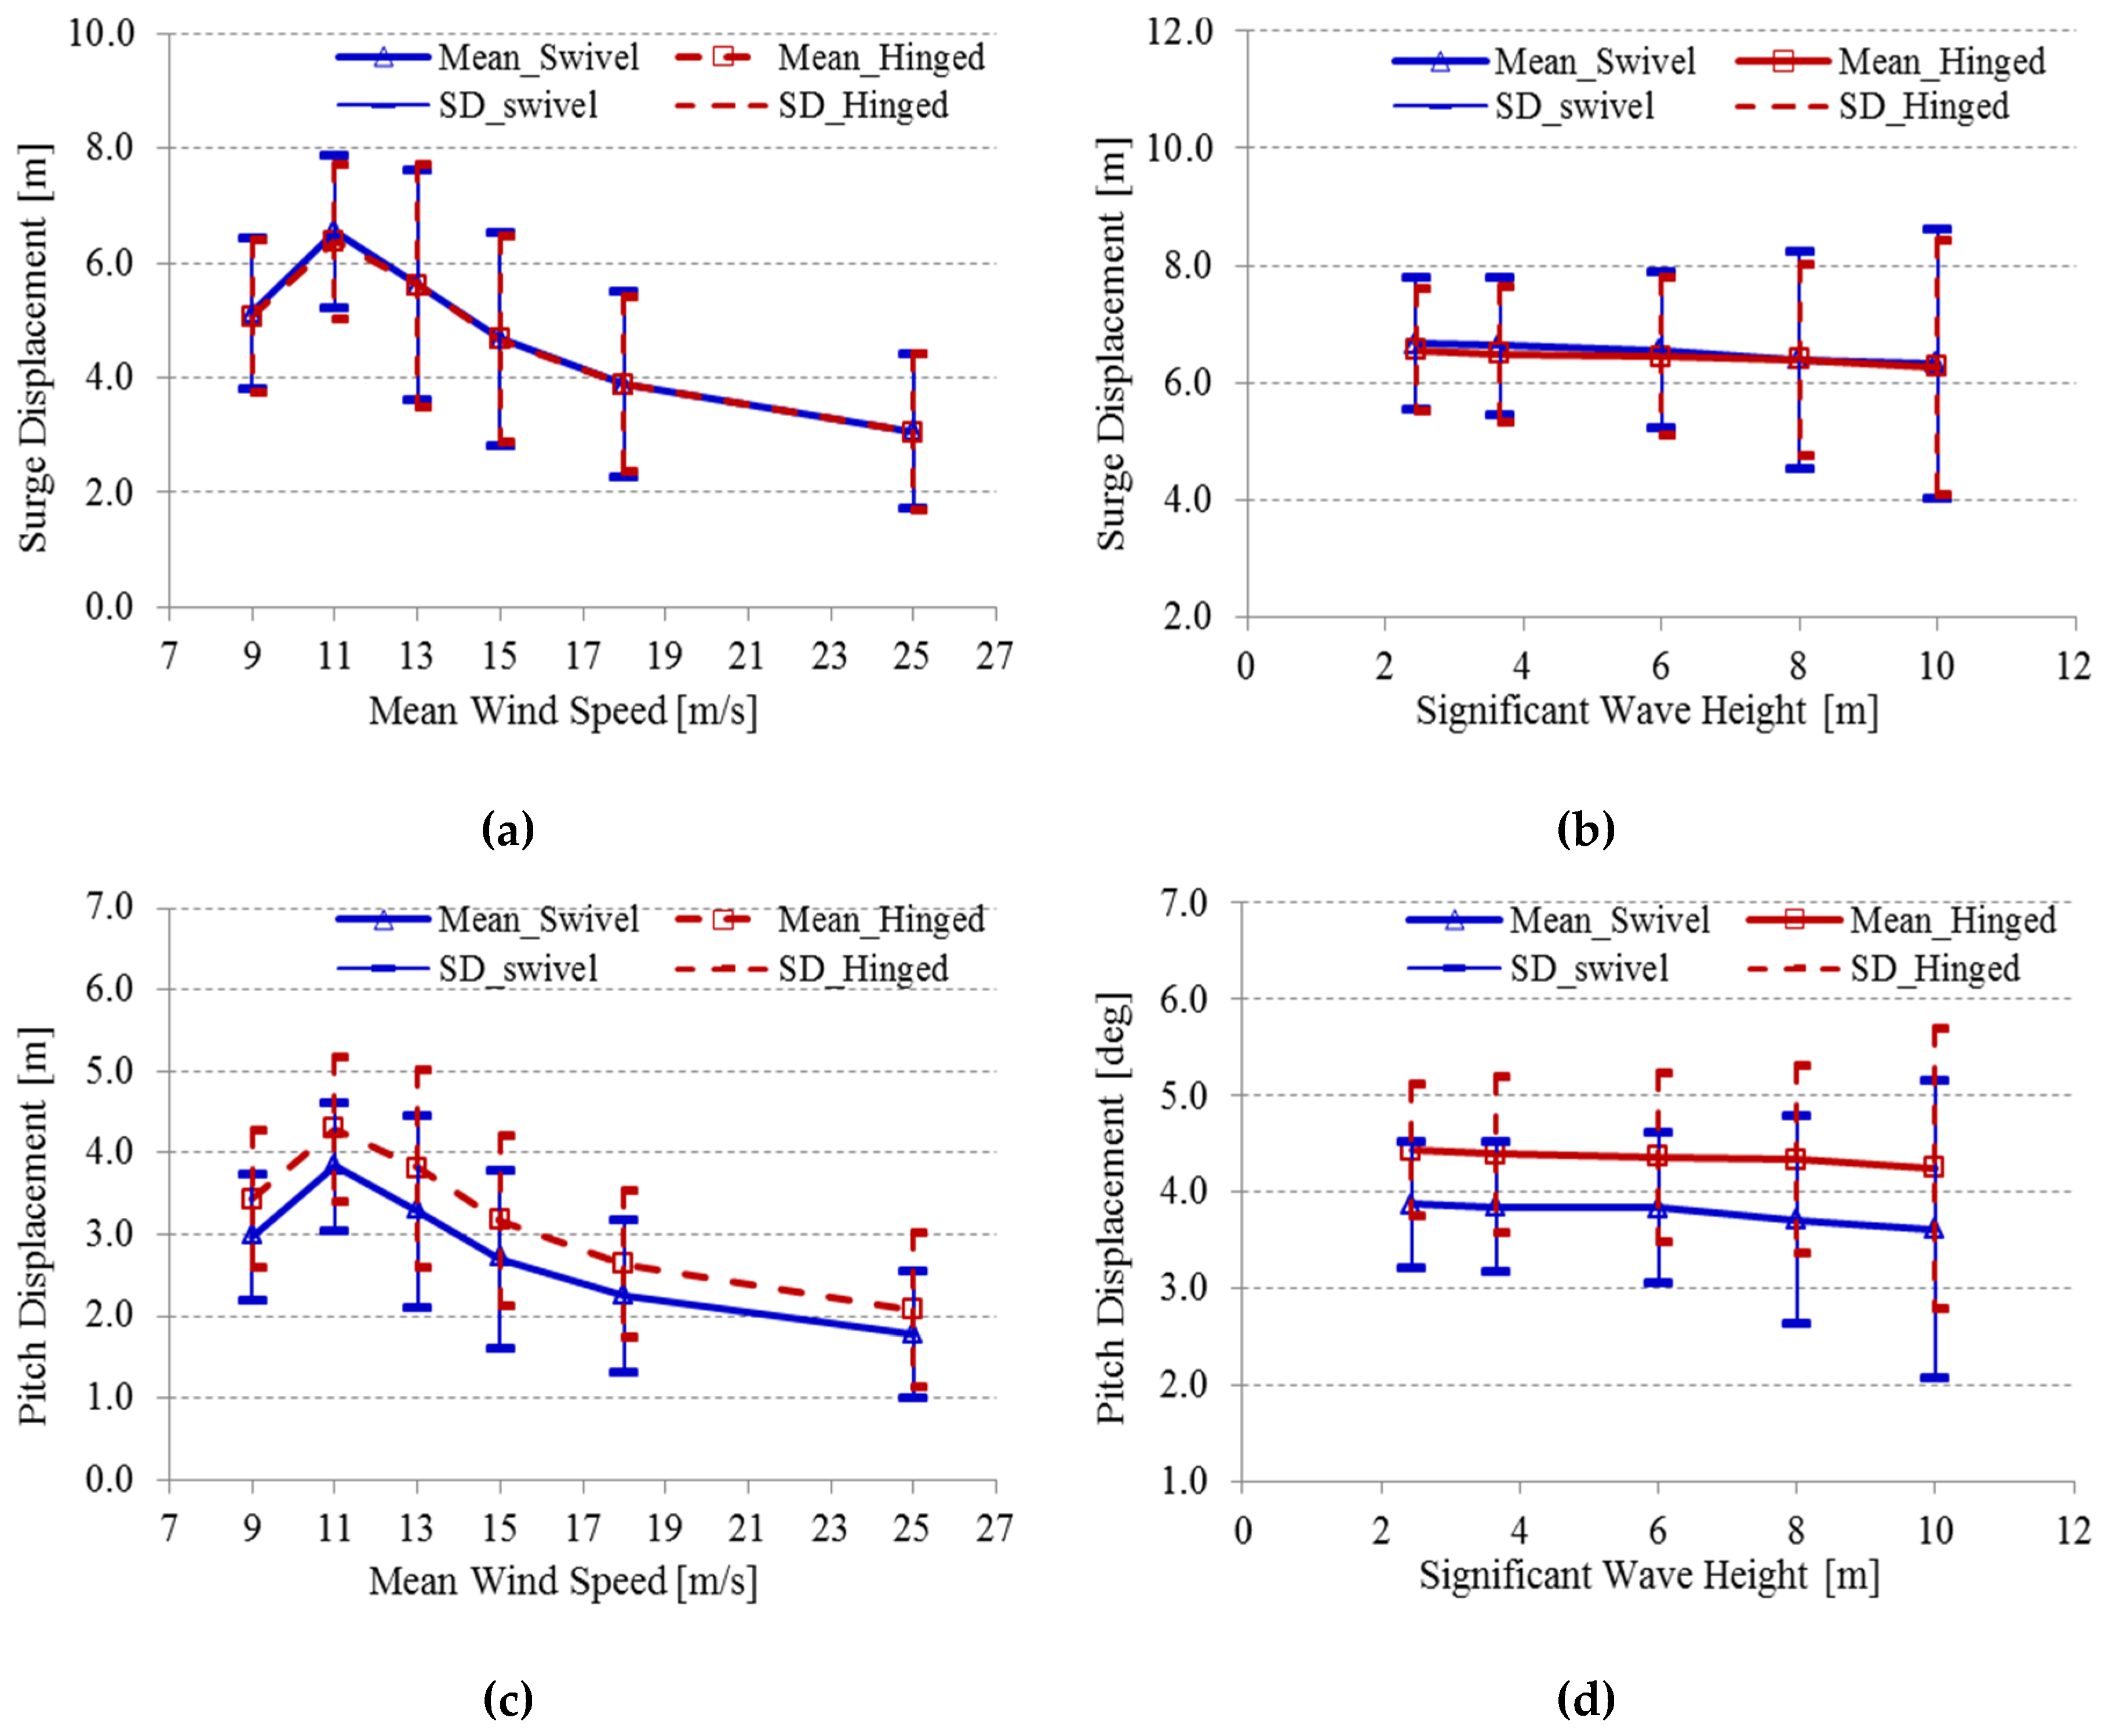
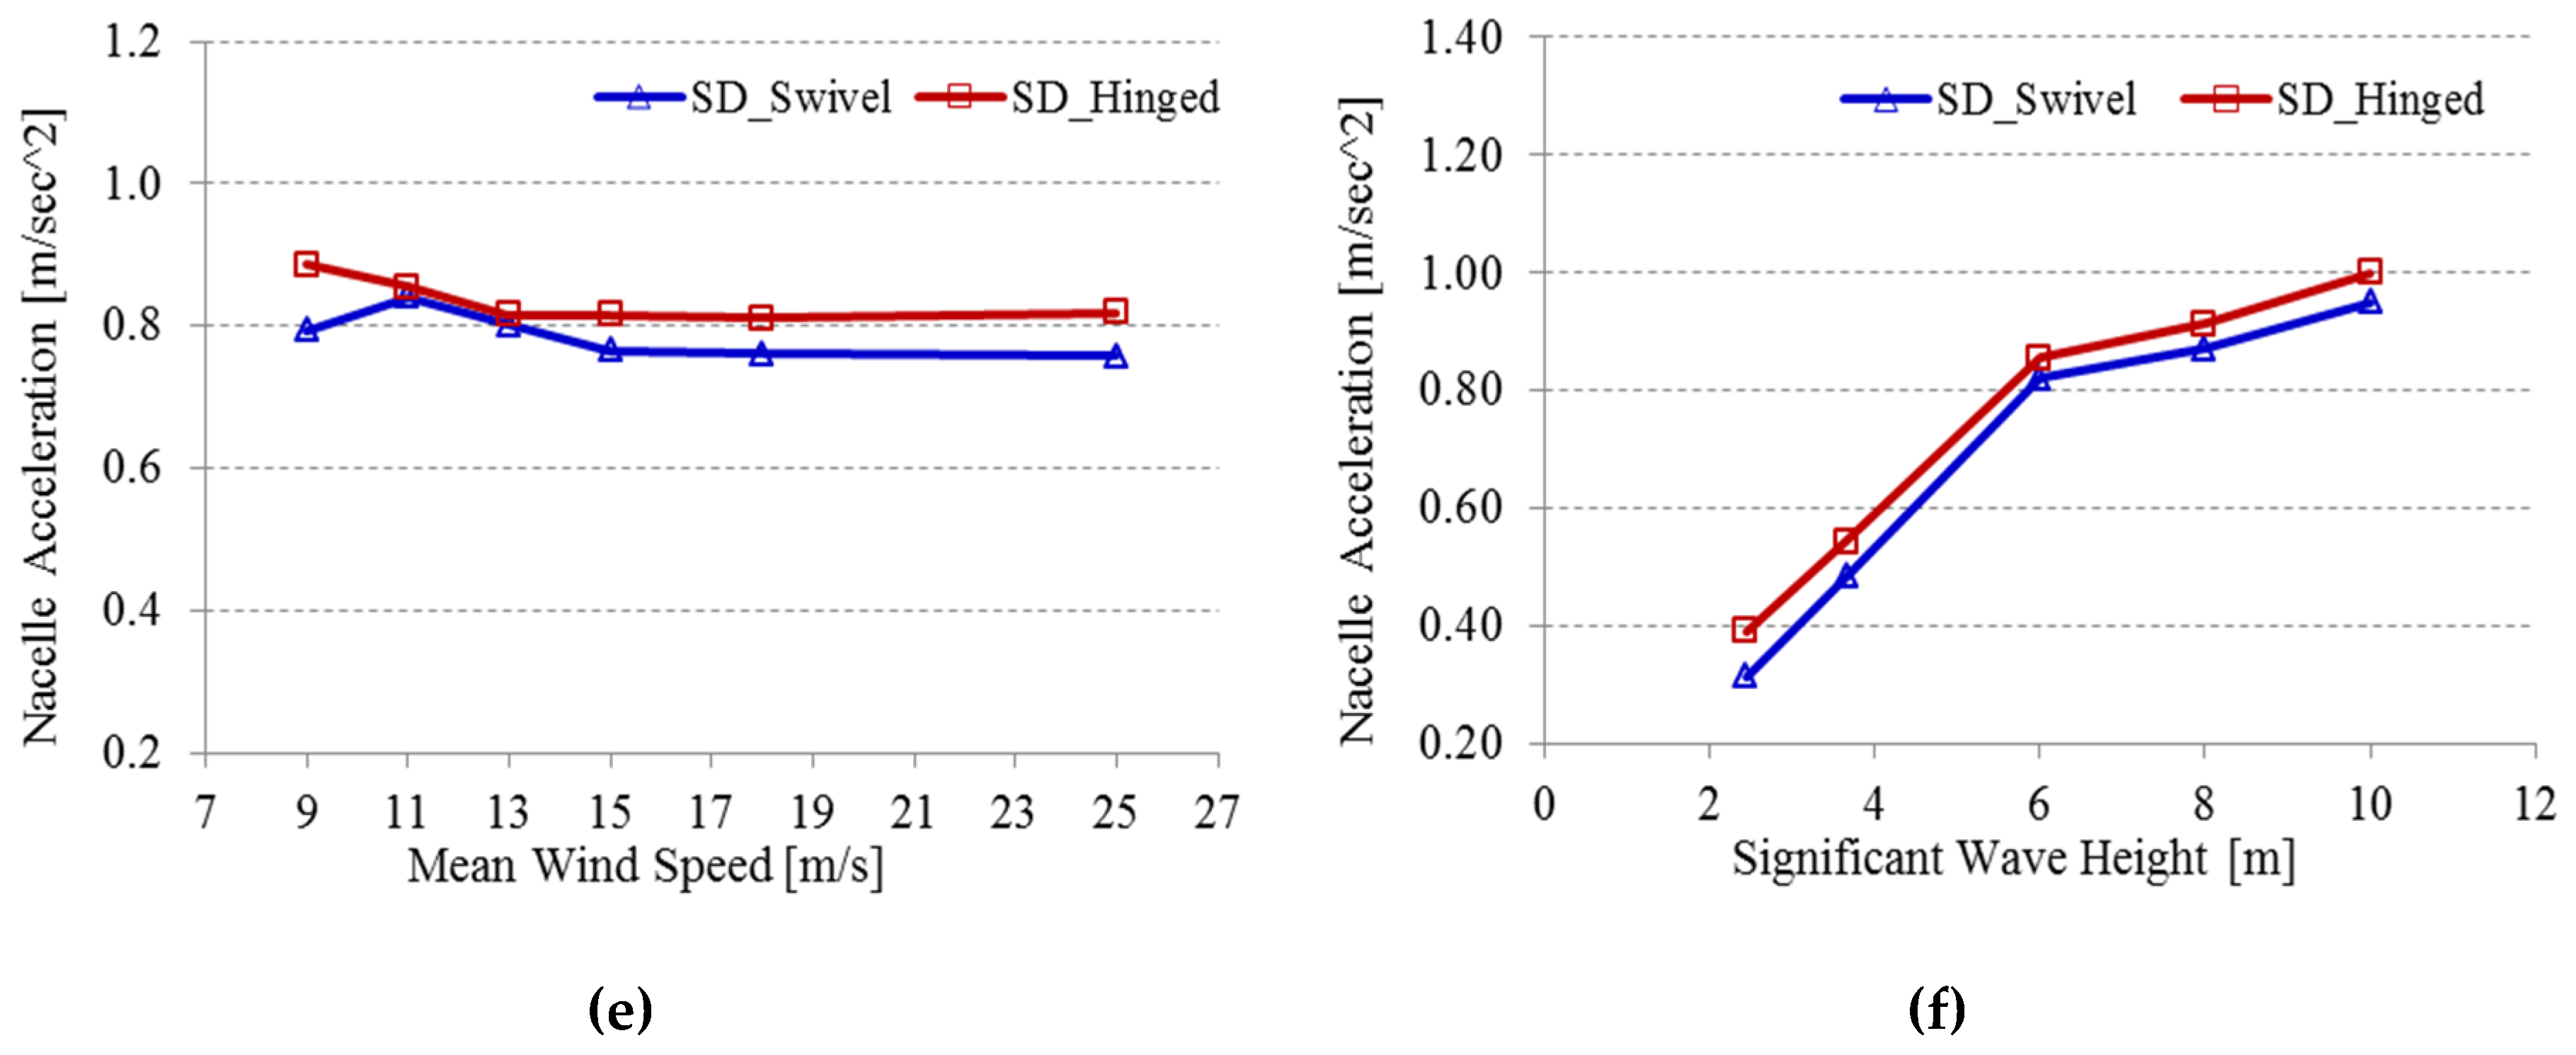
Figure 14.
Wind effect on surge/pitch motions and turbine performance: (a) Surge motion. (b) Pitch motion. (c) Nacelle Velocity. (d) Nacelle Acceleration. SD: standard deviation.
Figure 14.
Wind effect on surge/pitch motions and turbine performance: (a) Surge motion. (b) Pitch motion. (c) Nacelle Velocity. (d) Nacelle Acceleration. SD: standard deviation.
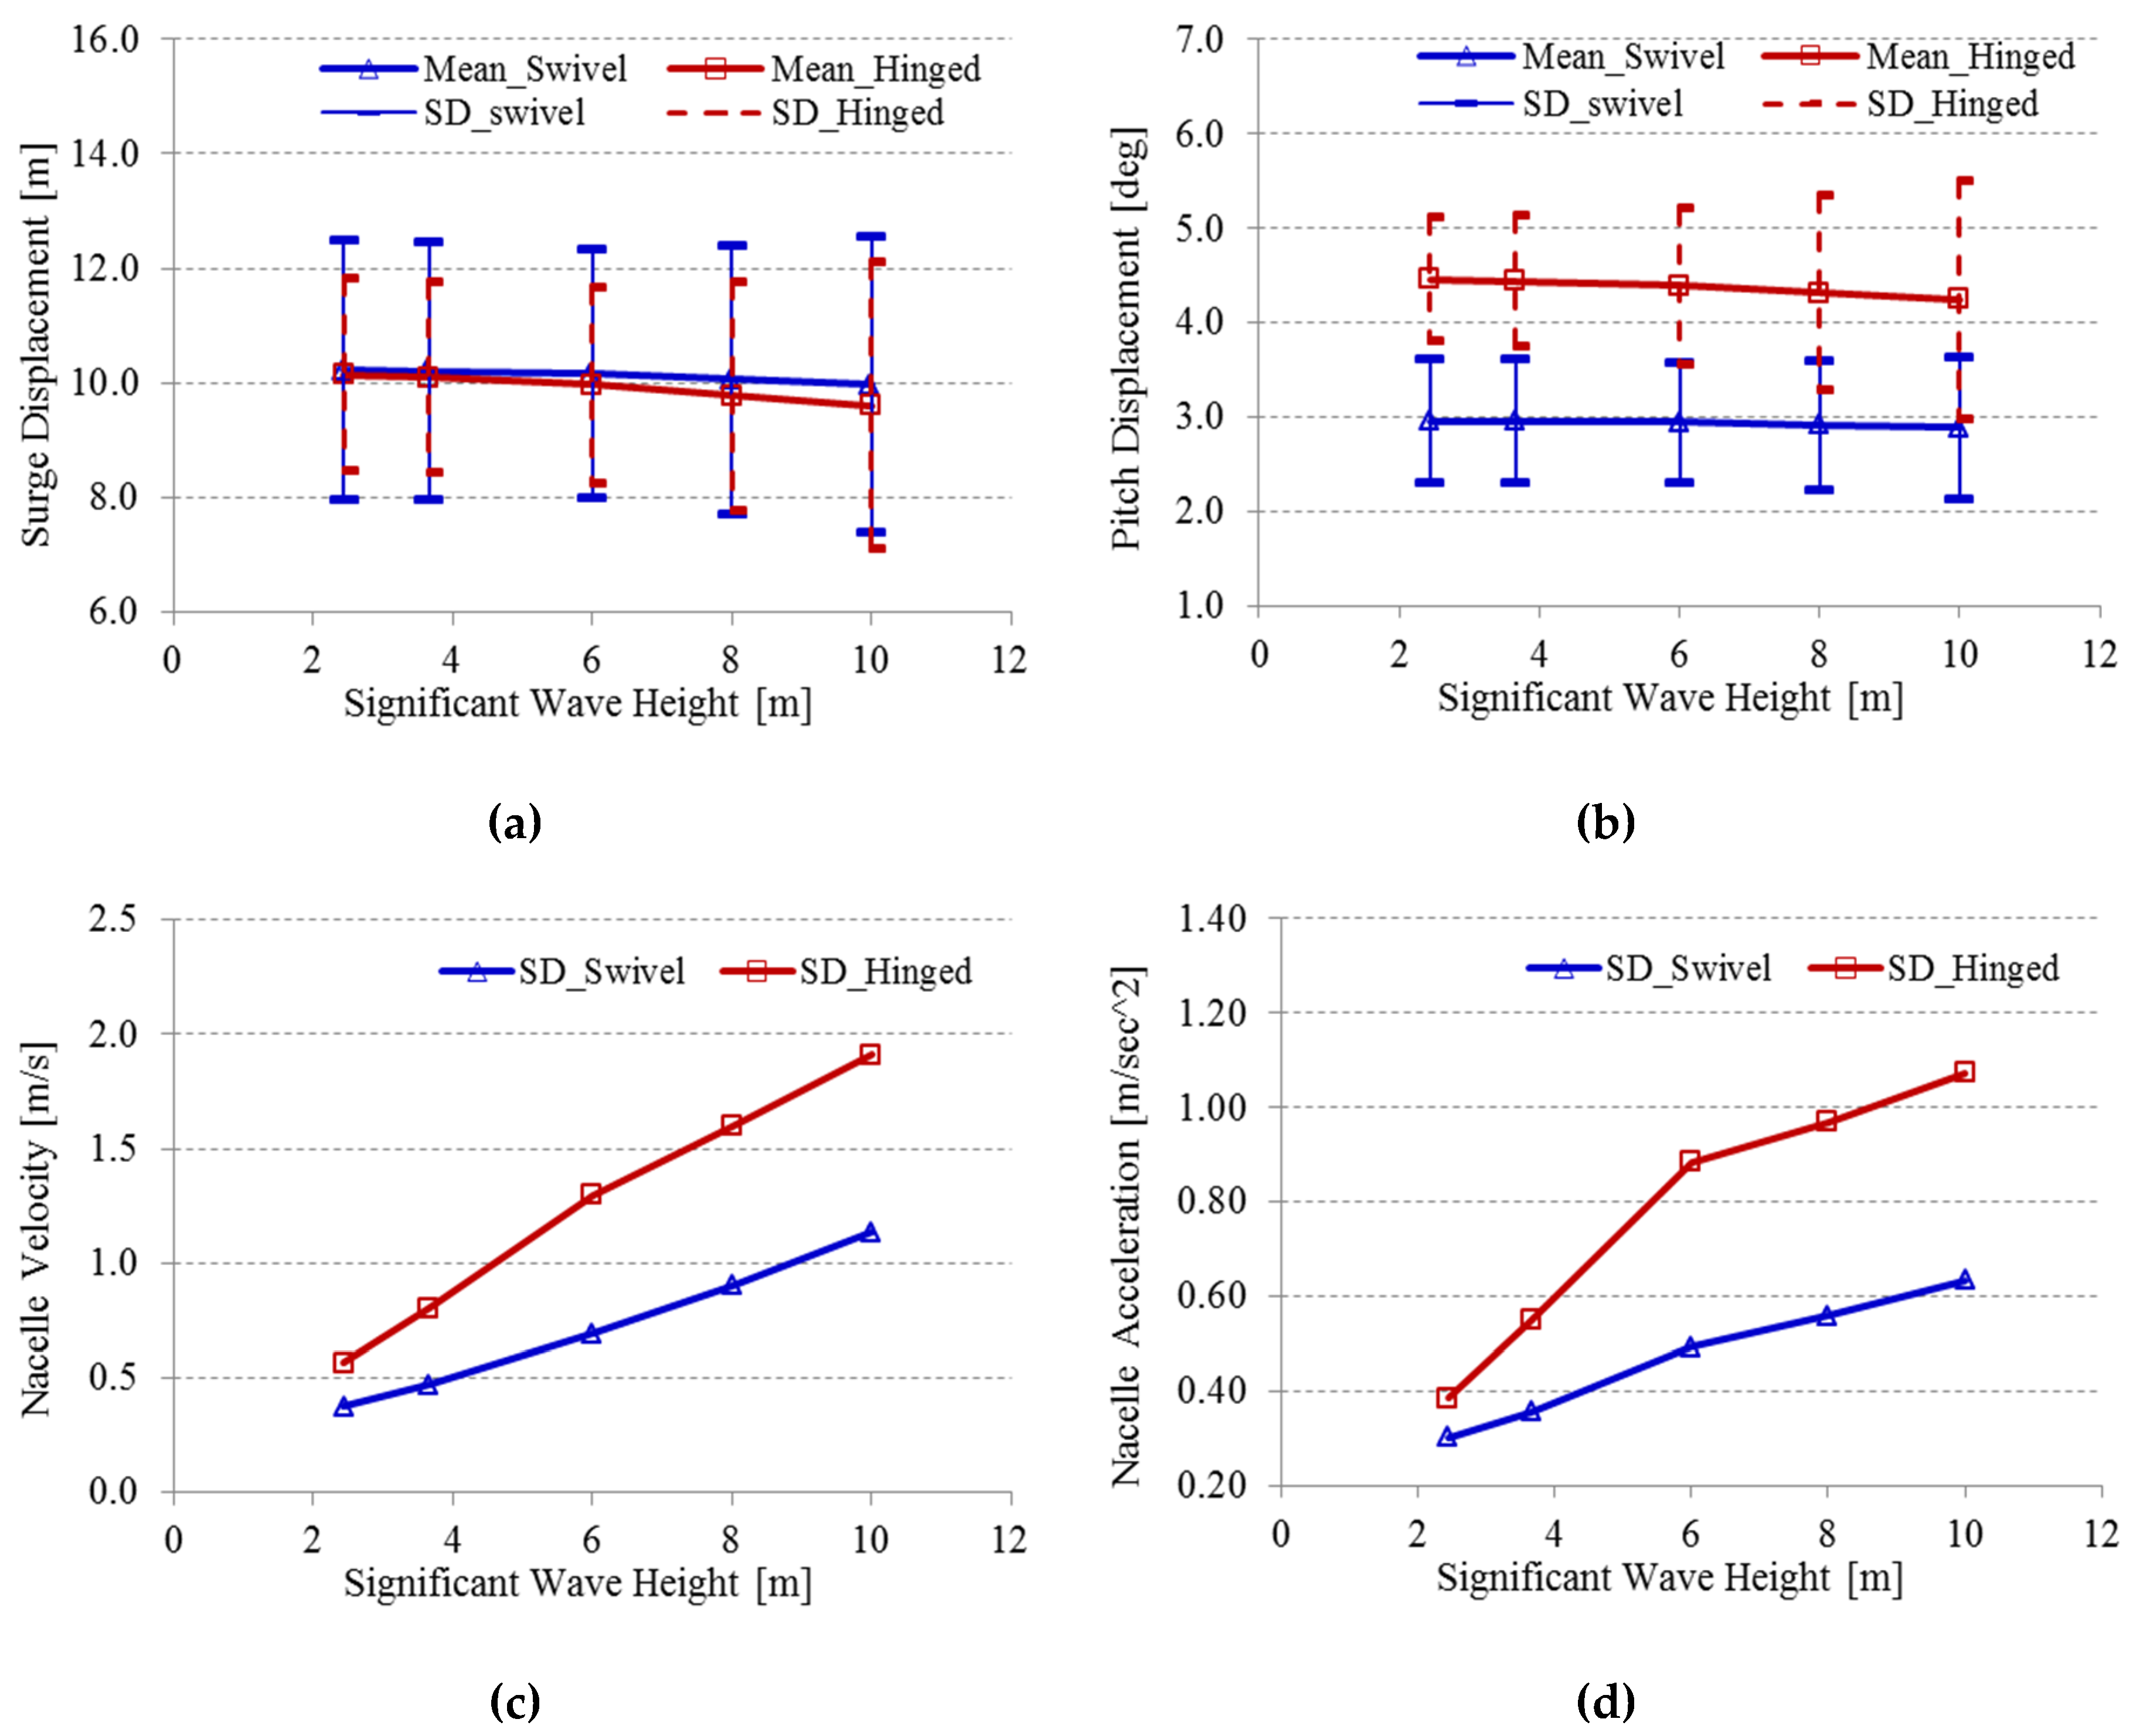
Figure 15.
Wave effect on surge/pitch motions and turbine performance: (a) Surge motion. (b) Pitch motion. (c) Nacelle Velocity. (d) Nacelle Acceleration. SD: standard deviation.
Figure 15.
Wave effect on surge/pitch motions and turbine performance: (a) Surge motion. (b) Pitch motion. (c) Nacelle Velocity. (d) Nacelle Acceleration. SD: standard deviation.
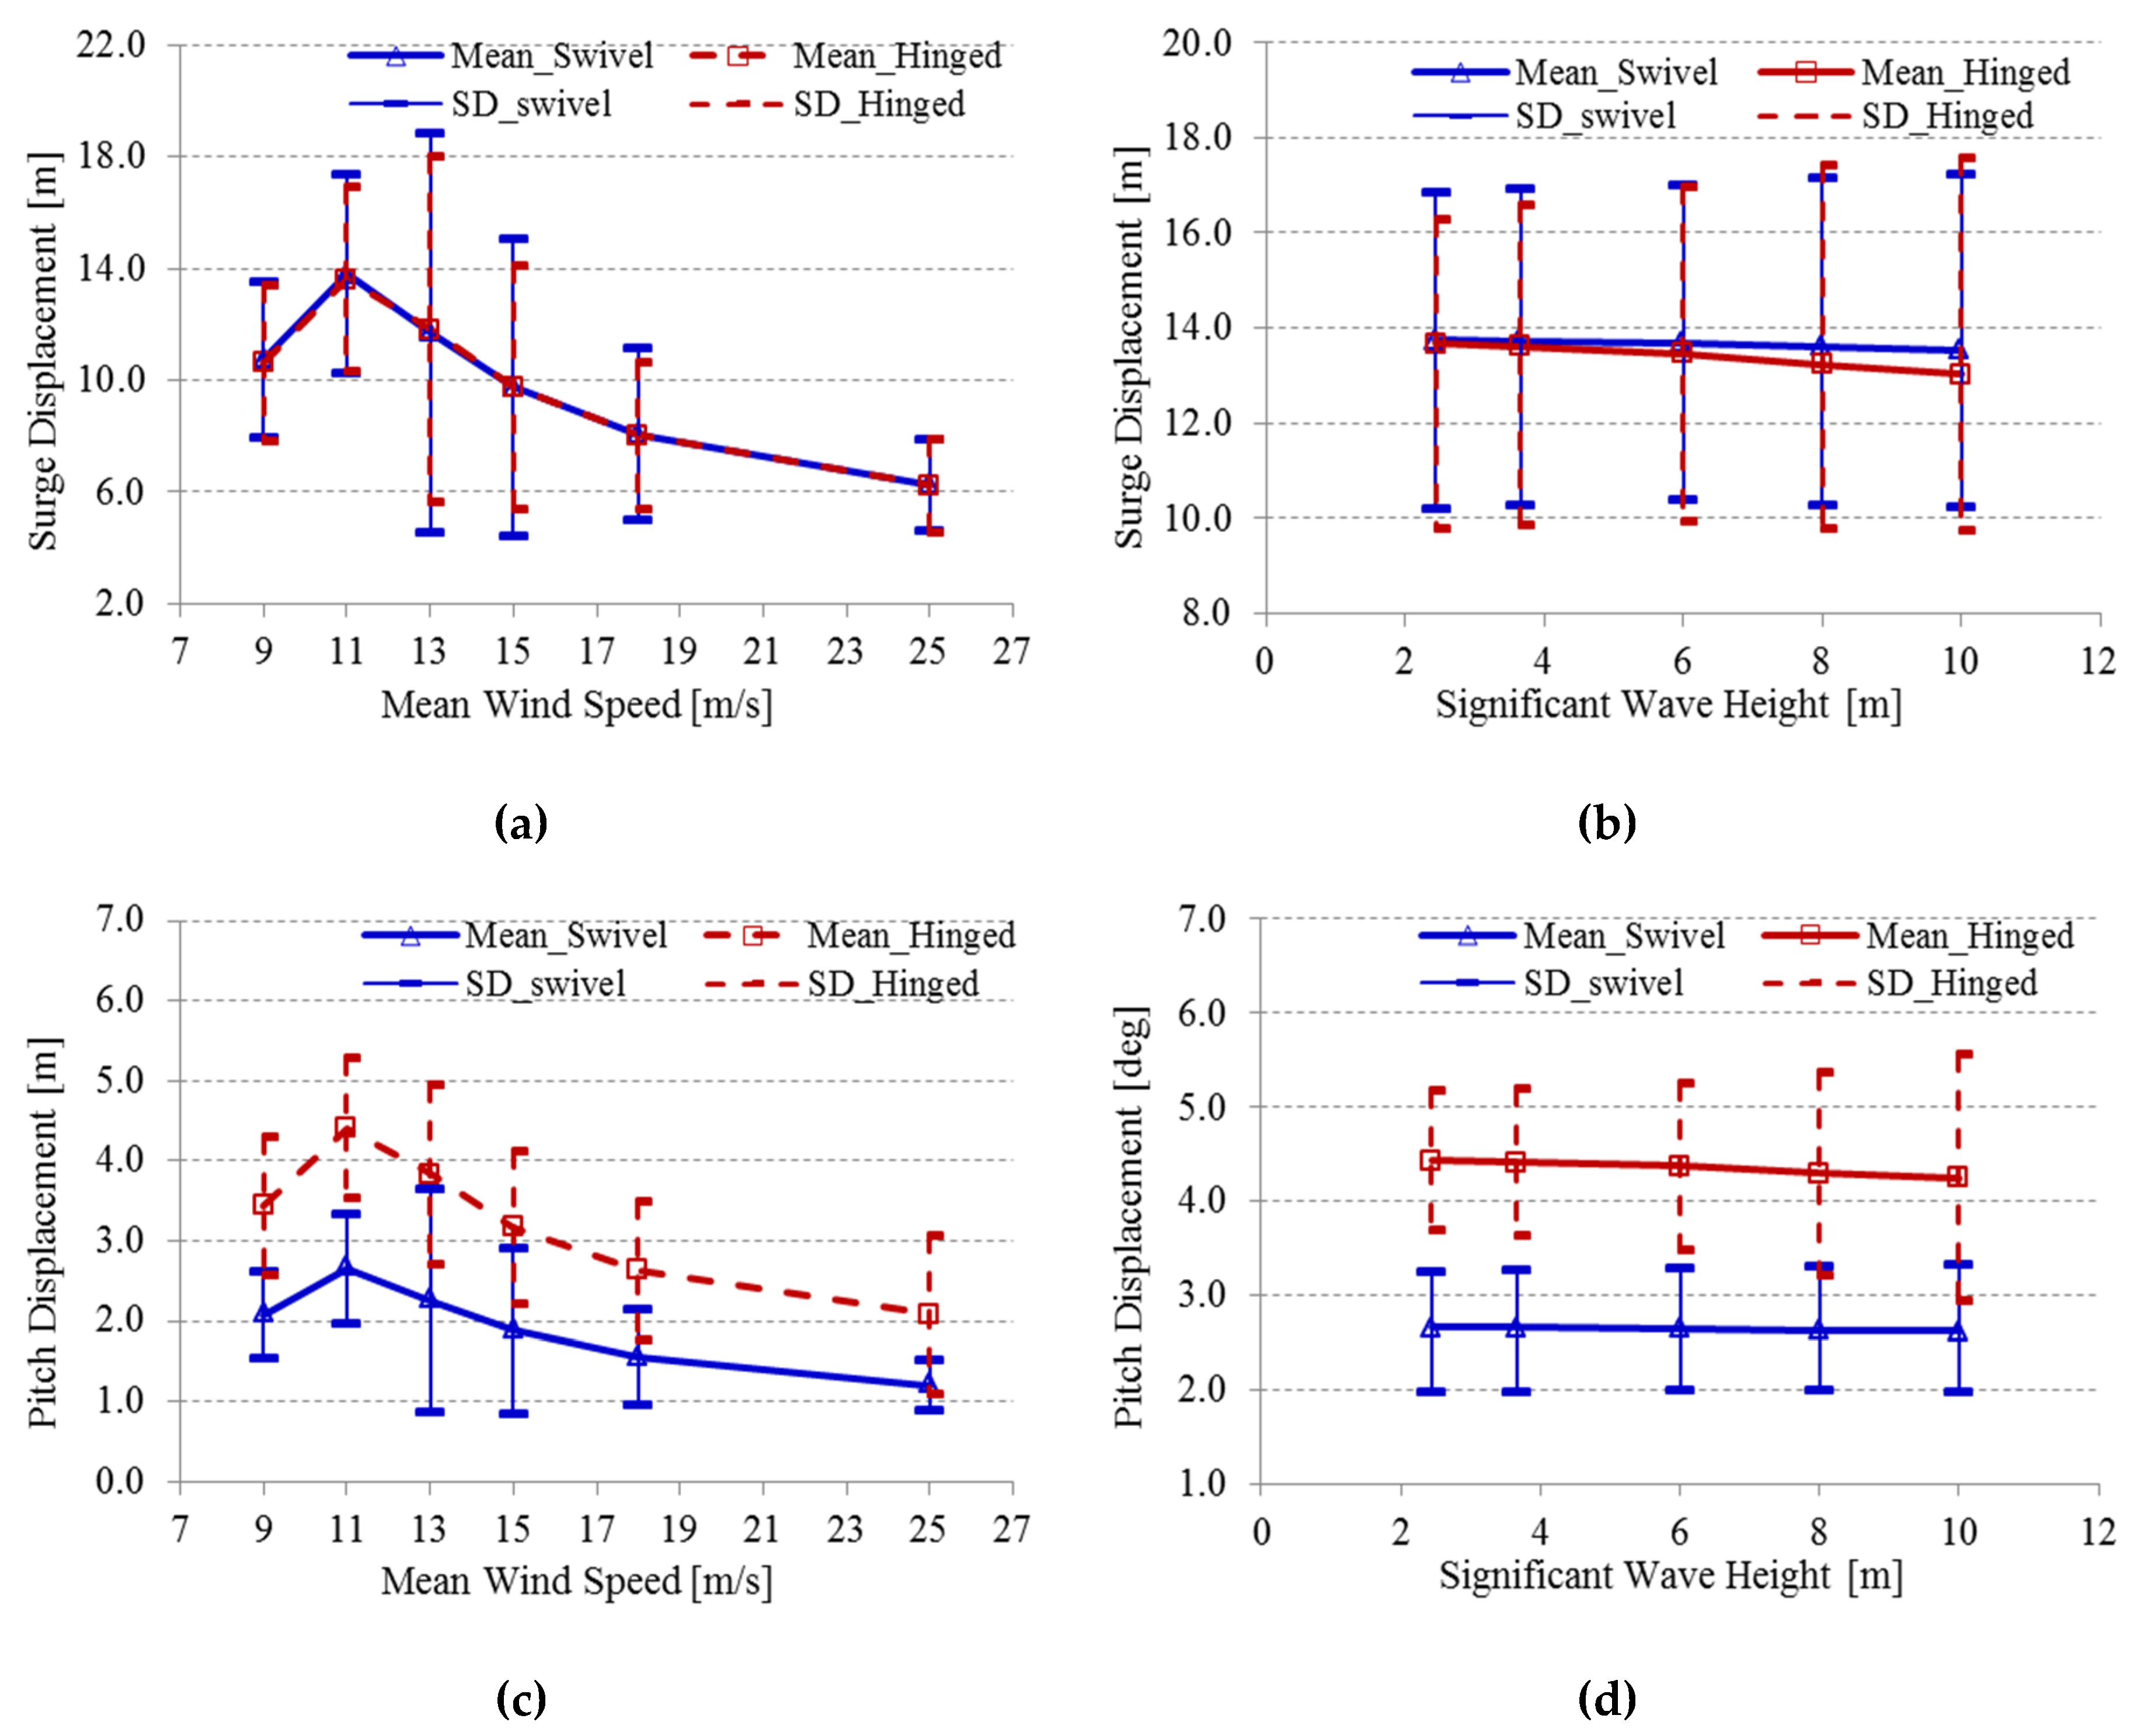
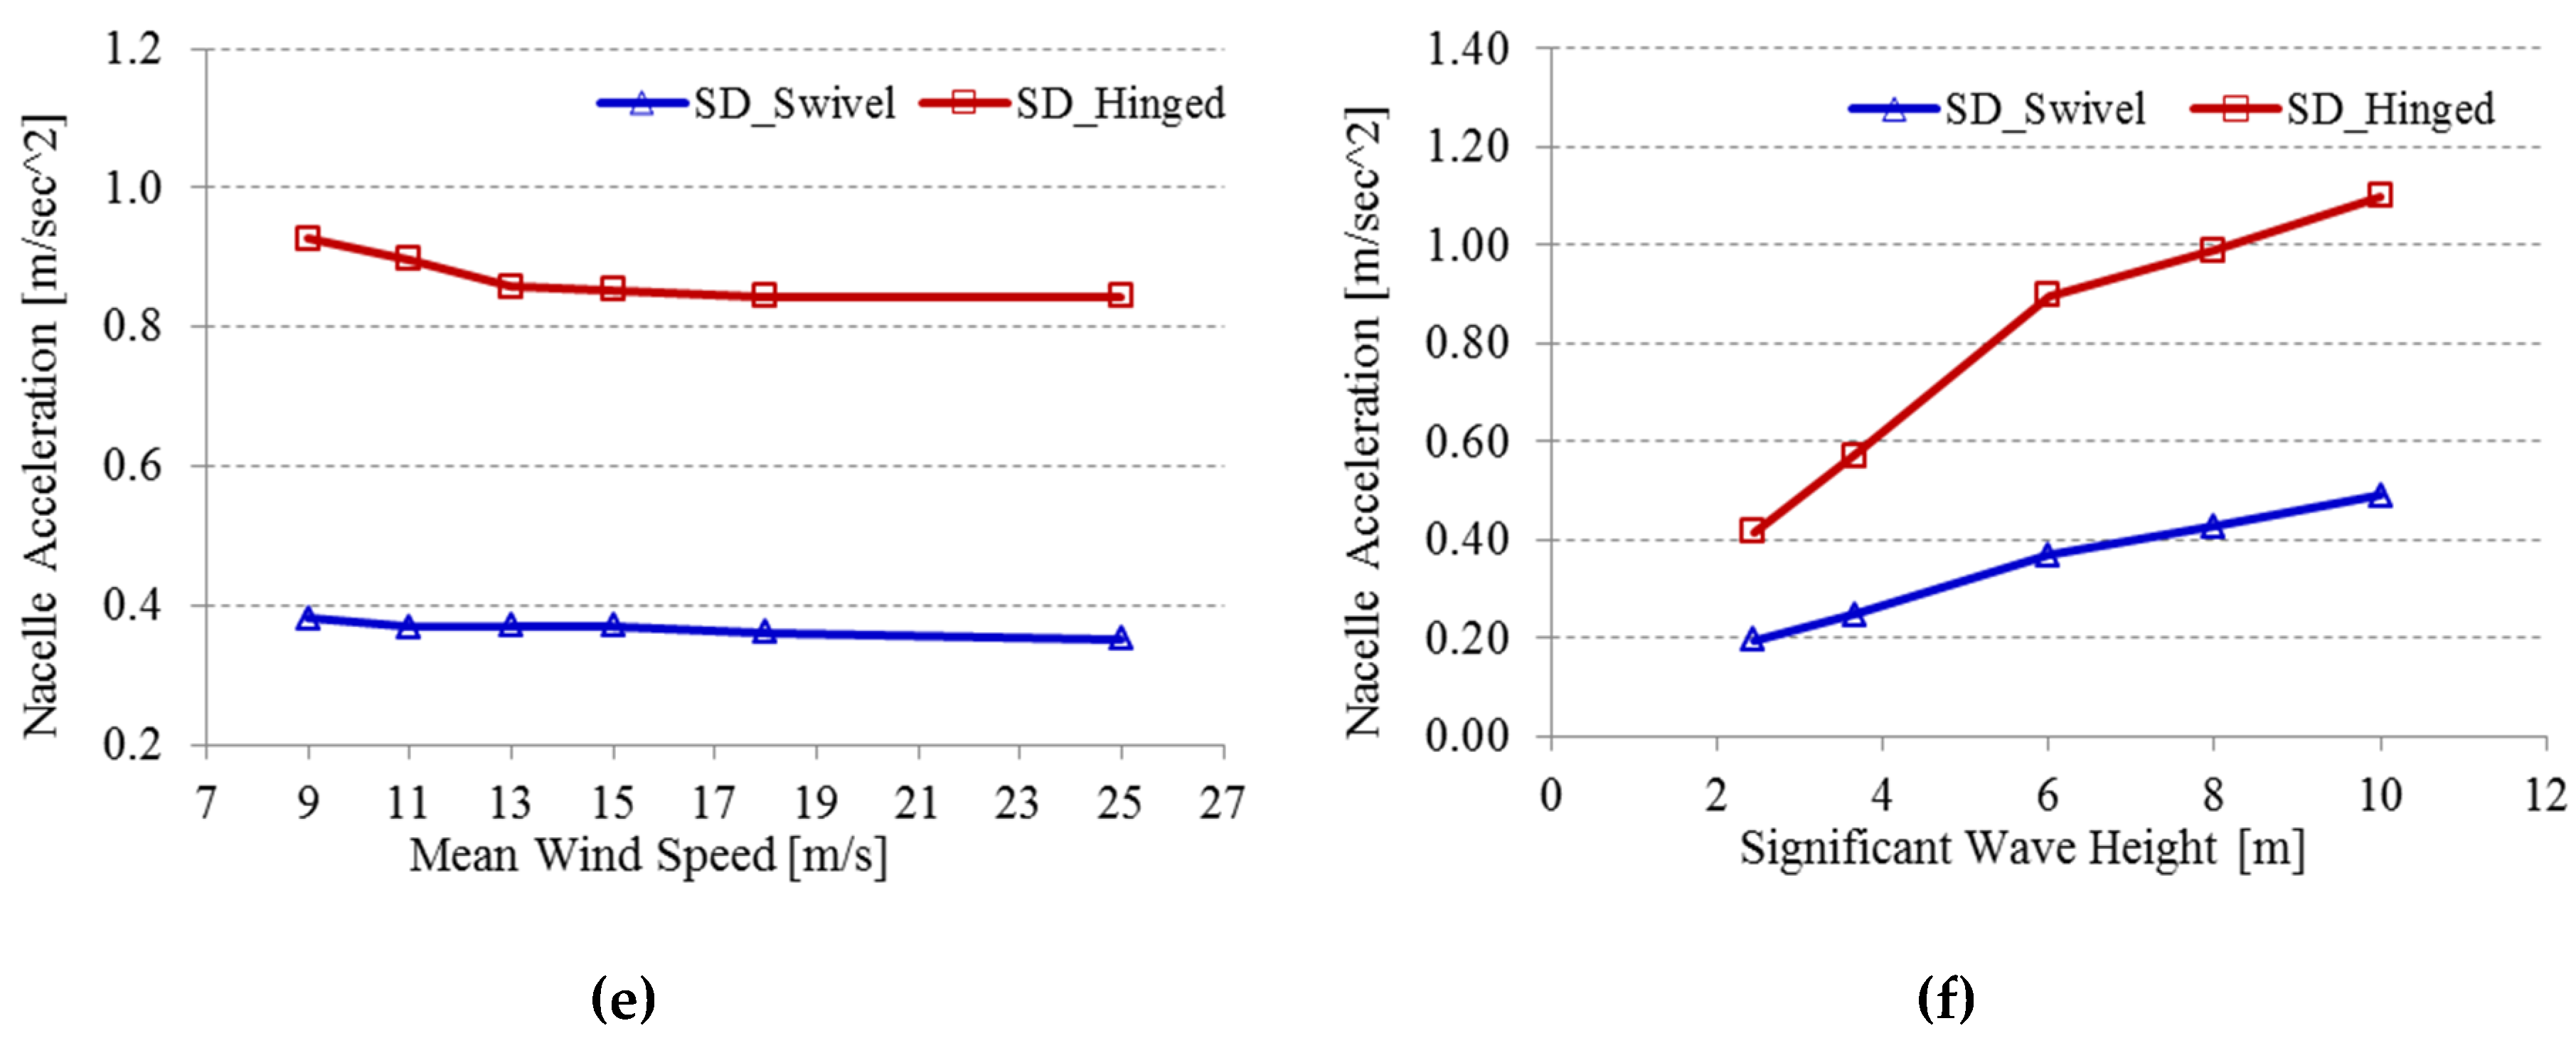
Figure 16.
Surge/pitch motions and turbine performance with 100m water depth: (a) Surge motion V.S. Wind speed. (b) Surge motion V.S. Significant wave height. (c) Pitch motion V.S. Wind speed. (d) Pitch motion V.S. Significant wave height. (e) Nacelle acceleration V.S. Wind speed. (f) Nacelle acceleration V.S. Significant wave height. SD: standard deviation.
Figure 17.
Surge/pitch motions and turbine performance with 300m water depth: (a) Surge motion V.S. Wind speed. (b) Surge motion V.S. Significant wave height. (c) Pitch motion V.S. Wind speed. (d) Pitch motion V.S. Significant wave height. (e) Nacelle acceleration V.S. Wind speed. (f) Nacelle acceleration V.S. Significant wave height. SD: standard deviation.
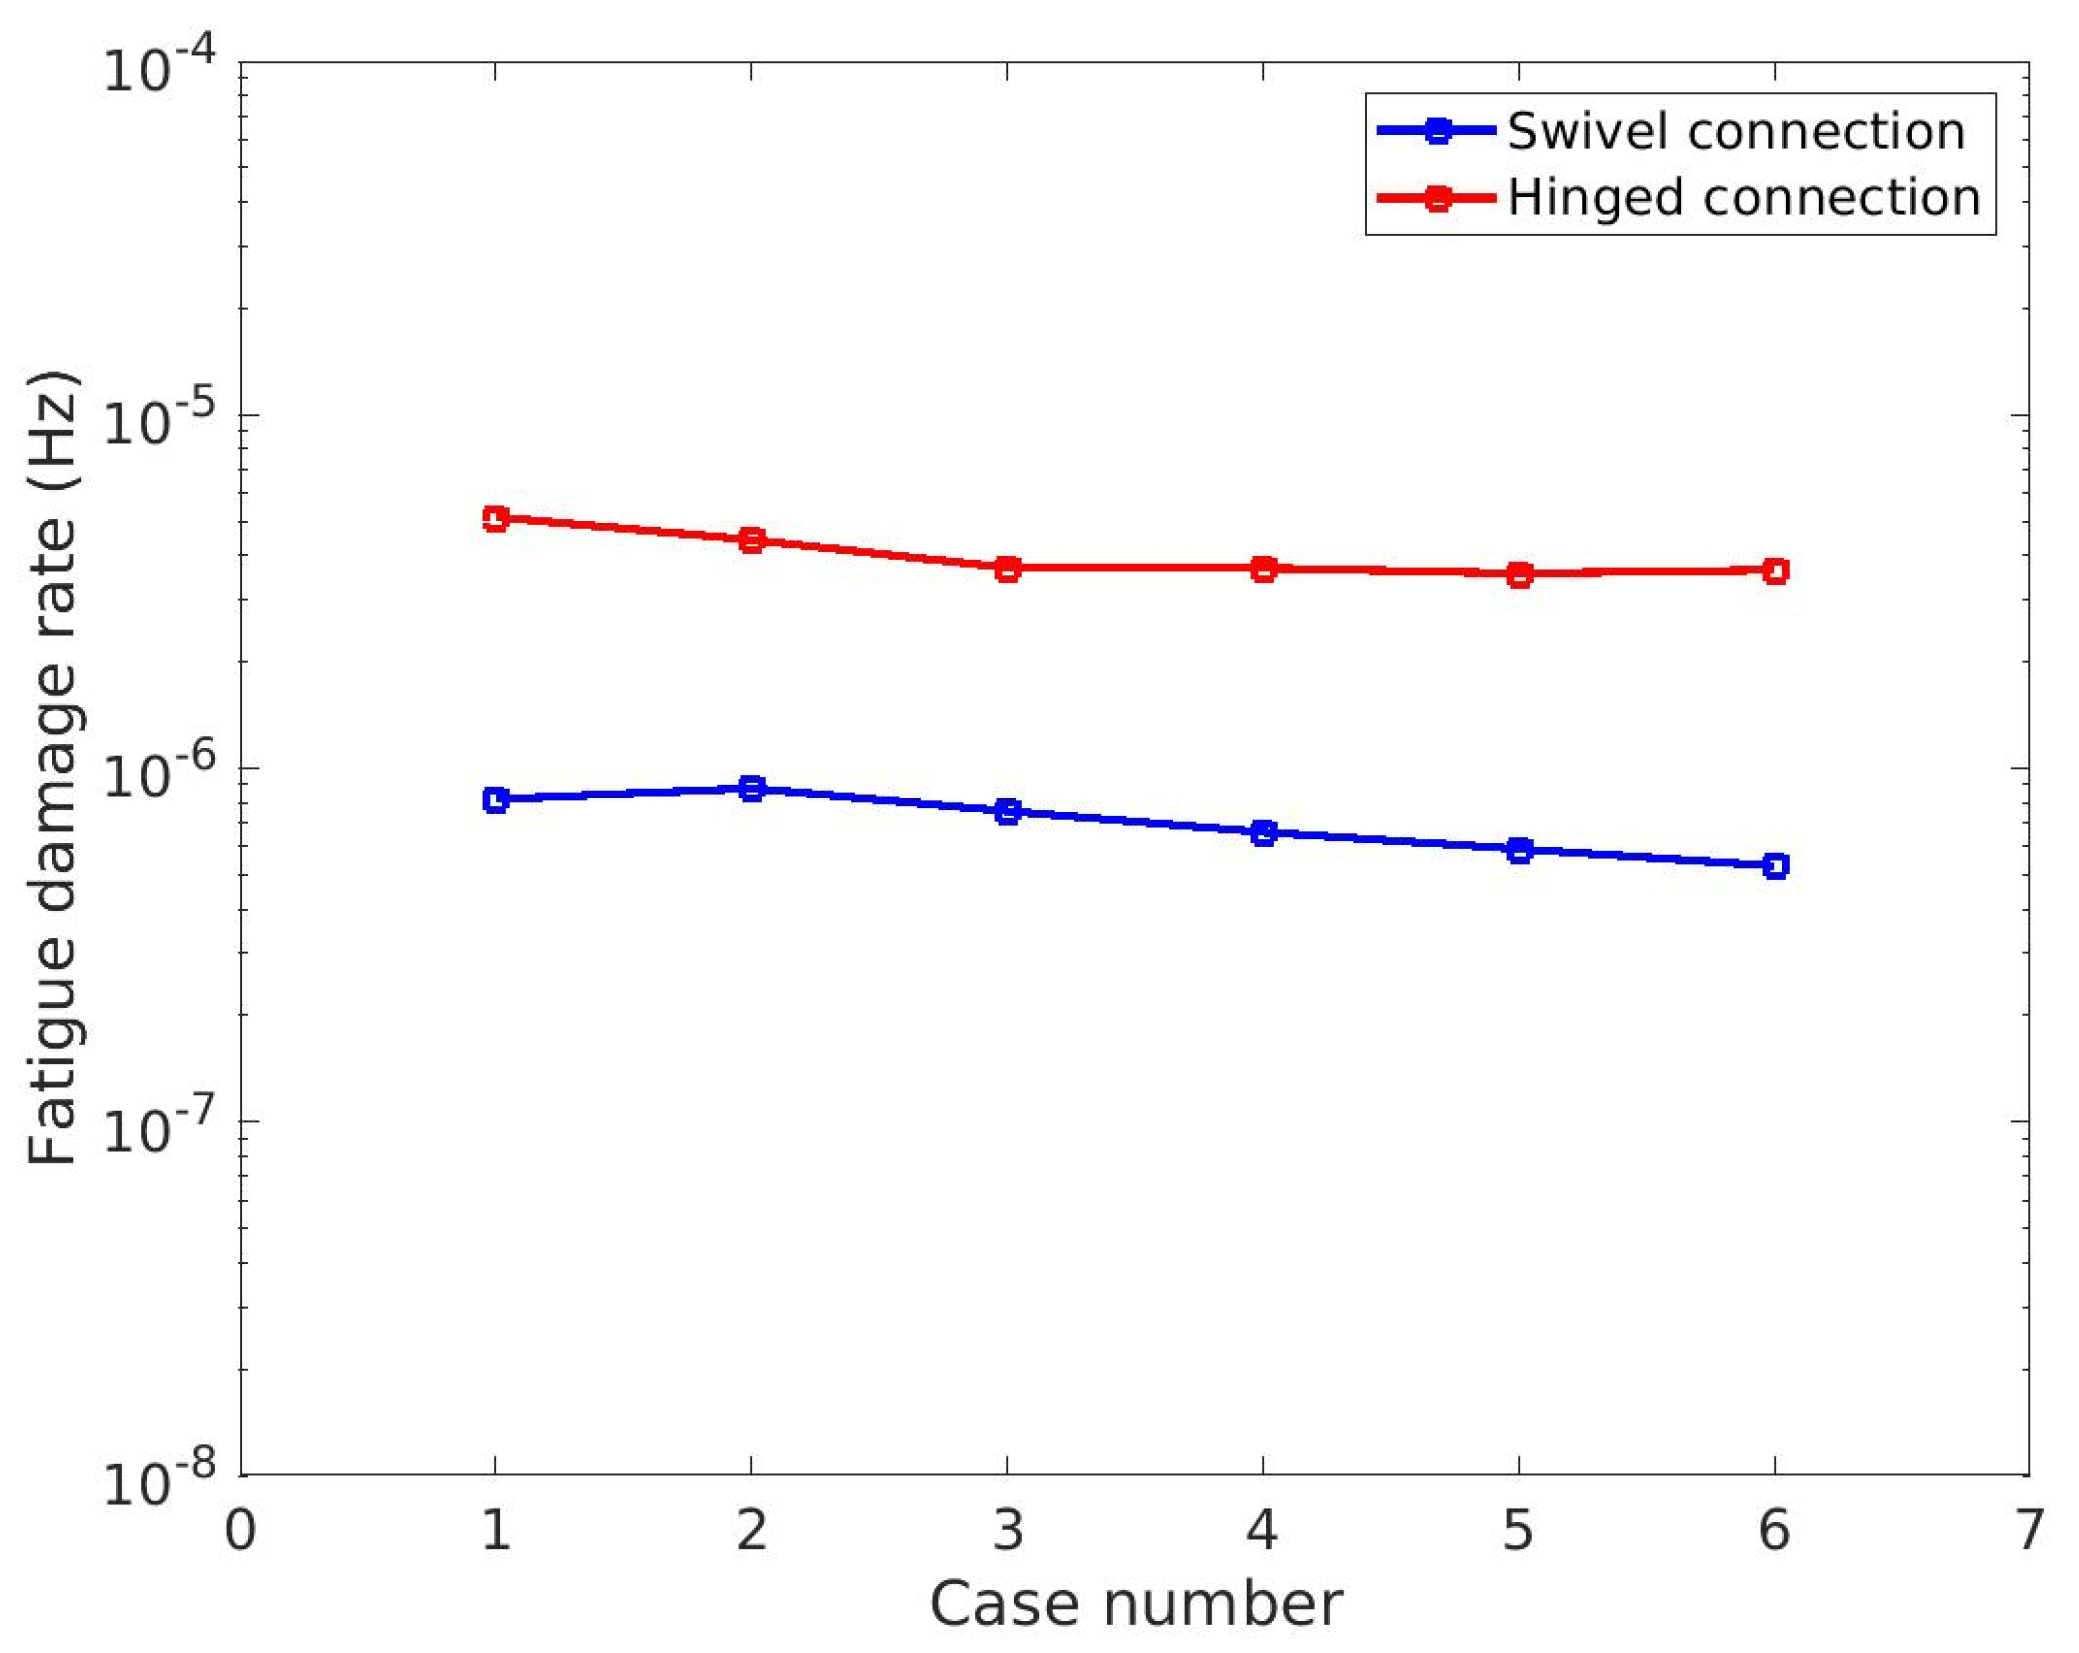
Figure 18.
Fatigue damage rate (Hz) for different cases.
Figure 18.
Fatigue damage rate (Hz) for different cases.
Table 1.
General properties of the National Renewable Energy Laboratory (NREL) 5 MW baseline wind turbine.
Table 1.
General properties of the National Renewable Energy Laboratory (NREL) 5 MW baseline wind turbine.
| Parameters | Value |
|---|
| Rating | 5 MW |
| Rotor orientation, configuration | Upwind, three blades |
| Control | Variable speed, collective pitch |
| Drivetrain | High speed, multiple-stage gearbox |
| Rotor, hub diameter | 126 m, 3 m |
| Hub height | 90 m |
| Cut-in, rated, cut-out wind speed | 3 m/s, 11.4 m/s, 25 m/s |
| Cut-in, rated rotor speed | 6.9 m/s, 12.1 rpm |
| Rated tip speed | 80 m/s |
| Overhang, shaft tilt, precone | 5 m, 5°, 2.5° |
| Rotor mass | 110,000 kg |
| Nacelle mass | 240,000 kg |
| Tower mass | 249,718 kg |
| Center of moment | (−0.2 m, 0.0 m, 70.4 m) |
| Rating | 5 MW |
Table 2.
Hydrostatic and gravitational restoring coefficients.
Table 2.
Hydrostatic and gravitational restoring coefficients.
| Hydrostatic Restoring Coefficients | Unit | Expression |
|---|
| N/m | |
| N | |
| Nm | |
| Nm | |
Table 3.
Restoring coefficient of the single tether.
Table 3.
Restoring coefficient of the single tether.
| Tether Restoring Coefficients | Unit | Expression |
|---|
| = | N/m | |
| N/m | |
| = | Nm | |
| = | N | |
| = | N | |
Table 4.
Design constants for the optimization process.
Table 4.
Design constants for the optimization process.
| Inputs | |
|---|
| Wind turbine | NREL 5 MW |
| Rated wind speed | 11.4 m/s |
| Maximum thrust | 800 kN |
| Turbine moment | 72,000 kN·m |
| Freeboard | 10 m |
Table 5.
Parameters’ influences on the natural frequencies of SWAY model (↑: increase; ↓: decrease; -: negligible effect).
Table 5.
Parameters’ influences on the natural frequencies of SWAY model (↑: increase; ↓: decrease; -: negligible effect).
| Parameters | | | | |
|---|
| i | 1 | 3 | 5 | 6 | 1 | 3 | 5 | 6 | 1 | 3 | 5 | 6 | 1 | 3 | 5 | 6 |
| ↑R | ↑ | - | - | - | ↑ | ↑ | ↑ | ↑ | ↑ | ↑ | ↑ | - | ↑ | ↓ | ↓ | ↑ |
| ↑D | ↑ | ↑ | ↑ | - | ↑ | ↑ | ↑ | ↑ | ↑ | ↑ | ↑ | - | ↑ | ↓ | ↓ | ↑ |
| ↑Tether extensional stiffness | - | ↑ | - | - | - | - | - | - | - | - | - | - | - | ↑ | - | - |
Table 6.
Design result for concrete ballast height from step 1.
Table 6.
Design result for concrete ballast height from step 1.
| Diameter (m) | Case 1: SWT = 0.015 m | Case 2: SWT = 0.0253 m |
|---|
| 13 | 17.7–19.4 | 17.2–17.4 |
| 12 | 18.0–19.2 | -- |
| 11 | 18.5–19.0 | -- |
Table 7.
Properties of the optimized design after Step 2.
Table 7.
Properties of the optimized design after Step 2.
| Properties | Case1 | Case 2 |
|---|
| | SWT = 0.015 m | SWT = 0.0253 m |
| Diameter (m) | 13 | 12 | 11 | 13 |
| Hconcrete (m) | 17.9 | 18.2 | 18.7 | 17.4 |
| Hydrostatic coefficient | 5321.1 | 3572.8 | 3312.4 | 4944.5 |
| Total cost_lower (million) | 0.82441 | 0.70121 | 0.5841 | 0.97024 |
| Total cost_upper (million) | 1.69536 | 1.4423 | 1.20546 | 1.86954 |
| Pretension (kN) | 18,324.5 | 14,085.7 | 9922.1 | 17,403.3 |
| Surge restoring coefficient (kN/m) | 143.16 | 110.04 | 77.52 | 135.96 |
| Pitch restoring coefficient (kNm) | 795,629.3 | 606,385.2 | 435,140.4 | 754,534.1 |
| Surge natural frequency (rad/s) | 0.09459 | 0.08904 | 0.08052 | 0.09192 |
| Pitch natural frequency (rad/s) | 0.13242 | 0.12397 | 0.11299 | 0.12908 |
| Total mass (metric tons) | 7065.38 | 6222.45 | 5472.75 | 7159.32 |
| Total displacement (metric tons) | 8933.99 | 7658.82 | 6484.54 | 8933.99 |
Table 8.
Heave natural frequencies of optimized designs.
Table 8.
Heave natural frequencies of optimized designs.
| Steel Wall Thickness (m) | Diameter (m) | Hconcrete (m) | ωn33 (rad/sec) |
|---|
| Case 1 = 0.015 m | 13 | 17.7 | 4.19561 |
| 19.4 | 4.03792 |
| 12 | 18.0 | 4.46077 |
| 19.2 | 4.34475 |
| 11 | 18.5 | 4.74421 |
| 19.0 | 4.69420 |
| Case 2 = 0.0253 m | 13 | 17.2 | 4.16852 |
| 17.4 | 4.14944 |
Table 9.
Optimized SWAY model parameters (we define
D, D1, D2 r, R, Hconcrete in
Figure 4).
Table 9.
Optimized SWAY model parameters (we define
D, D1, D2 r, R, Hconcrete in
Figure 4).
| Specifications | Unit | Optimized Model |
|---|
| D | m | 72 |
| D1 | m | 4 |
| D2 | m | 8 |
| r | m | 6.5 |
| R | m | 13 |
| Hconcrete | m | 18 |
| Platform steel wall thickness (SWT) | m | 0.015 |
| Total cost | million dollars | 0.82–1.69 |
| Steel mass | metric tons | 411.376 |
| System mass | metric tons | 7099.20 |
| Center of gravity (System) | m | −50.1373 |
| Total displacement | metric tons | 8934 |
| Center of buoyancy | m | −39.0355 |
| Platform roll/pitch inertia about mean water level | kg∙m2 | 2.5134 × 10¹⁰ |
| Platform yaw inertia about the centerline | kg∙m2 | 1.4306 × 10⁸ |
| Pretension | kN | 17992.8 |
| Surge restoring coefficient | kN/m | 140.57 |
| Pitch restoring coefficient | kN∙m | 800,118.7 |
| Max. allowable tether tension | kN | 3.48 × 10⁴ |
| Line cross-area | m2 | 0.0773 |
| EA stiffness unit length | Nm | 1.62 × 10¹⁰ |
| Line mass density | kg/m | 606.57 |
| Surge/sway natural frequency | rad/s | 0.098 |
| Heave natural frequency | rad/s | 4.166 |
| Pitch/roll natural frequency | rad/s | 0.112 |
| Yaw natural frequency | rad/s | 0.713 |
Table 10.
Environmental conditions for coupled dynamics analysis.
Table 10.
Environmental conditions for coupled dynamics analysis.
| Case Number | Wind Speed (m/s) | Hs (m) | Tp (s) |
|---|
| 1 | 9 | 6 | 10 |
| 2 | 11.4 | 6 | 10 |
| 3 | 13 | 6 | 10 |
| 4 | 15 | 6 | 10 |
| 5 | 18 | 6 | 10 |
| 6 | 25 | 6 | 10 |
| 7 | 11.4 | 2.44 | 8.1 |
| 8 | 11.4 | 3.66 | 9.7 |
| 9 | 11.4 | 8 | 12.5 |
| 10 | 11.4 | 10 | 14 |
Table 11.
Peak values of swivel and reference model.
Table 11.
Peak values of swivel and reference model.
| Parameters | Swivel Model | Hinged Model |
|---|
| Operational Load Cases | Case 3 | Case 10 | Case 3 | Case 10 |
| Max. Surge Displacement (m) | 21.36 | 17.58 | 20.62 | 17.33 |
| Max. Pitch Displacement (deg) | 6.22 | 5.10 | 7.71 | 8.73 |
| Max. Tower fore-aft Motion (m) | 0.75 | 0.88 | 1.09 | 1.27 |
| Max. Tower side-to-side Motion (m) | −0.014 | 0.012 | −0.009 | 0.036 |
| Max. Nacelle Velocity (m/sec) | 3.19 | 4.16 | 3.97 | 7.09 |
| Max. Nacelle Acceleration (m/sec2) | 1.66 | 2.79 | 2.84 | 4.28 |
| Max. Tether Tension (kN) | 2.19 × 10⁴ | 2.13 × 10⁴ | 2.35 × 10⁴ | 2.37 × 10⁴ |
Table 12.
Standard deviations of the SWAY model for various water depths (Umean = 11.4 m/s).
Table 12.
Standard deviations of the SWAY model for various water depths (Umean = 11.4 m/s).
| Wave Condition | Surge (m) | Pitch (deg) | Nacelle Acceleration (m/sec2) |
|---|
| Hs(m) | Tp(s) | 100m | 200m | 300m | 100m | 200m | 300m | 100m | 200m | 300m |
| 2.4 | 8.1 | 1.1 | 2.4 | 3.3 | 0.7 | 0.7 | 0.6 | 0.3 | 0.3 | 0.2 |
| 3.7 | 9.7 | 1.2 | 2.4 | 3.3 | 0.7 | 0.7 | 0.6 | 0.5 | 0.4 | 0.3 |
| 6 | 10 | 1.3 | 2.2 | 3.3 | 0.8 | 0.7 | 0.6 | 0.8 | 0.5 | 0.4 |
| 8 | 12.5 | 1.9 | 2.3 | 3.4 | 1.1 | 0.7 | 0.7 | 0.9 | 0.6 | 0.4 |
| 10 | 14 | 2.3 | 2.6 | 3.5 | 1.5 | 0.8 | 0.7 | 0.9 | 0.6 | 0.5 |
Table 13.
Sensitivity of tower fatigue damage rater to significant wave height (Hs).
Table 13.
Sensitivity of tower fatigue damage rater to significant wave height (Hs).
| Hs (m) | 3.66 | 8 | 10 |
|---|
| Hinged connection DR (Hz) | 6.6 × 10⁻⁷ | 6.4 × 10⁻⁶ | 9.7 × 10⁻⁷ |
| Swivel connection DR (Hz) | 2.4 × 10⁻⁷ | 1.5 × 10⁻⁶ | 2.4 × 10⁻⁶ |


