Microgrid Fault Detection and Classification: Machine Learning Based Approach, Comparison, and Reviews

 ,
,  ,
,  ,
, 
Abstract
1. Introduction
- We design a novel network for distribution line FDC of MG based on the deep learning network together with the WT that enables the network to take out the relevant short circuit fault attribute from the faulted line signals effectively.
- We develop a hierarchical generative model with multiple layers of RBM that restrains overfitting of the training dataset with a prominent unsupervised pre-trained process.
- Both operating modes namely islanded and grid-connected/tied with two typologies (radial and loop) of MG are studied to measure the effectiveness of the proposed model.
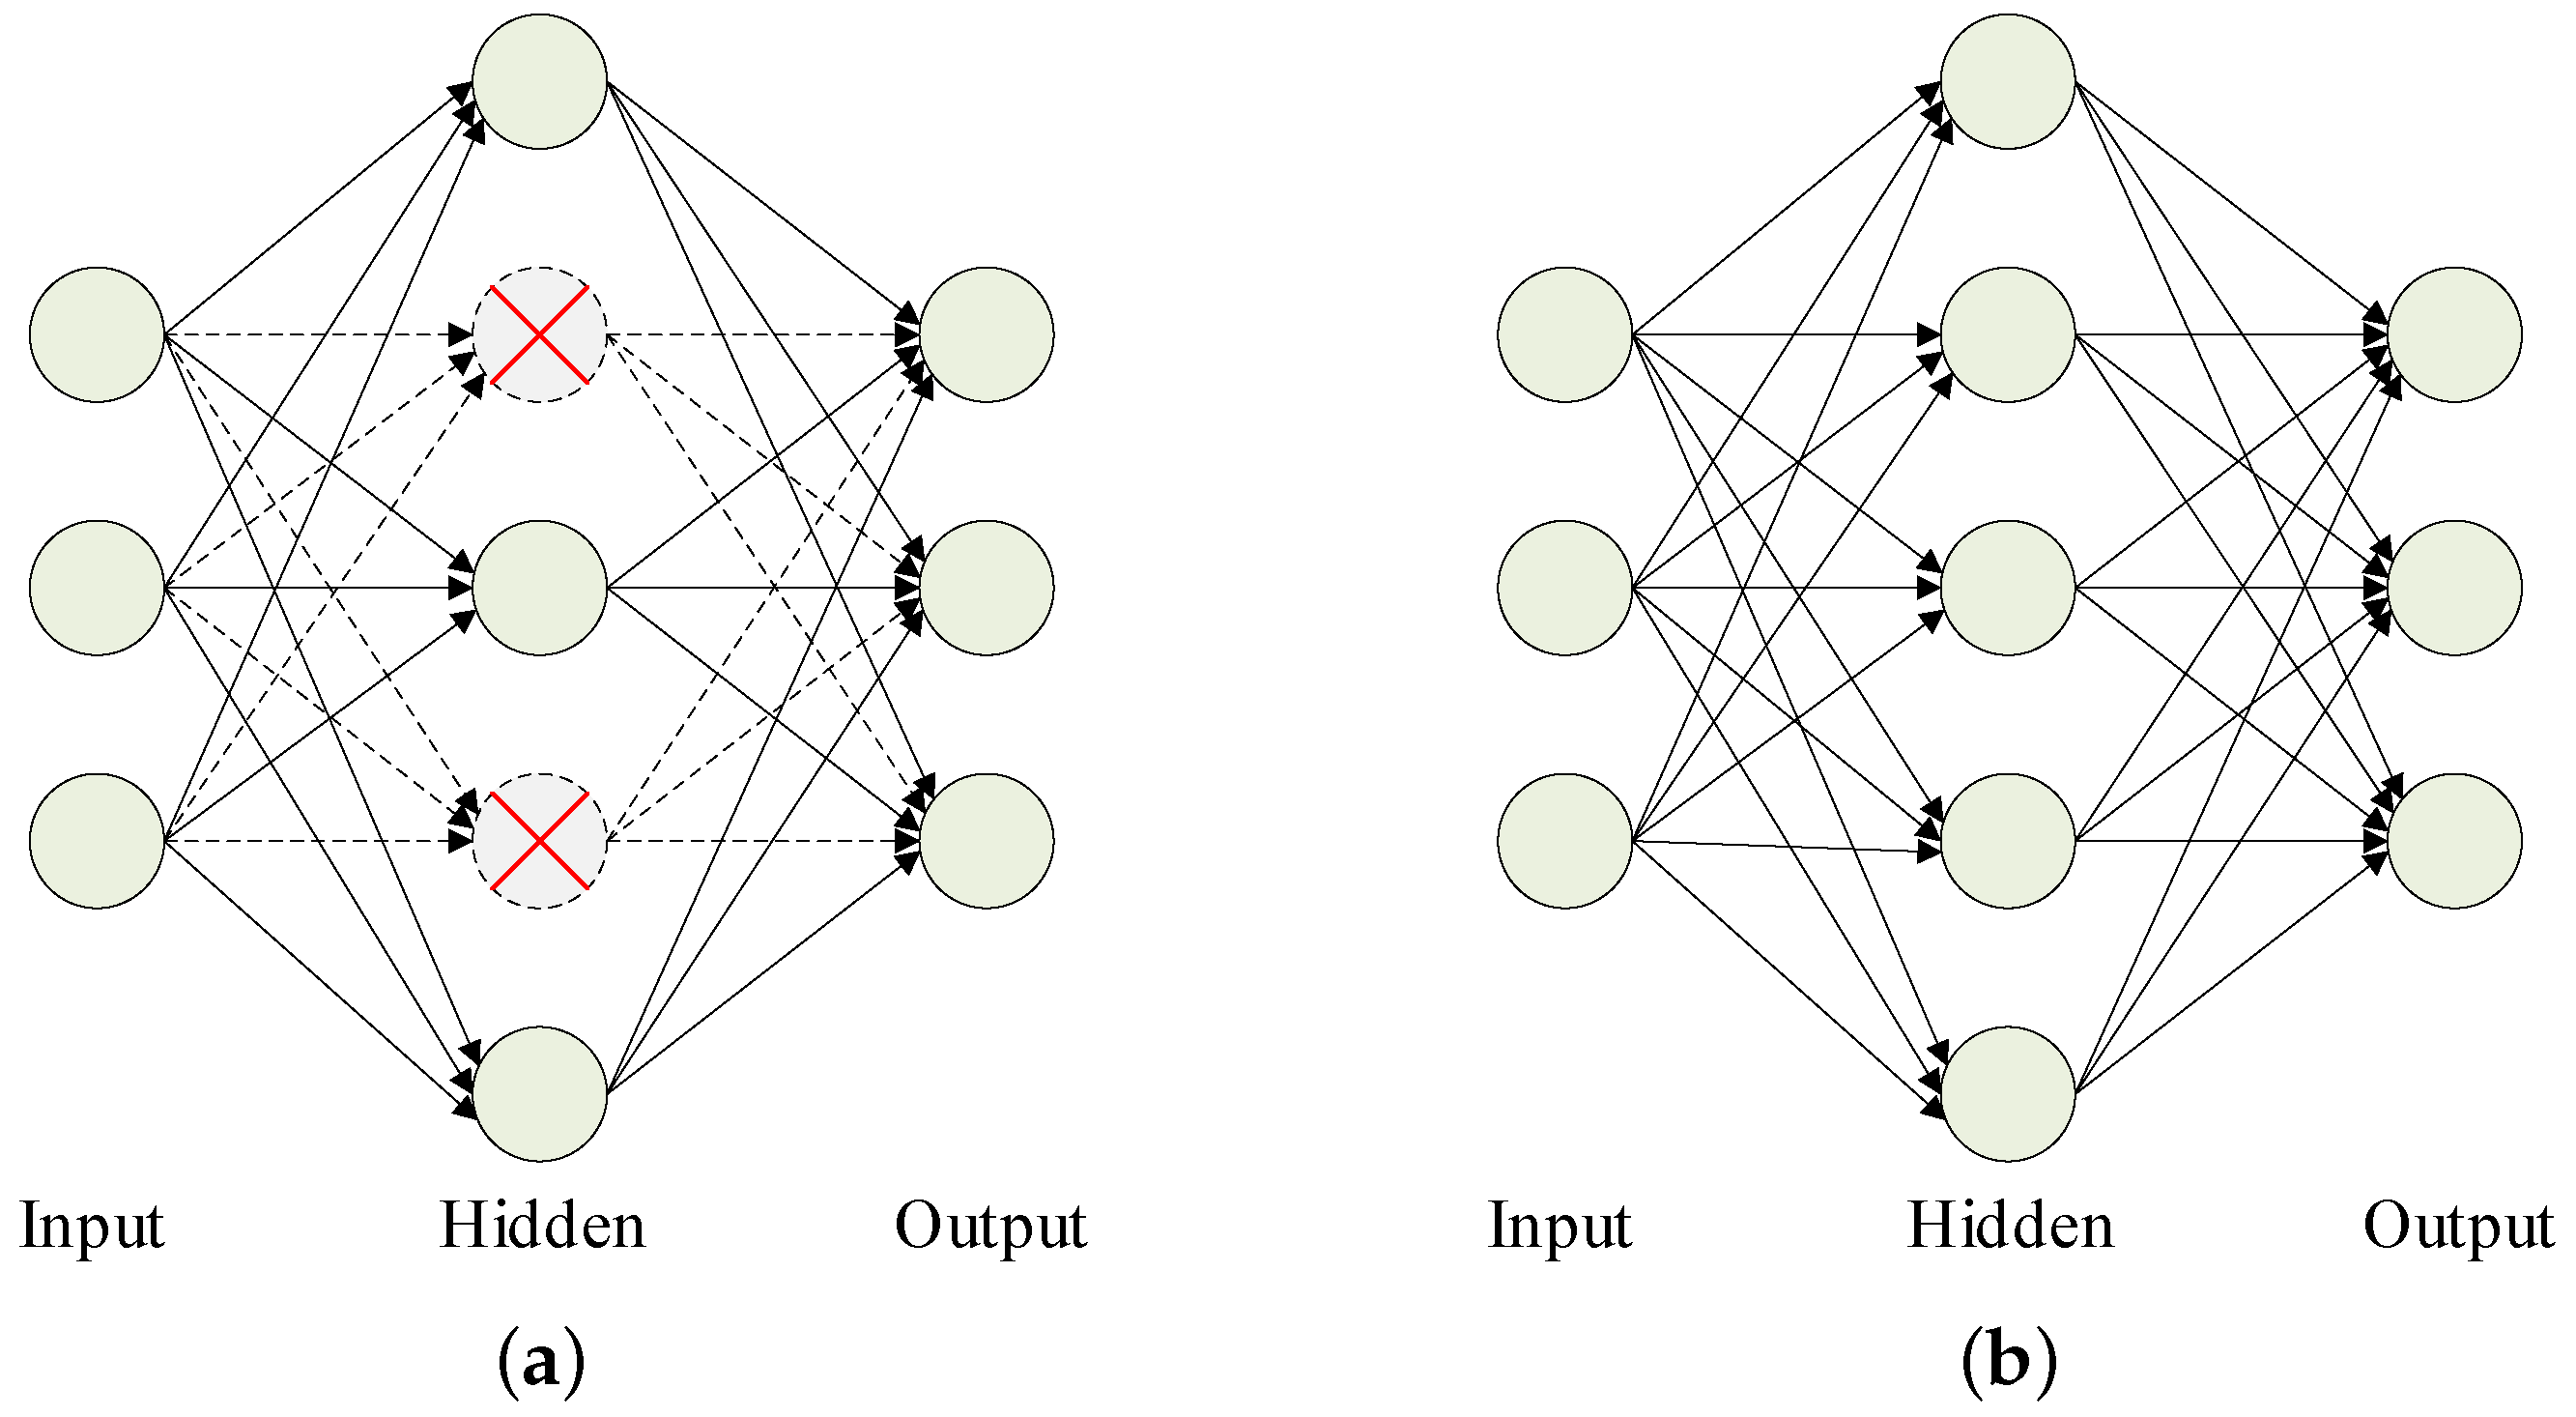
- The dropout strategy is integrated with the proposed network to establish the robust performance of the developed DBN model over the noisy environment.
2. Materials and Methods
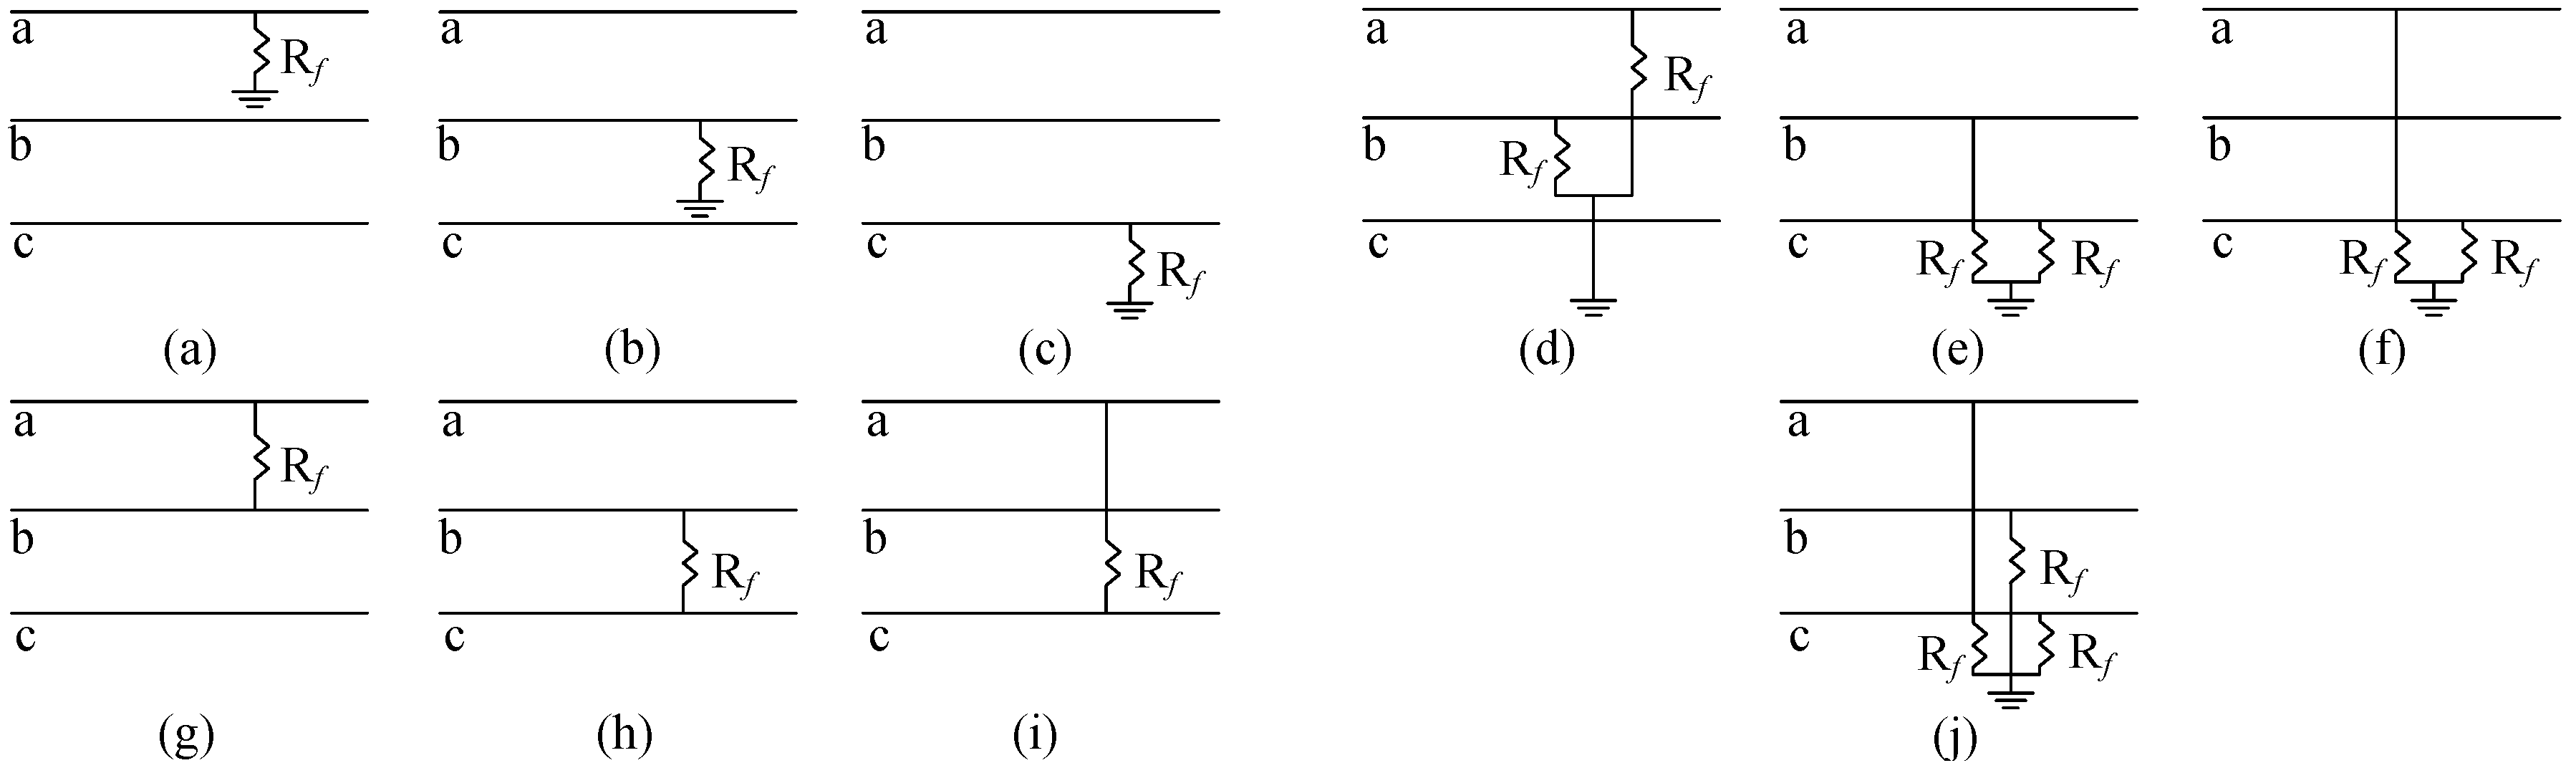
2.1. Types of Network Faults
2.1.1. Single PG Fault
2.1.2. Two PG Fault
2.1.3. PP Fault
2.1.4. Three PG Fault
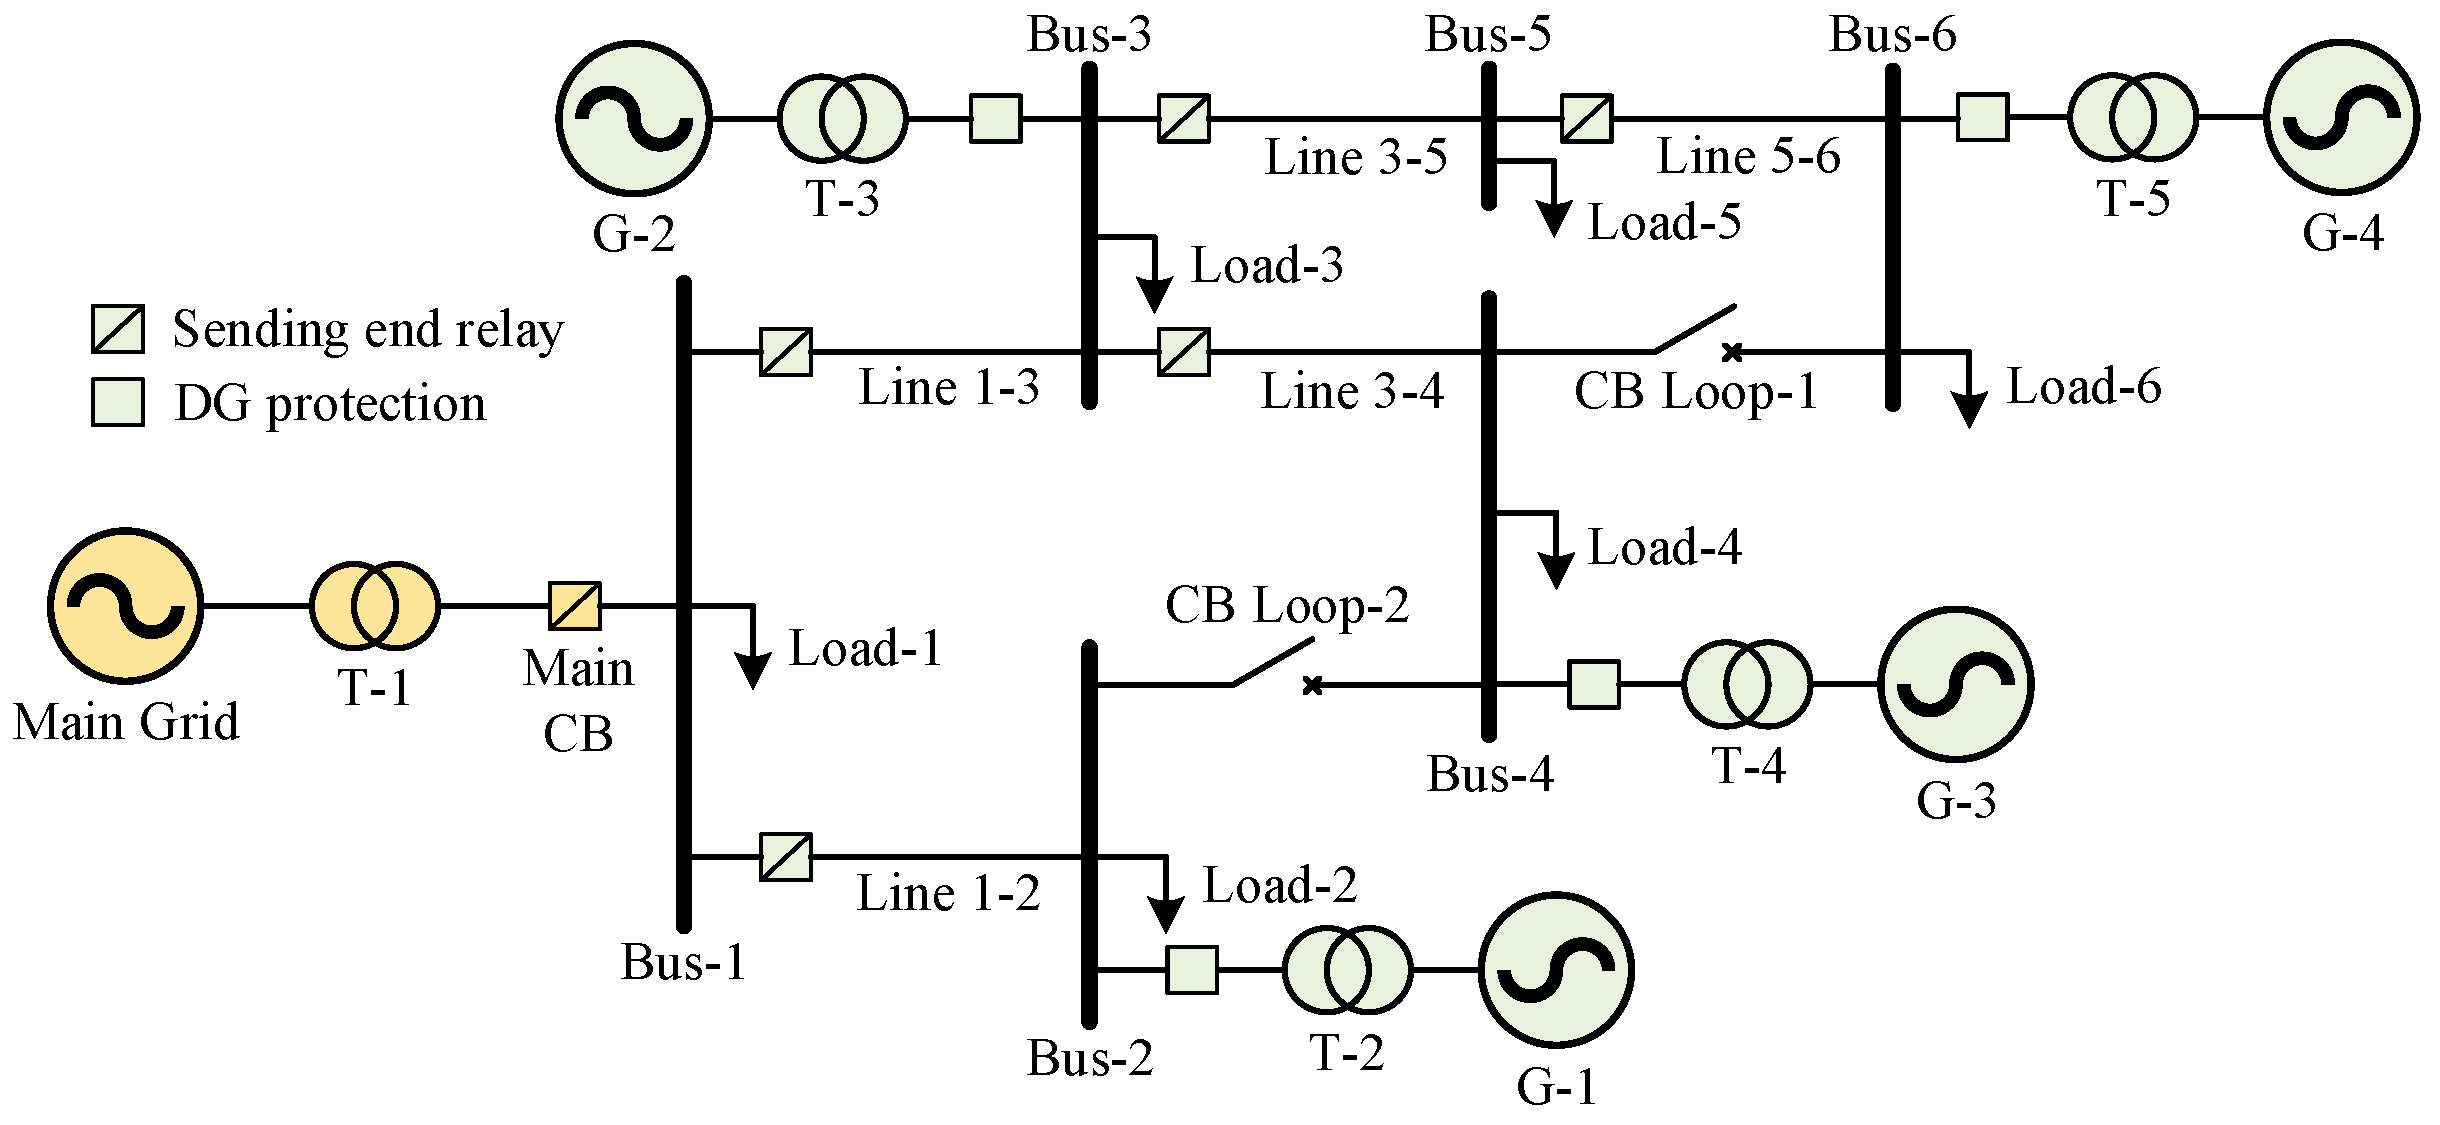
2.2. System Modelling
2.3. Variation of Signal Energy with Feature Generation
2.3.1. Effect of Fault Distance on Signal Energy
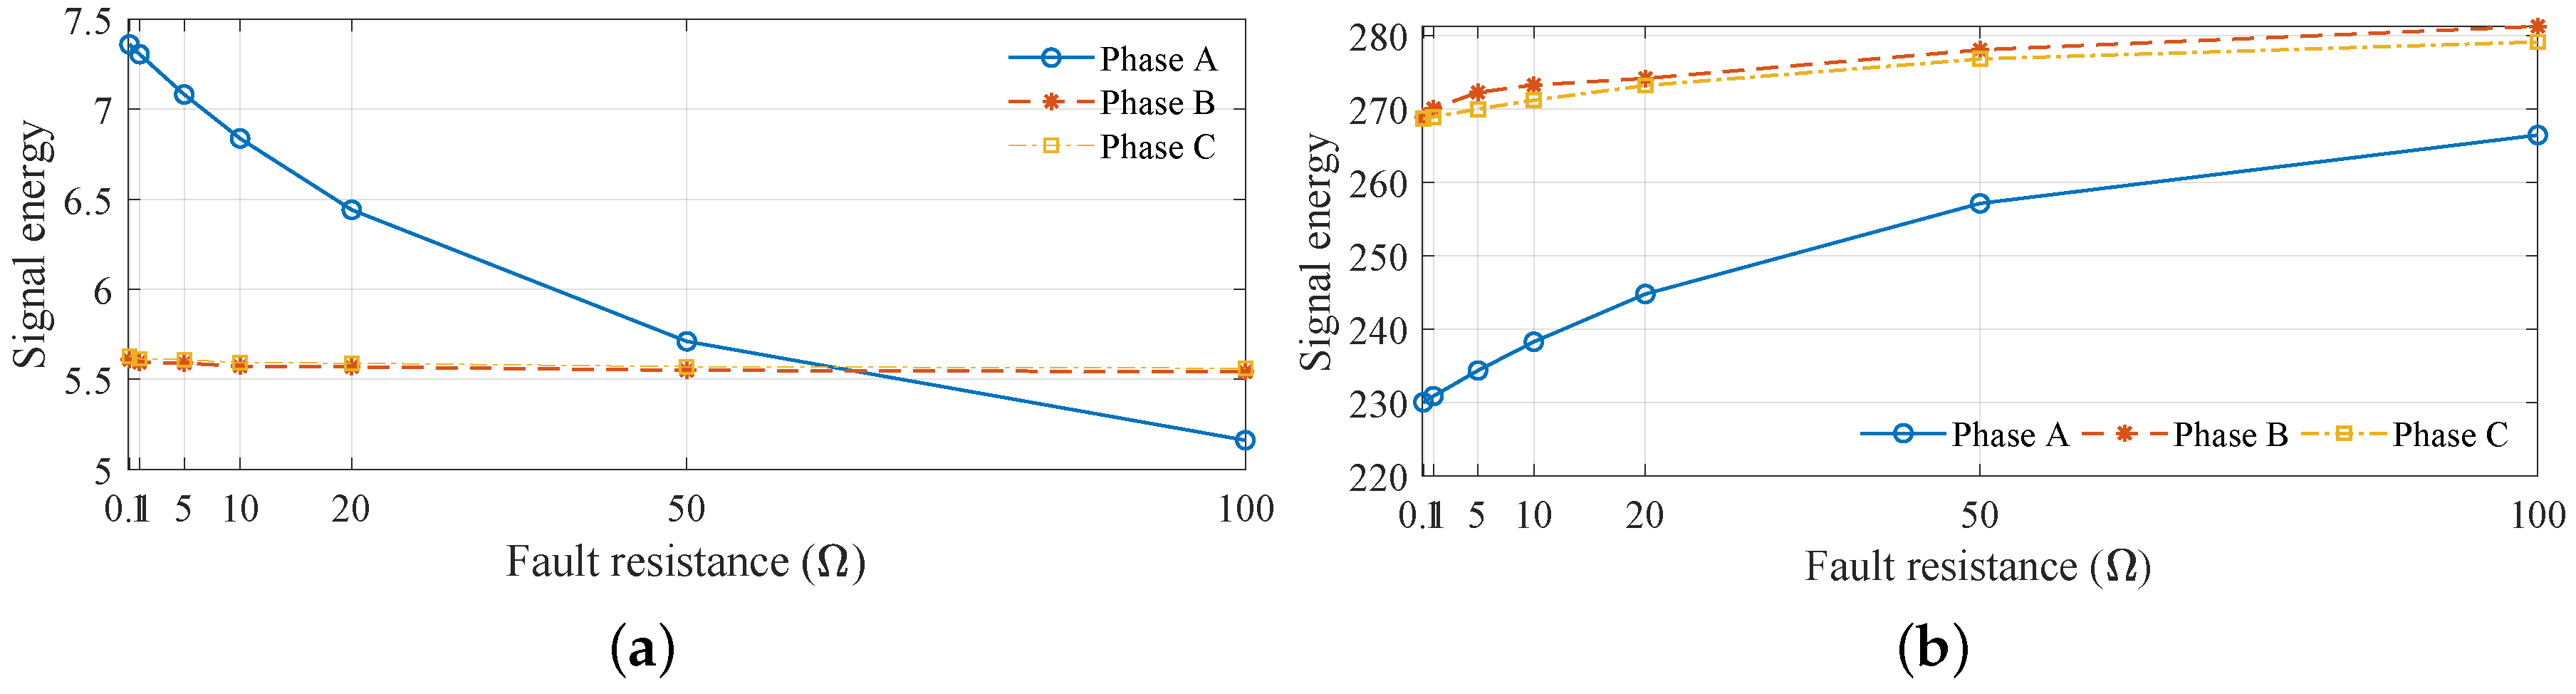
2.3.2. Effect of Fault Resistance on Signal Energy
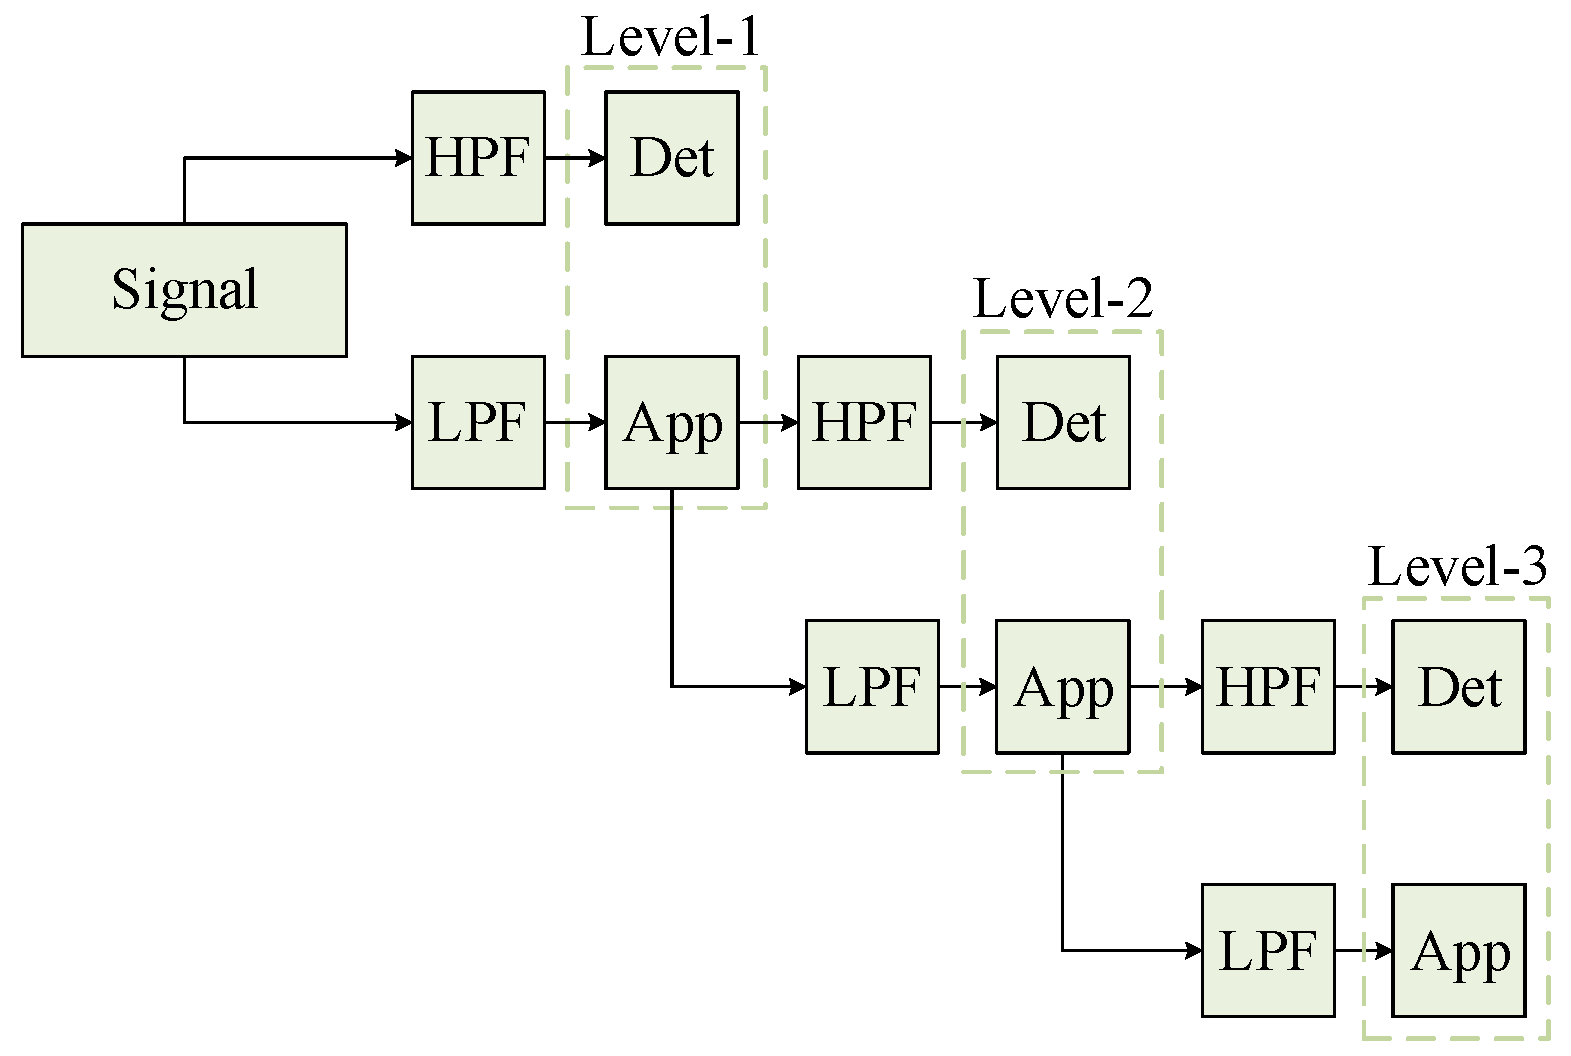
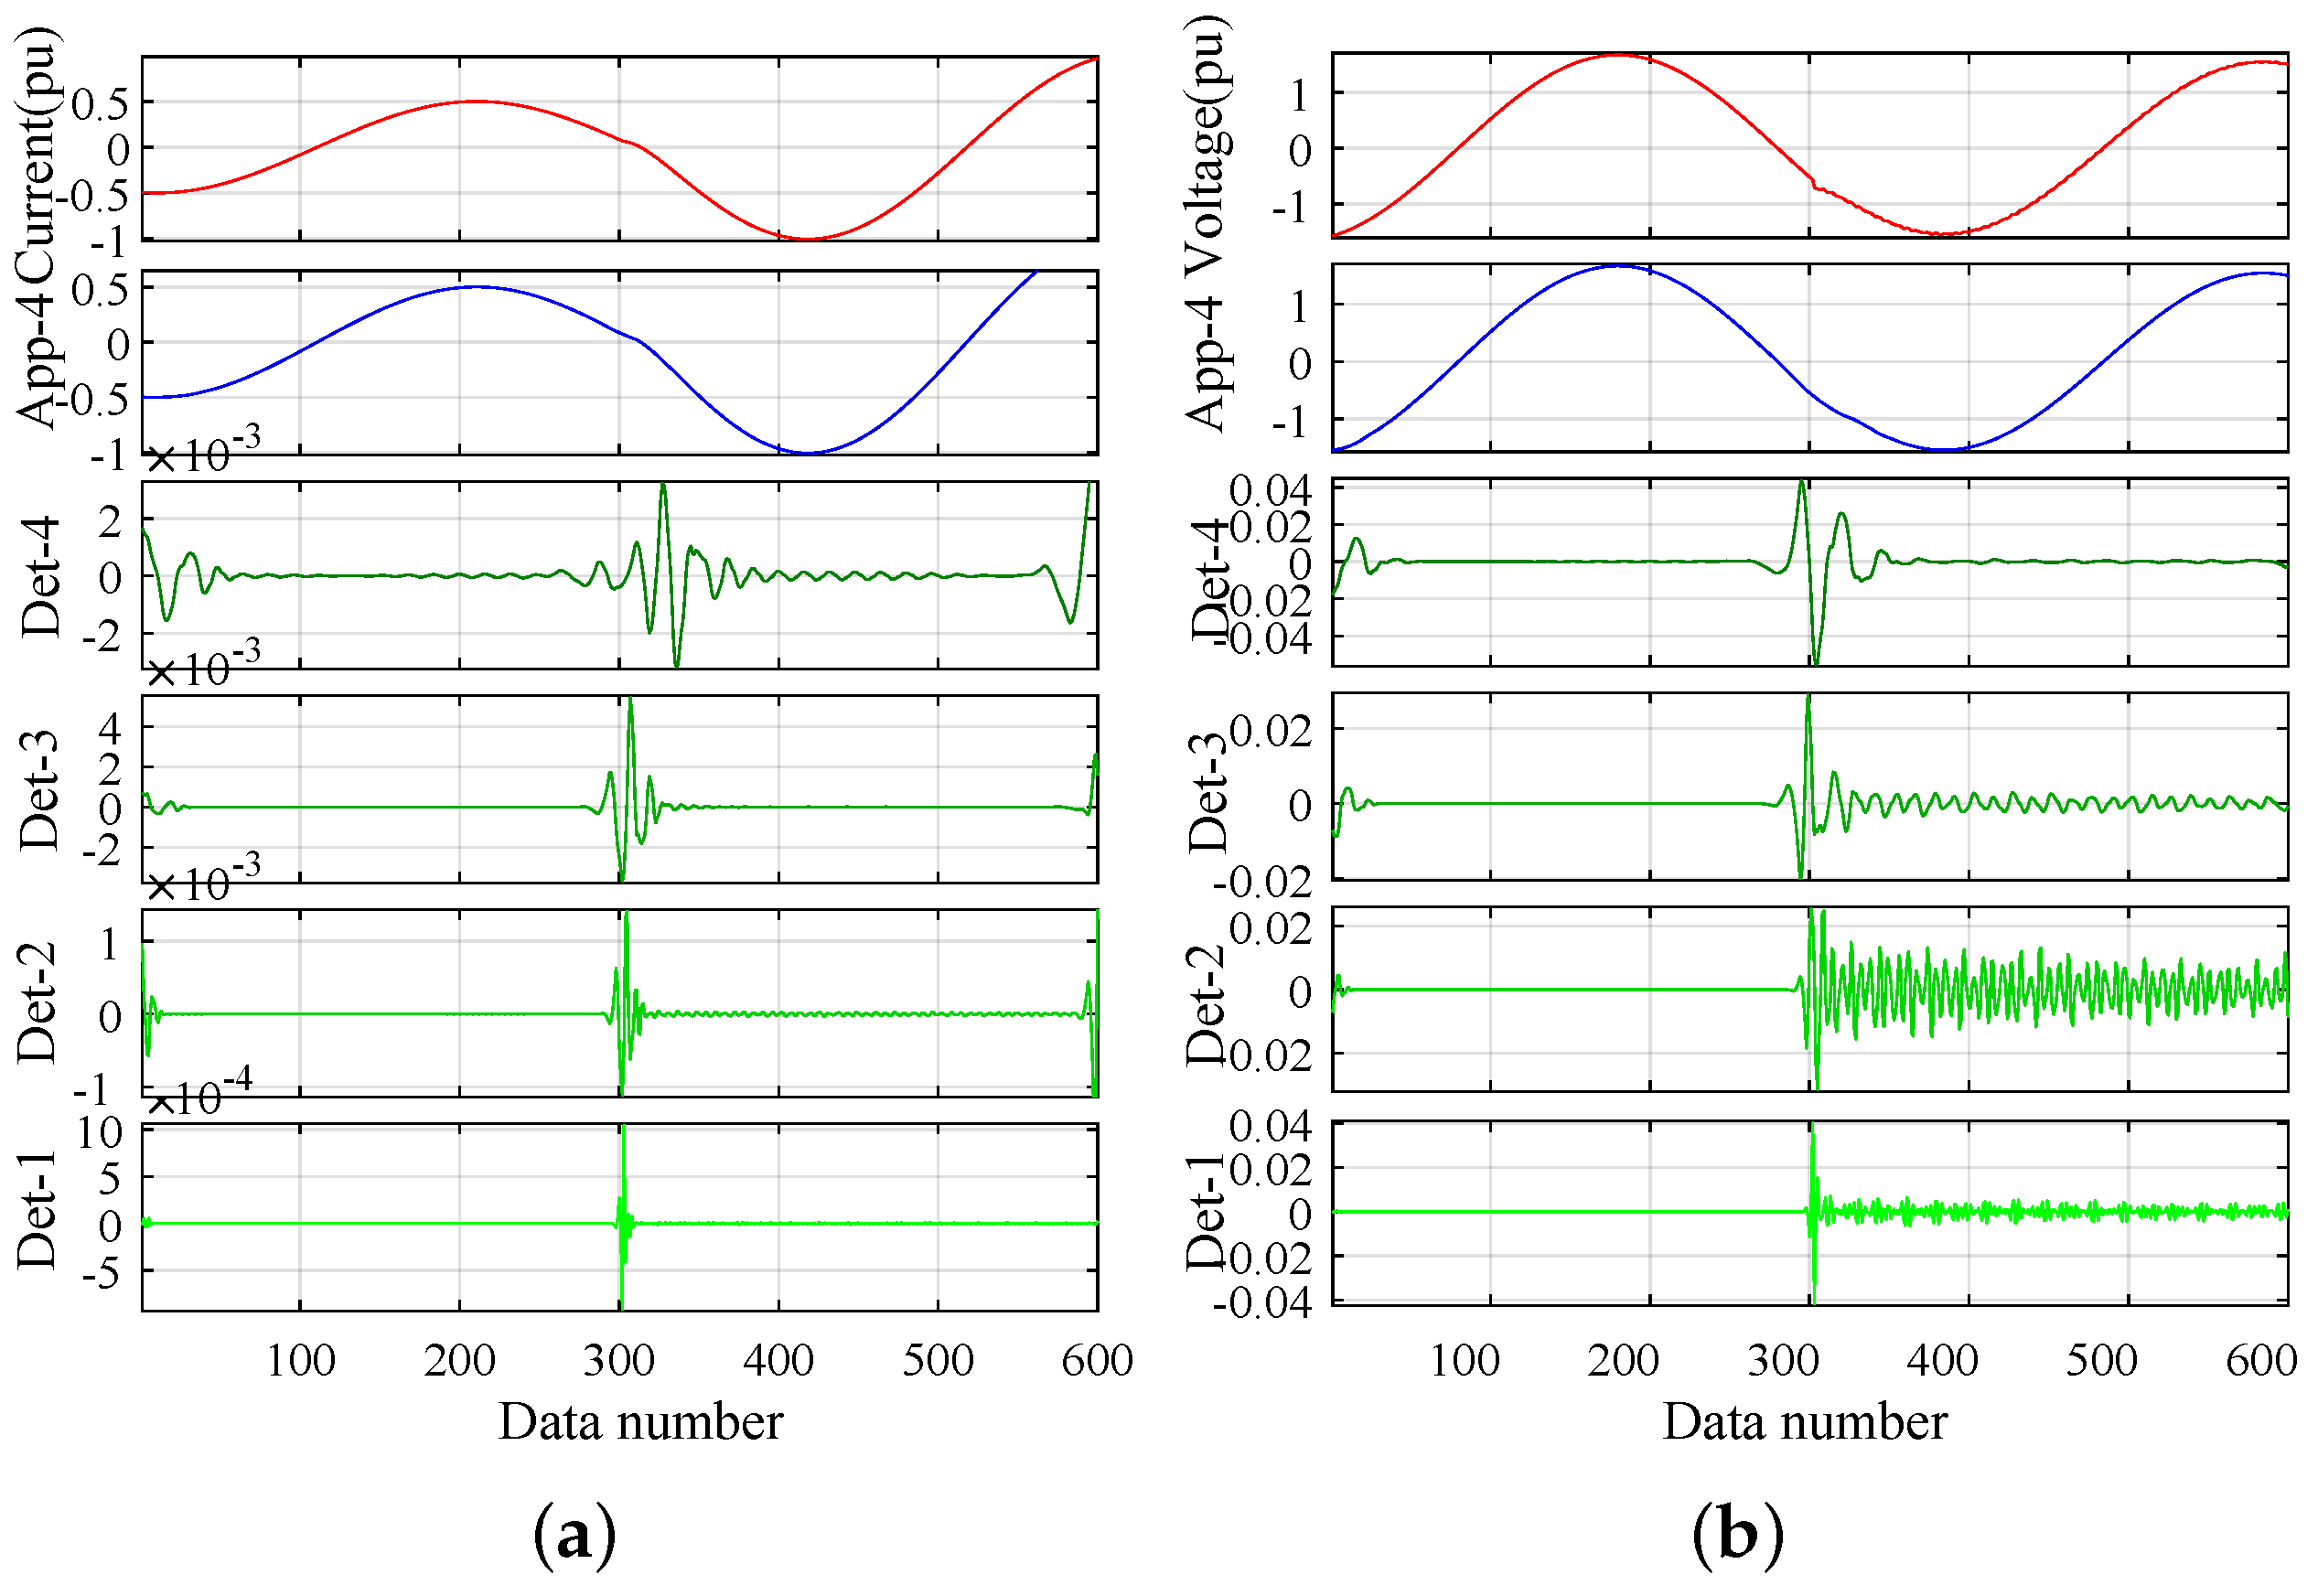
2.4. Fault Feature Generation with Wavelet Transform
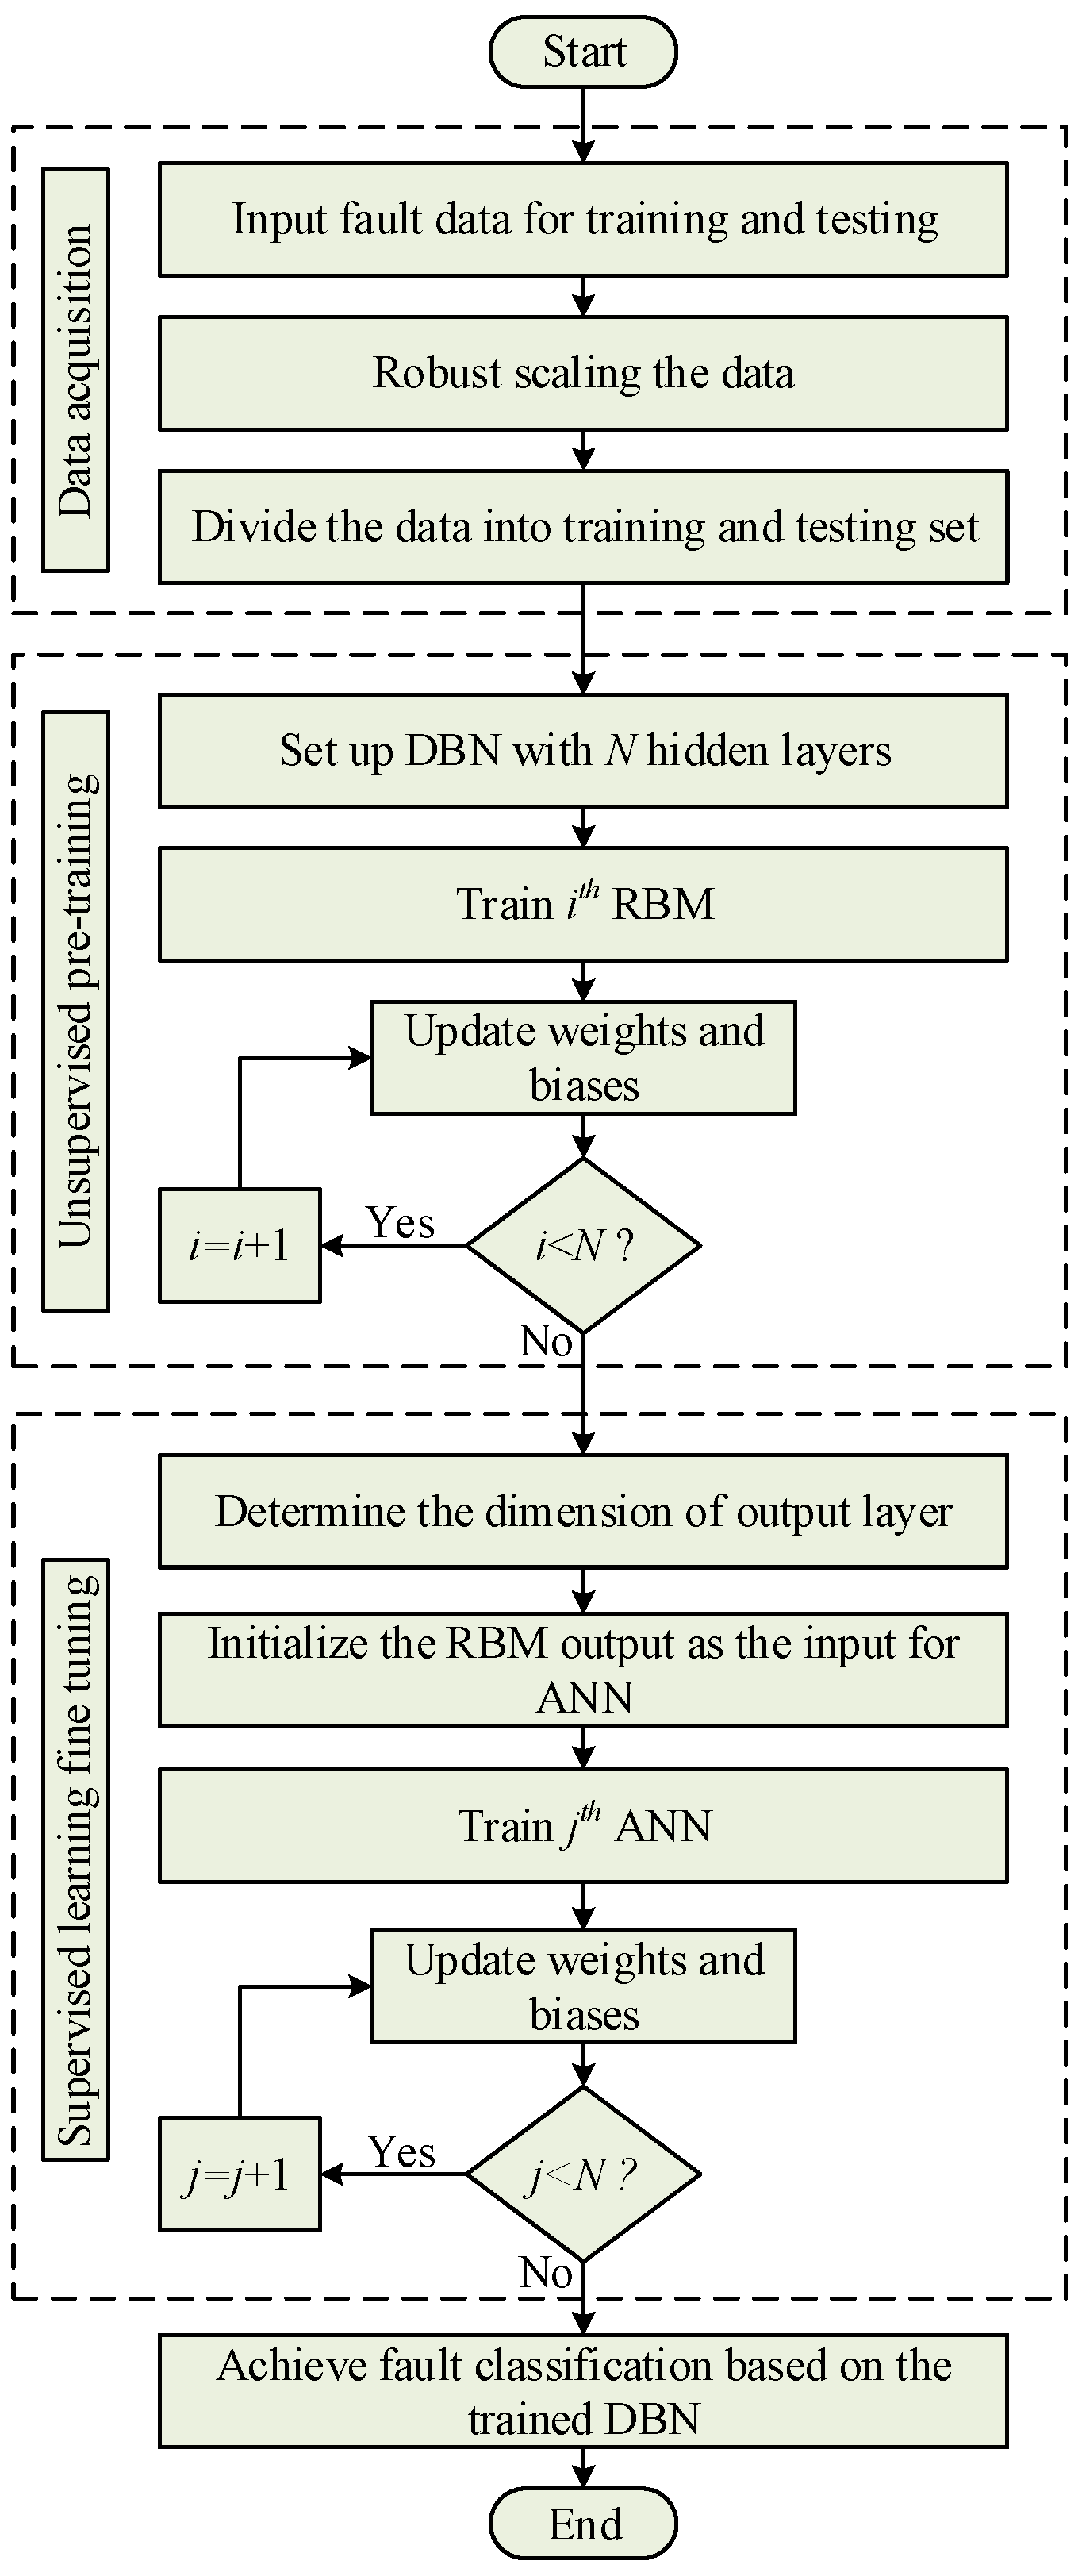
2.5. Proposed Hierarchical Generative Fault Classification Model
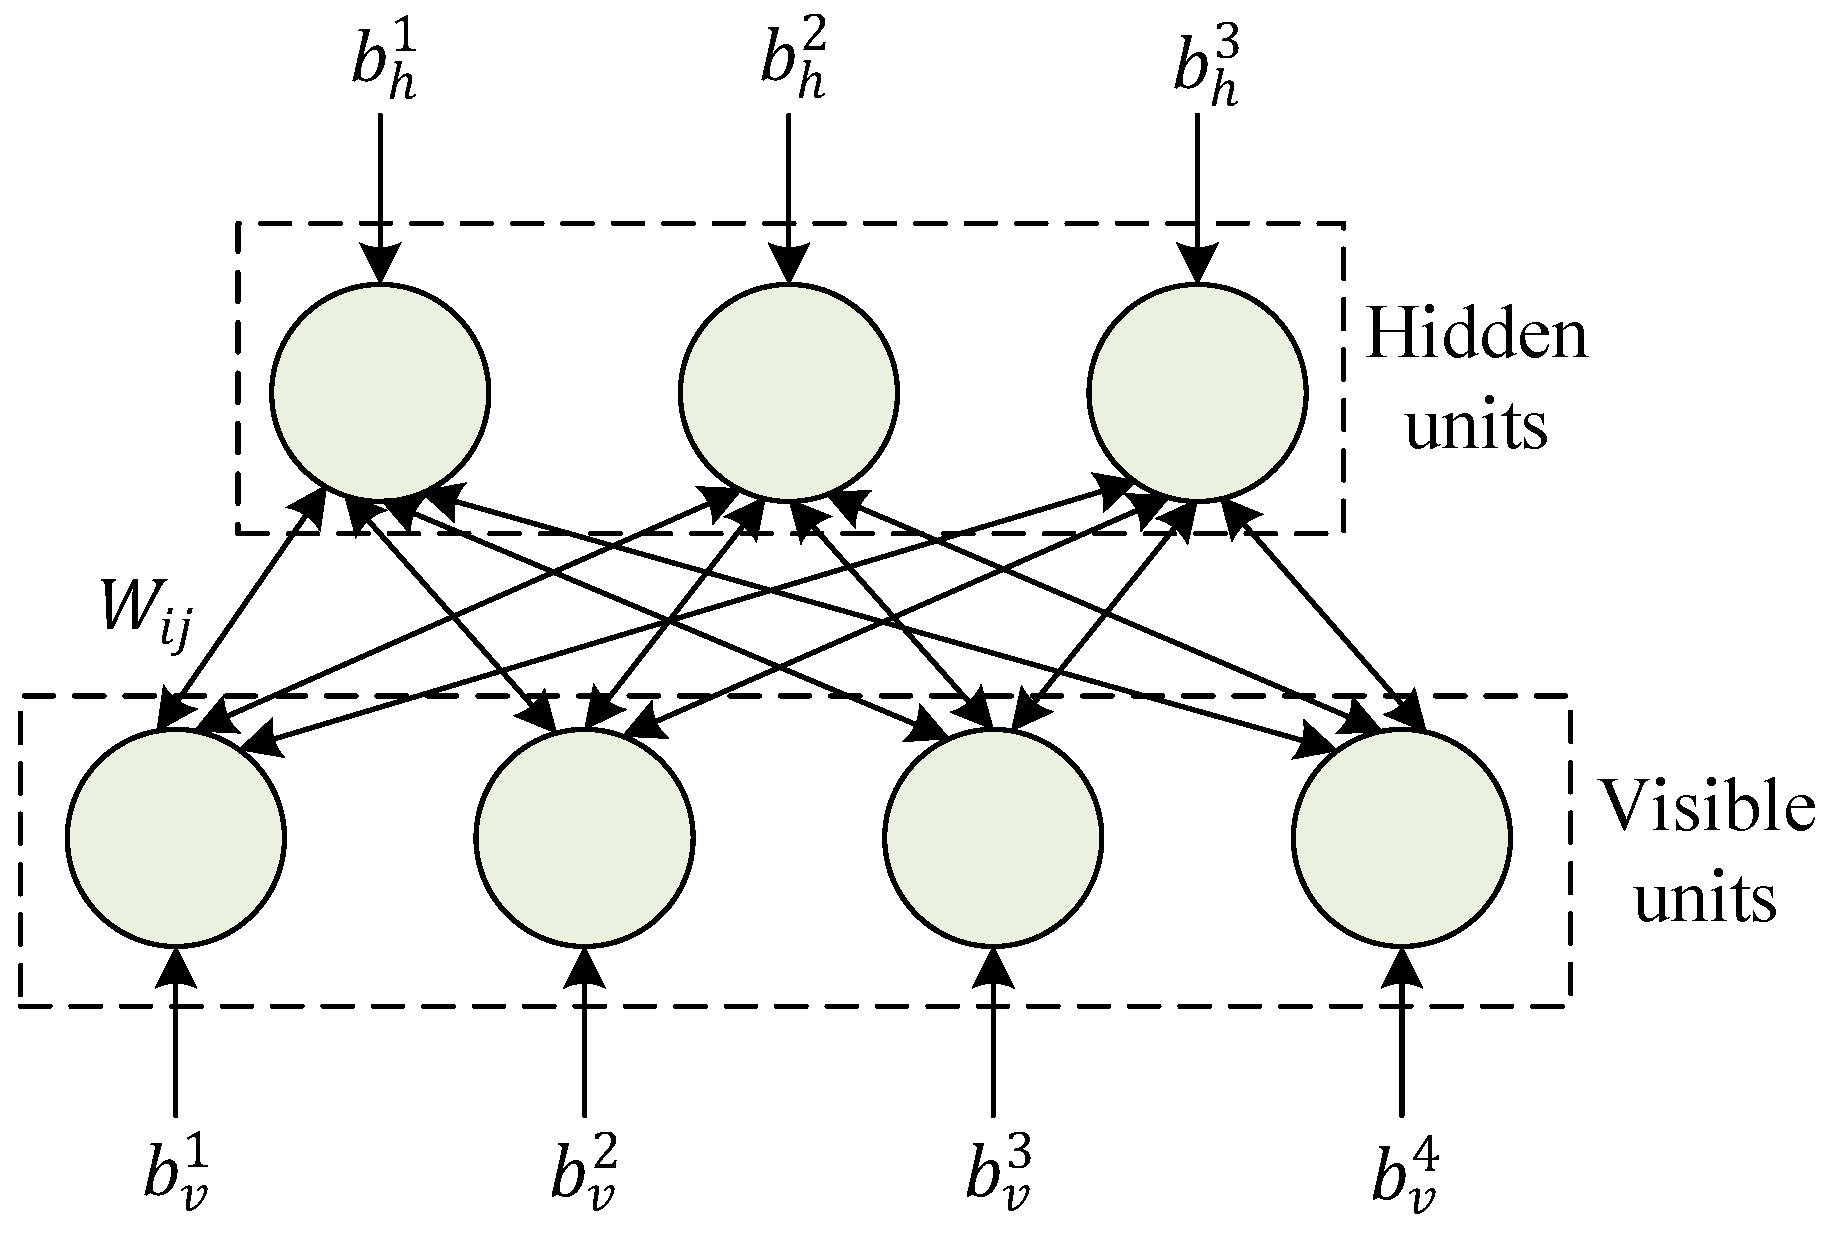
2.5.1. Restricted Boltzmann Machine
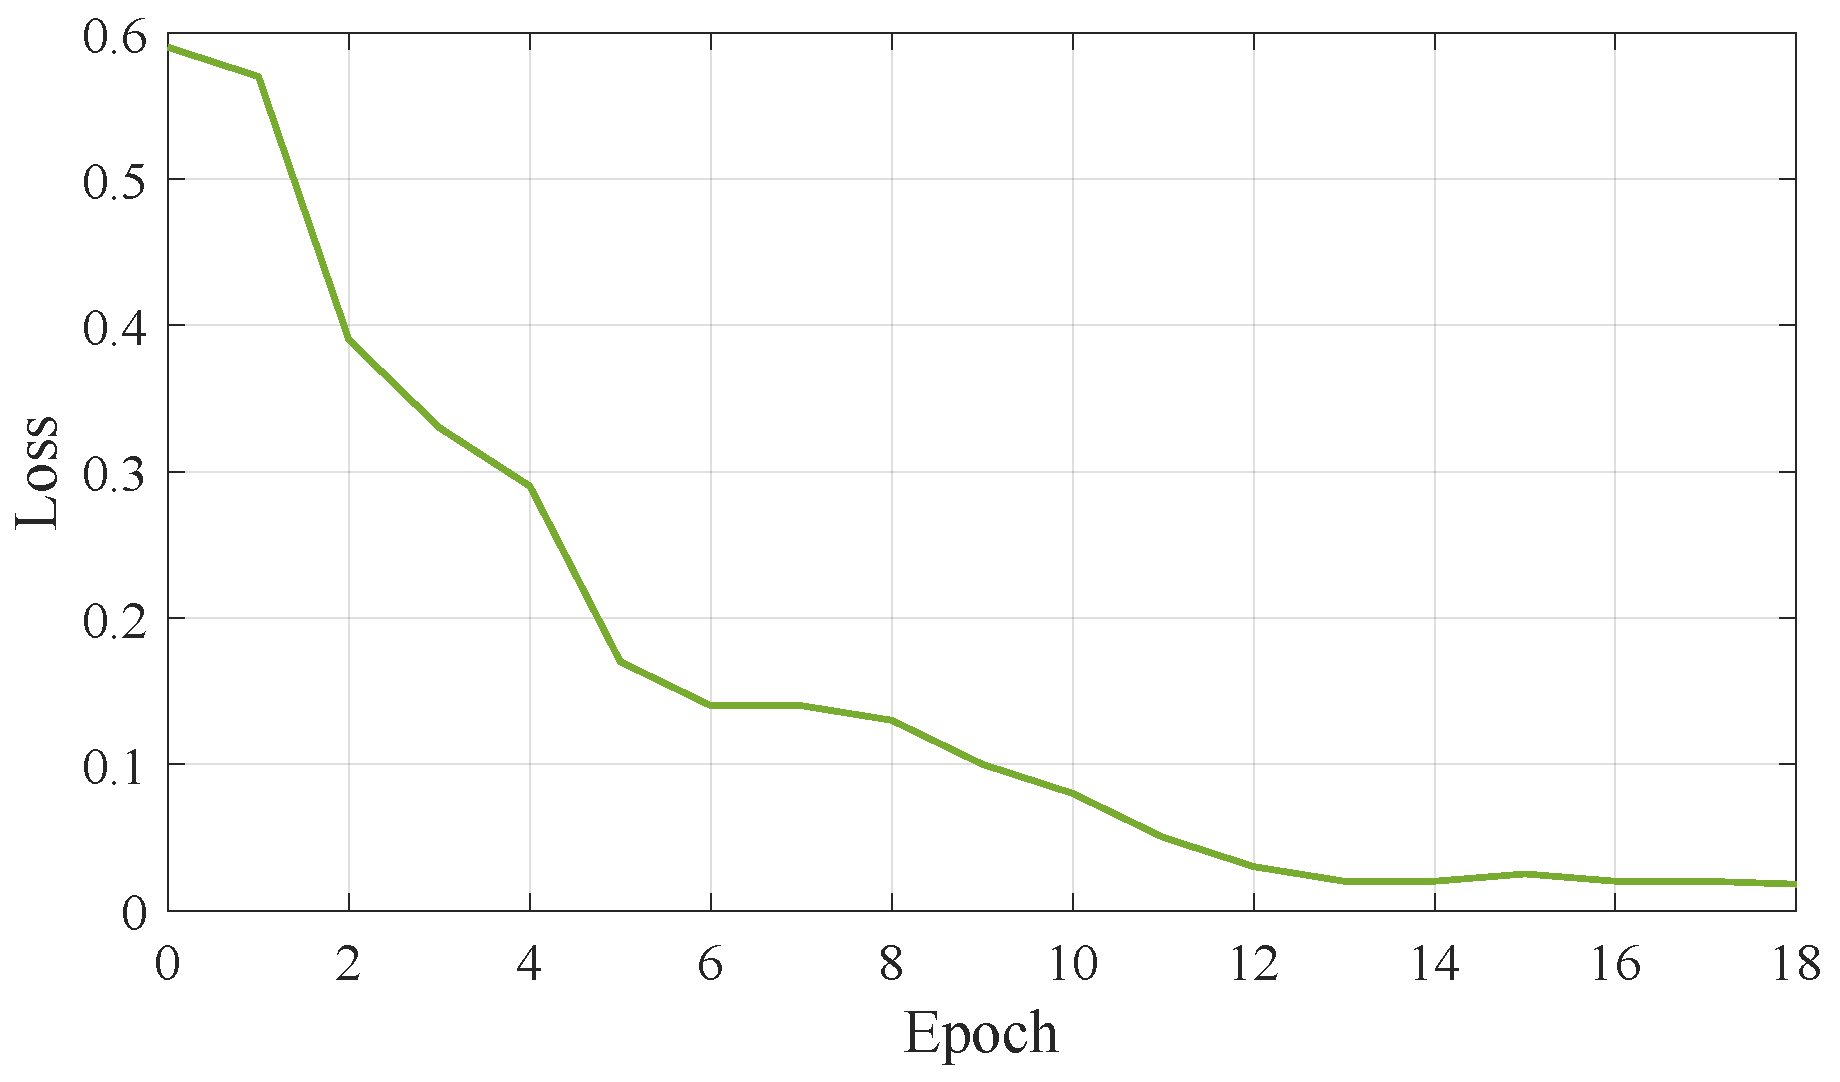
2.5.2. Unsupervised Learning of the Proposed Network
2.5.3. Supervised Training of the Proposed Network
3. Results and Discussion
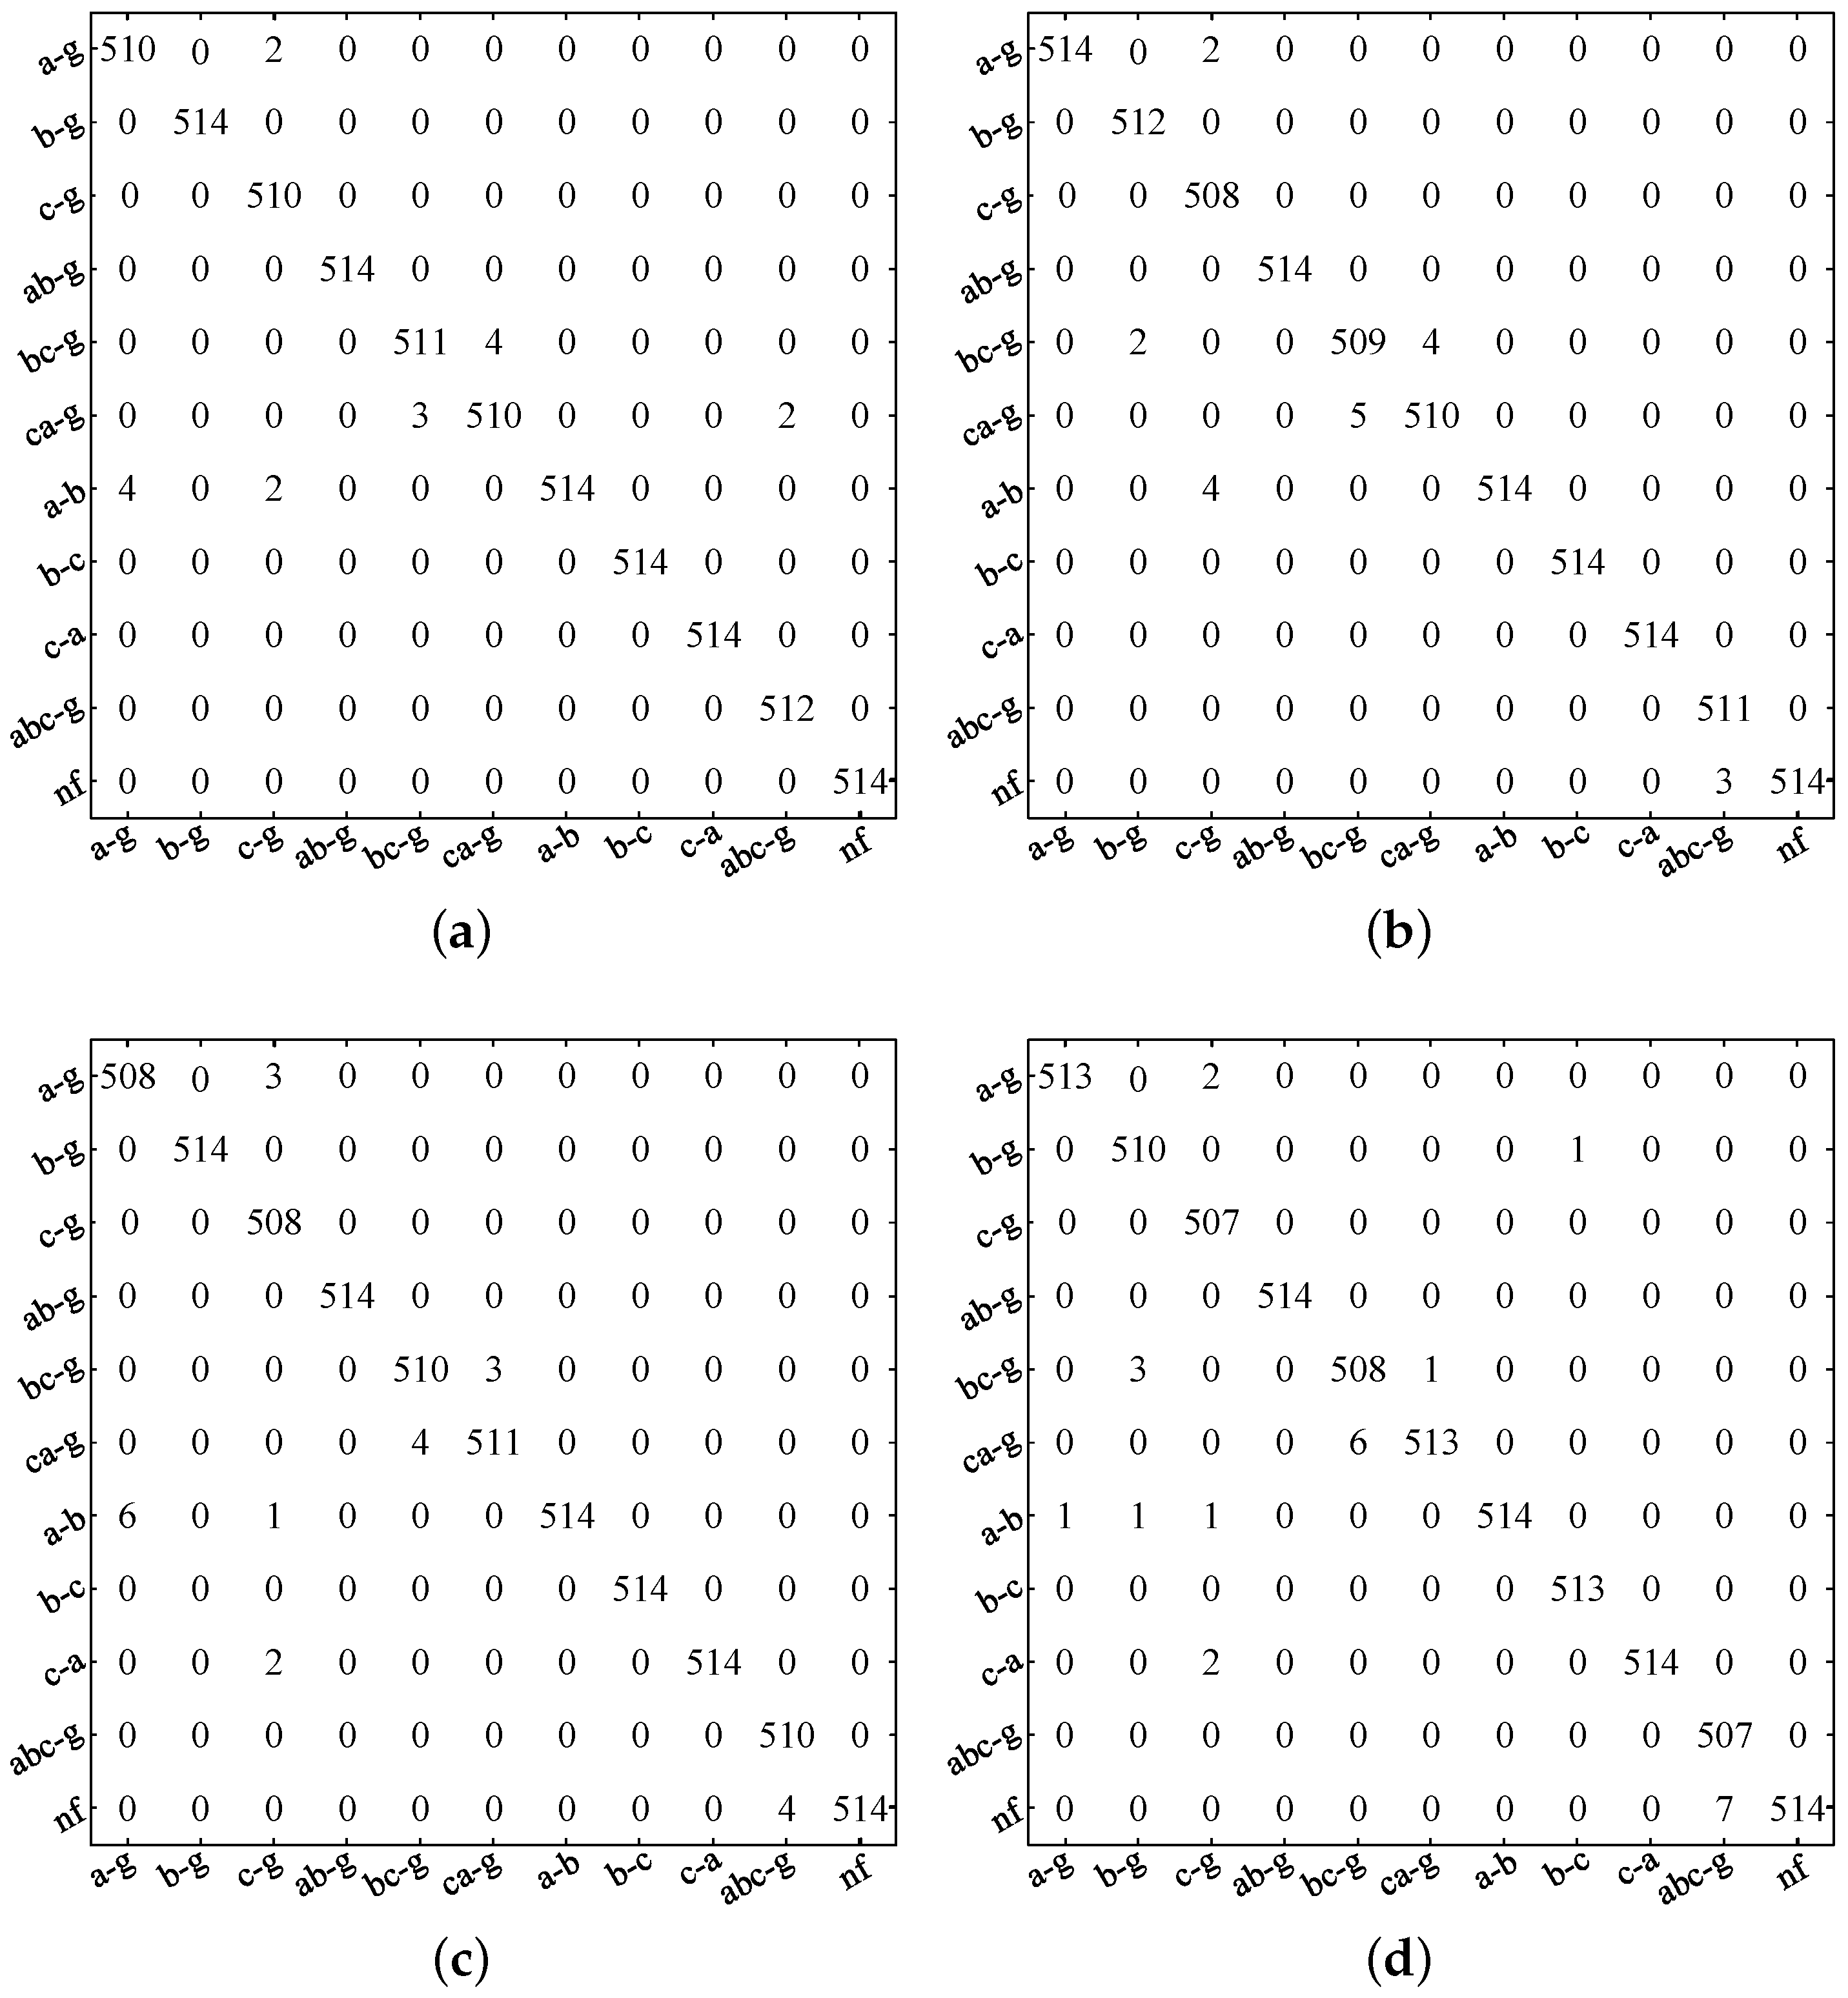
3.1. Performance Assessment of the DBN Based FDC Scheme
- TP: A label is correctly predicted by the classifier, and it belongs to the original class.
- TN: A label is correctly predicted by the classifier, and it does not belong to the original class.
- FP: A label is predicted as positive by the classifier. but it does not belong to the original class.
- FN: A label is predicted as negative by the classifier, but it belongs to the original class.
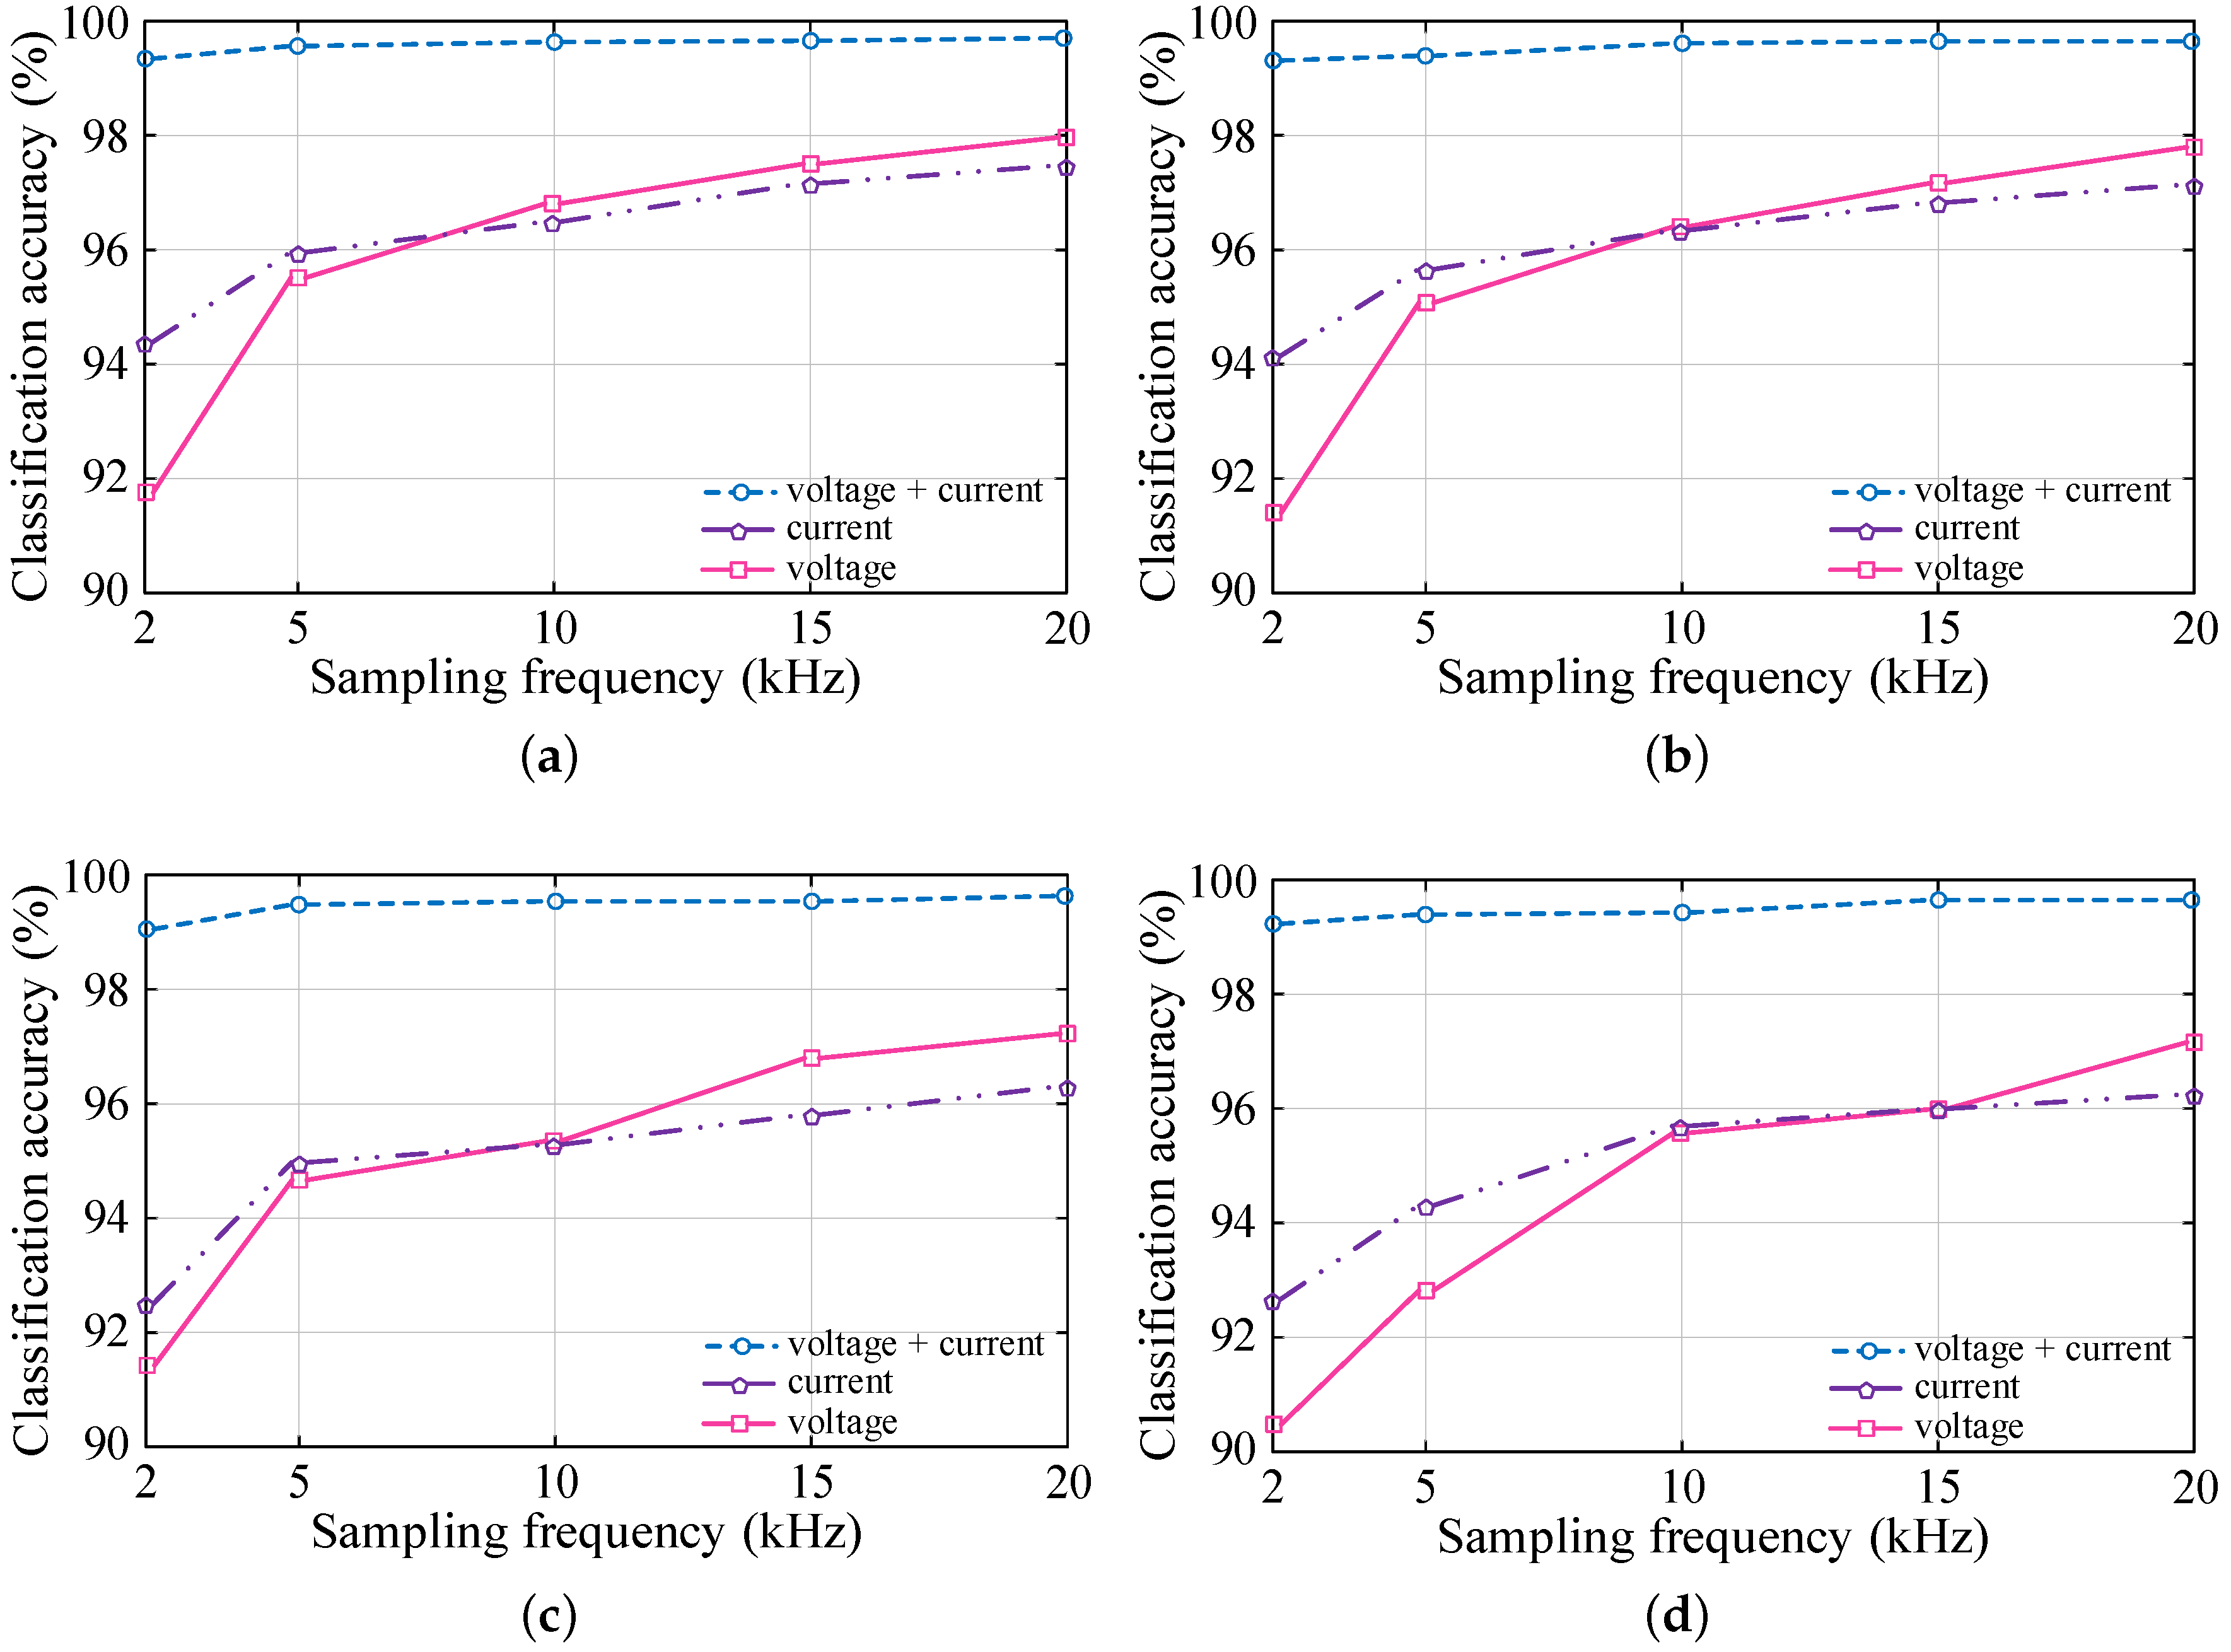
3.2. Effect of Sampling Resolution and Signal Type
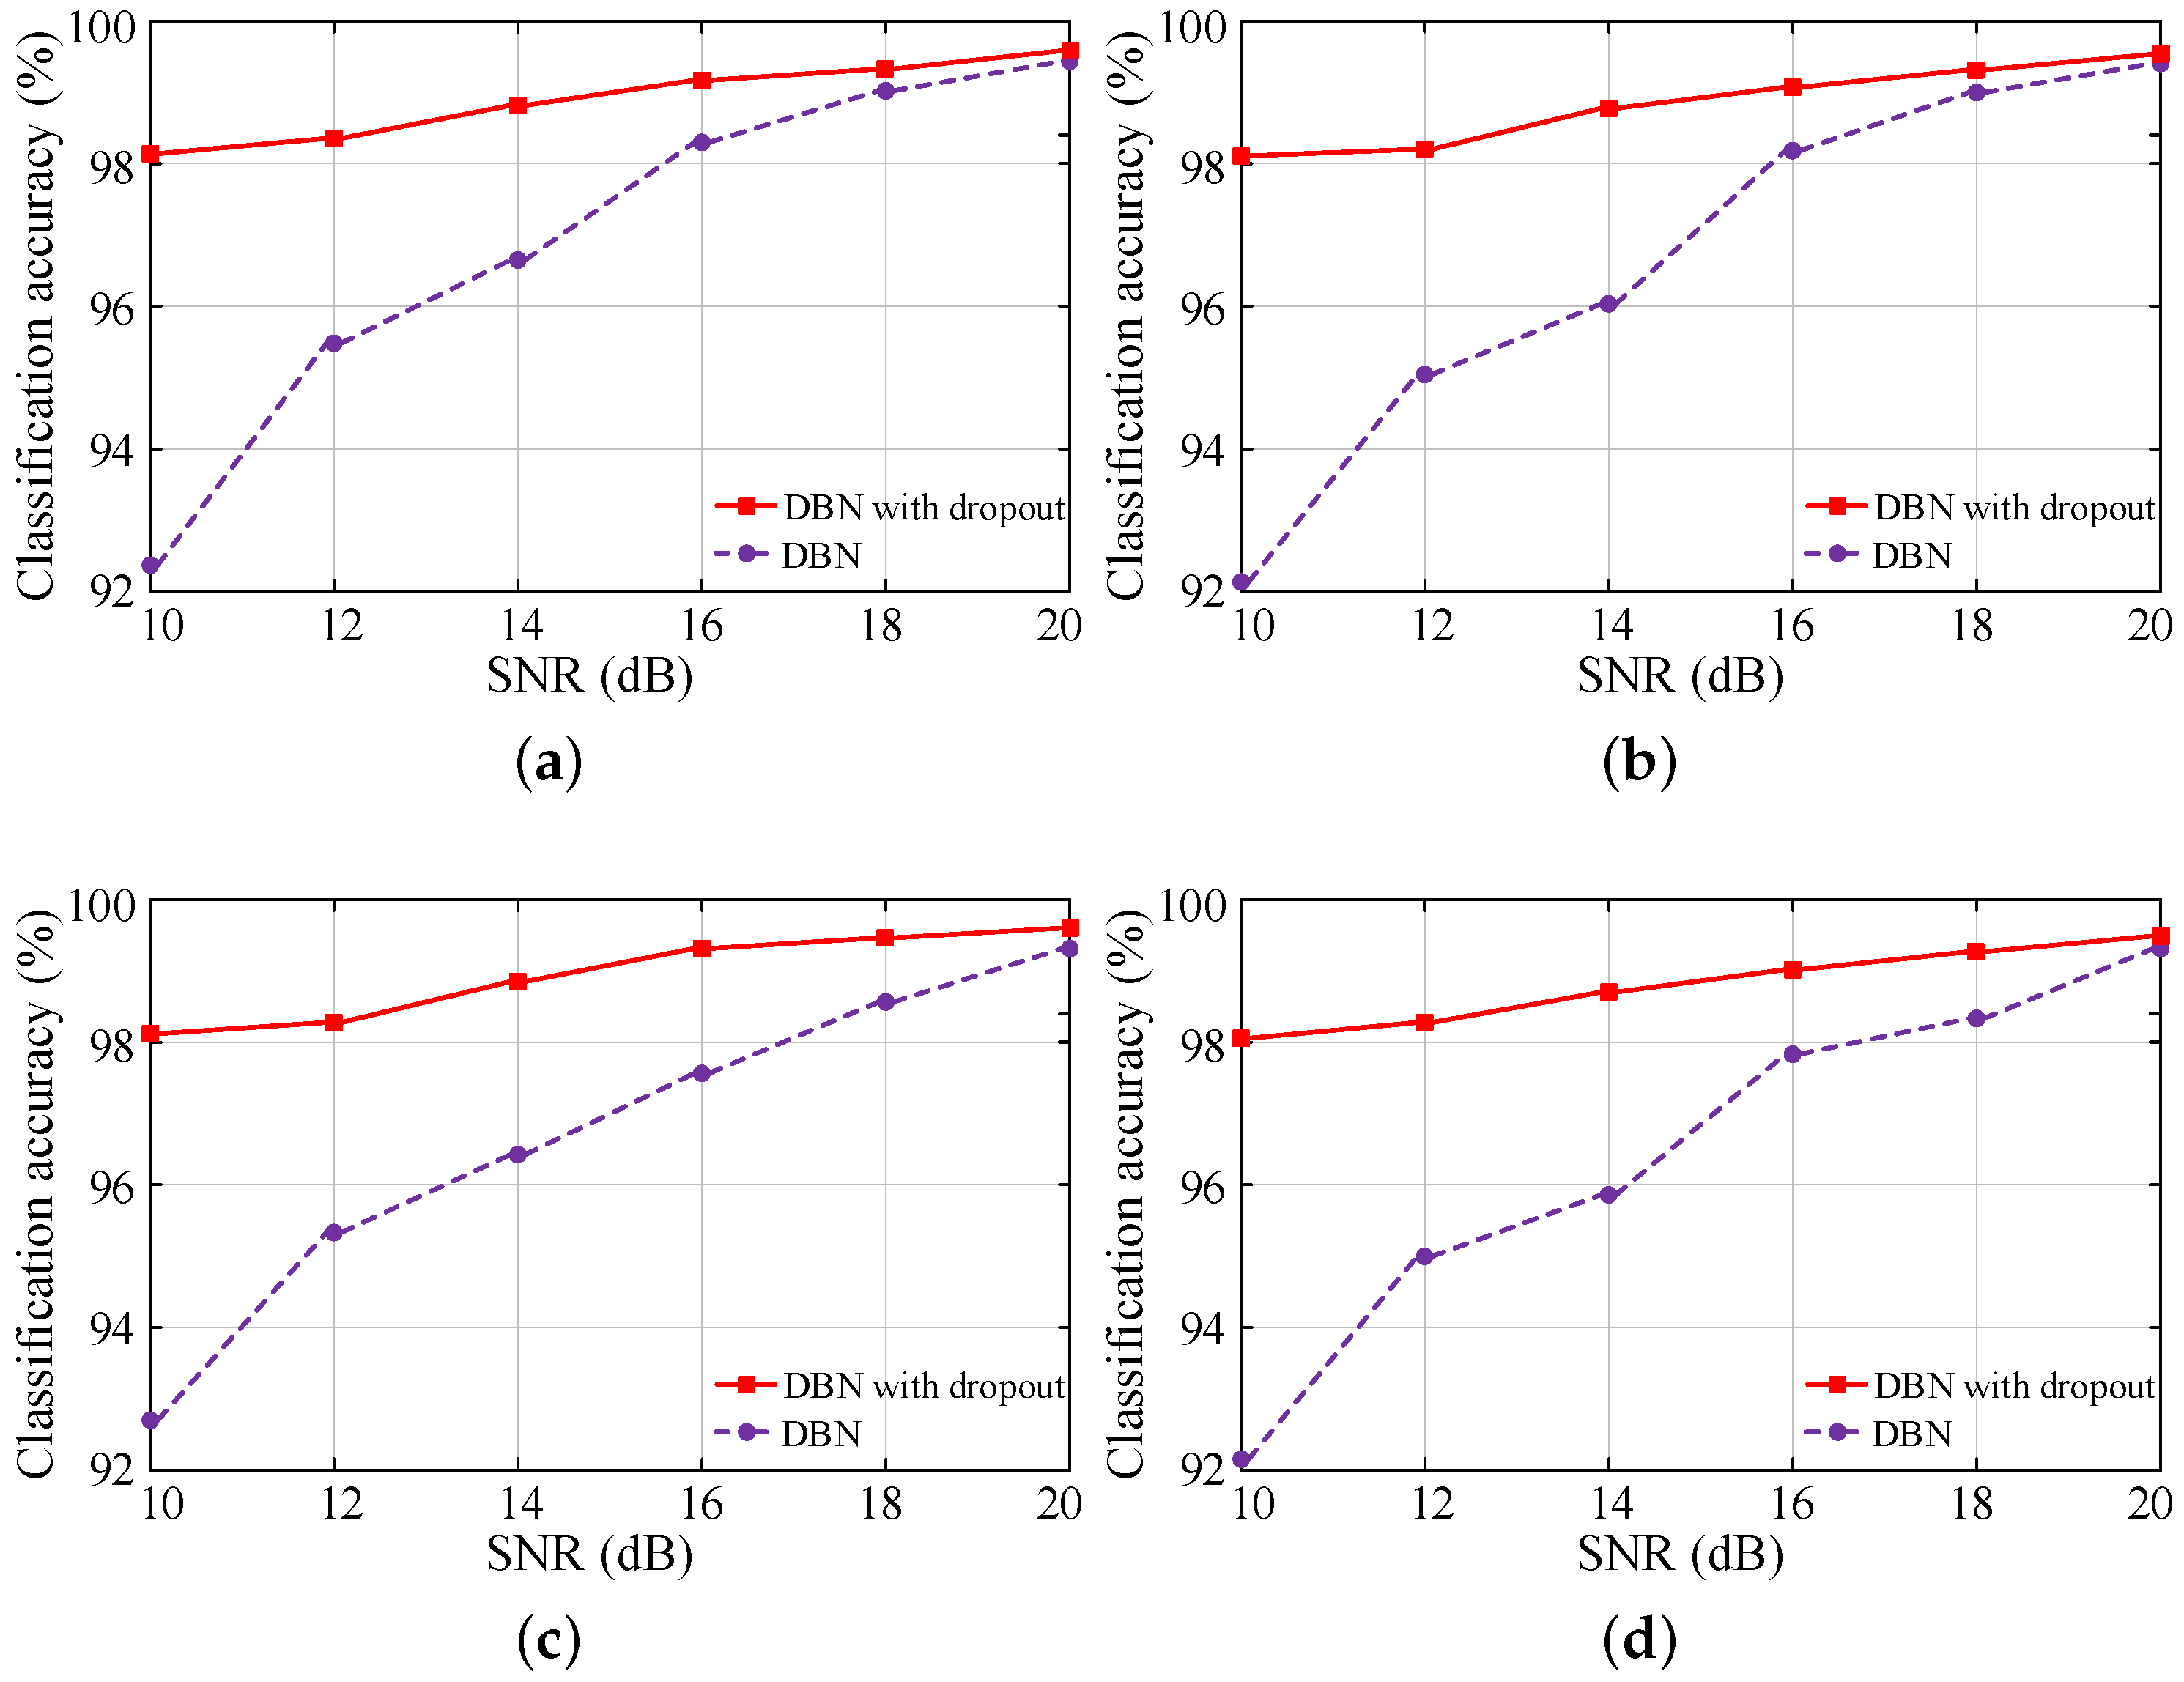
3.3. Effect of Noise Present in the Measured Signal Data on the Classification Accuracy
3.4. Comparative Study
4. Conclusions
Author Contributions
Funding
Conflicts of Interest
References
- Mishra, M.; Sahani, M.; Rout, P. An islanding detection algorithm for distributed generation based on Hilbert–Huang transform and extreme learning machine. Sustain. Energy Grids Netw. 2017, 9, 13–26. [Google Scholar] [CrossRef]
- Shuai, Z.; Sun, Y.; Shen, Z.J.; Tian, W.; Tu, C.; Li, Y.; Yin, X. Microgrid stability: Classification and a review. Renew. Sustain. Energy Rev. 2016, 58, 167–179. [Google Scholar] [CrossRef]
- Mishra, D.P.; Samantaray, S.R.; Joos, G. A combined wavelet and data-mining based intelligent protection scheme for microgrid. IEEE Trans. Smart Grid 2015, 7, 2295–2304. [Google Scholar] [CrossRef]
- Parhizi, S.; Lotfi, H.; Khodaei, A.; Bahramirad, S. State of the art in research on microgrids: A review. IEEE Access 2015, 3, 890–925. [Google Scholar] [CrossRef]
- El-Zonkoly, A.M. Fault diagnosis in distribution networks with distributed generation. Electr. Power Syst. Res. 2011, 81, 1482–1490. [Google Scholar] [CrossRef]
- Mishra, M.; Rout, P.K. Detection and classification of micro-grid faults based on HHT and machine learning techniques. IET Gener. Transm. Distrib. 2017, 12, 388–397. [Google Scholar] [CrossRef]
- Memon, A.A.; Kauhaniemi, K. A critical review of AC Microgrid protection issues and available solutions. Electr. Power Syst. Res. 2015, 129, 23–31. [Google Scholar] [CrossRef]
- Ray, P.K.; Panigrahi, B.K.; Rout, P.K.; Mohanty, A.; Eddy, F.Y.; Gooi, H.B. Detection of islanding and fault disturbances in microgrid using wavelet packet transform. IETE J. Res. 2019, 65, 796–809. [Google Scholar] [CrossRef]
- Dey, A.N.; Panigrahi, B.K.; Kar, S.K. Smartgrids/Microgrids in India: A Review on Relevance, Initiatives, Policies, Projects and Challenges. In Innovation in Electrical Power Engineering, Communication, and Computing Technology; Springer: Singapore, 2020; pp. 465–474. [Google Scholar]
- Shi, S.; Jiang, B.; Dong, X.; Bo, Z. Protection of microgrid. In Proceedings of the 10th IET International Conference on Developments in Power System Protection (DPSP 2010), Manchester, UK, 29 March–1 April 2010; pp. 1–4. [Google Scholar]
- Laaksonen, H.J. Protection principles for future microgrids. IEEE Trans. Power Electron. 2010, 25, 2910–2918. [Google Scholar] [CrossRef]
- Agüero, J.R.; Wang, J.; Burke, J.J. Improving the reliability of power distribution systems through single-phase tripping. In Proceedings of the IEEE PES T&D 2010, New Orleans, LA, USA, 19–22 April 2010; pp. 1–7. [Google Scholar]
- Eslami, R.; Sadeghi, S.H.H.; Askarian-Abyaneh, H.; Nasiri, A. A novel method for fault detection in future renewable electric energy delivery and management microgrids, considering uncertainties in network topology. Electr. Power Compon. Syst. 2017, 45, 1118–1129. [Google Scholar] [CrossRef]
- James, J.; Hou, Y.; Lam, A.Y.; Li, V.O. Intelligent fault detection scheme for microgrids with wavelet based deep neural networks. IEEE Trans. Smart Grid 2017, 10, 1694–1703. [Google Scholar]
- Prasad, A.; Edward, J.B.; Ravi, K. A review on fault classification methodologies in power transmission systems: Part—I. J. Electr. Syst. Inf. Technol. 2018, 5, 48–60. [Google Scholar] [CrossRef]
- Magdy, G.; Shabib, G.; Elbaset, A.A.; Mitani, Y. A novel coordination scheme of virtual inertia control and digital protection for microgrid dynamic security considering high renewable energy penetration. IET Renew. Power Gener. 2018, 13, 462–474. [Google Scholar] [CrossRef]
- Zhang, Y.; Wei, W. Decentralised coordination control strategy of the PV generator, storage battery and hydrogen production unit in islanded AC microgrid. IET Renew. Power Gener. 2020, 14, 1053–1062. [Google Scholar] [CrossRef]
- Al Hassan, H.A.; Reiman, A.; Reed, G.F.; Mao, Z.H.; Grainger, B.M. Model based fault detection of inverter based microgrids and a mathematical framework to analyse and avoid nuisance tripping and blinding scenarios. Energies 2018, 11, 2152. [Google Scholar] [CrossRef]
- Hare, J.; Shi, X.; Gupta, S.; Bazzi, A. Fault diagnostics in smart micro-grids: A survey. Renew. Sustain. Energy Rev. 2016, 60, 1114–1124. [Google Scholar] [CrossRef]
- Fahim, S.R.; Sarker, Y.; Islam, O.K.; Sarker, S.K.; Ishraque, M.F.; Das, S.K. An Intelligent Approach of Fault Classification and Localization of a Power Transmission Line. In Proceedings of the 2019 IEEE International Conference on Power, Electrical, and Electronics and Industrial Applications (PEEIACON), Dhaka, Bangladesh, 29 November–1 December 2019; pp. 53–56. [Google Scholar]
- Fahim, S.R.; Sarker, Y.; Sarker, S.K.; Sheikh, M.R.I.; Das, S.K. Self attention convolutional neural network with time series imaging based feature extraction for transmission line fault detection and classification. Electr. Power Syst. Res. 2020, 187, 106437. [Google Scholar] [CrossRef]
- Wan, H.; Li, K.; Wong, K. An multi-agent approach to protection relay coordination with distributed generators in industrial power distribution system. In Proceedings of the Fourtieth IAS Annual Meeting, Conference Record of the 2005 Industry Applications Conference, Kowloon, Hong Kong, China, 2–6 October 2005; Volumbe 2, pp. 830–836. [Google Scholar]
- Sortomme, E.; Venkata, S.; Mitra, J. Microgrid protection using communication-assisted digital relays. IEEE Trans. Power Deliv. 2009, 25, 2789–2796. [Google Scholar] [CrossRef]
- Oh, Y.S.; Kim, C.H.; Gwon, G.H.; Noh, C.H.; Bukhari, S.B.A.; Haider, R.; Gush, T. Fault detection scheme based on mathematical morphology in last mile radial low voltage DC distribution networks. Int. J. Electr. Power Energy Syst. 2019, 106, 520–527. [Google Scholar] [CrossRef]
- Al-Nasseri, H.; Redfern, M.; Li, F. A voltage based protection for micro-grids containing power electronic converters. In Proceedings of the 2006 IEEE Power Engineering Society General Meeting, Montreal, QC, Canada, 18–22 June 2006; p. 7. [Google Scholar]
- Hooshyar, A.; El-Saadany, E.F.; Sanaye-Pasand, M. Fault type classification in microgrids including photovoltaic DGs. IEEE Trans. Smart Grid 2015, 7, 2218–2229. [Google Scholar] [CrossRef]
- Al-Nasseri, H.; Redfern, M. Harmonics content based protection scheme for micro-grids dominated by solid state converters. In Proceedings of the 2008 12th International Middle-East Power System Conference, Aswan, Egypt, 12–15 March 2008; pp. 50–56. [Google Scholar]
- Yadav, A.; Dash, Y. An overview of transmission line protection by artificial neural network: Fault detection, fault classification, fault location, and fault direction discrimination. Adv. Artif. Neural Syst. 2014, 2014, 230382. [Google Scholar] [CrossRef]
- Hong, Y.Y.; Wei, Y.H.; Chang, Y.R.; Lee, Y.D.; Liu, P.W. Fault detection and location by static switches in microgrids using wavelet transform and adaptive network based fuzzy inference system. Energies 2014, 7, 2658–2675. [Google Scholar] [CrossRef]
- Gush, T.; Bukhari, S.B.A.; Mehmood, K.K.; Admasie, S.; Kim, J.S.; Kim, C.H. Intelligent Fault Classification and Location Identification Method for Microgrids Using Discrete Orthonormal Stockwell Transform-Based Optimized Multi-Kernel Extreme Learning Machine. Energies 2019, 12, 4504. [Google Scholar] [CrossRef]
- Gururani, A.; Mohanty, S.R.; Mohanta, J.C. Microgrid protection using Hilbert–Huang transform based-differential scheme. IET Gener. Transm. Distrib. 2016, 10, 3707–3716. [Google Scholar] [CrossRef]
- Kar, S.; Samantaray, S.; Zadeh, M.D. Data-mining model based intelligent differential microgrid protection scheme. IEEE Syst. J. 2015, 11, 1161–1169. [Google Scholar] [CrossRef]
- Ray, P.K.; Mohanty, S.R.; Kishor, N. Disturbance detection in grid-connected distributed generation system using wavelet and S-transform. Electr. Power Syst. Res. 2011, 81, 805–819. [Google Scholar] [CrossRef]
- Manohar, M.; Koley, E.; Ghosh, S. Microgrid protection under wind speed intermittency using extreme learning machine. Comput. Electr. Eng. 2018, 72, 369–382. [Google Scholar] [CrossRef]
- Abdelgayed, T.S.; Morsi, W.G.; Sidhu, T.S. Fault detection and classification based on co-training of semisupervised machine learning. IEEE Trans. Ind. Electron. 2017, 65, 1595–1605. [Google Scholar] [CrossRef]
- Hong, Y.Y.; Cabatac, M.T.A.M. Fault Detection, Classification, and Location by Static Switch in Microgrids Using Wavelet Transform and Taguchi-Based Artificial Neural Network. IEEE Syst. J. 2019, 14, 2725–2735. [Google Scholar] [CrossRef]
- Fahim, S.R.; Datta, D.; Sheikh, M.R.I.; Dey, S.; Sarker, Y.; Sarker, S.K.; Badal, F.R.; Das, S.K. A Visual Analytic in Deep Learning Approach to Eye Movement for Human-Machine Interaction Based on Inertia Measurement. IEEE Access 2020, 8, 45924–45937. [Google Scholar] [CrossRef]
- Sarker, Y.; Fahim, S.R.; Sarker, S.K.; Badal, F.R.; Das, S.K.; Mondal, M.N.I. A Multidimensional Pixel-wise Convolutional Neural Network for Hyperspectral Image Classification. In Proceedings of the 2019 IEEE International Conference on Robotics, Automation, Artificial-Intelligence and Internet-of-Things (RAAICON), Dhaka, Bangladesh, 29 November–1 December 2019; pp. 104–107. [Google Scholar]
- Fahim, S.R.; Sarker, Y.; Rashiduzzaman, M.; Islam, O.K.; Sarker, S.K.; Das, S.K. A Human-Computer Interaction System Utilizing Inertial Measurement Unit and Convolutional Neural Network. In Proceedings of the 2019 5th International Conference on Advances in Electrical Engineering (ICAEE), Dhaka, Bangladesh, 26–28 September 2019; pp. 880–885. [Google Scholar]
- Chen, Z.; Li, C.; Sánchez, R.V. Multi-layer neural network with deep belief network for gearbox fault diagnosis. J. Vibroeng. 2015, 17, 2379–2392. [Google Scholar]
- Shao, H.; Jiang, H.; Zhang, X.; Niu, M. Rolling bearing fault diagnosis using an optimization deep belief network. Meas. Sci. Technol. 2015, 26, 115002. [Google Scholar] [CrossRef]
- Wang, X.; Li, Y.; Rui, T.; Zhu, H.; Fei, J. Bearing fault diagnosis method based on Hilbert envelope spectrum and deep belief network. J. Vibroeng. 2015, 17, 1295–1308. [Google Scholar]
- Tran, V.T.; AlThobiani, F.; Ball, A. An approach to fault diagnosis of reciprocating compressor valves using Teager–Kaiser energy operator and deep belief networks. Expert Syst. Appl. 2014, 41, 4113–4122. [Google Scholar] [CrossRef]
- Zhao, G.; Liu, X.; Zhang, B.; Liu, Y.; Niu, G.; Hu, C. A novel approach for analog circuit fault diagnosis based on deep belief network. Measurement 2018, 121, 170–178. [Google Scholar] [CrossRef]
- Ranzato, M.; Boureau, Y.L.; Cun, Y.L. Sparse feature learning for deep belief networks. In Proceedings of the Advances in Neural Information Processing Systems, Vancouver, BC, Canada, 8–10 December 2008; pp. 1185–1192. [Google Scholar]
- Ustun, T.S.; Ozansoy, C.; Zayegh, A. Modeling of a centralized microgrid protection system and distributed energy resources according to IEC 61850-7-420. IEEE Trans. Power Syst. 2012, 27, 1560–1567. [Google Scholar] [CrossRef]
- Jiang, J.A.; Chuang, C.L.; Wang, Y.C.; Hung, C.H.; Wang, J.Y.; Lee, C.H.; Hsiao, Y.T. A hybrid framework for fault detection, classification, and location—Part I: Concept, structure, and methodology. IEEE Trans. Power Deliv. 2011, 26, 1988–1998. [Google Scholar] [CrossRef]
- Gao, W.; Ning, J. Wavelet based disturbance analysis for power system wide-area monitoring. IEEE Trans. Smart Grid 2011, 2, 121–130. [Google Scholar] [CrossRef]
- He, K.; Zhang, X.; Ren, S.; Sun, J. Delving deep into rectifiers: Surpassing human-level performance on imagenet classification. In Proceedings of the IEEE International Conference on Computer Vision, Santiago, Chile, 7–13 December 2015; pp. 1026–1034. [Google Scholar]
- Ali, M.; Son, D.H.; Kang, S.H.; Nam, S.R. An accurate CT saturation classification using a deep learning approach based on unsupervised feature extraction and supervised fine-tuning strategy. Energies 2017, 10, 1830. [Google Scholar] [CrossRef]
- Liu, Z.; Han, Z.; Zhang, Y.; Zhang, Q. Multiwavelet packet entropy and its application in transmission line fault recognition and classification. IEEE Trans. Neural Netw. Learn. Syst. 2014, 25, 2043–2052. [Google Scholar] [CrossRef]
- Srivastava, N.; Hinton, G.; Krizhevsky, A.; Sutskever, I.; Salakhutdinov, R. Dropout: A simple way to prevent neural networks from overfitting. J. Mach. Learn. Res. 2014, 15, 1929–1958. [Google Scholar]
- Chen, K.; Hu, J.; He, J. Detection and classification of transmission line faults based on unsupervised feature learning and convolutional sparse autoencoder. IEEE Trans. Smart Grid 2016, 9, 1748–1758. [Google Scholar] [CrossRef]


| System Parameters | Types or Values | |
|---|---|---|
| Fault | Types of faults | a-g, b-g, c-g, ab-g, bc-g, ac-g, a-b, b-c, |
| a-c, abc-g, non-fault | ||
| Fault distance (km) | 1 to 19 with an increment of 0.5 | |
| Fault resistance () | 0.1, 1, 5, 10, 20, 50, 100 | |
| Line | Positive and zero sequence resistances (/km) | 0.0135 and 0.0424 |
| Positive and zero sequence inductances (H/km) | 4.9869 × 10⁻⁵ and 1.39 × 10⁻⁴ | |
| Positive and zero sequence capacitances (F/km) | 11.33 × 10⁻⁹ and 5.01 × 10⁻⁹ | |
| Distance (km): Line 1-3; Line 1-2; Line 3-5; Line 3-4; Line 5-6 | 20 km each | |
| Transformers (T) | T-1 | 79/13 kV, 10 MVA, 50 Hz |
| T-2 and T-5 | 0.575/13 kV, 9 MVA, 50 Hz | |
| T-3 and T-4 | 0.4/13 kV, 10 MVA, 50 Hz | |
| Generators (G) | Main grid | 1000 MVA, 79 kV, 50 Hz |
| G-1 (DFIG based wind farm) | Rated MVA: 9 MVA, Rated kV: 575 V | |
| G-2 (Wind turbine with asynchronous machine) | Rated MVA: 1.5 MVA, Rated kV: 0.4 | |
| G-3 ( Inverter based) | Rated MVA: 10 MVA, Rated kV: 13 | |
| G-4 ( Inverter based) | Rated MVA: 10 MVA, Rated kV: 575 V |
| System Configuration | Average Accuracy(%) | ||||
|---|---|---|---|---|---|
| Line 1-3 | Line 1-2 | Line 3-4 | Line 3-5 | Line 5-6 | |
| Grid-connected radial mode | 99.70 | 99.71 | 99.36 | 99.68 | 99.21 |
| Grid-connected loop mode | 99.65 | 99.69 | 99.35 | 99.62 | 99.07 |
| Islanded radial mode | 99.59 | 99.48 | 99.13 | 99.42 | 98.80 |
| Islanded loop mode | 99.56 | 99.51 | 98.97 | 99.39 | 98.82 |
| Fault Class | Radial Mode | Loop Mode | ||||||
|---|---|---|---|---|---|---|---|---|
| Accuracy (%) | Precision | Recall | F1-Score | Accuracy (%) | Precision | Recall | F1-Score | |
| a-g | 99.89 | 1.0 | 0.99 | 0.99 | 99.96 | 1.0 | 1.0 | 1.0 |
| b-g | 100 | 1.0 | 1.0 | 1.0 | 99.96 | 1.0 | 1.0 | 1.0 |
| c-g | 99.93 | 1.0 | 0.99 | 1.0 | 99.89 | 1.0 | 0.99 | 0.99 |
| ab-g | 100 | 1.0 | 1.0 | 1.0 | 100 | 1.0 | 1.0 | 1.0 |
| bc-g | 99.88 | 0.99 | 0.99 | 0.99 | 99.81 | 0.99 | 0.99 | 0.99 |
| ac-g | 99.84 | 0.99 | 0.99 | 0.99 | 99.84 | 0.99 | 0.99 | 0.99 |
| a-b | 99.89 | 0.99 | 1.0 | 0.99 | 99.93 | 0.99 | 1.0 | 1.0 |
| b-c | 100 | 1.0 | 1.0 | 1.0 | 100 | 1.0 | 1.0 | 1.0 |
| a-c | 100 | 1.0 | 1.0 | 1.0 | 100 | 1.0 | 1.0 | 1.0 |
| abc-g | 99.96 | 1.0 | 1.0 | 1.0 | 99.95 | 1.0 | 0.99 | 1.0 |
| nf | 100 | 0.99 | 1.0 | 1.0 | 99.95 | 0.99 | 1.0 | 1.0 |
| Fault Class | Radial Mode | Loop Mode | ||||||
|---|---|---|---|---|---|---|---|---|
| Accuracy (%) | Precision | Recall | F1-Score | Accuracy (%) | Precision | Recall | F1-Score | |
| a-g | 99.84 | 0.99 | 0.99 | 0.99 | 99.95 | 1.0 | 1.0 | 1.0 |
| b-g | 100 | 1.0 | 1.0 | 1.0 | 99.91 | 1.0 | 0.99 | 1.0 |
| c-g | 99.89 | 1.0 | 0.99 | 0.99 | 99.91 | 1.0 | 0.99 | 1.0 |
| ab-g | 100 | 1.0 | 1.0 | 1.0 | 100 | 1.0 | 1.0 | 1.0 |
| bc-g | 99.88 | 0.99 | 0.99 | 0.99 | 99.82 | 0.99 | 0.99 | 0.99 |
| ac-g | 99.88 | 0.99 | 0.99 | 0.99 | 99.88 | 0.99 | 1.0 | 0.99 |
| a-b | 99.98 | 0.99 | 1.0 | 0.99 | 99.95 | 0.99 | 1.0 | 1.0 |
| b-c | 100 | 1.0 | 1.0 | 1.0 | 99.95 | 1.0 | 1.0 | 1.0 |
| a-c | 99.96 | 1.0 | 1.0 | 1.0 | 100 | 1.0 | 1.0 | 1.0 |
| abc-g | 99.93 | 1.0 | 0.99 | 1.0 | 99.88 | 1.0 | 0.99 | 0.99 |
| nf | 99.93 | 0.99 | 1.0 | 1.0 | 99.88 | 0.99 | 1.0 | 0.99 |
| SNR | Classification Accuracy (%) | |||
|---|---|---|---|---|
| MKELM | KELM | SVM | DBN with Dropout | |
| 30 dB | 98.29 | 98.15 | 98.24 | 99.38 |
| Techniques | Methods | Advantages | Disadvantages |
|---|---|---|---|
| Classical strategies | Circuit theory, | 1. Simplicity | 1. Inaccurate |
| Traveling waves, | 2. Easy implementation | 2. Limited fault type | |
| Symmetrical | classification | ||
| component | 3. Slow | ||
| Signal processing | FFT, | 1. Direct fault analysis | 1. Decision threshold are |
| WT | 2. Used for feature extraction | defined arbitrarily | |
| and information compression | |||
| Statistical | Traditional statistical | 1. High generalizability | 1. Take longer time to |
| concepts | 2. Individual data patterns | make a decision | |
| are clear and visible | 2. Validation of data | ||
| is not guaranteed | |||
| Knowledge based | 1. High precision | 1. The accuracy can not be | |
| Fuzzy logic | 2. Rapid operation | guaranteed as the system is | |
| 3. Can handle uncertainty | based on the experts’ | ||
| experience | |||
| Artificial intelligence | 1. Detects the non-linear | 1. Slow convergence of | |
| relationship between | training process | ||
| ANN | independent and dependent | 2. Shallow architecture limit the | |
| variables | capacity to learn the complex | ||
| non-linear relationships | |||
| 1. Faster, even if the problem | 1. Choosing kernel function and | ||
| SVM | is large-size | hyper parameters are difficult | |
| 2. Requires less heuristics | |||
| 1. Good at noisy environment | 1. Processes are random | ||
| 2. The simulation speed can | 2. Outputs are not consistent | ||
| GANN | be improved | ||
| 3. Dimension of solution can | |||
| be reduced | |||
| Proposed method | 1. Robust hierarchical generative | ||
| model | |||
| DBN | 2. Restrain overfitting of the | ||
| training data | |||
| 3. Discover the fundamental | |||
| regularity of versatile features | |||
| 4. Powerful generalization | |||
| capability |
© 2020 by the authors. Licensee MDPI, Basel, Switzerland. This article is an open access article distributed under the terms and conditions of the Creative Commons Attribution (CC BY) license (http://creativecommons.org/licenses/by/4.0/).
Share and Cite
Rahman Fahim, S.; K. Sarker, S.; Muyeen, S.M.; Sheikh, M.R.I.; Das, S.K. Microgrid Fault Detection and Classification: Machine Learning Based Approach, Comparison, and Reviews. Energies 2020, 13, 3460. https://doi.org/10.3390/en13133460
Rahman Fahim S, K. Sarker S, Muyeen SM, Sheikh MRI, Das SK. Microgrid Fault Detection and Classification: Machine Learning Based Approach, Comparison, and Reviews. Energies. 2020; 13(13):3460. https://doi.org/10.3390/en13133460
Chicago/Turabian StyleRahman Fahim, Shahriar, Subrata K. Sarker, S. M. Muyeen, Md. Rafiqul Islam Sheikh, and Sajal K. Das. 2020. "Microgrid Fault Detection and Classification: Machine Learning Based Approach, Comparison, and Reviews" Energies 13, no. 13: 3460. https://doi.org/10.3390/en13133460
APA StyleRahman Fahim, S., K. Sarker, S., Muyeen, S. M., Sheikh, M. R. I., & Das, S. K. (2020). Microgrid Fault Detection and Classification: Machine Learning Based Approach, Comparison, and Reviews. Energies, 13(13), 3460. https://doi.org/10.3390/en13133460