A Study on the Influence of Lithium Plating on Battery Degradation

 ,
, 

Abstract
:1. Introduction
- To improve the degradation diagnostics model presented in [9] to simplify the quantification procedure of LLI, LAMNE and LAMPE;
- To identify the degradation modes of a commercial cell aged under a fast charge regime and analyze the underlying degradation mechanisms.
2. Experimental Setup and Data Acquisition
2.1. Full-Cell Experiments
2.2. Half-Cell Experiments
3. Quantification Procedure of LAM and LLI
3.1. Cell OCV Fitting
3.1.1. Identify the Cell OCV Fitting Range
3.1.2. Identification of Electrode OCV Use Range
3.2. Quantification of LAM and LLI
3.2.1. LLI Calculation
3.2.2. LAM Calculation
4. Degradation Analysis: Results and Discussion
4.1. Identification of Electrode Utilization Range
4.2. Application of the Degradation Diagnostics
- Higher levels of LLI (circa 19.4%) are observed for set A cells compared to set B cells (circa 7.3%) as shown in Figure 11. This could be explained through the following reasons. First, set A cells had higher levels of lithium plating (see Figure 3). Part of the plated lithium becomes irreversible, leading to LLI. Second, the increased LAM could raise the LLI level since LAM could occur in the lithiated state. Third, the plated lithium could crack the SEI layer, resulting in further growth of the SEI layer consuming cyclable lithium [40].
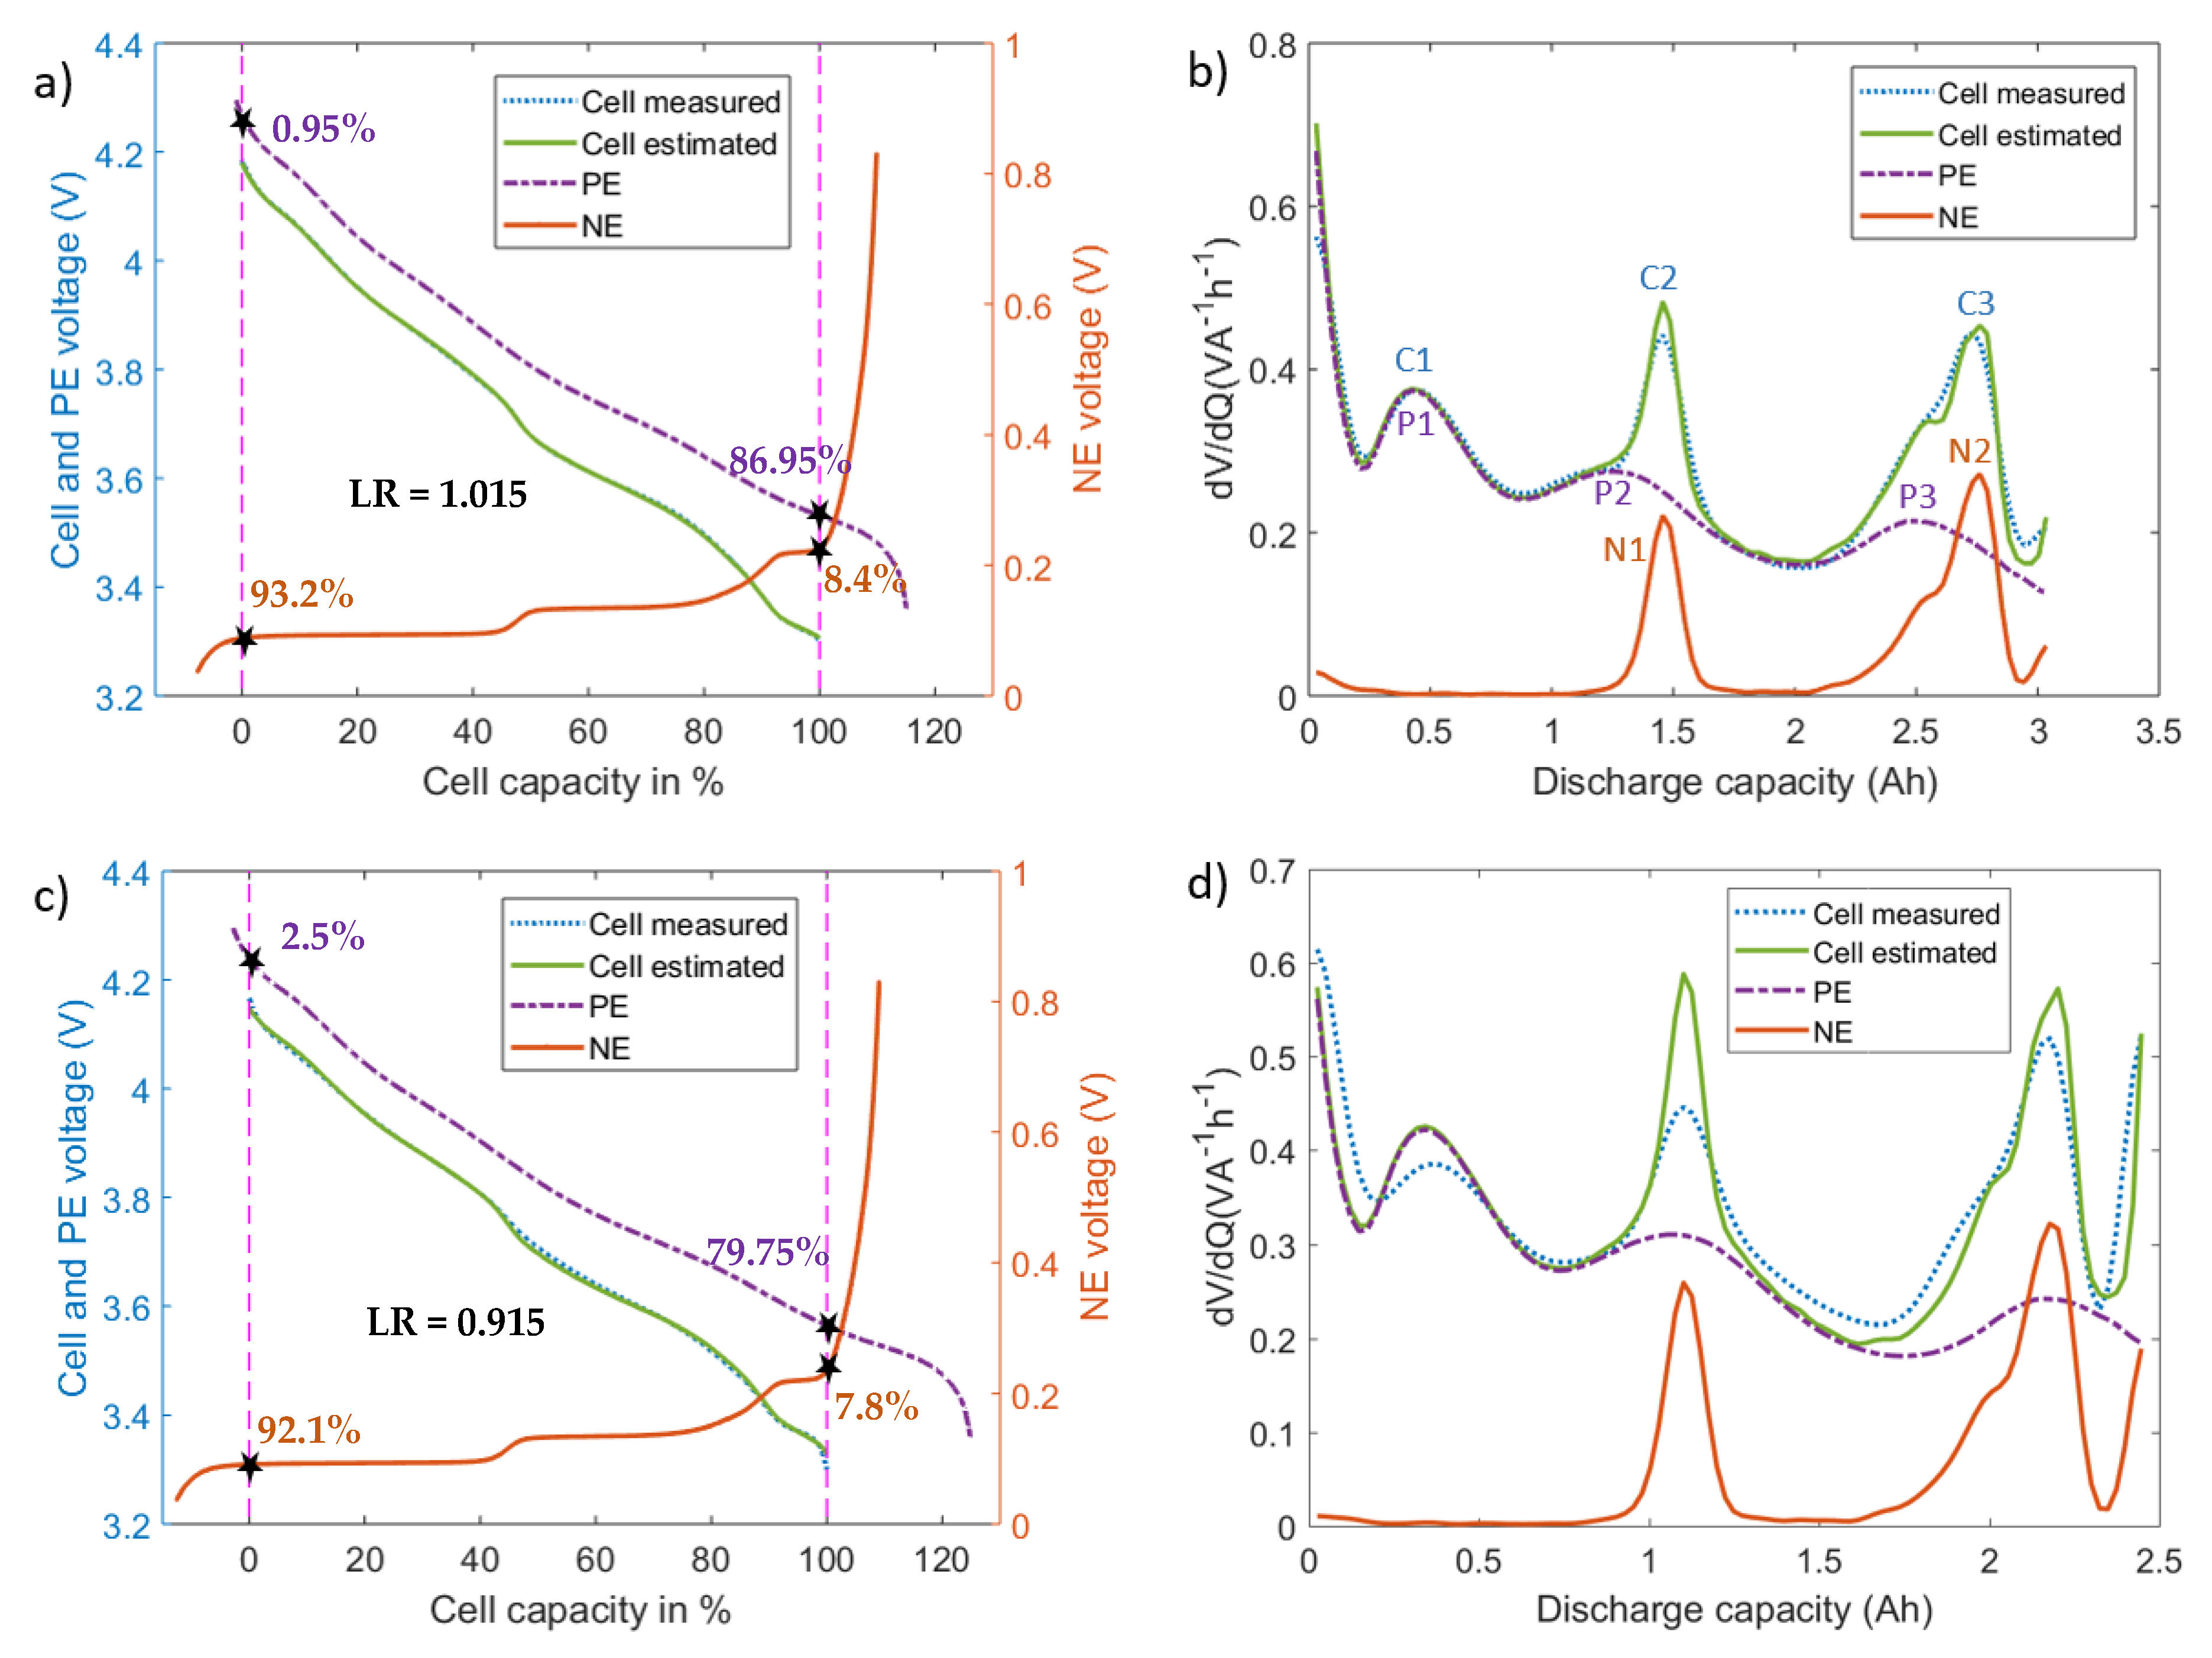
- Increased levels of LAM at the NE are observed under lithium plating. The LAM levels at NE of set A cells are significantly higher (an average of 16.2%, Figure 11) than those of set B cells (an average of 6.1%, Figure 11b). However, relatively low, the LAM levels in set B indicates that there could be some amount of lithium plating that is below the detectable level. As discussed within [29], the VRP method fails to detect lithium plating levels lower than 2.5%. Visual inspection of the electrodes (Figure 3) as detailed in Section 2.1 as well indicate relatively lower levels of lithium metal depositions in set B cells compared to that of set A cells.The LAM difference between the two sets as seen from Figure 11 indicates that higher the capacity fade under the influence of lithium plating, larger the LAM for two reasons. First, set A cells are charged with an aggressive current profile and found with much higher levels of lithium depositions and capacity fade compared to set B cells (see Figure 3). Second, other possible aging mechanisms such as binder decomposition and graphite exfoliation at the NE [41,42] that cause LAM may not induce such high levels of LAM given these cells are only tested for 52 cycles [4].In addition to the quantification of degradation modes using the proposed electrodes OCV profiles, IC–DV curves are also compared for degradation analysis. Figure 12a,b shows the evolution of IC and DV curves, respectively for the cell A1. In the DV curves, the cell capacity delivered between the peaks C2 and C3 is equal to the capacity delivered by the NE electrode between the peaks N1 and N2. Therefore, the percentage of capacity reduction between these peaks can be used to indicate the percentage of LAMNE. As seen from figure, the capacity between the peaks C2 and C3 has dropped by 15.6% (1.086 Ah compared to 1.285 Ah) which suggests that LAMNE is 15.6%. On the other hand, LAMNE estimated for the same cell using the electrode OCV profiles is 17.8%. The large levels of LAMNE calculated from both techniques highlights that mechanical stress has increased under lithium plating.Increased levels of LAM under the influence of lithium plating can originate from two possible sources. One, as discussed earlier, volume expansion due to the lithium metal depositions in the early cycles can raise the mechanical stresses within the cell and lead to LAM in the first moment. Second, as discussed within [43], formation of localized layers due to passivated lithium depositions or electrically isolated LAM in the early cycles may further increase the mechanical stresses locally which in turn can raise the LAM further.
- LAMNE is higher than LAMPE for each cell in set A (as per Figure 11) and the average LAMNE across the set A cells is 16.2% while the average LAMPE is only 8.9%. Since lithium plating occurs at the NE and metal depositions could stay between the NE and the separator, it can be reasonably assumed that the NE experiences higher levels of mechanical stresses compared to the PE ([3,12]). Therefore, it follows that mechanical stresses impact on the NE could be higher than the PE.
- The results also highlight that LAMNE levels are comparable to the LLI levels in the aged cells. For example, cell number one from set A lost 17.8% LAMNE and 19.4% LLI. LAM can occur in lithiated condition, which means LLI along with it or in the delithiated state. Since lithium plating occurs towards the end of charging or near to full lithiation of the electrode, mechanical stresses could rise remarkably in the lithiated state of NE. This could result in higher levels of LAM in the lithiated state (LAMliNE). As discussed within [44], the shift of valley points in the IC curve (*C2 and *C3) that correspond to the peaks C2 and C3 in the DV curve (or the peaks N1 and N2 of the NE) towards higher cell voltages (as seen from Figure 12a) as well indicates the dominance of LAMliNE. Therefore, significant levels of LLI may come from LAMliNE and the contribution of irreversible lithium plating to the total LLI can be much lower than the LLI from the LAM. This analysis indicates that most lithium plating can become reversible and LAMliNE can be a major result of lithium plating. However, this initial conclusion needs further study to quantify the LLI from LAM.
4.3. Research Challenges and Future Work
4.3.1. Impact of Electrode Degradation
4.3.2. Impact of Lithium Metal Depositions
4.3.3. Loading Ration Mismatch
5. Conclusions
Author Contributions
Funding
Conflicts of Interest
Abbreviations
| BMS | Battery management system |
| CC–CV | Constant current followed by constant voltage |
| DV | Differential voltage |
| EV | Electric vehicle |
| IC | Incremental capacity |
| LAM | Loss of active material |
| LFP | Lithium iron phosphate |
| LI | Lithium inventory |
| LLI | Loss of lithium inventory |
| NCA | Lithium nickel cobalt aluminum oxide |
| NE | Negative electrode |
| NEP | Negative electrode potential |
| NMC | Nickel manganese cobalt oxide |
| OCV | Open circuit voltage |
| SEI | Solid electrolyte interface |
| SOH | State of health |
| SOC | State of charge |
| VRP | Voltage relaxation profile |
References
- Anseán, D.; Gonzalez, M.; Viera, J.C.; García, V.; Blanco, C.; Valledor, M. Fast charging technique for high power lithium iron phosphate batteries: A cycle life analysis. J. Power Sources 2013, 239, 9–15. [Google Scholar] [CrossRef]
- Guo, Z.; Liaw, B.; Qiu, X.; Gao, L.; Zhang, C. Optimal charging method for lithium ion batteries using a universal voltage protocol accommodating aging. J. Power Sources 2015, 274, 957–964. [Google Scholar] [CrossRef]
- Legrand, N.; Knosp, B.; Desprez, P.; Lapicque, F.; Raël, S. Physical characterization of the charging process of a Li-ion battery and prediction of Li plating by electrochemical modelling. J. Power Sources 2014, 245, 208–216. [Google Scholar] [CrossRef]
- Anseán, D.; Dubarry, M.; Devie, A.; Liaw, B.; García, V.; Viera, J.; González, M. Operando lithium plating quantification and early detection of a commercial LiFePO4 cell cycled under dynamic driving schedule. J. Power Sources 2017, 356, 36–46. [Google Scholar] [CrossRef] [Green Version]
- Yang, X.-G.; Leng, Y.; Zhang, G.; Ge, S.; Wang, C.-Y. Modeling of lithium plating induced aging of lithium-ion batteries: Transition from linear to nonlinear aging. J. Power Sources 2017, 360, 28–40. [Google Scholar] [CrossRef]
- Smart, M.C.; Ratnakumar, B.V. Effects of Electrolyte Composition on Lithium Plating in Lithium-Ion Cells. J. Electrochem. Soc. 2011, 158, A379. [Google Scholar] [CrossRef]
- Waldmann, T.; Hogg, B.-I.; Kasper, M.; Grolleau, S.; Couceiro, C.G.; Trad, K.; Matadi, B.P.; Wohlfahrt-Mehrens, M. Interplay of Operational Parameters on Lithium Deposition in Lithium-Ion Cells: Systematic Measurements with Reconstructed 3-Electrode Pouch Full Cells. J. Electrochem. Soc. 2016, 163, A1232–A1238. [Google Scholar] [CrossRef]
- Vetter, J.; Novak, P.; Wagner, M.; Veit, C.; Möller, K.-C.; Besenhard, J.; Winter, M.; Wohlfahrt-Mehrens, M.; Vogler, C.; Hammouche, A. Ageing mechanisms in lithium-ion batteries. J. Power Sources 2005, 147, 269–281. [Google Scholar] [CrossRef]
- Birkl, C.R.; Roberts, M.R.; McTurk, E.; Bruce, P.G.; Howey, D.A. Degradation diagnostics for lithium ion cells. J. Power Sources 2017, 341, 373–386. [Google Scholar] [CrossRef]
- Sarasketa-Zabala, E.; Aguesse, F.; Villarreal, I.; Rodríguez-Martínez, L.M.; López, C.M.; Kubiak, P. Understanding Lithium Inventory Loss and Sudden Performance Fade in Cylindrical Cells during Cycling with Deep-Discharge Steps. J. Phys. Chem. C 2014, 119, 896–906. [Google Scholar] [CrossRef]
- Waldmann, T.; Hogg, B.-I.; Wohlfahrt-Mehrens, M. Li plating as unwanted side reaction in commercial Li-ion cells—A review. J. Power Sources 2018, 384, 107–124. [Google Scholar] [CrossRef]
- Uhlmann, C.; Illig, J.; Ender, M.; Schuster, R.; Ivers-Tiffée, E. In situ detection of lithium metal plating on graphite in experimental cells. J. Power Sources 2015, 279, 428–438. [Google Scholar] [CrossRef]
- Park, H.; Yoon, T.; Kim, Y.; Gil Lee, J.; Kim, J.; Kim, H.-S.; Ryu, J.H.; Kim, J.J.; Oh, S.M.; Lee, J.G. Thermal Behavior of Solid Electrolyte Interphase Films Deposited on Graphite Electrodes with Different States-of-Charge. J. Electrochem. Soc. 2015, 162, A892–A896. [Google Scholar] [CrossRef]
- Collins, J.; Gourdin, G.; Foster, M.; Qu, D. Carbon surface functionalities and SEI formation during Li intercalation. Carbon 2015, 92, 193–244. [Google Scholar] [CrossRef]
- Bitzer, B.; Gruhle, A. A new method for detecting lithium plating by measuring the cell thickness. J. Power Sources 2014, 262, 297–302. [Google Scholar] [CrossRef]
- Dubarry, M.; Truchot, C.; Liaw, B.; Gering, K.; Sazhin, S.; Jamison, D.; Michelbacher, C. Evaluation of commercial lithium-ion cells based on composite positive electrode for plug-in hybrid electric vehicle applications. Part II. Degradation mechanism under 2C cycle aging. J. Power Sources 2011, 196, 10336–10343. [Google Scholar] [CrossRef]
- Dubarry, M.; Truchot, C.; Cugnet, M.; Liaw, B.Y.; Gering, K.; Sazhin, S.; Jamison, D.; Michelbacher, C. Evaluation of commercial lithium-ion cells based on composite positive electrode for plug-in hybrid electric vehicle applications. Part I: Initial characterizations. J. Power Sources 2011, 196, 10328–10335. [Google Scholar] [CrossRef]
- Petzl, M.; Kasper, M.; Danzer, M.A. Lithium plating in a commercial lithium-ion battery—A low-temperature aging study. J. Power Sources 2015, 275, 799–807. [Google Scholar] [CrossRef]
- Dubarry, M.; Liaw, B. Identify capacity fading mechanism in a commercial LiFePO4 cell. J. Power Sources 2009, 194, 541–549. [Google Scholar] [CrossRef]
- Smith, A.J.; Dahn, J.R. Delta Differential Capacity Analysis. J. Electrochem. Soc. 2012, 159, A290–A293. [Google Scholar] [CrossRef]
- Dubarry, M.; Truchot, C.; Liaw, B. Synthesize battery degradation modes via a diagnostic and prognostic model. J. Power Sources 2012, 219, 204–216. [Google Scholar] [CrossRef]
- Koleti, U.R.; Zhang, C.; Malik, R.; Dinh, T.Q.; Marco, J. The development of optimal charging strategies for lithium-ion batteries to prevent the onset of lithium plating at low ambient temperatures. J. Energy Storage 2019, 24, 100798. [Google Scholar] [CrossRef]
- Stroe, D.-I.; Swierczynski, M.J.; Stroe, A.-I.; Kær, S.K. Generalized Characterization Methodology for Performance Modelling of Lithium-Ion Batteries. Batteries 2016, 2, 37. [Google Scholar] [CrossRef] [Green Version]
- Birkl, C.R.; McTurk, E.; Roberts, M.R.; Bruce, P.G.; Howey, D.A. A Parametric Open Circuit Voltage Model for Lithium Ion Batteries. J. Electrochem. Soc. 2015, 162, A2271–A2280. [Google Scholar] [CrossRef] [Green Version]
- Waldmann, T.; Kasper, M.; Wohlfahrt-Mehrens, M. Optimization of Charging Strategy by Prevention of Lithium Deposition on Anodes in high-energy Lithium-ion Batteries—Electrochemical Experiments. Electrochim. Acta 2015, 178, 525–532. [Google Scholar] [CrossRef]
- Keil, P.; Jossen, A. Charging protocols for lithium-ion batteries and their impact on cycle life—An experimental study with different 18650 high-power cells. J. Energy Storage 2016, 6, 125–141. [Google Scholar] [CrossRef]
- Wilhelm, J.; Seidlmayer, S.; Keil, P.; Schuster, J.; Kriele, A.; Gilles, R.; Jossen, A. Cycling capacity recovery effect: A coulombic efficiency and post-mortem study. J. Power Sources 2017, 365, 327–338. [Google Scholar] [CrossRef]
- Koleti, U.R.; Zhang, C.; Quang Dinh, T.; Marco, J.; Amietszajew, T.; Malik, R. A new concept to improve the lithium plating detection sensitivity in lithium-ion batteries. Int. J. Smart Grid Clean Energy 2019, 8, 505–516. [Google Scholar]
- Von Lüders, C.; Zinth, V.; Erhard, S.V.; Osswald, P.J.; Hofmann, M.; Gilles, R.; Jossen, A. Lithium plating in lithium-ion batteries investigated by voltage relaxation and in situ neutron diffraction. J. Power Sources 2017, 342, 17–23. [Google Scholar] [CrossRef]
- Bach, T.; Schuster, S.F.; Fleder, E.; Müller, J.; Brand, M.J.; Lorrmann, H.; Jossen, A.; Sextl, G. Nonlinear aging of cylindrical lithium-ion cells linked to heterogeneous compression. J. Energy Storage 2016, 5, 212–223. [Google Scholar] [CrossRef]
- Gallagher, K.G.; Dees, D.W.; Jansen, A.; Abraham, D.P.; Kang, S.-H. A Volume Averaged Approach to the Numerical Modeling of Phase-Transition Intercalation Electrodes Presented for LixC6. J. Electrochem. Soc. 2012, 159, A2029–A2037. [Google Scholar] [CrossRef]
- Nitta, N.; Wu, F.; Lee, J.T.; Yushin, G. Li-ion battery materials: Present and future. Mater. Today 2015, 18, 252–264. [Google Scholar] [CrossRef]
- Lu, T.; Luo, Y.; Zhang, Y.; Luo, W.; Yan, L.; Xie, J. Degradation Analysis of Commercial Lithium-Ion Battery in Long-Term Storage. J. Electrochem. Soc. 2017, 164, A775–A784. [Google Scholar] [CrossRef]
- Ge, H.; Aoki, T.; Ikeda, N.; Suga, S.; Isobe, T.; Li, Z.; Tabuchi, Y.; Zhang, J. Investigating Lithium Plating in Lithium-Ion Batteries at Low Temperatures Using Electrochemical Model with NMR Assisted Parameterization. J. Electrochem. Soc. 2017, 164, A1050–A1060. [Google Scholar] [CrossRef]
- Stiaszny, B.; Ziegler, J.C.; Krauß, E.E.; Zhang, M.; Schmidt, J.P.; Ivers-Tiffée, E. Electrochemical characterization and post-mortem analysis of aged LiMn2O4–NMC/graphite lithium ion batteries part II: Calendar aging. J. Power Sources 2014, 258, 61–75. [Google Scholar] [CrossRef]
- Lewerenz, M.; Warnecke, A.; Sauer, D.U. Introduction of capacity difference analysis (CDA) for analyzing lateral lithium-ion flow to determine the state of covering layer evolution. J. Power Sources 2017, 354, 157–166. [Google Scholar] [CrossRef]
- Epding, B.; Rumberg, B.; Jahnke, H.; Stradtmann, I.; Kwade, A. Investigation of significant capacity recovery effects due to long rest periods during high current cyclic aging tests in automotive lithium ion cells and their influence on lifetime. J. Energy Storage 2019, 22, 249–256. [Google Scholar] [CrossRef]
- Han, X.; Ouyang, M.; Lu, L.; Li, J.; Zheng, Y.; Li, Z. A comparative study of commercial lithium ion battery cycle life in electrical vehicle: Aging mechanism identification. J. Power Sources 2014, 251, 38–54. [Google Scholar] [CrossRef]
- Mohanty, D.; Dahlberg, K.; King, D.M.; David, L.; Sefat, A.S.; Wood, D.L.; Daniel, C.; Dhar, S.; Mahajan, V.; Lee, M.; et al. Modification of Ni-Rich FCG NMC and NCA Cathodes by Atomic Layer Deposition: Preventing Surface Phase Transitions for High-Voltage Lithium-Ion Batteries. Sci. Rep. 2016, 6, 26532. [Google Scholar] [CrossRef] [Green Version]
- Petzl, M.; Danzer, M.A. Nondestructive detection, characterization, and quantification of lithium plating in commercial lithium-ion batteries. J. Power Sources 2014, 254, 80–87. [Google Scholar] [CrossRef]
- Sethuraman, V.; Van Winkle, N.; Abraham, D.; Bower, A.; Guduru, P.R. Real-time stress measurements in lithium-ion battery negative-electrodes. J. Power Sources 2012, 206, 334–342. [Google Scholar] [CrossRef] [Green Version]
- Choi, J.; Ryou, M.-H.; Son, B.; Song, J.; Park, J.-K.; Cho, K.Y.; Lee, Y.M. Improved high-temperature performance of lithium-ion batteries through use of a thermally stable co-polyimide-based cathode binder. J. Power Sources 2014, 252, 138–143. [Google Scholar] [CrossRef]
- Lewerenz, M.; Warnecke, A.; Sauer, D.U. Post-mortem analysis on LiFePO 4 |Graphite cells describing the evolution & composition of covering layer on anode and their impact on cell performance. J. Power Sources 2017, 369, 122–132. [Google Scholar] [CrossRef]
- Marongiu, A.; Nlandi, N.; Rong, Y.; Sauer, D.U. On-board capacity estimation of lithium iron phosphate batteries by means of half-cell curves. J. Power Sources 2016, 324, 158–169. [Google Scholar] [CrossRef]


| Test Case | Cells Used (Group: Cell Marking) |
|---|---|
| Case 1: Cells aged under fast charging regime | Three new cells (set A: A1, A2, A3) |
| Case 2: Cells aged under less aggressive charging regime | Three new cells (set B: B1, B2, B3) |
| Test Sequence | Sub-Step No. | Exp. Setup | Current/Voltage | Control Limits |
|---|---|---|---|---|
| Step 1: Preconditioning tests | 1.1 | Soak to 25 °C | – | t > 4 h |
| 1.2 | Constant current charge | C/3 current | V > 4.2 V | |
| 1.3 | Constant voltage charge | 4.2 V | I < C/60 | |
| 1.4 | Rest | – | t > 1 h | |
| 1.5 | Constant current discharge | C/3 current | V < 2.5 V | |
| 1.6 | Constant voltage discharge | 2.5 V | I < C/60 | |
| 1.7 | Rest | – | t > 1 h | |
| 1.8 | Repeat steps 1.2 to 1.7 | – | Cycle number ≤ 6 | |
| Step 2: OCV tests before aging | 2.1 | Soak to 25 °C | – | t > 4 h |
| 2.2 | Constant current charge | C/10 current | V > 4.2 V | |
| 2.3 | Constant voltage charge | 4.2 V | I < C/60 | |
| 2.4 | Rest | – | t > 4 h | |
| 2.5 | Partial constant current discharge | C/20 current | ΔQ > Qnom/120 | |
| 2.6 | Rest | – | t > 1 h | |
| 2.7 | Repeat steps 2.5 & 2.6 until V limit reached | – | V < 2.5 V | |
| Step 3: Cell aging tests | 3.1 | Soak to 5 °C | – | t > 4 h |
| 3.2a: set A | Constant current charge | 1 C current | V > 4.2 V | |
| 3.2b: set A | Constant voltage charge | 4.2 V | I < C/4 | |
| 3.2a: set B | Constant current charge | 1 C current | V > 4.05 V | |
| 3.2b: set B | Constant voltage charge | 4.05 V | I < C/4 | |
| 3.2c: set B | Constant current charge | C/4 current | V > 4.2 V | |
| 3.3 | Rest | – | t > 4 h | |
| 3.4 | Constant current discharge | C/3 current | V < 2.5 V | |
| 3.5 | Rest | – | t > 1 h | |
| 3.6 | Repeat steps 3.2 to 3.5 until set A capacity drops to 80% | – | V < 2.5 V | |
| Step 4: OCV tests after aging | Follows the same procedure as step 2 |
| Test Case | SOH (%) | Cell Number | RMSE (mV) | Max Error (mV) |
|---|---|---|---|---|
| set A (aggressive charge profile) | 100 | 1 | 1.60 | 5.3 |
| 100 | 2 | 1.81 | 6.0 | |
| 100 | 3 | 1.81 | 6.0 | |
| 78.86 | 1 | 4.70 | 17.8 | |
| 84.39 | 2 | 3.80 | 12.2 | |
| 78.41 | 3 | 4.20 | 15.1 | |
| set B (less aggressive charge profile) | 100 | 1 | 1.89 | 5.5 |
| 100 | 2 | 1.71 | 5.7 | |
| 100 | 3 | 1.51 | 5.6 | |
| 93.94 | 1 | 2.01 | 7.9 | |
| 94.71 | 2 | 1.81 | 8.4 | |
| 93.76 | 3 | 1.99 | 7.2 |
© 2020 by the authors. Licensee MDPI, Basel, Switzerland. This article is an open access article distributed under the terms and conditions of the Creative Commons Attribution (CC BY) license (http://creativecommons.org/licenses/by/4.0/).
Share and Cite
Koleti, U.R.; Rajan, A.; Tan, C.; Moharana, S.; Dinh, T.Q.; Marco, J. A Study on the Influence of Lithium Plating on Battery Degradation. Energies 2020, 13, 3458. https://doi.org/10.3390/en13133458
Koleti UR, Rajan A, Tan C, Moharana S, Dinh TQ, Marco J. A Study on the Influence of Lithium Plating on Battery Degradation. Energies. 2020; 13(13):3458. https://doi.org/10.3390/en13133458
Chicago/Turabian StyleKoleti, Upender Rao, Ashwin Rajan, Chaou Tan, Sanghamitra Moharana, Truong Quang Dinh, and James Marco. 2020. "A Study on the Influence of Lithium Plating on Battery Degradation" Energies 13, no. 13: 3458. https://doi.org/10.3390/en13133458
APA StyleKoleti, U. R., Rajan, A., Tan, C., Moharana, S., Dinh, T. Q., & Marco, J. (2020). A Study on the Influence of Lithium Plating on Battery Degradation. Energies, 13(13), 3458. https://doi.org/10.3390/en13133458