Technoeconomic Analysis on a Hybrid Power System for the UK Household Using Renewable Energy: A Case Study


Abstract
1. Introduction
2. Methodology
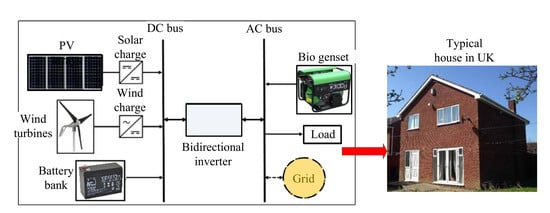
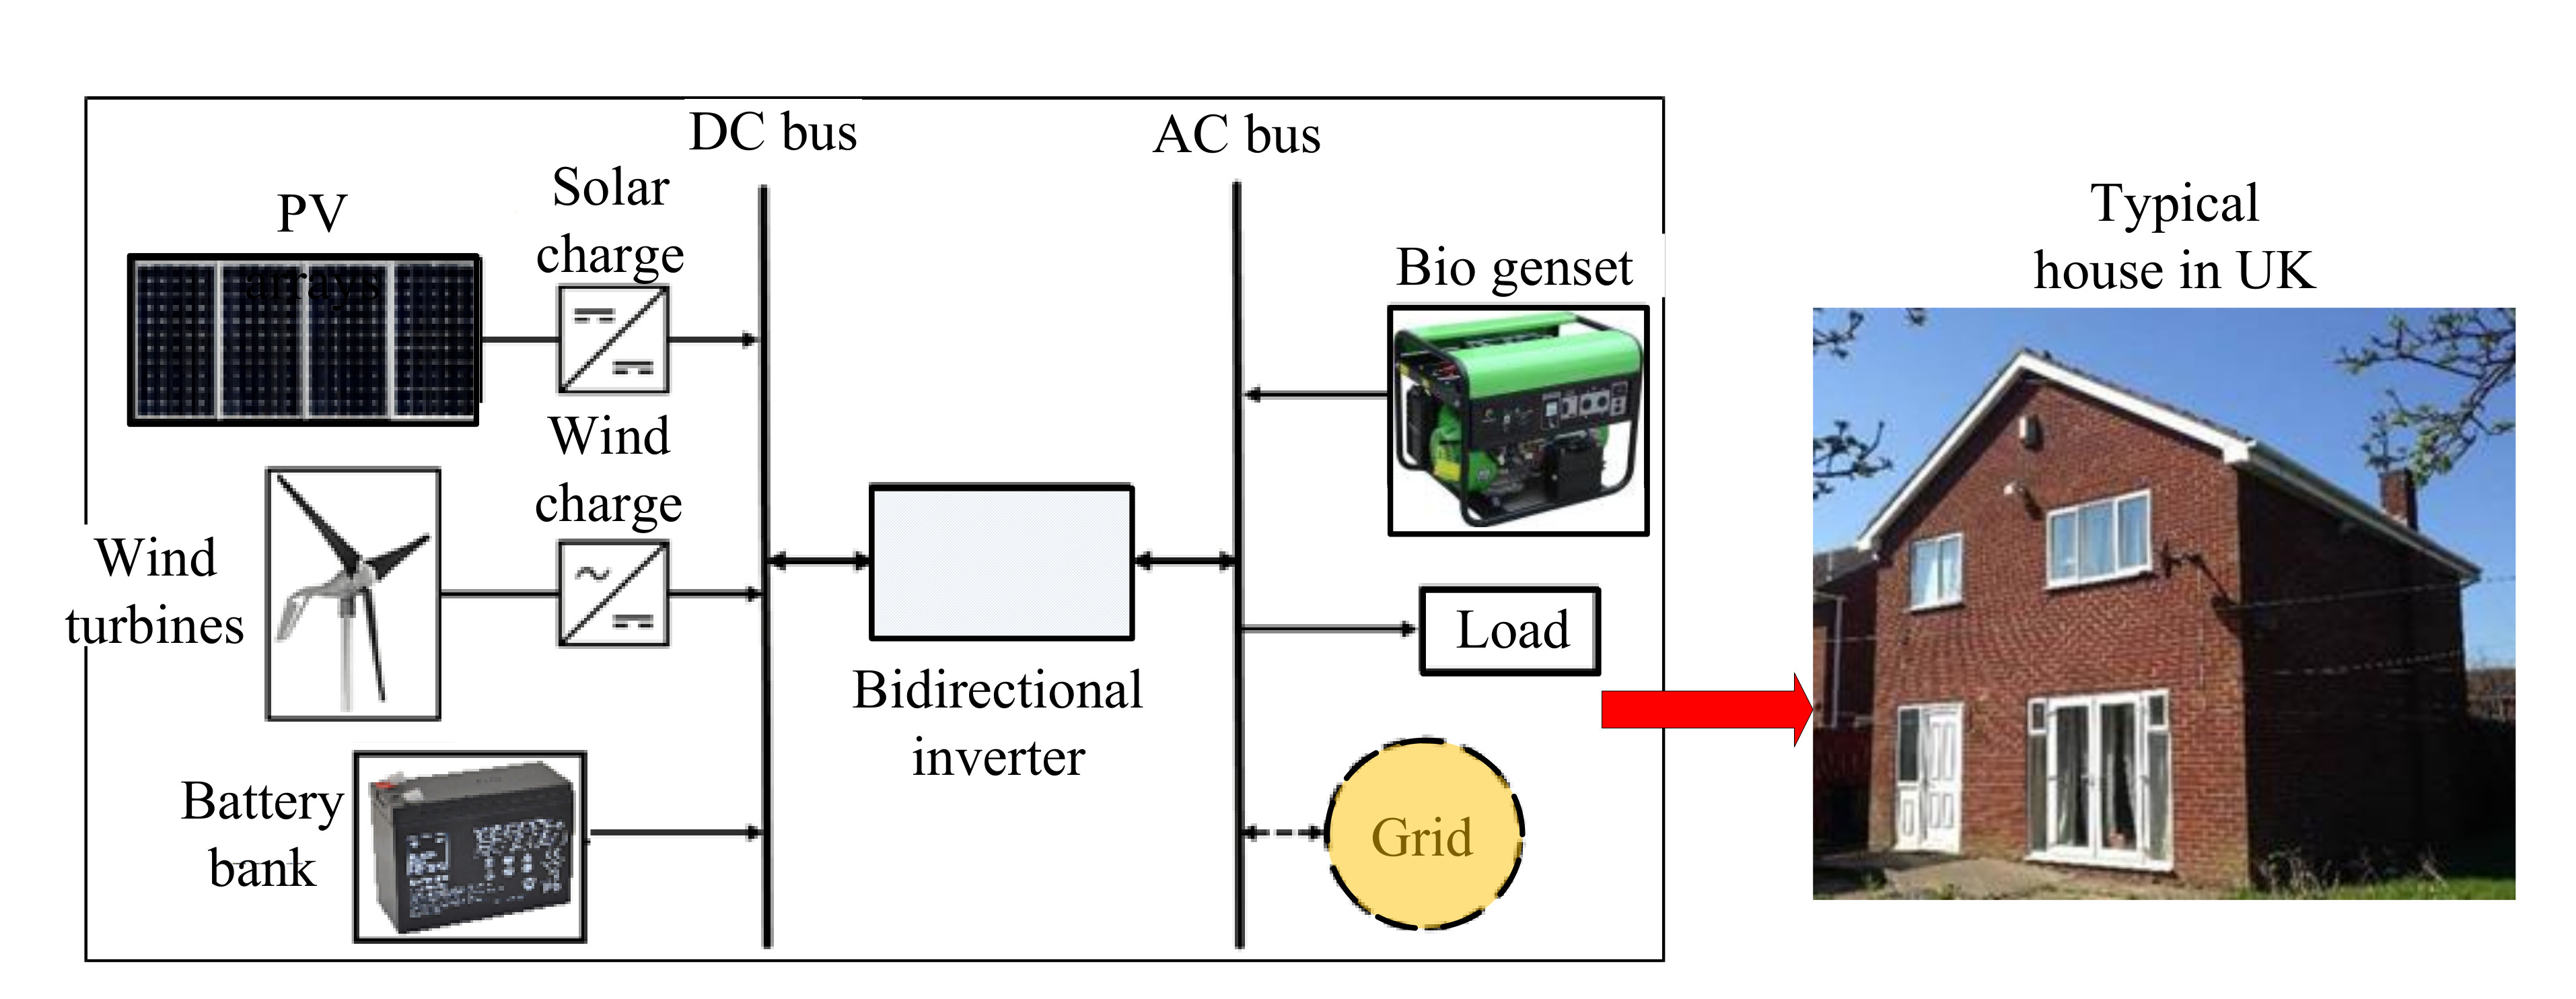
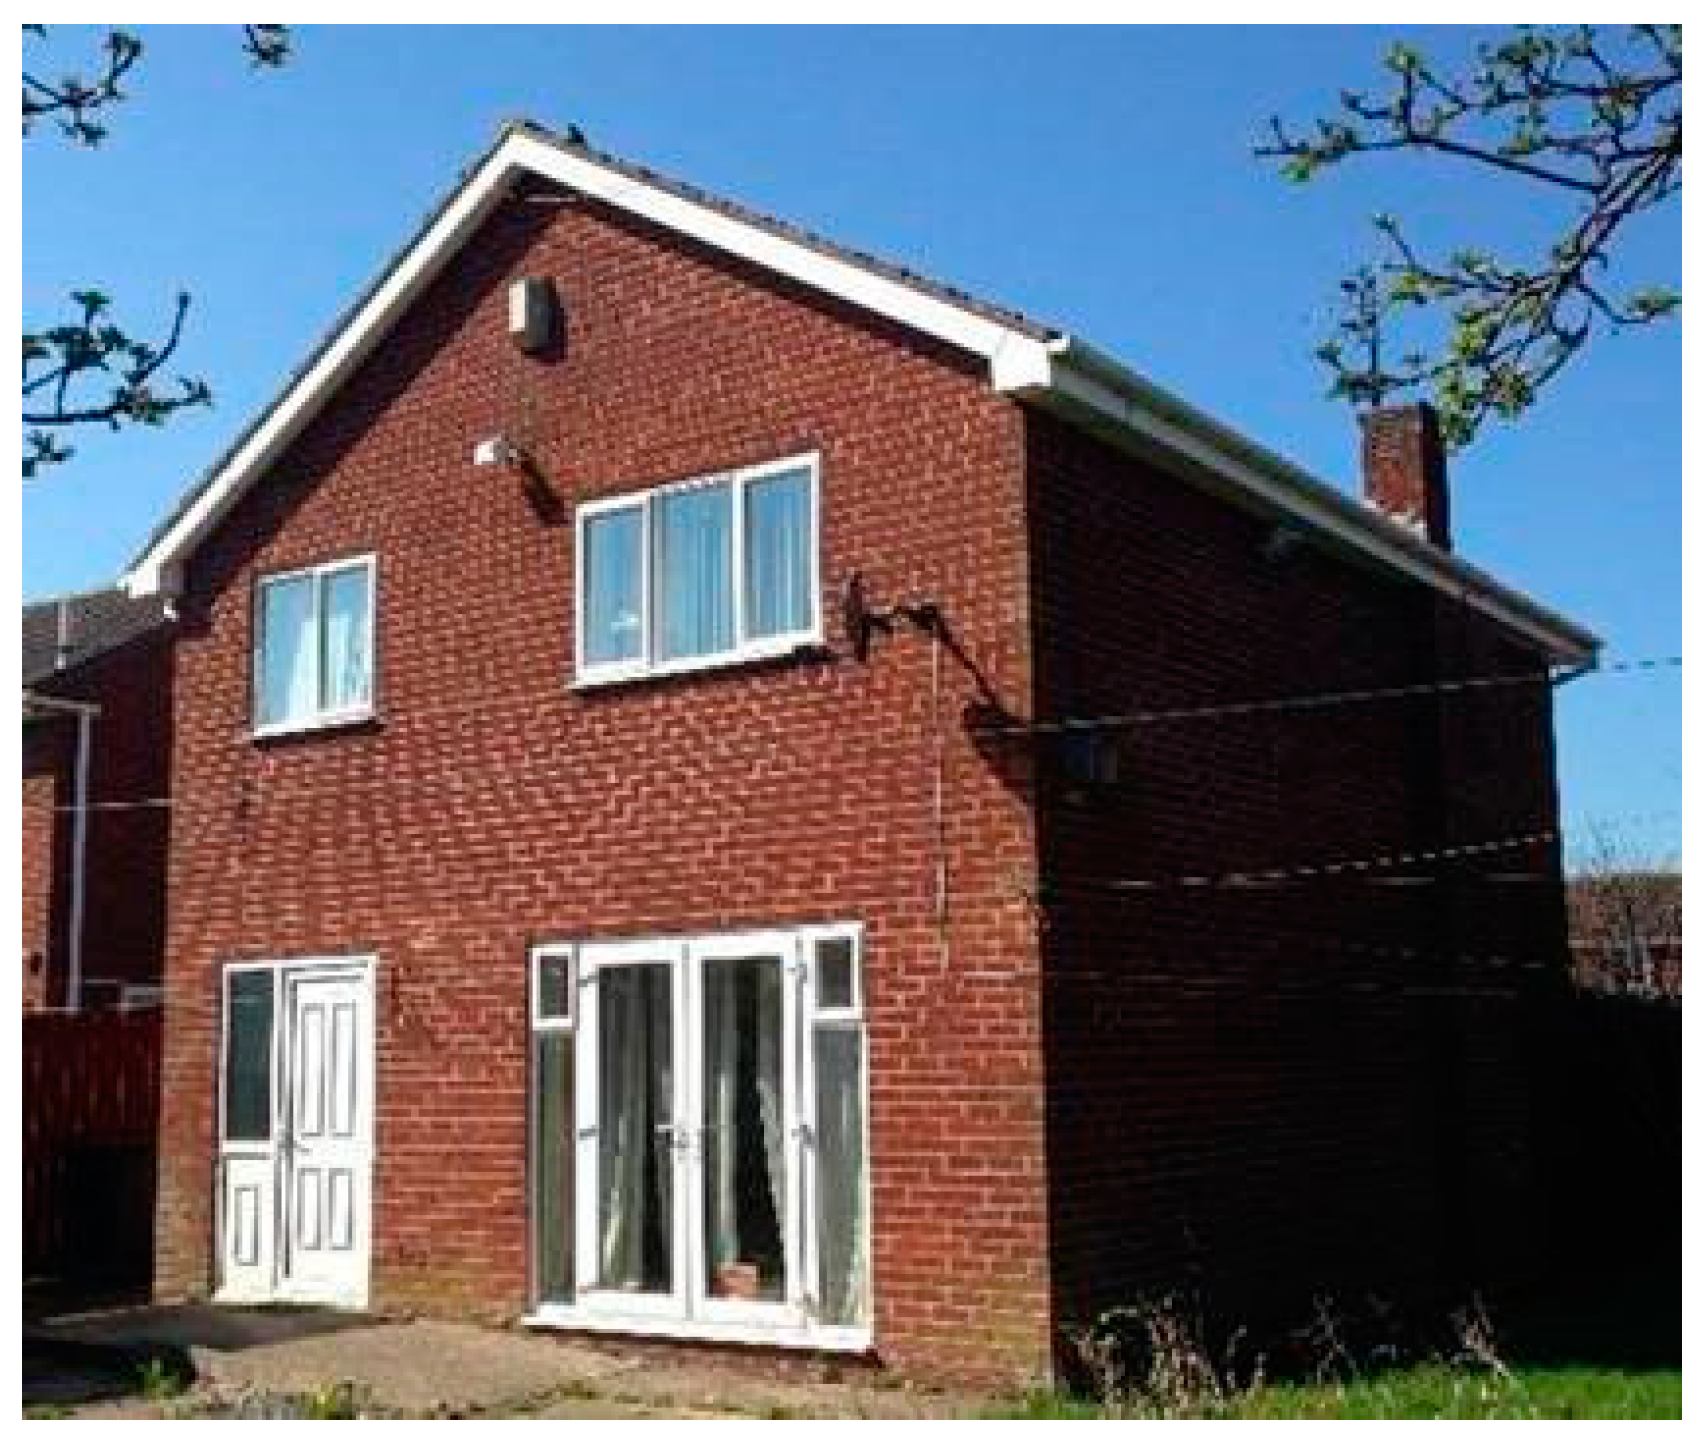
2.1. Description of the Case Study
2.2. Renewable Energy Potentials in Newcastle, UK
2.3. Data Collection and Analysis
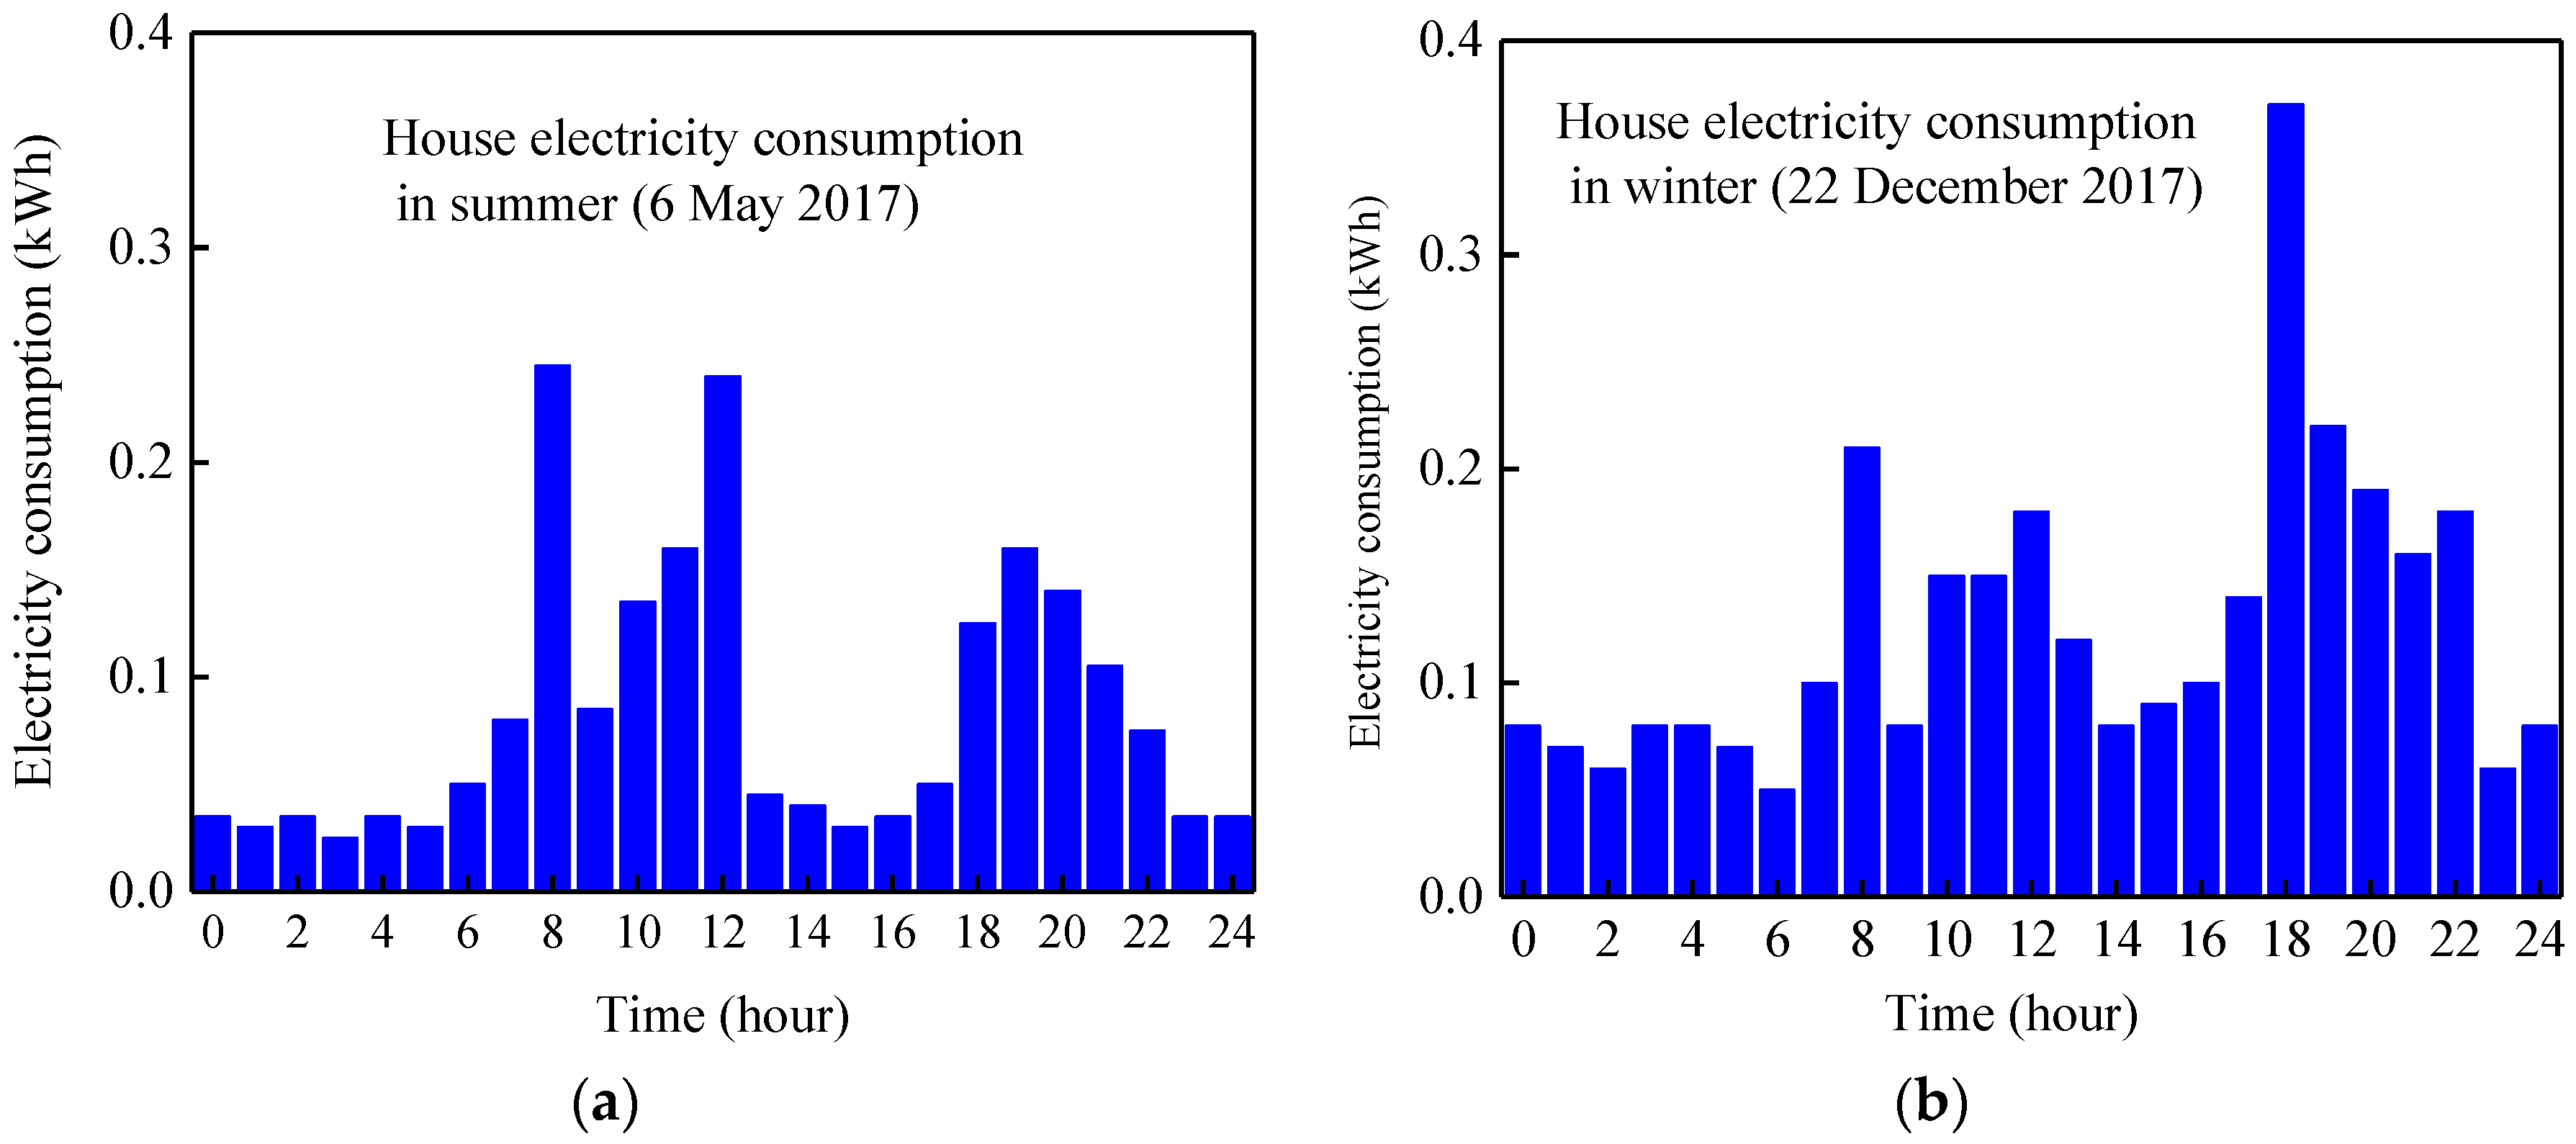
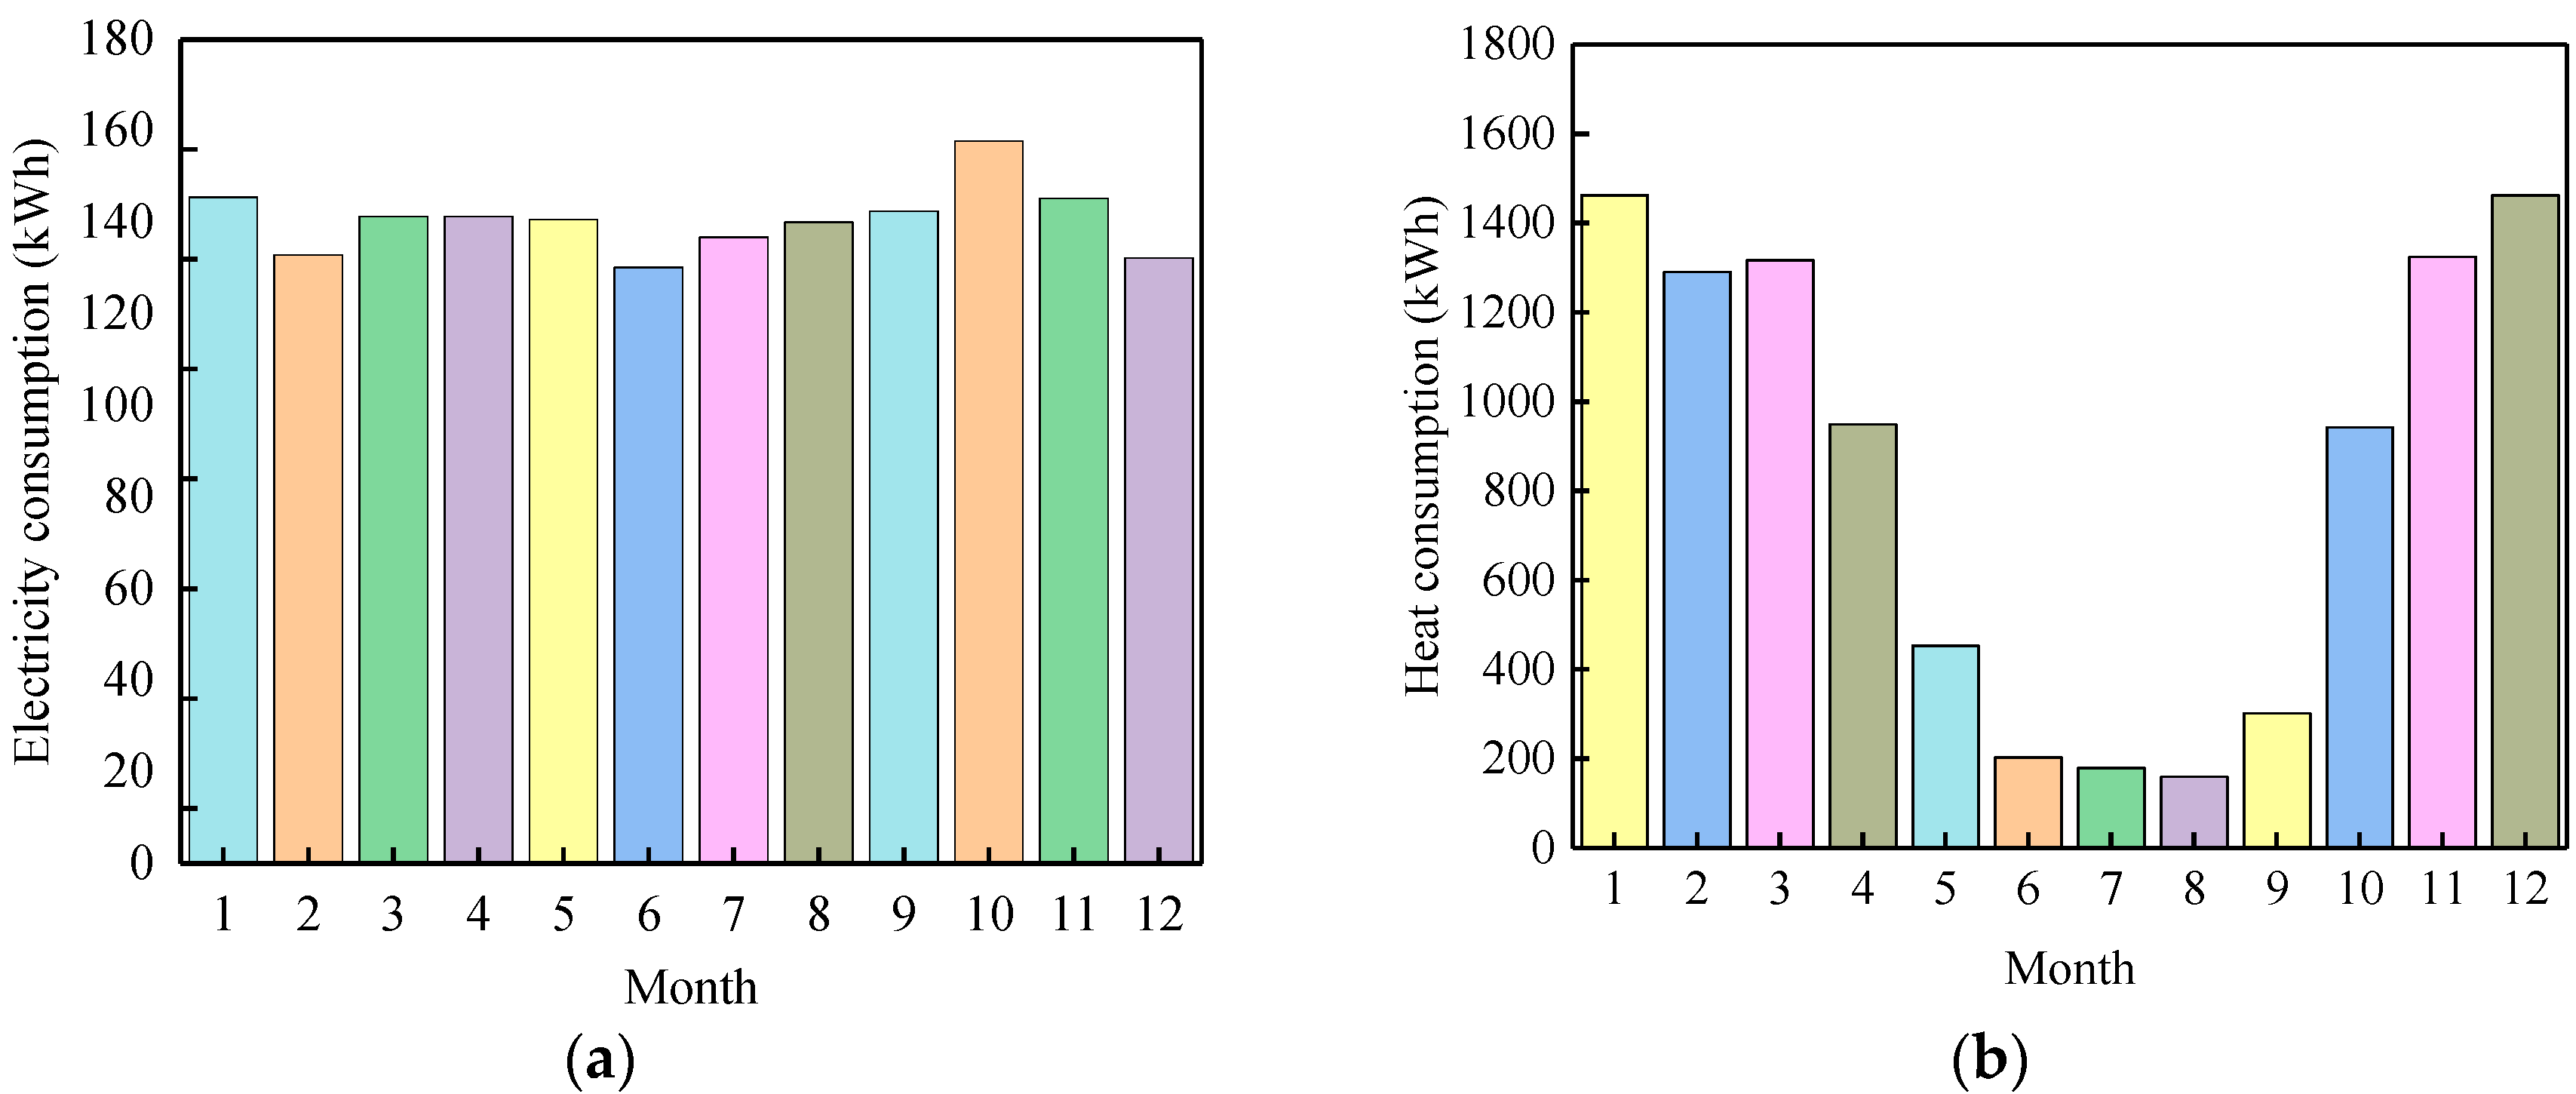
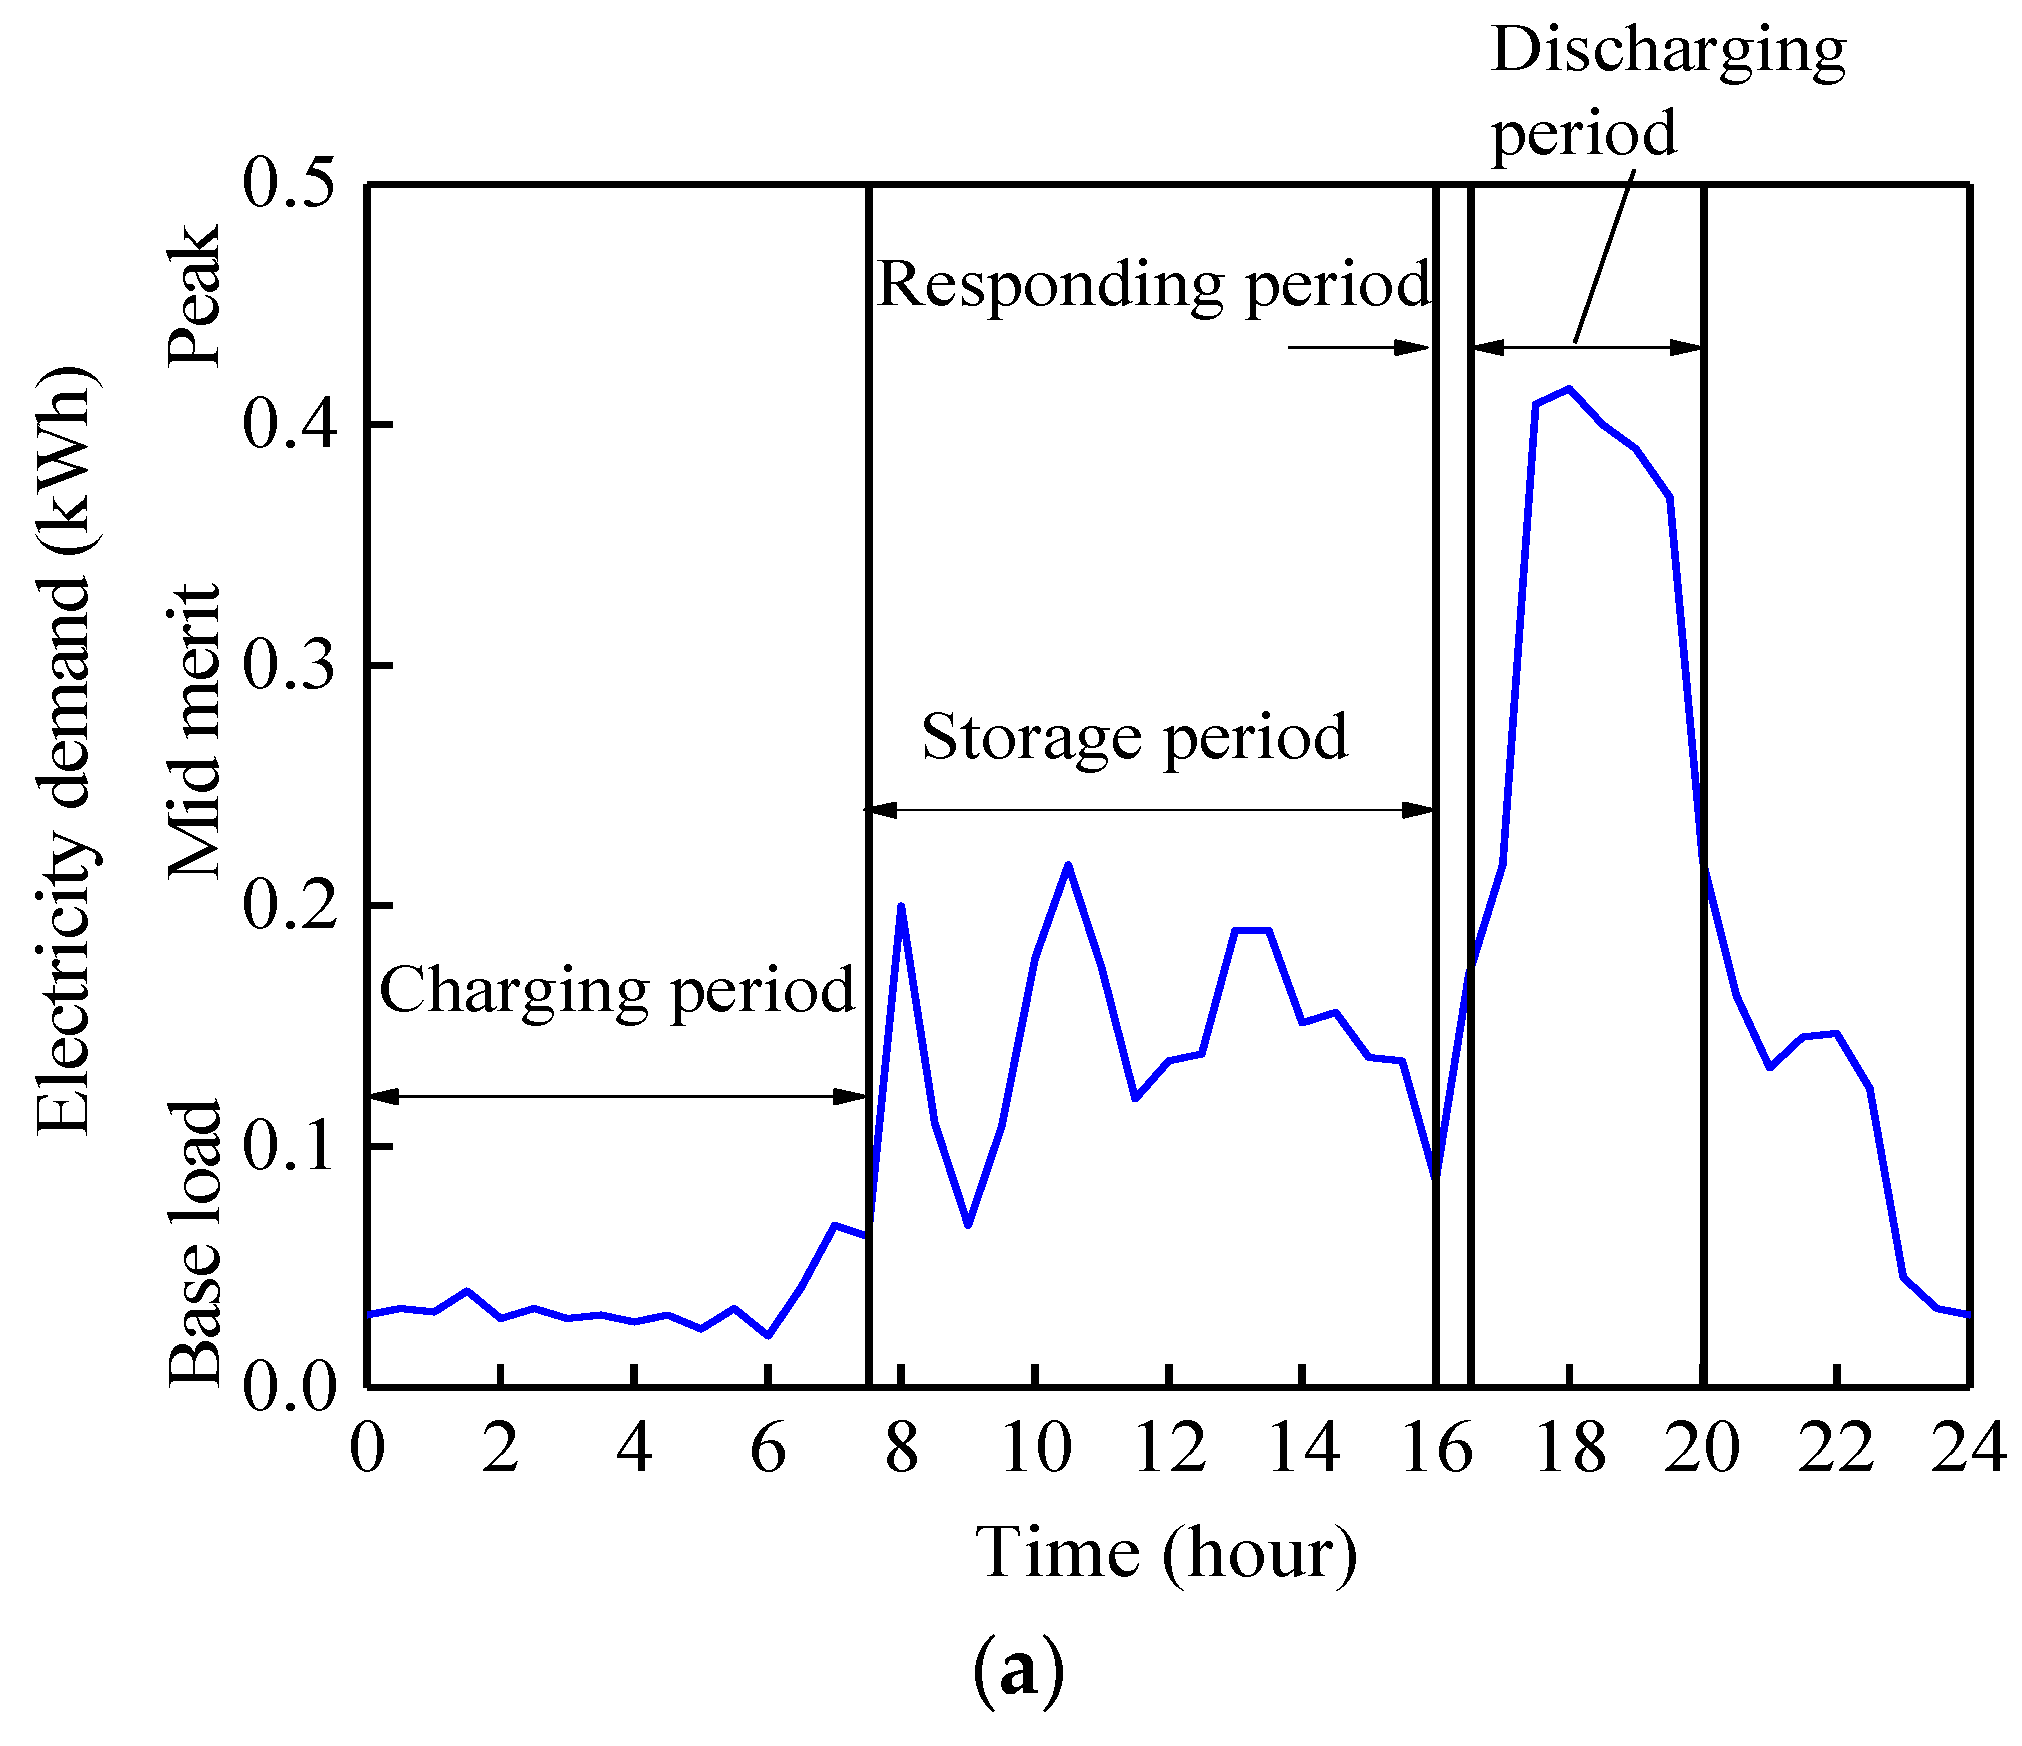
2.3.1. Electricity and Heat Consumption of the Selected House
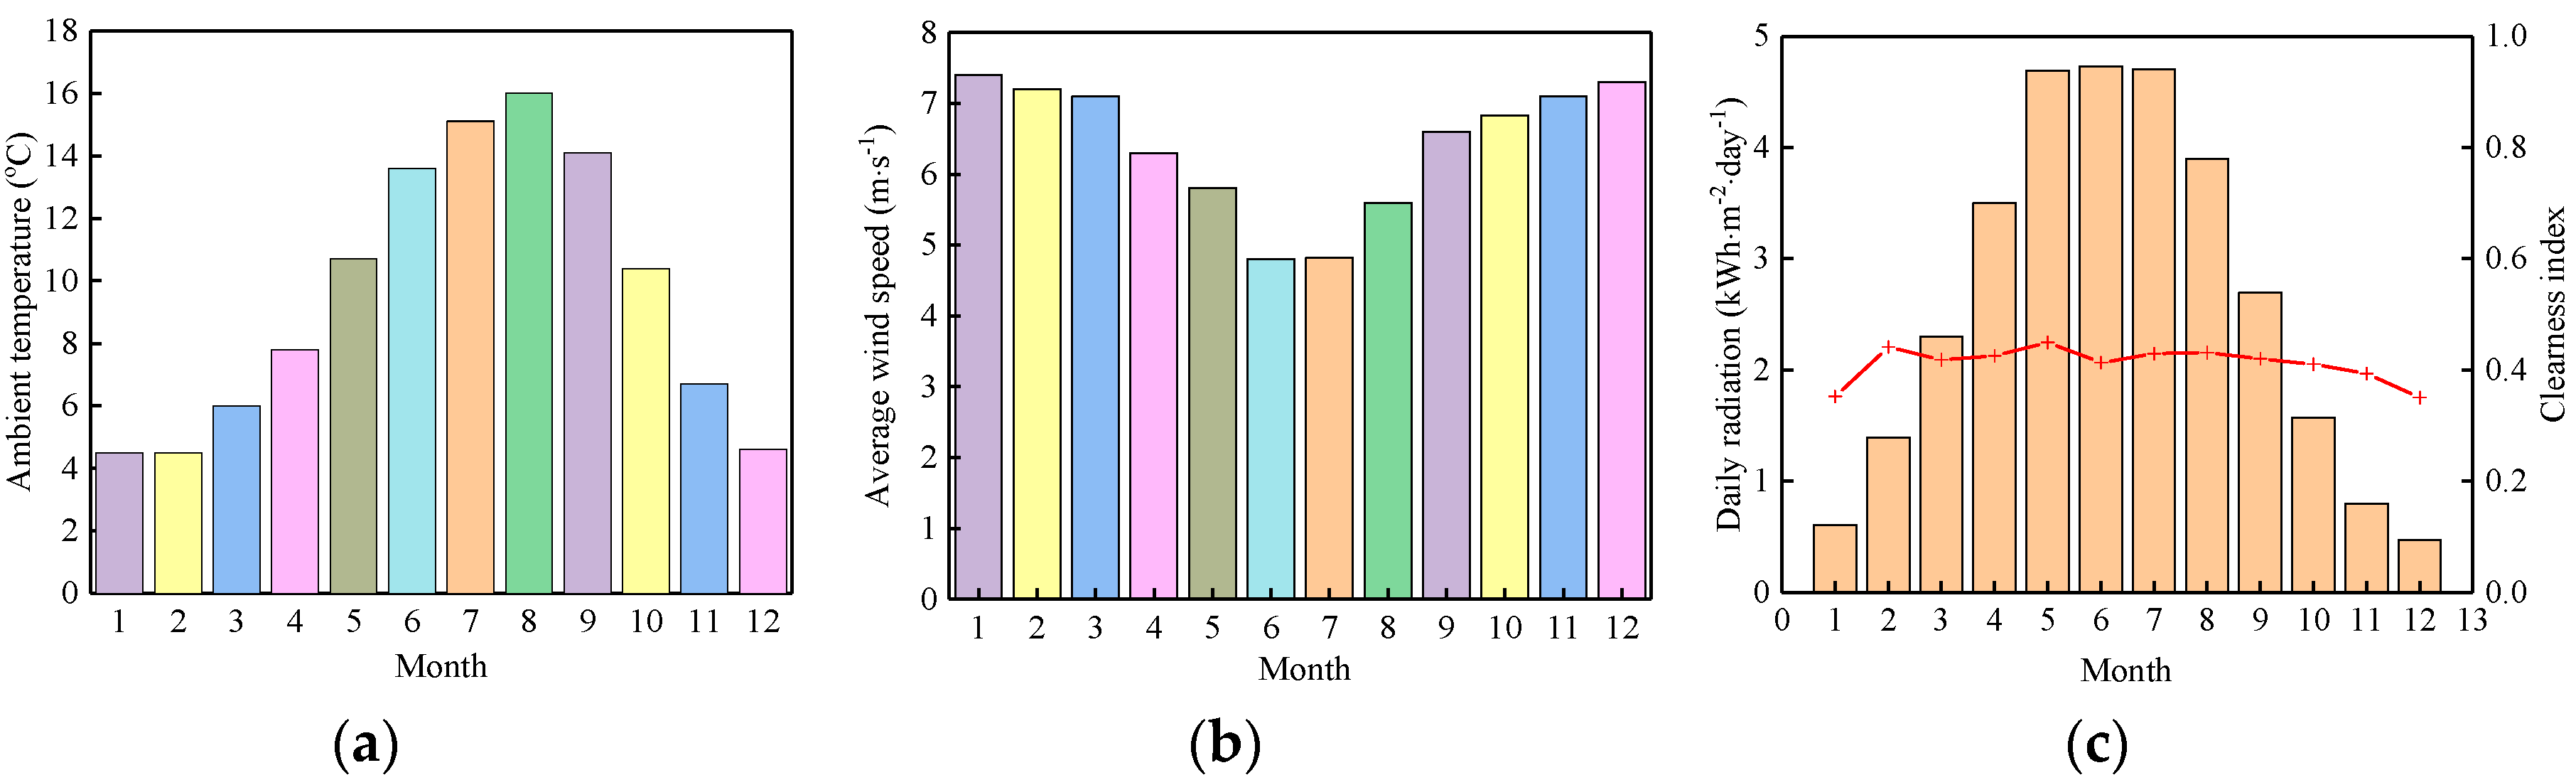
2.3.2. Weather Data
2.4. System Design and Configuration
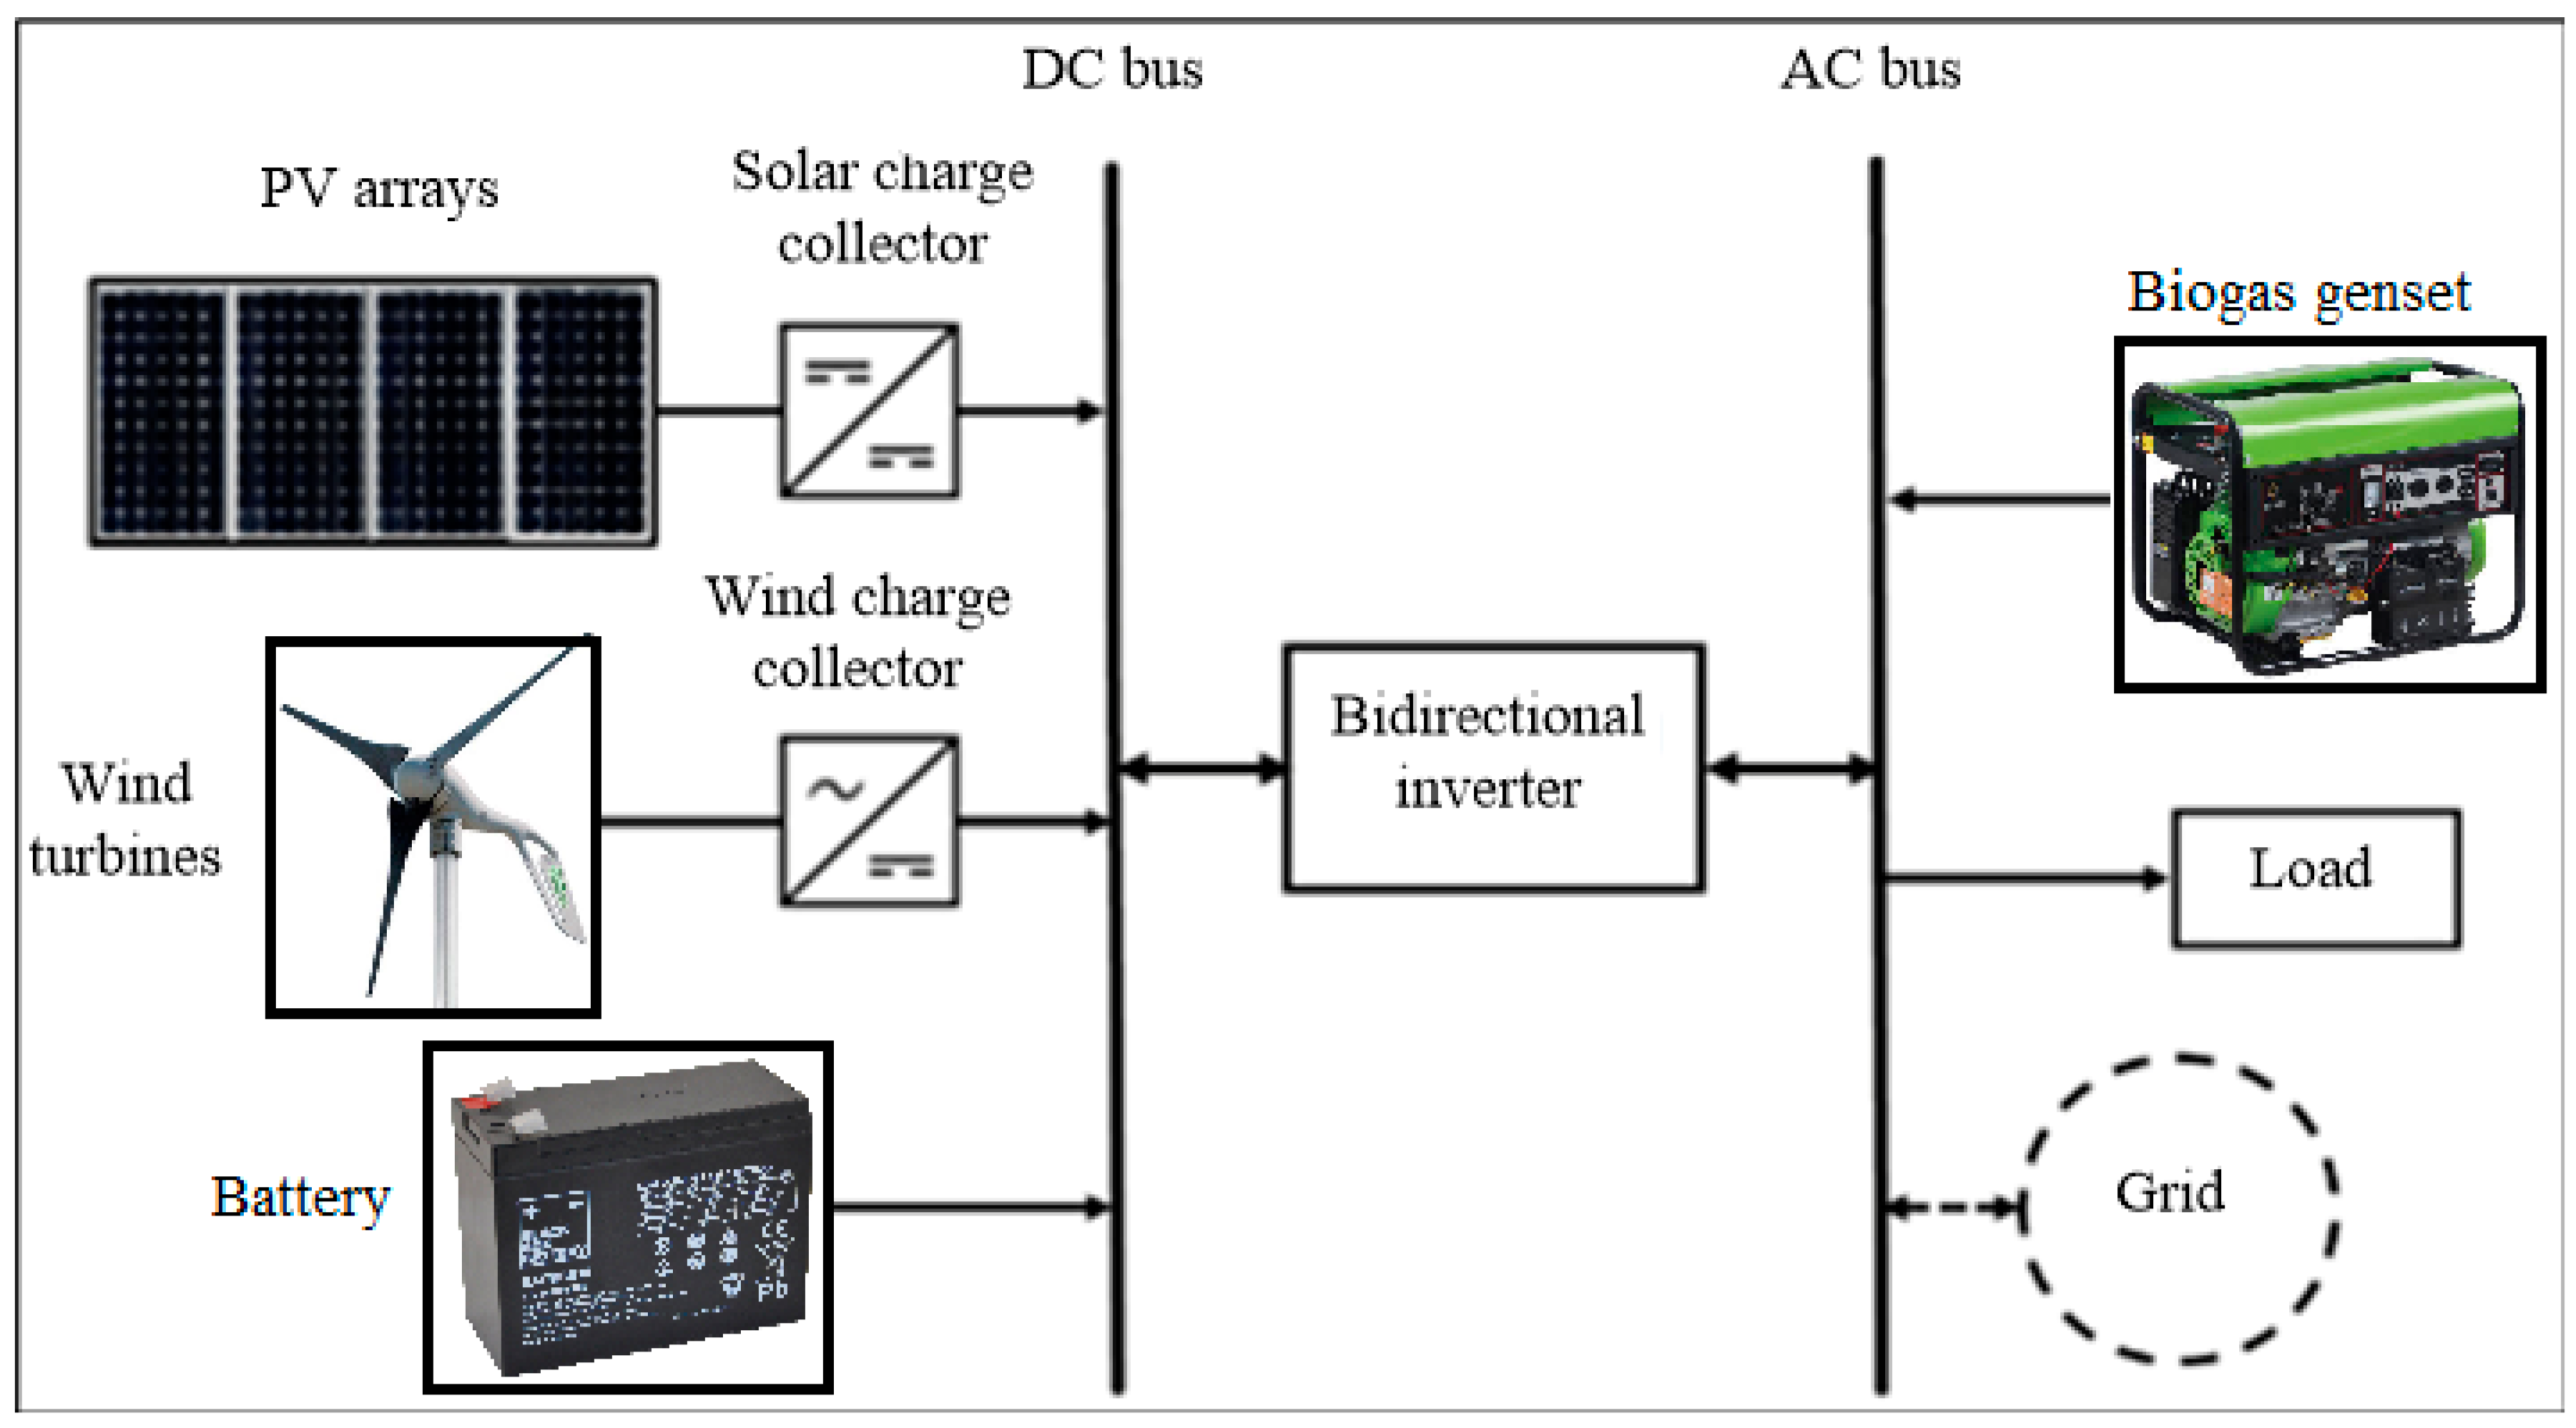
2.4.1. System Design
2.4.2. System Components
Electricity Supply
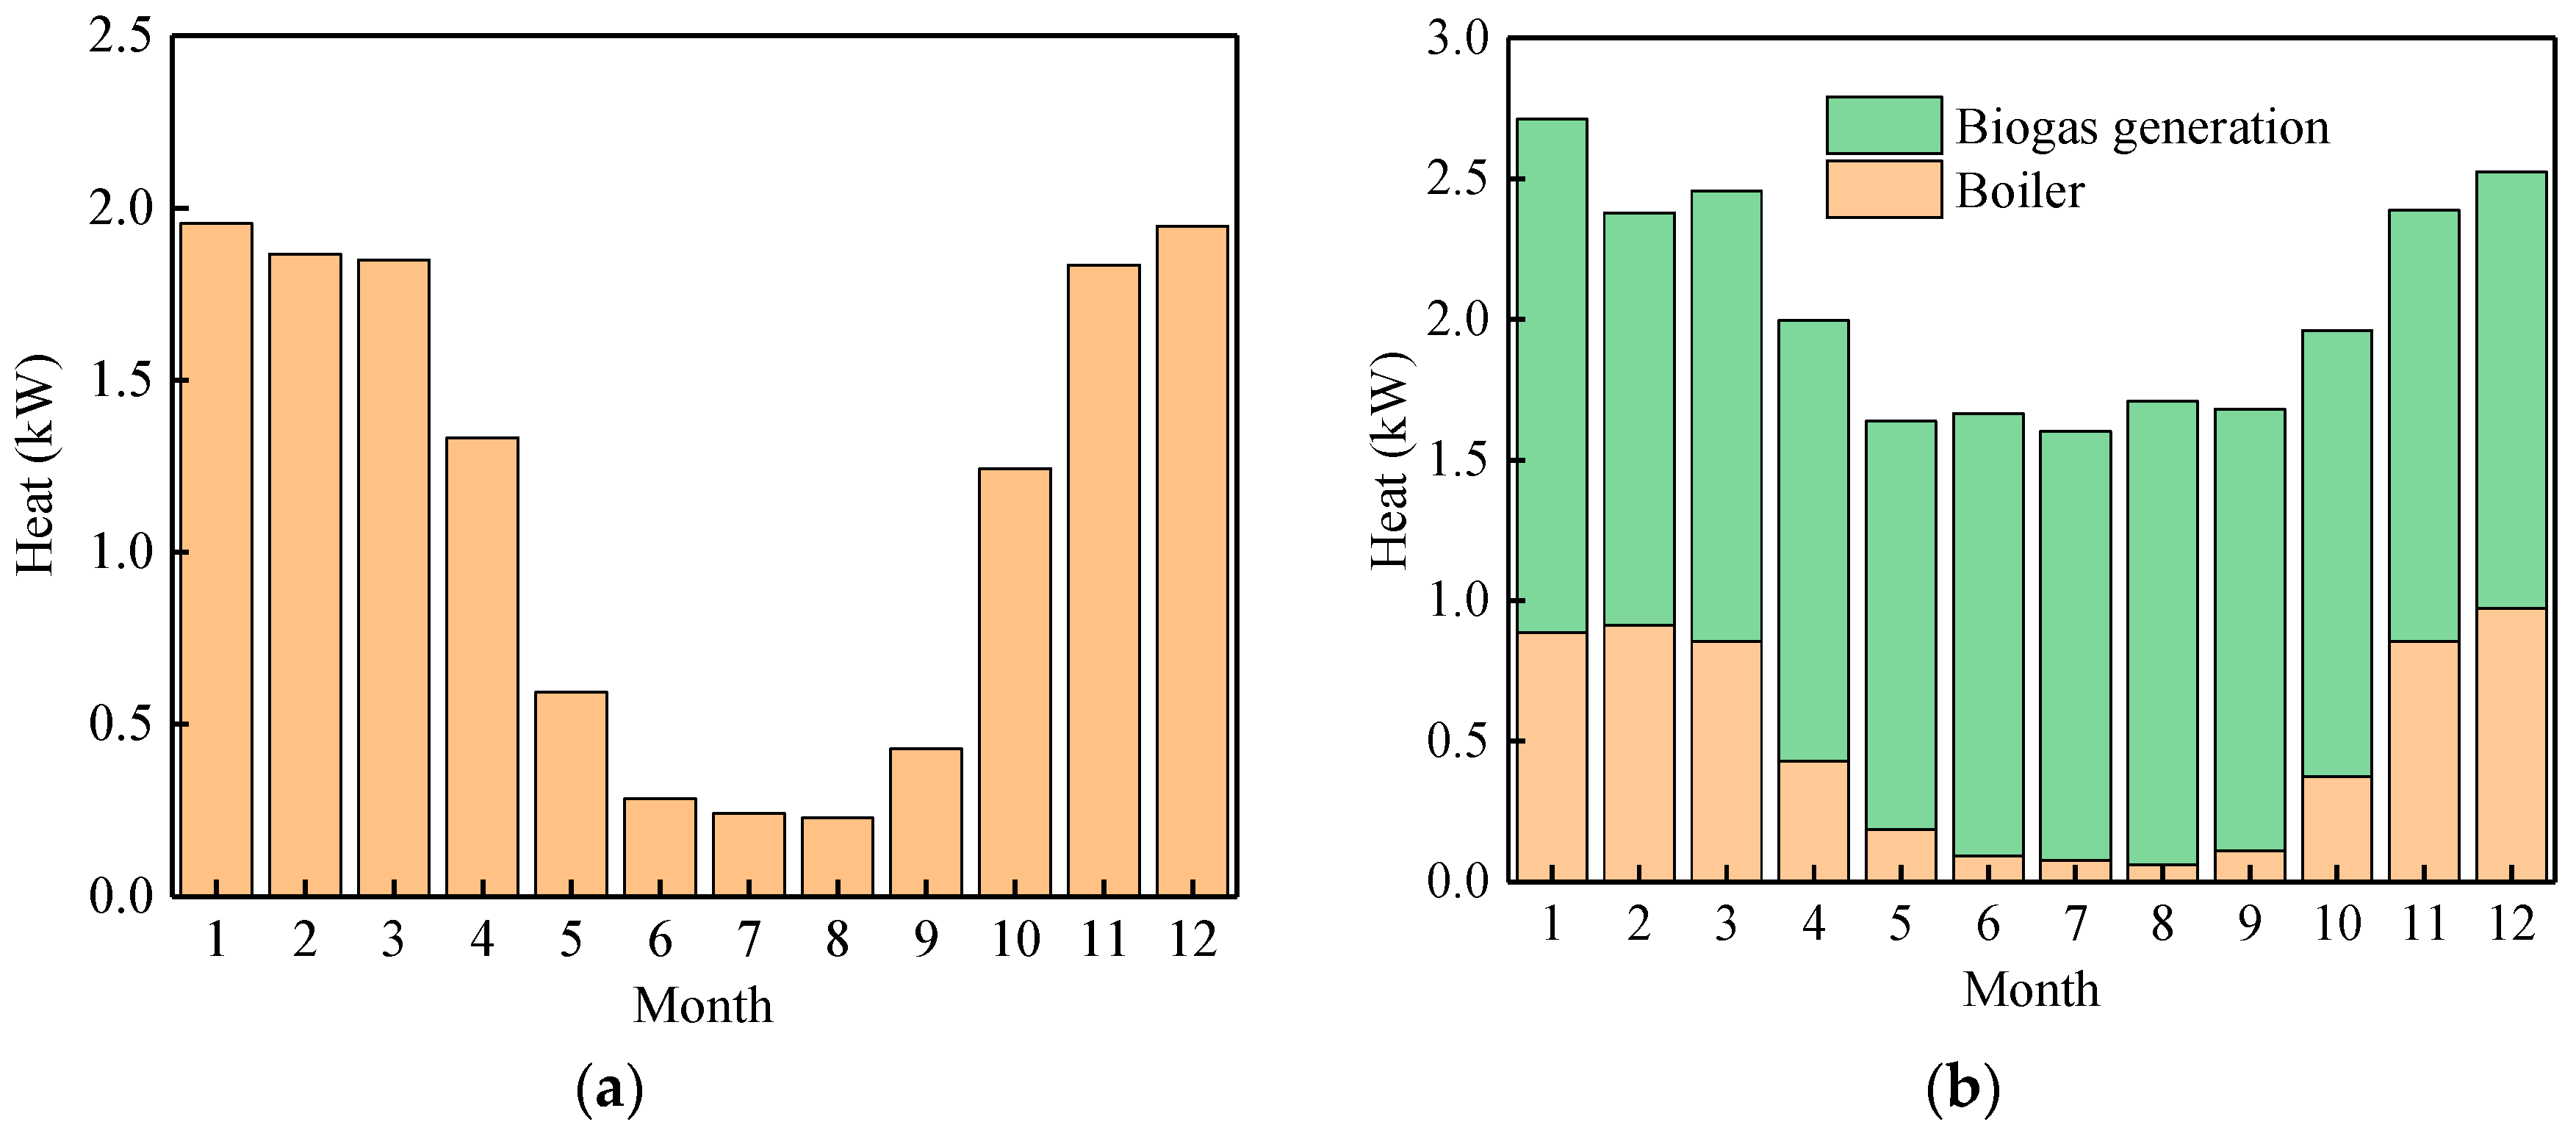
Heat Supply
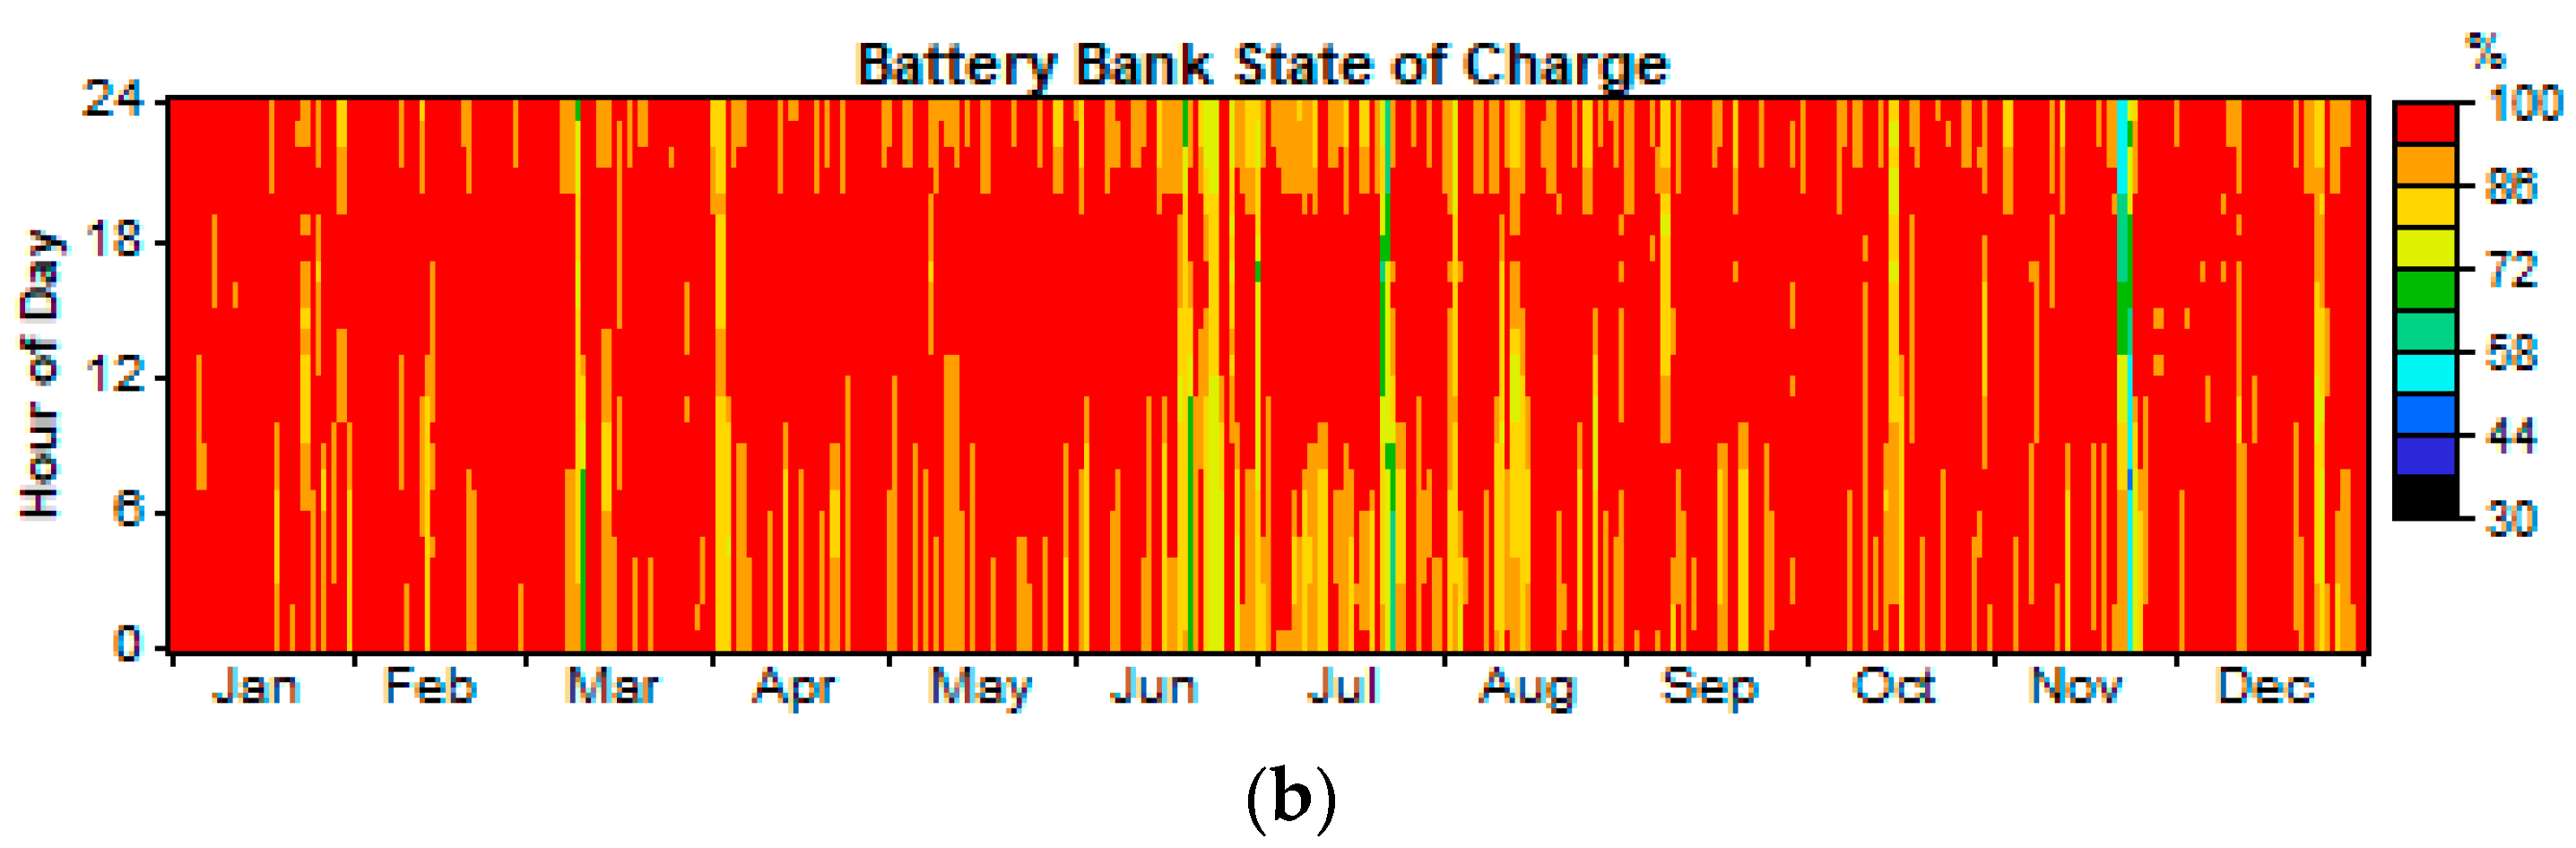
Storage Battery
DC and AC Converter
2.5. Economic Evaluation
3. Results and Discussion
4. Conclusions
- (1)
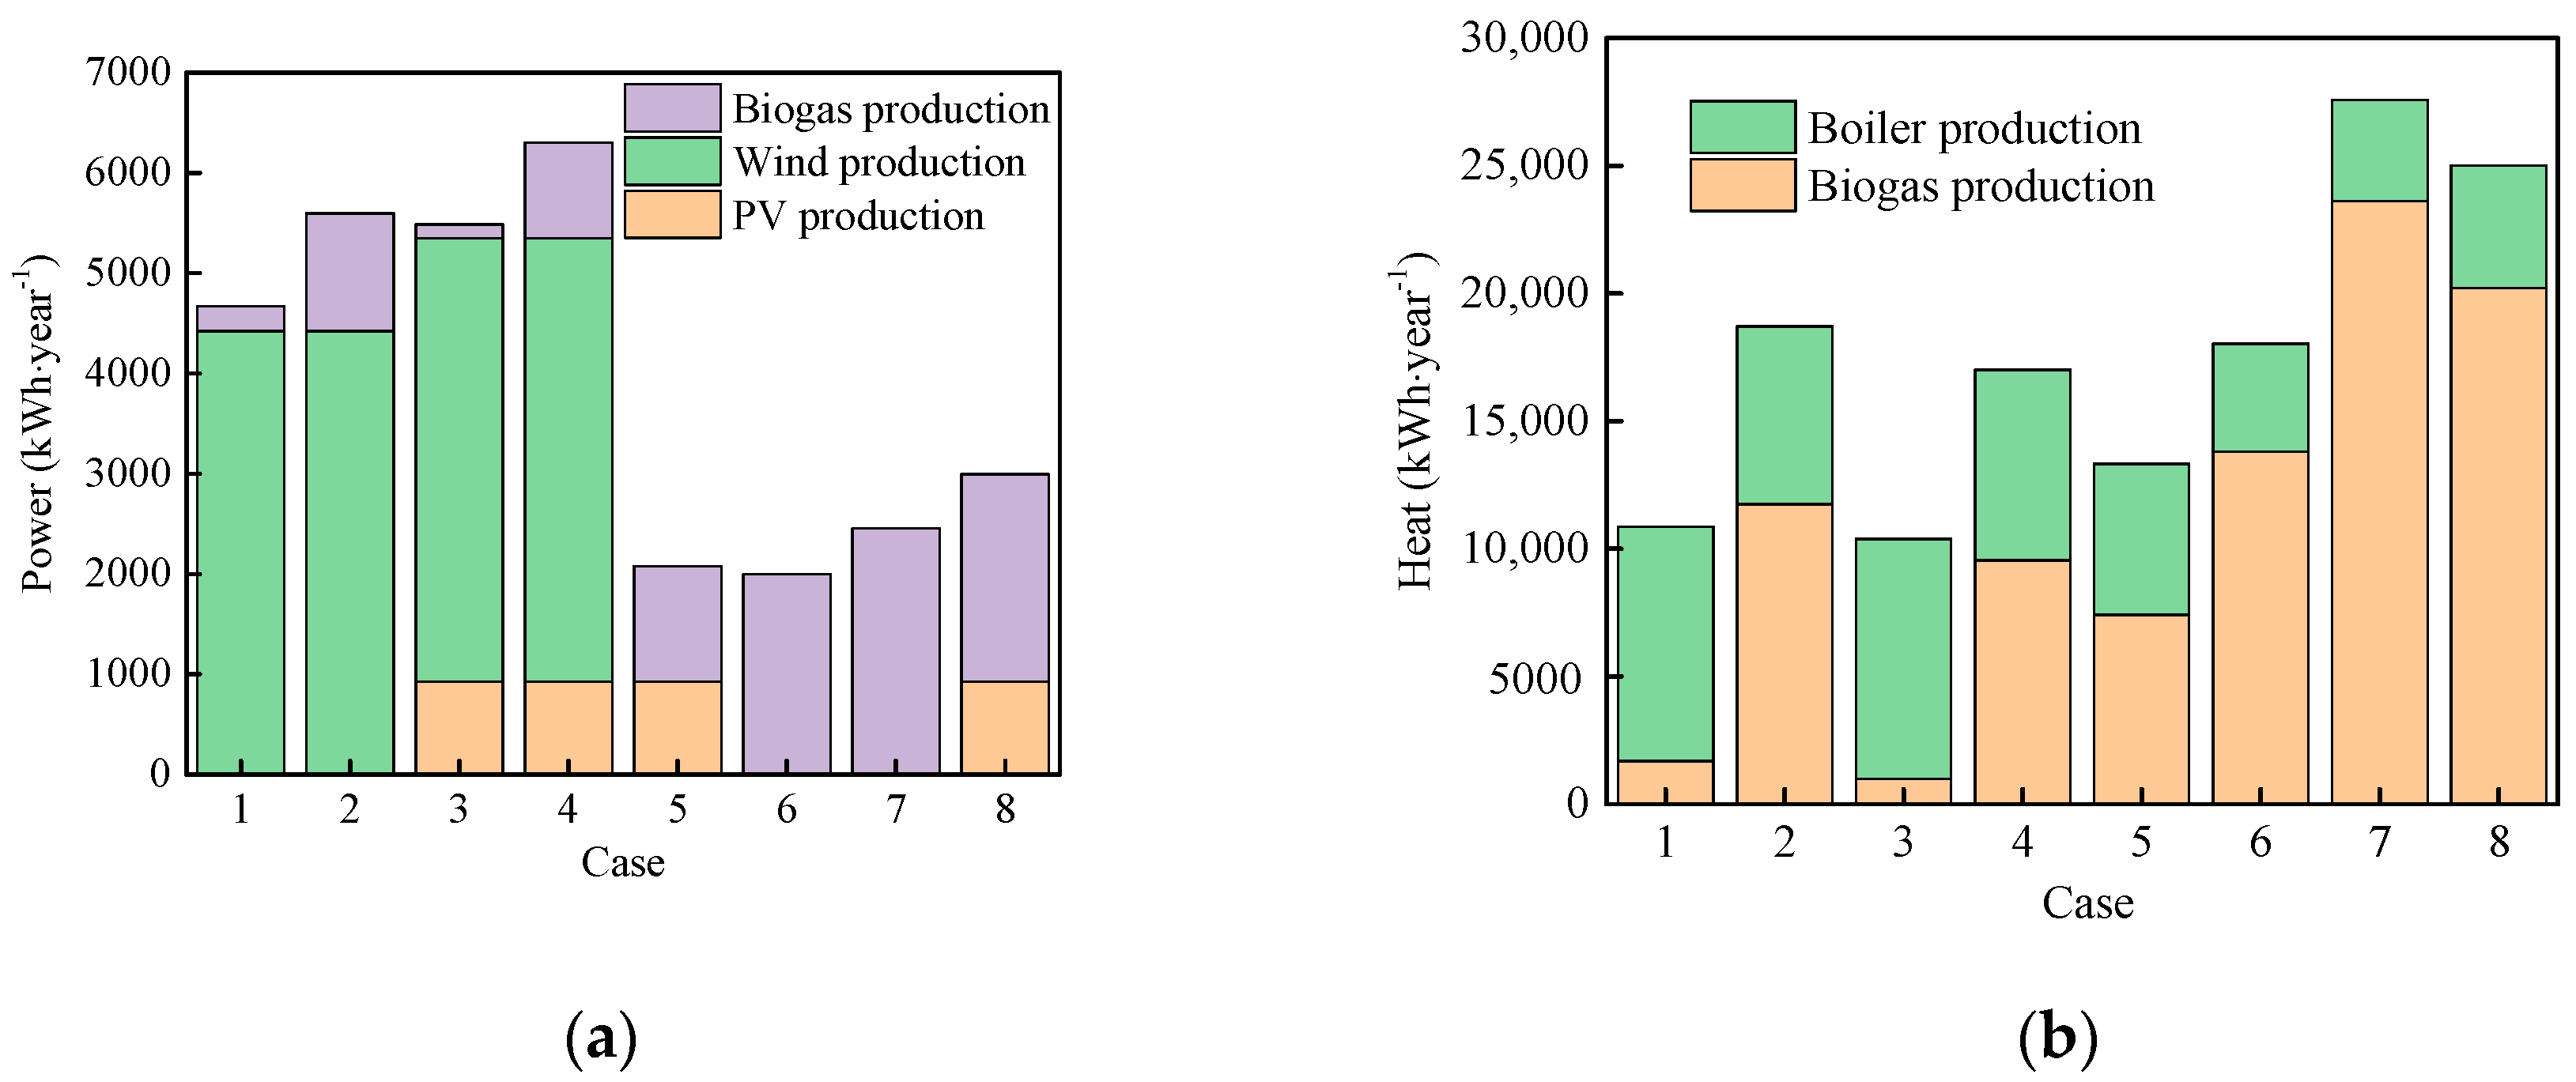
- Applying a hybrid distributed HRES, to meet the dynamic electrical power demand of a household, is feasible and rewarding since the power and heat are all supplied from renewables, i.e., wind bioenergy and solar.
- (2)
- The wind (1 kW capacity)-biogas-genset-battery system is the most optimal choice with appropriate NPC ($14,507) and the lowest COE ($0.588 kW−1·h−1). The system can also provide the heat of 2227 kWh from the biogas genset, which can save 19.9% of the total heat supply by the boiler.
- (3)
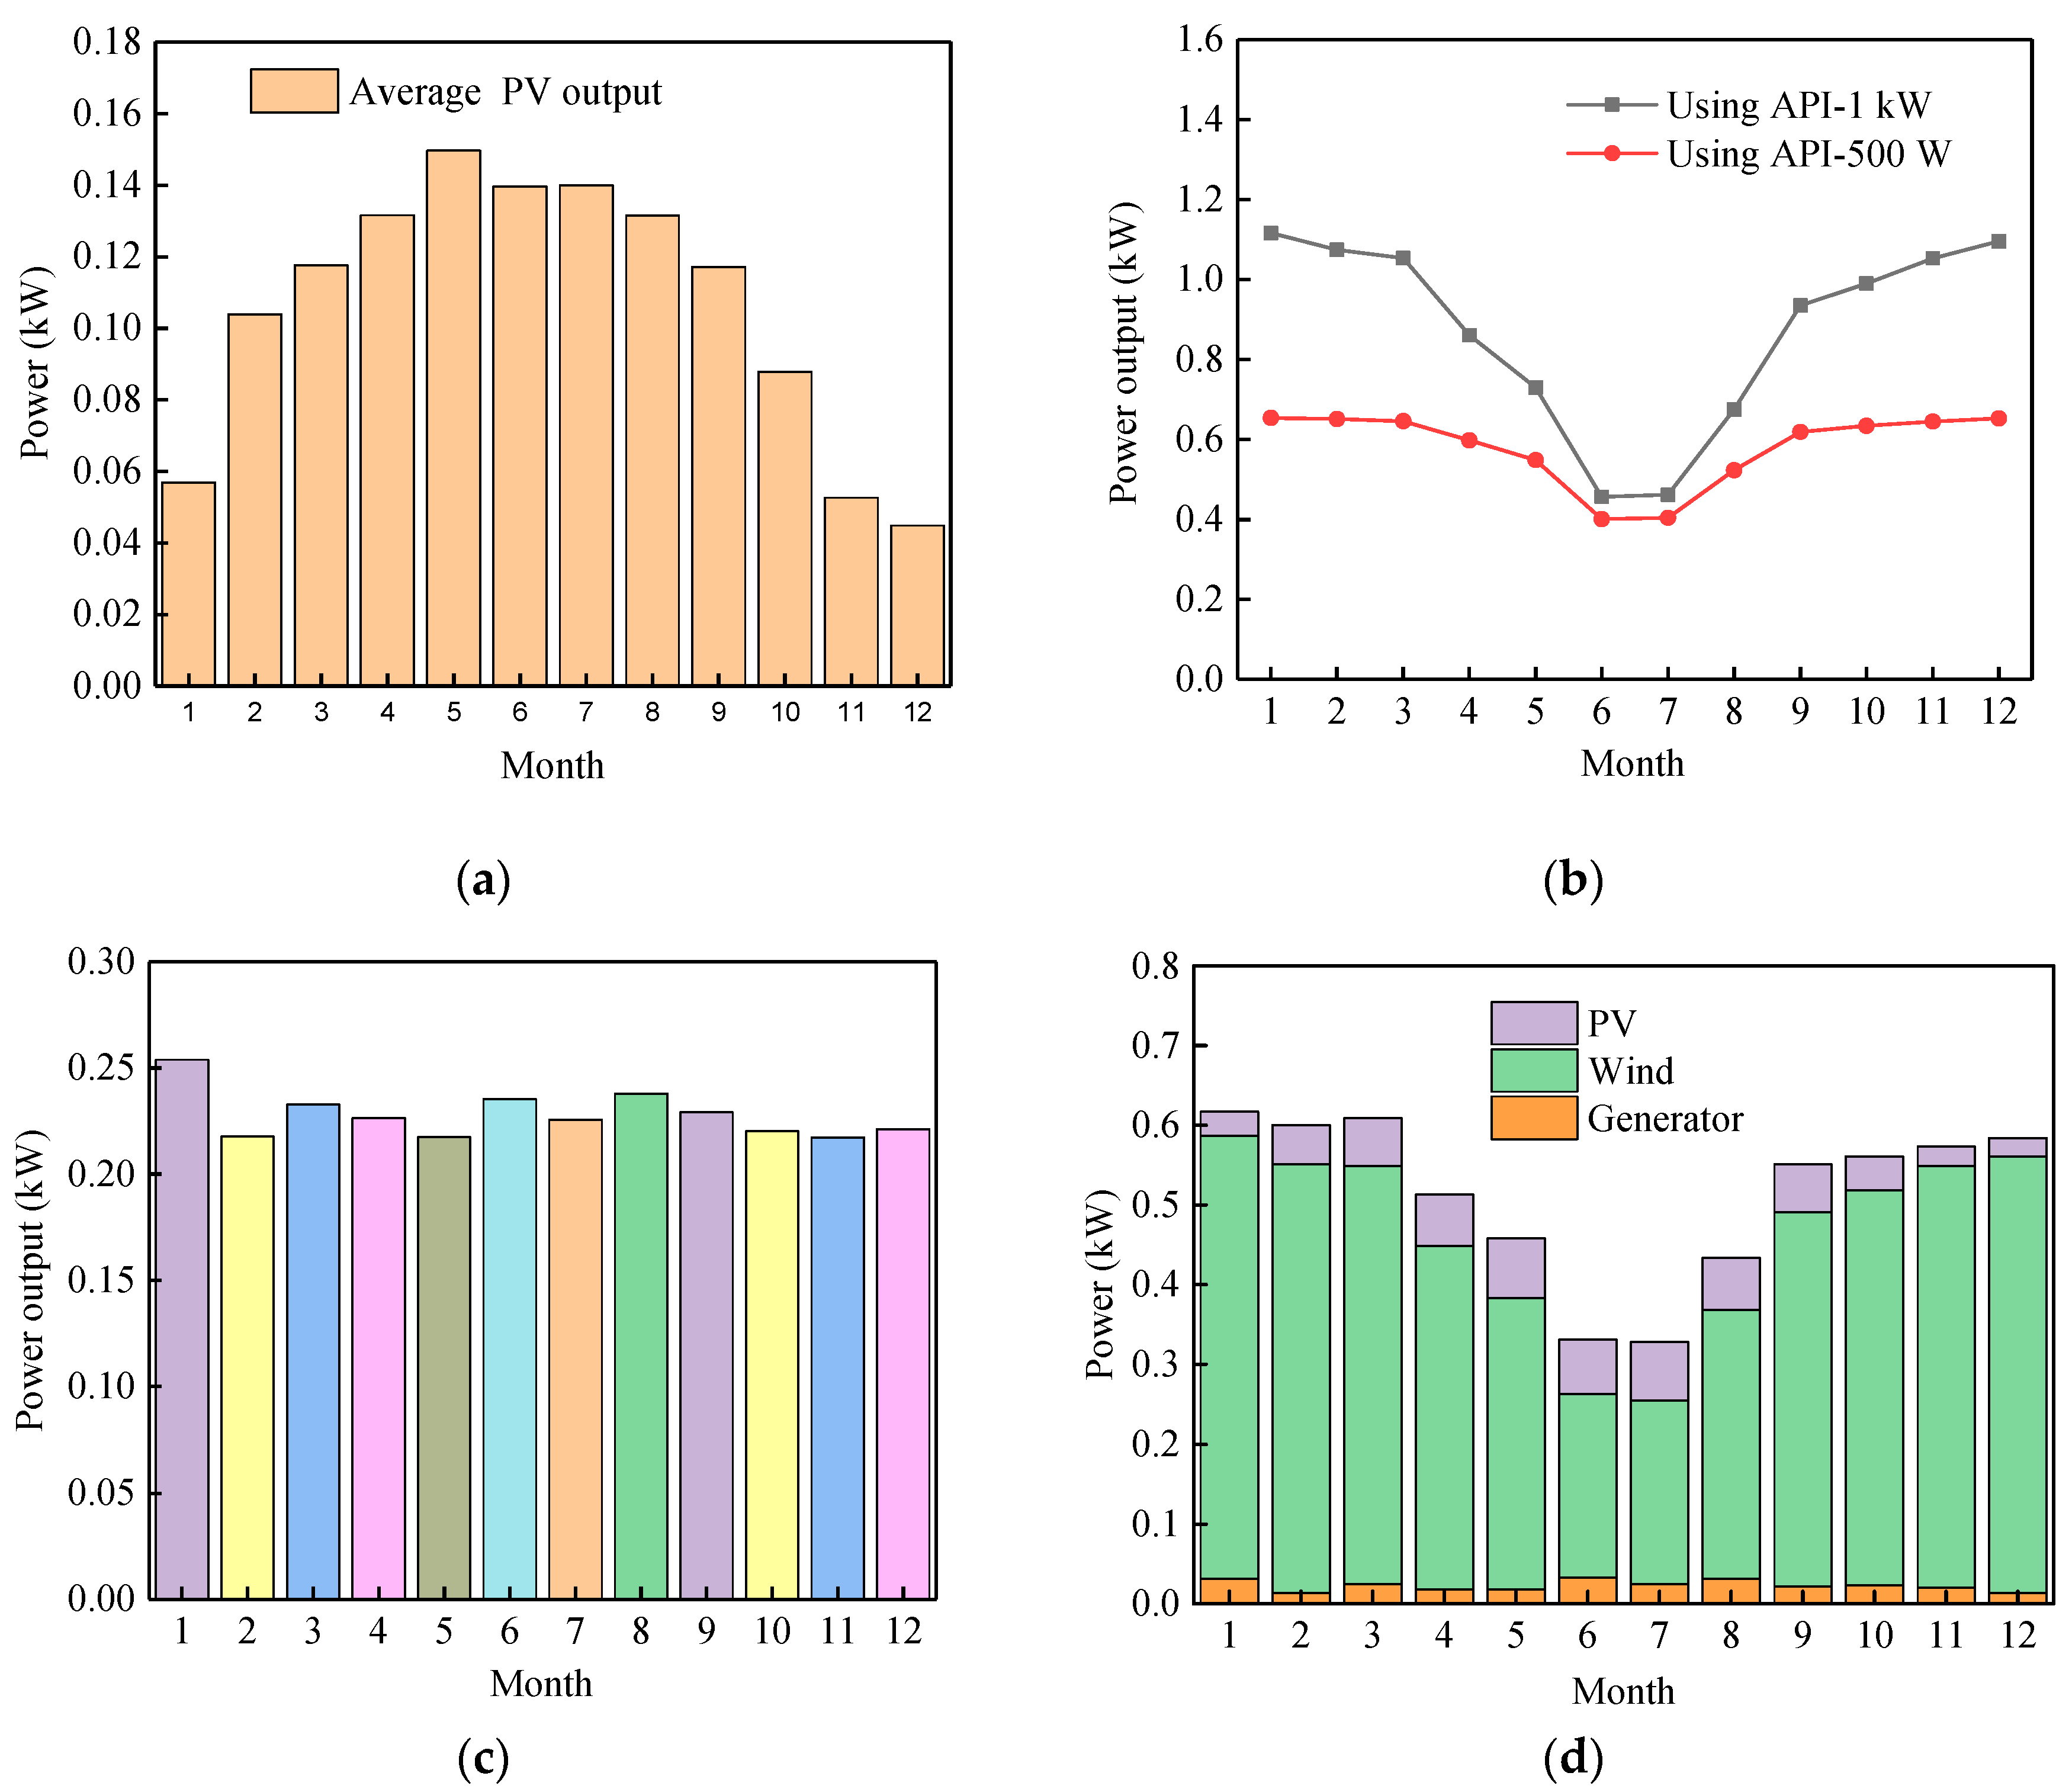
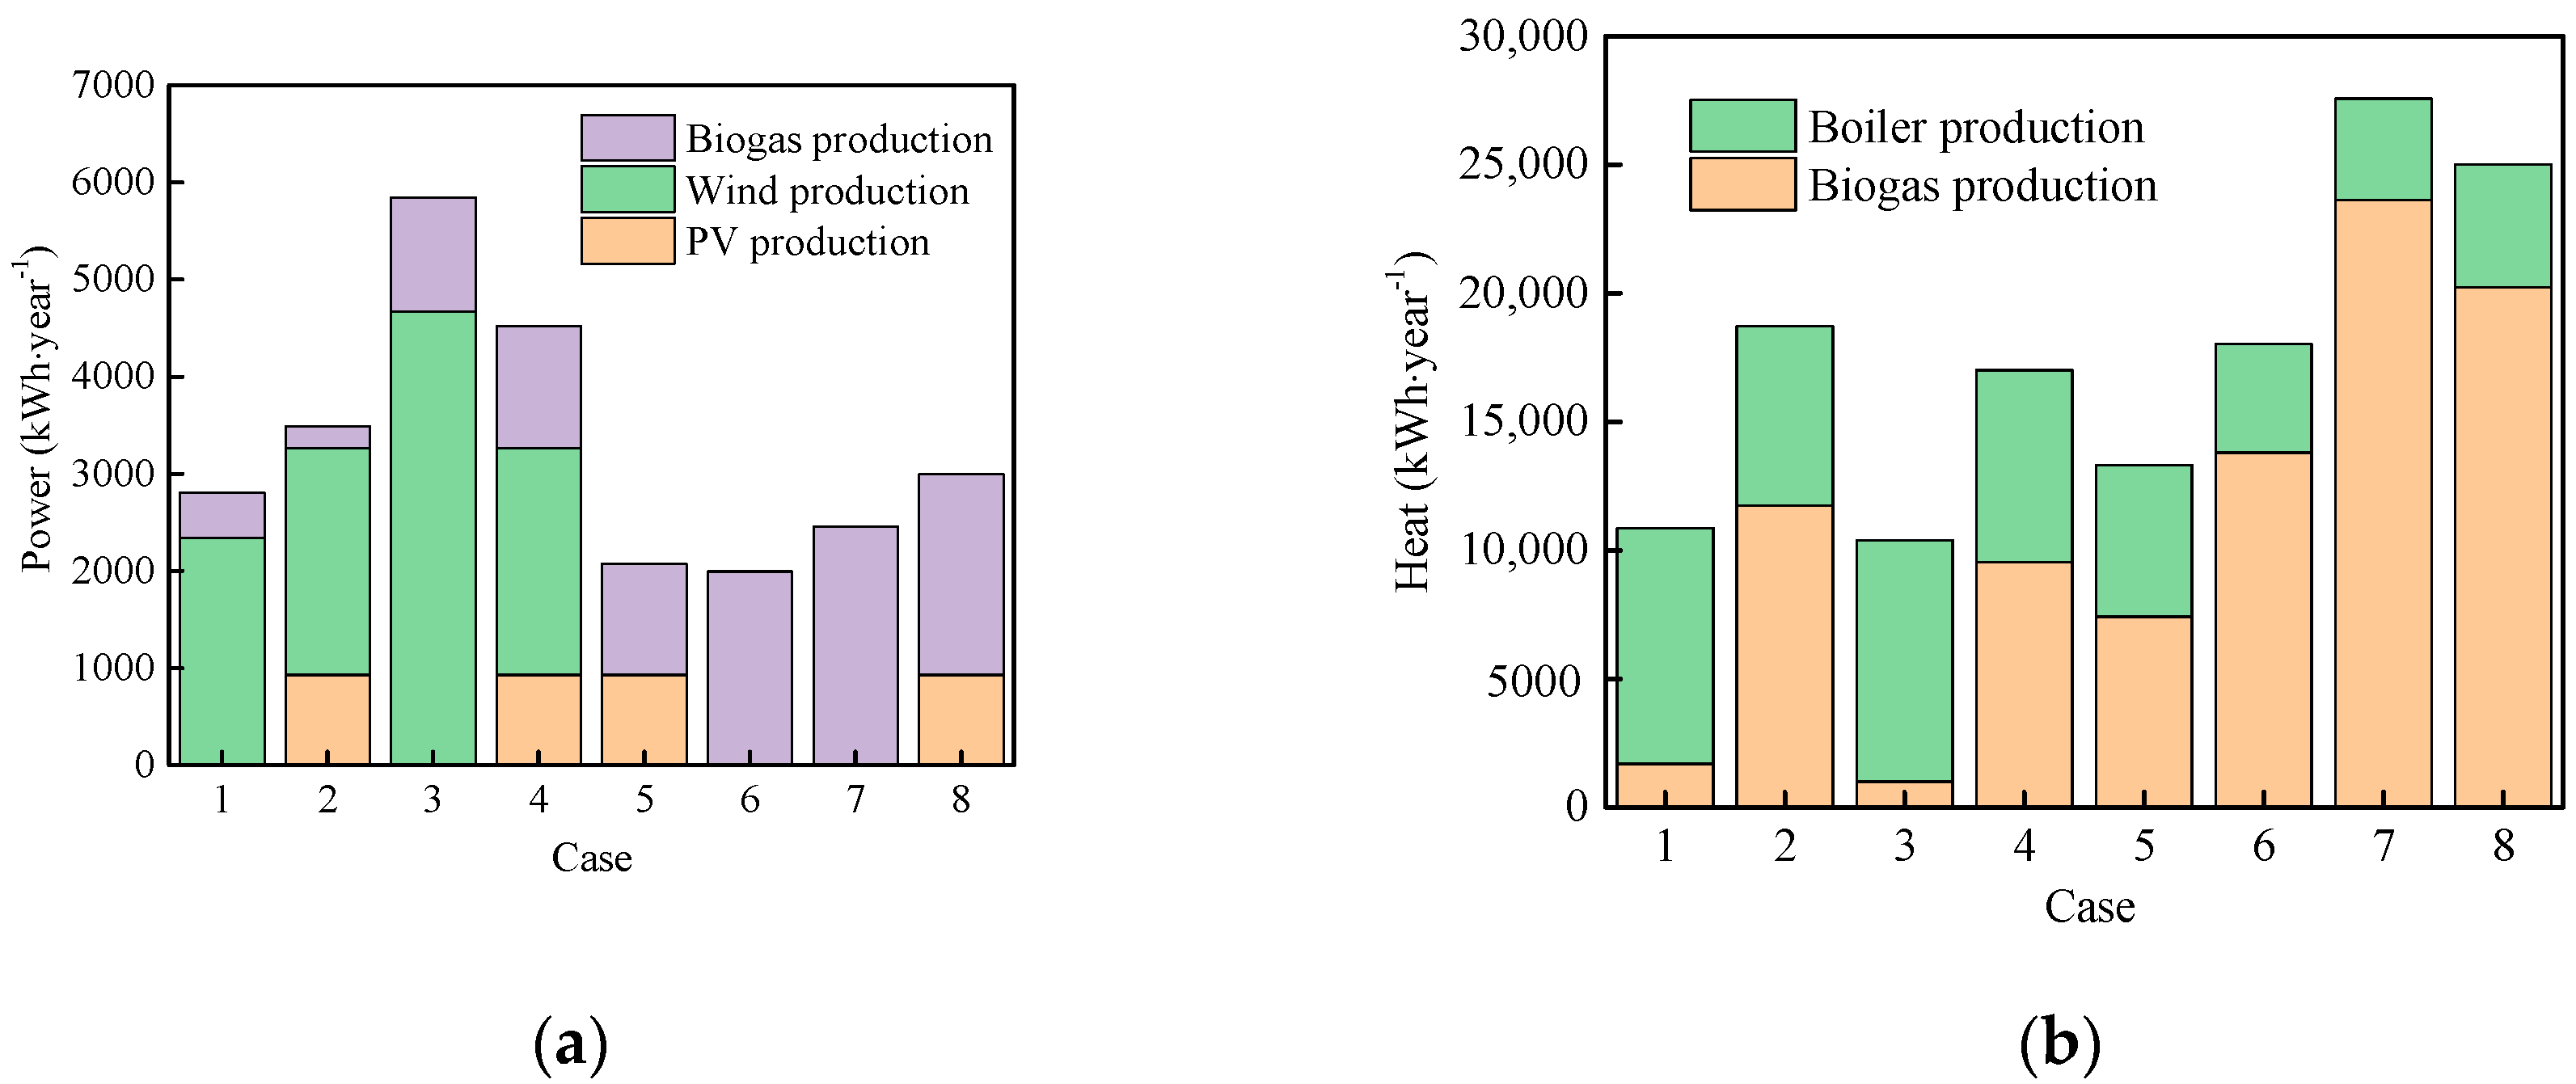
- Because of the abundant wind resources in the United Kingdom, especially in Newcastle area, wind turbines have an overwhelming contribution to the electricity supply from the HRES. Comparably, due to the less solar radiation available (rainy and cloudy weather at Newcastle area), solar PVs have less contribution to the HRES.
Author Contributions
Funding
Acknowledgments
Conflicts of Interest
Nomenclature
| AIT | Artificial intelligence techniques |
| C | Cost ($·year−1) |
| CRF | Capital recovery factor |
| Cp | The aerodynamic efficiency |
| E | Load served or supplied (kWh·year−1) |
| FIT | Feed-in tariff |
| f | PV derating factor |
| Fuel consumption (L·year−1); Average specific fuel consumption (L·kWh−1); Fuel curve intercept coefficient (L·kWh−1) of the genset | |
| G | Global solar radiation (kW·m−2) |
| HOMER | Hybrid optimization model electric renewables |
| HRES | Hybrid renewable energy system |
| h | Height (m) |
| i | Annual interest rate (%) |
| LCC | Life cycle cost |
| LCOE | Levelized cost of energy |
| NASA | National aeronautics and space administration |
| NOCT | Normal operating cell temperature (°C) |
| NREL | National renewable energy laboratory |
| NPC | Net present cost ($) |
| n | Number of turbines |
| N | Number of years |
| O&M | Operation and maintenance |
| P | Power (kW); Energy in time interval |
| PV | Photovoltaic |
| RET | Renewable energy technology |
| TCC | Total capital cost ($) |
| r | Radius (m) |
| R | Lifetime (year) |
| SOC | State of charge |
| T | Temperature (°C) |
| v | Wind speed (m·s−1) |
| Y | Capacity of generator (kW) |
| Greek letters | |
| ρ | Density (kg·m−3) |
| η | Efficiency of the generator; Efficiency of inverter |
| σ | Factor of self-discharging |
| Superscripts | |
| N | Number of years |
| Subscripts | |
| A | PV array |
| a | Ambient |
| ann | Annual |
| anntot | Total annual; Total annualized |
| acap | Annualized capital |
| b | Battery |
| bb | Battery charging |
| bh | Total energy generated by either wind turbine biogas genset or PV panel |
| bi | Inverter |
| bl | Load demand in time interval |
| boiler | Boiler |
| c | Cell |
| def | Deferrable load served |
| fueleff | Effective price of fuel ($·L−1) |
| gen | Generator |
| 1 | Fuel curve slope (L·kWh−1) |
| 0 | Fuel curve intercept |
| O&M | Operation and maintenance |
| primAC | AC primary load |
| primDC | DC primary load |
| proj | Project |
| PV | Photovoltaic |
| repgen | Replacement of genset |
| spec | Average specific fuel consumption of the genset |
| STC | Standard test condition |
| thermal | Thermal |
References
- Jiang, L.; Gonzalez-Diaz, A.; Ling-Chin, J.; Malik, A.; Roskilly, A.P.; Smallbone, A.J. PEF plastic synthesized from industrial carbon dioxide and biowaste. Nat. Sustain. 2020. [Google Scholar] [CrossRef]
- Bartolucci, L.; Cordiner, S.; Mulone, V.; Rossi, J.L. Hybrid renewable energy systems for household ancillary services. Int. J. Electr. Power Energy Syst. 2019, 107, 282–297. [Google Scholar] [CrossRef]
- Celik, A.N. Optimisation and techno-economic analysis of autonomous photovoltaic–wind hybrid energy systems in comparison to single photovoltaic and wind systems. Energy Convers. Manag. 2002, 43, 2453–2468. [Google Scholar] [CrossRef]
- Markvart, T. Sizing of hybrid photovoltaic-wind energy systems. Sol. Energy 1996, 57, 277–281. [Google Scholar] [CrossRef]
- Diaf, S.; Diaf, D.; Belhamel, M.; Haddadi, M.; Louche, A. A methodology for optimal sizing of autonomous hybrid PV/wind system. Energy Policy 2007, 35, 5708–5718. [Google Scholar] [CrossRef]
- Diaf, S.; Belhamel, M.; Haddadi, M.; Louche, A. Technical and economic assessment of hybrid photovoltaic/wind system with battery storage in Corsica island. Energy Policy 2008, 36, 743–754. [Google Scholar] [CrossRef]
- Jeyaprabha, S.B.; Selvakumar, A.I. Optimal sizing of photovoltaic/battery/diesel based hybrid system and optimal tilting of solar array using the artificial intelligence for remote houses in India. Energy Build. 2015, 96, 40–52. [Google Scholar] [CrossRef]
- Sagani, A.; Vrettakos, G.; Dedoussis, V. Viability assessment of a combined hybrid electricity and heat system for remote household applications. Sol. Energy 2017, 151, 33–47. [Google Scholar] [CrossRef]
- Arthur, R.; Baidoo, M.F.; Antwi, E. Biogas as a potential renewable energy source: A Ghanaian case study. Renew. Energy 2011, 36, 1510–1516. [Google Scholar] [CrossRef]
- Bhide, A.; Monroy, C.R. Energy poverty: A special focus on energy poverty in India and renewable energy technologies. Renew. Sustain. Energy Rev. 2011, 15, 1057–1066. [Google Scholar] [CrossRef]
- Vendoti, S.; Muralidhar, M.; Kiranmayi, R. Techno-economic analysis of off-grid solar/wind/biogas/biomass/fuel cell/battery system for electrification in a cluster of villages by HOMER software. Environ. Dev. Sustain. 2020. [Google Scholar] [CrossRef]
- Vijay, M.; Reddy, K.S.; Mallick, T.K. Techno-Economic Analysis of Standalone Solar Photovoltaic-Wind-Biogas Hybrid Renewable Energy System for Community Energy Requirement. Future Cities Environ. 2019, 5. [Google Scholar] [CrossRef]
- Jiang, L.; Wang, L.W.; Zhou, Z.S.; Zhu, F.Q.; Wang, R.Z. Investigation on non-equilibrium performance of composite adsorbent for resorption refrigeration. Energy Convers. Manag. 2016, 119, 67–74. [Google Scholar] [CrossRef]
- Jiang, L.; Wang, L.; Wang, R.; Zhu, F.; Lu, Y.; Roskilly, A.P. Experimental investigation on an innovative resorption system for energy storage and upgrade. Energy Convers. Manag. 2017, 138, 651–658. [Google Scholar] [CrossRef]
- Himri, Y.; Boudghene Stambouli, A.; Draoui, B.; Himri, S. Techno-economical study of hybrid power system for a remote village in Algeria. Energy 2008, 33, 1128–1136. [Google Scholar] [CrossRef]
- Nfah, E.M.; Ngundam, J.M.; Vandenbergh, M.; Schmid, J. Simulation of off-grid generation options for remote villages in Cameroon. Renew. Energy 2008, 33, 1064–1072. [Google Scholar] [CrossRef]
- Zamani, M.H.; Riahy, G.H. Introducing a new method for optimal sizing of a hybrid (wind/PV/battery) system considering instantaneous wind speed variations. Energy Sustain. Dev. 2008, 12, 27–33. [Google Scholar] [CrossRef]
- Bekele, G.; Palm, B. Feasibility study for a standalone solar–wind-based hybrid energy system for application in Ethiopia. Appl. Energy 2010, 87, 487–495. [Google Scholar] [CrossRef]
- Lau, K.Y.; Yousof, M.F.M.; Arshad, S.N.M.; Anwari, M.; Yatim, A.H.M. Performance analysis of hybrid photovoltaic/diesel energy system under Malaysian conditions. Energy 2010, 35, 3245–3255. [Google Scholar] [CrossRef]
- Nandi, S.K.; Ghosh, H.R. Prospect of wind–PV-battery hybrid power system as an alternative to grid extension in Bangladesh. Energy 2010, 35, 3040–3047. [Google Scholar] [CrossRef]
- Hafez, O.; Bhattacharya, K. Optimal planning and design of a renewable energy based supply system for microgrids. Renew. Energy 2012, 45, 7–15. [Google Scholar] [CrossRef]
- Ngan, M.S.; Tan, C.W. Assessment of economic viability for PV/wind/diesel hybrid energy system in southern Peninsular Malaysia. Renew. Sustain. Energy Rev. 2012, 16, 634–647. [Google Scholar] [CrossRef]
- Li, C.; Ge, X.; Zheng, Y.; Xu, C.; Ren, Y.; Song, C.; Yang, C. Techno-economic feasibility study of autonomous hybrid wind/PV/battery power system for a household in Urumqi, China. Energy 2013, 55, 263–272. [Google Scholar] [CrossRef]
- Hiendro, A.; Kurnianto, R.; Rajagukguk, M.; Simanjuntak, Y.M. Techno-economic analysis of photovoltaic/wind hybrid system for onshore/remote area in Indonesia. Energy 2013, 59, 652–657. [Google Scholar] [CrossRef]
- Sen, R.; Bhattacharyya, S.C. Off-grid electricity generation with renewable energy technologies in India: An application of HOMER. Renew. Energy 2014, 62, 388–398. [Google Scholar] [CrossRef]
- Yahiaoui, A.; Benmansour, K.; Tadjine, M. Control, analysis and optimization of hybrid PV-Diesel-Battery systems for isolated rural city in Algeria. Sol. Energy 2016, 137, 1–10. [Google Scholar] [CrossRef]
- Maatallah, T.; Ghodhbane, N.; Ben Nasrallah, S. Assessment viability for hybrid energy system (PV/wind/diesel) with storage in the northernmost city in Africa, Bizerte, Tunisia. Renew. Sustain. Energy Rev. 2016, 59, 1639–1652. [Google Scholar] [CrossRef]
- Bentouba, S.; Bourouis, M. Feasibility study of a wind–photovoltaic hybrid power generation system for a remote area in the extreme south of Algeria. Appl. Therm. Eng. 2016, 99, 713–719. [Google Scholar] [CrossRef]
- Sarker, S. Feasibility analysis of a renewable hybrid energy system with producer gas generator fulfilling remote household electricity demand in Southern Norway. Renew. Energy 2016, 87, 772–781. [Google Scholar] [CrossRef]
- Palmer, J.; Cooper, I. United Kingdom Housing Energy Fact File; Department of Energy & Climate Change: London, UK, 2013. [Google Scholar]
- Ackermann, T.; Andersson, G.; Söder, L. Distributed power generation in a deregulated market environment. Electr. Power Syst. Res. 2001, 57, 195–204. [Google Scholar] [CrossRef]
- Hoff, T.E.; Wenger, H.J.; Farmer, B.K. Distributed generation: An alternative to electric utility investments in system capacity. Energy Policy 1996, 24, 137–147. [Google Scholar] [CrossRef]
- Pepermans, G.; Driesen, J.; Haeseldonckx, D.; Belmans, R.; D’haeseleer, W. Distributed generation: Definition, benefits and issues. Energy Policy 2005, 33, 787–798. [Google Scholar] [CrossRef]
- Darghouth, N.R.; Barbose, G.; Wiser, R. The impact of rate design and net metering on the bill savings from distributed PV for residential customers in California. Energy Policy 2011, 39, 5243–5253. [Google Scholar] [CrossRef]
- Yang, D.; Kong, W.; Li, B.; Lian, X. Intelligent vehicle electrical power supply system with central coordinated protection. Chin. J. Mech. Eng. 2016, 29, 781–791. [Google Scholar] [CrossRef]
- HOMER Energy. HOMER Microgrid Software. Available online: https://www.homerenergy.com/products/ (accessed on 1 January 2018).
- National Renewable Energy Laboratory (NREL). Getting Started Guide for HOMER Legacy; National Renewable Energy Laboratory: Golden, CO, USA, 2011. [Google Scholar]
- Green, M.A. Third generation photovoltaics: Solar cells for 2020 and beyond. Phys. E Low-Dimens. Syst. Nanostruct. 2002, 14, 65–70. [Google Scholar] [CrossRef]
- Prasad, A.R.; Natarajan, E. Optimization of integrated photovoltaic–wind power generation systems with battery storage. Energy 2006, 31, 1943–1954. [Google Scholar] [CrossRef]
- Chauhan, A.; Saini, R.P. A review on Integrated Renewable Energy System based power generation for stand-alone applications: Configurations, storage options, sizing methodologies and control. Renew. Sustain. Energy Rev. 2014, 38, 99–120. [Google Scholar] [CrossRef]
- RETScreen Expert: Clean Energy Management Software, Version 4; Natural Resources Canada: Ottawa, ON, Canada, 2019.
- Haidar, A.M.A.; John, P.N.; Shawal, M. Optimal configuration assessment of renewable energy in Malaysia. Renew. Energy 2011, 36, 881–888. [Google Scholar] [CrossRef]
- World Coal Association. High Efficiency Low Emission Coal. 2020. Available online: https://www.worldcoal.org/reducing-co2-emissions/high-efficiency-low-emission-coal (accessed on 1 January 2020).
- US Environmental Protection Agency (EPA). CHaPCP-CEaESC. Available online: https://www.epa.gov/chp/chp-energy-and-emissions-savings-calculator (accessed on 1 November 2017).


| Reference | Technology | Application Place | Research Findings |
|---|---|---|---|
| Himri et al. [15] 2008 | Wind/diesel | Algeria | Combining wind turbine with a diesel-based supply; limited technology options. |
| Nfah et al. [16] 2008 | PV/microhydro/ diesel/battery | Cameroon | Diesel as main generator supplemented by PV and microhydro based on grid-connected urban households. |
| Zamani et al. [17] 2008 | PV/wind/battery | Hypothetical | A new method developed for exact calculation of the variable-speed wind turbine output power. |
| Bekele and Palm [18] 2010 | PV/wind | Ethiopia | PV and wind; randomized load profile from hypothetical load data. |
| Lau et al. [19] 2010 | PV/diesel | Malaysia | 24 h service but a high demand profile for a rural area. |
| Nandi et al. [20] 2010 | PV/wind/battery | Bangladesh | Solar and wind hybrid; no productive demand. |
| Hafez et al. [21] 2012 | PV/wind/hydro/diesel/ battery | Hypothetical | 24 h service but unrealistic demand profile for rural area in developing countries. |
| Ngan et al. [22] 2012 | PV/wind/diesel | Southern Malaysia | Seven different system configurations, e.g., system with and without battery storage. |
| Li et al. [23] 2013 | PV/wind/battery | Urumqi, China | The economical, sensitivity and PV module tilt angle analyses of the proposed system are discussed. |
| Hiendro et al. [24] 2013 | PV/wind/battery | Indonesia | Wind turbine and battery are the most important components of the PV/wind hybrid system. |
| Sen et al. [25] 2014 | PV/microhydro/wind /biogenerator/battery | India | The optimal off-grid option is identified and compared with conventional grid extension. |
| Yahiaoui et al. [26] 2016 | PV/diesel/battery | South Algeria | Utilization of hybrid energy system could minimize operational cost and reduce CO2 emission. |
| Maatallah et al. [27] 2016 | PV/wind/diesel | The northernmost city in Africa | Potential operation of hybrid PV/wind turbine/diesel system with batteries storage is verified. |
| Bentouba et al. [28] 2016 | PV/wind/diesel | South of Algeria | 100% of the electricity demand could be supplied to the town by using a hybrid configuration. |
| Sarker [29] 2016 | Bio/PV/wind/battery/capacitor | Southern Norway | Biomass is used for hybrid system and proves its feasibility. |
| Sagani et al. [8] 2017 | PV/diesel/battery | Northwest Greece | Hybrid system for power and heat is proposed; a cost-effective alternative is obtained to conventional type. |
| Present study | PV/wind/battery/ biogas | Northeast United Kingdom | Both heating and electrify loads are considered. The optimal off-grid option is identified among eight cases. |
| Electrical Specifications | XW6048-230-50 | XW4548-230-50 |
|---|---|---|
| Continuous output power (kW) | 0.006 | 0.0045 |
| Surge rating (kW) | 0.012 | 0.009 |
| Surge current (Arms) | 53 | 40 |
| Perak efficiency (%) | 95.4 | 95.6 |
| AC output voltage (%) | 230 ± 3 | 230 ± 3 |
| DC current at rated power (A) | 131 | 96 |
| DC input voltage range (V) | 44–64 | 44–64 |
| System Configurations (Off-Grid) | ||||||||
|---|---|---|---|---|---|---|---|---|
| Case Number | 1 | 2 | 3 | 4 | 5 | 6 | 7 | 8 |
| Configuration 1 | Number of Unit | |||||||
| Wind turbine (API-0.5 kW) | 1 | 1 | 2 | 1 | 0 | 0 | 0 | 0 |
| PV | 0 | 1 | 0 | 1 | 1 | 0 | 0 | 1 |
| Biogas genset | 1 | 1 | 1 | 1 | 1 | 1 | 1 | 1 |
| Battery | 5 | 4 | 0 | 0 | 7 | 7 | 0 | 0 |
| Converter | 1 | 1 | 0 | 0 | 1 | 1 | 0 | 0 |
| Configuration 2 | Number of Unit | |||||||
| Wind turbine (API-1 kW) | 1 | 1 | 1 | 1 | 0 | 0 | 0 | 0 |
| PV | 0 | 0 | 1 | 1 | 1 | 0 | 0 | 1 |
| Biogas genset | 1 | 1 | 1 | 1 | 1 | 1 | 1 | 1 |
| Battery | 4 | 0 | 3 | 0 | 7 | 7 | 0 | 0 |
| Converter | 1 | 0 | 1 | 0 | 1 | 1 | 0 | 0 |
| Case Number | 1 | 2 | 3 | 4 | 5 | 6 | 7 | 8 |
|---|---|---|---|---|---|---|---|---|
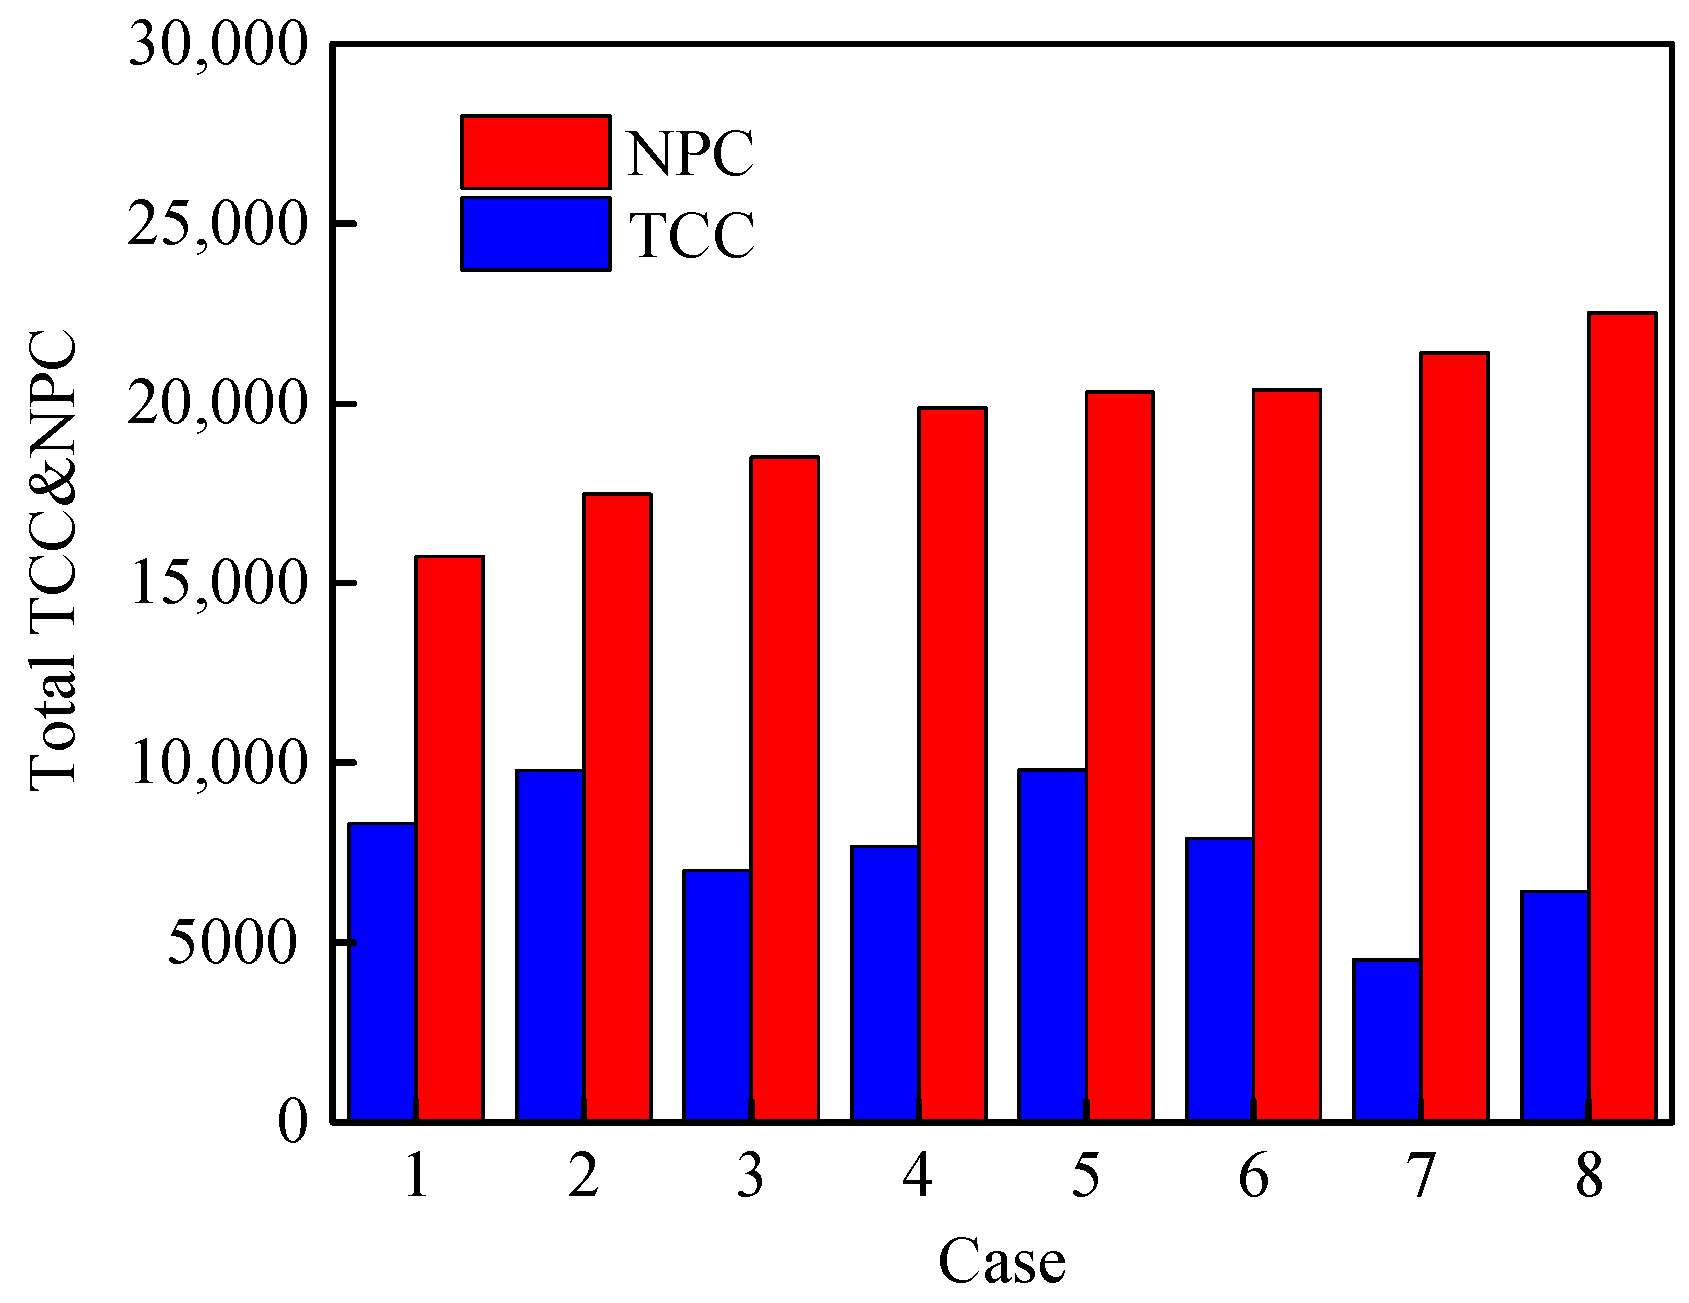
| Configuration 1: Wind Turbine (API-0.5 kW) | ||||||||
| Total capital cost ($) | 8307 | 9789 | 7010 | 7667 | 9800 | 7900 | 4524 | 6424 |
| Total NPC ($) | 15,735 | 17,470 | 18,497 | 19,860 | 20,307 | 20,379 | 21,416 | 22,526 |
| LCOE ($·kWh−1) | 0.645 | 0.726 | 0.774 | 0.837 | 0.858 | 0.862 | 0.91 | 0.962 |
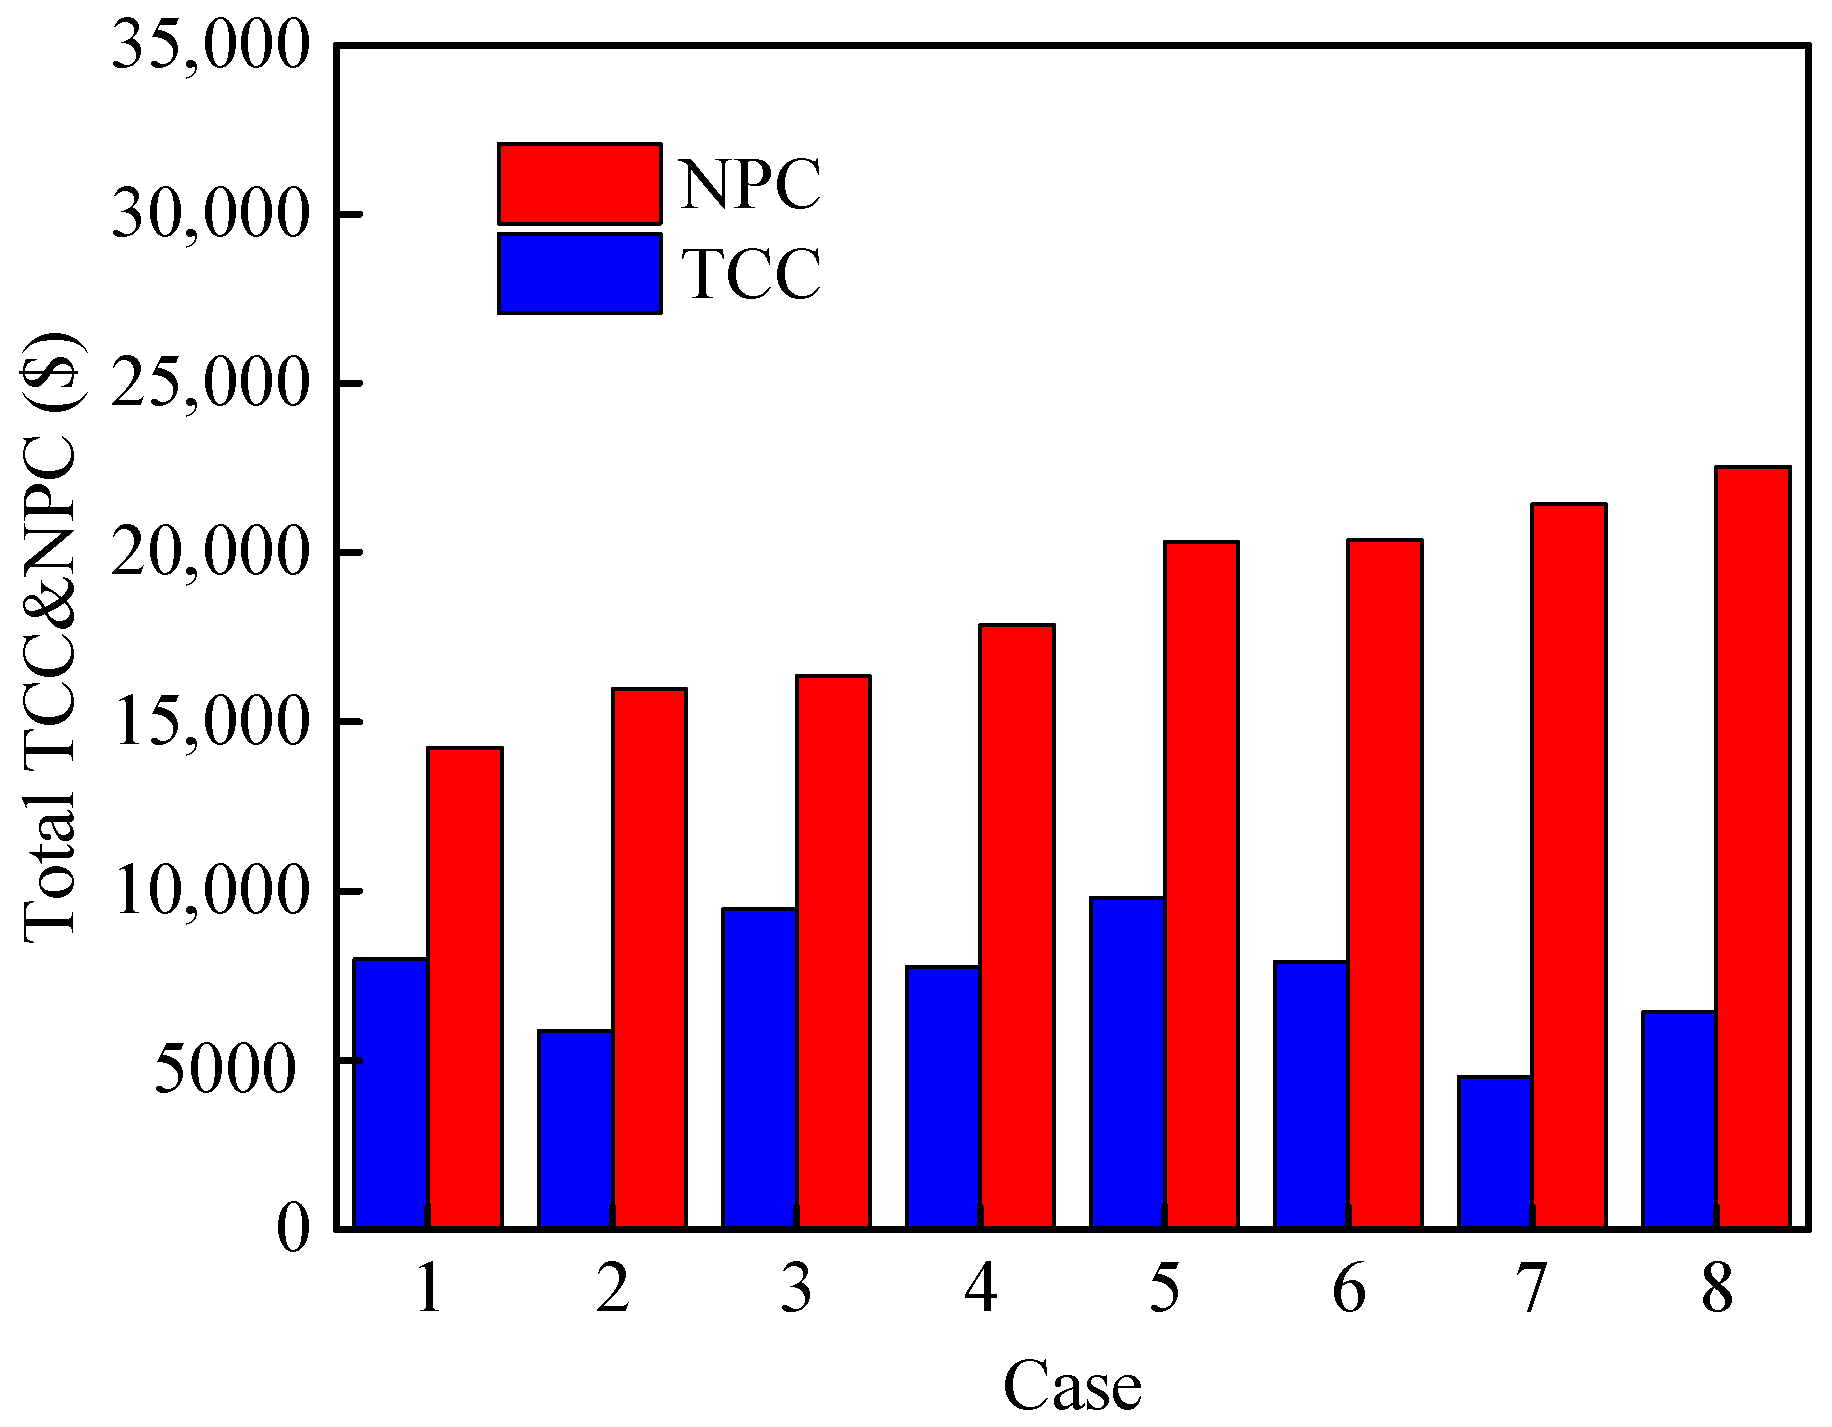
| Configuration 2: Wind Turbine (API-1 kW) | ||||||||
| Total capital cost ($) | 7992 | 5870 | 9474 | 7770 | 9800 | 7900 | 4524 | 6424 |
| Total NPC ($) | 14,507 | 16,473 | 17,025 | 18,616 | 20,307 | 20,379 | 21,416 | 22,526 |
| LCOE ($·kWh−1) | 0.588 | 0.68 | 0.705 | 0.779 | 0.858 | 0.862 | 0.91 | 0.962 |
© 2020 by the authors. Licensee MDPI, Basel, Switzerland. This article is an open access article distributed under the terms and conditions of the Creative Commons Attribution (CC BY) license (http://creativecommons.org/licenses/by/4.0/).
Share and Cite
Miao, C.; Teng, K.; Wang, Y.; Jiang, L. Technoeconomic Analysis on a Hybrid Power System for the UK Household Using Renewable Energy: A Case Study. Energies 2020, 13, 3231. https://doi.org/10.3390/en13123231
Miao C, Teng K, Wang Y, Jiang L. Technoeconomic Analysis on a Hybrid Power System for the UK Household Using Renewable Energy: A Case Study. Energies. 2020; 13(12):3231. https://doi.org/10.3390/en13123231
Chicago/Turabian StyleMiao, Chunqiong, Kailiang Teng, Yaodong Wang, and Long Jiang. 2020. "Technoeconomic Analysis on a Hybrid Power System for the UK Household Using Renewable Energy: A Case Study" Energies 13, no. 12: 3231. https://doi.org/10.3390/en13123231
APA StyleMiao, C., Teng, K., Wang, Y., & Jiang, L. (2020). Technoeconomic Analysis on a Hybrid Power System for the UK Household Using Renewable Energy: A Case Study. Energies, 13(12), 3231. https://doi.org/10.3390/en13123231