Article

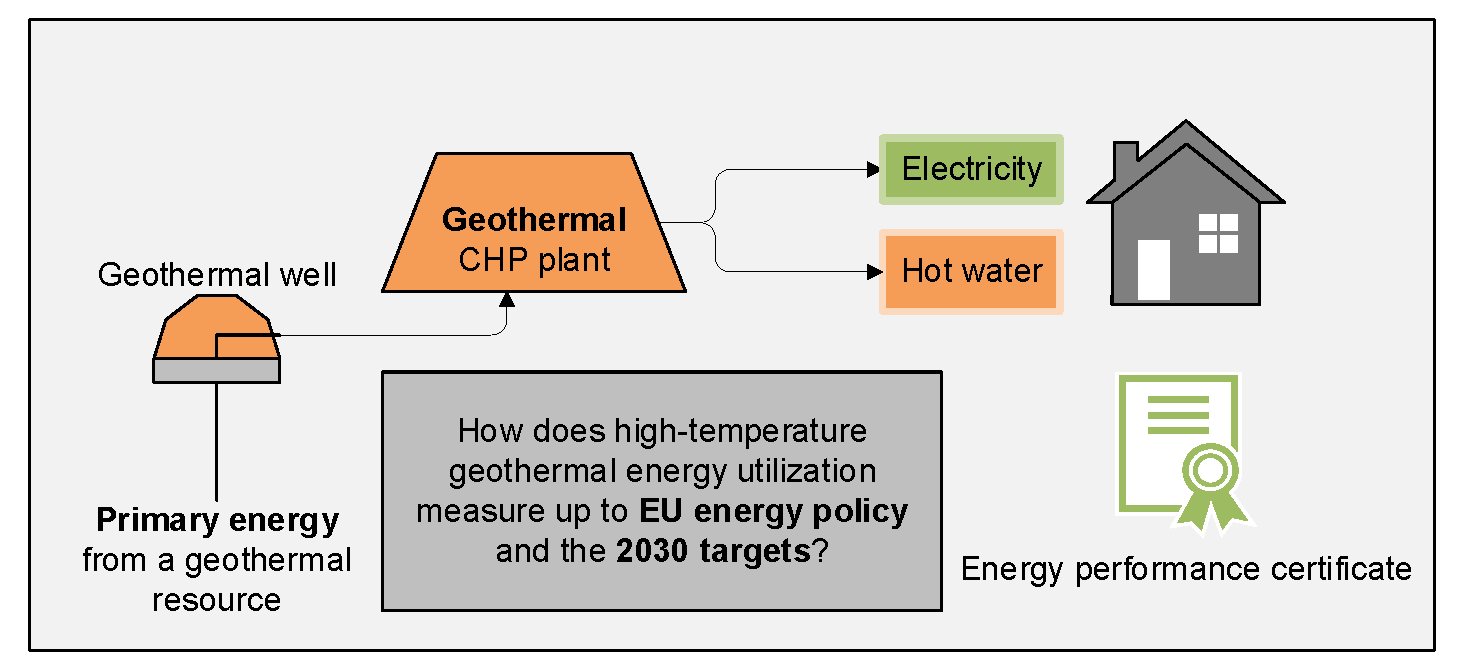
High-Temperature Geothermal Utilization in the Context of European Energy Policy—Implications and Limitations

by
Marta Ros Karlsdottir
1,*,
Jukka Heinonen
2,
Halldor Palsson
1 and
Olafur Petur Palsson
1
1
Faculty of Industrial Engineering, Mechanical Engineering and Computer Science, University of Iceland, VR-II, Hjardarhaga 6, 107 Reykjavik, Iceland
2
Faculty of Civil and Environmental Engineering, University of Iceland, VR-II, Hjardarhaga 6, 107 Reykjavik, Iceland
*
Author to whom correspondence should be addressed.
Energies 2020, 13(12), 3187; https://doi.org/10.3390/en13123187
Submission received: 1 May 2020 / Revised: 13 June 2020 / Accepted: 13 June 2020 / Published: 19 June 2020

Abstract

:
The European Union (EU) has made climate change mitigation a high priority though a policy framework called “Clean Energy for all Europeans “. The concept of primary energy for energy resources plays a critical role in how different energy technologies appear in the context of this policy. This study shows how the calculation methodologies of primary energy content and primary energy factors pose a possible negative implication on the future development of geothermal energy when comparing against EU’s key energy policy targets for 2030. Following the current definitions of primary energy, geothermal utilization becomes the most inefficient resource in terms of primary energy use, thus contradicting key targets of increased energy efficiency in buildings and in the overall energy use of member states. We use a case study of Hellisheidi, an existing geothermal power plant in Iceland, to demonstrate how the standard primary energy factor for geothermal in EU energy policy is highly overestimated for efficient geothermal power plants. Moreover, we combine life cycle assessment and the commonly utilized combined heat and power production allocation methods to extract the non-renewable primary energy factor for geothermal and show how it is only a minimal fraction of the total primary energy factor for geothermal. The findings of the study apply to other geothermal plants within the coverage of the European Union’s energy policy, whether from high- or low-temperature geothermal resources. Geothermal has substantial potential to aid in achieving the key energy and climate targets. Still, with the current definition of the primary energy of geothermal resources, it may not reach the potential.

Graphical Abstract

1. Introduction

The European Union (EU) has put forward an ambitious energy and climate policy framework called “Clean Energy for all Europeans “. The policy framework defines specific targets to be met by the year 2030 to reduce greenhouse gas (GHG) emissions, increase the share of renewable energy in the EU’s energy mix and increase energy efficiency throughout the entire energy value chain [1]. Essential indicators to track the progress towards the EU’s climate and energy targets are GHG emission factors for different energy technologies and the primary energy factor (PEF). The PEF states how efficient energy technologies are in converting primary energy from various resources into usable energy products such as electricity and heat.
GHG emission factors are readily available in literature and industry standards for the different energy technologies, based on data from multiple sources. The PEFs, however, are more complicated to define, as the physical properties of different fuels and energy resources may vary significantly, resulting in a complexity of defining their actual primary energy content. In international energy statistics, methods have been set on how to calculate the primary energy content of the different fuels and energy resources [2,3], and the EU energy and climate policy framework adheres to those methods [3]. However, the methods have had some criticism from various stakeholders within the energy industry. The methods do not apply a consistent methodology to define the primary energy content across different resources. In return, they become difficult to compare between various resources and even produce unfavorable indicators and statistical results for renewable energy resources [4,5,6,7].
One particular energy technology that can be negatively affecting the EU’s climate and energy targets due to the definition of the PEF is geothermal energy. Geothermal energy is utilized worldwide as a reliable renewable and low-emitting source of heat and power, providing continuous base-load energy production in contrast to the highly fluctuating production profiles of, e.g., wind and solar energy. Furthermore, geothermal energy is an excellent source of heat for district heating purposes. Geothermal energy technologies typically have lower conversion efficiencies compared to other thermal energy technologies due to the naturally available temperatures and pressures from the individual geothermal resources. These low efficiencies result in higher PEFs for geothermal than for other technologies, which can negatively affect energy efficiency targets based on primary energy measures in countries developing future geothermal projects.
This paper discusses the possible implications and limitations on current and future development of geothermal energy due to how the PEF for geothermal is defined within the EU’s climate and energy policy. In particular, it focuses on high-temperature geothermal utilization and gives an actual technical example to support the discussion. Also, the paper addresses the methods used to allocate the PEF and GHG emission factor between electricity and heat from combined heat and power (CHP) plants, with a focus on how they apply to high-temperature geothermal CHP plants, and how they affect the outcome of an assessment. The study uses a technical example derived from a previously published paper by the authors on the life cycle assessment (LCA) of the largest geothermal power plant in Iceland, the Hellisheidi geothermal CHP plant [8].
The following subsections of Section 1 provide the context for the paper. They cover the ongoing discussion on the newly updated EU climate and energy policy framework and the key indicators used within the framework to address the climate and energy targets. Furthermore, they discuss the status of geothermal energy in Europe and how the current policy framework can have potential adverse effects on the further development of geothermal utilization within the EU.
Section 2 covers the methods chosen to showcase the implications of the EU policy framework on geothermal development by introducing a technical example of an existing high-temperature geothermal CHP plant located in Iceland. The methods for calculating the PEFs for the plant are described and discussed. Additionally, the methods used to calculate allocation factors based on different methodologies, including EU’s preferred methods of allocation, to divide the PEF and other environmental impacts between power and heat for the technical example are given. Section 3 presents the results of the allocation factors and their impact on the values of PEF for electricity and heat from the geothermal CHP plant. A discussion of the results and concluding remarks are given in Section 4 and Section 5, respectively.
The paper will show that the definition of PEF for geothermal energy, or the use of primary energy as a target measure, should be reconsidered if geothermal energy is to become one of the renewable energies the EU relies on for clean energy in the future. The current definitions and targets can undermine the development of geothermal energy within the EU as replacing any energy technology with geothermal technology, either in a building or in a Member State, results in increased primary energy use due to the high PEF value of geothermal. The authors believe that this was not the intended purpose of the current climate and energy policy nor international energy statistics methods, and should, therefore, be revised to support future geothermal development.

1.1. Overview of Current EU Energy and Climate Policy

The European Union (EU) has shown a noticeable ambition to put forward clear and forward-thinking climate and energy goals and supporting legislative acts. The EU first adopted a package of energy and climate measures in 2008, setting the 20/20/20 targets. These targets aimed at decreasing GHG emissions by 20% (from 1990 levels), increase energy efficiency by 20% (compared to “business as usual” scenario projections for 2020 energy use made in 2007), and to achieve a 20% share of renewables within the EU. Already in 2012, reports showed the EU was well on its way of meeting the 20/20/20 targets. As of 2017, according to Eurostat [9], the 20% reduction in GHG emissions from 1990 levels was already met and surpassed, while the share of renewables measured 17.5% and energy efficiency for final- and primary energy consumption lacked 3.3% and 5% points towards its goal respectively. The next update on the progress towards the 2020 targets is expected from Eurostat in fall 2020.
The European Commission, therefore, requested the construction of the next climate and energy framework to set ambitious key targets for the period 2021–2030 [10]. In 2015, the new 2030 climate and energy framework, “Clean energy for all Europeans”, was adopted with updated targets from the 2020 package. Furthermore, the targets for energy efficiency and share of renewables were revised upwards in 2018. The following key targets are now adopted [1,11,12]:
  • No less than a 40% reduction of greenhouse gas emissions compared to 1990 levels. The target is twofold, where sectors under the EU emissions trading system (ETS) must cut emissions by 43%, and non-ETS sectors (emissions under each Member State) need to reduce emissions by 30%, both compared to 2005 levels [11].
  • No less than a 32% share of renewable energy in final energy use (revised upwards in 2018 from a target of 27%) [1,11].
  • No less than a 32.5% improvement in energy efficiency compared to projections from 2007 (revised upwards in 2018 from a target of 27%) [1,11].
The “Clean energy for all Europeans package” is reinforced by revising and grouping eight legislative acts to support those key targets. An overview of those legal acts is given in Table 1 [1].
Additionally, as a long term strategy, the EU aims to be “climate-neutral” by 2050 as put forward in “The European Green deal” growth strategy for the EU, presented in December 2019 [13]. A first-of-its-kind European Climate law has been proposed to make the target legally binding [14].

1.2. Indicators for Energy Technologies Affecting Key EU Energy and ClimateT

Important indicators for energy technologies within the EU climate and energy policy are the Greenhouse Gas (GHG) Emission Factor and the Primary Energy Factor (PEF). The definitions of how these indicators are calculated for different energy technologies can have a significant effect on how the technologies compare against the overall progress in reaching the EU’s key 2030 energy and climate targets. For instance, one energy technology can have higher GHG emissions compared to others, leading to an increase or slower reduction of GHG emissions overall. Yet, the same energy technology might have a higher conversion efficiency (and thus, a lower primary energy factor) than others leading to lowered primary energy consumption compared to other technologies and therefore contributes more to the increased energy efficiency target and vice versa. The following sections discuss further the state and definition of these indicators for energy technologies.

1.2.1. Greenhouse Gas Emission Factors

The greenhouse gas (GHG) emission factor is used as a descriptive indicator of GHG emissions resulting from different energy technologies. The indicator is used as a measure towards the target of reduced GHG emissions, and an optional indicator in the Energy Performance of Buildings Directive (EPBD) to state the energy performance of a building in terms of annual GHG emissions per m2 [15]. In the Renewable Energy Directive (RED), the indicator is used as a determining factor for the support and development of renewable resources that emit GHG (i.e., by excluding those renewable technologies that might emit a similar amount of GHG as fossil technologies) [16].
The calculation of greenhouse gas emission factors for different energy technologies is a widely studied field, preferably using LCA or other comparable methods to calculate the overall emissions throughout the energy value-chain per energy unit produced or sold [17]. Average emission factors for energy production from different resources are also widely available in literature, as well as case studies on specific energy production facilities worldwide. Therefore, the science of calculating CO2 emissions from energy production is relatively mature and agreed upon, as well as increasingly comparable between different energy resources and energy conversion technologies.
However, the GHG factors from various studies still vary quite significantly for many energy technologies, and the use of lower or higher end estimates may substantially alter the outcome of an assessment and entirely change the policy-recommendations [18]. In a typical grid, the average and marginal technologies may also be very different. Therefore, the emission factors for marginal and average production can be far apart, and those for marginal can change from one moment to another [19]. Biofuels are a known example where the assessment assumptions and the actual local conditions may significantly affect the assessment outcome [17]. Furthermore, Zhang et al. [20] demonstrate how simply a different leak rate, within typical leak range, may lead to a natural gas plant reaching a higher emissions rate than a coal plant. Farsaei et al. [21] also point out the implications that national energy policies aiming at reduced GHG emissions by closing down the most GHG intensive energy systems, can have significant impacts on wider regions with strongly connected international energy markets. Policies that fail to take these impacts into account may lead to unwanted adverse effects of increased emissions in the region due to increased import of GHG intensive electricity from other markets instead. This implies that a system-wide approach to lowering GHG emissions within the EU should be applied rather than focusing on individual country contributions in an already interlinked energy transmission system across Europe. An additional problematic issue is the combined production of heat and electricity, where the allocation choice can entirely change the split of emissions between the two outputs (e.g., [22]).

1.2.2. Primary Energy Factors (PEF) for Different Energy Systems

The concept of primary energy is generally used to define the energy content of the primary energy resource (fossil, hydro, solar, wind, geothermal, etc.) from which usable energy is produced (electricity, heat, fuels for transportation, etc.). It is widely used to describe the physical flow of energy in energy systems, comparison of national energy uses in statistical reports, and recently also as a key indicator of energy systems in energy policy [6]. Primary energy factors (PEF) describe how efficiently a flow of primary energy from an energy resource is converted into usable energy products.
The PEF is a fundamental indicator for calculating the primary energy use, either of a single building or in a broader perspective (e.g., on a regional level) in EU energy policy. The Energy Efficiency Directive (EED) relies on PEFs to account for the savings and annual reduction of primary energy use of Member States towards the target of increased energy efficiency (also closely related to the decrease of greenhouse gas emissions target) within the Union [23]. It is also fundamental for the EPBD to calculate the energy performance of buildings, where it serves as a basis for the mandatory energy performance indicator stating the primary energy use of a building in kWh/m2/year [15]. These indicators are then made visible in energy performance certificates of buildings (e.g., [24]
The definition of primary energy, and consequently, the resulting PEFs for different energy technologies, is not as straight forward as for calculating their GHG emission factors. Due to the significant differences in the physical properties of various energy resources (renewable, non-renewable, thermal resources, combustible resources, kinetic energy, photovoltaic energy, etc.), different definitions may be set for the primary energy content of each resource.
Firstly, the form of the primary energy content of the various energy resources must be defined. Definitions of how to calculate the primary energy content of different resources are given by the statistical office of the EU, Eurostat [3]. They base their definitions of primary energy content on the same basis as the International Energy Agency (IEA) and the International Recommendations for Energy Statistics (IRES) do for their energy balance statistics [2]. They all use the “physical energy content” method, where the general principle is that “the primary energy form is taken as the first flow in the production process that has a practical energy use” [3]. Furthermore, Eurostat defines three different situations of determining the primary energy content depending on the type of energy source:
  • For directly combustible energy resources (e.g., lignite, natural gas, gasoline, biogas, firewood, and combustible municipal waste), their primary energy form is defined as the heat generated during combustion [3].
  • For energy resources that are not directly combustible, the primary energy form is chosen as:
    -
    the heat content of the working fluid (the fluid that delivers the primary energy to the conversion cycle) for nuclear, geothermal, solar thermal, and ambient heat, and;
    -
    the produced electricity output from the energy conversion cycle for solar photovoltaic, wind, hydro, tide, wave and other ocean energy [3].
Secondly, the PEF of different energy systems is the conversion factor between the final usable energy product (i.e., electricity or heat) and the primary energy supplied to the energy production from the resource [25]. Therefore, the PEF states how efficiently the energy system converts primary energy from a resource to a usable energy product. A simplified general equation for calculating the PEF for energy products according to the Eurostat definition is given in Equation (1):
PEF energy   system = Primary   energy   input   from   resource Usable   energy   output = { 1   1 η ( for   most   renewables )
where η is the 1st law (thermal) efficiency of the energy conversion process. As can be seen from Equation (1), the PEF for most renewable sources becomes 1 (corresponding to 100% efficiency) due to the definition by the IEA of the primary energy content of most renewable energy resources. For other energy resources, the PEF is a function of the particular energy technology‘s thermal efficiency η .

1.2.3. Adding Life Cycle Perspectives into the PEF

The new standards for energy performance of buildings (EPB) ISO 52000-1 [25] and CEN ISO 52000-2 [26] (substituting the former ISO 15603:2007 standards on the same subject) further define the calculation methods for PEFs and discuss their application to comply with the EPBD. The EPB standards also encourage the assessment of up-stream primary energy use to extract, supply, and convert the primary energy into electricity to be included in the overall PEF value. Thus, LCA is an applicable standardized method to calculate PEF for energy systems, as it requires the inclusions of these up-stream processes (e.g., [27,28,29]). By taking the up-stream processes into account, the PEF increases according to their primary energy demand. Furthermore, the use of an LCA approach for calculating the PEF can reveal otherwise hidden primary energy inputs of energy conversion cycles, linked to their upstream processes. As an example, the use of non-renewable resources becomes evident even in the production of energy products from renewable sources as energy, often of non-renewable origin, to manufacture equipment, materials, and constructing facilities is taken into account in the calculation of the PEF. The same benefits of using LCA applies to the calculation of the GHG emission factor.

1.2.4. Possible Implications of PEFs for Different Energy Systems on EU Climate and Energy Targets

As discussed in the sections above, the various definitions of the primary energy content of energy resources and fuels have a substantial impact on the results for the PEF for different energy technologies. These definitions have had some debate, mainly due to the possible implications and negative side-effects they may have on the comparison of different energy systems and their accountability towards the key energy and climate targets (e.g., [7,30]).
As an example, the share of renewables in a country‘s reported primary energy mix may seem low if it consists of a mix of non-thermal renewables (e.g., wind, solar-voltaic, hydro) and non-renewable resources. The PEF for the renewables is defined as 1, as opposed to a PEF ranging from 2–4 for the non-renewables. This can lead to an underrepresentation of the share of renewables in the country‘s energy mix compared to the non-renewables that have more weight in the primary energy mix due to their higher PEFs.
Another example to be mentioned is the use of thermal renewable resources, such as geothermal and solar thermal energy. In the case of these resources, the primary energy is defined as the heat content of the working fluid. The PEFs are calculated from their thermal efficiencies, which are relatively low compared to, e.g., high-efficiency fossil fuel plants. This definition results in a possible overrepresentation of the importance of these resources. Due to their high PEF value of up to 10 for electricity from geothermal resources [3], compared to 1 for other non-thermal renewables, the renewable share of primary energy use in countries relying on those resources becomes exaggerated compared to using other renewable technologies in combination with non-renewable sources.
In the context of buildings, one of the main sectors of PEF utilization through the EPB directive, the use of primary energy instead of delivered energy to assess buildings’ energy performance has been debated due to similar reasons mentioned above. As an example of the implication PEF has on the reported energy performance of a building, the choice of energy source can dictate the measures taken to improve the building’s energy efficiency. By choosing an energy source with low PEF for heat demand, such as using renewable biomass (with PEF of 1) instead of gas (with a relatively high PEF), the building has improved its energy efficiency manifold according to the EPBD [4]. In contrast, nothing has been done to improve the energy systems’ efficiency for the building itself to achieve improvement. Although it is vital to encourage the use of efficient and clean energy resources, technological advances in the energy performance of various systems are also crucial for developing nearly zero-energy buildings and a lower-carbon future. There is a risk of using primary energy demand as a measure of a buildings’ energy performance that can undermine such energy system innovation.
The EED defines the energy efficiency target of at least 32.5% by 2030. It results in the requirement that EU’s “2030 energy consumption has to be no more than 1273 Mtoe of primary energy and/or no more than 956 Mtoe of final energy. This means that primary energy consumption in the Union should be reduced by 26%, and final energy consumption should be reduced by 20% compared to the 2005 levels.” [23] (par. 10). As indicated by the statement of targets for primary “and/or” final energy use, the use of primary energy calculations is somewhat optional in the EED directive. Thus, Member States may choose whether to calculate energy efficiency improvements in either final or primary energy use. In that respect, the PEF has less significant implications on different energy resources concerning the energy efficiency targets.
However, the EED does not discourage the use of primary energy as a measure, nor does it address the potential implications of the concept of primary energy on different energy resources. Since the market share of the two thermal renewable sources, geothermal and solar-thermal energies is only marginal, it is likely that the implications of the EED on these technologies have not been sufficiently assessed and addressed within the policy framework.
Additionally, since the EED equally states efficiency improvement targets for primary and final energy use, it enables the negative implications of the thermal renewables in international energy statistics reports showcasing primary energy use. Readily available global energy statistics are often used to compare national primary energy use to energy policy targets and can thus be used to draw erroneous conclusions on an alleged ill-performance of individual countries that rely on such low-efficiency renewables. An example of such erroneous conclusions is evident in Section 1.3.2 below.

1.2.5. Response to Criticism on the Definition of Primary Energy Content for Renewable Energy Technologies

As previous sections describe, concerns have been raised on the use of primary energy as a basis for energy statistics, targets, and policies due to the different methodologies used to define the primary energy content. As a response to this discussion, the IEA published a commentary on the subject on its website explicitly addressing the topic. They argue that these definitions for energy resources and fuels have been based on various consultation processes involving multiple stakeholders dealing with energy statistics around the world, resulting in an agreed methodology [2]. The IEA furthermore stresses that the interpretation of energy statistics must be made with a proper understanding of the underlying assumptions and definitions that might affect what results can be extracted from these standardized and internationally agreed energy statistic methods. For interpretation of data on primary energy use, such as assessments on the share of renewables within different countries, assessments on final energy use and electricity generation should also be reviewed in context.
Here, there may have been an under-representation of thermal renewables within the consultation work process, due to their historic low market share. Also, the negative implications connected to future energy policy regarding the agreed-upon methods for defining the primary energy content of those resources may have been unforeseen. Whatever the reason, the resulting methodology on the primary energy content of thermal renewables may be criticized for being erroneous and out of sync with the definition of the primary energy content of other renewables, especially in the light of the previously mentioned implications of these definitions on the status of thermal renewables within current EU energy policy.

1.3. High-Temperature Geothermal Energy in the EU’s Energy Policy

In light of the above discussions on the definition of the primary energy content of various energy resources and its relevance to the EU’s 2030 key energy and climate targets, the role of thermal renewable energy resources, such as geothermal and solar thermal, in the EU’s future energy mix becomes particularly interesting. Since their primary energy factors become considerably higher than other PEFs for renewables, the utilization of these resources can contradict the targets aiming at improved energy efficiency in terms of primary energy use. Geothermal energy is of particular interest, as the definition of the PEF for electricity of geothermal origin generally has a value of 10 (compared to PEF of 1 for most renewable electricity), making geothermal an outlier in the values for PEFs for different energy resources and fuels.
It is typical to classify geothermal resources into high-temperature and low-temperature resources. There are multiple proposed classification methods based on various properties of the resource. In the simplest form, high-temperature geothermal resources are of volcanic origin, while low-temperature resources draw heat from the general heat flow of the earth’s crust [31]. Typically, high-temperature resources are used to produce electricity. In contrast, low-temperature resources are more suitable for direct utilization, e.g., for heating purposes, swimming and bathing, heating greenhouses, etc. However, low-temperature resources can also generate electricity by using binary cycle technology, if the temperature of the produced geothermal fluid is high enough [32]. Subsequently, high-temperature utilization often produces valuable effluent heat that can be used for the same purposes as low-temperature resources.
Geothermal power plants can be found in 11 European countries, with an installed total capacity of ~3.4 GWel. If these plants were run on 100% capacity, they would account for only 0,4% of the net generated electricity in Europe based on data from 2017 [33]. The leading European countries in geothermal electricity generation are Turkey, Italy, and Iceland due to their access to vast high-temperature resources [34]. Direct utilization is reported in 34 European countries with around 32 GWth installed and 264,843 TJ/year of use. In fact, European countries dominate the top five countries worldwide in the direct use of geothermal in terms of MWth and TJ per land area (100 km2). Sweden, Germany, and Finland have extensive use of geothermal ground source heat pumps while Iceland, Turkey, France, Germany use geothermal resources directly for space heating. Turkey, Netherlands, Russia, and Hungary use geothermal energy to heat greenhouses and for ground heating for growing vegetables and flowers [35].
Electricity generation from geothermal resources worldwide increased by almost 30% from the year 2015 to 2020. It is further projected to increase by nearly 20% from 2020 to 2025 [34]. Direct use is growing faster than power production worldwide, as it rose more than 50% from 2015 to 2020, mostly due to a substantial increase in the installation of geothermal heat pumps, followed by an increase in utilization for space heating, bathing, and swimming. Thus, there is a growing demand for utilizing geothermal energy worldwide for producing valuable energy products with low emissions.

1.3.1. GHG Emissions from High-Temperature Geothermal

The utilization of geothermal resources generally results in low emissions of GHG compared to conventional energy resources (e.g., [17,36,37]). The highest emissions from geothermal exploitation stem from utilizing high-temperature resources [8]. In high-temperature geothermal reservoirs, hot fluid interacts with the surrounding rock that results in the dissolution of gases and various minerals from the rock to the geothermal fluid. The gases travel with the fluid to the plant above the surface, and are either released to the atmosphere or treated with an abatement method. These gases are mainly CO2, H2S, and CH4, yet the gas content of geothermal fluid may vary significantly between different reservoirs.
Emission values ranging from 7–740 g/kWh with a weighted average emission of 122 g/kWh have been reported for direct emissions from geothermal power plants [38]. Furthermore, the Intergovernmental Panel on Climate Change (IPCC) issued a review on published life cycle emissions for geothermal in the range of 6–79 g/kWh, where the scarcity of LCA studies on geothermal utilization likely explains the lower range reported for LCA emissions than direct emissions. GHG emissions for conventional fossil fuel generation plants are reported in the range of 833–1297 g/kWh for coal-fired plants, 386–605 g/kWh for gas-fired and 641–1462 g/kWh for oil-fired plants [39].
Extremely high CO2 emission values (up to 1300 g/kWh) have, however, been reported for geothermal power plants in Turkey, resulting in higher emissions than new-generation coal power plants. These high emission factors for geothermal utilization seem to be rare and bound to high-temperature areas located in carbonate-rich rocks, such as in selected cases within Turkey, Italy, and New Zealand [40]. An example of low emission factors from high-temperature geothermal power is found in Iceland, where the average emission factor of 26 g/kWh is reported by the National Energy Authority [41].
The Renewable Energy Directive (RED) promotes geothermal energy as an important local renewable energy source but recognizes the rare cases of greenhouse gas emissions being substantial from geothermal utilization. Therefore, the RED is only intended to facilitate the development of low-emitting geothermal utilization [16].

1.3.2. Primary Energy Factor for Geothermal

As stated before, the PEF for geothermal electricity is defined by default as 10, representing an assumed 10% average thermal efficiency of geothermal power plants [3]. For thermal production from geothermal resources, a default conversion efficiency of 50%, resulting in a PEF of 2, is also defined by the International Energy Agency [2].
A worldwide review on the efficiency of geothermal power plants by Zarrouk and Moon [42] publishes a range of efficiencies for geothermal power production from published data from 94 plants. The study reports efficiency values as low as 1% for low-temperature geothermal utilization, and up to 21% for high-temperature utilization. Corresponding PEF values would be 100 for the lower efficiency and 4.8 for the higher efficiency values. Zarrouk and Moon [42] further concluded an average efficiency of 12% for geothermal power production, resulting in a PEF of 8.3. Thus, the default EU value for geothermal PEF is significantly higher than the efficiency statistics of current geothermal technologies would support.
Even if the default PEF for geothermal would be updated to represent reported efficiencies better, the PEF for geothermal would still be higher than most, if not all, PEFs for non-renewable energy technologies. Harmsen et al. [5] realized this and discuss how the PEF for geothermal leads automatically to increased primary energy use compared to all other energy resources, including those from fossil-fuels as they have lower PEFs than geothermal.
These negative implications of the PEF for geothermal are already finding their way into official energy statistics, as can be seen from the European Environmental Agency track report on the EU energy and climate targets [43]. The report presents an enormous increase in primary energy use in Iceland after the year 2005, thus pointing out that the country is on the wrong track regarding energy efficiency measures compared to the EU Member States. The fact is, however, that two new geothermal power plants came online in the years 2006–2012, and with a PEF of 10, they account for this substantial increase, which would have been ten times lower if the plants were, i.e., of hydropower origin (thus, with a PEF of 1). This implication of the different definitions of primary energy content to calculate the PEF is a significant factor in the criticism of using PEFs as an energy efficiency measure in policymaking, as well as compiling and publishing the national PE use in international energy statistics without clearly stating the limitations of such presentation of energy data.

1.3.3. Combined Heat and Power Production from High-Temperature Geothermal Resources in Context with EU’s Energy Policy

Geothermal energy is particularly suited for combined heat and power (CHP) production in locations where there is access to geothermal resources in close vicinity to heat demand. Geothermal CHP plants can be found in various locations around the world, examples including Austria, Germany, Iceland, USA, and Thailand [44,45]. In these CHP cases, the challenge of a fair allocation of environmental impacts, cost, fuel/primary energy input, etc. between the two valuable products (electricity and heat) arises. The method chosen for allocation will significantly affect the outcome of the two key indicators for GHG emissions and primary energy for the electricity and heat outputs of those plants.
In CHP plants, the production of electricity and heat is so interlinked that there is no straight-forward way of partitioning inputs and outputs between them. Discussion of correct, fair, or preferred allocation method for CHP plants is both current and somewhat non-conclusive within the CHP industry, energy policy, and statistics. The three main EU directives supporting the key energy and climate targets, the RED, EED, and EPBD, include, or refer to, a discussion on allocation factors for CHP production related to the calculation of GHG emissions or the PEF.
The RED discusses the allocation of GHG emissions from CHP production and recommends using the energy allocation method. However, the EED only discusses the allocation of emissions in connection with the use of biomass fuels and bioliquids for CHP production [16]. The EED thus seems to omit the possibility of utilizing geothermal energy for CHP production. Nevertheless, it can be assumed that the EED would recommend the use of energy allocation across all renewable energy sources used to produce CHP.
The EED focuses on the primary and end energy use and supports the energy efficiency target. The PEF is, therefore, a key indicator in context to the EED to account for the primary energy use. The EED shortly addresses the need for allocation of primary energy share to electricity from CHP plants and refers directly to Annex II to Directive 2012/27/EU for the methodology to be applied [23]. The method given in Directive 2012/27/EU is based on comparing the CHP actual production efficiencies to efficiency reference values for separate production processes of electricity and heat. Although the method is not given a title in the Annex, it is fully compatible with the so-called „Finnish method“, also called the Alternative Generation Method (AGM) [46].
The EPBD relies strongly on PEFs as they are essential to calculate the required primary energy use of a building, so allocation of primary energy in CHP production is an issue in the EPBD. The directive itself does not address the allocation issues connected to the energy supplied to a building from CHP production but refers to the calculation methodology of the ISO 52000 standard series [15]. The ISO standards that address allocation issues for CHP production are ISO 5200-1:2017 and 5100-02:2017 [25,26], with the addition of the European standard EN 15316-4-5:2017 [47]. The EN 15316 has the most elaborate discussion on allocation methods to be used for co-produced electricity and heat, and lists the following methods: Power loss method, Carnot method (comparable with the commonly used exergy method in LCA allocation procedures), Alternative production method (compatible with the AGM mentioned above), Residual heat method, and the Power loss ref method. These methods are all showcased for the allocation of the primary energy and it is not specified in the standards if they should also be used for the allocation of GHGemissions.
It is evident from the above discussion that there is a lack of consistency in the energy and climate policy framework between recommendations or requirements of allocation methodology for calculating the GHG emission factor and the PEF of electricity and heat from CHP technologies. Additionally, there is a reasonably large selection of methods given for the PEF calculations that differ significantly in their methodology. As an attempt of the authors to reach consistency between the different directive requirements or suggestions, the energy allocation method should be used to allocate GHG emissions between electricity and heat, while the AGM is a commonly suggested method for PEF calculations in both the EED and the ISO standards supporting the EPBD. The use of two different methods for the two key indicators for energy technologies, however, is not ideal and should be revised to define a single method for both indicators for further consistency between the different directives.
In the context of geothermal CHP plants, a problem arises using the AGM for allocation within high-temperature geothermal CHP plants because there is no real alternative method practiced to produce heat from high-temperature resources. Such resources are almost always used for electricity generation, or in some cases, for CHP production, but not for heat production alone.
The methods and results sections in this paper showcase the outcome of using different allocation methods, including the AGM and the energy allocation method along with other commonly used allocation methods in LCA, on the PEF and GHG emission factor for the technical example given in this study.

2. Materials and Methods

In the sections below, we present a technical example of the largest geothermal power plant in Iceland. The case is used in the study to evaluate the implications of the current EU energy policy using primary energy factors as a performance indicator on the future development of geothermal energy in Europe. Furthermore, the power plant also produces heat for district heating. Thus the complexity of allocation also applies to the example, giving a basis for discussion on the different methods used within the CHP industry and EU climate and energy policy for CHP plants. The example derives from a life cycle assessment study on the Hellisheidi geothermal CHP plant in Iceland, previously published by the authors in [8,48].

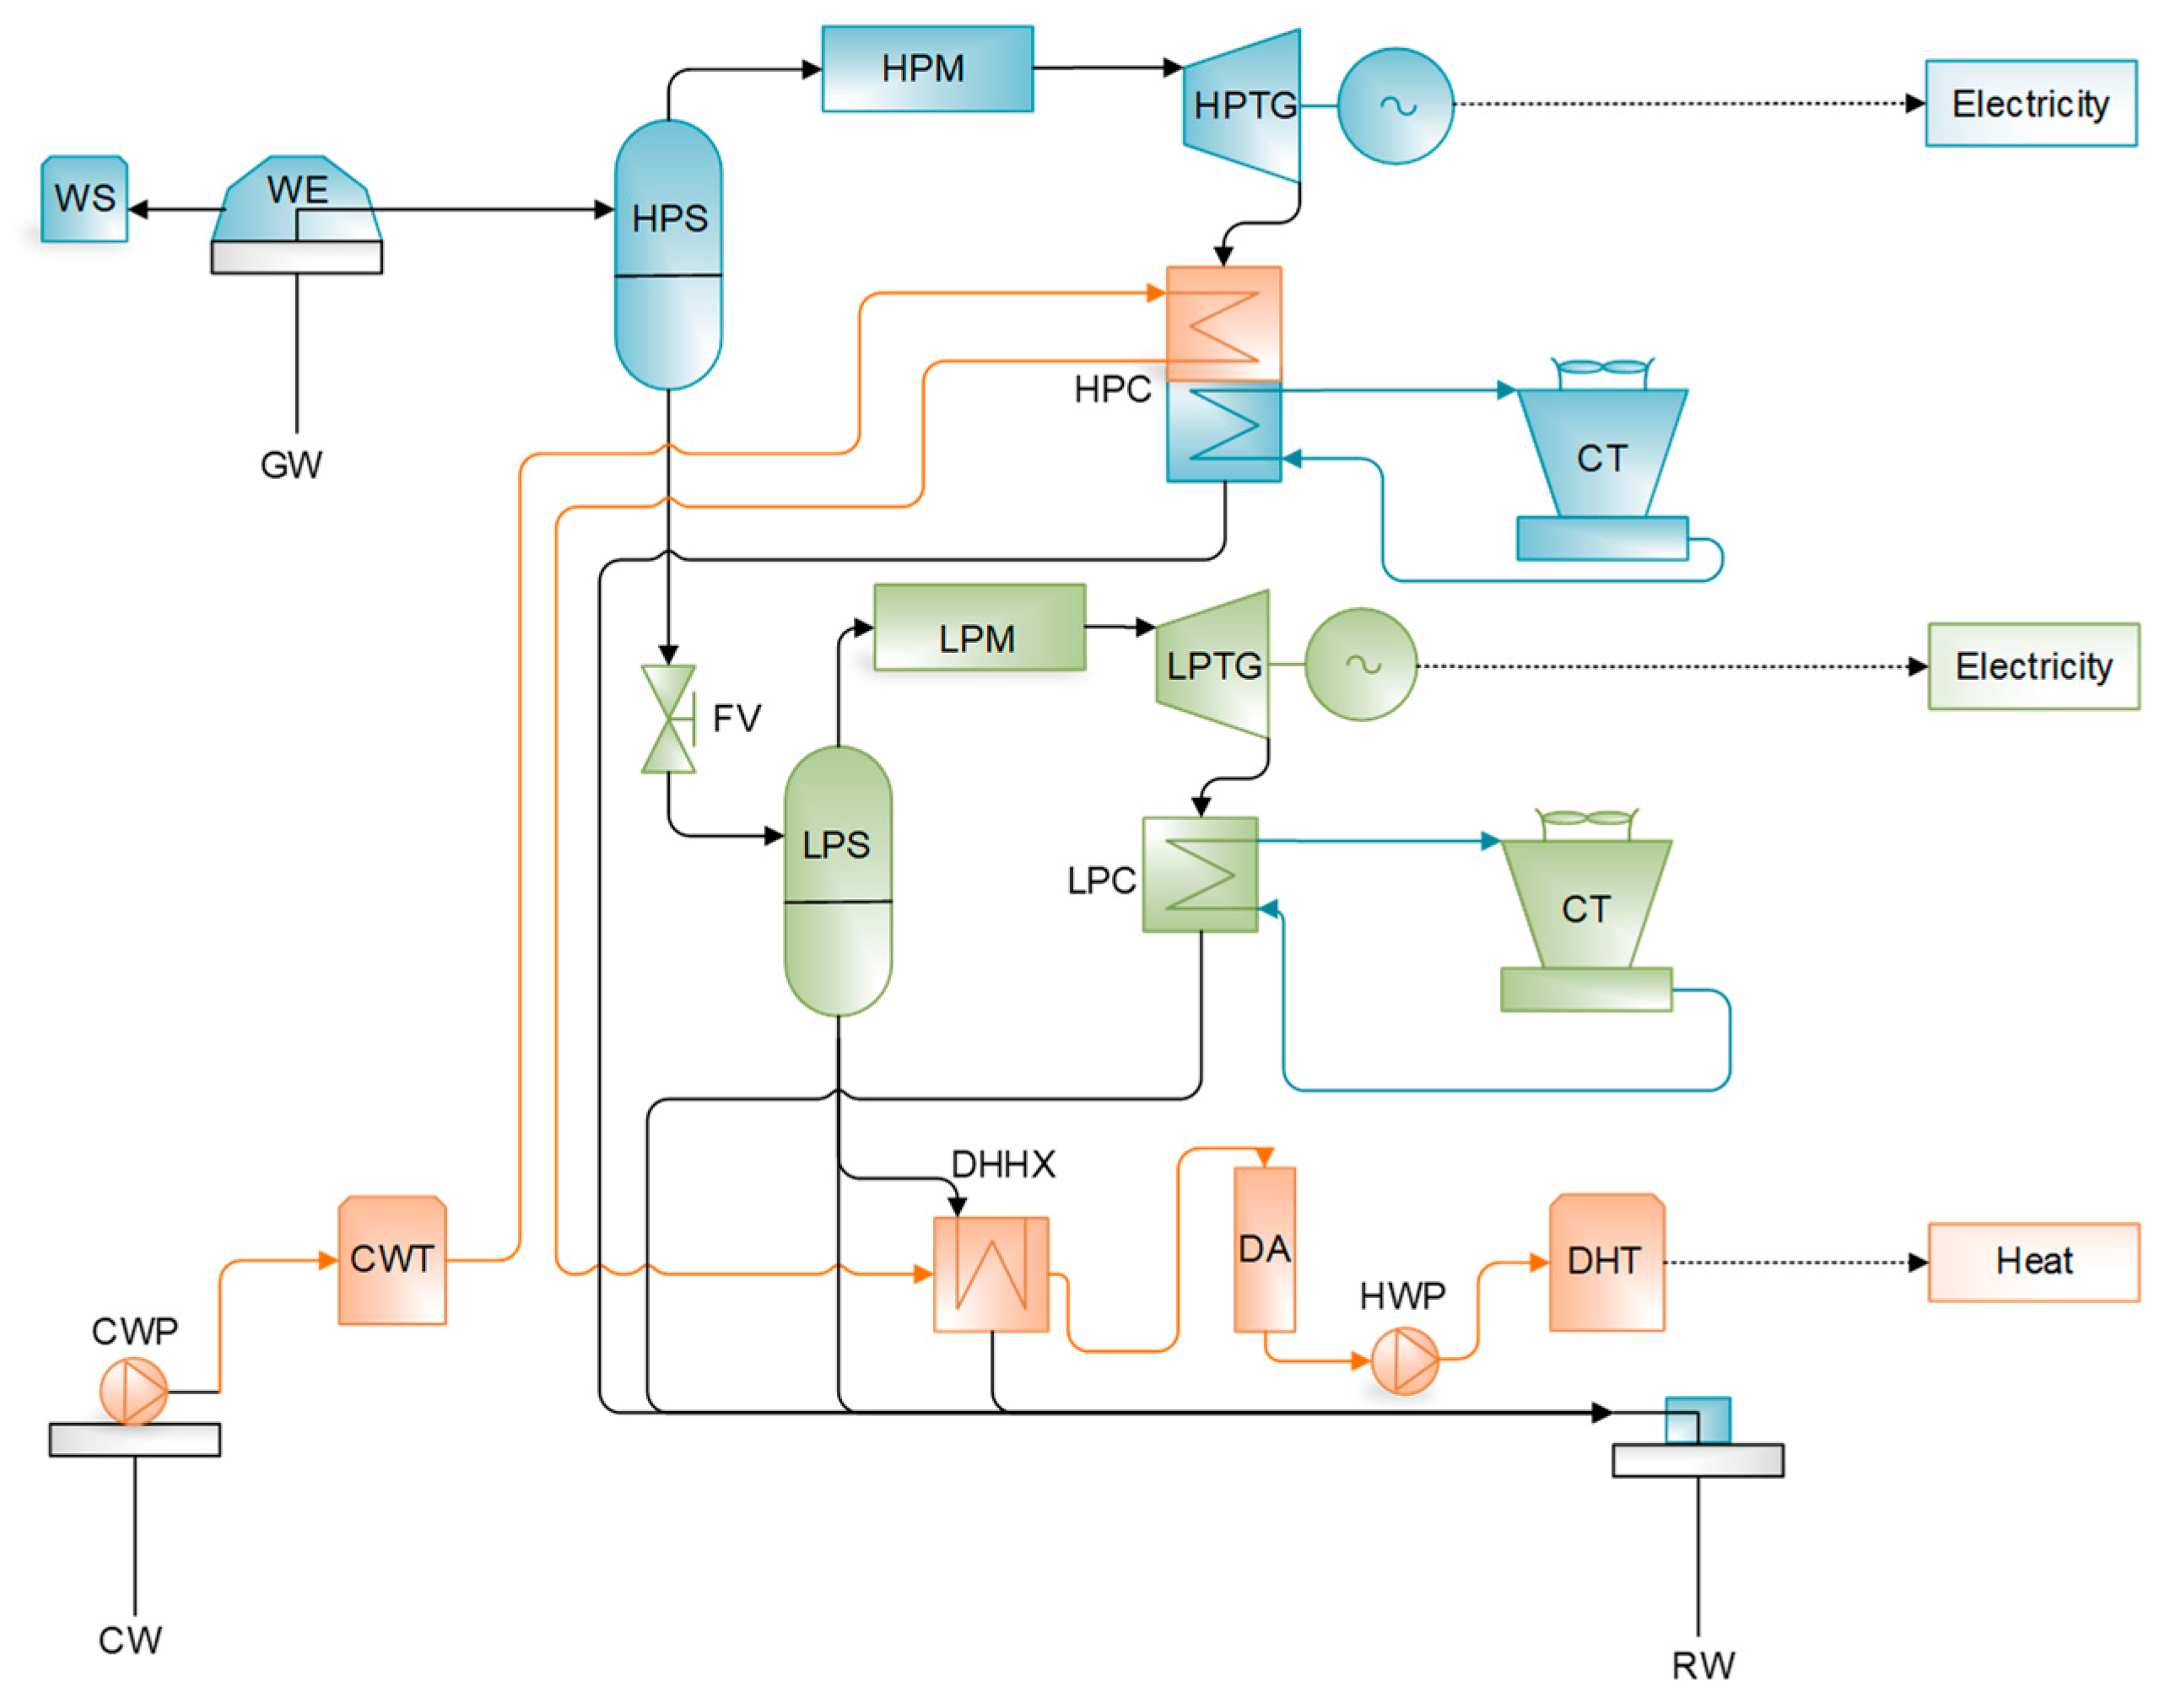
2.1. Case Study: Hellisheidi Geothermal Combined Heat and Power Plant

Hellisheidi CHP plant is located on the Hengill high-temperature area, roughly 20 km from the capital city of Reykjavik in south-west Iceland. It was built due to the increasing heat demand of the capital region, and the growing demand for electricity primarily based on the expanding aluminum industry [49]. The Hellisheidi CHP plant produces 303 MWel of power and has a current thermal capacity of 200 MWth of hot water production for district heating and hot tap water purposes. The plant has further possibilities for expansion of thermal output up to 400 MWth in the future to meet the capital’s growing heat demand.
A schematic of the Hellisheidi CHP plant is given in Figure 1. The electricity generation process is a so-called double flash cycle, producing electricity from steam at two separate pressure stages (denoted in blue for the high-pressure stage and green for the low-pressure stage in Figure 1). The double flash technology allows for increased efficiency of the conversion process compared to a single pressure stage. Waste heat from the electricity generation process, as well as the available heat “leftover” from the geothermal fluid effluent, is used to heat groundwater to about 83 °C for the district heating network (process flow is shown in orange in Figure 1).
The overall electrical capacity of the plant accounts for 40% of the installed capacity from geothermal resources in Iceland while covering around 10% of the total installed capacity from hydro, geothermal, fuel (for emergency power) and wind combined, according to the Icelandic National Energy Authority [50]. For the heat demand, Hellisheidi is expected to expand gradually to meet the future demand for heat for space heating within the capital region.

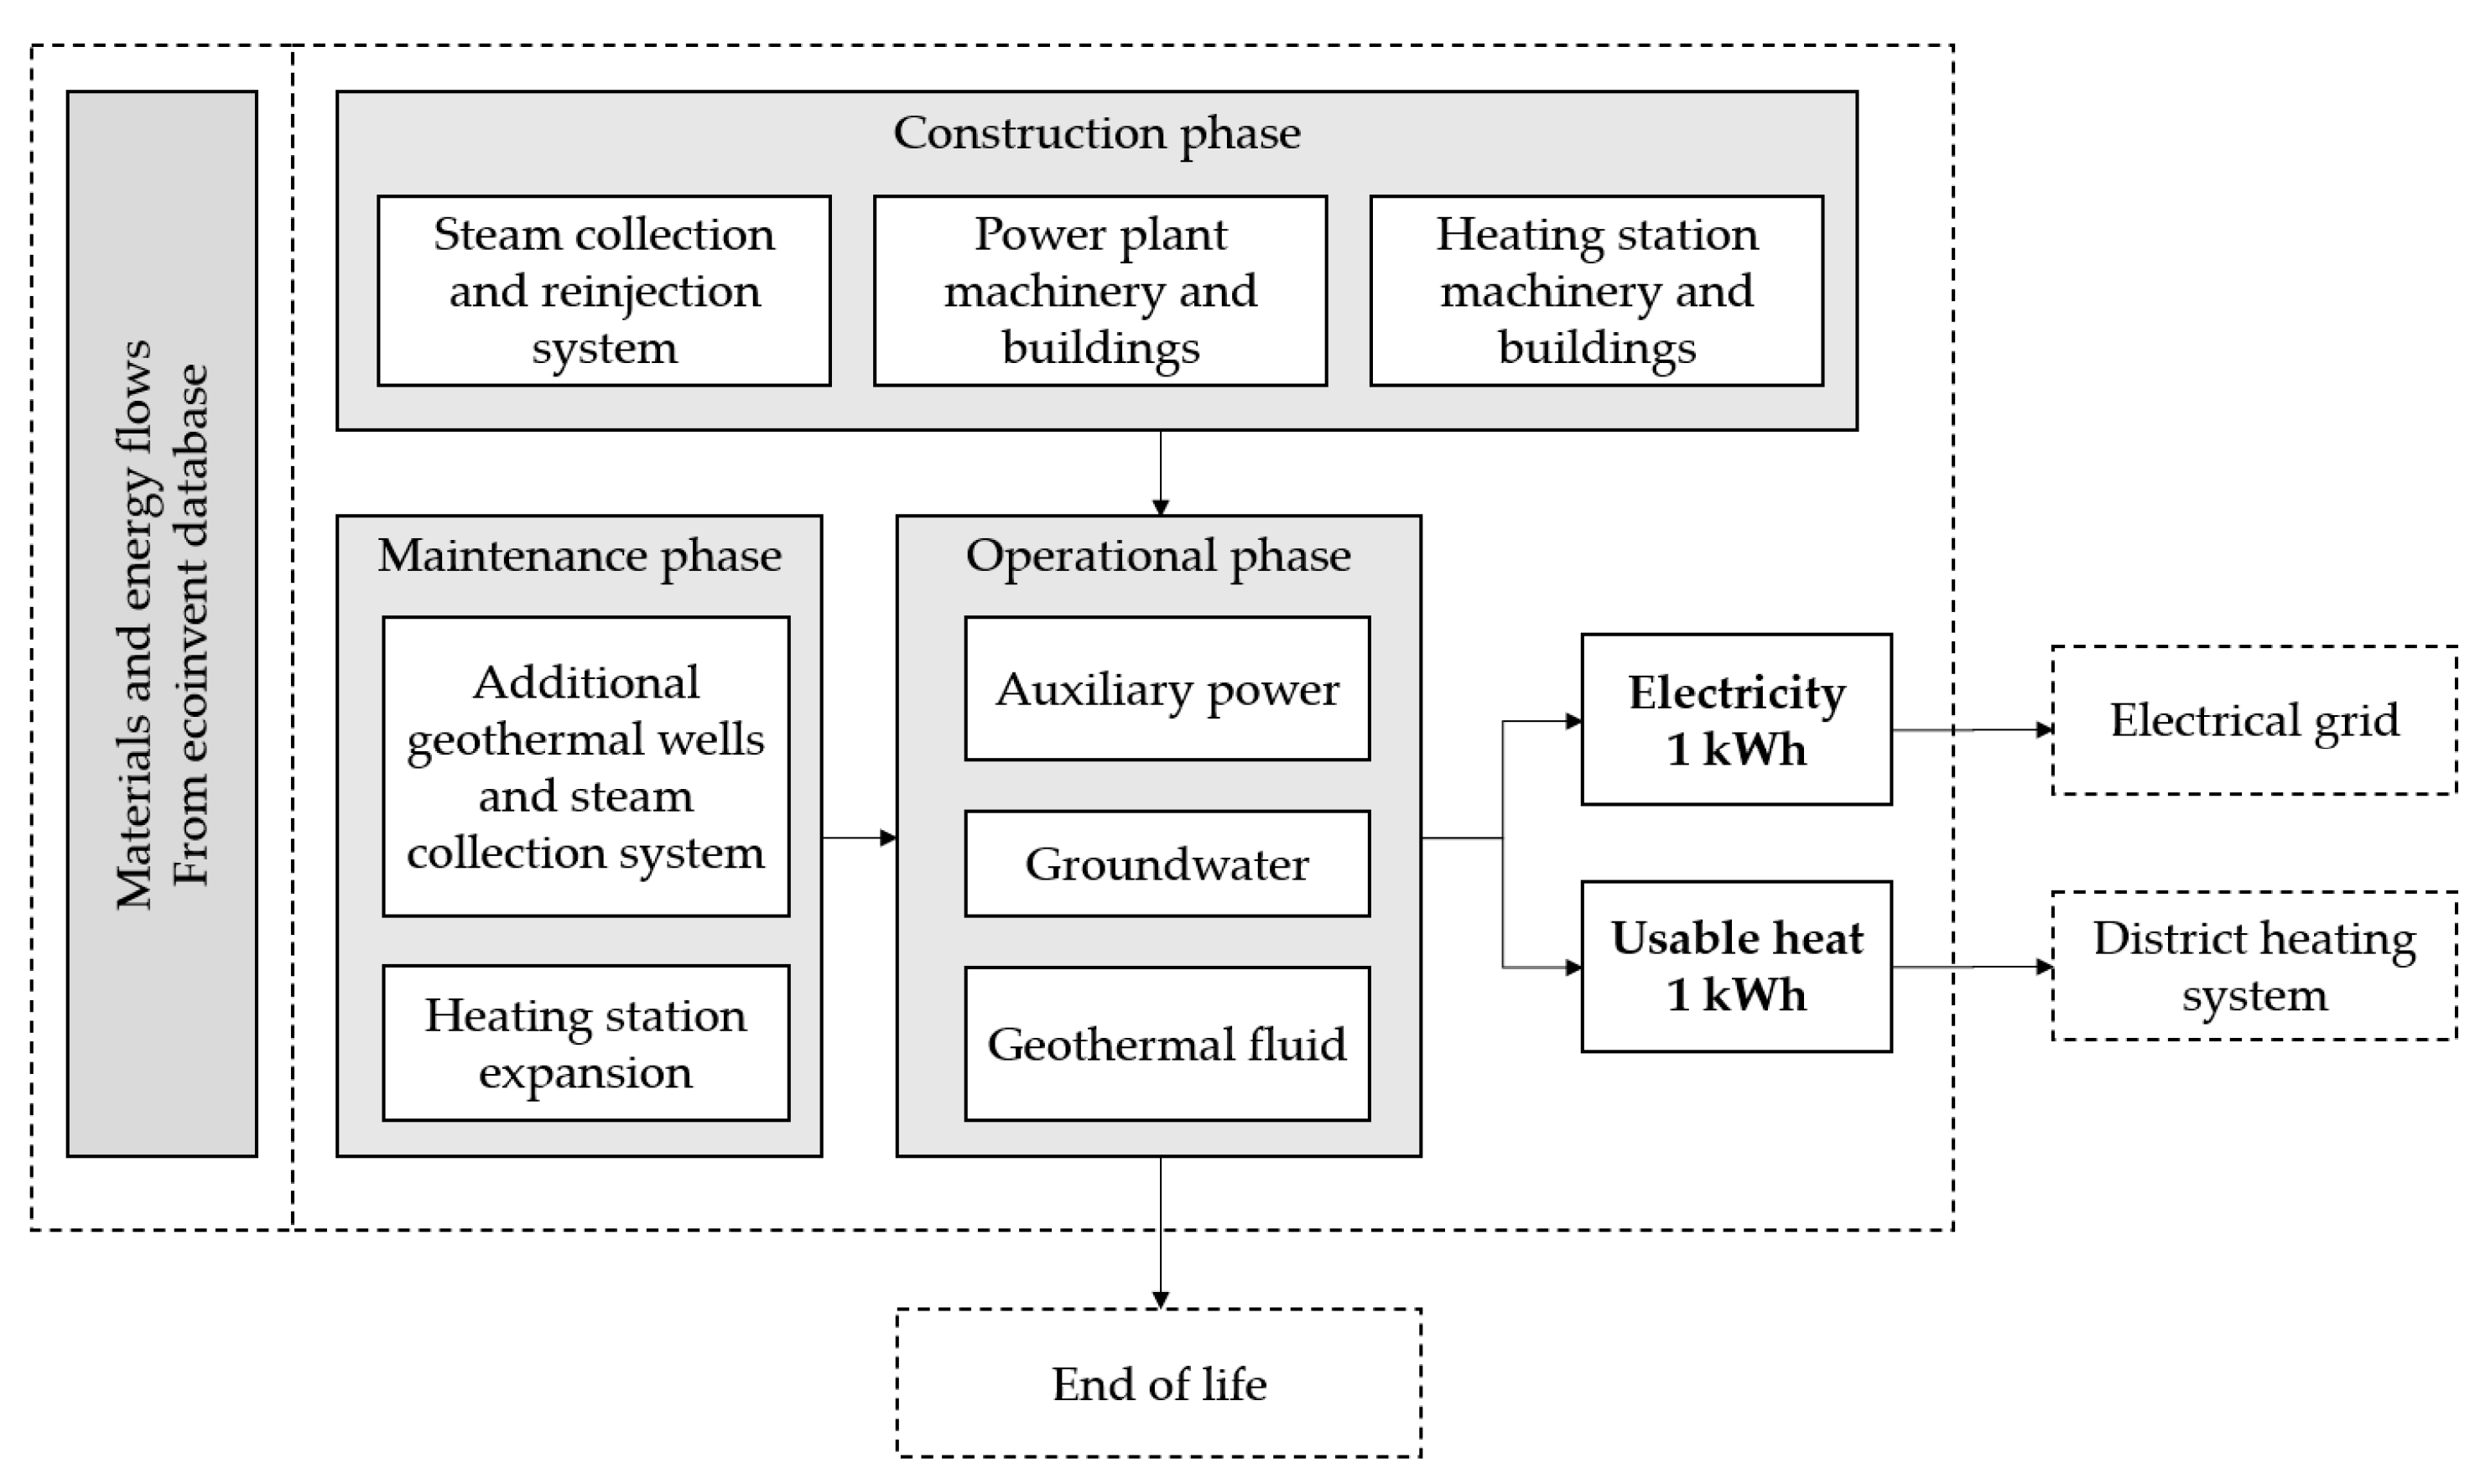
2.2. Life Cycle Assessment (LCA) of the Hellisheidi GCHP Plant

Two detailed studies on the life cycle assessment (LCA) and the life cycle inventory (LCI) for the Hellisheidi geothermal CHP plant have been previously published by the authors [8,48]. The studies followed the methodology framework defined by the standards ISO 14040:2006 and ISO 14044:2006 [51,52].
The LCI study [48] publishes a detailed set of inventory data for Hellisheidi for the processes shown in Figure 2. The inventory was collected from primary data on the plant‘s construction, operation, and maintenance while using secondary data for accounting for material- and energy flow inputs retrieved from the ecoinvent v2.0 database (developed by the ecoinvent association, Zurich, Switzerland). The data set is presented such that it can be used as a reference for other LCA studies on high-temperature geothermal power and heat production processes. It allows for scaling the Hellisheidi data to suit geothermal power and heat plants with different installed capacity and different technological setups. Thus, the dataset serves as primary data for LCA of the Hellisheidi plant, but as secondary (or reference) data for potential LCA studies on other high-temperature geothermal plants.
The LCA study [8] further assesses the life cycle environmental impacts of electricity and heat production from the Hellisheidi plant. It uses the SimaPro 8 software (developed by PRé Sustainability, Amersfoort, The Netherlands) and the ecoinvent v3.4 database for data modeling and analysis. The environmental impacts were calculated using the CML-IA baseline method (developed by the Institute of Environmental Sciences, Centrum voor Milieuwetenschappen, at Leiden University, the Netherlands [28]) for GHG emissions and other environmental impact categories such as acidification potential, human toxicity, depletion of abiotic resources, etc. The cumulative energy demand (CED) method [53] was used to calculate the primary energy factors (total PEF, non-renewable PEF, and renewable PEF). Furthermore, the energy allocation method was applied (described as method C in the current study) to divide environmental impacts and CED between the two products, electricity, and heat.
The main goals of the two studies were:
  • To provide a detailed dataset for high-temperature geothermal heat- and power generation technology to be used in other LCA studies as a reference, as these studies are scarce [48].
  • To investigate the life cycle environmental impacts of high-temperature geothermal heat and power production [8].
  • To examine the contribution of different life cycle stages of high-temperature geothermal heat- and power production to the overall environmental impacts to see if hidden impacts occur in upstream or downstream life cycle stages compared to the operational life cycle stage [8].
  • To investigate the effects of operational improvements implemented during the first decade of operation of the Hellisheidi CHP plant on the overall life cycle environmental impacts compared to a base case scenario. This was done by comparing the operation scenario from 2012, where no abatement system for gaseous emissions was present, to the operation scenario from 2017 when abatement methods had been installed for gaseous emissions [8].
The system boundary for the LCA on the Hellisheidi CHP plant is shown in Figure 2. The study is a “cradle-to-gate“ study as it does not include the transmission losses in electrical and district heating networks as these are outside of the scope of the study. Furthermore, the environmental impacts of the end-of-life (EOL) phase are outside the system boundary, as multiple LCA studies on geothermal power plants have shown a negligible contribution of EOL to the overall LCA results [54,55,56].

2.3. Calculation of Primary Energy Factor for Geothermal Utilization

The primary energy factor for the Hellisheidi CHP plant is evaluated by:
(1)
Calculating the primary energy content with basic thermodynamic equations based on the enthalpy (heat content) of the geothermal fluid extracted from the resource as instructed by the EU climate and energy policy framework. Since the spent geothermal fluid is reinjected back down to the reservoir after utilization within the power plant, the primary energy content of the reinjected fluid is subtracted from the extracted primary energy.
(2)
Using historical and forecasted operational input and output parameters of primary energy flow and corresponding production of electricity and heat from the plant to calculate the average PEF for the energy products over a 30-year technical lifetime scenario.
(3)
Using life cycle assessment (LCA) to account for primary energy use to extract, supply, and convert the geothermal energy to electricity and heat. LCA considers the whole value-chain within the system boundary of the power plant, as explained above in Section 2.2. The Cumulative Energy Demand (CED) method was used to calculate the final primary energy use of the power plant per produced unit of electricity and heat. The results generated by the CED method allows for a break-down of the primary energy factor into non-renewable and renewable PEFs.
(4)
Using different allocation methods to divide the primary energy input between electricity and heat outputs to calculate the separate PEF for each energy product. These are further discussed in Section 2.4.

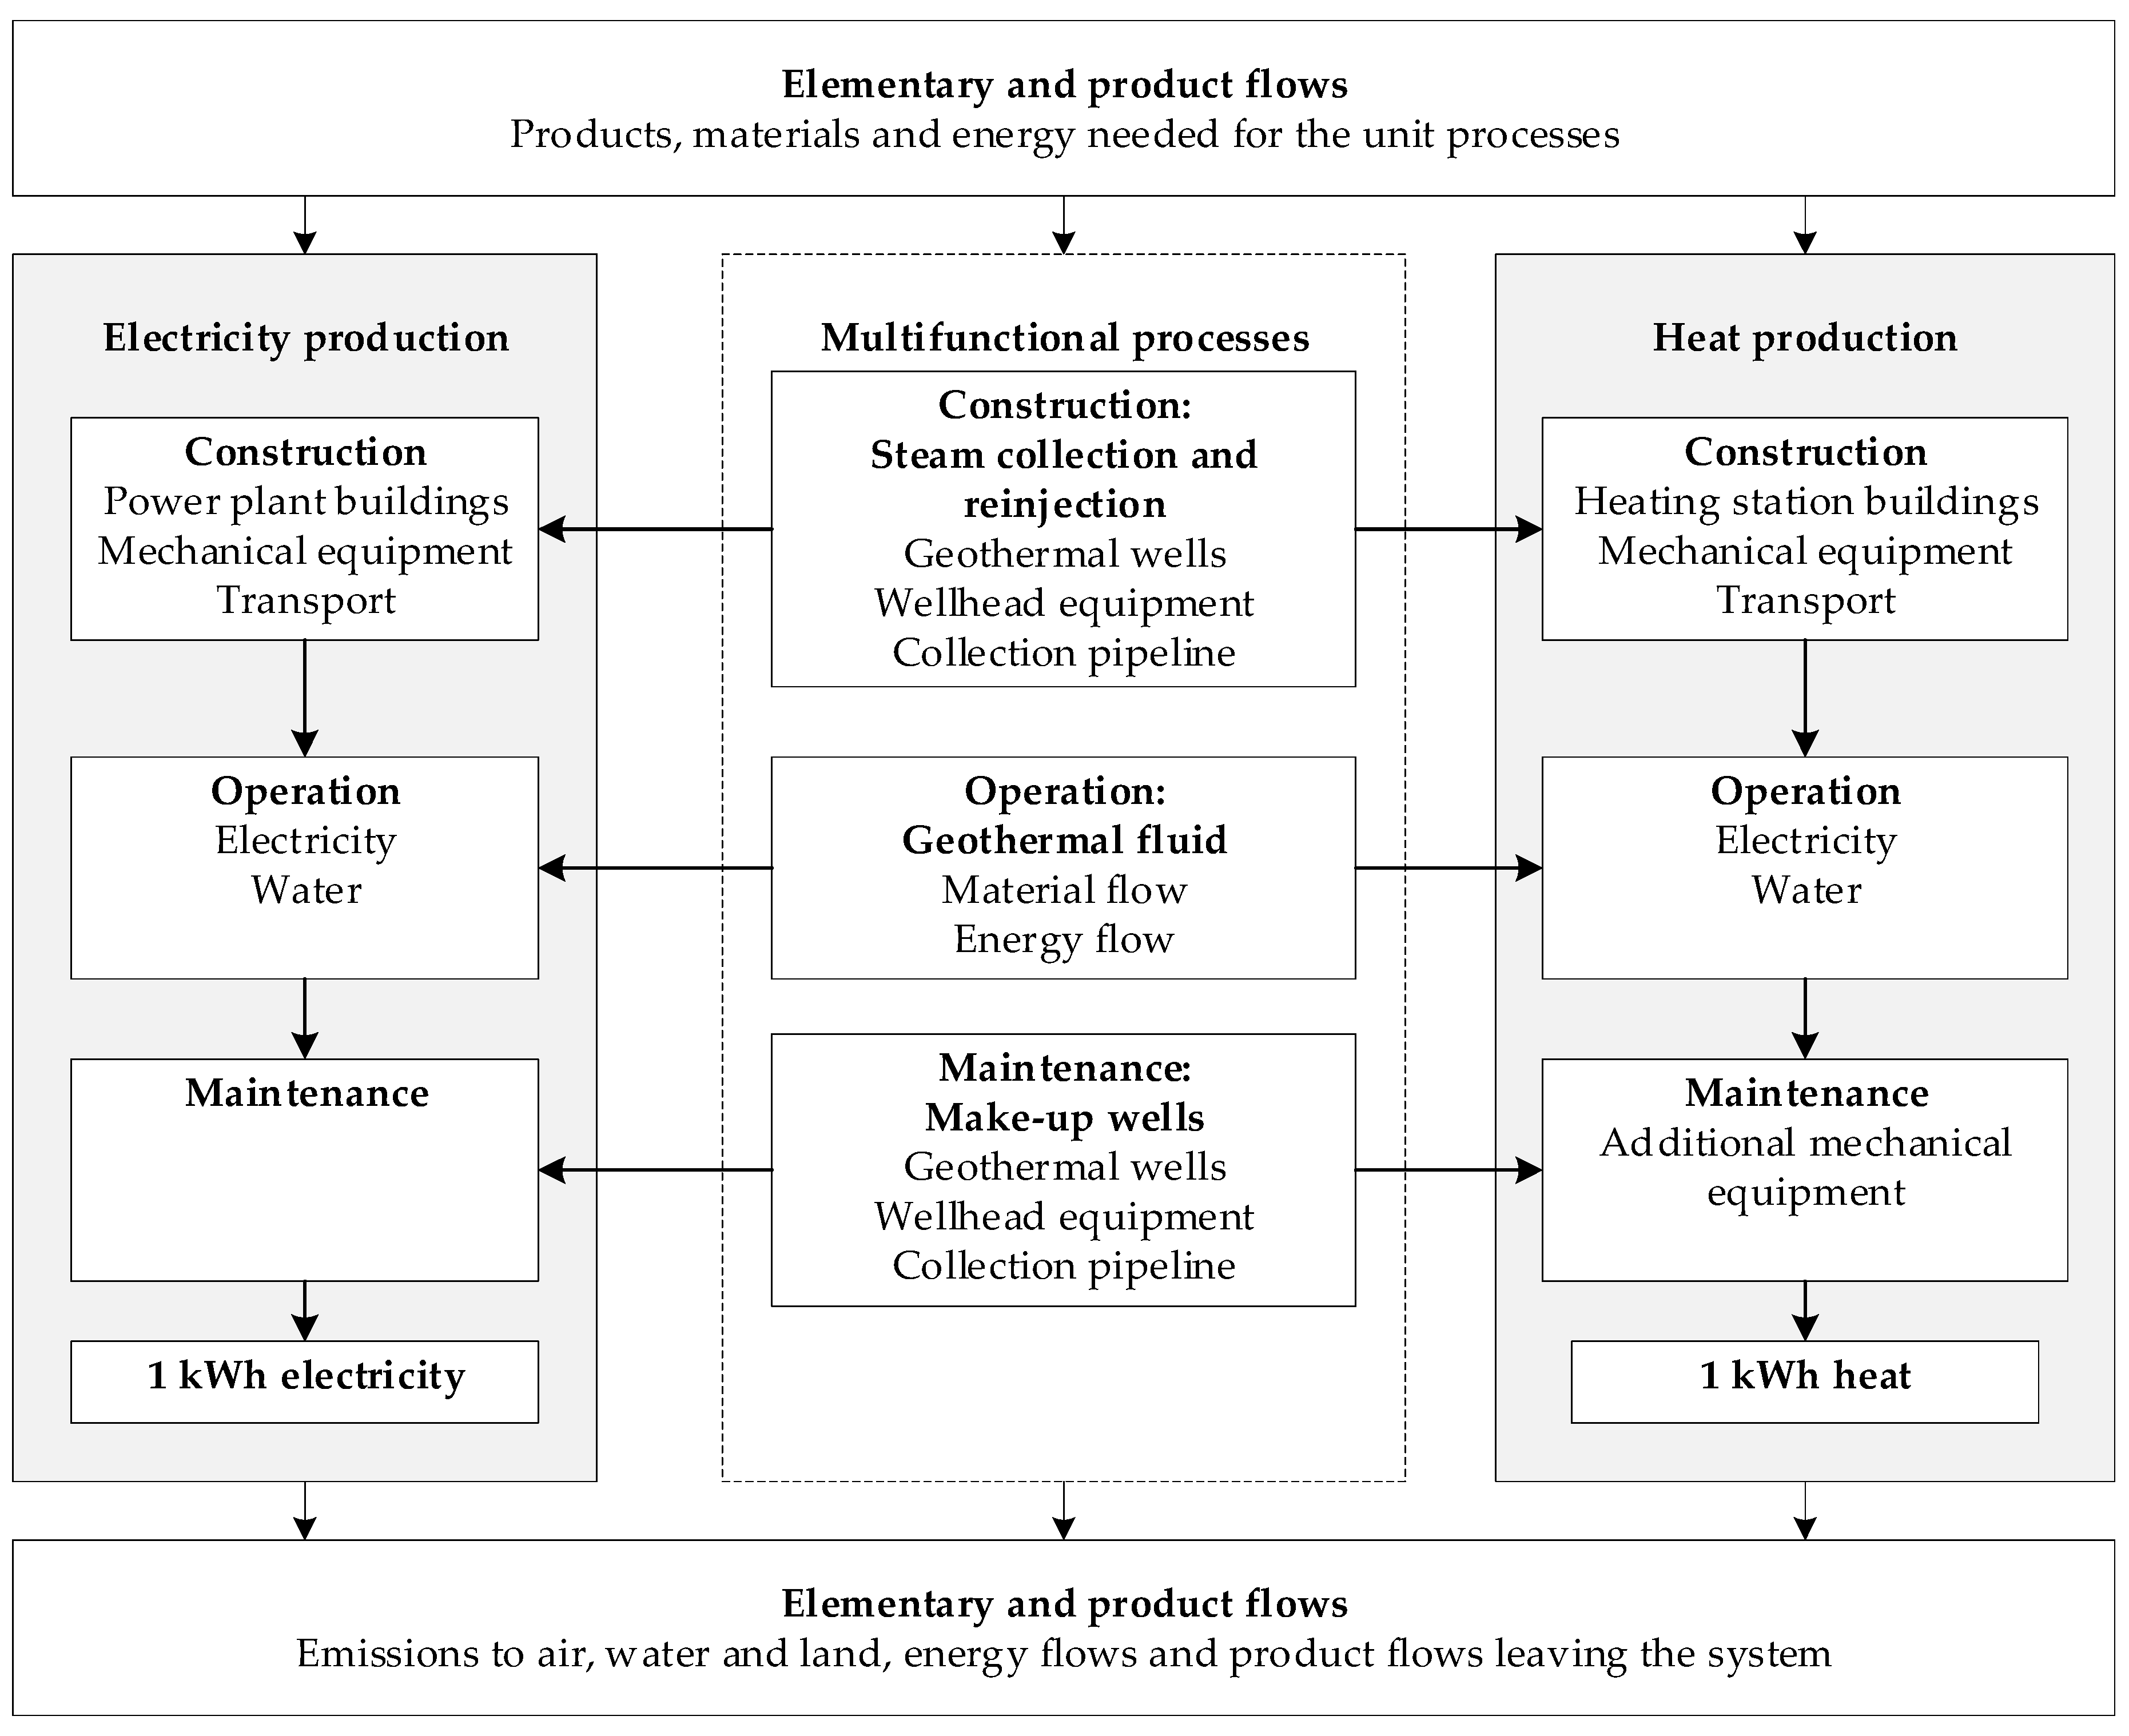
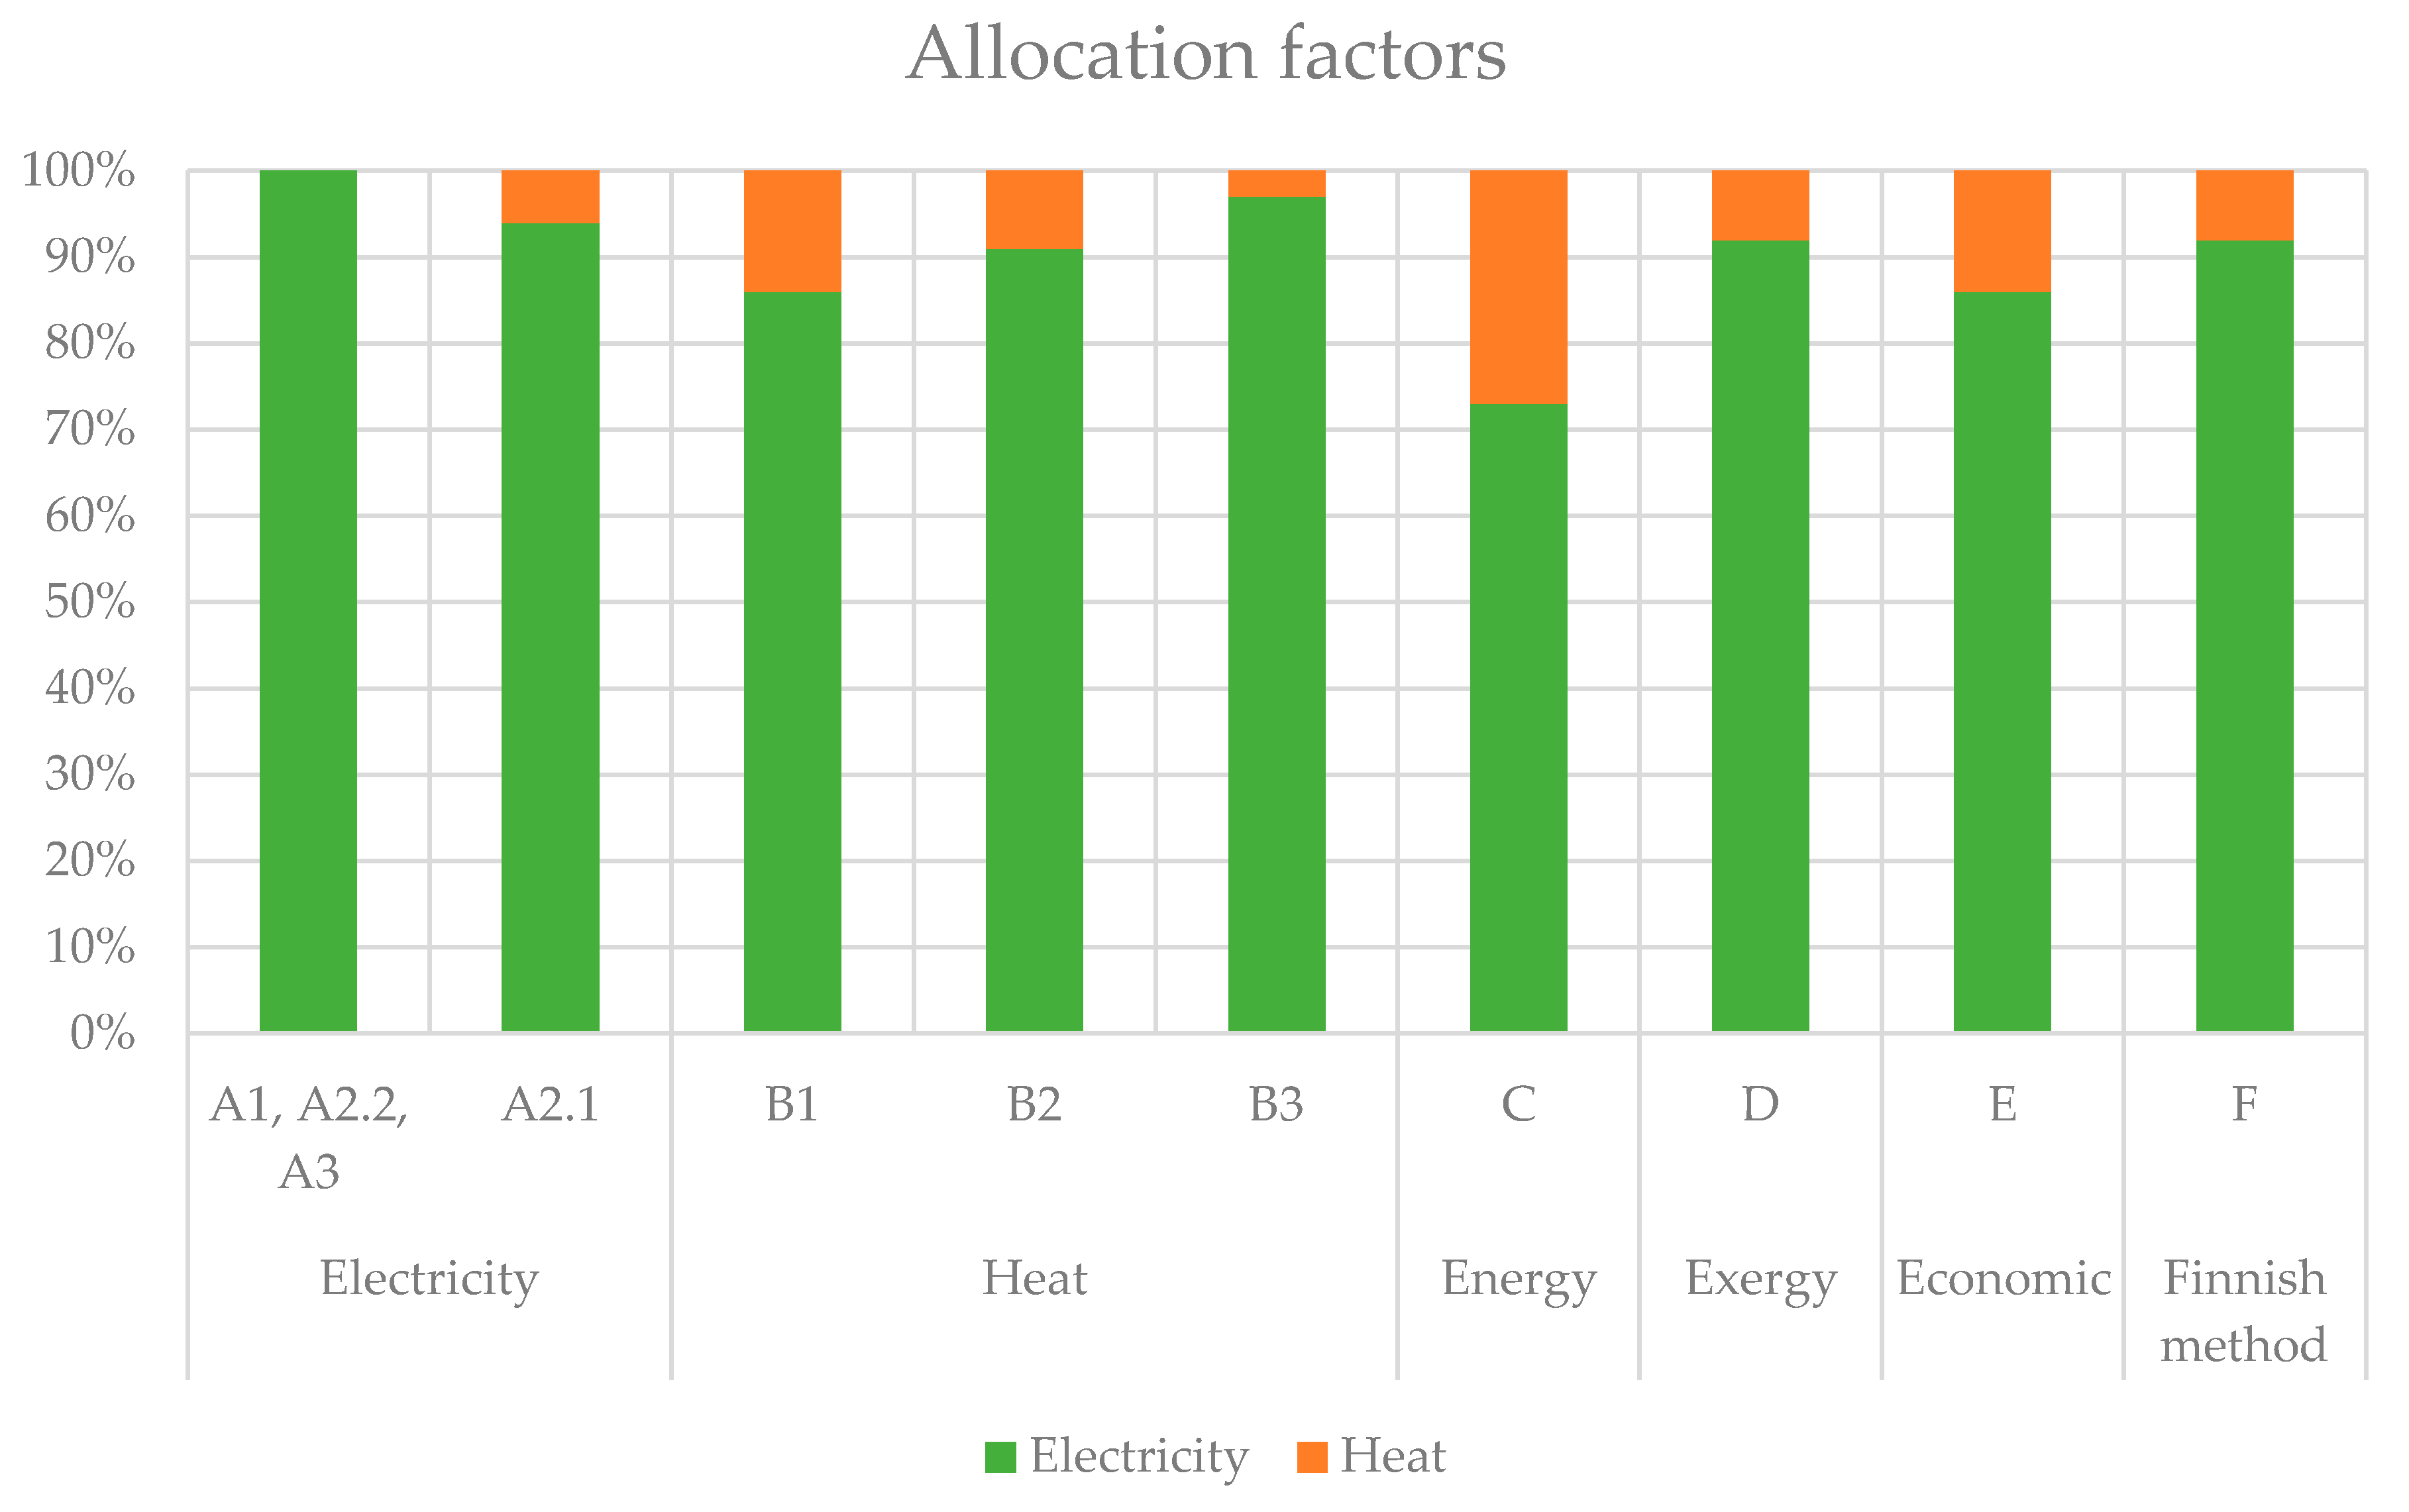
2.4. Allocation of Environmental Impacts and Primary Energy Use

As with other CHP conversion cycles, some processes and equipment within the Hellisheidi CHP plant are jointly used to produce both products; electricity and heat. They will hereafter be referred to as „multifunctional processes“. The multifunctional processes at Hellisheidi CHP plant are shown within the dash-lined box in Figure 3 and described as:
(1)
Construction phase: Steam collection and reinjection system that collects, transports, and disposes of the geothermal fluid used for energy production. The processes included here are the energy and material intensive drilling activities (subsurface), as well as the well completion and the construction of the collection pipeline system for transporting the geothermal fluid above-surface.
(2)
Operational phase: Includes the use of geothermal fluid. Here, the fluid’s thermal energy content defines the primary energy form for the energy conversion cycle, and its gas- and mineral content is the cause of various potential environmental effects.
(3)
Maintenance phase: Includes drilling and completion of make-up wells for maintaining energy supply during the lifetime of the power plant. These wells sustain a constant flow of primary energy needed to produce electricity and heat, as older wells decline during production.
As these processes are of mutual importance to both products, an allocation method to divide the impacts originated from these processes must be selected. There are various allocation methods available, either defined within the research field of LCA or recommended within industry standards and energy policy framework, as discussed in Section 1.3.3. The allocation methods investigated in this study are presented in Section 2.4.1, Section 2.4.2, Section 2.4.3, Section 2.4.4, Section 2.4.5 and Section 2.4.6 The selection of methods studied here is based on conventional methods used within LCA studies of CHP production, as well as applied methods in EU energy policy. The selection does not constitute a comprehensive list of possible allocation methods for CHP production, as there is a wide selection within the literature of other methods, or nuances, defined and discussed for CHP plants.

2.4.1. Method A: Avoidance of Allocation with Electricity as a Primary Product

As a first priority in the ISO 14040 methodology [51], allocation should be avoided as far as possible by subdivision of multifunctional processes or system expansion. In the case of the co-production of electricity and heat in CHP plants, avoidance of allocation may, however, prove difficult. Method A is such an attempt, where allocation is avoided by system-expansion to adjust the model as if Hellisheidi was an electricity-only plant, and all processes (or part of processes) not necessary to electricity production are assigned to heat production as a by-product. This method is sometimes called “partitioning”. To execute the partitioning in the LCA model, the multifunctional processes are evaluated in detail to calculate the estimated fraction of each process necessary to produce the electricity alone. The fraction not essential to electricity production is allocated to heat.
To facilitate an electricity-only plant within the Hellisheidi LCA model, two partitioning factors are calculated. First, the steam collection and reinjection systems are fully assigned to the electricity production with the partitioning factor f A 1 , e l   in Equation (2). Second, for the geothermal energy input, a specific energy transfer process between the geothermal fluid and the groundwater used for the heat production process is assigned to the heat production according to the partitioning factor f A 2 , e l in Equation (3):
f A 1 , e l = 1
f A 2 , e l = E g e o , H X E g e o , t o t a l
Here, E g e o , H X is the primary energy transfer between the geothermal fluid and the groundwater during the final heating process in the DHHX (see Figure 1) while E g e o , t o t a l is the net primary energy extracted from the geothermal reservoir.

2.4.2. Method B: Avoidance of Allocation with Heat as a Primary Product

Here, the same method is applied as for method A in Section 2.4.1, but with heat as a primary product of the plant. Thus, the partitioning factors are found by calculating the fraction of each multifunctional process necessary to produce heat alone. Here, calculation of three different partitioning factors, B1–B3, is needed:
B1
For steam collection and reinjection during the construction phase: An estimation of the minimum requirement of steam collection and reinjection infrastructure to produce and sustain the heat production throughout the 30-year technical lifetime of the plant was made based on thermodynamic energy balance for stand-alone heat production and the known energy output from wells drilled at Hellisheidi. Here, it is evaluated that a minimum of five out of the 64 production wells and four out of the 17 reinjection wells would have to be drilled solely for the 133 MWth heat production that was installed during the construction phase of the CHP plant (prior to the year 2012 when operation phase is assumed to start in the study).
B2
For geothermal fluid: The geothermal energy extraction essential for heat production is calculated separately and compared to the overall energy extraction from the geothermal fluid for the total CHP plant production to calculate the partitioning factor. However, for mass flow and direct emissions due to the use of the geothermal fluid by a heat-alone plant, the same partitioning factor is used for B1, as explained above.
B3
For the need of make-up wells for maintaining heat production: The assumed decline of geothermal well output due to production was estimated for the maintenance phase of a stand-alone heat plant. Here, the assumption is made that at least one make-up well is needed exclusively for the maintenance of heat production at the plant over a 30-year lifetime (compared to an estimate of 15-60 make-up wells being necessary for the overall CHP plant to sustain both heat and electricity production). The assumed need for make-up wells includes future expansions above the original 133 MWth installed thermal capacity, e.g., the recent 200 MWth expansion in 2020.
The equations for the resulting partitioning factors for method B are expressed in Equations (4)–(7):
f B 1 , t h = N w e l l s , t h , c o n N w e l l s , t o t a l , c o n
f B 2 , t h = E g e o , t h E g e o , t o t a l
f B 3 , t h = N w e l l s , t h , o p N w e l l s , t o t a l , o p
f B i , e l = 1 f B i , t h
where f B i , t h is the partitioning factor for each multifunctional process i affected by system expansion for heat production; f B i , e l is the corresponding partitioning factor for electricity production; N w e l l s , t h , c o n is the number of wells needed for thermal production at the plant at the start of operation;
N w e l l s , t h , o p is the amount of make-up wells needed for thermal production at the plant during a 30-year lifetime; N w e l l s , t o t a l , c o n is the total amount of wells needed for both electricity and thermal production at the plant at the start of operation; N w e l l s , t o t a l , o p is the total amount of make-up wells needed for both electricity and thermal production at the plant for 30 years lifetime; E g e o , t h is the primary energy extracted from the geothermal fluid to produce heat and E g e o , t o t a l is the net primary energy extracted from the geothermal reservoir.

2.4.3. Method C: Energy Allocation

Energy, exergy, and economic allocation methods are commonly used in LCA studies of CHP plants if an allocation cannot be avoided, as they are recommended in the ISO 14040 [51]. These methods (C, D, and E) are described here and in Section 2.4.4 and Section 2.4.5.
The energy allocation method (Method C) is based on the fraction of each product of the total produced energy from the plant, as described by Equations (8) and (9). It is defined as an allocation method for GHG emissions in the RED directive, as discussed in Section 1.3.3:
f C , e l = E e l E t h + E e l
f C , t h = 1 f C , e l
where E e l is the produced electricity [kWh] during 30-year lifetime of the plant and E t h is the produced heat [kWh] during 30-year lifetime of the plant.

2.4.4. Method D: Exergy Allocation

Exergy allocation (Method D) is based on the fraction of the exergy content of each product compared to the overall availability of work produced from the plant. The exergy, X, is calculated by standard thermodynamic calculation methods (e.g., [57]). Equations (10) and (11) describe the calculation of the corresponding allocation factor. The exergy method is equivalent to the Carnot method suggested within the EPBD standards as discussed in Section 1.3.3:
f D , e l = X e l X t h + X e l
f D , t h = X t h X t h + X e l = 1 f D , e l
where X e l is the exergy content of produced electricity during 30-year lifetime of the plant and X t h is the exergy content of produced heat during 30-year lifetime of the plant.

2.4.5. Method E: Economic Allocation

Economic allocation (Method E) is based on the monetary value per kWh (unit purchase price) of each product at a consumer-level compared to the sum of the monetary value of both products:
f E , e l = C e l C t h + C e l
f E , t h = C t h C t h + C e l = 1 f E , e l
where C e l is the unit purchase price of 1 kWh of electricity and C t h is the unit purchase price of 1 kWh of heat.
Using economic allocation based on unit prices is common in LCA studies (e.g., [58]). Other definitions of economic allocation could be used instead of comparing the monetary value of units of produced energy in the form of electricity and heat. Allocation based on total revenues during the lifetime of the plant, either actual reported values or estimated from unit prices and total energy production, could be used as well (e.g., [59]). In this paper, results are only presented based on unit purchase price allocation.

2.4.6. Method F: Alternative Generation Method (AGM)

The Alternative Generation Method (AGM) (alternatively, the Finnish method, Alternative Production method, Benefit method, or Efficiency method) is the method most consistently referred to in EU energy policy and CHP industry standards. The method was developed by the Finnish District Heating Association and has gained popularity for fair CHP allocation as it aims to share the benefits of co-production to both products [60]. Here, two reference systems are defined as a stand-alone electricity plant and a stand-alone heat plant having default efficiencies of the energy technology in use. For geothermal energy, these default efficiencies are 10% for electricity generation and 50% for heat generation, according to the International Energy Agency [2]. Equations (14) and (15) describe the resulting allocation factors:
f F , e l = ( E e l η a l t , e l ) / ( E t h η a l t , t h + E e l η a t l , e l )
f F , t h = ( E t h η a l t , t h ) / ( E t h η a l t , t h + E e l η a t l , e l ) = 1 f F , e l
where E e l is the produced electricity [kWh] during 30-year lifetime of the plant; E t h is the produced heat [kWh] during 30-year lifetime of the plant; η a l t , e l is the efficiency of the alternative electricity generation method using the same energy resource as the CHP plant and η a l t , t h is the efficiency of the alternative heat generation method using the same energy resource as the CHP plant.

3. Results

Detailed results on the various environmental impacts based on a single select allocation method (method C. Energy allocation) can be found in Karlsdottir et al. [8]. In the present study, only results for GHG emissions and PEF are presented due to their significance within EU climate and energy policy, while also investigating the effects of choosing different allocation methods to calculate these two factors. The results show that the PEF and GHG emission factors for electricity and heat from the Hellisheidi plant do vary significantly with the different allocation methods. For electricity, the PEFel ranges from 5.2–6.6 and the GHG emission factor from 15.9–21.5 g CO2 eq/kWh. Consequently, the PEFth varies from 1.3–5.2 and the GHG emission factor from 0.7–15.7 g CO2 eq/kWh. The following sections further present the findings of allocation method selection and corresponding indicator results.

3.1. Allocation Factors

As explained for methods A and B of avoided allocation, multiple partitioning factors are used in this approach, essentially one for each multifunctional process. Table 2 thus shows numerous “allocation factors” to describe the results for methods A and B, followed by a single allocation factor for each of the various allocation methods investigated in the study. The resulting allocation factors for all methods described in Section 2.4 are presented in detail in Table 2 and summarized visually in Figure 4. The results for each method are discussed in brief below.
For method A, the only multifunctional process that was not allocated entirely to the electricity production was factor A2.1 describing the share of primary energy needed for the production. As the heat production process interlinked with the electricity production at Hellisheidi results in lower temperatures of spent geothermal fluid than if no heat production were present, the share of primary energy use corresponding to this additional primary energy use is assigned to the heat production.
For method B, it is evident by the partitioning factors in Table 2 that the heat production alone only requires a small portion of the inputs of each multifunctional process. If the Hellisheidi CHP plant had been built as a stand-alone heat plant, it would have required far a smaller number of geothermal wells and corresponding steam collection and reinjection system than the combined heat and power production requires. This again results in lower requirements of geothermal fluid flow, fewer make-up wells needed over the plant’s lifetime, etc. Thus, only the necessary contribution of each multifunction process is assigned entirely to heat production, and the rest is attributed to electricity production.
Methods C-F are conventional allocation methods producing single allocation factors based on different approaches to the allocation dilemma. The variations in the results are well noticeable in Table 2 and Figure 4. Interestingly, the Exergy method (D) and the AGM (F) produce the same allocation factors. Both these methods are listed within the EU energy and climate policy framework, as recommended methods (where method D is compatible with the Carnot method mentioned in Section 1.3.3) for partitioning the PEF between heat and electricity in CHP plants. The Energy allocation method (C) allocates the smallest fraction of environmental impacts to electricity production compared to the other methods and is thus the most beneficial for electricity. This is the recommended method for partitioning GHG emissions between electricity and heat from CHP plants, according to the RED. In contrast, the Exergy and AGM methods (D and F) allocate the most significant fraction of impacts to electricity.
To evaluate better how methods A and B affect the overall results of the division of impacts between the two products, results for the overall impact factors must be analyzed further, as done in the following section (Section 3.2).

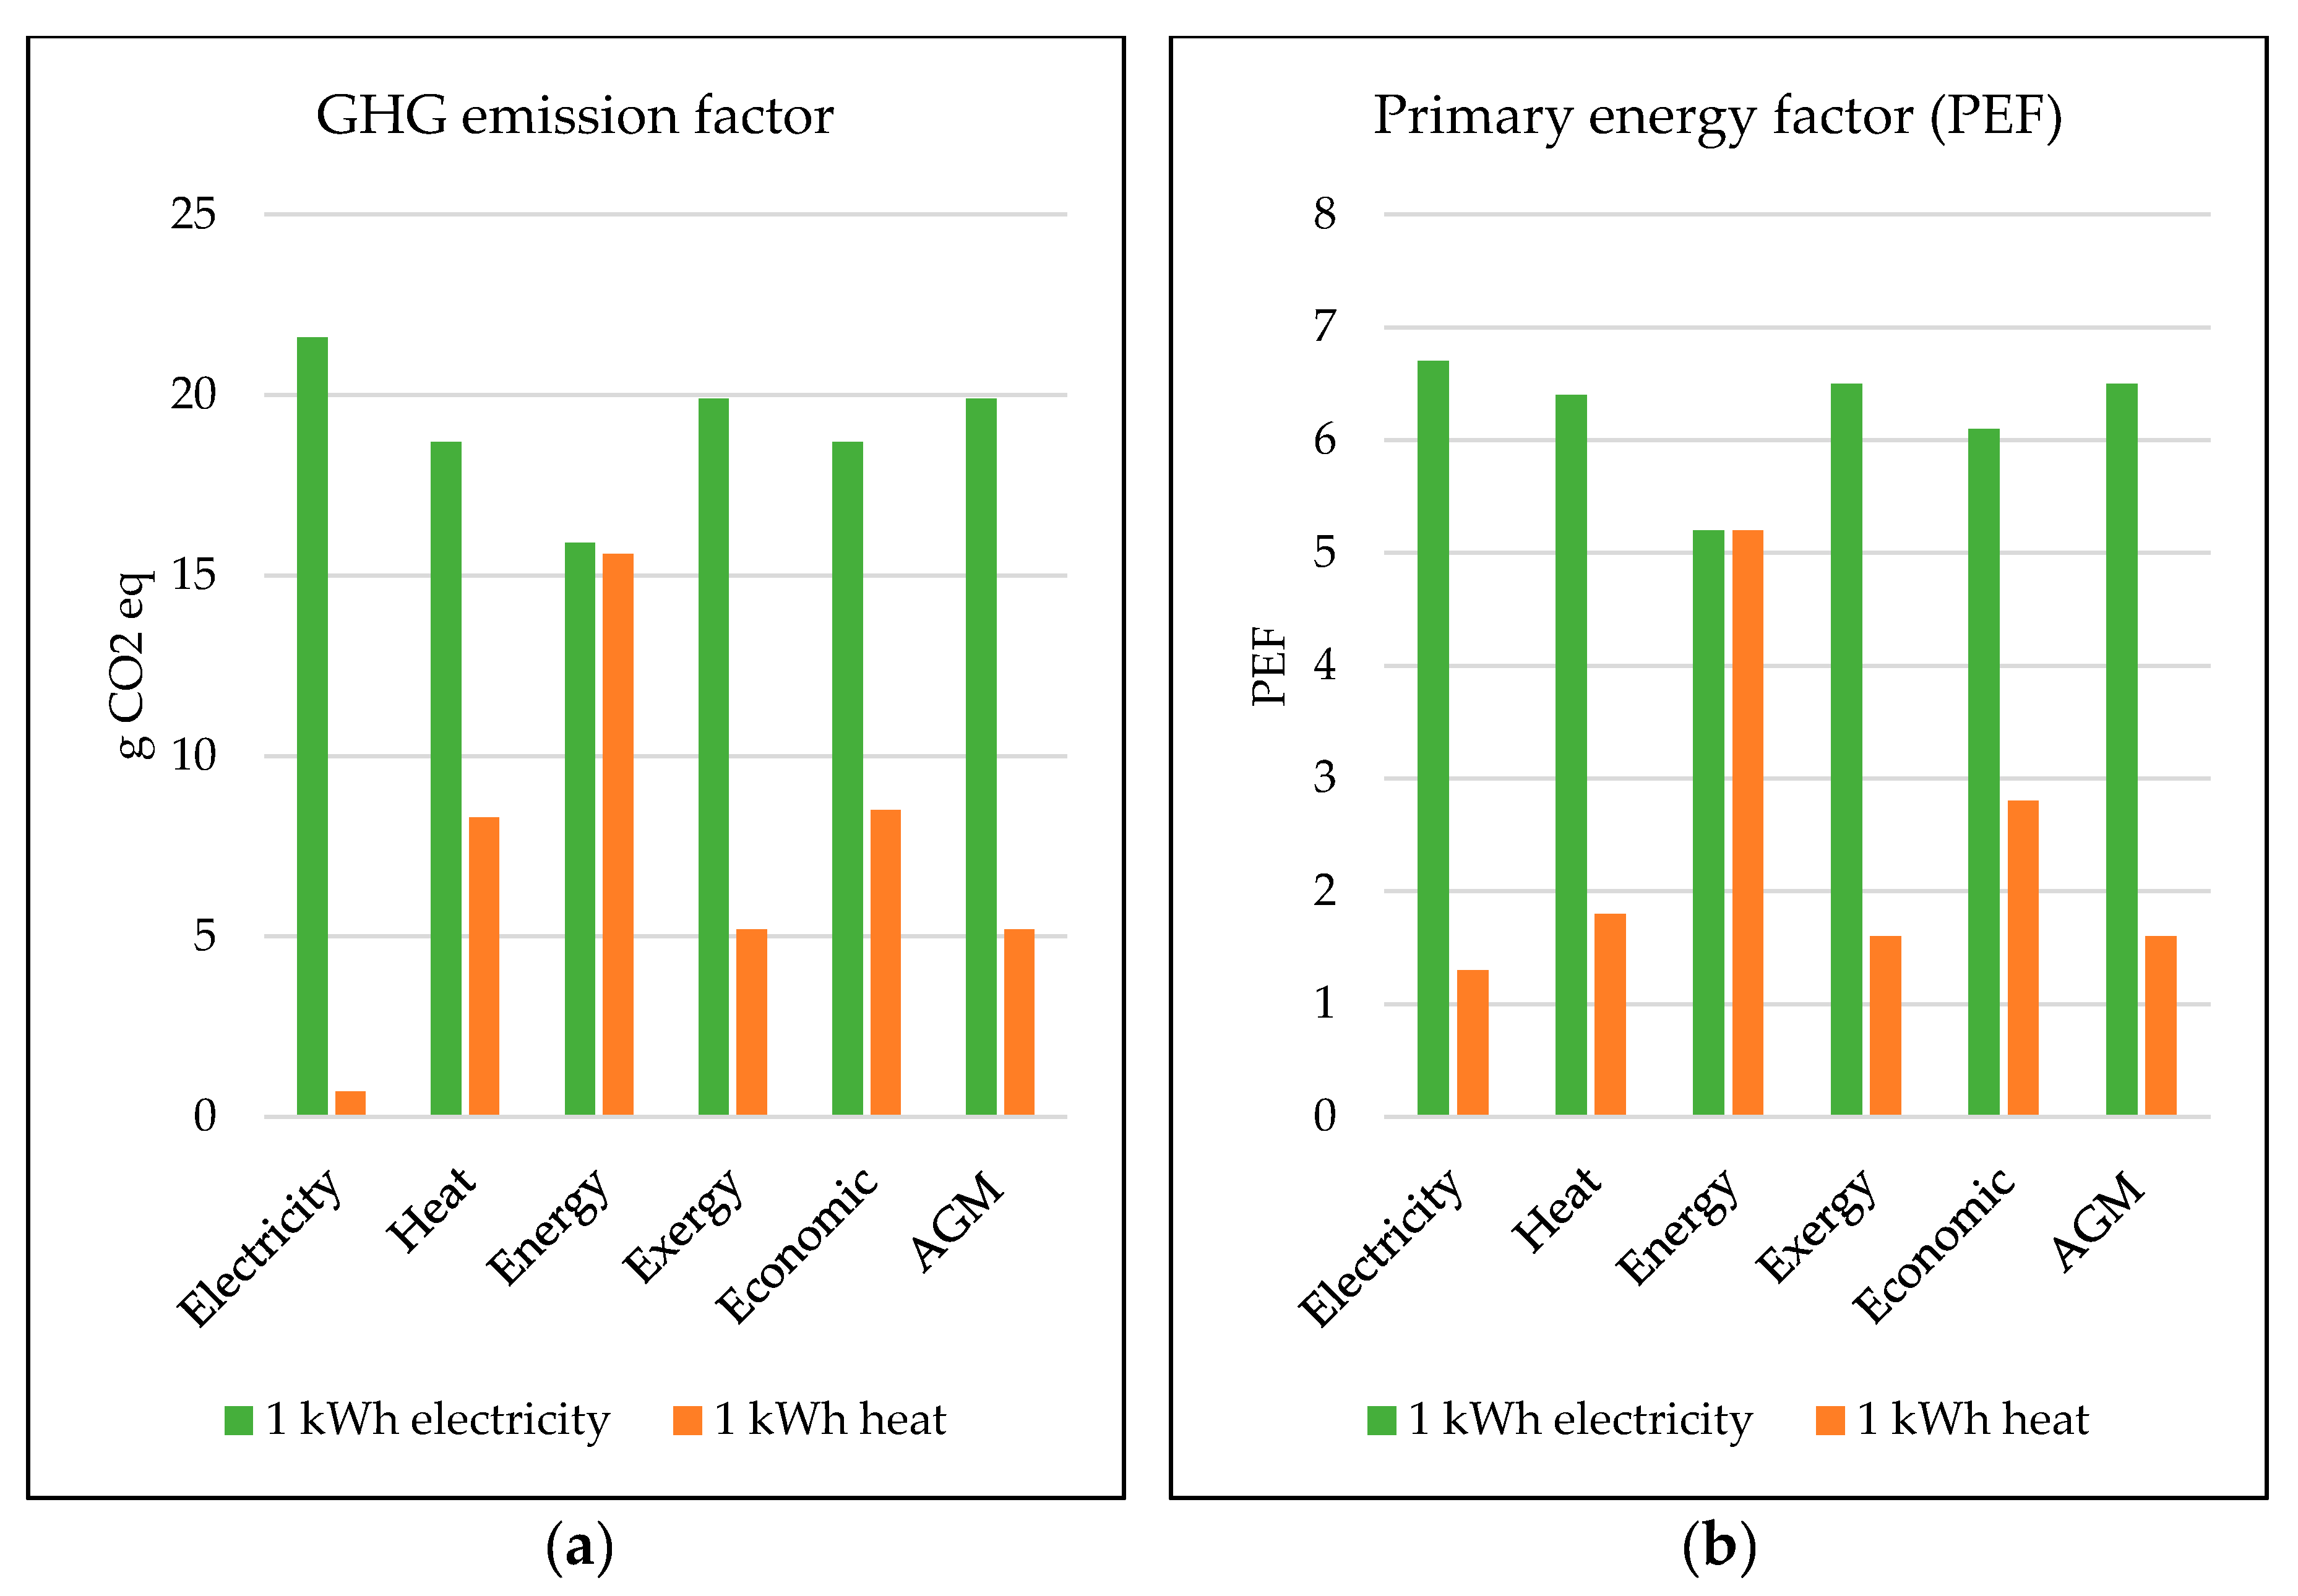
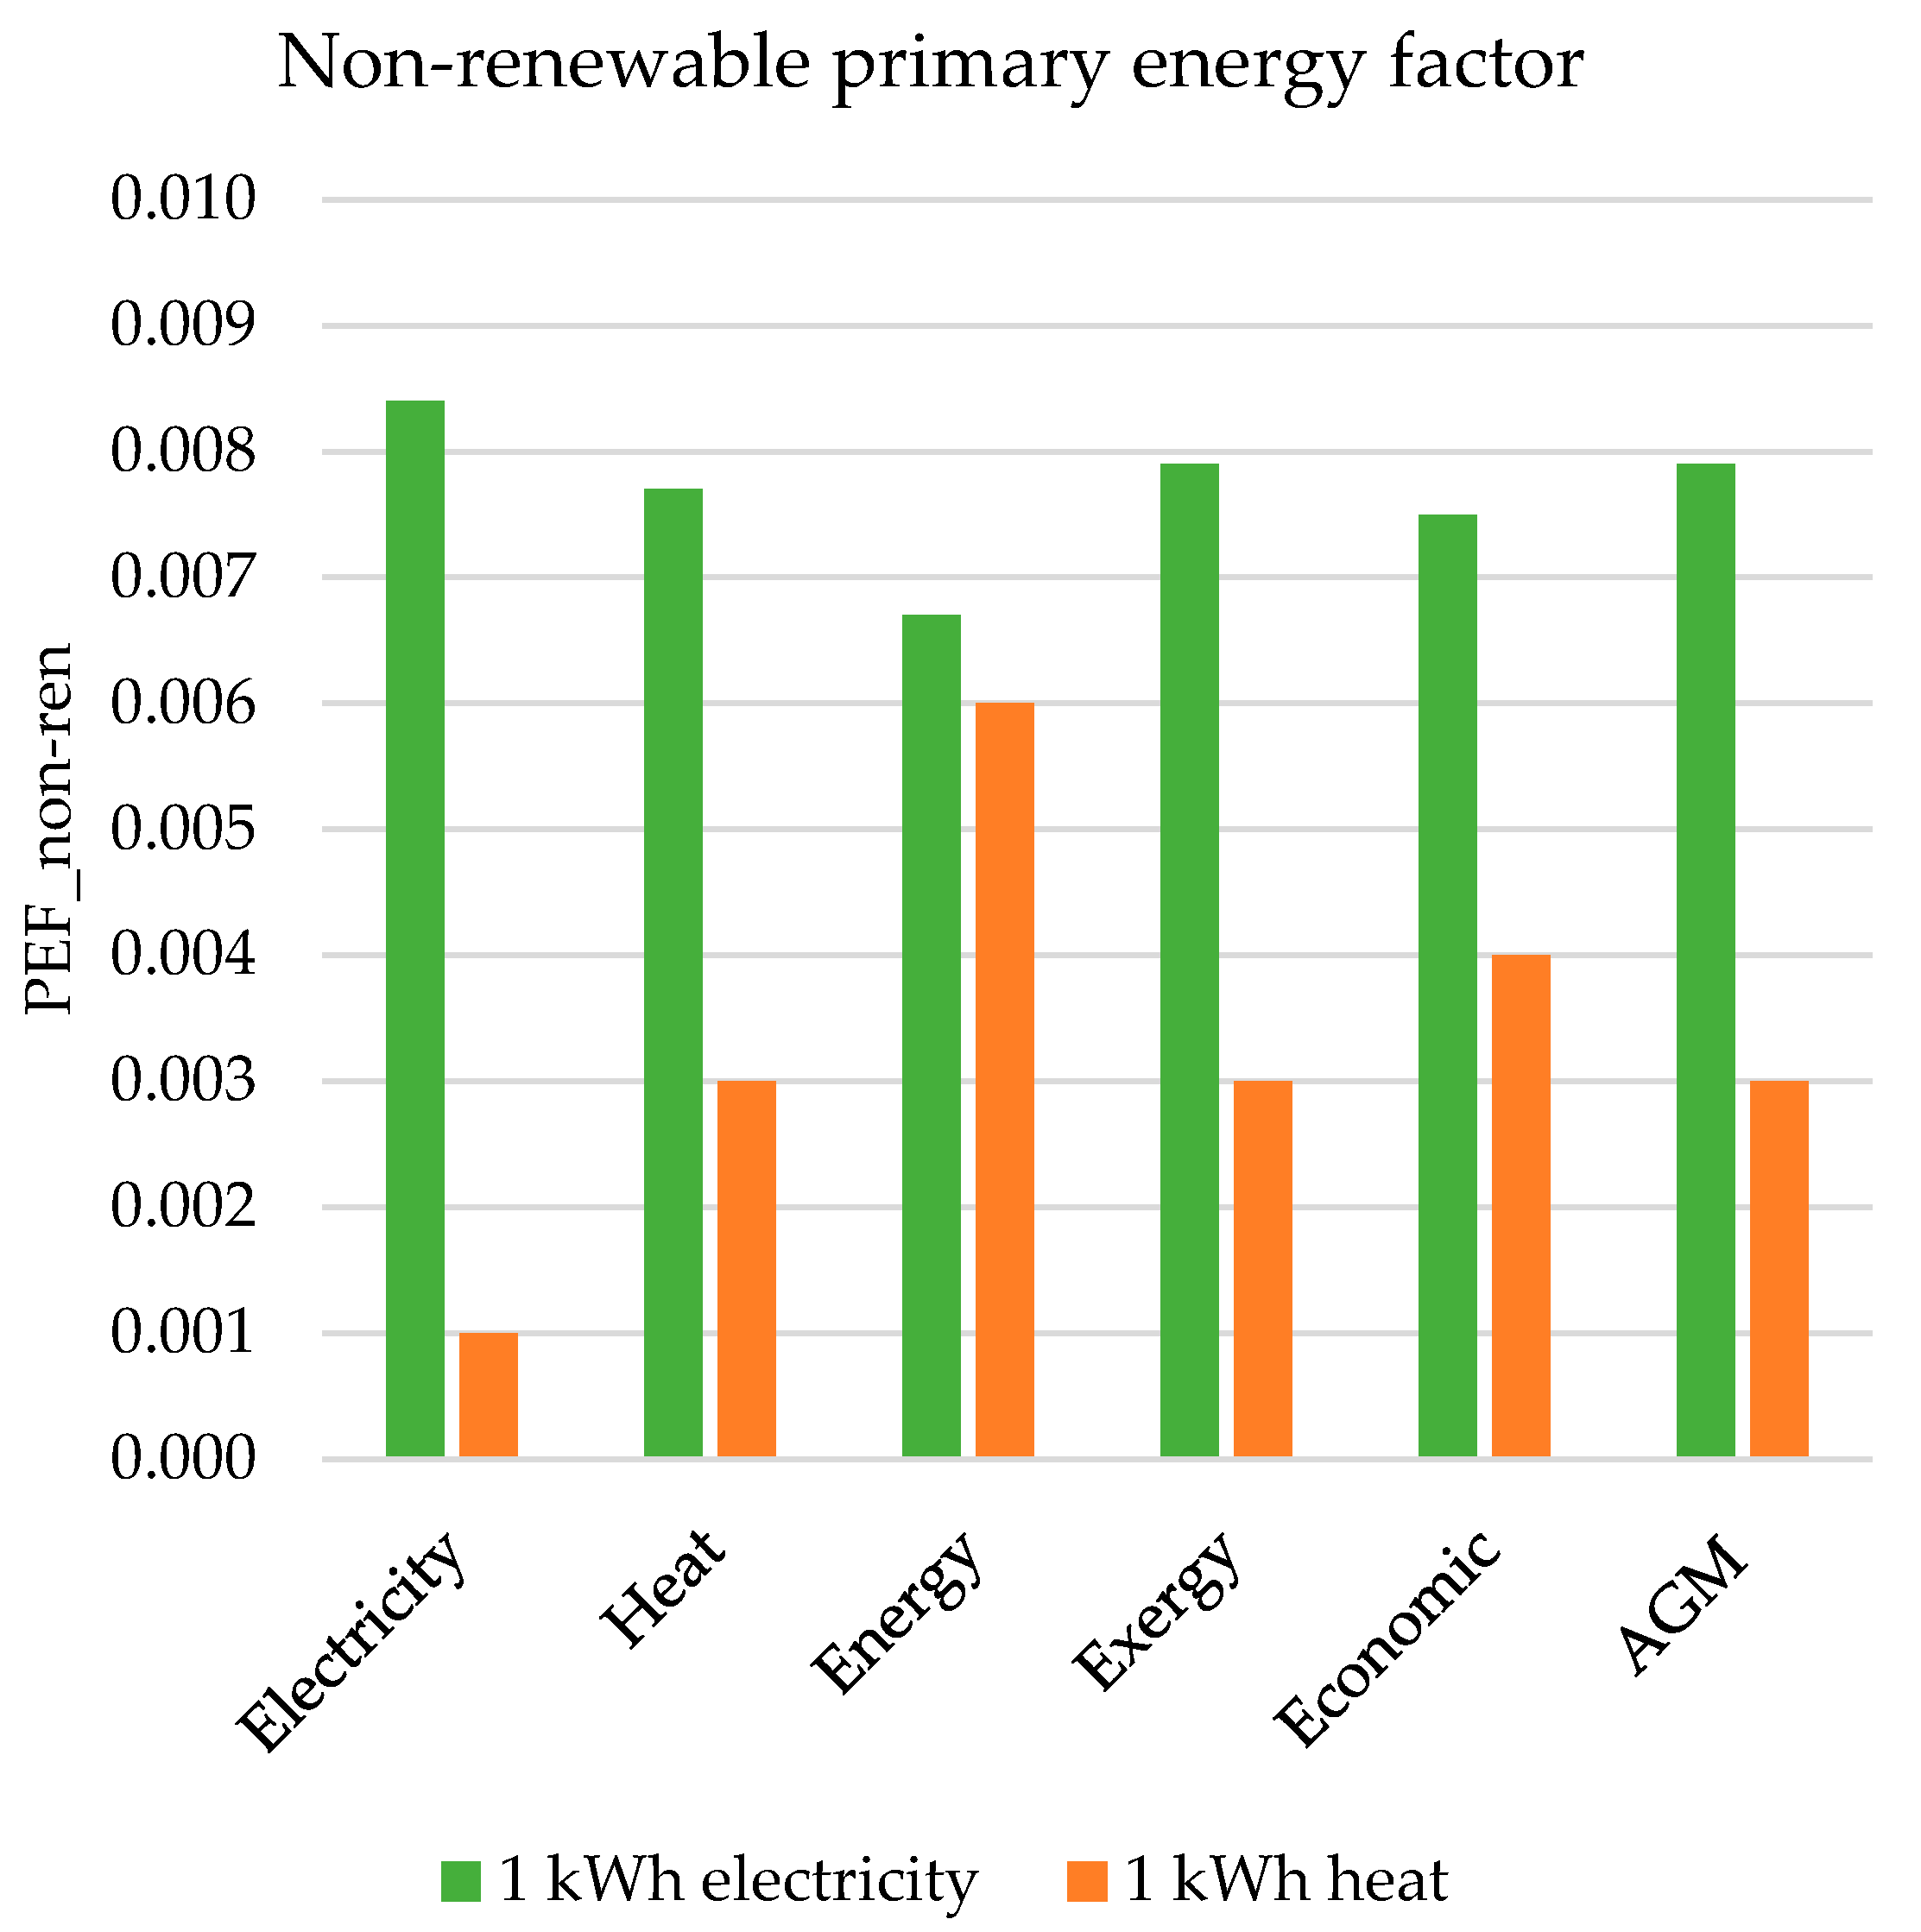
3.2. Indicator Results for Electricity and Heat from Hellisheidi CHP Plant

The indicators for GHG emissions and the PEF for electricity and heat from the Hellisheidi CHP plant vary significantly between the different allocation methods used in the analysis, as seen in Figure 5. The lowest impact of electricity generation in both indicator results is achieved for allocation based on energy content (method C). This is expected since it gives the smallest allocation factor for electricity compared to the other allocation options, as discussed in Section 3.1.
Method A, with electricity as a primary product, gives the highest resulting indicators for electricity generation compared to the other allocation methods as almost all impacts resulting from the CHP plant are assigned to the electricity and only a small fraction to the heat production. The indicator values for electricity vary from 15.9–21.5 g CO2 eq/kWh for the GHG emission factor and 5.2–6.6 for the PEF.
Consequently, energy allocation (method C) results in the highest indicators for heat production, while method A results in the lowest indicator results for the same reasons as discussed above. The indicator values for heat vary from 0.7–15.7 g CO2 eq/kWh and 1.3–5.2 for the PEF.
As an additional note, the results for the non-renewable part of the total PEF is presented in Figure 6. Since the PEF was calculated with methods of LCA, the amount of primary energy needed for various processes throughout the lifetime of the plant has been evaluated using the cumulative energy demand (CED) impact assessment method. The sum of all non-renewable energy inputs throughout the construction, operation, and maintenance of Hellisheidi CHP plant results in the non-renewable PEFnon-ren ranging from 0.007–0.009 for electricity production and 0.001–0.006 for heat production. The PEFnon-ren mainly originates from the use of diesel fuel during drilling of geothermal wells, and from the production of steel for the infrastructure of the various power plant structures [8].

4. Discussion

The study has reviewed the main performance indicators of the EU climate and energy policy that can influence the statistics and possible future development of geothermal energy within the EU. The critical implications are due to the definition of the primary energy content of geothermal resources and the definition of the PEF used as a key indicator in the energy policy. The PEF is a fundamental factor within the EPBD, where its use is mandatory to calculate the energy performance of buildings. At the same time, the PEF is somewhat optional in the EED, albeit primary energy use is widely discussed and highlighted within the directive as an appropriate performance indicator to account for energy efficiency measures.
As the discussion in the extensive Introduction section of this paper recaps, geothermal utilization becomes one of the most inefficient resources to utilize for energy production in terms of the primary energy factor. The reason is how the primary energy content of geothermal energy versus other renewable energy technologies is defined. Technologies such as solar photovoltaic have power conversion efficiency values (depending on technology) in the range of 11.9% for mature technologies up to 46% for developing high-efficiency technologies. The photovoltaic power systems with the highest market share have an efficiency of around 22.3% [61]. In terms of the PEF, this would translate into a PEF value of 4.5 (the inverse of the conversion efficiency), while international energy statistics define the PEF as 1 for solar photovoltaics (e.g., [2]). A PEF for photovoltaics of 4.5 is still less than the given PEF of 10 for geothermal energy. However, the two PEFs do become comparable on common ground by taking into account the actual conversion efficiencies of both technologies. This inconsistency in the primary energy definition for different renewable energy technologies favors the renewables defined with a low PEF value of 1 over the renewable thermal technologies having, by chosen definition, a much higher PEF factor implying worse energy performance in terms of primary energy efficiency. Even worse, the high PEF factors for thermal renewables also exceed PEFs for non-renewable fuels, sometimes by manifold, also implying their worse energy performance in terms of efficiency compared to the non-renewable systems. This leads to adverse effects on the use of geothermal energy as an energy source for buildings and primary energy source within a country‘s energy mix in context to the EU energy and climate policy framework.
The technical example of the Hellisheidi geothermal CHP plant further sheds light on the issues of defining and calculating the PEF. Since this modern, state-of-the-art plant has an electricity generation efficiency of roughly 12–14%, it is within the higher range for geothermal technologies, as presented by Zarrouk and Moon [42]. The resulting PEF for a stand-alone electricity plant at Hellisheidi is in the range of 7.1–8.3, while LCA results for the PEF fall in the range of 5.2–6.2 when a part of the primary energy use is allocated to heat production. These PEF values are considerably lower than the standard PEF of 10 for geothermal. This stresses the importance of evaluating different conversion technologies for geothermal in terms of finding standard PEFs for the different systems. Examples of different conversion technologies for geothermal are: dry steam plants, single flash plants, double flash plants, binary plants, hybrid plants, etc., each having different conversion efficiencies.
A possible solution to avoiding the bias between renewable energy technologies in terms of their attractiveness due to primary energy factors is to put more emphasis, or even specific PEF targets, on minimizing the non-renewable primary energy factor PEFnon-ren. For renewable technologies, the PEFnon-ren can be acquired using LCA or similar methods to include all up-stream energy flows needed for the life cycle of the energy conversion process. The EPBD does introduce the possibility of using multiple indicators, alongside the mandatory indicator based on primary energy, for presenting the energy performance of a building, e.g., in terms of total, non-renewable and renewable primary energy use, as well as in terms of greenhouse gas emissions. [15]. Still, the EPBD neither encourages nor implies the beneficial aspects of such a multi-factorial approach. As an example, if the PEFnon-ren and GHG emission factor would become mandatory within the EPBD, they would give a much broader overview of the improvement’s buildings can implement without focusing solely on minimizing the overall primary energy use. For expressing those additional energy performance indicators, conversion factors (indicators) must then be available for the different energy systems to reveal the renewable and non-renewable shares of the PEF as well as the GHG emission factor. The results for the technical example in this study showed that by presenting the PEFnon-ren for geothermal, the beneficial elements are better highlighted in terms of the extremely low non-renewable primary energy fraction of the delivered energy product, compared to using the total PEF.
One additional complexity with geothermal energy is that GHG emissions are highly context-sensitive, and therefore the PEF alone may not be a sufficient indicator. Even if in the majority of cases, such as the Hellisheidi plant in this study, the emission intensities are on the same range as other renewables [17], the emission rates can exceed even fossil-fuel energy systems as in individual cases in Turkey. In these cases, a possible solution is to require adequate abatement procedures (e.g., the proven carbon capture and sequestration method CarbFix [62]) or refrain from developing those geothermal resources.
Furthermore, the technical example also highlights the influence of the allocation method chosen to divide the PEF, and other indicators or environmental impacts resulting from energy production, on the resulting values. Allocation is a joint discussion within LCA research where issues often arise. Ultimately, no consensus has been reached within the LCA research field on the best allocation for energy technologies producing multiple value streams. Similarly, the EU does not recommend a specific single allocation method but gives recommendations on different methods in the RED and EED, and within the EPB standards [16,23,26]. The need for ensuring a consistent methodology for calculating PEFs, as well as energy savings and GHG emission shares of electricity and heat in CHP plants within the EU‘s climate and energy policy framework, is crucial.
This is especially true for high-emitting technologies as the choice of allocation method, or nuance of the same method, significantly changes the emission intensities of power and heat produced in CHP plants. The possibility of „greenwashing“ of either product is evident, by selecting an allocation method that minimizes emission intensity, e.g., of the more valuable product. An example of a nuance of a method is mentioned in Section 2.4.5 where economic allocation factors can be calculated based on different values, e.g., unit prices, actual or estimated annual revenues of a reference year, or total estimated revenues over the plant lifetime. These nuances can give drastically different results for the economic allocation factor, and often it is unclear from studies which nuance is actually used. For Hellisheidi, the variations in the economic allocation factor for electricity ranges from 70–94% if calculated based on (i) average annual revenues of heat and electricity as found in published annual reports, or (ii) the estimated revenues during the technical lifetime of the plant, based on unit prices at consumer levels and the overall expected energy production of the plant. These two nuances of economic allocation actually showcase the possibility of „greenwashing“. The lower value allocates the highest share of environmental impacts and primary energy use to heat (30%), giving similar results as allocation method C in this study, while the higher value is similar to the results for Method A, where electricity is chosen as a primary product with almost all impacts allocated to the electricity production.
From the three principal directives, two allocation methods can be highlighted above others as recommended allocation methods in EU energy and climate policy: the energy allocation method for dividing GHG emissions between electricity and heat, and the AGM for dividing the primary energy use between electricity and heat. The AGM assumes the CHP production can be substituted by corresponding separate production processes of electricity and heat, using the same form of energy resource as input to both processes. For high-temperature geothermal utilization, a separate heating production process is not a typical nor a probable production technology to be used. The capital cost of high-temperature utilization likely requires higher revenue streams for the project to be profitable than heat production alone would give. Thus electricity production is likely always the basis of high-temperature projects. That being said, it is relatively simple to use the AGM for high-temperature geothermal CHP, assuming conversion efficiencies of 10% for separate electricity generation and 50% for separate heat generation as the IAE recommends [2]. Thus, using the AGM, albeit it does not represent a likely scenario for geothermal utilization to compare the CHP production with, would result in a consistent approach to allocation for high-temperature CHP with other CHP technologies. The AGM can also be used to allocate GHG emissions and could thus serve as a single selected method for both indicators.
The energy allocation method suggested by the RED for the GHG emissions from CHP plants is a fairly simple method that is also commonly applied within LCA. It works well for allocating GHG emissions, but in the case of PEF it can result in non-representative efficiency values (equal to the inverse of the PEF as presented in Equation 1) in the context of thermodynamics. For Hellisheiði, the energy allocation results in an abnormally high PEF for heat as it normalizes the primary energy input between the kWh produced as either electricity or heat. Consequiently, the high PEF for heat results in an abnormally low efficiency of the heat production, or an efficiency of only 19% compared to the default value of 50% in energy statistics. In turn, it benefits the electricity production excessively, as a 19% efficiency value is much higher than the 12–14% actual efficiency of the electricity production at the plant. The same would apply to other CHP plants using different energy sources, as the energy method always normalises the primary energy input between the produced heat and electricity, resulting in the same dilemma of overestimating electric efficiency and underestimating thermal efficiency of heat production. Thus, the energy allocation method is not suitable for allocating PEF between electricity and heat from CHP plants.
The need for assigning an appropriate allocation method for CHP to calculate primary energy factors, energy savings, and GHG emissions from co-generated electricity and heat in context with EU energy and climate policy is of crucial importance. It would clarify which method is most appropriate and allow for comparison between different calculations of PEFs and GHG emissions from CHP plants in the EU. Taking into account the undesirable results for the PEF of electricity and heat using the energy allocation method, the AGM is more suitable as a single, consistent method that can be used to allocate differnt impacts between coproduction of heat and electricity.
Even though the study provided a single technical example of a specific geothermal CHP plant in Iceland, the general implication of the issues with the EU energy and climate policy also applies to other geothermal plants, whether from high- or low-temperature geothermal resources. All geothermal energy plants have relatively low thermal conversion efficiency, thus resulting in a high PEF. The results of this study can, therefore, be applied to other cases of geothermal energy utilization in terms of power production or CHP production. Geothermal energy is technically feasible for utilization in various locations around Europe (e.g., [35,63]) and has substantial potential to aid in achieving the targets of reduced emissions and increase the share of renewables within the EU‘s energy mix. Contrary to many other renewable energies, geothermal provides stable and reliable power output, i.e., in comparison with solar photovoltaics and wind power [63]. However, geothermal will not be a good representative of improved energy performance in terms of primary energy use if the PEF is defined the way it is described in today’s EU energy and climate framework.

5. Conclusions

To conclude, how does geothermal utilization measure up to EU climate and energy policy? Geothermal has the potential to take part in the EU achieving its climate and energy targets. The definition of the primary energy factor, or more explicitly the primary energy content of a geothermal resource, does limit geothermal energy for being successful in terms of improved energy efficiency measures unless the measures are against lowering the non-renewable primary energy use instead of the total primary energy use. The authors regard that the intention of the IEA with the different definitions on how to evaluate the primary energy of a resource was not to cause biased energy indicators that could potentially favor non-renewable technologies in some context over some renewables. Still, the PEF for thermal renewables does precisely that. It may be that the downside implications resulting from the PEF definition for geothermal utilization were not taken sufficiently into account in the process. We believe that the most transparent way of expressing the benefits of replacing non-renewable energy with renewable energy in terms of primary energy efficiency is to highlight the PEFnon-ren as a mandatory indicator within the EU “Clean energy for all Europeans” policy framework.

Author Contributions

Conceptualization, M.R.K., J.H., H.P., and O.P.P.; methodology, M.R.K. and J.H.; software, M.R.K.; validation, M.R.K.; formal analysis, M.R.K.; investigation, M.R.K.; resources, M.R.K.; data curation, M.R.K.; writing—original draft preparation, M.R.K.; writing—review and editing, M.R.K., J.H., H.P., and O.P.P.; visualization, M.R.K.; supervision, O.P.P.; project administration, O.P.P.; funding acquisition, O.P.P. All authors have read and agreed to the published version of the manuscript.

Funding

This work is a part of the Primary Energy Efficiency (PEE) project that was funded by Nordic Energy Research, grant number 16X753.02, and co-financed by the National Energy Fund (Orkusjóður), grant number 12-2007, owned by the Government of Iceland. Also partially funded by the Landsvirkjun Energy Research fund, grant number FMV 04-2013.

Acknowledgments

Reykjavik Energy, and its subsidiary ON Power, supported the work by providing data on the Hellisheidi geothermal CHP plant along with expert advice.

Conflicts of Interest

The funders had no role in the design of the study; in the collection, analyses, or interpretation of data; in the writing of the manuscript, or in the decision to publish the results.

Abbreviations

ACERAgency for the Cooperation of Energy Regulators
AGMAlternative Generation Method
CEDCumulative Energy Demand
CENThe European Committee for Standardization (French: Comité Européen de Normalisation)
CHPCombined Heat and Power
CML-IAImpact Assessment method of the Centrum voor Milieuwetenschappen, Leiden University
CTCooling tower
CWColdwater well
CWPColdwater pumps
CWTColdwater tank
DADeaerator
DHHXHeat exchanger District Heat
DHTHot water tank District Heat
EDElectricity Directive
EEDEnergy Efficiency Directive
EOLEnd of life
EPBEnergy Performance in Buildings
EPBDEnergy Performance in Buildings Directive
EPCEnergy Performance Certificate
ETSEmission Trading System
EUEuropean Union
FVFlashing valve
GHGGreenhouse Gas Emissions
GWGeothermal well
HPCHigh-pressure condenser with preheater
HPMmethod moisture remover
HPSHigh-pressure steam separator
HPTGHigh-pressure turbine-generator set
HWPHot water pump
IEAInternational Energy Agency
IPCCIntergovernmental Panel on Climate Change
IRESInternational Recommendations for Energy Statistics
ISOInternational Organization for Standardization
LCALife Cycle Assessment
LCILife cycle inventory
LPCLow-pressure condenser
LPMLow-pressure moisture remover
LPSLow-pressure steam separator
LPTGLow-pressure turbine-generator set
PEFPrimary Energy Factor
PEFnon-renNon-Renewable Primary Energy Factor
REDRenewable Energy Directive
RWReinjection well
WEWellhead
WSWell silencer

References

  1. European Commission. Clean Energy for All Europeans Package. Available online: https://ec.europa.eu/energy/en/topics/energy-strategy-and-energy-union/clean-energy-all-europeans (accessed on 21 November 2019).
  2. International Energy Agency. Commentary: Understanding and Using the Energy Balance. Available online: https://www.iea.org/newsroom/news/2017/september/commentary-understanding-and-using-the-energy-balance.html?utm_content=buffer3537d (accessed on 26 November 2019).
  3. Eurostat. Energy Balance Guide. Methodology Guide for the Construction of Energy Balances & Operational Guide for the Energy Balance Builder Tool. Available online: https://ec.europa.eu/eurostat/documents/38154/4956218/ENERGY-BALANCE-GUIDE-DRAFT-31JANUARY2019.pdf/cf121393-919f-4b84-9059-cdf0f69ec045 (accessed on 26 November 2019).
  4. Buildings Performance Institute Europe. Is the Primary ENERGY factor the Right Indicator for Determining the Energy Performance of Buildings? Discussion Paper. Available online: http://bpie.eu/wp-content/uploads/2017/09/Policy-paper-PEF_edits_18Sept.pdf (accessed on 22 November 2019).
  5. Harmsen, R.; Wesselink, B.; Eichhammer, W.; Worrell, E. The unrecognized contribution of renewable energy to Europe’s energy savings target. Energy Policy 2011, 39, 3425–3433. [Google Scholar] [CrossRef]
  6. Hitchin, R. Primary Energy Factors and the primary energy intensity of delivered energy: An overview of possible calculation conventions. Build. Serv. Eng. Res. Technol. 2018, 40, 014362441879971. [Google Scholar] [CrossRef]
  7. Segers, R. Three options to calculate the percentage renewable energy: An example for a EU policy debate. Energy Policy 2008, 36, 3243–3248. [Google Scholar] [CrossRef]
  8. Karlsdottir, M.R.; Heinonen, J.; Palsson, H.; Palsson, O.P. Life cycle assessment of a geothermal combined heat and power plant based on high temperature utilization. Geothermics 2020, 84, 101727. [Google Scholar] [CrossRef]
  9. Eurostat. Smarter, Greener, More Inclusive? Indicators to Support the Europe 2020 Strategy, 2019 eds.; Publication Office of the European Union: Luxembourg, 2019. [Google Scholar]
  10. European Commission. Communication from the Commission to the European Parliament, the Council, the European Economic and Social Committee and the Committee of the Regions. A Policy Framework for Climate and Energy in the Period from 2020 to 2030; Publication Office of the European Union: Luxembourg, 2014. [Google Scholar]
  11. European Commission. 2030 Climate & Energy Framework. Available online: https://ec.europa.eu/clima/policies/strategies/2030_en (accessed on 21 November 2019).
  12. Directorate-General for Energy, Clean Energy for All Europeans; Publication Office of the European Union: Luxembourg, 2019.
  13. European Commission The European Green Deal. Available online: https://ec.europa.eu/commission/presscorner/detail/e%20n/ip_19_6691 (accessed on 17 April 2020).
  14. European Commission, Directorate-General for Climate Action. Proposal for a regulation of the european parliament and of the council establishing the framework for achieving climate neutrality and amending Regulation (EU) 2018/1999 (European Climate Law); Publication Office of the European Union: Brussels, Belgium, 2020. [Google Scholar]
  15. European Council Directive. Directive (EU) 2018/844 of the European Parliament and of the Council of 30 May 2018 Amending Directive 2010/31/EU on the Energy Performance of Buildings and Directive 2012/27/EU on Energy Efficiency (Text with EEA Relevance); European Parliamend and European Council, Ed.; Official Journal of the European Union: Luxembourg, 2018. [Google Scholar]
  16. European Council Directive. Directive (EU) 2018/2002 of the European Parliament and of the Council of 11 December 2018 on the Promotion of the Use of Energy from Renewable Sources (Recast); Official Journal of the European Union: Luxembourg, 2018. [Google Scholar]
  17. Cherubini, F.; Birda, N.; Cowie, A.; Jungmeier, G.; Schlamadinger, B.; Woess-Gallasch, S. Energy- and greenhouse gas-based LCA of biofuel and bioenergy systems: Key issues, ranges and recommendations. Resourc. Conserv. Recycl. 2009, 53, 434–447. [Google Scholar] [CrossRef]
  18. Heinonen, J.; Laine, J.; Pluuman, K.; Säynäjoki, E.-S.; Soukka, R.; Junnila, S. Planning for a Low Carbon Future? Comparing Heat Pumps and Cogeneration as the Energy System Options for a New Residential Area. Energies 2015, 8, 9137–9154. [Google Scholar] [CrossRef] [Green Version]
  19. Olkkonen, V.; Syri, S. Spatial and temporal variations of marginal electricity generation: The case of the Finnish, Nordic, and European energy systems up to 2030. J. Clean. Prod. 2016, 126, 515–525. [Google Scholar] [CrossRef]
  20. Zhang, X.; Myhrvold, N.P.; Caldeira, K. Key factors for assessing climate benefits of natural gas versus coal electricity generation. Environ. Res. Lett. 2014, 9, 114022. [Google Scholar] [CrossRef] [Green Version]
  21. Farsaei, A.; Syri, S.; Olkkonen, V.; Khosravi, A. Unintended Consequences of National Climate Policy on International Electricity Markets—Case Finland’s Ban on Coal-Fired Generation. Energies 2020, 13, 1930. [Google Scholar] [CrossRef] [Green Version]
  22. Soimakallio, S.; Kiviluoma, J.; Saikku, L. The complexity and challenges of determining GHG (greenhouse gas) emissions from grid electricity consumption and conservation in LCA (life cycle assessment)—A methodological review. Energy 2011, 36, 6705–6713. [Google Scholar] [CrossRef]
  23. European Council Directive. Directive (EU) 2018/2002 of the European Parliament and of the Council of 11 December 2018 Amending Directive 2012/27/EU on Energy Efficiency; Official journal of the European Union: Luxembourg, 2018. [Google Scholar]
  24. Bio Intelligence Service; Ronan Lyons. IEEP Energy Performance Certificates in Buildings and Their Impact on Transaction Prices and Rents in Selected EU Countries. Final Report Prepared for European Commission (DG Energy); Publication Office of the European Union: Brussels, Belgium, 2013. [Google Scholar]
  25. International Organization for Standardization. Energy Performance of Buildings-Overarching EPB Assessment—Part 1: General Framework and Procedures (ISO 52000-1:2017); International Organization for Standardization: Geneva, Switzerland, 2017. [Google Scholar]
  26. European committee for standardization. Energy Performance of Buildings - Overarching EPB Assessment—Part 2: Explanation and Justification of ISO 52000-1 (CEN ISO/TR 52000-2:2017); International Organization for Standardization: Geneva, Switzerland, 2017. [Google Scholar]
  27. Curran, M.A.; Mann, M.; Norris, G. The international workshop on electricity data for life cycle inventories. J. Clean. Prod. 2005, 13, 853–862. [Google Scholar] [CrossRef]
  28. Guinée, J.B.G.M.; Heijungs, R.; Huppes, G.; Kleijn, R.; de Koning, A.; van Oers, L.; Wegener Sleeswijk, A.; Suh, S.; Udo de Haes, H.A.; de Bruijn, H.; et al. Handbook on Life Cycle Assessment. Operational Guide to the ISO Standards. I: LCA in Perspective. IIa: Guide. IIb: Operational Annex. III: Scientific Background; Kluwer Academic Publishers: Dordrecht, The Netherlands, 2002; p. 692. [Google Scholar]
  29. Guinée, J.B.; Heijungs, R.; Huppes, G.; Zamagni, A.; Masoni, P.; Buonamici, R.; Ekvall, T.; Rydberg, T. Life cycle assessment: Past, present, and future. Environ. Sci. Technol. 2011, 45, 90–96. [Google Scholar] [CrossRef] [PubMed]
  30. Sauar, E. IEA Underreports Contribution Solar and Wind by A Factor of Three Compared to Fossil Fuels. Available online: https://energypost.eu/iea-underreports-contribution-solar-wind-factor-three-compared-fossil-fuels/ (accessed on 25 November 2019).
  31. Saemundsson, K.; Axelsson, G.; Steingrimsson, B. Geothermal Systems in Global Perspective; ISOR – Iceland GeoSurvey Reykjavik: Reykjavik, Iceland, 2009. [Google Scholar]
  32. DiPippo, R. Geothermal Power Plants. Principles, Applications, Case Studies and Environmental Impact; Elsevier: Amsterdam, The Netherlands, 2008. [Google Scholar]
  33. Eurostat Statistics Explained. Electricity Production, Consumption and Market Overview. Available online: https://ec.europa.eu/eurostat/statistics-explained/index.php/Electricity_production,_consumption_and_market_overview#:~:text=Data%20extracted%20in%20June%202019,Planned%20article%20update%3A%20July%202020.&text=Total%20net%20electricity%20generation%20in,2017%20came%20from%20combustible%20fuels (accessed on 5 June 2020).
  34. Huttrer, G.W. Geothermal Power Generation in the World 2015-2020 Update Report. In World Geothermal Congress; International Geothermal Association: Reykjavik, Iceland, 2020. [Google Scholar]
  35. Lund, J.W.; Toth, A.N. Direct Utilization of Geothermal Energy 2020 Worldwide Review. In World Geothermal Congress; International Geothermal Association: Reykjavik, Iceland, 2020. [Google Scholar]
  36. Sullivan, J.L.; Wang, M.Q. Life cycle greenhouse gas emissions from geothermal electricity production. J. Renew. Sustain. Energy 2013, 5, 063122. [Google Scholar] [CrossRef]
  37. Saner, D.; Juraske, R.; Kubert, M.; Blum, P.; Hellweg, S.; Bayer, P. Is it only CO2 that matters? A life cycle perspective on shallow geothermal systems. Renew. Sustain. Energy Rev. 2010, 14, 1798–1813. [Google Scholar] [CrossRef]
  38. Bertani, R.; Thain, I. Geothermal power generating plant CO2 emission survey. IGA News, 20 September 2002; 1–3. [Google Scholar]
  39. Hussy, C.; Klaassen, E.; Koornneef, J.; Wigand, F. International Comparison of Fossil Power Efficiency and CO2 Intensity; Ecofys: Utrecht, The Netherlands, 2014. [Google Scholar]
  40. Fridriksson, T.; Mateos, A.; Orucu, Y.; Audinet, P. Greenhouse Gas Emissions from Geothermal Power Production. In Stanford Geothermal Workshop; Stanford Geothermal Workshop: Stanford, CA, USA, 2017. [Google Scholar]
  41. Orkustofnun. OS-2019-T004-01: Gas Emissions of Geothermal Power Plants and Utilities 1969–2018; Orkustofnun: Reykjavik, Iceland, 2019. [Google Scholar]
  42. Zarrouk, S.J.; Moon, H. Efficiency of geothermal power plants: A worldwide review. Geothermics 2014, 51, 142–153. [Google Scholar] [CrossRef]
  43. European Environment Agency. Trends and Projections in Europe 2019. Tracking Progress towards Europe’s Climate and Energy Targets; 15/2019; Publication Office of the European Union: Luxembourg, 2019. [Google Scholar]
  44. Lund, J.W.; Chiasson, A. Examples of combined heat and power plants using geothermal energy. In European Geothermal Congress (EGC); European Geothermal Energy Council (EGEC): Unterhaching, Germany, 2007. [Google Scholar]
  45. DeLovato, N.; Sundarnath, K.; Cvijovic, L.; Kota, K.; Kuravi, S. A review of heat recovery applications for solar and geothermal power plants. Renew. Sustain. Energy Rev. 2019, 114, 109329. [Google Scholar] [CrossRef]
  46. EPD INTERNATIONAL AB. Product Category Rules (PCR). Electricity, Steam and Hot Water Generation and Distribution; 2007:08; EPD International AB: Stockholm, Sweden, 2020. [Google Scholar]
  47. European Committee for Standardization. EN 15316-4-5:2017 (E). Heating Systems in Buildings - Method for Calculation of SYSTEM energy Requirements and System Efficiencies—Part 4–5: District Heating and Cooling; International Organization for Standardization: Geneva, Switzerland, 2017. [Google Scholar]
  48. Karlsdottir, M.R.; Palsson, H.; Palsson, O.P.; Maya-Drysdale, L. Life cycle inventory of a flash geothermal combined heat and power plant located in Iceland. Int. J. Life Cycle Assess. 2015, 20, 503–519. [Google Scholar] [CrossRef]
  49. Gunnlaugsson, E.; Gislason, G. Preparation for a New Power Plant in the Hengill Geothermal Area, Iceland In World Geothermal Congress; International Geothermal Association: Antalya, Turkey, 2005. [Google Scholar]
  50. National Energy Authority. Energy Statistics in Iceland 2016; Orkustofnun National Enery Authority: Reykjavík, Iceland, 2017. [Google Scholar]
  51. ISO 14040. Environmental Management-Life Cycle Assessment-Principles and Framework (ISO 14040:2006); ISO-International Organization for Standardization: Geneva, Switzerland, 2006. [Google Scholar]
  52. ISO 14044. Environmental Management-Life Cycle Assessment-Requirements and Guidelines (ISO 14044:2006); ISO-International Organization for Standardization: Geneva, Switzerland, 2006. [Google Scholar]
  53. Hischier, R.; Weidema, B.; Althaus, H.J.; Bauer, C.; Doka, G.; Dones, R.; Frischknecht, R.; Hellweg, S.; Humbert, S.; Jungbluth, N. Implementation of Life Cycle Impact Assessment Methods. Ecoinvent Report No. 3, v2.2; ecoinvent Centre: Dübendorf, Switzerland, 2010. [Google Scholar]
  54. Sullivan, J.L.; Stephens, T.; Wang, M. Geothermal Power Production: Alternative Scenarios and Critical Issues; Argonne National Lab. (ANL): Lemont, IL, USA, 2014.
  55. Buonocore, E.; Vanoli, L.; Carotenuto, A.; Ulgiati, S. Integrating life cycle assessment and emergy synthesis for the evaluation of a dry steam geothermal power plant in Italy. Energy 2015, 86, 476–487. [Google Scholar] [CrossRef]
  56. Frick, S.; Kaltschmitt, M.; Schroder, G. Life cycle assessment of geothermal binary power plants using enhanced low-temperature reservoirs. Energy 2010, 35, 2281–2294. [Google Scholar] [CrossRef] [Green Version]
  57. Ertesvåg, I.S. Exergetic comparison of efficiency indicators for combined heat and power (CHP). Energy 2007, 32, 2038–2050. [Google Scholar] [CrossRef]
  58. Moretti, C.; Corona, B.; Rühlin, V.; Götz, T.; Junginger, M.; Brunner, T.; Obernberger, I.; Shen, L. Combining Biomass Gasification and Solid Oxid Fuel Cell for Heat and Power Generation: An Early-Stage Life Cycle Assessment. Energies 2020, 13, 2773. [Google Scholar] [CrossRef]
  59. Lelek, L.; Kulczycka, J.; Lewandowska, A.; Zarebska, J. Life cycle assessment of energy generation in Poland. Int. J. Life Cycle Assess. 2016, 21, 1–14. [Google Scholar] [CrossRef] [Green Version]
  60. Tereshchenko, T.; Nord, N. Uncertainty of the allocation factors of heat and electricity production of combined cycle power plant. Appl. Therm. Eng. 2015, 76, 410–422. [Google Scholar] [CrossRef] [Green Version]
  61. Shubbak, M.H. Advances in solar photovoltaics: Technology review and patent trends. Renew. Sustain. Energy Rev. 2019, 115, 109383. [Google Scholar] [CrossRef]
  62. Aradóttir, E.S.P.; Gunnarsson, I.; Sigfússon, B.; Gunnarsson, G.; Júliusson, B.M.; Gunnlaugsson, E.; Sigurdardóttir, H.; Arnarson, M.T.; Sonnenthal, E. Toward Cleaner Geothermal Energy Utilization: Capturing and Sequestering CO2 and H2S Emissions from Geothermal Power Plants. Transp. Porous Media 2015, 108, 61–84. [Google Scholar] [CrossRef]
  63. Khosravi, A.; Syri, S.; Zhao, X.; El Haj Assad, M. An Artificial Intelligence Approach for Thermodynamic Modeling of Geothermal Based-Organic Rankine Cycle Equipped with Solar System. Geothermics 2019, 80, 138–154. [Google Scholar] [CrossRef]
Figure 1. Schematic of the Hellisheidi geothermal CHP plant. WS: Well silencer; WE: Wellhead; GW: Geothermal well; HPS: High-pressure steam separator; HPM: High-pressure moisture remover; HPTG: High-pressure turbine-generator set; HPC: High-pressure condenser with preheater for district heat; CT: Cooling tower; FV: Flashing valve; LPS: Low-pressure steam separator; LPM: Low-pressure moisture remover; LPTG: Low-pressure turbine-generator set; LPC: Low-pressure condenser; CW: Coldwater well; CWP: Coldwater pump; CWT: Coldwater tank; DHHX: Heat exchanger for district heat; DA: Deaerator; HWP: Hot water pump; DHT: Hot water tank for district heat; RW: Reinjection well.
Energies 13 03187 g001
Figure 2. The system boundary for the Hellisheidi LCA study, showing the processes and life cycle stages included and excluded (dashed lined boxes) in the original study by Karlsdottir et al. [8].
Energies 13 03187 g002
Figure 3. The main unit processes set up to describe the production of electricity and heat from the Hellisheidi geothermal CHP plant.
Energies 13 03187 g003
Figure 4. Results for allocation factors for electricity and heat from the Hellisheidi CHP plant based on the investigated allocation methods.
Energies 13 03187 g004
Figure 5. The results of the two indicators for GHG emissions and PEF vary greatly due to different allocation methods used to allocate impacts between the production of electricity and heat: (a) Results for the GHG emission factor for electricity and heat for the different allocation methods analyzed in the study; (b) The total primary energy factor shows the sum of all renewable and non-renewable energy inputs needed to produce 1 kWh of electricity or 1 kWh of heat.
Energies 13 03187 g005
Figure 6. The non-renewable primary energy factor shows the sum of all non-renewable energy inputs (non-renewable biomass, nuclear, and fossil fuels) needed to produce 1 kWh of electricity or 1 kWh of heat. The results vary greatly depending on the allocation method used.
Energies 13 03187 g006
Table 1. Overview of the eight legislative acts combined in the Clean Energy for all Europeans package (adopted from [1]).
Legislative ActOfficial Journal Publication
(Date and Official Document)
Energy Performance in Buildings Directive (EPBD)19/06/2018 - Directive 2018/844
Renewable Energy Directive (RED)21/12/2018 - Directive 2018/2001
Energy Efficiency Directive (EED)21/12/2018 - Directive 2018/2002
Governance of the Energy Union21/12/2018 - Regulation 2018/1999
Electricity Regulation14/06/2019 - Regulation 2019/943
Electricity Directive (ED)14/06/2019 - Directive 2019/944
Risk Preparedness 14/06/2019 - Regulation 2019/941
Agency for the Cooperation of Energy Regulators (ACER)14/06/2019 - Regulation 2019/942
Table 2. Results for the allocation factors resulting from the different allocation methods A–F investigated in the study.
Allocation MethodsElectricityHeat
A. Electricity (system expansion)
A1 Construction: Steam collection and reinjection100%0%
A2.1 Operation: Geothermal fluid, primary energy flow94%6%
A2.2 Operation: Geothermal fluid, material flow100%0%
A3 Maintenance: Make-up wells100%0%
B. Heat (system expansion)
B.1 Construction: Steam collection and reinjection86%14%
B.2 Operation: Geothermal fluid, primary energy, and material flow91%9%
B.3 Maintenance: Make-up wells97%3%
C. Energy73%27%
D. Exergy92%8%
E. Economic86%14%
F. AGM92%8%

