Article

Analysis of the Potential for Gas Micro-Cogeneration Development in Poland Using the Monte Carlo Method

1
Mineral and Energy Economy Research Institute, Polish Academy of Sciences, 7A Wybickiego St., 31-261 Cracow, Poland
2
Department of Thermal and Fluid Flow Machines, Faculty of Energy and Fuels, AGH University of Science and Technology, 30 Mickiewicza Ave., 30-059 Cracow, Poland
*
Author to whom correspondence should be addressed.
Energies 2020, 13(12), 3140; https://doi.org/10.3390/en13123140
Submission received: 27 April 2020 / Revised: 12 June 2020 / Accepted: 15 June 2020 / Published: 17 June 2020
(This article belongs to the Special Issue Energy Systems for Residential and Tertiary Sector)

Abstract

:
Micro-cogeneration (mCHP) is a promising solution for the generation of heat and electricity in households, it contributes to reducing carbon dioxide emissions in countries where the production of electricity is mainly based on fossil fuels. Its dissemination in Poland faces barriers in the form of high purchase prices in relation to electricity productivity. In this work 1% of the household population in Poland was analyzed using the Monte Carlo method. It was found that for mCHP to become economically profitable for a group of at least 10,000 households, its price should fall from around 18,000 euros (711.5 euros/kWth and 18,000 euros/kWe) to 4800 euros (189.7 euros/kWth and 4800 euros/kWe) and for 100,000 households to 4100 euros (162.1 euros/kWth and 4100 euros/kWe). These calculations were made for fixed gas and electricity prices. The analysis also included cases of various changes in gas and energy prices. Faster growth of electricity prices than gas prices reduce the profitability barrier. In addition, a building located in Lesser Poland region was analyzed, with an above average demand for electricity and heat. Gas micro-cogeneration becomes profitable for this household at a price of 3700 euros (146.2 euros/kWth and 3700 euros/kWe) at fixed gas and electricity prices.

Graphical Abstract

1. Introduction

In 2018, energy consumption in households accounts for 26.7% of the total energy consumption in Poland. Therein, households consumed 53.2% of heat, 20.7% of natural gas, 18.4% of liquid gas (mostly for space heating and food preparation) and 16.5% of electricity [1]. According to KOBiZE data, in 2017 greenhouse gas emissions (excluding emissions from international aviation and maritime transport and land use, land use change and forestry) in Poland obtained 413.8 million tons of CO2 equivalent. This means that their emissions have been reduced in comparison to 1990 and 1988 by 12.8% and 28.3%, respectively. More importantly, the energy sector was largely responsible for greenhouse gas emissions (in 2017, its share has been 82.7% of total emissions) [2]. From an environmental point of view, Poland has been a signatory to the UN Framework Convention on Climate Change since 1994 and the Kyoto Protocol since 2002, and thus participates in efforts to reduce climate change undertaken by the international community. In the first commitment period, resulting from Poland’s ratification of the Kyoto Protocol, Poland undertook measures to reduce its greenhouse gas emissions in 2008–2012 by 6% compared to emissions in the base year (for Poland the base year was set for 1988). However, in the second commitment period set out in the Doha amendment and the “Europe 2020” strategy, it was planned to reduce greenhouse gas emissions by at least 20% jointly with the European Union in 2013–2020 compared to the base year [3]. These goals can be achieved, among others by using modelling and simulation during solving energy-oriented problems [4], eliminating hard coal-fired units, adapting novel, environmentally friendly technologies (with low–carbon and recyclable construction materials) [5], using renewable energy sources [6] or by reducing transmission and distribution losses through decentralized generation [7]. The use of combined heating and power (CHP) units for residential building energy production, called micro-CHP (mCHP), is one of the decentralized generation methods, which can increase the energy efficiency by generating heat and electricity simultaneously [8]. Wherein, micro-CHP unit is classified in this category, when its maximum electric capacity is up to 50 kWe (other two categories includes “small-scale or mini cogeneration” unit if its maximum electric capacity ranges from 50 kWe to 1 MWe and “cogeneration” unit—for 1 MWe and more) [9]. CHP units can be installed near to the end user, what eliminates the losses of useful heat during distribution between unit and end user [10]. The comparison of energy flow for the building working with and without CHP is shown on Figure 1. In case of conventional building, the thermal and electricity loads are supplied, respectively by the boiler and power grid. In case of building using CHP unit, the building loads are supplied simultaneously—space heating and district heating use the heat recovered from CHP, while the generated power is utilized for the electric load. The grid power can be provided to the building when the generated power is not enough for the electric load. In addition, in opposite situation, when greater power is generated than it is required, surplus power can be returned to the grid [11].
Given the available micro-CHP technologies, two categories can be distinguished, namely: technologies based or not based on thermodynamic cycles used for power generation [8]. The first category (based on thermodynamic cycles) includes both internal and external combustion technologies, e.g., Organic Rankine Cycles (ORCs) [12], internal combustion engines (ICEs) [13], microturbines [14], Stirling engines (SEs) [15,16], new expander technologies such as Wankel-type expanders, etc. [17]. The second group of technologies, the one not based on thermodynamic cycles, mostly contain fuel cells [18] and solar photovoltaic hybrid technologies (PV/T) [19,20]. The use of ORC in combined heat and power production is well known and extensively studied technology, which can be used with a wide range of heat sources such as biomass [21], geothermal [22], solar [23] or waste heat [24]. However, in case of micro-CHP (below 50 kWe) this technology is not mature enough and face some challenges connected with designing small size turbine or expansion machine and compact, highly efficient heat exchangers appropriate for such unit [12]. In addition, micro-CHP ORC systems face the same problems as large units with dependence on ORC system design from working fluid selection and operating parameters [25]. The other group of micro-CHP applications, which can operate with wide range are internal combustion and reciprocating engines. Reciprocating engines can provide very good fuel conversion efficiency and at the same time a high power to weight ratio. Currently the most interesting (in the range of 1–5 kWe of output power) in the ratio efficiency/cost is ICE (usually “Otto engines” and “Diesel engines” are categorized as ICE) [26]. What seems important, ICE is well-known and established technology, but still offers room for research and the efficiency improvement [8]. Most of the ICE units use natural gas as energy source and this low fuel adaptability can be classified as disadvantage of those technologies. However, there are some studies, which considered alternative fuels (syngas form biomass [27] or hydrogen enriched with natural gas [28]) for ICE engines. Multi-fuel capabilities (mostly gaseous or liquid fuels) and high-grade waste heat are advantages of a small combustion turbines. Additionally, microturbines as micro-CHP units can offer a compact size and low noise. However, their efficiency is lower than in case of ICE engines and a decrease of efficiency at partial loads can be observed which cause technical barrier in spreading this technology [29]. Harrison and On [30] have considered Stirling engines to be one of the most promising technologies within micro-CHP. They allow strict control of the combustion process and high fuel adaptability, which makes them suitable for integration with renewable energy resources. In addition, SE have a lower noise level than ICE, which is why they seems to be a good solution for residential applications [31]. To demonstrate the high fuel adaptability of SE, study of solar dish Stirling micro-CHP system for residential applications (in five different Iran cities) has been conducted [32]. Studies shows that the best electrical efficiency can be obtain by fuel cell micro-CHP. The comparison of micro-CHP technologies shown that fuel cells have great potential for residential applications, however, a capital costs are still too high [33]. In addition, each CHP system is composed of not only a prime mover, but also a thermal storage unit and an auxiliary boiler (used to cover peak thermal demand) [34].
There have been many studies on various micro-CHP application both in single family house and multi-family house [11,35] that shows the great potential of micro-CHP in reduction of the residential building consumption. Bianchi et al. [36] provide general guidelines for using micro-CHP in single family house. Their study showed that appropriately sized both the CHP prime mover and thermal storage system can save 15–45% of primary energy depending on the used micro-CHP unit. Barbieri et al. [34] analyzed the feasibility of different CHP type (ICE, micro-gas turbine, micro-Rankine cycle and Stirling engine) for meeting energy demand of single house. The study shows importance of appropriate selectin of size of thermal energy storage unit. In addition, the economic analysis showed that a reasonable level of the CHP marginal cost is near 3000 euros/kWe. Economic and environmental assessment has been conducted in Ito research [37]. The economic analysis showed that the target cost of the micro-CHP unit (with the back-up boiler) is about $6200 under current grid price in Japan and achieve ten years payback for 1 kW. Streimikiene and Baležentis [38] conducted multi-criteria assessment analysis to compare four micro-CHP technologies (reciprocating engines, microturbines, Stirling engines and PEM fuel cells) for buildings in Lithuania. The study has taken under consideration economic, social and environmental criteria. The best results have been obtained for microturbines, followed by engines, but the difference between them was not significant. Ren and Gao [39] investigated the use of gas engine and fuel cell CHP-unit in residential buildings in Japan. Their study show that the fuel cell technology obtained better parameters for the examined residential building from economic (annual energy cost reduced by 26%) and environmental point (annual CO2 emissions reduced about 9%). Lee et al. [40] analyzed the feasibility of integration CHP system into buildings for two different regions in USA. The results show 21% and 27% cost savings in mid-Atlantic region and Great Lakes region, respectively. Entchev et al. [41] discuss the integration micro-cogeneration system designed for demonstration house in Canada. For this study, a Stirling micro-CHP unit was used with an electric output of 736 We and a thermal output of 6.5 kWth. The study has showed that analyzed unit met demand for heat and electricity during testing period. Wajs et al. [12] conducted research on the prototype of domestic ORC system integrated (which allows to generate 760 We, almost 1 kWe in Rankine Cycle module) with a typical commercial gas boiler.
For the multi-family house, Arteconi et al. [35] evaluated integration of micro solar ORC plant with residential buildings. The analyzed system included concentrated linear Fresnel reflector solar field (producing heat at temperature in the range of 250–280 °C), a phase change material (PCM) thermal energy storage tank and 2 kWe/18kWt ORC unit. The analyzed system produced 50% of energy demand for six dwellings with 6% and 9% of cost and energy saving, respectively. Rodrἱguez et al. [42] analyzed several designs of hybrid system (composed of solar thermal collectors, photovoltaic panels and internal combustion engine) for the same six-story residential building in five different Spanish locations with diverse climate conditions. All analyzed case studies were compared in terms of primary energy consumption and emissions and the Life Cycle Cost analysis. Based on this, the most optimal solution is presented. Kim et al. [43] reported the proper capacity of internal combustion engine micro-CHP unit based on the number of apartments units being served. The analysis focused both on energetic and economic criteria and was done based on Korean load profiles. Jung et al. [11] also analyzed internal combustion engine-based the micro-CHP system in multi-family building with the floor heating system in Korea. Appling of such system causes reduction of primary energy consumption by 18.4%, CO2 emissions by 11.8% and operation cost 9.6%, respectively. Spitalny et al. [44] studied the possible market expansion of heat pumps and micro-CHP based on the residential sector in Germany. The analysis showed that the micro-CHP have high potential in multi-family house, while heat pumps are better suited to single-family house. Caliano et al. [45] analyzed the optimal operation of micro-CHP system producing heat and electricity to multi-apartment housing in Italy. Two operating strategies were implemented—in the first, the heat production was limited by user heat demand; win the second—heat dumping is allowed.
In spite of the large amount of research and analysis, huge market and potential benefits of reducing primary energy consumption and greenhouse gases (GHG) emissions, micro-CHP systems still have a lot to do to reach a sufficient state of maturity and become an important alternative to the standard heating systems as Dentice d’Accadia et al. [46] and De Paepe et al. [47] showed. In addition to environmental and energy issues, the problems with diffusion of this technology into the market is affected not only by some technological obstacles, but also by gas and electricity prices, which influence competitiveness of micro-CHP unit (that should be characterized by easy operation and low investment cost). Paepe et al. showed that micro-CHP system in residential applications is not attractive due to the high investment cost and long payback period. However, Hawkes and Leach [48] specified that in cold climate areas (with higher thermal needs and time working) the potential interest of this units can be bigger.
Structure of households’ energy consumption per inhabitant by various energy commodities in the Poland and in the EU-28 is presented below in Figure 2. In Poland, coal still has a high share among commodities at the level of 32.1%, while in the EU-28 its consumption for household needs is marginal—2.6%. The largest share of energy commodity in the structure of energy consumption in households in the EU has natural gas and it is 36%. In order to reduce these disparities, an analysis of the increase in the share of micro-CHP units based on natural gas in single-family houses in Poland was carried out. Equally important, natural gas micro-CHP units are currently the most popular solution in EU, and their service is not demanding and more importantly it is available in Poland, which can also influence the preference for this type of solution on the domestic market. This study demonstrates the possibilities of technical and economical application of natural gas micro-CHP technology in households in Poland. This research was based on a real demand profile of a households in Poland. At this moment, there are no solutions on the direction in which those micro-CHP technologies should develop in household sector, so that their use can be profitable. The novelty of the result of this analysis is to answer the question of how great is the potential for this type of solution in Poland–in other words, do we have enough gas-connected households that have such heat energy consumption that the use of micro-CHP is economically justified. The novelty of the result of this analysis is the development of guidelines for the technical and economic feasibility of implementing micro-CHP systems in households in Poland. For example, how much electricity and heat should produce micro-CHP unit to diffuse into the market, at what prices of the device or electricity the solution is profitable, etc.
The analysis adopted the method involving the construction of an energy balance and cash flow model for a heat and electricity source in a hypothetical household. In the Monte Carlo simulation process, the values of technical parameters are drawn from the probability density distributions describing the structure of these parameters for the household population in Poland. A set of randomly selected data in one iteration characterized a single household. For each simulation 134,325 data sets characterizing a sample of 134,325 hypothetical households in Poland were drawn. Simulations were made for different variants of fuel (gas) and electricity prices. The proposed approach to analysis was successfully used to assess the potential of passenger car technology for compressed natural gas [49] and assessment of the potential for reducing pollutant emissions and improving energy efficiency in the household sector in Poland [50]. In addition, the potential of micro cogeneration installations for a single case—a building located in an area with high air pollution in Poland—was analyzed [51].
Economic and technical analysis of the cogeneration using Monte Carlo simulations were carried out, among others, by:
Momen et al. [52] Monte Carlo simulations was used to estimate variable electricity and gas prices, focusing on the commodity market. Yearly prices for individual customers (households) are currently nearly constant. In addition, optimization of the operating parameters of a 30 MW cogeneration source was included in the analysis.
Westner and Madlener [53]—the financial support systems for investment in CHP were reviewed for individual European countries. NPV simulations on a sample of 100,000 units (with power over 0.5 MWe) was carried out.
Carpaneto et al. [54]—Monte Carlo simulations were used to determine uncertainty and probabilistic models for cogeneration with a capacity of several hundred kWe. The fluctuations in fuel and energy prices as well as heat demand over time were also considered.
Siler-Evans et al. [55]—the impact of cogeneration on the power and electricity market as well as the impact on the amount of CO2 emission charges was analyzed using Monte Carlo simulations.
Marquez et al. [56]—Monte Carlo simulation was used to determine operational availability for cogenerations plants when working over hours and years.
The above-mentioned analyses, however, did not concern the estimation of the potential of using a given technology in a broadly understood society, among others due to the fact that analyses concerned power levels that are not applicable in households.
The study is organized as follows: in Section 2 the data presenting electricity and heat demand both from literature and for the selected building is presented and analyzed, in Section 3 methods and assumptions used in analysis are described, Section 4 presents results and their discussion and finally the conclusions are provided in Section 5.

2. Data for Analysis

2.1. Literature Data Presenting the Demand for Electricity and Heat for Households

The demand for electricity in households varies for individual hours of the day and depends on many factors such as: time of the year, day of the week (weekend/weekdays), number of inhabitants or their habits and routine activities. Regardless of all these factors, the common feature are periods of increased demand during the day, associated with staying in the building and performing activities that require electricity. Below are literature examples of daily electricity demand profiles for residential buildings located in Ireland, Denmark United Kingdom and Poland.
Fintan McLoughlin et al. [57] have developed 10 typical profiles of electricity users for households in Ireland. Profiles were developed based on intelligent measurement of energy consumption over a 6-month period. These characteristics show how varied and diurnally variable the demand for electricity can be. Profile No. 4 (WD IR), shown in Figure 3, is the profile with the highest number in this country. At the same time, it is also the closest to the profile characteristic for users in Poland (WD PL).
Kyriaki Foteinaki et al. presented in the article [58] a representative daily electricity load profile they developed for Danish households. Two profiles were developed and then compared with three measured data sets of different sizes and from different regions of Denmark. Obtained characteristics are similar to the profile characteristic for residential buildings in Poland (Figure 3)
José Luis Ramírez-Mendiola et al. presented in the article [59] a comparative study between simulated data on electricity demand in residential buildings and measurement data from UK Household Electricity Survey. For loads in the UK, morning and afternoon increased loads are also characteristic, as in the examples discussed above for Ireland and Denmark.
In the analysis, it was decided to use a simplified homogeneous profile for the whole year, not distinguishing characteristics for individual months and seasons. Literature analysis and analysis of the demand characteristics for the examined existing object confirmed that such simplification is sufficient to achieve the objectives of the article.
Figure 3 shows the average daily electricity load profile normalized on the individual maximum of each load profile for Poland, UK and Ireland. Data for Poland comes from the study [60] and present the demand specific to users of the G11 tariff: customers having single-time zone meters with a single electricity rate per kWh. The G11 tariff is the tariff most often chosen by households [61].
Attention in the summary presented in Figure 3 draws much smaller variation between the load at night and daytime for the Polish profile, compared to profiles specific to UK and Denmark. This is probably related to the different specifics of household operations, including larger use of electrical appliances in countries such as UK or Denmark.
The amount of heat demand for heating depends on degree days (Figure 4). The number of degree days is the product of the number of heating days and the difference between the average outdoor temperature and the average temperature of the heated room. Heating days are those days when the average daytime temperature is below 15 °C. The warmest region in this is the southwest (2797 K·day/year) and the coldest is the northeast region (3416 K·day/year). Figure 4 also includes the percentage share of the number of households (shp) in individual voivodships in the total number of households in the country.
Figure 5 presents the distribution of electricity consumption and Figure 6 gas for households in Poland, prepared on the basis of data from Central Statistical Office in Poland [1]. The developed distribution shows that most households consume 1500–2500 kWh per year of electricity, which is 14.61% of all households and about 1000–2000 kWh per year of energy from natural gas, which is 20.8% of all households using natural gas. Demand for heat and gas consumption for heating purposes in households is presented in Table 1.
Based on the summary “Energy consumption in households in 2018” [1], it was determined that among all rural households, 8% use single or dual-function gas boilers for the needs of central heating and domestic hot water preparation. This group was identified as the target market for cogeneration boilers in the first approach, also due to access to the natural gas network and having appropriate boiler rooms and flue pipes. Coal fired boilers users who currently do not have access to the gas are another potential group. It could be expected that eventually they will also be interested in such a solution, however for the purposes of the article it was decided to consider only a group of users with access to the gas network.

2.2. Energy Demand for the Selected Building

In addition to data nationwide, a real object was selected for analysis—a building that in 2018 and 2019 was inhabited by an average of 4.5 people, one of whom was retired. The consumption of electricity was primarily influenced by the use of electricity to prepare meals: electric induction hob and water boiling. The building’s thermal needs were met by a single-function gas condensing boiler integrated with a domestic hot water buffer tank. In the summer, the basic source of energy needed to prepare hot water was a solar system (3 flat collectors). The consumption of electricity and natural gas in the individual months of 2018 and 2019 are shown in Figure 7 as the average daily consumption. In winter months higher energy consumption than in summer can be noticed. It is related to the operation of the central heating installation (auxiliary energy) with greater lighting needs. In turn, in the summer months the use of air conditioning in two rooms was important.
The average daily heat demand for hot water preparation in Poland is around 7.3 kWh [62]. As it results from Figure 7, the daily requirements for the analyzed building are significantly higher than the indicated average for Poland, this applies to all months of the year. Similar observations can be made on the basis of Figure 5 and Figure 6, where it is clearly seen that the building is in a group of high gas and electricity consumption in comparison to other facilities of this type. Despite the fact that analyzed building is characterized by high consumption of natural gas in comparison to other rural households in Poland, only minimally matches the recommendations for using the smallest cogeneration boiler available on the Polish market like Vitotwin [63], for which the suggested efficiency limit is at least 20,000 kWh/year (natural gas) and 3000 kWh/year electricity.
Figure 8 clearly shows a shift in the morning peak for weekdays to earlier hours than for weekends. For the analyzed building, the increase of electricity consumption in the early morning hours is typical, which is related to the specificity of work and habits of residents. For the national average, this increase is shifted by about 2.5 hours. Higher values can also be noticed on weekend evenings (09:00–11:00 p.m.). Higher variability of electricity consumption was observed for the analyzed building than for the general profile of G11 tariff users in Poland. Similar loads were also observed in the hours of 2:00–5:00 a.m. due to the power consumption of fridge, router and standby devices. Presented results were affected by a higher value of energy consumed during the weekdays for the analyzed building than for the average in Poland (by 30%).
In the analyzed building, electricity consumption in 2018 amounted to 5590 kWh, which places the house in 5% of households with the highest energy consumption in Poland (Figure 5) [1]. However, when analyzing the number of inhabitants living in the house (average annual: 4.5 people) taking into account the average electricity consumption per resident of rural areas in 2018, which is 1088 kWh/year, the analyzed building is close to the average. Similarly, the building is located in terms of natural gas consumption, also in the highest group—Figure 6, but in this case it is also influenced by the fact that 21.8% of rural households in Poland in 2018 consumed natural gas and only 1.7% was equipped with a single-function gas boiler (as in the case of analyzed building). Generally, natural gas was used in 55.7% of households in Poland, but more than half of the recipients (51.9%) used it only for cooking meals (often with access to heat network), of which 14.0% for apartments heating.

3. Methods and Assumptions

Assessment of the economic potential for using natural gas mCHP technology in households in Poland, required the construction of a stochastic model of energy balance and cash flow for a hypothetical household. Data on households were generated by the Monte Carlo method from probability density distributions prepared on the basis of an analysis of the national structure of households. Based on the generated values, the energy balance and cash flow values for hypothetical 134,325 households were calculated. This is a sample (1%) from the population of 13.432 million households in Poland (whole population WP).
The model adopts two alternative variants of equipping the hypothetical household with an energy source. The first variant assumes that a traditional gas-fired boiler will be installed in the facility. It will be used to generate heat (heating and domestic hot water DHW preparation). All electricity will be taken from the power grid. The second option assumes that the heat demand will be entirely met by the mCHP boiler and the electricity generated in the boiler will satisfy all or part of the building’s electricity demand. Electricity deficits will be satisfied from the power grid.
The following technical parameters characterizing the household were adopted for the analysis:
  • Access to the gas network and district heating is described by binomial distribution. It was assumed that the assembly of mCHP is possible only in the case of objects that are connected to the gas network (55.74% of the population of single-family houses in Poland). Access to the gas network in each voivodeship is described by a different binomial distribution built based on the data presented in Table 2. At the same time, it was assumed that in the case of buildings connected to the municipal heating network (40.11% of the population of single-family houses in Poland), the assembly of mCHP is not justified.
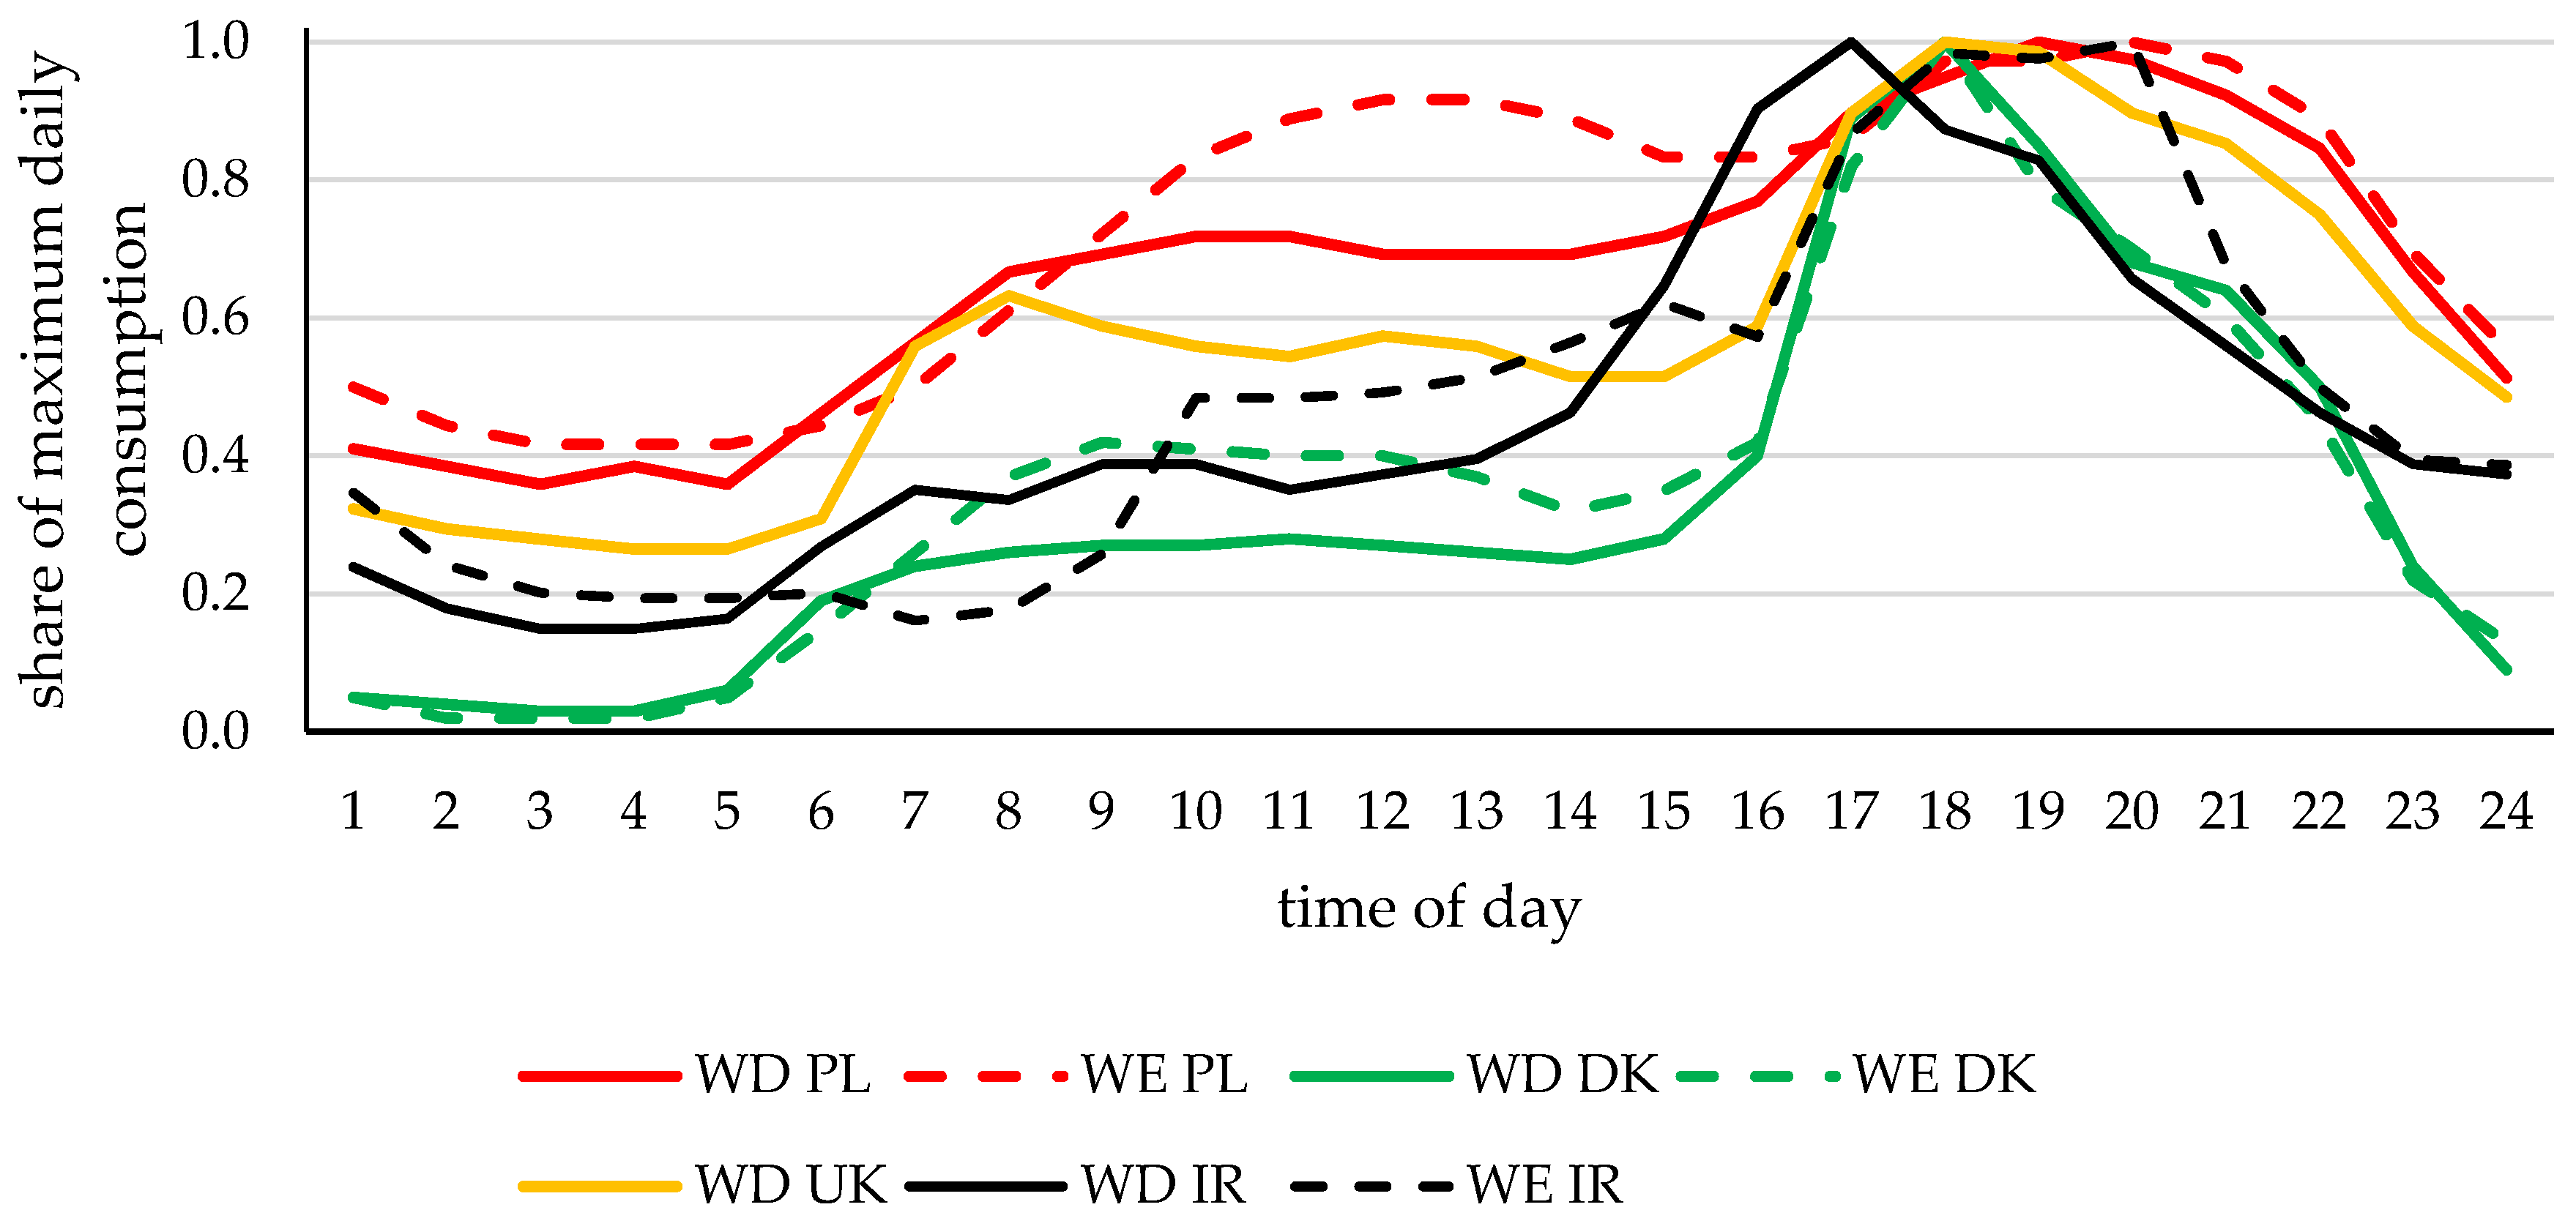
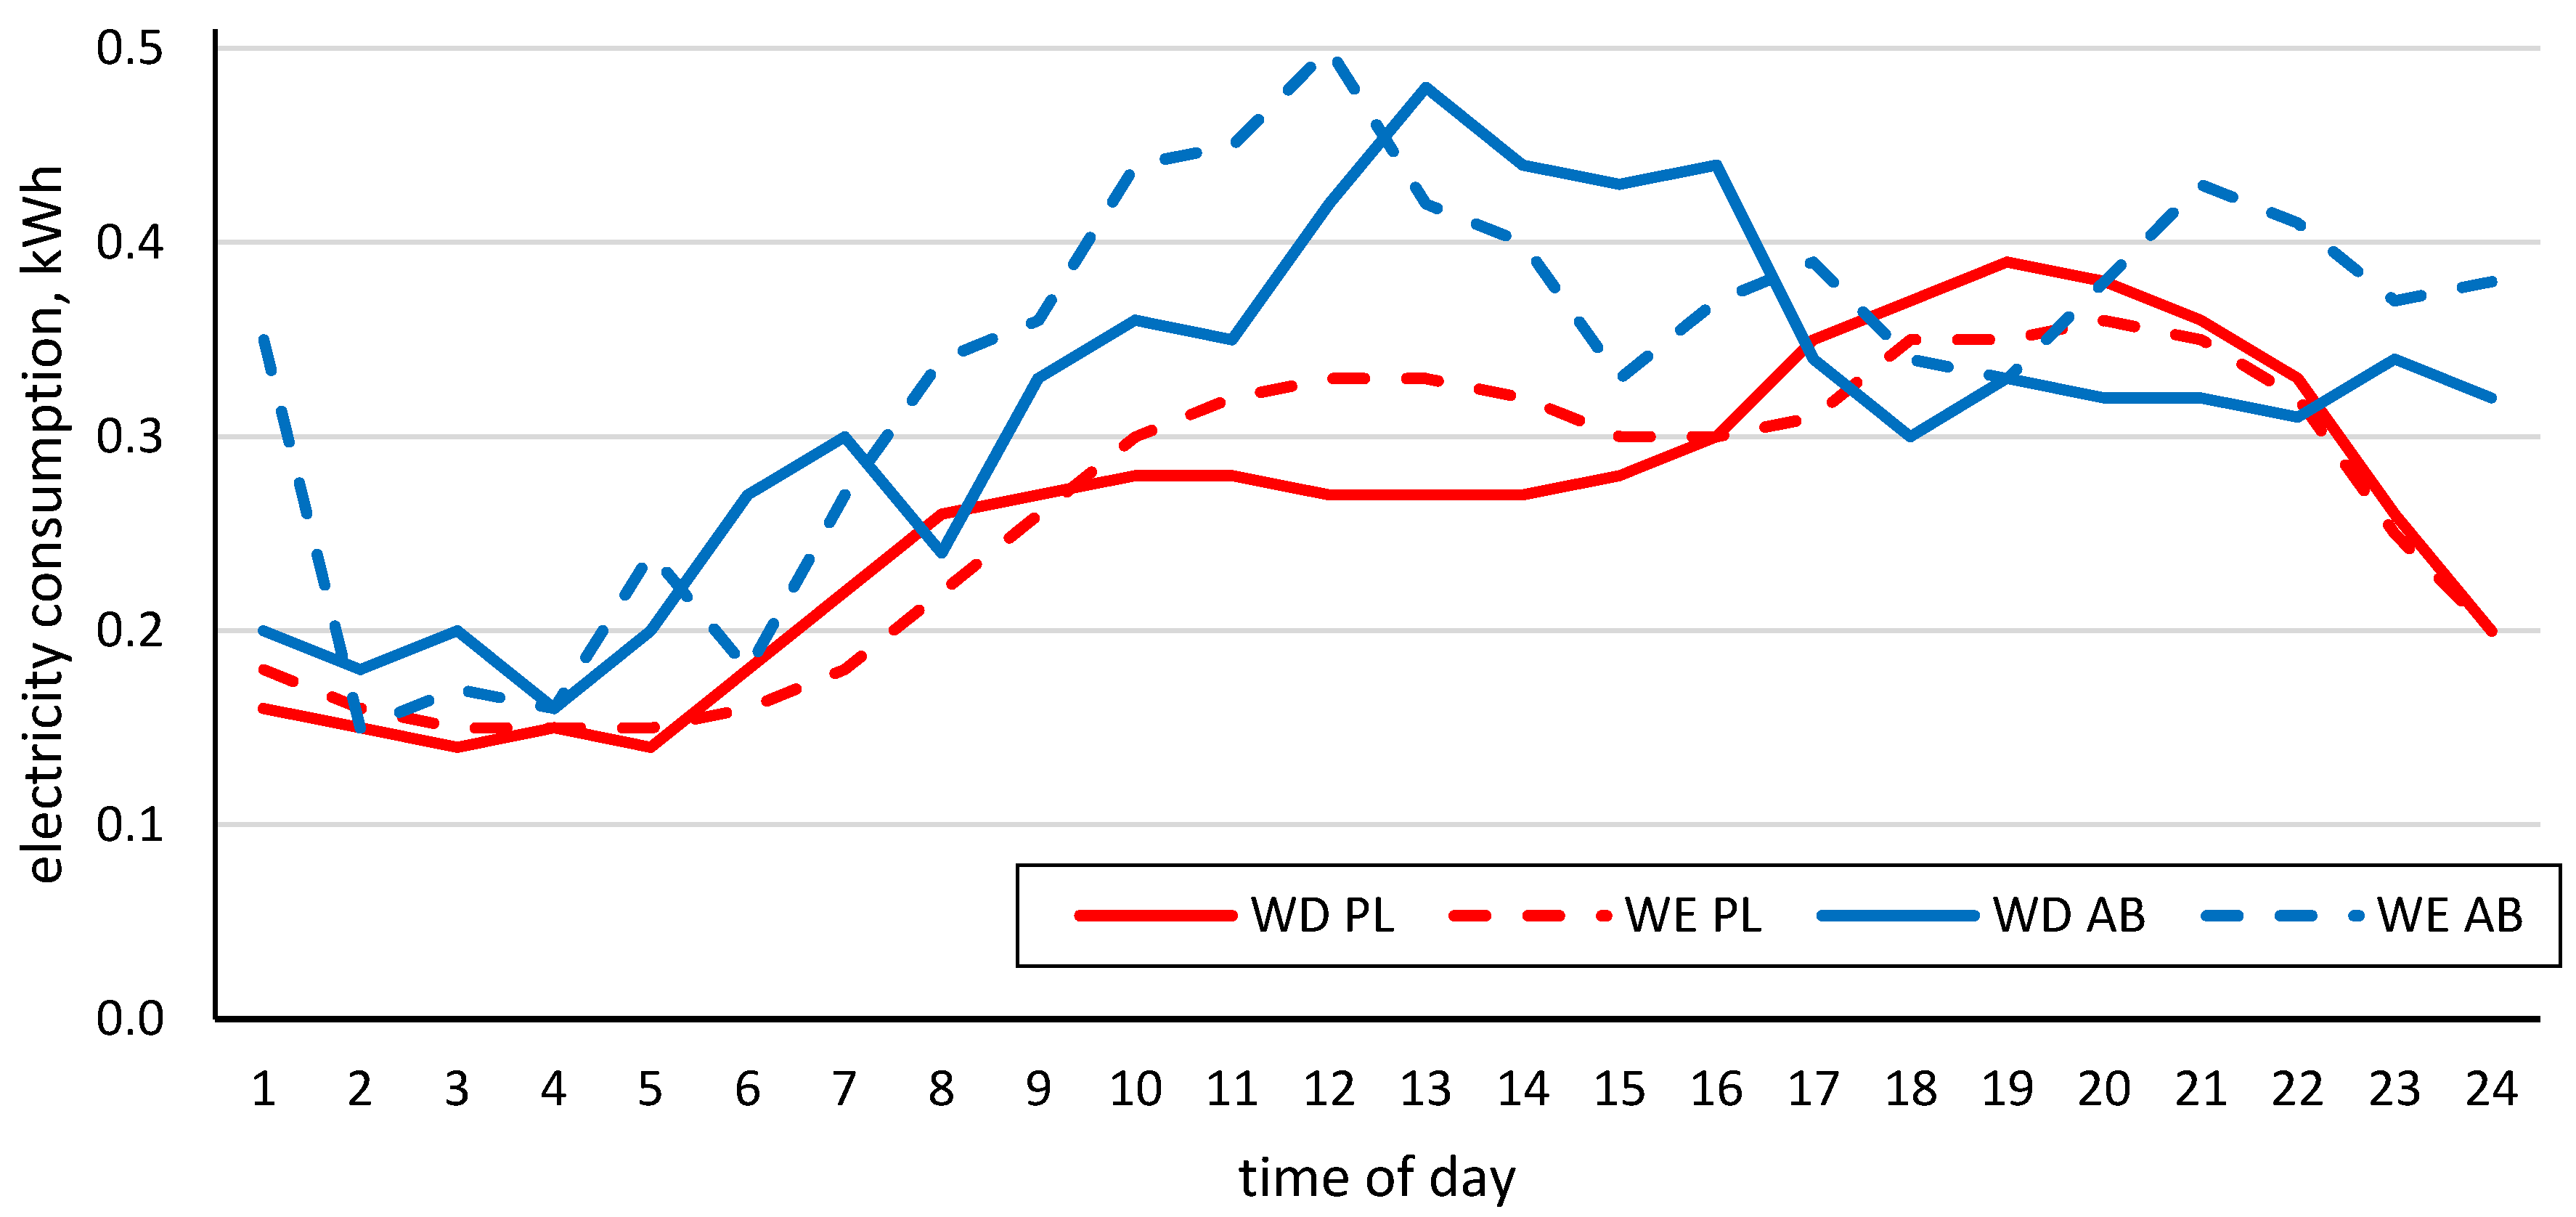
  • Two daily electricity demand profiles (Figure 8) at an hourly interval: one for weekdays and the other for non-working days (weekends and holidays). It was assumed that the ratio of working days to non-working days is 5:2.
  • Annual electricity demand (kWh/year) in individual voivodships is described by a lognormal probability density distribution with parameters location = 0, mean according to the data from Table 2, standard deviation = 1,467.47 kWh/year. The distribution was built on the basis of CSO data [1].
  • The annual heat demand for hot water preparation (kWh/year) was calculated as the product of the annual heat demand for DHW preparation per person (kWh/year/person) and the number of people in the household. Annual heat demand for DHW preparation per person is described by a rectangular (uniform) probability density distribution with a minimum value of 900 kWh/year/person and a maximum value of 1100 kWh/year/person. The number of persons in a household was modeled by discrete polynomial probability distributions (prepared based on data in Table 3 and Table 4) describing the structure of households in terms of the number of persons. The drawn values of people in the household were used to calculate the demand for heat for the preparation of domestic hot water in a hypothetical household. It is assumed that the distribution of domestic hot water is uniform throughout the year. The annual demand for heating a single-family house was calculated as the ratio of the individual heating demand (kWh/(m2·year)) and the area of household (m2). The individual heating demand was described by the Weibull distribution with the parameters of location = 0, scale = 140.24 and shape = 1.456. The distribution was prepared based on data published by the Central Statistical Office (CSO) [1] and concerning the individual demand for natural gas for household heating (kWh/(m2·year)). The structure of the single-family houses area in Poland was described by a continuous probability distribution prepared on the basis of data (Table 4) published by the portal Oferteo [64] and CSO data from the census carried out in 2011 [65].
  • The annual heat demand for heating household was divided into individual months of the year based on the number of heating degree days in individual months [66].
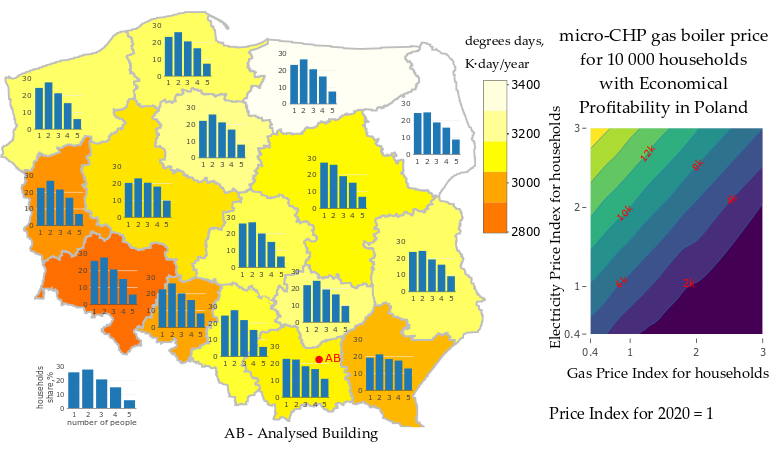
  • The number of degree days for individual months depends on the geographical location of the building. Poland was divided into 16 geographical locations. The division was consistent with the administrative division into voivodeships (the highest-level administrative subdivision of Poland). Degree days of heating were presented for the capital of each voivodeship on Figure 4. The location of the building was assigned in the process of drawing from the probability density distribution prepared based on the population of people living in individual Polish voivodeships. The source of the data have was CSO [67].
Other assumptions made:
  • Euro price was 4.5 PLN (polish zloty);
  • The share of households living in multi-family buildings in the total number of households was 55.3%, while in single-family housed in terraced, semi-detached or detached housed was 44.7%;
  • All buildings were connected to the power grid;
  • The base price of gas was 0.0489 euro/kWh (GP) [1];
  • The base price of electricity including transmission was 0.133 euro/kWh (EP) [1];
  • The base price of gas and the base price of electricity were changed depending on the dependencies adopted in Chapter 4 (EPI, GPI). In addition, in Poland, changes in energy prices for households depend on market price fluctuations over at least six-month periods;
  • The fixed distribution fee was 1.78 euros/month;
  • The producer coefficient was 0.8. The possibility of using the Prosumer program was assumed [68];
  • The cost of buying and installing a traditional gas-fired boiler was 1555.56 euros;
  • Other costs of installing the boiler or mCHP were considered the same;
  • Possible correlations between variables had not been taken into account;
  • The cost of servicing a natural gas boiler was on average 22.22 euros/year;
  • The costs of operating a micro-CHP boiler were on average 44.44 euros/year;
  • The economic efficiency calculation was performed on a monthly basis for the entire life cycle of micro-CHP boilers and gas-fired boilers, which was the same for both technologies for 15 years;
  • The micro-CHP boiler had two burners: main with nominal power equal to 5.3 kW and peak one with 20 kW;
  • Operation of the peak burner was only possible with simultaneous operation of the basic burner with full nominal power;
  • The electricity generator in the micro-CHP boiler had a nominal power of 1 kW;
  • The actual power of the electricity generator depends on the actual power of the main burner, which depends on the heat demand at the moment;
The efficiency of the micro-CHP boiler is constant regardless of the load level.
The sum of heat demand for hot water preparation and heat for heating was the basis for calculating the amount of electricity generated in the micro-CHP boiler. On the basis of the electricity demand profile, the amount of electricity overproduction was determined, which cannot be consumed and is transferred to the power grid. In case when the demand for electricity is greater than the energy production in the micro-CHP boiler, electricity is taken from the power grid. The amount of electricity collected and returned to the power grid is balanced on an annual basis and the electricity fee is calculated for electricity resulting from the balance sheet. In case when the amount of energy returned to the power grid per annum is higher than that taken from the grid, the user will not receive remuneration.
The expected price of the micro-CHP boiler is calculated on the basis of a comparison of the total costs incurred by the household for 15 years (and it includes: purchase and installation of the boiler, maintenance and service costs, fuel costs, costs of power grid use). The expected price of the micro-CHP boiler corresponds to the price at which the sum of cash flows for both analyzed variants for a hypothetical household would be equal.
The energy balance and cash flow model were made in Microsoft Excel and the Monte Carlo simulation was performed with the support of the software Oracle Crystal Ball.
As part of the research, an analysis was also carried out for a real single-family house—Analysed Building (AB) located in the Lesser Poland voivodship. The electricity demand in the building (Figure 5) equal to 5720 kWh/year was calculated based on the measured electricity consumption in the building (Figure 8). The heat demand for domestic hot water preparation in the building was 3650 kWh/year and on average 14,350 kWh/year heat was used for heating. Value estimated on the basis of measured gas consumption (Figure 6). A 26 kW gas boiler is available in the building, the price of which is estimated at 1460 euros.

4. Results and Discussion

The generated data for 134,325 hypothetical households were used to calculate the demand for electricity, heat for heating and domestic hot water preparation in Polish households. The calculated values were compared with statistical data provided by the Central Statistical Office [1,69]. The results of the comparison are shown in Table 5.
Comparison of the results indicates that the differences between the actual results and the data from the simulation are at the level of statistical error and thus can be considered as representative for the household population in Poland.
The results in the form of map charts for constant or variable values Electricity Price Index (EPI) and Gas Price Index (GPI). EPI and GPI were determined on the basis of the following relationships:
EPI = AEP/EP
where:
AEP—assumed average electricity price for the next 15 years, euros/kWh.
EP—base price of electricity including transfer, euros/kWh.
GPI = AGP/GP
where:
AGP—assumed average natural gas price for the next 15 years, euros/kWh.
GP—the base gas price, euros/kWh.
Calculations based on variable values of Electricity to Gas Price Ratio, are known in the literature, but it is difficult to refer them to the price of the boiler.

4.1. Results for Analyzed Building

Figure 9 shows the price at which mCHP becomes profitable for the analyzed building, determined for different EPI and GPI values. With fixed electricity and natural gas prices, mCHP becomes profitable when it costs 3700 euros. A two-fold increase of the electricity price with a constant price of gas means that the solution becomes profitable at a price of 7000 euros.

4.2. Effect of Model Reduction

For the whole country, the results are presented in the form of the share of households for which the profitability of purchasing a cogeneration boiler is at least equal to buying a gas boiler (without cogeneration) and purchasing electricity from the grid for 15 years. The obtained results are influenced by the fact that only 30% of households are single-family houses with access to the gas network.
Due to the fact that the calculations were carried out for a sample of the population, the influence of the size of this calculation sample on the results in the form of the population size for which mCHP will be profitable depending on the mCHP price was checked. The calculations were carried out for the following variants: 0.1%, 0.2%, 0.5%, 1.0% and 2.0% of households in Poland. Results as a comparison of households share for variants EPI = 1.0 and GPI = 1.0 and the abovementioned population sizes are shown in Figure 10. A similar analysis (impact of model size on simulation results) was performed by Mavrotas et al. [70]. The main purpose of this work was to analyze the use of cogeneration for the hospital using Monte Carlo simulations (uncertain parameters).
In the calculations carried out in this study, a sample of 1.0% of the population was considered, because, as shown in Figure 10, increasing the number to 2% has no effect on the results.

4.3. Results for Households in Poland

Households share (share of households for which economic profitability was achieved) for variable GPI values (from 0.4 to 3.0) and constant EPI values are shown in the following figures: Figure 11a, Figure 12a, Figure 13a and Figure 14a. Households share for variable EPI values (from 0.4 to 3.0) and constant GPI values are shown in the following figures: Figure 11b, Figure 12b, Figure 13b and Figure 14b.
Clearly for EPI = 3.0, GPI = 0.4 and mCHP price 2000 euros households share is the highest (27%), but this price situation is unlikely (especially for a combination of these three values). At 9000 euros (half of the current mCHP price) households share is 4%. With GPI = 3.0 and EPI < 2.0, even with mCHP price = 2000 euros, there is no household in Poland (connected to gas and electricity) for which such a solution would be economically viable.
For two EPI values (1.0 and 3.0) the data are presented below in the form of a graph with the log “Households share” scale and variable GPI values—Figure 15.
The above graphs show that only for cases EPI = 3.0 and GPI = 0.4 a cogeneration boiler at the current price of 18,000 euros would be profitable for 0.04% of households (approx. 5200) and in the case of EPI = 3.0 and GPI = 0.8 it is only 0.0008% of households (approx. 100) in Poland. Hence, it can be assumed that a change in the relation of energy carrier prices in the assumed range will not increase popularity. Therefore, it was determined for what mCHP boiler price it will be 10,000 (Figure 16a) and 100,000 (Figure 16b) households for which it will be a profitable solution.
With current electricity and gas prices (EPI = 1.0 and GPI = 1.0), lowering the mCHP price to euros 4800 will result in economic profitability for 10,000 households (with access to the gas network) in Poland. In turn, reducing the mCHP price to euros 4100 will result in economic profitability for a group of 100,000 households (hereinafter referred to as “selected group”—SG100k). EPI = 2.0 at GPI = 1.4 will cause similar economic effects at prices of 8100 and 6400 euros, respectively.
For SG100k (for EPI = 1.0 and GPI = 1.0), the demand for heat (heating + domestic hot water) and electricity in normalized histogram and the amount of produced electricity are shown in Figure 17. Overproduced electricity is the amount of energy produced by the cogeneration boiler, but not consumed on a regular basis, but stored in the network according to the net-metering assumptions (Prosument program [68,71]).
The energy production limit results from the number of hours per year (8760) and the boiler’s electrical capacity (1 kWe). Approximately 8.2% of households with SG100k did not show overproduction of electricity from a cogeneration boiler.
SG100k comparing to the entire population—cumulative histogram for electricity demand and for heat energy demand—Figure 18.
It is obvious that in the first-place economic profitability will be achieved (with a drop in mCHP price) for households with a much higher than average energy demand (electricity and heat) in the population of households. Electricity demand in selected households (for SG100k) above 5000 kWh/year was recorded for 60% of households. In the whole population of Poland, 4% of households has the demand higher than 5000 kWh/year.

5. Conclusions

There are currently over 13 million households in Poland. Among these households, 100% have access to electricity, and most of them are heated using fossil fuels (including district heating). Micro-cogeneration in households in Poland is currently unused mainly due to high purchase prices and limited purchase access (producers withdrew from the market: De Dietrich and Viessmann and there are no legal solutions for the electricity production through mCHP). Among the reasons for the lack of interest should also be mentioned that the vast majority of households in Poland are characterized by low demand for electricity—about 1500–2500 kWh per year. In addition, mCHP devices are not yet widely known and popular and trusted technology in Poland.
The study examined under what conditions mCHP will become profitable compared to a gas boiler and purchase of electricity from the power grid. The results of the analysis were influenced by the fact that around 27% of all households in Poland had access to the gas network while not having access to the heating network.
For mCHP to become economically profitable for a group of at least 10,000 households, its price should fall from around 18,000 euros (711.5 euros/kWth and 18,000 euros/kWe) to 4800 euros (189.7 euros/kWth and 4800 euros/kWe) and for 100,000 households to 4100 euros (162.1 euros/kWth and 4100 euros/kWe). These calculations were made at constant gas and electricity prices. The analysis also included cases of various changes in gas and energy prices. Faster growth of electricity prices than gas prices reduce the profitability barrier.
Calculations were made for a sample of 1% of households with different demand for electricity and heat (related to the size of the apartment, external conditions of degree days, number of inhabitants, etc.). An analysis has also been carried out showing that increasing the sample to 2% would not have a significant effect on the results.
The case of a single-family house from the Lesser Poland voivodeship, characterized by a much higher energy demand than the average value for households in Poland, was also analyzed. Micro-CHP becomes profitable at a price of euros 3700 (146.2 euros/kWth and 3700 euros/kWe) with unchanged prices of electricity and natural gas.
Micro-cogeneration is a technology with not very favorable potential due to the price. As a result of the analysis, it was pointed out that in order for it to be disseminated (even on a scale of 0.1% of the household population in Poland), changes to increase its availability are necessary. The results give an image of what subsidies should be introduced from the point of view of the country (guided by considerations of environmentally friendly solution, etc.) or producers (the effect of the scale of the sales market) to promote micro-cogeneration in Poland.

Author Contributions

Conceptualization, D.M.; data curation, P.O.; formal analysis, D.K. and D.M.; investigation, M.K.; methodology, D.K. and D.M.; project administration, M.K. and P.O.; software, D.M.; supervision, D.K. and P.O.; validation, D.K.; visualization, P.O.; writing—original draft, M.K. and D.M.; writing—review & editing, P.O. All authors have read and agreed to the published version of the manuscript.

Funding

This work was supported by AGH—University of Science and Technology number 16.16.210.476.

Conflicts of Interest

The authors declare no conflicts of interest.

Abbreviations

ABAnalyzed building
AEPAssumed average electricity price for the next 15 years, euros/kWh
AGPAssumed average natural gas price for the next 15 years, euros/kWh
CHPCombined heat and power
CSOCentral statistical office
dd15Degree-day values, K·day/year
DHWDomestic hot water
eelectricity
EPBase price of electricity including transfer, euros/kWh
EPIElectricity price index
G11Electricity price tariff in Poland
GHGGreenhouse gases
GPBase gas price, euros/kWh
GPIGas price index
ICEInternal combustion engine
mCHPMicro-combined heat and power
ORCOrganic Rankine cycle
PCMPhase change material
PV/TSolar photovoltaic hybrid technologies
SEStirling engine
SG100kSelected group for 100,000 households, EPI = 1.0 and GPI = 1.0
shpPercentage share of the number of households in the voivodship in relation to the total for the whole country (Poland)
ththermal
WDWeekday
WEWeekend day
WPWhole population of households in Poland

References

  1. Central Statistical Office. Energy Consumption in Households in 2018; Central Statistical Office of Poland: Warsaw, Poland, 2019.
  2. IoEP-NRI. Inventory of Greenhouse Gases in Poland for 1988–2017; The National Centre for Emissions Management: Warsaw, Poland, 2019. [Google Scholar]
  3. Green Economy Indicators in Poland 2019. Available online: https://stat.gov.pl/en/topics/environment-energy/environment/green-economy-indicators-in-poland-2019,3,3.html (accessed on 8 April 2020).
  4. Böckl, B.; Greiml, M.; Leitner, L.; Pichler, P.; Kriechbaum, L.; Kienberger, T. HyFloW—A hybrid load flow-modelling framework to evaluate the effects of energy storage and sector coupling on the electrical load flows. Energies 2019, 12, 956. [Google Scholar] [CrossRef] [Green Version]
  5. Teh, S.H.; Wiedmann, T.; Moore, S. Mixed-unit hybrid life cycle assessment applied to the recycling of construction materials. J. Econ. Struct. 2018, 7, 13. [Google Scholar] [CrossRef] [Green Version]
  6. Sornek, K.; Filipowicz, M.; Goryl, W.; Mokrzycki, E.; Mirowski, T.; Duraczyński, M. The analysis of the wind potential in selected locations in the southeastern Poland. E3S Web Conf. 2017, 14, 01014. [Google Scholar] [CrossRef] [Green Version]
  7. Pepermans, G.; Driesen, J.; Haeseldonckx, D.; Belmans, R.; D’haeseleer, W. Distributed generation: Definition, benefits and issues. Energy Policy 2005, 33, 787–798. [Google Scholar] [CrossRef]
  8. Martinez, S.; Michaux, G.; Salagnac, P.; Bouvier, J.L. Micro-combined heat and power systems (micro-CHP) based on renewable energy sources. Energy Convers. Manag. 2017, 154, 262–285. [Google Scholar] [CrossRef]
  9. Parliament, T.H.E.E.; Council, T.H.E.; The, O.F.; Union, E. Directive 2004/8/EC of the European Parliament and of the Council of 11 February 2004; European Parliament: Brussels, Belgium, 2004.
  10. Kaarsberg, T.; Fiskum, R.; Deppe, A.; Kumar, S.; Rosenfeld, A.; Romm, J. Combined heat and power for saving energy and carbon in residential buildings. Build. Ind. Trends 2000, 149, 1–13. [Google Scholar]
  11. Jung, Y.; Kim, J.; Lee, H. Multi-criteria evaluation of medium-sized residential building with micro-CHP system in South Korea. Energy Build. 2019, 193, 201–215. [Google Scholar] [CrossRef]
  12. Wajs, J.; Mikielewicz, D.; Bajor, M.; Kneba, Z. Experimental investigation of domestic micro-CHP based on the gas boiler fitted with ORC module. Arch. Thermodyn. 2016, 37, 79–93. [Google Scholar] [CrossRef]
  13. Taie, Z.; Hagen, C. Experimental thermodynamic first and second law analysis of a variable output 1–4.5 kWe, ICE-driven, natural-gas fueled micro-CHP generator. Energy Convers. Manag. 2019, 180, 292–301. [Google Scholar] [CrossRef]
  14. Thu, K.; Saha, B.B.; Chua, K.J.; Bui, T.D. Thermodynamic analysis on the part-load performance of a microturbine system for micro/mini-CHP applications. Appl. Energy 2016, 178, 600–608. [Google Scholar] [CrossRef]
  15. Qiu, S.; Gao, Y.; Rinker, G.; Yanaga, K. Development of an advanced free-piston Stirling engine for micro combined heating and power application. Appl. Energy 2019, 235, 987–1000. [Google Scholar] [CrossRef]
  16. Cardozo, E.; Erlich, C.; Malmquist, A.; Alejo, L. Integration of a wood pellet burner and a Stirling engine to produce residential heat and power. Appl. Therm. Eng. 2014, 73, 671–680. [Google Scholar] [CrossRef]
  17. Antonelli, M.; Francesconi, M.; Baccioli, A.; Caposciutti, G. Experimental Results of a Wankel-type Expander Fuelled by Compressed Air and Saturated Steam. Energy Procedia 2017, 105, 2929–2934. [Google Scholar] [CrossRef]
  18. Staffell, I. Zero carbon infinite COP heat from fuel cell CHP. Appl. Energy 2015, 147, 373–385. [Google Scholar] [CrossRef]
  19. Bahlawan, H.; Poganietz, W.R.; Spina, P.R.; Venturini, M. Cradle-to-gate life cycle assessment of energy systems for residential applications by accounting for scaling effects. Appl. Therm. Eng. 2020, 171, 115062. [Google Scholar] [CrossRef]
  20. Calise, F.; Figaj, R.D.; Vanoli, L. Energy performance of a low-cost PhotoVoltaic/Thermal (PVT) collector with and without thermal insulation. IOP Conf. Ser. Earth Environ. Sci. 2019, 214, 012116. [Google Scholar] [CrossRef]
  21. Algieri, A.; Morrone, P. Energetic analysis of biomass-fired ORC systems for micro-scale combined heat and power (CHP) generation. A possible application to the Italian residential sector. Appl. Therm. Eng. 2014, 71, 751–759. [Google Scholar] [CrossRef]
  22. Kharseh, M.; Al-Khawaja, M.; Hassani, F. Optimal utilization of geothermal heat from abandoned oil wells for power generation. Appl. Therm. Eng. 2019, 153, 536–542. [Google Scholar] [CrossRef]
  23. Cioccolanti, L.; Tascioni, R.; Arteconi, A. Simulation analysis of an innovative micro-solar 2kWe Organic Rankine Cycle plant for residential applications. Energy Procedia 2017, 142, 1629–1634. [Google Scholar] [CrossRef]
  24. Obi, J.B. State of art on ORC applications for waste heat recovery and micro-cogeneration for installations up to 100kWe. Energy Procedia 2015, 82, 994–1001. [Google Scholar] [CrossRef] [Green Version]
  25. Linke, P.; Papadopoulos, A.I.; Seferlis, P. Systematic methods for working fluid selection and the design, integration and control of organic Rankine cycles—A review. Energies 2015, 8, 4755–4801. [Google Scholar] [CrossRef]
  26. Zheng, C.Y.; Wu, J.Y.; Zhai, X.Q.; Yang, G.; Wang, R.Z. Experimental and modeling investigation of an ICE (internal combustion engine) based micro-cogeneration device considering overheat protection controls. Energy 2016, 101, 447–461. [Google Scholar] [CrossRef] [Green Version]
  27. Moriconi, N.; Laranci, P.; D’Amico, M.; Bartocci, P.; D’Alessandro, B.; Cinti, G.; Baldinelli, A.; Discepoli, G.; Bidini, G.; Desideri, U.; et al. Design and preliminary operation of a gasification plant for micro-CHP with internal combustion engine and SOFC. Energy Procedia 2015, 81, 298–308. [Google Scholar] [CrossRef]
  28. De Santoli, L.; Lo Basso, G.; Albo, A.; Bruschi, D.; Nastasi, B. Single cylinder internal combustion engine fuelled with H2NG operating as micro-CHP for residential use: Preliminary experimental analysis on energy performances and numerical simulations for LCOE assessment. Energy Procedia 2015, 81, 1077–1089. [Google Scholar] [CrossRef] [Green Version]
  29. Pilavachi, P.A. Mini- and micro-gas turbines for combined heat and power. Appl. Therm. Eng. 2002, 22, 2003–2014. [Google Scholar] [CrossRef]
  30. Harrison, J.; On, E. Stirling engine systems for small and micro combined heat and power (CHP) applications. In Small and Micro Combined Heat and Power (CHP) Systems: Advanced Design, Performance, Materials and Applications; Woodhead Publishing: Witney, UK, 2011; pp. 179–205. ISBN 9781845697952. [Google Scholar]
  31. Scarpete, D.; Uzuneanu, K.; Badea, N. Stirling engine in residential systems based on renewable energy. In Proceedings of the 4th WSEAS International Conference on Energy Planning, Energy Saving, Environmental Education, EPESE’10, 4th WSEAS International Conference on Renewable Energy Sources, RES ’10, Kantaoui, Sousse, Tunisia, 3 May 2010; pp. 124–129. [Google Scholar]
  32. Moghadam, R.S.; Sayyaadi, H.; Hosseinzade, H. Sizing a solar dish Stirling micro-CHP system for residential application in diverse climatic conditions based on 3E analysis. Energy Convers. Manag. 2013, 75, 348–365. [Google Scholar] [CrossRef]
  33. Hawkes, A.; Staffell, I.; Brett, D.; Brandon, N. Fuel cells for micro-combined heat and power generation. Energy Environ. Sci. 2009, 2, 729–744. [Google Scholar] [CrossRef]
  34. Barbieri, E.S.; Spina, P.R.; Venturini, M. Analysis of innovative micro-CHP systems to meet household energy demands. Appl. Energy 2012, 97, 723–733. [Google Scholar] [CrossRef]
  35. Arteconi, A.; Del Zotto, L.; Tascioni, R.; Cioccolanti, L. Modelling system integration of a micro solar Organic Rankine Cycle plant into a residential building. Appl. Energy 2019, 251, 113408. [Google Scholar] [CrossRef]
  36. Bianchi, M.; De Pascale, A.; Spina, P.R. Guidelines for residential micro-CHP systems design. Appl. Energy 2012, 97, 673–685. [Google Scholar] [CrossRef]
  37. Ito, H. Economic and environmental assessment of residential micro combined heat and power system application in Japan. Int. J. Hydrog. Energy 2016, 41, 15111–15123. [Google Scholar] [CrossRef]
  38. Streimikiene, D.; Baležentis, T. Multi-criteria assessment of small scale CHP technologies in buildings. Renew. Sustain. Energy Rev. 2013, 26, 183–189. [Google Scholar] [CrossRef]
  39. Ren, H.; Gao, W. Economic and environmental evaluation of micro CHP systems with different operating modes for residential buildings in Japan. Energy Build. 2010, 42, 853–861. [Google Scholar] [CrossRef]
  40. Lee, H.; Bush, J.; Hwang, Y.; Radermacher, R. Modeling of micro-CHP (combined heat and power) unit and evaluation of system performance in building application in United States. Energy 2013, 58, 364–375. [Google Scholar] [CrossRef]
  41. Entchev, E.; Gusdorf, J.; Swinton, M.; Bell, M.; Szadkowski, F.; Kalbfleisch, W.; Marchand, R. Micro-generation technology assessment for housing technology. Energy Build. 2004, 36, 925–931. [Google Scholar] [CrossRef]
  42. Romero Rodríguez, L.; Salmerón Lissén, J.M.; Sánchez Ramos, J.; Rodríguez Jara, E.Á.; Álvarez Domínguez, S. Analysis of the economic feasibility and reduction of a building’s energy consumption and emissions when integrating hybrid solar thermal/PV/micro-CHP systems. Appl. Energy 2016, 165, 828–838. [Google Scholar] [CrossRef]
  43. Kim, J.; Cho, W.; Lee, K.S. Optimum generation capacities of micro combined heat and power systems in apartment complexes with varying numbers of apartment units. Energy 2010, 35, 5121–5131. [Google Scholar] [CrossRef]
  44. Spitalny, L.; Myrzik, J.M.A.; Mehlhorn, T. Estimation of the economic addressable market of micro-CHP and heat pumps based on the status of the residential building sector in Germany. Appl. Therm. Eng. 2014, 71, 838–846. [Google Scholar] [CrossRef]
  45. Caliano, M.; Bianco, N.; Graditi, G.; Mongibello, L. Economic optimization of a residential micro-CHP system considering different operation strategies. Appl. Therm. Eng. 2016, 101, 592–600. [Google Scholar] [CrossRef]
  46. Dentice d’Accadia, M.; Sasso, M.; Sibilio, S.; Vanoli, L. Micro-combined heat and power in residential and light commercial applications. Appl. Therm. Eng. 2003, 23, 1247–1259. [Google Scholar] [CrossRef]
  47. De Paepe, M.; D’Herdt, P.; Mertens, D. Micro-CHP systems for residential applications. Energy Convers. Manag. 2006, 47, 3435–3446. [Google Scholar] [CrossRef]
  48. Hawkes, A.D.; Leach, M.A. Cost-effective operating strategy for residential micro-combined heat and power. Energy 2007, 32, 711–723. [Google Scholar] [CrossRef]
  49. Orzechowska, M.; Kryzia, D. Estimation of the future demand for natural gas in road transport in Poland. In Proceedings of the 5th International Youth Conference on Energy (IYCE), Pisa, Italy, 27–30 May 2015; pp. 1–5. [Google Scholar]
  50. Kryzia, D.; Pepłowska, M. The impact of measures aimed at reducing low-stack emission in Poland on the energy efficiency and household emission of pollutants. Polityka Energetyczna—Energy Policy J. 2019, 22, 121–132. [Google Scholar] [CrossRef]
  51. Jeleński, T.; Dendys, M.; Tomaszewska, B.; Pająk, L. The Potential of RES in the Reduction of Air Pollution: The SWOT Analysis of Smart Energy Management Solutions for Krakow Functional Area (KrOF). Energies 2020, 13, 1754. [Google Scholar] [CrossRef] [Green Version]
  52. Momen, M.; Shirinbakhsh, M.; Baniassadi, A.; Behbahani-Nia, A. Application of Monte Carlo method in economic optimization of cogeneration systems - Case study of the CGAM system. Appl. Therm. Eng. 2016, 104, 34–41. [Google Scholar] [CrossRef]
  53. Westner, G.; Madlener, R. The benefit of regional diversification of cogeneration investments in Europe: A mean-variance portfolio analysis. Energy Policy 2010, 38, 7911–7920. [Google Scholar] [CrossRef]
  54. Carpaneto, E.; Chicco, G.; Mancarella, P.; Russo, A. Cogeneration planning under uncertainty. Part I: Multiple time frame approach. Appl. Energy 2011, 88, 1059–1067. [Google Scholar] [CrossRef]
  55. Siler-Evans, K.; Morgan, M.G.; Azevedo, I.L. Distributed cogeneration for commercial buildings: Can we make the economics work? Energy Policy 2012, 42, 580–590. [Google Scholar] [CrossRef]
  56. Marquez, A.C.; Heguedas, A.S.; Iung, B. Monte Carlo-based assessment of system availability. A case study for cogeneration plants. Reliab. Eng. Syst. Saf. 2005, 88, 273–289. [Google Scholar] [CrossRef]
  57. McLoughlin, F.; Duffy, A.; Conlon, M. A clustering approach to domestic electricity load profile characterisation using smart metering data. Appl. Energy 2015, 141, 190–199. [Google Scholar] [CrossRef] [Green Version]
  58. Foteinaki, K.; Li, R.; Rode, C.; Andersen, R.K. Modelling household electricity load profiles based on Danish time-use survey data. Energy Build. 2019, 202, 109355. [Google Scholar] [CrossRef]
  59. Ramírez-Mendiola, J.L.; Grünewald, P.; Eyre, N. The diversity of residential electricity demand—A comparative analysis of metered and simulated data. Energy Build. 2017, 151, 121–131. [Google Scholar] [CrossRef]
  60. Nafkha, R.; Woźniakowski, T. Households Electricity Usage Analysis and the Effectiveness of Changing Tariff Group. Inf. Syst. Manag. 2018, 7, 171–179. [Google Scholar] [CrossRef]
  61. Mirowski, T.; Pepłowska, M. Simulation Analysis of Electricity Consumption for the Final Consumer with the Use of Smart Metering. Energy Policy J. 2016, 2, 81–91. [Google Scholar]
  62. Olczak, P.; Zabagło, J.; Kandefer, S.; Dziedzic, J. Influence of Solar Installation with Flat-Plate Collectors in a Detached House on Pollutants Emission and Waste Stream. In Between Evolution and Revolution—In Search of an Energy Strategy; WAT: Poznań, Poland, 2015; pp. 739–752. [Google Scholar]
  63. Viessmann VITOTWIN 350-F VITOTWIN 300-W. Available online: http://www.viessmann.pl/content/dam/vi-brands/PL/PDF/KP/Kogeneracja/KP-Vitotwin_350-F_i_300-W_2015_08.pdf/_jcr_content/renditions/original.media_file.download_attachment.file/KP-Vitotwin_350-F_i_300-W_2015_08.pdf (accessed on 20 April 2020).
  64. Alebank.pl House Construction Report: How Large is the Average Single-Family Home? Available online: https://alebank.pl/raport-o-budowie-domow-jaka-powierzchnie-ma-przecietna-nieruchomosc/ (accessed on 8 April 2020).
  65. Central Statistical Office. National Census; Central Statistical Office of Poland: Warsaw, Poland, 2014.
  66. Ministry of Development Typical Reference Year. Available online: https://www.gov.pl/web/fundusze-regiony/dane-do-obliczen-energetycznych-budynkow (accessed on 18 December 2019).
  67. Central Statistical Office Area and Population in the Territorial Proöle in 2019. Available online: https://stat.gov.pl/obszary-tematyczne/ludnosc/ludnosc/powierzchnia-i-ludnosc-w-przekroju-terytorialnym-w-2019-roku,7,16.html (accessed on 8 April 2020).
  68. Kuchmacz, J.; Mika, Ł. Description of development of prosumer energy sector in Poland. Polityka Energetyczna 2018, 21, 5–20. [Google Scholar] [CrossRef]
  69. Central Statistical Office. Municipal Infrastructure in 2016; Central Statistical Office of Poland: Warsaw, Poland, 2017.
  70. Mavrotas, G.; Florios, K.; Vlachou, D. Energy planning of a hospital using Mathematical Programming and Monte Carlo simulation for dealing with uncertainty in the economic parameters. Energy Convers. Manag. 2010, 51, 722–731. [Google Scholar] [CrossRef]
  71. Mirowski, T.; Sornek, K. Potential of prosumer power engineering in Poland by example of micro PV installation in private construction. Energy Policy J. 2015, 18, 73–84. [Google Scholar]
Figure 1. Comparison of energy flow in building without/with combined heating and power. Source: based on [11].
Energies 13 03140 g001
Figure 2. Structure of households energy consumption per inhabitant by various energy commodities in the EU-28 and in the Poland in 2017. Source: own study based on [1].
Energies 13 03140 g002
Figure 3. Average daily electricity load profile normalized on the individual maximum of each load profile: WD PL—weekdays Poland; WE PL—weekend Poland; DK—Denmark; UK—United Kingdom; IR—Ireland. Source: own study based on [57,58,59,60].
Energies 13 03140 g003
Figure 4. Map of Poland with degree–day values for each voivodship (color scale: dd15, black color) and the percentage share of the number of households in the voivodship in relation to the total for the whole country (shp—blue color). The location of the analyzed building is also marked (AB).
Energies 13 03140 g004
Figure 5. Distribution of electricity consumption of households in Poland together with a comparison for the analyzed building (characteristic p. 2.2) Source: own study based on [1].
Energies 13 03140 g005
Figure 6. Distribution of natural gas consumption in households in Poland together with a comparison for the analyzed building (characteristic p. 2.2) Source: own study based on [1].
Energies 13 03140 g006
Figure 7. Average daily electricity consumption in AB in individual months of 2018 and 2019.
Energies 13 03140 g007
Figure 8. Average daily electricity load profile: WD PL—weekdays Poland, WE PL—weekend Poland, AB—analyzed building. Source: own study based on [59].
Energies 13 03140 g008
Figure 9. mCHP price, as an EPI and GPI function at which an investment in mCHP would be economically profitable for the analyzed building.
Energies 13 03140 g009
Figure 10. Share of households for which economic viability was achieved in the function of mCHP price (for EPI = 1.0 and GPI = 1.0) and depending on the sample size from the population.
Energies 13 03140 g010
Figure 11. Household share for: (a) EPI = 0.4 and different GPI; (b) GPI = 0.4 and different EPI.
Energies 13 03140 g011
Figure 12. Household share for: (a) EPI = 1.0 and different GPI; (b) GPI = 1.0 and different EPI.
Energies 13 03140 g012
Figure 13. Household share for: (a) EPI =2.0 and different GPI; (b) GPI = 2.0 and different EPI.
Energies 13 03140 g013
Figure 14. The household share for: (a) EPI =3.0 and different GPI; (b) GPI = 3.0 and different EPI.
Energies 13 03140 g014
Figure 15. The household share (log scale) for: (a) EPI = 1.0 and different GPI; (b) EPI = 3.0 and different GPI.
Energies 13 03140 g015
Figure 16. mCHP price, as an EPI and GPI function at which an investment in mCHP would be economically viable for: (a) 10,000 households; (b) 100,000 households, SG100k for EPI = 1.0 and GPI = 1.0).
Energies 13 03140 g016
Figure 17. (a) Energy demand histogram for heat and electricity for chosen group; (b) Produced and overproduced electricity histogram for chosen group. Selected group—Figure 16b for EPI = 1.0 and GPI = 1.0.
Energies 13 03140 g017
Figure 18. (a) Electricity demand cumulative histogram for whole population WP and selected group (SG100k); (b) Heat energy demand cumulative histogram for whole population WP and selected group (SG100k).
Energies 13 03140 g018
Table 1. Demand for heat and gas consumption for heating purposes in households. Source: own study based on [1].
Energy Commodity
Households Group
Unit of MeasureArithmetic AverageFirst DecileFirst QuartileMedianThird QuartileNinth Decile
Natural gas
Household using gas for space heating
kWh/m2123.5529.3350.00112.03174.60285.71
Natural gas
Household using gas only for water heating and cooking
kWh/m238.119.3817.6433.5550.1392.86
Natural gas
Household using gas only for cooking
kWh/m225.137.2010.9719.7430.7748.30
Table 2. Structure of average electricity consumption in households in individual voivodships and access to the gas network. Source: own study based on [69].
VoivodeshipElectricity Consumption, kWh/yearShare of People, %
Average per InhabitantAverage per HouseholdAccess to Gas Network
Lower Silesia758.11848.861.2
Kuyavian–Pomeranian714.52038.742.9
Lubelskie665.71810.540.7
Lubuskie730.01986.651.9
Łódzkie783.91913.839.6
Lesser Poland790.02088.262.3
Masowian859.72076.053.3
Opolskie796.32011.241.9
Podkarpackie571.41746.072.2
Podlaskie754.31896.228.3
Pomeranian744.91999.049.2
Silesian778.21911.462.2
Świętokrzyskie606.71646.436.8
Warmian–Masurian701.12062.342.6
Greater Poland764.32213.647.5
West Pomeranian691.21824.059.1
Table 3. Structure of the number of people in households in Poland. Source: own study based on [65].
VoivodeshipShare of Number of People in Households, %
12345678910
Lower Silesia25.927.920.815.15.82.51.30.400.150.04
Kuyavian–Pomeranian22.125.921.216.97.93.41.80.540.210.06
Lubelskie23.824.419.316.29.34.02.10.630.240.07
Lubuskie22.626.821.616.77.03.01.60.480.180.05
Łódzkie26.226.920.215.26.52.81.50.450.170.05
Lesser Poland22.922.518.516.811.04.72.50.750.290.08
Masowian27.326.019.215.36.93.01.60.470.180.05
Opolskie22.726.220.216.38.33.61.90.570.220.06
Podkarpackie19.421.418.617.713.05.63.00.890.340.09
Podlaskie24.625.019.015.98.83.82.00.600.230.06
Pomeranian23.426.220.716.67.43.21.70.510.200.05
Silesian24.527.721.815.95.82.51.30.400.150.04
Świętokrzyskie22.124.719.516.69.74.22.20.660.260.07
Warmian–Masurian23.326.620.716.47.43.21.70.500.190.05
Greater Poland20.523.220.618.39.94.22.30.670.260.07
West Pomeranian24.627.921.415.56.02.61.40.410.160.04
Table 4. Structure of the surface of single-family houses and apartments in multi-apartment buildings in Poland. Source: own study based on [64,69].
Area, m2Probability
fromtoflatsSingle-Family House
15300.0430
30400.122
40500.181
50600.1530.13
60800.189
801000.089
1001250.0770.23
1251500.0950.28
1502000.24
2003000.0280.09
30050000.03
Table 5. Comparison of the value of electricity and heat demand in households in Poland.
ParametersValues, TWhError, %
From Reference CSO [1]Calculated From Generated Data by the Monte Carlo method
Electricity demand29.2830.865.4
Heating demand for heating188.24181.713.5
Heat demand for DHW heating38.4837.811.8

