Article

Assessment of Green Methanol Production Potential and Related Economic and Environmental Benefits: The Case of China

1
Belt and Road Initiative Centre for Chinese-European studies, Guangdong University of Petrochemical Technology, Maoming 525000, China
2
Department of Tractors and Agricultural Machinery, Operating and Maintenance, Mykolayiv National Agrarian University, 54020 Mykolaiv, Ukraine
3
SCIRE Foundation, 00867 Warsaw, Poland
4
Division of Farms and Enterprises Economics, Lithuanian Institute of Agrarian Economics, 03220 Vilnius, Lithuania
5
Department of Economics and Finance, University of Tyumen, 625003 Tyumen, Russian
*
Authors to whom correspondence should be addressed.
Energies 2020, 13(12), 3113; https://doi.org/10.3390/en13123113
Submission received: 19 May 2020 / Revised: 2 June 2020 / Accepted: 11 June 2020 / Published: 16 June 2020

Abstract

:
Adopting a new paradigm for social development implies a transition to a circular economy. The above requires the reduction of greenhouse gas emissions, the utilization of wastes, and the use of renewable energy sources. The most promising way is the use of methanol for industrial and transport applications. China is experiencing a boom in methanol production and its use in almost every sector of the economy. The purpose of this study was to reveal economic benefits, carbon dioxide emissions and the potential production of green methanol. Fuel price history, energy costs and fuel economy were used for economic assessment. Life cycle analysis to evaluate carbon dioxide emissions was applied. It was revealed that only the use of green methanol as a fuel results in decreases in well-to-wheel CO2 emissions compared to fossil fuels. The potential methanol production by using recycled waste and wind power was determined. Its annual production can range from 6.83 to 32.43 million tones. On this basis, a gradual transition to a circular and methanol economy is possible. Policymakers are recommended to support green methanol production in China. It can result in boosting the application of vehicles fueled by methanol and can control CO2 emissions.

1. Introduction

Road transport consumes around 33% of total energy consumption by transport [1]. Petroleum fuels are the primary fuels of road transportation. Their burning results in harmful emissions including carbon dioxide emissions. According to the International Energy Agency (IEA) carbon dioxide emissions are increasing. In 2018, their value exceeded 33 Gt [2]. To mitigate climate change, the United Nations Intergovernmental Panel on Climate Change recommended reduction of greenhouse gas emissions by 50–85% by 2050 [3]. The decrease of harmful emissions can be reached by using alternative vehicle fuels, including methanol [4,5].
Methanol could bring economic and ecological benefits to China. This fuel is environmentally friendly [6]. Moreover, its application results in reduced fuel costs [7]. China imports around 65% oil and 31% natural gas. The use of methanol-based fuel can decrease the import of the above energy resources [8]. Since 2000, the Chinese government has improved national energy independence and cut harmful emissions. Therefore, the increase of the methanol vehicle fleet ensures the sustainable economic growth of the country.
Methanol is mainly converted into the following fuels: neat methanol—M100; methanol and petrol blend (M5, M10, M15, M30, M50 and M85); methanol based petrol; methyl tertiary butyl ether (MTBE); dimethyl ether (DME); and biodiesel. Methanol can be converted to different hydrocarbons, including olefins. Olefins are valuable raw materials for the production of liquid vehicle fuels such as gasoline, distillate and dimethyl ether [9,10].
In 2018, road transport in China consumed 126 million tons of petrol and 156 million tons of diesel fuel [11]. Meanwhile, methanol consumption was around 17.4 million tons [12]. The production and use of methanol is growing mainly due to the use of methanol by transport in China (Figure 1 and Figure 2) [12,13].
The largest methanol producer in the world is China (around 70 million tons) [12,13]. Other countries produced much less methanol. For example, in 2018 the USA produced 5.7 million tons and Russia produced 4.46 million tons [14,15]. Methanol is an important chemical. It is used mainly in Asia, and China is the largest methanol consumer. Methanol usage by region of the world is as follows, in percent: China—58%; the rest of Asia-Pacific—16%; Europe—13%; Latin America—2%; North America—10% [16].
The growth of methanol production in China has had a positive trend despite global methanol production growth having slowed. There has been an increase in methanol-based fuel consumption (Figure 2).
Green methanol is very attractive for the energy sector. It makes possible the development of the methanol economy. This idea has been proposed by Nobel laureate G.A. Olah [17,18]. The transition to the methanol economy may allow China to reach the following results: strengthening of energy security; reduction of air pollution and carbon dioxide emissions; and increases in the added value of the domestic economy [19]. Therefore, the methanol economy gives tangible benefits.

2. Literature Review

2.1. Benefits of Methanol Based Fuels

The use of methanol as fuel (neat or blends) has considerable advantages over traditional uses. Tian et al. [20] provided a comparative description of the use of methanol in fuel mixtures. The use of M20 caused an increase in the thermal efficiency of engines and reduction of emissions of CO, CO2 and NOx. Wang et al. [21] reported that M15 and M25 are more acceptable compared to petrol. They have better environmental and economic indicators. Sun et al. [22] found that methanol based fuels are an excellent and inexpensive alternative to petrol and diesel fuel. This alcohol can meet new emissions standards. Huang et al. [23] analyzed methanol as a feedstock for manufacturing DME, biodiesel, MTBE and gasoline (MTG). Duraisamy et al. [24], Jia and Denbratt [25] and Prasad et al. [26] studied the use of methanol in diesel engines. They found that methanol does not impact diesel efficiency; however, it reduces HC and CO emissions by 30–40%.
However, well-to-wake carbon dioxide emissions factored in fuel economy and engine efficiency were not studied enough.
Methanol is biodegradable. This fuel degrades faster than petroleum fuels. At high concentrations, methanol is a poison. However, there was not a single case of accidental methanol poisoning [27].

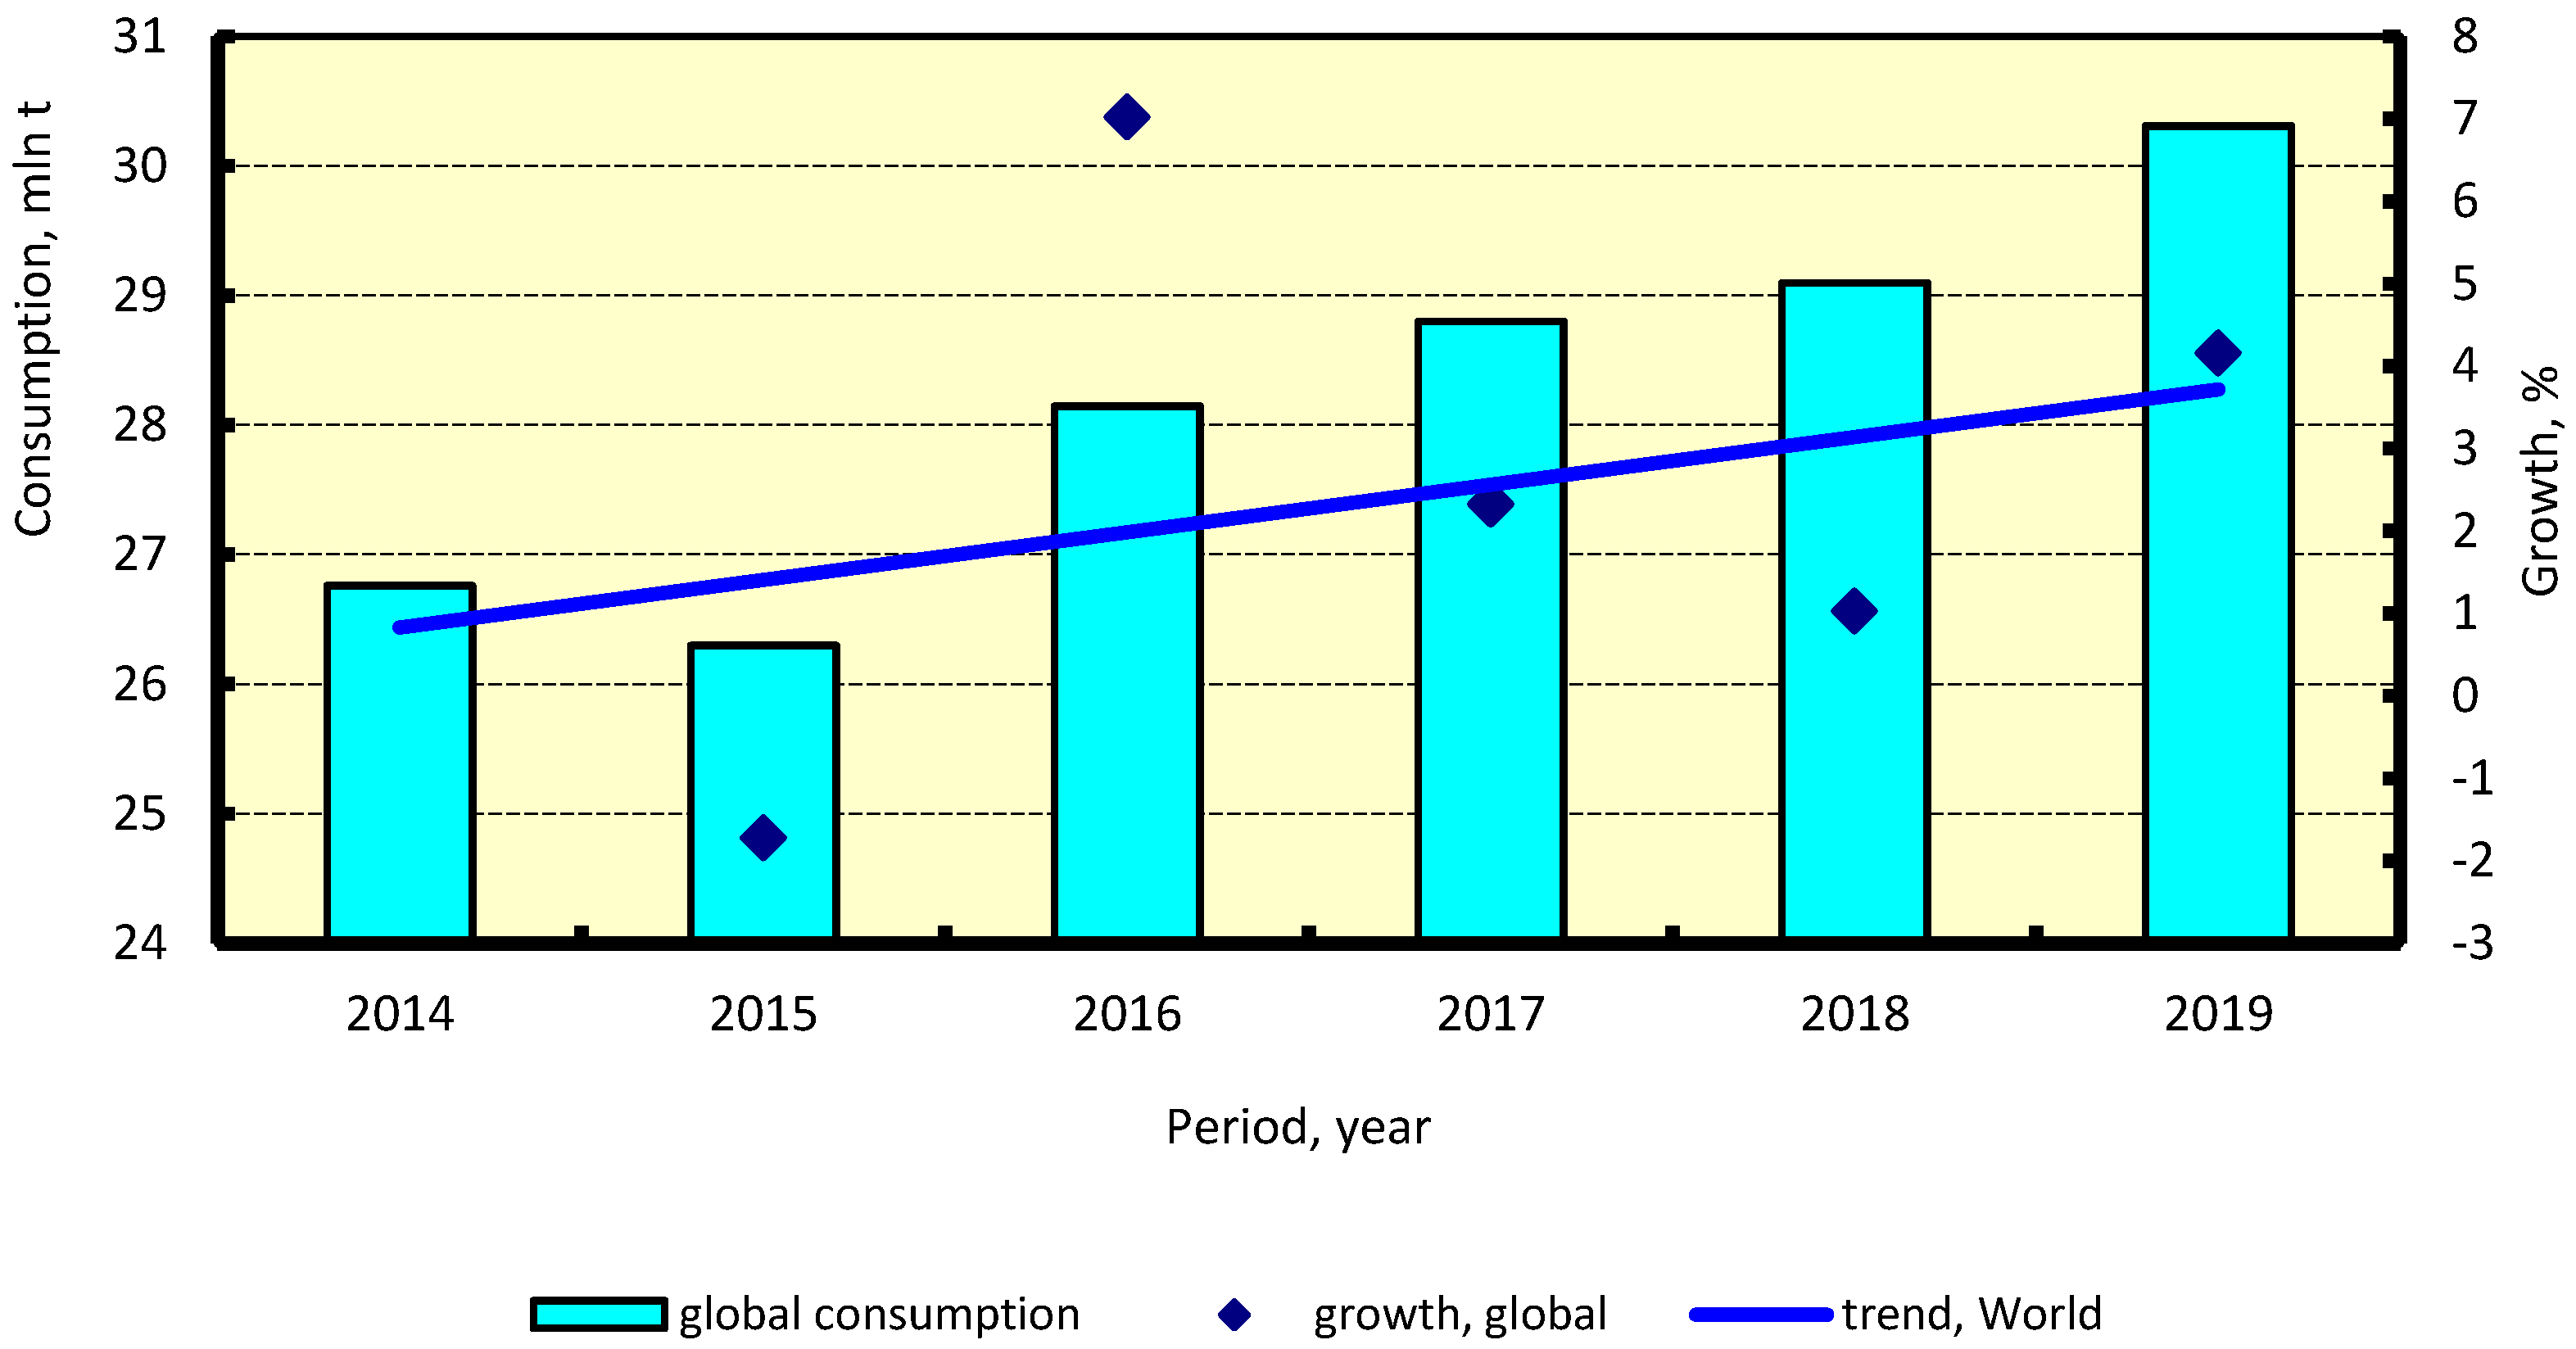
2.2. Methanol Market Forecasts

The methanol market can be divided into two distinct groups, namely non-renewable and green methanol. Thus, the forecasting of experts is carried out by the specified groups. However, large consulting companies take into account the overall methanol market in the long-term forecasting process without the renewable component selection. According to various forecasts, methanol production is predicted to be increased [28,29,30,31,32,33,34,35]. Total methanol production may grow from 110 million metric tons in 2018 to 220 in 2030 [36]. Projections of Council on Energy, Environment and Water (CEEW) and International Energy Agency (IEA) suggest that the cost of production of renewable methanol will be gradually reduced by 2030, making it cheaper than coal and natural gas [37].

2.3. Feedstock and Methanol Production

In China the most common types of feedstock for methanol production are currently coal, natural gas and coke gases. Meanwhile, globally, municipal and industrial waste, biomass and carbon dioxide are promising feedstock for green methanol. The technology for methanol production strongly depends on the feedstock type. Thus, synthesis gas can be produced by the reforming of gaseous hydrocarbons and the gasification of solid and liquid hydrocarbons. In addition, hydrogen and carbon dioxide can be used.
A number of scientists and experts have focused on the use of coal [38,39,40] and natural gas [41,42] as feedstocks for methanol production. Another group of scientists emphasized the feasibility of biomass based methanol [43,44,45,46]. Cellulosic biomass [47], sawdust [48], glycerol [49], carbon dioxide [50,51,52] and wind [42,53] have also been studied as feedstock for methanol production. Liu [40] proposed use of combined feedstock such as coal (50%) and biomass (50%).
Scientists have paid much attention to the use of industrial and municipal waste as a feedstock for methanol production. Yang et al. emphasized the importance of a gradual transition from coal-to-methanol technology to biomass-to-methanol. This can reduce CO2 emissions [43]. Roode-Gutzmer et al. considered the combined use of fossil fuels (coal and natural gas) and biomass for methanol production [45]. Municipal solid wastes are recommended for use for the realization of the circular economy model [46]. Borgwardt drew the conclusion that cellulosic biomass may be promising substitution of crude oil [47]. Wood biomass is potentially effective for the use in methanol production for woodland [48]. The most cost-effective and promising way to produce methanol is the use of renewable hydrogen and recycled carbon dioxide [49]. Ishaq and Dincer demonstrated the efficiency of the use of wind energy and hydrogen for the production of methanol [53].
To realize a sustainable and low-carbon economy, renewable energy should be introduced in the fuel production chain. A key strategic factor of this scenario is the conversion of carbon dioxide into feedstock for methanol and DME production [54]. Special attention has been paid to the methanol-to-DME and the one-pot carbon dioxide-to-DME process [55,56].
Thus, the use of certain resources for the production of methanol depends on natural resources and waste in various sectors of the economy.
The above studies are the driving force behind innovative positive changes in the automotive industry. The use of methanol as a mixture or clean fuel results in improving engine efficiency, reducing harmful emissions and increasing economic efficiency. China has experience in the use of neat methanol or M100 as a vehicle fuel. For example, Geely Auto has produced a methanol version of cars. They are used in Jinzhong in Shanxi Province [57].
However, there is a lack of studies concerning sustainable methanol production potential from available feedstocks and related economic and environmental benefits (carbon dioxide emissions).
The purpose of this study is to reveal the advantages of methanol as a sustainable fuel for land transport and a component of derived fuels, namely (i) fuel cost saving; (ii) well-to-wake carbon dioxide emissions; (iii) promising green electricity source and volume of renewable methanol production; and (iv) promising resources and volume of biomethanol production. The third section introduces methods and data, the fourth section deals with results, and the fifth section concludes the paper.

3. Materials and Methods

3.1. Fuels

Methanol and petroleum fuels were analyzed in this study. Methanol has a low cetane number and, therefore, it cannot be used for diesel engines. This kind of fuel is suitable for spark ignition engines, gas turbines and fuel cells. Its lower heating values are less than those of petroleum fuel and it has a high heat of vaporization. Molecular compositions are the main differences between conventional fuels and methanol. Diesel fuel or gasoline do not contain oxygen, whereas methanol has 50% oxygen by mass (Table 1) [58,59,60,61,62].

3.2. Carbon Dioxide Emissions Indicator

Carbon dioxide emissions of any fuel depend on the engine efficiency and fuel properties, such as lower heating value and carbon content. Specific fuel consumption of any engine is
S F C = 3600 ( η L H V f ) 1 ,   kg / kWh ,
where η is the engine efficiency; LHVf is the lower heating value of the fuel, kJ/kg.
Carbon dioxide emission depends on the carbon content in fuel
C D E = 11 3 F C C ,   kg / kg ,
where FCC is the carbon content in the fuel in kg/kg.
Then the specific carbon dioxide emission can be calculated by the following formula:
S C D E = S F C C D E = 3600 ( η L H V f ) 1 11 3 F C C = 13200 F C C ( η L H V f ) 1 ,   kg / kWh ,
In our study, we took into account the total fuel life cycle and calculated well-to-wake (WTW) emissions. The well-to-wake carbon dioxide emissions of any engine and any fuel can be calculated by the following formula [63]:
W T W = 3600 η L H V ( F C C 11 3 + W T T f ) ,   kg / kWh ,
where WTTf is the well-to-tank carbon dioxide emissions for a certain fuel in kg CO2-eq/kg.
Therefore, to decrease carbon dioxide emissions in the atmosphere, the engine efficiency must be augmented, and the carbon content of fuel must be reduced.
The WTW emissions for vehicles can be calculated by using the following expression:
W T W = i = 1 n { F E i ρ i ( 11 3 F C C i + W T T i ) } ,   kg / 100   km ,
where WTTi is the well-to-tank carbon dioxide emissions for ith fuel component in kg CO2-eq/kg; FEi is the fuel economy of ith fuel component in L/100 km.

3.3. Efficiency Indicators and Economic Assessment

In this study we used the following indicators:
  • Engine efficiency;
  • Specific fuel consumption;
  • Fuel economy.
The above indicators were used for different fuels and engines.
To estimate economic efficiency of different fuels, the fuel energy cost was computed as follows [62]:
E C F = F p r L H V f 1 ,   USD / GJ ,
where Fpr is the price of fuel in USD/t; LHVf is the lower heat value of the fuel in GJ/t.
The energy cost for useful work factors in the engine efficiency and is calculated as [51]
E C U W = F p r ( η L H V f ) 1 ,   USD / GJ .
The same value per MWh is calculated by the following formula [51]:
E C U W = F p r ( 3.6 η L H V f ) 1 ,   USD / MWh .
An acceptable methanol to conventional fuel price ratio, which take into account lower heating values and densities, is the thermal ratio [62]:
R M C P t h = L H V M ρ M L H V C ρ C < F p r M F p r C ,  
where ρ M is the density of methanol-based fuel in kg/L; ρ C is the density of conventional fuel in kg/L.
If the actual methanol to conventional fuel price ratio is less than RMCPth, then the methanol-based fuel is competitive.

3.4. Information Base

The economic analysis was fulfilled for diesel fuel, petrol and methanol based fuels. The average fuel prices were taken from official information sources. Official prices of Methanex (the world’s largest producer of methanol) were applied for this study.

4. Results

This section is divided by the following subsections: pathway for methanol utilization, carbon dioxide emissions, economic assessment and potential green methanol production.

4.1. Pathway for Methanol Utilization

A fuel application of methanol is a key component of its consumption. In 2018, pure methanol (M100), and the methanol-petrol blends MTBE and DME totaled around 17.4 million tons or approximately 25–27% of national application [11]. Methanol may be used in several pathways, including direct burning (pure methanol or methanol blends), derived fuels (biodiesel or dimethyl ether (DME) and fuel cells (Figure 3). Low level methanol blends such as M15–M25 can be used in spark ignition engines. These engines need no change. High level methanol blends (M85–M100) can be used only in dedicated engines [64].
Diesel engines can be retrofitted for methanol application. As a rule, these are dual-fuel engines. This solution results in reduction of harmful emissions [65].
Methanol-based fuels are not yet implemented in transport in the European Union. However, new alcohol-based fuels have been developed. A new A7 fuel contains 3% methanol and 4% ethanol. It can substitute E5 [66]. A new A20 fuel contains 20% alcohol (15% methanol, 5% ethanol, 80% petrol) [67].

4.2. Carbon Dioxide Emissions

Specific carbon dioxide emissions of fuels depend on primary factors such as carbon content, lower heating value and engine efficiency. Carbon dioxide emissions were computed using Equation (1). Diesel fuel (for diesel engines), petrol and methanol (for spark ignition engines and fuel cells) were analyzed. The obtained results are shown in Figure 4. However, they do not take into account well-to-tank (WTT) emissions for different vehicle fuels.
The figures show that the type of fuel has no significant influence on carbon dioxide emissions. Emissions primarily depend on engine efficiency. This may be explained by the following fact, that the specific carbon content (by mass) per unit of energy is slightly dependent on the fuel type. The above value for methanol is equal to 19.065 g/MJ. Conventional fuels have similar values: petrol—19.55 g/MJ and diesel fuel—20 g/MJ. Therefore, improving efficiency is the main way to reduce greenhouse gas emissions.
In 2019, the Gumpert Aiways Automobile Company presented a methanol fuel cell. This company developed an electric car in a methanol fuel cell version. This system has an electric efficiency of 45% and converts 1 L on methanol into 2 kWh of electricity. The fuel economy is 21 kWh per 100 km or 9.65 L of methanol per 100 km [68].
WTT carbon dioxide emissions from different fuels vary in a wide range. Regarding methanol fuel, WTT depends on the production technology and the type of feedstock. This indicator has a minimum value for renewable feedstock (biomass) and green electricity. However, it is worse compared to bioethanol (Table 2).
Carbon dioxide emissions per 100 km for a Geely methanol car were determined. Tank-to-wheel, well-to-wake maximum and well-to-wake minimum values were calculated. Actual data about fuel economy was used [67]. According to our calculations, M100 (neat methanol) had the best values of carbon dioxide emissions compared to petrol (Figure 5). Biomethanol had four times less emissions than petrol. However, methanol produced from coal had higher WTW emissions. Methanol fuel cell is a perspective technology. All kinds of methanol (biomethanol and coal-based methanol) provide the best environmental performance compared to petrol.
The cetane number of methanol is less than 5. Nevertheless, neat methanol may be used in diesel engines. To use it in compressed ignition engines, a diesel methanol compound combustion (DMCC) system has been developed. The DMCC system consists of two injection subsystems: methanol and diesel fuel. Methanol is injected into the intake port of each cylinder to form an air/methanol mixture. The mixture is ignited by diesel fuel. The diesel fuel injection system is modified to limit the volume of injected diesel fuel. At engine start and low load, the diesel engine operates on diesel fuel only. At medium and high loads, the engine operates on methanol and diesel fuels. Pilot diesel fuel is used to ignite the air/methanol mixture. DMCC engines have lower smoke opacity and nitrogen oxides emissions as compared to conventional diesel engines [69]. Carbon dioxide emissions of the above trucks were analyzed. The use of methanol resulted in slight reduction of TTW emissions. The WTW emissions for biomethanol depended on methanol origin (Figure 6).
The use of methanol gives the best results for spark ignition engines (SIE). There is a 21% decrease in tank-to-wheel emissions for SIE and a 1.5% decrease for diesel engines. WTW emissions are cut by 75% for SIE and 21.2% for DMCC (if biomethanol is used).

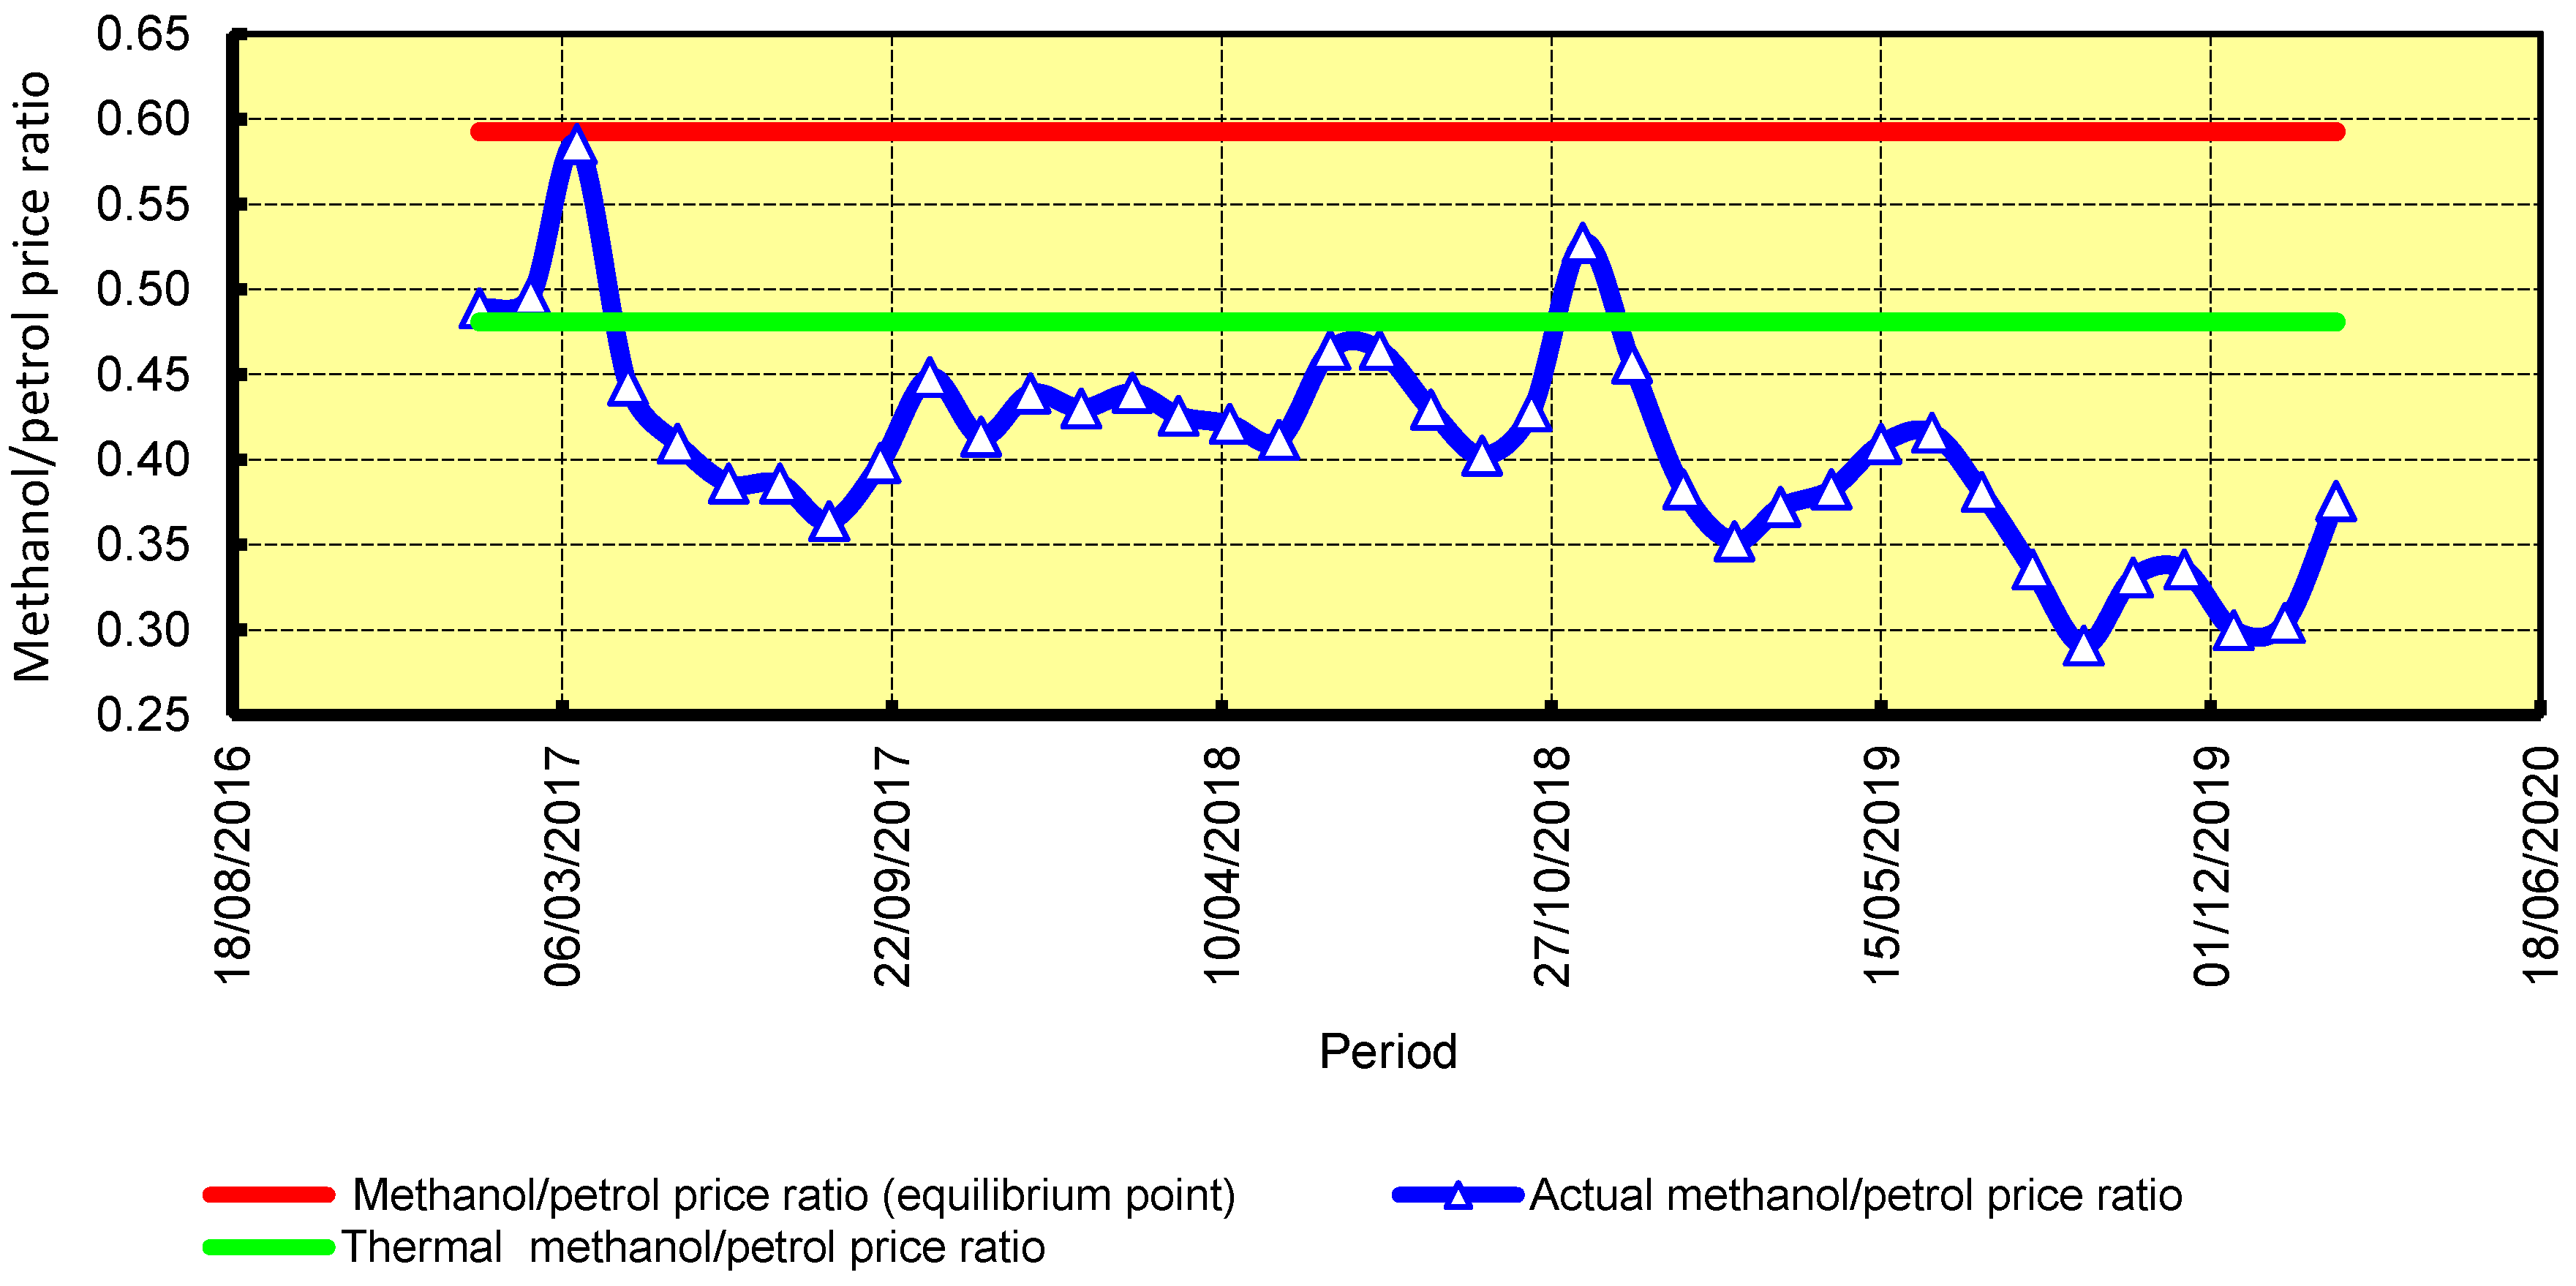
4.3. Economic Assessment

A number of researchers have stated that the target markets for methanol as a fuel are land vehicles; methanol vessels (to improve environmental indicators); the energy supply of recreation areas; and the energy supply if there is lack of inexpensive fossil fuels such as natural gas, propane, fuel oil, etc.) [70]. In this study, the economic assessment of methanol as a vehicle fuel was considered.
To compare petrol and diesel fuel with methanol, an economic analysis was carried out. The China petrol prices [71] and Mathenex methanol prices for Asia markets [72,73] were used (Figure 7). These fuels have different physical properties such as lower heating value and density; therefore, their energy costs were calculated (Figure 8). Since October 2018, petrol energy costs have been higher compared to those of methanol.
For consumers, a methanol to petroleum fuel price ratio indicator has been recommended for making decision [62,74]. This ratio should be less than an equilibrium point. The equilibrium point takes into account principle indicators of fuels and engine efficiency. It can be computed by the following expression:
P F R 0 = F p r m F p r p = L H V m η m L H V p η p
where LHVm is the lower heating value of methanol in MJ/kg; LHVp is the lower heating value of petrol in MJ/kg; ηm is the engine efficiency when methanol is used; ηp is the engine efficiency when petrol is used.
If the actual methanol to petrol price ratio is less than calculated PFR0, then the application of methanol is acceptable. If there is information about actual fuel economy, the equilibrium point is determined by the formula
P F R 0 = F p r m F p r p = F E p F E m
where FEm is the fuel economy of a methanol-fueled vehicle in L/100 km; FEp is the fuel economy of a petrol-fueled vehicle in L/100 km.
Our calculations were done for a Geely car. Its fuel economy for petrol is 8 L/100 km, and for neat methanol fuel M100 its fuel economy is 13.5 L/100 km [67]. Methanol and petrol prices have been investigated since 2017. For that period, methanol demonstrated economic superiority over petrol (Figure 9). The actual methanol/petrol price ratios were less than the equilibrium point. Therefore, methanol was a competitive alternative to petrol. The thermal methanol to petrol price ratio was lower than the actual one. This means that the methanol engine efficiency was higher than the petrol engine efficiency.
M15 fuel is widespread in China. An engine fueled by M15 has higher thermal brake efficiency compared to petrol. The increase of methanol concentration results in increases of the thermal brake efficiency. China has been successful in commercializing M15 fuel. The existing vehicle fleet does not need modification, and the price of M15 is also competitive (Figure 10).
Some Chinese companies such as Sinotruk Jinan Truck Co., Ltd and Shaanxi Automobile group Co., Ltd. produce methanol diesel dual fuel dump trucks. For example, Shacman SX3317DR456HM and ZZ3317N4667D1M are powered by a 245 kW dual fuel engine [75,76]. Chinese companies (Yulin City of Shannxi Province) have experience in the use of M100 by trucks equipped by DMCC engines. The energy share of diesel fuel ranges from 0.64 to 0.697 [11].
An acceptable methanol to diesel fuel price ratio may be found by the following formula:
F E d F p r d + F E m F p r m F E d 0 F p r d < 1 ,
where FEd is the diesel fuel economy of a vehicle equipped by DMCC engine in L/100 km; FEm is the methanol fuel economy of a vehicle equipped by DMCC engine in L/100 km; FEd0 is the fuel economy of a diesel-fueled vehicle equipped by conventional diesel engine in L/100 km.
Hence, the equilibrium point of the acceptable methanol to diesel fuel price ratio is equal to
F P R d 0 = F p r r m F p r d < F E d 0 F E d F E m .
The equilibrium point is higher than the actual methanol to diesel fuel price ratio (Figure 11) [77]. The price ratio makes the use of M100 profitable. According to our calculations, the use of methanol fuel results in fuel cost saving of 6–7%.

4.4. Methanol Production

A conventional methanol plant comprises the following processes: production of syngas and its cleaning, reforming of higher hydrocarbons, water–gas shift, methanol synthesis and its purification.
Methanol production processes depend on the feedstock. Solid feedstock (such as coal, biomass and waste) is gasified into syngas (a mixture of carbon monoxide and hydrogen, as well as water and hydrocarbons). However, if air is used as the oxidant, syngas contains nitrogen. It increases the gas flow through the gasifier. This results in higher investment costs. The use of pure oxygen decreases equipment costs. However, this oxidant is rather expensive. If biomass is used as the feedstock, a pre-treatment is required. It may be chipping, drying, etc. The pre-treatment increases investment and operational costs.
If gaseous feedstock (such as natural gas or biomethane) is used for methanol production, it should be reformed to produce syngas. Biomethane is a result of biogas upgrading. Its production requires anaerobic digestion, biogas cleaning and biogas upgrading. Therefore, biomethane production needs more investment costs. Moreover, this renewable combustible gas has higher production costs compared to natural gas.
Renewable methanol is produced from carbon dioxide and renewable hydrogen. Hydrogen can be obtained from water by electrolysis. This process needs electricity produced by solar photovoltaic, hydro and wind power plants. As a rule, it is the most expensive methanol, although this process shows the highest carbon dioxide saving [78,79,80].

4.4.1. Green Methanol

In this study, we distinguish low-carbon methanol (LCM), biomethanol and renewable methanol [81]. Biomethanol is produced from organic feedstock. Renewable methanol is produced from carbon dioxide and renewable electricity. LCM is produced from natural gas or other fossil fuel by adding carbon dioxide from industrial facilities. According to the Methanol Institute, renewable methanol is produced from the following feedstocks: biomass, industrial waste, municipal waste and carbon dioxide plus green electricity [82]. Methanol production and utilization pathways are presented in Figure 12. Renewable feedstock and electricity meet the circular economy.
Methanol is currently produced from fossil fuels, mainly natural gas. China is the biggest methanol producer. This country uses primarily coal (around 64%) [45,83]. Methanol production costs mainly depend on feedstock and an electricity price. Natural gas-based methanol production costs range from EUR50/t to EUR400/t. The share of feedstock in production costs varies from 39.6 to 85.7% [84]. Coal-based methanol, as a rule, is more expensive. For example, in 2017 in China, its cost was EUR235/t [38]. China can produce biomethanol and renewable methanol from the following resources: biomass, municipal solid and water waste, carbon dioxide and renewable electricity. Biomass-based methanol cannot compete with fossil fuel based methanol. Its production cost ranges from EUR500/t to EUR600/t. The production costs of renewable methanol based on wind power and carbon dioxide depend on electricity cost and vary from EUR610/t to EUR1520/t, but are falling [45,85].
Some kinds of renewable resources may be used to produce biomethanol, such as biomass (forest residues, agricultural residues and energy crops), municipal waste water and municipal solid waste. China has a relatively small forested area at less than 23% [86]. Wood and wood residues were not considered in this study. The use of wood and agricultural residues requires specific approaches and will be explored in subsequent studies [87,88]. To produce renewable methanol, carbon dioxide and renewable electricity are needed. Based on economic feasibility and the availability of resources, we further considered the following feedstocks: municipal waste water, municipal solid waste, carbon dioxide and renewable electricity.

4.4.2. Renewable Methanol (Carbon Dioxide and Renewable Electricity)

Zhang et al. reported that CO2-to-methanol technology is economically feasible if the electricity price is less than USD 0.047/kWh [89]. There are different sources of carbon dioxide such as flue gases, exhaust gases, atmosphere, biogas, pre-combustion, etc. (Figure 13). The largest sources of carbon dioxide are cement and steel industries [90]. Costs for carbon dioxide capture vary from EUR26/t to EUR59/t [91,92,93].
The average global renewable electricity production costs are falling. Among them, onshore wind and biomass power plants generate electricity with the lowest costs. Some of these projects can reach competitive costs of electricity [94]. Therefore, the production of renewable methanol may be competitive.
Wind power plants have high potential to produce sustainable hydrogen and, therefore, methanol. Due to technological innovations, the generation costs are decreasing. According to the IRENA reports, in 2018 the global average cost of electricity generated by onshore wind power plants was USD 0.056/kWh. In general, it ranged from USD 0.04/kWh to USD 0.10/kWh. Around 5% of electricity was cheaper than USD 0.05/kWh. The average levelized cost of electricity of onshore wind power plants commissioned in 2018 was under USD 0.048/kWh [94]. That fact allows us to look with optimism at the power-to-methanol technology.
China is a leader of the wind power market. In 2019, its total onshore installations had a rated power of 229,954 MW [95] and generated 405,700 GWh [96]. This sector of the economy has positive dynamics (Figure 14).
The potential renewable methanol production using power-to-liquid technology is
T P M P W W = 10 3 W S W η p l L H V m w 1   million   t
where W is the total national electricity production by wind power plants in GWh; SW is the share of competitive wind power plants, and SW = 5%; ηpl is the conversion efficiency, in percent; LHVm0 is the lower heating value of methanol, and LHVm0 = 5.464 kWh/kg.
The power-to-methanol conversion efficiency is 48.2% [66]. Therefore, the theoretical feasible methanol production is 1.789 million tons. These wind power plants may integrate with sources of carbon dioxide such as alcohol refineries, steel plants, biogas plants, etc.

4.4.3. Biomethanol

There are several sources of biomass for the production of biomethanol (Figure 15).
Waste water can be used to produce biogas. Upgraded biogas (biomethane) can be converted to methanol. This process is like the natural gas to methanol conversion [65]. Nowadays there are commercial projects producing renewable methanol (biomethanol) from biogas. For example, BioMethanol Chemie Nederland B.V., doing business as BioMCN (the Netherlands), has replaced natural gas with biogas in its methanol production process. This company uses upgraded biogas (biomethane) from different sources. In 2017, BioMCN produced around 60 thousand tons of biomethanol. This form of renewable methanol production can contribute to the circular green economy [81].
Lu et al. explored possible solutions for optimizing the operation of wastewater treatment plants in China [97]. They found that sludge anaerobic digestion is a most sustainable pathway to sort out the sludge disposal problem. This idea was supported by Li and Feng [98]. Biogas production strategies to reduce the operating costs were supported by Cano et al. [99] and Holaby et al. [100].
In China, annual sewage sludge generation is around 6.25 million tons of dry matter [101]. Its specific value (per inhabitant) is less than in European Union countries, Japan, the USA, etc. Therefore, its volume is expected to grow. Waste water treatment plants (WWTP) may be integrated into biogas and biomethane systems [102].
There is a number of large-scale WWTPs, for example, treatment capacity in thousands of cubic meters per day, as follows: Dalian Malan River—120; Wuxi Lucun Village—200; Tianjin Jizhuangzi—260; Shanghai Shidongkou—400; Beijing Water Reclamation Plant—1000; Qinghe Wastewater Treatment Plant—240 [96,103]. They are more suitable for biogas production. The upgraded biogas can be used as a feedstock for methanol production. Large-scale WWTPs (capacity more than 500 thousand cubic meters per day) treat around 5.2% of the total waste water. The potential biomethanol production was computed by the following formula:
T P M P W W = 10 6 M W W D M S L S V S η B C E Y B L H V B L H V m 1   thousand   t
where MWWDM is the annual sewage sludge generation in millions of tons; SLS is the share of large scale WWTPs, in percent; VS is the volatile solid fraction, in percent; ηBCE is the conversion efficiency, in percent; YB is the biogas yield in m3/t; LHVB is the lower heating value of biogas in MJ/m3; LHVm is the lower heating value of methanol in MJ/kg.
The energy efficiency of biomethane-to-methanol technology is equal to 69% [66]. We assumed the following initial data: volatile solids fraction—87% [104]; biogas yield—700 m3/t [104]; share of large scale WWTPs (more than 200,000 m3/day)—24.57% [105]; lower heating value of biogas—21 MJ/m3. Our calculations showed that the theoretical potential of biogas-based methanol production is 688.9 thousand tons.
This idea is feasible. For example, in Sweden, WWTPs annually produce 700 GWh or 120 million cubic meters of biogas. Himmerfjärdsverket WWTP (the capacity is 130,000 m3/day) has annual biogas production of 7.68 million m3. It produces around 2.7 million m3 of biomethane. Its production cost was EUR 509/m3 [106].
Municipal Solid Waste:
A prospective biomass source is municipal solid waste (MSW). This kind of feedstock is used by the Canadian company Enerken. Its methanol production cost was estimated at EUR 110/t [107]. There is an agreement between Enerken Inc. and Sinobioway Group to implement this technology in China [108].
Therefore, MSW for methanol production is a promising technology. In China, the volume of MSW is rising [109]. In 2018, the above value exceeded 228 million tons (Figure 16). According to forecasting, this value may reach 480 million tons by 2030. The combustible fraction of MSW (such as paper, plastics, textile, wood, etc.) ranges from 19.07 to 56.35%. Its lower heating value varies from 3.572 MJ/kg to 8.322 MJ/kg [110]. This feedstock may be used to produce methanol. The theoretical potential of MSW-based methanol can be calculated by the following formula:
T P M P = 10 4 M m s w C S η C E L H V M S W L H V m 1   mln   t
where Mmsw is collected MSW in millions of tons; CS is the combustible fraction of MSW in percent; ηCE is the conversion efficiency in percent; LHVMSW is the lower heating value of MSW in MJ/kg; LHVm is the lower heating value of methanol in MJ/kg.
The energy efficiency of waste-to-methanol technology is around 55% [111]. We computed the theoretical potential for 2018 and 2023 (we used the mass of MSW predicted by the approximation of a function). Our calculations showed that in 2018 the theoretical potential was between 4.35 and 29.95 million tons. By 2023 the above potential may increase to values between 5.14 and 35.4 million tons (Figure 17). Therefore, the potential MSW-based methanol production can be between 6.69% and 54.46% of its current production [12].

5. Conclusions

Since 2000 there has been an increase in methanol production and application as a vehicle fuel. China, as a leader in methanol production, has demonstrated the gradual transition to a methanol economy. The analysis showed that the global methanol economy has an average annual growth rate of 5.9%. Meanwhile, China showed an increase of about 10%. In 2019, global methanol consumption as fuel exceeded 30 million tons and is growing.
The thermal efficiency of methanol fueled engines is not less than the efficiency of engines powered by conventional fuels. Methanol fuel increases the efficiency of spark ignition engines. Methanol fuel cells have the best results. Since October 2018, methanol has been competitive compared to petroleum fuels. The fuel cost saving ranged from 6–7% (for diesel engines) to 30% (for SIE).
Specific carbon dioxide emissions do not depend on the type of fuel. They mainly depends on engine efficiency. Only green methanol can reduce WTW carbon dioxide emissions. Spark ignition engines and fuel cells are expected to have the best results.
To ensure the sustainable development of the automotive industry, it is necessary to use renewable fuels, including biomethanol. The use of MSW, wind power and WWTP biogas are promising pathways for green methanol production. MSW as a feedstock is ranked first.
Improved living standards have resulted in increased volumes of MSW. Its volume exceeded 238 million tons in 2018. MSW is a promising feedstock to produce green methanol. Existing technologies allow chemical companies to convert MSW into methanol. In 2018, the theoretical annual potential ranged from 4.35 to 29.95 million tons. Wind power plants (power-to-liquid) and biogas of WWTPs can currently produce 1.79 and 0.69 million tons, respectively.
Based on the above, policymakers should support the development of green methanol projects in China.
Agricultural residues and wood as feedstock for methanol production have significant potential. They are subjects for further study. In order to assess the potential of agricultural residues for biomethanol production, further research will be focused on the quantity of agricultural crop residues, the quantity of manure, their geographical locations and cluster analysis. Special attention will be paid to determine the synergetic effects of biomethanol production.

Author Contributions

Conceptualization, E.A.T.; Formal analysis, V.H. and V.N.; Investigation, O.B.; Writing—original draft, V.H. and V.N.; Writing—review and editing, T.B. and D.S. All authors have read and agreed to the published version of the manuscript.

Funding

This study was carried out as part of the project “Belt and Road Initiative Centre for Chinese–European studies” and was funded by the Guangdong University of Petrochemical Technology.

Conflicts of Interest

The authors declare no conflict of interest.

References

  1. International Energy Agency. Transport, Energy and CO2: Moving Toward Sustainability; OECD/IEA: Paris, France, 2009; Available online: https://www.iea.org/news/transport-energy-and-co2-moving-toward-sustainability (accessed on 11 April 2020).
  2. IEA. Global Energy & CO2 Status Report 2019. Available online: https://www.iea.org/reports/global-energy-co2-status-report-2019/emissions (accessed on 20 April 2020).
  3. IPCC—Intergovernmental Panel on Climate Change. IPCC Fourth Assessment Report; UN IPCC: Geneva, Switzerland, 2007; Available online: https://www.ipcc.ch/assessment-report/ar4/ (accessed on 11 April 2020).
  4. Yuan, X.; Liu, X.; Zuo, J. The development of new energy vehicles for a sustainable future: A review. Renew. Sustain. Energy Rev. 2015, 42, 298–305. [Google Scholar] [CrossRef]
  5. Zhang, X.; Liang, Y.; Yu, E.; Rao, R.; Xie, J. Review of electric vehicle policies in China: Content summary and effect analysis. Renew. Sustain. Energy Rev. 2017, 70, 698–714. [Google Scholar] [CrossRef]
  6. Hao, H.; Liu, Z.; Zhao, F.; Ren, J.; Chang, S.; Rong, K.; Du, J. Biofuel for vehicle use in China: Current status, future potential and policy implications. Renew. Sustain. Energy Rev. 2018, 82, 645–653. [Google Scholar] [CrossRef]
  7. Li, C.; Negnevitsky, M.; Wang, X. Review of methanol vehicle policies in China: Current status and future implications. Energy Procedia 2019, 160, 324–331. [Google Scholar] [CrossRef]
  8. National Bureau of Statistics. China Energy Statistics Yearbook 2019; China Statistics Press: Beijing, China. Available online: http://www.stats.gov.cn/tjsj/ndsj/2019/indexeh.htm (accessed on 11 April 2020).
  9. Keil, F.J. Methanol-to-Hydrocarbons: Process Technology. Microporous Mesoporous Mater. 1999, 29, 49–66. [Google Scholar] [CrossRef]
  10. Catizzone, E.; Cirelli, Z.; Aloise, A.; Lanzafame, P.; Migliori, M.; Giordano, G. Methanol conversion over ZSM-12, ZSM-22 and EU-1 zeolites: From DME to hydrocarbons production. Catal. Today 2018, 304, 39–50. [Google Scholar] [CrossRef]
  11. Zhao, K. A Brief Review of China’s Methanol Vehicle Pilot and Policy. Available online: https://www.methanol.org/wp-content/uploads/2019/03/A-Brief-Review-of-Chinas-Methanol-Vehicle-Pilot-and-Policy-20-March-2019.pdf (accessed on 12 February 2020).
  12. Chan, T. Methanol Fuel Blending In China. In Proceedings of the Enmore 14th International Me OH Week, Nanjing, China, 9–10 July 2019; Available online: https://www.methanol.org/wp-content/uploads/2019/07/Methanol-Fuel-Blending-in-China.pdf (accessed on 29 March 2020).
  13. Methanol Institute. Methanol Price and Supply/Demand. Available online: https://www.methanol.org/methanol-price-supply-demand/ (accessed on 15 April 2020).
  14. Methanol Production in the United States from 1990 to 2018. Available online: https://www.statista.com/statistics/974802/us-methanol-production-volume/ (accessed on 30 May 2020).
  15. Methanol Production in Russia in 2018 Increased by 7%. Available online: http://rcc.ru/article/proizvodstvo-metanola-v-rossii-v-2018-g-vyroslo-na-7–69007 (accessed on 30 May 2020).
  16. Methanex Investor Presentation. March 2019. Available online: https://www.methanex.com/sites/default/files/investor/MEOH-Presentation-2019–03–04.pdf (accessed on 30 May 2020).
  17. Olah, G.A.; Goeppert, A.; Prakash, G.K.S. Beyond Oil and Gas: The Methanol Economy; Wiley-VCH: Hoboken, NJ, USA, 2006; Available online: https://onlinelibrary.wiley.com/doi/book/10.1002/9783527627806 (accessed on 11 April 2020).
  18. Olah, G.A. Towards Oil Independence Through Renewable Methanol Chemistry. Angew. Chem. Int. Ed. 2013, 52, 104–107. [Google Scholar] [CrossRef]
  19. Liao, H.; Long, Y.; Ming, T.; Mardani, A.; Xu, J. Low carbon supplier selection using a hesitant fuzzy linguistic span method integrating the analytic network. Transform. Bus. Econ. 2019, 18, 67–88. [Google Scholar]
  20. Tian, Z.; Zhen, X.; Wang, Y.; Liu, D.; Li, X. Comparative study on combustion and emission characteristics of methanol, ethanol and butanol fuel in TISI engine. Fuel 2020, 259, 116199. [Google Scholar] [CrossRef]
  21. Wang, X.; Ge, Y.; Liu, L.; Peng, Z.; Hao, L.; Yin, H.; Ding, Y.; Wang, J. Evaluation on toxic reduction and fuel economy of a gasoline direct injection- (GDI-) powered passenger car fueled with methanol–gasoline blends with various substitution ratios. Appl. Energy 2015, 157, 134–143. [Google Scholar] [CrossRef]
  22. Sun, H.; Wang, W.; Koo, K.-P. The practical implementation of methanol as a clean and efficient alternative fuel for automotive vehicles. Int. J. Engine Res. 2019, 20, 350–358. [Google Scholar] [CrossRef]
  23. Huang, P.; Ju, H.; Tan, S.; Wang, H.; Zhao, T. The Future of Methanol Fuel an Analysis on the Feasibility of Methanol as an Alternative Fuel. 4 December 2015. Team 1. Available online: http://franke.uchicago.edu/bigproblems/BPRO29000–2015/Team01-TheFutureofMethanolFuel.pdf (accessed on 16 January 2020).
  24. Duraisamy, G.; Rangasamy, M.; Govindan, N. A comparative study on methanol/diesel and methanol/PODE dual fuel RCCI combustion in an automotive diesel engine. Renew. Energy 2020, 145, 542–556. [Google Scholar] [CrossRef]
  25. Jia, Z.; Denbratt, I. Experimental investigation into the combustion characteristics of a methanol-Diesel heavy duty engine operated in RCCI mode. Fuel 2018, 226, 745–753. [Google Scholar] [CrossRef]
  26. Prasad, B.S.N.; Pandey, J.K.; Kumar, G.N. Impact of changing compression ratio on engine characteristics of an SI engine fueled with equi-volume blend of methanol and gasoline. Energy 2020, 191, 116605. [Google Scholar] [CrossRef]
  27. Bromberg, L.; Cheng, W.K. Methanol as an Alternative Transportation Fuel in the US: Options for Sustainable and/or Energy-Secure Transportation. Massachusetts Institute of Technology. Final Report. 2010. Available online: https://afdc.energy.gov/files/pdfs/mit_methanol_white_paper.pdf (accessed on 30 May 2020).
  28. Infoholic Research LLP. Methanol Market—Global Drivers, Restraints, Opportunities, Trends Forecast up to 2023; Infoholic Research LLP: Karnataka, India, 2019. [Google Scholar]
  29. IMARC Group. Methanol Market: Global Industry Trends, Share, Size, Growth, Opportunity and Forecast 2019–2024; IMARC Group: Noida, India, 2019; ID: 4763079. [Google Scholar]
  30. Grand View Research. Methanol Market Size, Share Trends Analysis Report by Application (Formaldehyde, Acetic Acid, MTBE, DME, Fuel Blending, MTO, Biodiesel), by Region, and Segment Forecasts, 2019–2025; Grand View Research: San Francisco, CA, USA, 2019; ID: GVR-4-68038-016-3. [Google Scholar]
  31. Prismane Consulting. Global Methanol Market Study 2014–2025; Prismane Consulting: Maharashtra, India, 2018. [Google Scholar]
  32. Mordor Intelligence. Methanol Market—Growth, Trends, and Forecast (2020–2025); Mordor Intelligence: Hyderabad, India, 2020; ID: 4514928. [Google Scholar]
  33. Polaris Market Research. Methanol Market Share, Size, Trends Industry Analysis Report, by Feedstock (Natural Gas, Coal), by Derivatives (Formaldehyde, Acetic Acid, Gasoline, MTO, Gasoline, MMA), by End-Use (Automotive, Construction, Electronics, Paints Coatings, Pharmaceuticals), by Regions: Segment Forecast, 2019—2026; Polaris Market Research: Maharashtra, India, 2019; ID: PM1543. [Google Scholar]
  34. Triton Market Research. Global Methanol Market 2019–2027; Triton Market Research, July 2019. ID: 4791833. Available online: https://www.tritonmarketresearch.com/reports/methanol-market (accessed on 16 June 2020).
  35. Inkwood Research. Global Methanol Market Forecast 2019–2027; Inkwood Research: Westford, MA, USA, 2019; ID: INKR15970824. [Google Scholar]
  36. Statista. Production Capacity of Methanol Worldwide in 2018 and 2030 (in Million Metric Tons). Available online: https://www.statista.com/statistics/1065891/global-methanol-production-capacity/ (accessed on 5 January 2020).
  37. Joshi, A. 160,000 Jobs can be Created by Manufacturing Petrochems Using Green Methanol: CEEW. ETEnergyWorld. 17 October 2019. Available online: https://energy.economictimes.indiatimes.com/news/oil-and-gas/160000-jobs-can-be-created-by-manufacturing-petrochems-using-green-methanol-ceew/71423985 (accessed on 12 December 2019).
  38. Bassani, A.; Bozzano, G.; Pirola, C.; Ranzi, E.; Pierucci, S.; Manenti, F. Low Impact Methanol Production from Sulfur Rich Coal Gasification. Energy Procedia 2017, 105, 4519–4524. [Google Scholar] [CrossRef]
  39. Wang, X. Sustainable Clean Coal Technology with Power and Methanol Production. Chem. Biomol. Eng. Theses Diss. Stud. Res. 2017, 30. [Google Scholar]
  40. Liu, Z. Economic analysis of methanol production from coal/biomass upgrading. Energy Sources Part. B Econ. Plan. Policy 2018, 13, 66–71. [Google Scholar] [CrossRef]
  41. Blumberg, T.; Tsatsaronis, G.; Morosuk, T. On the economics of methanol production from natural gas. Fuel 2019, 256, 115824. [Google Scholar] [CrossRef]
  42. Yang, S.; Chen, Q.; Liu, Z.; Wang, Y.; Tang, Z.; Sun, Y. Performance analysis of the wind energy integrated with a natural-gas-to-methanol process. Energy Convers. Manag. 2018, 173, 735–742. [Google Scholar] [CrossRef]
  43. Yang, S.; Li, B.; Zheng, J.; Kankala, R.K. Biomass-to-Methanol by dual-stage entrained flow gasification: Design and techno-economic analysis based on system modeling. J. Clean. Prod. 2018, 205, 364–374. [Google Scholar] [CrossRef]
  44. Liu, Z.; Peng, W.; Motahari-Nezhad, M.; Shahraki, S.; Beheshti, M. Circulating fluidized bed gasification of biomass for flexible end-use of syngas: A micro and nano scale study for production of bio-methanol. J. Clean. Prod. 2016, 129, 249–255. [Google Scholar] [CrossRef]
  45. Roode-Gutzmer, Q.I.; Kaiser, D.; Bertau, M. Renewable Methanol Synthesis. ChemBioEng Rev. 2019, 6, 209–236. [Google Scholar] [CrossRef]
  46. Borgogna, A.; Salladini, A.; Spadacini, L.; Pitrelli, A.; Annesini, M.C.; Iaquaniello, G. Methanol production from Refuse Derived Fuel: Influence of feedstock composition on process yield through gasification analysis. J. Clean. Prod. 2019, 235, 1080–1089. [Google Scholar] [CrossRef] [Green Version]
  47. Borgwardt, R.H. Transportation fuel from cellulosic biomass: A comparative assessment of ethanol and methanol options. Proc. Inst. Mech. Eng. Part A J. Power Energy 1999, 213, 399–407. [Google Scholar] [CrossRef]
  48. Andres Soria, J.; McDonald, A.G. Liquefaction of Softwoods and Hardwoods in Supercritical Methanol: A Novel Approach to Bio-Oil Production. In Biomass Conversion; Baskar, C., Baskar, S., Dhillon, R., Eds.; Springer: Berlin/Heidelberg, Germany, 2012. [Google Scholar] [CrossRef]
  49. Franca, R.G.; Souza, P.A.; Lima, E.R.; Costa, A.L. An extended techno-economic analysis of the utilization of glycerol as an alternative feedstock for methanol production. Clean Technol. Environ. Policy 2017, 19, 1855–1865. [Google Scholar] [CrossRef]
  50. Zhang, C.; Jun, K.W.; Gao, R.; Kwak, G.; Park, H.G. Efficient Way of Carbon Dioxide Utilization in a Gas-to-Methanol Process: From Fundamental Research to Industrial Demonstration. Top. Catal. 2018, 61, 1794–1809. [Google Scholar] [CrossRef]
  51. Hank, C.; Gelpke, S.; Schnabl, A.; White, R.J.; Full, J.; Wiebe, N.; Smolinka, T.; Schaadt, A.; Henning, H.-M.; Hebling, C. Economics carbon dioxide avoidance cost of methanol production based on renewable hydrogen and recycled carbon dioxide—Power-to-methanol. Sustain. Energy Fuels 2018, 2, 1244–1261. [Google Scholar] [CrossRef]
  52. Bergins, C.; Fox, E.L.; Tran, K.C.; Wuebben, P. Commercialization of Low Carbon Methanol. ATZextra Worldw. 2016, 21, 22–25. [Google Scholar] [CrossRef]
  53. Ishaq, H.; Dincer, I. Evaluation of a wind energy based system for co-generation of hydrogen and methanol production. Int. J. Hydrogen Energy 2020. [Google Scholar] [CrossRef]
  54. Perathoner, S.; Centi, G. CO2 Recycling: A Key Strategy to Introduce Green Energy in the Chemical Production Chain. Chem. Sus. Chem. 2014, 7, 1274–1282; [Google Scholar] [CrossRef]
  55. Bonura, G.; Cannilla, C.; Frusteri, L.; Catizzone, E.; Todaro, S.; Migliori, M.; Giordano, G.; Frusteri, F. Interaction effects between CuO-ZnO-ZrO2 methanol phase and zeolite surface affecting stability of hybrid systems during one-step CO2 hydrogenation to DME. Catal. Today 2020, 345, 175–182. [Google Scholar] [CrossRef]
  56. Catizzone, E.; Bonura, G.; Migliori, M.; Frusteri, F.; Giordano, G. CO2 Recycling to Dimethyl Ether: State-of-the-Art and Perspectives. Molecules 2018, 23, 31. [Google Scholar] [CrossRef] [Green Version]
  57. Dolan, G. Fuel Application for Methanol. In Proceedings of the HIS World Methanol Conference, Berlin, Germany, 5 October 2019; Available online: https://www.methanol.org/wp-content/uploads/2019/10/Fuel-Applications-for-Methanol-IHS-2019.pdf (accessed on 12 February 2020).
  58. Fayyazbakhsh, A.; Pirouzfar, V. Comprehensive overview on diesel additives to reduce emissions, enhance fuel properties and improve engine performance. Renew. Sustain. Energy Rev. 2017, 74, 891–901. [Google Scholar] [CrossRef]
  59. Yusri, I.M.; Mamat, R.; Najafi, G.; Razman, A.; Awad, O.I.; Azmi, W.H.; Ishak, W.F.W.; Shaiful, A.I.M. Alcohol based automotive fuels from first four alcohol family in compression and spark ignition engine: A review on engine performance and exhaust emissions. Renew. Sustain. Energy Rev. 2017, 77, 169–181. [Google Scholar] [CrossRef] [Green Version]
  60. Kumar, M.S.; Nataraj, G.; Arulselvan, S. A comprehensive assessment on the effect of high octane fuels induction on engine’s combustion behaviour of a Mahua oil based dual fuel engine. Fuel 2017, 199, 176–184. [Google Scholar] [CrossRef]
  61. Yates, A.; Bell, A.; Swarts, A. Insights relating to the autoignition characteristics of alcohol fuels. Fuel 2010, 89, 83–93. [Google Scholar] [CrossRef]
  62. Goncharuk, A.G.; Havrysh, V.I.; Nitsenko, V.S. National features for alternative motor fuels market. Int. J. Energy Technol. Pol. 2018, 14, 226–249. [Google Scholar] [CrossRef]
  63. Cherednichenko, O.; Havrysh, V.; Shebanin, V.; Kalinichenko, A.; Mentel, G.; Nakonieczny, J. Local Green Power Supply Plants Based on Alcohol Regenerative Gas Turbines: Economic and Environmental Aspects. Energies 2020, 13, 2156. [Google Scholar] [CrossRef]
  64. Zhao, K. Methanol Fuel Blending in China. Trinidad and Tobago Methanol Forum. 24 January 2019. Available online: https://www.methanol.org/wp-content/uploads/2019/02/6.-Kai-Zhao-Methanol-Fuel-Blending-in-China.pdf (accessed on 14 March 2020).
  65. Avenues for Collaboration. Recommendations for US—China Transportation Fuel Cooperation. United State Energy Security Council. 2015. Available online: http://www.iags.org/USChinaFC.pdf (accessed on 3 March 2020).
  66. Winther, K. Methanol as Motor Fuel. IEA-AMF Annex 56. Danish Technological Institute. 2019. Available online: http://danskbiomethanol.dk/Papers/Report%20DK.pdf (accessed on 29 March 2020).
  67. Dolan, G. Overview of Global Methanol Fuel Blending, Trinidad and Tobago Methanol Fuel Blending Forum. 24 January 2019. Available online: https://www.methanol.org/wp-content/uploads/2019/02/4.-Greg-Dolan-Overview-of-Global-Methanol-Fuel-Blending.pdf (accessed on 13 February 2020).
  68. Gumpert Presents Serial-Ready Methanol Fuel Cell. Available online: https://www.electrive.com/2019/11/08/gumpert-presents-serial-ready-methanol-fuel-cell/ (accessed on 29 March 2020).
  69. Yao, C.; Cheung, C.S.; Cheng, C.; Wang, Y.; Chan, T.L.; Lee, S.C. Effect of Diesel/methanol compound combustion on Diesel engine combustion and emissions. Energy Convers. Manag. 2008, 49, 1696–1704. [Google Scholar] [CrossRef]
  70. Methanol for Power Generation: A White Paper. ADI Analytics. Energy Insight and Consulting. September 2017. Available online: https://adi-analytics.com/wp-content/uploads/2017/09/ADI-MTP-White-Paper-Sep-2017-vf.pdf (accessed on 17 March 2020).
  71. China Gasoline Prices. Available online: https://tradingeconomics.com/china/gasoline-prices (accessed on 14 March 2020).
  72. Methanex Posts Regional Contract Methanol Prices for North America, Europe and Asia. Available online: https://www.methanex.com/our-business/pricing (accessed on 10 February 2020).
  73. Balussou, D. An Analysis of Current and Future Electricity Production from Biogas in Germany; Karlsruhe Institute of Technology: Karlsruhe, Germany, 2018; Available online: https://publikationen.bibliothek.kit.edu/1000084909 (accessed on 12 February 2020).
  74. Kalinichenko, A.; Havrysh, V.; Atamanyuk, I. The Acceptable Alternative Vehicle Fuel Price. Energies 2019, 12, 3889. [Google Scholar] [CrossRef] [Green Version]
  75. Shacman SX3317DR456HM Methanol/Diesel Dual Fuel Dump Truck Manufactured by Shaanxi Automobile Group Co.; Ltd. Available online: http://shaanxi.su/en/auto/sx/shacman-sx3317dr456hm.html (accessed on 20 March 2020).
  76. Sinotruk Howo ZZ3257N3847D1M Methanol/Diesel Dual Fuel Dump Truck Manufactured by Sinotruk Jinan Truck Co.; Ltd. Available online: http://howo.biz/howo/zz/sinotruk-howo-zz3257n3847d1m.html (accessed on 20 March 2020).
  77. Global Petrol Prices. Available online: https://www.globalpetrolprices.com/diesel_prices/ (accessed on 20 March 2020).
  78. Broeren, M. Production of Bio-Methanol: Technology Brief. IRENA. 2013. Available online: https://irena.org/publications/2013/Jan/Production-of-Bio-methanol (accessed on 30 May 2020).
  79. Giuliano, A.; Catizzone, E.; Barisano, D.; Nanna, F.; Villone, A.; De Bari, I.; Cornacchia, G.; Braccio, G. Towards Methanol Economy: A Techno-environmental Assessment for a Bio-methanol OFMSW/Biomass/Carbon Capture-based Integrated Plant. Int. J. Heat Technol. 2019, 37, 665–674. [Google Scholar] [CrossRef]
  80. Giuliano, A.; Catizzone, E.; Freda, C.; Cornacchia, G. Valorization of OFMSW Digestate-Derived Syngas toward Methanol, Hydrogen, or Electricity: Process Simulation and Carbon Footprint Calculation. Processes 2020, 8, 526. [Google Scholar] [CrossRef]
  81. Hobson, C.; Márquez, C. Renewable Methanol Report. Methanol Institute. December 2018. Available online: https://www.methanol.org/wp-content/uploads/2019/01/MethanolReport.pdf (accessed on 3 March 2020).
  82. Law, K.; Rosenfeld, J.; Jackson, M. Methanol as a Renewable Energy Resource; White Paper; TIAX LLCL: Cupertino, CA, USA, 2013; Available online: https://mafiadoc.com/queue/white-paper-methanol-as-a-renewable-energy-resource_59f9e63b1723dd8aab15caac.html (accessed on 29 March 2020).
  83. Su, L.W.; Li, X.R.; Sun, Z.Y. The consumption, production and transportation of methanol in China: A review. Energy Policy 2013, 63, 130–138. [Google Scholar] [CrossRef]
  84. Boulamanti, A.; Moya, J.A. Production costs of the chemical industry in the EU and other countries: Ammonia, methanol and light olefins. Renew. Sustain. Energy Rev. 2017, 68, 1205–1212. [Google Scholar] [CrossRef]
  85. Bozzano, G.; Manenti, F. Efficient methanol synthesis: Perspectives, technologies and optimization strategies. Prog. Energy Combust. Sci. 2016, 56, 71–105. [Google Scholar] [CrossRef]
  86. Deforestation Statistics for China. Available online: https://rainforests.mongabay.com/deforestation/archive/China.htm (accessed on 8 April 2020).
  87. Havrysh, V.; Kalinichenko, A.; Minkova, O.; Lyashenko, S. Agricultural feedstock for solid and liquid biofuel production in Ukraine: Cluster analysis. Procedia Environ. Sci. Eng. Manag. 2019, 6, 649–658. Available online: http://procedia-esem.eu/pdf/issues/2019/no4/73_Havrysh_19.pdf (accessed on 18 April 2020).
  88. Jiang, Y.; Havrysh, V.; Klymchuk, O.; Nitsenko, V.; Balezentis, T.; Streimikiene, D. Utilization of Crop Residue for Power Generation: The Case of Ukraine. Sustainability 2019, 11, 7004. [Google Scholar] [CrossRef] [Green Version]
  89. Zhang, H.; Wang, L.; Van herle, J.; Maréchal, F.; Desideri, U. Techno-Economic Optimization of CO2-to-Methanol with Solid-Oxide Electrolyzer. Energies 2019, 12, 3742. [Google Scholar] [CrossRef] [Green Version]
  90. Netherlands Environmental Assessment Agency. Trends in Global CO2 Emissions: 2016 Report. Available online: https://edgar.jrc.ec.europa.eu/news_docs/jrc-2016-trends-in-global-co2-emissions-2016-report-103425.pdf (accessed on 29 March 2020).
  91. Asif, M.; Gao, X.; Lv, H.; Xi, X.; Dong, P. Catalytic hydrogenation of CO2 from 600 MW supercritical coal power plant to produce methanol: A techno-economic analysis. Int. J. Hydrogen Energy 2018, 43, 2726–2741. [Google Scholar] [CrossRef]
  92. Rubin, E.S.; Davison, J.E.; Herzog, H.J. The cost of CO2 capture and storage. Int. J. Greenh. Gas. Control. 2015, 40, 378–400. [Google Scholar] [CrossRef]
  93. Anicic, B.; Trop, P.; Goricanec, D. Comparison between two methods of methanol production from carbon dioxide. Energy 2014, 77, 279–289. [Google Scholar] [CrossRef]
  94. IRENA. Renewable Power Generation Costs in 2018; International Renewable Energy Agency: Abu Dhabi, UAE, 2019; Available online: https://www.irena.org/-/media/Files/IRENA/Agency/Publication/2019/May/IRENA_Renewable-Power-Generations-Costs-in-2018.pdf (accessed on 3 January 2020).
  95. GWEC. Global Wind Report 2019. 2019. Available online: https://gwec.net/global-wind-report-2019/ (accessed on 8 April 2020).
  96. Qinghe Wastewater Treatment Plant. Available online: https://www.water-technology.net/projects/qinghewatertreatment/ (accessed on 8 April 2020).
  97. Lu, J.-Y.; Wang, X.-M.; Liu, H.-Q.; Yu, H.-Q.; Li, W.-W. Optimizing operation of municipal wastewater treatment plants in China: The remaining barriers and future implications. Environ. Int. 2019, 129, 273–278. [Google Scholar] [CrossRef]
  98. Li, H.; Feng, K. Life cycle assessment of the environmental impacts and energy efficiency of an integration of sludge anaerobic digestion and pyrolysis. J. Clean. Prod. 2018, 195, 476–485. [Google Scholar] [CrossRef]
  99. Cano, R.; Perez-Elvira, S.I.; Fdz-Polanco, F. Energy feasibility study of sludge pretreatments: A review. Appl. Energy 2015, 149, 176–185. [Google Scholar] [CrossRef]
  100. Halaby, A.; Ghoneim, W.; Helal, A. Sensitivity analysis and comparative studies for energy sustainability in sewage treatment. Sustain. Energy Technol. Assess. 2017, 19, 42–50. [Google Scholar] [CrossRef]
  101. Yang, G.; Zhang, G.; Wang, H. Current state of sludge production, management, treatment and disposal in China. Water Res. 2015, 78, 60–73. [Google Scholar] [CrossRef] [PubMed]
  102. Kiselev, A.; Magaril, E.; Magaril, R.; Panepinto, D.; Ravina, M.; Zanetti, M.C. Towards Circular Economy: Evaluation of Sewage Sludge Biogas Solutions. Resources 2019, 8, 91. [Google Scholar] [CrossRef] [Green Version]
  103. Qu, J.; Wang, H.; Wang, K.; Yu, G.; Ke, B.; Yu, H.Q.; Ren, H.; Zheng, X.; Li, J.; Li, W.W.; et al. Municipal wastewater treatment in China: Development history and future perspectives. Front. Environ. Sci. Eng. 2019, 13, 88. [Google Scholar] [CrossRef]
  104. Tyagi, K.V.; Fdez-Güelfo, L.A.; Zhou, Y.; Álvarez-Gallego, C.J.; Romero Garcia, L.I.; Nga, W.J. Anaerobic co-digestion of organic fraction of municipal solid waste (OFMSW): Progress and challenges. Renew. Sustain. Energy Rev. 2018, 93, 380–399. [Google Scholar] [CrossRef]
  105. Zhang, Q.H.; Yang, W.N.; Ngo, H.H.; Guo, W.S.; Jin, P.K.; Dzakpasu, M.; Yang, S.J.; Wang, Q.; Wang, X.C.; Ao, D. Current status of urban wastewater treatment plants in China. Environ. Int. 2016, 92–93, 11–22. [Google Scholar] [CrossRef]
  106. Von Friesen, M.P.; Odhner, P.; Arnell, M.; Svensson, M.; Ivarsson, P.; Jannasch, A.-K.; Boss, A.; Hjornhede, A. More Efficient Use of Biogas at Waste Water Treatment Plants. Report 2018:476. Available online: https://energiforskmedia.blob.core.windows.net/media/24303/more-efficient-use-of-biogas-at-waste-water-treatment-plants-energiforskrapport-2018–476.pdf (accessed on 8 April 2020).
  107. Iaquaniello, G.; Centi, G.; Salladini, A.; Palo, E.; Perathoner, S.; Spadaccini, L. Waste-to-methanol: Process and economics assessment. Bioresour. Technol. 2017, 243, 611–619. [Google Scholar] [CrossRef]
  108. The Rise, Rise, Rise of Bio-Methanol for Fuels and Chemical Markets. Available online: http://www.biofuelsdigest.com/bdigest/2018/01/24/the-rise-rise-rise-of-bio-methanol-for-fuels-and-chemical-markets/ (accessed on 29 March 2020).
  109. National Bureau of Statistics of China. Collection, Transport and Disposal of Consumption Waste in Cities. 2018. Available online: http://data.stats.gov.cn/easyquery.htm?cn=C01 (accessed on 29 March 2020).
  110. Ji, L.; Lu, S.; Yang, J.; Du, C.; Chen, Z.; Buekens, A.; Yan, J. Municipal solid waste incineration in China and the issue of acidification: A review. Waste Manag. Res. 2016, 34, 280–297. [Google Scholar] [CrossRef]
  111. Morandin, M.; Harvey, S. Methanol via Biomass Gasification. Department of Energy and Environment Division of Industrial Energy Systems and Technologies, Chalmers University of Technology, Göteborg, Sweden. 2015. Available online: https://publications.lib.chalmers.se/records/fulltext/218484/local_218484.pdf (accessed on 29 March 2020).
Figure 1. Global and China methanol production.
Energies 13 03113 g001
Figure 2. Global methanol consumption as fuel.
Energies 13 03113 g002
Figure 3. Methanol utilization as vehicle fuel.
Energies 13 03113 g003
Figure 4. Specific tank-to-wheel carbon dioxide emissions.
Energies 13 03113 g004
Figure 5. Carbon dioxide emissions per 100 km.
Energies 13 03113 g005
Figure 6. Carbon dioxide emissions per 100 km for diesel methanol compound combustion (DMCC) system.
Energies 13 03113 g006
Figure 7. Selected fuel prices.
Energies 13 03113 g007
Figure 8. Energy cost.
Energies 13 03113 g008
Figure 9. Methanol/petrol prices ratio.
Energies 13 03113 g009
Figure 10. M15/petrol prices ratio.
Energies 13 03113 g010
Figure 11. Methanol to diesel fuel price ratio: actual, maximum acceptable.
Energies 13 03113 g011
Figure 12. Methanol-based fuel production and utilization.
Energies 13 03113 g012
Figure 13. Renewable methanol production.
Energies 13 03113 g013
Figure 14. Onshore wind farm installations and electricity generation history.
Energies 13 03113 g014
Figure 15. Biomethanol production.
Energies 13 03113 g015
Figure 16. Municipal solid waste collected.
Energies 13 03113 g016
Figure 17. Potential production of MSW-based methanol.
Energies 13 03113 g017
Table 1. Physical and chemical properties of selected fuels.
PropertiesUnitDieselGasolineMethanol
Densitykg/m3840740796
Cetane number->40 <5
Octane number--95-
Boiling pointK453–643298–488338
Lower heating valueMJ/kg42.54419.67
Stoichiometric air–fuel ratio-14.614.76.45
Heat of vaporizationkJ/kg243180–3501100
Viscosity cSt4.590.570.65
Auto-ignition temperatureK503465–743736
Carbon content by mass%858637.5
Hydrogen content by mass%151412.5
Oxygen content by mass%0050
Specific carbon dioxide emissiong/MJ73.3373.9568.44
Table 2. Well-to-tank (WTT) carbon dioxide emissions for selected fuels.
FuelWTT Carbon Dioxide Emissions (g CO2-eq/kg)References
MinimumMaximum
Diesel fuel2841020[57]
Gasoline 294.81188[57]
Natural gas909.51290.9[57,58,59,60]
Biomethanol (biomass and renewable electricity)−898[61]
Methanol (coal)2965[61]
Bioethanol −1493−352[62]

