1. Introduction
In 2017, South Korea was the ninth largest energy consumer in the world, which means that a supply and demand structure is very vulnerable to energy security [
1]. Dependence of energy on imports can have a detrimental effect on the country’s economy, according to the situation of energy producers. Consequently, the South Korean government has come up with and implemented low-carbon, green growth, energy transition policies to mitigate reliance on fossil fuels and join and lead the trend of global climate change efforts and green growth initiatives. The important key of low-carbon, green growth, energy transition is the renewable energy sector [
2].
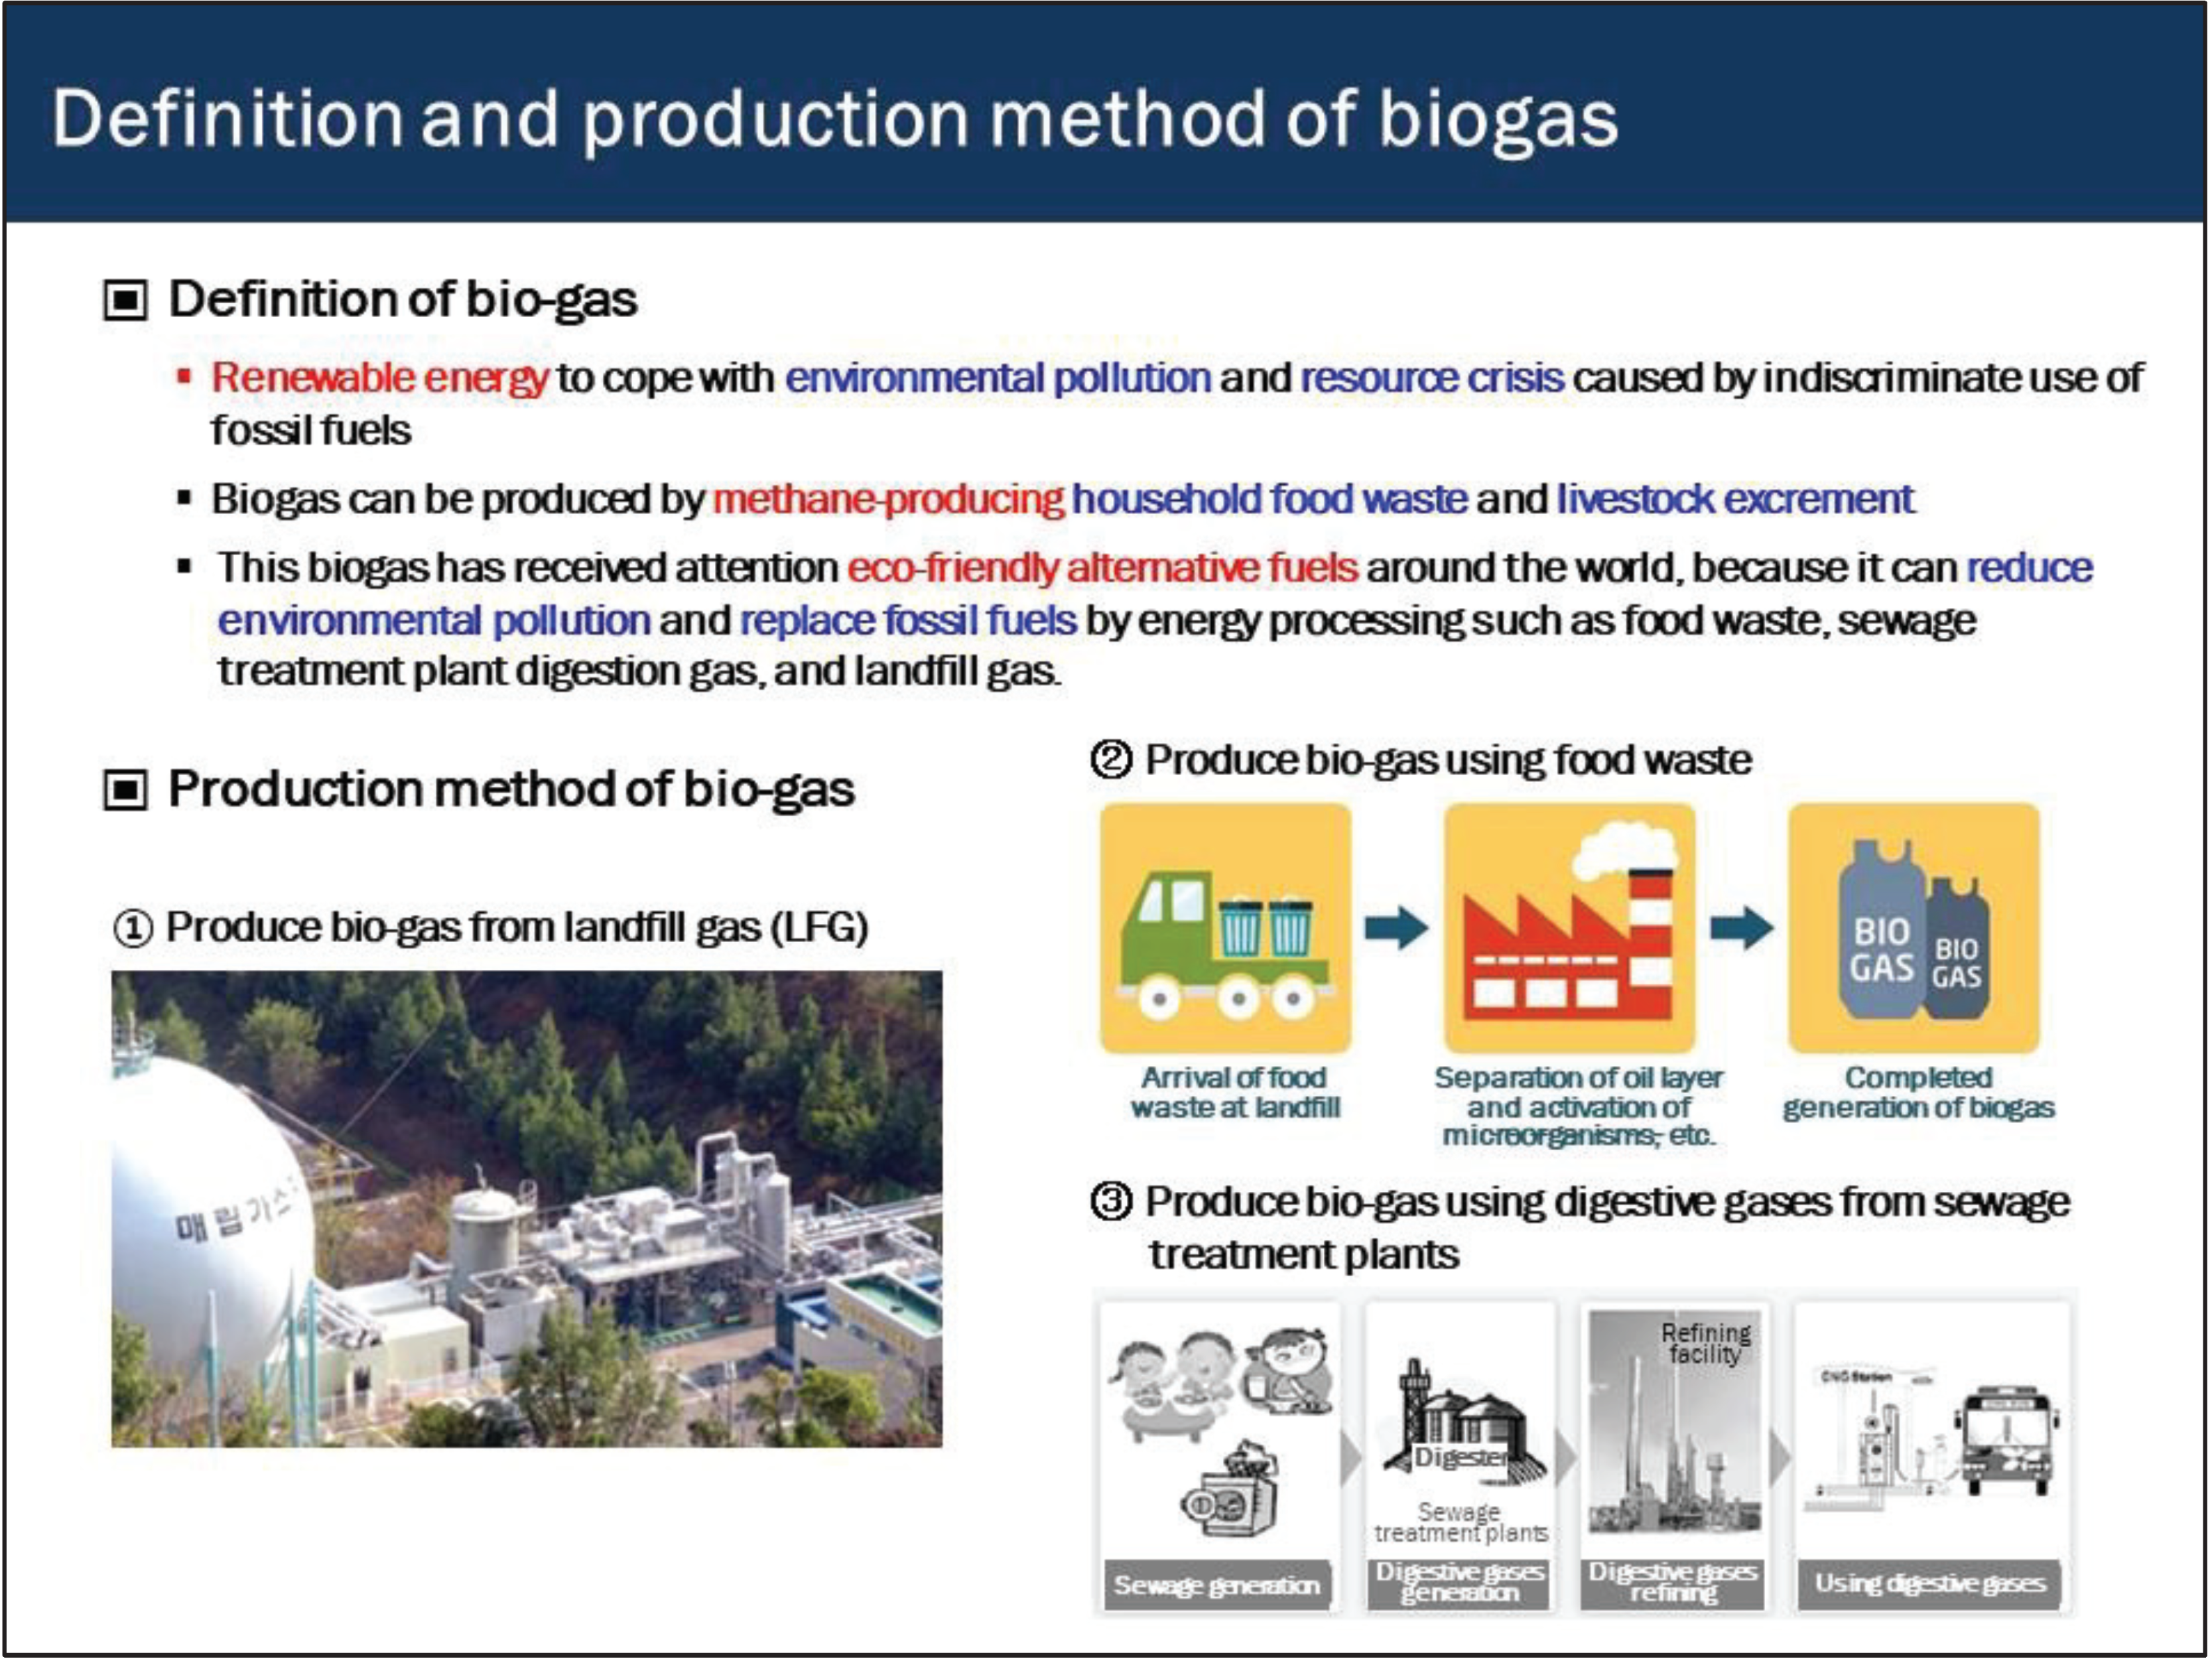
Recently, bio-gas (BG) has received attention worldwide as a renewable energy that can substitute natural gas (NG), a fossil fuel. In South Korea, various methods for utilizing BG have been developed and tried, and BG, which has been utilized mainly for power generation, is now being used for city gas, automobile fuel, fuel cell, and steam production [
3,
4]. BG is made up of mainly food waste from households, livestock excretions, and organic waste generated from industrial processes. The treated organic waste is decomposed by microorganisms and converted into BG in an oxygen-free environment. BG comprises mainly methane and does not generate carbon dioxide (CO
2). Renewable methane (RM) is the methane obtained from BG after separation of carbon dioxide and purification to make it injectable into the NG.
With these characteristics, RM can be supplied to each household through existing residential NG pipelines or new pipelines for the supply of RM and used as heating or cooking fuel. Although the production cost of RM is higher than that of NG, RM has advantages as domestic energy, not as imported energy, and has the effect of reducing CO
2 emissions by treating waste in the production process [
5,
6,
7]. Therefore, South Korea attempts to encourage the substitution of NG with RM, as BG can be produced by handling organic wastes economically or capturing BG from sewage treatment plants.
As part of its low-carbon, green growth policy, the government has set up a system to utilize organic waste as BG; thereby, the substitution rate of NG by RM has been increasing [
8,
9]. More specifically, BG-producing companies, BG-providing companies, and local governments have worked closely with each other to produce BG and supply it to consumers. Some city gas companies supply RM to consumers by mixing it with NG within existing residential NG pipeline networks, while others supply RM by building their own RM pipeline networks.
BG production facilities have been increasing and will continue to increase in the future [
10]. The RM produced will be supplied to each household through the city gas grid for residential use, such as cooking and heating [
11]. However, RM supply costs may be higher than NG supply costs. High supply costs will eventually result in higher city gas charges. Thus, in order to expand RM supply, consumers’ acceptance of a higher price becomes an important issue. The government needs this information. In other words, information about whether households place more value on RM than NG or not and how much additional value is being given to RM compared to existing city gas charges is being requested. The additional willingness to pay (WTP) for RM over NG implies a price premium for RM compared to NG.
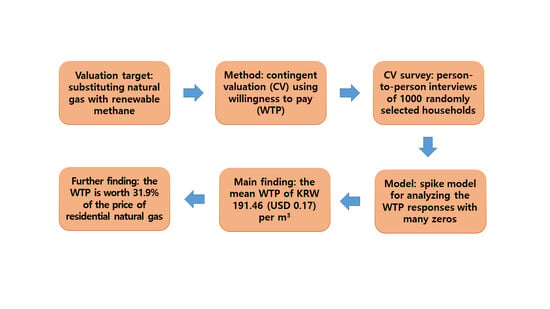
This article aims to explore South Korean households’ WTP for substituting residential NG with RM, employing a contingent valuation (CV), with a survey of 1000 interviewees undertaken across the country. More specifically, the article seeks to estimate the amount of additional WTP for substituting one m3 consumption of NG with that of RM. For the purpose of eliciting the WTP response, the dichotomous choice question method of asking an interviewee if she/he intends to pay an offered bid was adopted. Moreover, a spike model, which is capable of allowing for zero WTP, was utilized.
Since the methods of modeling and analyzing CV data statistically are standardized to a considerable degree in the literature, it may be better to implement standardized CV application procedures well than to make new methodological attempts in relation to applying CV and analyzing the CV data in terms of unarguably utilizing the results of the analysis in policy assessment. Therefore, the objective of this study is not to develop a new CV analysis model or method, but to analyze the consumers’ additional WTP for renewable methane, which has not been covered well in the literature. This paper hereby seeks to add one contribution to the literature of CV application in the bioenergy field.
The implications of the study will be more useful because the government is seeking information about households’ acceptance of RM. The remainder of this paper comprises three sections.
Section 2 deals with materials and methods adopted in the study. More specifically, literature review, CV method, survey questionnaire composition, implementation of the survey, collection of data, and statistical model of dealing with the CV data are described in the section. The estimation results and discussion of them are reported in
Section 3. The conclusions are addressed in
Section 4.
2. Materials and Methods
2.1. A Brief Literature Review
Since the Kyoto Protocol, research has been actively carried out on the benefits from renewable energy resources, and the stated preference (SP) approach has been used in most studies [
12]. Among the SP approaches, CV and choice experiment (CE) were widely used.
Table 1 reports the main findings from the former studies. Dogan and Muhammad [
13] assessed that WTP for a 20% portion of renewable energy and a 30% percentage of renewable energy was 4.35 Turk Lirasi (TL) and 6.03 TL per month per household respectively, in Turkey. Numerous studies for South Korea have also been conducted on bioenergy, which is part of renewable energy. For example, Lim et al. [
14] and Kim et al. [
15] investigated public WTP for bioethanol and biogas respectively, using CV. Kim et al. [
16] and Kim et al. [
17] assessed households’ WTP for marine biodiesel and bioethanol respectively, applying CE. Solomon and Johnson [
18] estimated WTP for biomass as USD 556 per individual per year using CV.
2.2. CV Method
Non-market goods usually do not have a price because they are not traded in the market [
19]. For example, market data on non-market goods, such as clean air, urban parks, public investment projects affecting the environment, and so on, are difficult to obtain, and thus the price for them is not well formed. The same is true of the good under evaluation in this study, substituting residential NG with RM. Consequently, economic techniques designed for assessing a non-market good should be applied here. These economic techniques are divided into the SP and the revealed preference (RP) approaches [
20,
21]. The former uses the data that appears as a result of a person’s behavior, while the latter uses the data obtained by asking a person about her or his preference.
The RP approach is sometimes considered more reliable than the SP approach in that the former only requires observing people’s behavior without having to ask people about their preferences. However, the RP approach is quite restrictive because there are only a limited number of objects to which the RP approach can be applied. It is difficult to employ the RP approach, especially in achieving the objective of this study. On the other hand, the SP approach has no restrictions and can be applied to objects to which the RP cannot be applied [
22]. Thus, this study strives to adopt the SP approach. The SP approach is made up of CV and CE approaches. Both approaches have their own merits and demerits. Particularly, in order to apply the latter, the non-market goods to be investigated must consist of a variety of attributes, which must be well defined and meaningful as they are well recognized by the public, which is the subject of the valuation.
The CV approach is employed in this study because several attributes are not properly defined for substituting residential NG with RM. The reliability and validity of the approach were thoroughly verified in the literature [
23,
24,
25,
26]. CV collects data by asking people about their preferences through a survey and then analyzes the collected data [
27]. Therefore, applied CV researchers should have a good understanding of the non-market good to be valued and be able to create questionnaires that help people understand and value the good [
28,
29]. It would be better for the CV researcher to refer the survey to a professional research firm rather than to conduct it on her/his own. After collecting data, the researchers should apply economic and econometric theories to the data and obtain results. The survey questionnaire composition, the survey implementation, the data collection, and the statistical model of dealing with the CV data will be described below.
2.3. Survey Questionnaire Composition
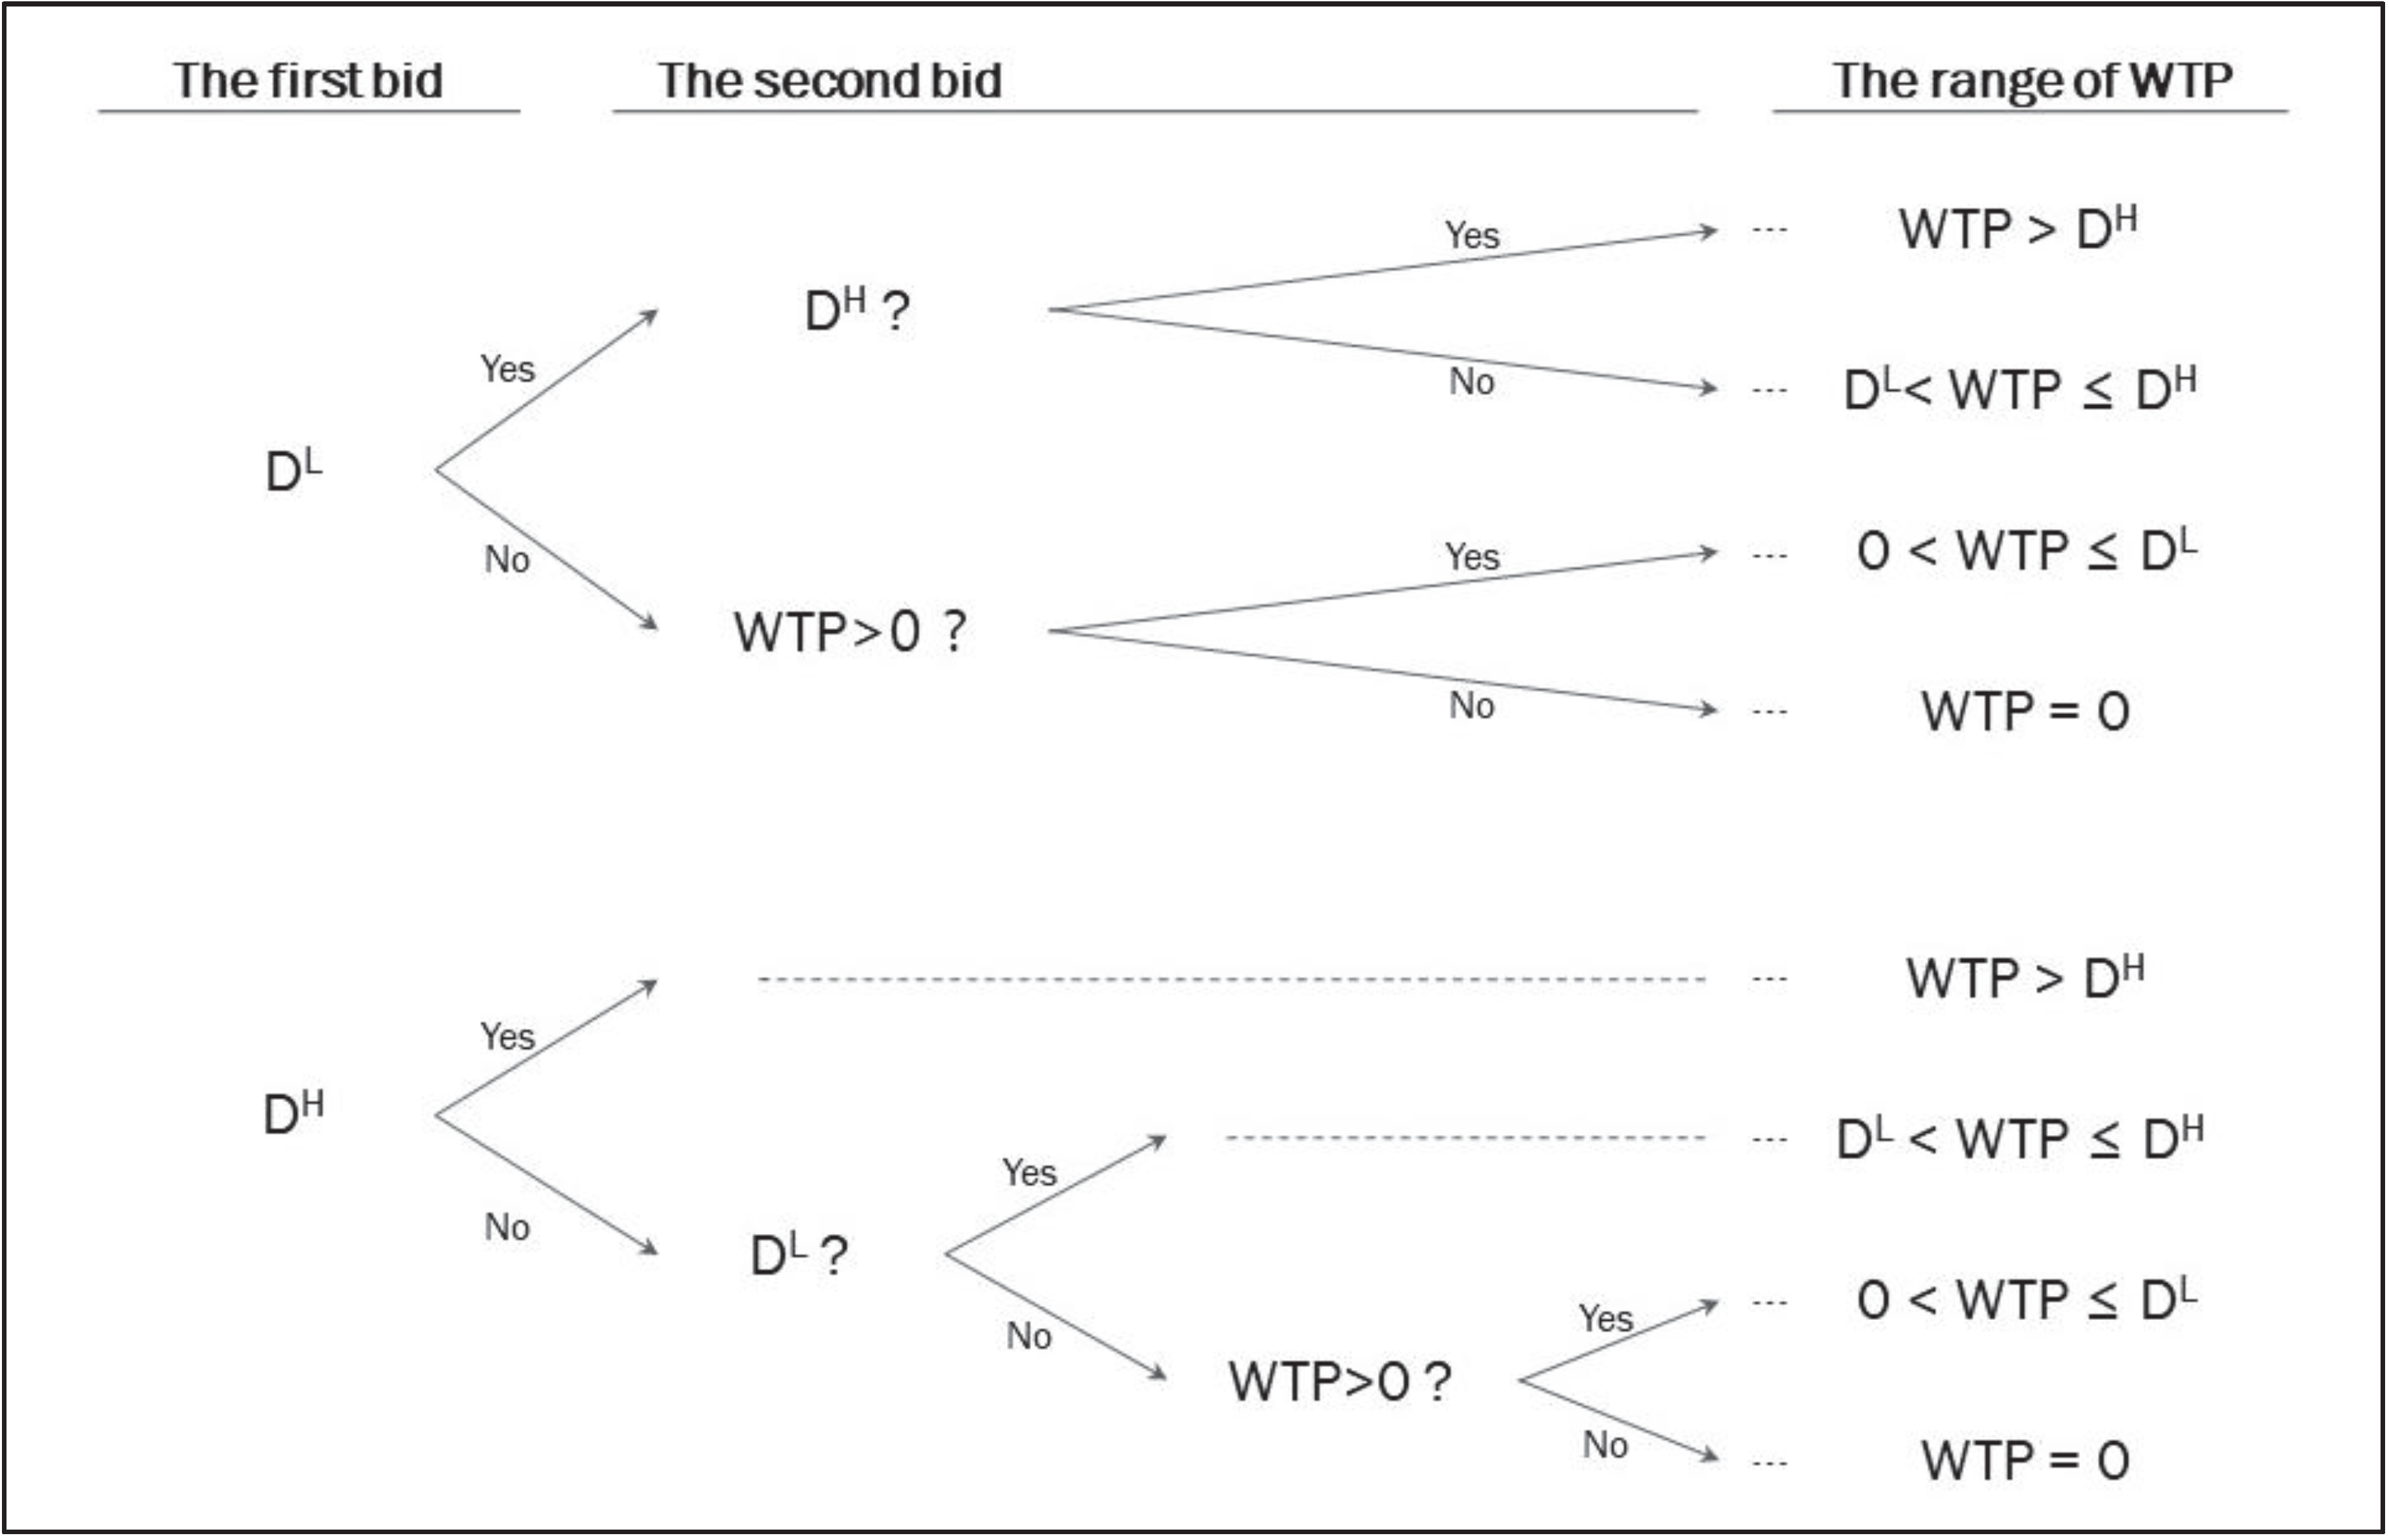
The survey questionnaire is largely composed of three components. The first component describes the background and objective of the survey to the respondents, and then asks certain questions about their information. In the second component, a detailed explanation of the good under valuation is made to the respondents, and then some questions are asked about their WTP. The third part asks questions about the socioeconomic variables of interviewees and their households. The second part is the core of the survey instrument. The main part of the survey questionnaire used in the CV survey and visual aids used to describe BG to respondents are presented in
Figure A1 and
Figure A2 in the
Appendix A, respectively.
When describing the good in the second part, three things should be clearly presented and explained [
30,
31]. First, the reference state (S
0) in which the project to be assessed has not yet been enforced should be defined. Second, the expected target state (S
1) after the project is enforced should be described. Third, effective policy measures to move from the S
0 to S
1 should be reported. The object for eliciting WTP responses should be exactly a move from S
0 to S
1. This means that S
0 and S
1 should be accurately presented and explained to the respondents so that they can evaluate the same object. The effective policy measures offered in the survey include: To fulfill the target state, the government plans to install 14 additional government-run bio-gasification facilities utilizing livestock excretions by 2022, and to operate bio-gasification facilities in conjunction with the existing composting plant and liquefied fertilizer tank.
Initial versions of the survey instrument drawn up by CV researchers should be refined through small focus group interviews. In this regard, a survey of the 30-member focus group was able to find parts that were unclear and/or difficult to figure out, and to refine the survey instrument more precisely. In addition, basic information for designing the bid amounts to be presented to the respondents could be collected through the focus group interviews. The focus group was formed by a professional survey company.
2.4. Implementation of the Survey
In order to collect CV data, the method of deriving the WTP from respondents, the payment vehicle, unit and period, the method of survey, and the sample size should be determined [
32]. First, out of four methods of open-ended questions, bidding game questions, payment card questions, and dichotomous choice (DC) questions, which have been used in the literature as a method of eliciting WTP, this study adopts the DC question method. This is because the DC question method has been most frequently employed in the literature and possesses various merits, such as incentive-compatibleness and mitigation of the respondents’ cognitive burden [
33]. Rather than requiring an answer to the level of WTP, it uses the method of asking interviewees if they intend to pay a particular amount. For this reason, the DC CV is also called the discrete CE [
26].
Second, the payment vehicle, unit, and period must be determined. There are two major alternatives to assessing the acceptability of substituting the use of residential NG with that of RM. First, NG is substituted by RM in terms of per-unit usage, not total usage. In other words, the household’s additional WTP for one m3 of RM use instead of the current one m3 of NG use is investigated. Second, NG is substituted by RM in terms of total usage, not per-unit usage—that is, the household’s additional WTP for monthly RM use instead of monthly NG use. This study adopts the first alternative for three reasons. First, it is difficult to convey the concept of additional payment for RM relative to the monthly NG bill to the households in the CV survey, as the rate level of NG use varies significantly depending on the month of use. This is because the pattern of heavy use in winter and low use in summer is clear in the residential NG consumption structure. Second, since the production of RM is limited, it is impossible to substitute all residential use of NG with RM—it is possible to substitute only some. Thus, it makes sense to ask additional WTP for RM on a per-unit basis rather than on a monthly basis. Third, since the information required by the government from this research result is a price premium of RM relative to NG per unit, the use of the first alternative is consistent with the requirement.
Third, the method of survey suitable for the object to be valued in this study should be determined. Postal surveys, telephone surveys, person-to-person surveys, and Internet surveys have been utilized in the literature. In this study, the person-to-person survey method was chosen. Although it is the most-costly of these four methods, it was able to convey sufficient information needed for the valuation and draw the attention of the respondents. Moreover, Arrow et al. [
34] suggested the adoption of the person-to-person survey method in applied CV work, and the Korea Development Institute [
35] in Sejong South Korea suggested a guideline of using the person-to-person survey in a CV study for South Korea. In addition, in conducting person-to-person interviews, interview experts belonging to professional survey companies visited the respondents’ homes instead of selecting respondents in crowded places, such as shopping malls.
Fourth, the sample size was 1000 in this study. The reason for this was that Arrow et al. [
34] and the Korea Development Institute [
35] recommended an appropriate sample size of 1000. Due to the development of modern statistics and sampling techniques, 1000 observations are known to reflect the information of the population accurately only if the survey is carried out properly [
34,
35]. Furthermore, in this study, a professional research firm, Research Prime, with extensive CV research experience and associated experts extracted sample households from the entire population. The unit of the survey is households, not individuals.
2.5. Collection of Data
As noted earlier, this study uses the DC question method to induce respondents’ WTP. There are various question formats within the DC question method. Examples include single-bounded (1B), double-bounded (2B), triple-bounded, and one-and one-half-bounded (1.5B) question formats. The latter was created by Cooper et al. [
36] to take advantage of the 1B question format and the 2B question format, while overcoming their disadvantages. In many recent CV studies, the 1.5B question format has been used [
37,
38,
39,
40,
41]. Meanwhile, a large proportion of interviewees may have zero WTP for various reasons. This is what happened in this study, as will be described later. Thus, this study combines the 1.5B question format and the spike model developed by Kriström [
42] and Yoo and Kwak [
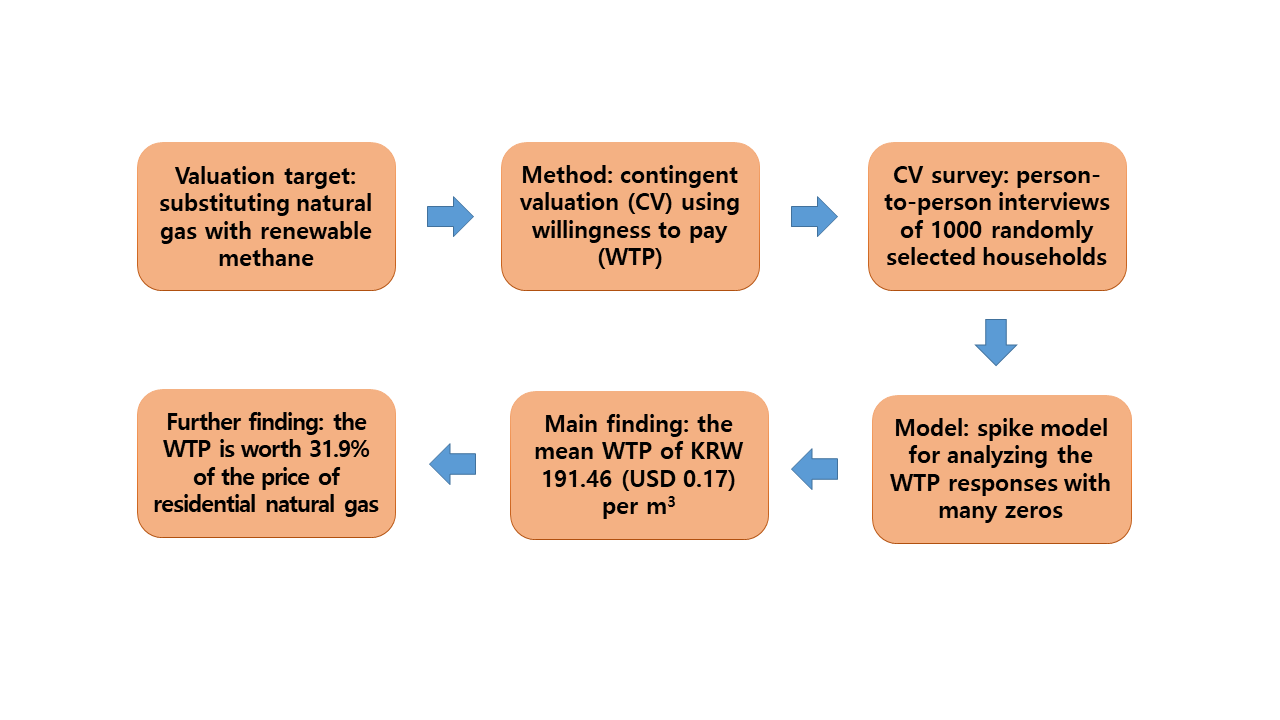
43] for reflecting zero WTP. The procedure of collecting CV data using the 1.5B spike model is explained as follows.
Several sets of two bids, and (), prepared by the focus group survey, are utilized. For example, if five sets were created, all respondents would be divided into five groups. Let WTP be for brevity. Within each group, the same set of bids is presented, with roughly half of respondents first asked whether they intend to pay . If they answer “yes,” they are further asked whether they intend to pay . Responding “yes” to this question will imply , responding “no” will mean . If they answer “no” to the payment of , they can be divided into = 0 responses and responses by additionally asking whether they intend to pay a little.
The remaining half of the interviewees are first asked whether they intend to pay
. Answering “yes” indicates
. If they respond “no,” an additional question is posed concerning whether they intend to pay
. Answering “yes” to this question will determine the response of
. If they say “no,” they are asked whether they intend to pay a little. The answer to this question allow us to identify which of
= 0 or
they belong to. Thus, there are a total of eight possible responses, as illustrated in
Figure 1, and the WTP responses collected from a CV survey undertaken during August 2018 are described in
Table 2.
2.6. Statistical Model of Dealing with the CV Data
This paper aims to analyze the DC CV data by adopting the utility difference approach presented in Hanemann [
44]. Haab and McConnell [
45] presented various models of handling the DC CV data. Let
indicate an interviewee for
. The binary variables associated with the eight responses described above can be defined as:
where
and
relate to the responses when
and
are suggested first respectively, and they are one when the statement given in parentheses is true and zero otherwise.
Employing the logistic function commonly used in the literature, the cumulative distribution of
,
, is as follows:
where
and
are parameters of
.
The log-likelihood function induced for the spike model takes the form:
Spike, which means the probability of
, is computed as
. The mean WTP, the most commonly used welfare measure [
46,
47], is calculated as
. The model with covariates can be introduced to see how some of the variables affect the probability of responding “yes” to the suggested amount. For this purpose,
in Equation (3) is substituted with
, where
and
denote covariates and their coefficients, respectively.
3. Results
3.1. Estimation Results of the Model
Table 3 presents the findings from estimating the model. By performing maximum likelihood estimation, we could obtain the parameter estimates for the model. Concerning the model specification test, the Wald statistic can be computed. The hypothesis to be tested is that the model is insignificant or meaningless. The statistic is 522.88. Its
p-value is 0.000, which implies that we can reject the hypothesis. Consequently, the model shows statistical significance. Interestingly, the estimate for the spike (0.3941) is close to the sample ratio of “no–no” and “no–no–no” answers (37.6%), which corroborated the usefulness of the spike model.
The estimate for mean household WTP was KRW 191.46 (USD 0.17) per m
3. The confidence intervals of the estimate for 95% and 99% levels can be calculated from the procedure shown in Krinsky and Robb’s [
48] paper. More specifically, 5000 replications of resampling the parameters from bi-variate normal distribution constructed with the estimation results of
and
produced these confidence intervals. Although this method has limitations that assume the two parameters follow bi-variate normal distribution, it has the advantage of making it relatively easy for researchers to obtain confidence intervals. In addition, performance is known to be better than simple methods of calculating confidence intervals using standard errors [
48].
Table 3 shows the computed confidence intervals.
3.2. Estimation Results of the Model with Covariates
The spike model reported above has no covariates except for constant term and bid amount. However, there can be other factors influencing the possibility of answering “yes” to a presented bid. Examples include the interviewee’s socio-economic variables such as age, gender, and education level. The interviewee’s household income is also one of the commonly used covariates. Thus, a model containing covariates can be introduced for investigating the impact that covariates have on the probability. Concerning the covariates, three variables that are related to the interviewees’ characteristics were selected. The basic information about the covariates employed is shown in
Table 4.
The results from estimating the model with covariates are described in
Table 5. Concerning the model specification test, the Wald statistic can be computed. The hypothesis to be tested is that the model is insignificant or meaningless. The statistic is 519.07. Its
p-value is 0.000, which implies that the hypothesis can be rejected. All the estimated values show statistical significance. If the sign of the estimated coefficient for a particular variable is positive, the larger the value of that variable, and the more likely it is to report “yes” to a given bid amount. For instance, the coefficient for the Education variable has a positive sign. The education level of the interviewee has a positive correlation to the likelihood of saying “yes” to a provided bid. The same is true of the Income variable. In other words, households with more income have a higher possibility, compared to those with less income, to report “yes” to a provided bid. This finding is natural since RM is a normal good in which demand increases as income increases. However, the coefficient for the Age variable is estimated as negative sign. This indicates that younger interviewees tend to say “yes” more to the bid amount offered than older ones do.
3.3. Discussion of the Results
This article looked into South Korean households’ additional WTP for getting supplied with BG instead of NG or substituting NG with BG. In order to obtain reliable data, the authors paid attention to three aspects. First, they did not conduct the CV survey arbitrarily, but requested the CV survey to a professional survey company with extensive CV survey experience. Second, the CV survey was undertaken by selecting only experienced and skilled interviewers among interviewers belonging to the company. Third, a sufficient number of observations were obtained in this study by sampling 1000 randomly selected households. Therefore, the authors believe that the sample obtained in this study can reasonably represent the population. Moreover, since the characteristics of the sample were not significantly distinguishable from those of the population, generalizing the results reported above as a whole population would not suffer from any particular problems.
Additional WTP for being supplied with RM rather than NG was estimated as an average of KRW 191.46 (USD 0.17) per m3. The average price of residential NG, the benchmark for eliciting the additional WTP, was KRW 600.97 (USD 0.54) per m3 in 2017. The additional WTP implies a price premium for RM over NG or the economic benefits that ensue from getting supplied with BG instead of NG. This value was worth 31.8% of the average price of NG. It is concluded that the households would place more value on RM than NG. Changing from NG to RM for residential use will bring significant economic value to the households.
The discovery that people are willing to shoulder additional burdens for RM instead of NG can justify the investment of the government and RM-providing companies to expand the supply of RM. Since RM is currently produced by collecting what is generated from landfills, sewage treatment plants, and so on, their production costs are relatively low. However, the production costs may become higher than they are now, as additional investments will be required to increase the output of RM. Therefore, the supply costs of RM will be higher than now. The supply of RM is socially profitable as long as the price of RM does not exceed about 1.32 times the price of NG. If the price of RM exceeds about 1.32 times the price of NG, it should be carefully decided whether or not the RM will be expanded. Although this study did not compare the supply costs of RM with the economic benefits of RM due to the limitations of the data, it is necessary to perform the comparison in follow-up future studies.
4. Conclusions
South Korea is considering substituting some residential NG, a fossil fuel that relies on imports, with RM, a renewable energy source. Therefore, we examined the households’ additional WTP for substituting the use of NG with that of RM using data gathered through a survey of 1000 interviewees. The average of additional WTP for RM over NG was computed, with statistical significance, as KRW 191.46 (USD 0.17) per m
3. Considering that the price of residential NG was about KRW 600.97 (USD 0.54), the average is worth 31.9% of the price. This value could be interpreted as a price premium for RM compared to NG. Thus, it could be a useful reference for future researchers to explore the public perspective on substituting the residential NG with RM. In addition, compared with Lim et al.’s [
14] study, which is similar to this study, the WTP estimate is relatively large. Lim et al. [
14] reported that the mean additional WTP for introducing a bioethanol mandate of 5% bioethanol and 95% gasoline is KRW 290 (USD 0.26) per liter, which was worth 15.6% of the gasoline retail price.
Although some studies that analyzed price premiums or additional WTP for other bio-fuels, such as bio-diesel, bio-ethanol, and bio-hydrogen, are found in the literature, research cases targeting BG are hard to find. That is, to the extent that the authors know, no research can be found in the literature that analyzes the price premium or additional WTP for RM. In this respect, this is the first study to deal with price premium or additional WTP for RM. Therefore, the authors believe that it can be an important contribution to the literature dealing with bio-gas and also provide useful information to government policy-makers who are considering expanding the supply of RM.
This study is a kind of pilot study that needs to be extended in three ways. First, although the results are for the whole country, it would be useful to derive values from differentiated analysis by region. Because the supply cost of RM is higher than that of NG, it is possible to consider supplying RM first to areas with greater acceptance toward RM. In this regard, more research budgets should be secured to expand the scope of the survey. Second, it would also be interesting to conduct a study comparing the level of WTP for RM by country. In addition, identifying what factors determine differences if they differ by country is another topic to study. Third, it is useful to compare the results from this CV study with those from another SP technique, CE. This is because CE is the most popular SP technique in the literature, along with CV. Of course, for CE to be applied, it would be important to well-define several attributes associated with RM. We hope that this study will be a starting point for various follow-up studies to be carried out.


