Abstract
This paper presents research on humidity in a passenger car cabin with the use of supply ventilation without cooling the air. Based on the tests carried out and the humidity balance in the car, a model was developed for changing the humidity in the passenger car cabin as a function of time. The study of thermohumid conditions was carried out in two passenger cars. During the tests, the heating and cooling functions were turned off. The relative humidity and temperature were measured outside the car before and after driving the car and in the supply air duct and inside the passenger car cabin while driving the car. The tests were carried out for an average temperature range from 20 to 42.9 °C. In order to develop a model of humidity changes as a function of time, a humidity balance was prepared. Human-generated humidity in the car cabin depends mainly on the temperature inside the car and the age of the person and can range from 20 to 180 g/(h × person) for an adult in the temperature range of 20–43 °C, while for a child under six years old the humidity ranges from 8 to 19.5 g/(h × person) in the temperature range 22–34 °C. A formula of humidity generated by an adult and a child aged six years old was obtained as a function of temperature inside a passenger car. Based on the experimental research and the model developed, the humidity generated by a single adult and a six-year-old child in the car was determined. The developed model can be used in the automatic airflow adjustment systems in passenger cars.
1. Introduction
Air humidity is one of the parameters of air quality that significantly affects the comfort of driving a car and human health [1,2,3]. The main sources of moisture in the passenger car cabin are the driver and passengers inside the passenger car. The generation of moisture by humans depends primarily on human physical intensity and can range from about 30 g/h during sleep to over 300 g/h during intense physical effort [4]. Air quality in car cabins has been studied by many researchers [5,6], and a few of them have analyzed moisture. In Aquino et al. [5], an analysis of fungal contamination of air-conditioning filters collected from 21 cars was performed, and the study showed a population of fungi in all samples taken (100%), including toxin-forming fungi such as Penicillium, Fusarim, and Aspergillus, which indicates that air quality indoors may be a health hazard. These fungi cause severe allergic and pulmonary respiratory diseases. For health reasons and to ensure thermal comfort, the relative humidity of air at a temperature of 20–22 °C can be 30–65%. At a temperature of about 26 °C, the relative humidity should not exceed 55%. When the relative humidity exceeds 70%, there are conditions that cause the formation of fungi and mold that are harmful to people and can destroy the structure of the car. According to the results of a survey [7], 47.7% of the people from the surveyed population spent one to two hours in means of transport; in larger cities (over 500,000 inhabitants), this time was longer, and about 20% of the respondents from large cities spent 2–5 h a day in cars. Due to the increasing use of cars, drivers and passengers may be exposed to many internal pollutants [8]. In [9], the authors analyzed the additional fuel consumption of cars in terms of the thermal comfort in the car cabin without taking into account humidity conditions, which also significantly contribute to the feeling of thermal comfort. An analysis of changes in passengers’ thermal sensations due to the change in the thermohumidity conditions in the car cabin is presented in [10,11,12]. Four air parameters were examined in [13], namely temperature, humidity, carbon dioxide (CO2) concentration, and dust. The approach proposed by the authors makes it possible to provide real-time concise and comprehensive information on air quality in car cabins. A modeling of air quality in a car cabin was done by the authors in [14,15]. As the level of CO2 in the vehicle cabin increases, the risk of accidents increases, drowsiness increases, and reaction time slows down. A computational fluid dynamics (CFD) model developed in this study was created to examine the impact of the ventilation coefficient in a car cabin on the quality of the indoor air and the amount of air required for each person in the vehicle. The humidity inside the car cabin can also be associated with other factors affecting the quality of the air, such as the air flow inside the passenger car, solar radiation, or the external pollution getting inside the car cabin. A simulation of flows inside the car was performed in [16]. The effect of solar radiation on the thermal comfort in a passenger car cabin has been presented in [17,18]. The impact of air pollution on the quality of air in passenger car cabins was presented in [19] and the quality of air in the aircraft cabin in [20]. The air quality in the car may have an influence on the quality of the air in the garage [21,22]. Indoor air quality (IAQ) and indoor environmental quality (IEQ) modeling in various enclosed spaces has been done by many authors [23,24,25,26,27]. Too high and too low humidity is bad for how people feel and thus their concentration, which is very important for drivers [28,29,30]. In the literature [31,32,33,34], guidelines are described regarding the relative humidity of the air in rooms where people are present. According to the guidelines in [31], in classrooms a relative humidity of 30% to 50% is recommended for a temperature range of 20–24 °C. In [32], a minimum relative humidity of not less than 30% for a temperature equal to 20 °C is recommended, while the guidelines in [33] specify that in winter the minimum relative humidity should not be less than 40% for a temperature of 26 °C in the room. In [13], a categorization of air quality was developed related to the humidity in the car cabin.
Most simplified models of the moisture in rooms intended for people’s stay [35,36,37,38] are based on the moisture balance, which includes ventilation parameters, internal sources of moisture, and the moisture buffering by the interior materials. The aim of the article is to develop a humidity model in the passenger car cabin as a function of time, the number of people, and the cubic capacity of the car cabin based on empirical research. No data on human moisture generation inside passenger cars were found in the literature. Based on the derived model, the work also determined the humidity generated by an adult and a child aged six years old in the cabin of a passenger car. The tests were carried out for mechanical ventilation without air cooling, i.e., car air conditioning. In the future, to supplement the issue of humidity in cars, tests will be carried out using air cooling, thus dehumidifying the air in the cabin.
2. Materials and Methods
The study of thermohumid conditions was carried out in two passenger cars—one a type of station wagon marked A and the other a type of hatchback marked B. The maximum number of people allowed in the tested cars together with the driver is five people. The car speed in all measurement series was maintained at a constant level of 70 km/h. Both cars are equipped with air heating and cooling functions.
A simplified diagram of the ventilation system is shown in Figure 1. The blown air is first taken in from the outside through the inlet (1) through the backward-curved centrifugal fan (2), then the air flows through the air filter (3) and heat exchangers (4) in which the air can be heated or cooled, and the air is then supplied through the channels (5–7) inside the car with the option of switching off individual channels. The cooling function is carried out by a thermodynamic cycle, while heating is most often done before the heat is collected from the engine. During the tests, the heating and cooling functions were turned off. The relative humidity of the supply air in such a system is equal to the outside air humidity. Despite the heating function being turned off, the supply air had a higher temperature than the outside air, which was caused by heat gains from the running engine and solar radiation.
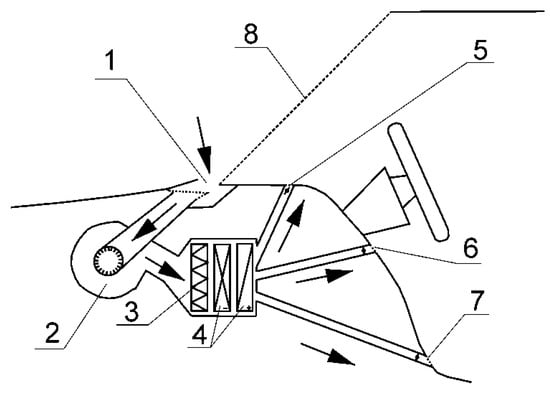
Figure 1.
The main elements included in the passenger car ventilation system: 1—air intake, 2—supply fan, 3—air filter, 4—heat exchangers (cooler, heater), 5—air supply duct under the glass, 6—duct air supply towards the driver and passenger, 7—air supply channel towards the driver’s and passengers’ legs, 8—car windscreen.
The relative humidity and temperature in the tested passenger cars were recorded while driving the car with the windows closed. The research was conducted in Poland in the spring and the summer when mechanical ventilation in passenger cars is intensively exploited. Measurements were made outside of an urban area on a national road, where the car’s velocity varied from 70 to 90 km/h. The relative humidity and temperature were measured outside the car before and after driving the car as well as in the supply air duct and inside the passenger car cabin while driving the car using a Testo-435 recorder, whose parameters are shown in [39]. During the measurement, the airflow was set only before the windscreen in channel 5; the other channels 6 and 7 were closed (Figure 1). Additionally, in order to determine the air change rate inside the car cabin, the flow velocity in the supply air duct (5) was measured using a Testo-435 recorder. The air change rate (ACH) n was determined according to the following relationship:
where (m3/s) is the volumetric air flow, V (m3) is the volume of the passenger car cabin, t (s) is the time, and um (m/s) is the average air velocity in the supply air duct.
Table 1 presents the characteristics of the persons in the car, and the body surface area is determined from the DuBois formula:

Table 1.
Characteristics of persons in the car.
The temperature and relative humidity were measured in the center of the passenger car between the front seats. Table 2 presents the measurement series number, car designation, volume of the passenger car cabin, the number of people in the car, the number of adults and children aged six, the driving time, air change rate, and the date of measurement.
Table 2.
Basic data of the tested passenger cabins.
3. Results and Discussion
Table 3 presents the assessment of thermohumidity conditions in the passenger car cabin based on the average temperature and relative humidity values. The temperature of the air blown into the passenger car cabin is much higher than the outside air temperature, which is caused by heat gains from solar radiation and heat gains from the internal combustion engine. In the case of car A, the largest increase in temperature by 64% was obtained for the air change rate equal to 4.66 1/h (measuring series No. 4), while the smallest increase in the temperature of the supply air in relation to the outside temperature was 16% for the air change rate equal to 83.01 1/h (series measuring No. 8). Air flowing at a lower velocity through heated ventilation ducts achieves a higher temperature. A larger flow through the ventilation system means a lower temperature of the air blown into the car. According to the Mollier chart, air heating in this way runs along the constant absolute humidity line [10,40]. The average absolute humidity inside the car cabin increased compared to the average absolute humidity of the supply air, which is caused by the generation of moisture by the driver and passengers. The increase in absolute humidity inside the car cabin depends on the air change rate, the number of people inside the car, and the temperature inside the car. The highest increase in the average absolute humidity inside the car in relation to the average absolute humidity of the supply air was recorded for measurement series No. 10 (n = 6.21 1/h, Tin = 41.6 °C), while the smallest increase in the absolute humidity inside the car was recorded for measurement series No. 8 (n = 83.01 1/h, Tin = 31.8 °C). High temperatures inside the car are primarily attributed to solar radiation [41]. According to measurements made by [41] in Athens, the maximum temperatures on clear days in a parked car reached up to 76 °C.
Table 3.
The parameters of the air outside the car and in the passenger car’s cabin during the tests.
The assessment of thermohumidity conditions (Table 3) in the passenger car cabin was made in accordance with the guidelines in [13,34] based on the average values of the temperature and the relative humidity in the passenger car cabin. In the presented research, the “intermediate” and “bad” grades prevailed. Bad thermohumidity conditions were caused by too low ventilation efficiency (3–5 series) and by high temperature inside the car (9 series). The “very bad” category was also added to the assessment, which means the possibility of hyperthermia in one-year-old children when the temperature is above 40 °C, based on studies in [40,41,42]. The “very bad” category was received by the series 9, 10, and 11, in which the average temperature was around 40 °C. These take into account the guidelines from [31,32,33,34] where comfort can be obtained at a temperature of 22–24 °C and a humidity of 40–60%; using these guidelines and numbers for our case, comfort is only ensured in series 1 and 2.
Figure 2 presents graphic results of absolute humidity measurements for 15 measurement series as a function of time. Universal trends can be observed in the charts. In the case of cars ventilated before driving, an increase in absolute humidity was observed when driving a passenger car. The increase in humidity then depends on the number of passengers and the air change rate as well as the relative humidity of the air supplied to the car, where the greater the number of passengers and the smaller the air change rate and the higher relative humidity of the supply air, then the gradient of relative humidity inside the car is higher. The air change rate in a car has the greatest impact on the absolute humidity increase in a car. For example, for the same two adults in car A for series 3–5 with an average air change rate equal to 4.7 1/h, the increase in absolute humidity is about 23% from the initial value, while for the air change rate equal to 29.7 1/h (series No. 6), the absolute humidity value is approximately constant. The temperature inside the car has a significant impact on the increase in the absolute humidity in the car. The largest increase in absolute humidity by about 30% in relation to the initial value of all measurement series is for series No. 10, namely for the temperature inside the car that is equal to 41.6 °C. It should be emphasized here that the tests were carried out without supply cooling. In the case of cooling, the humidity in a car usually has a decreasing trend as a result of dehumidifying the air [27].
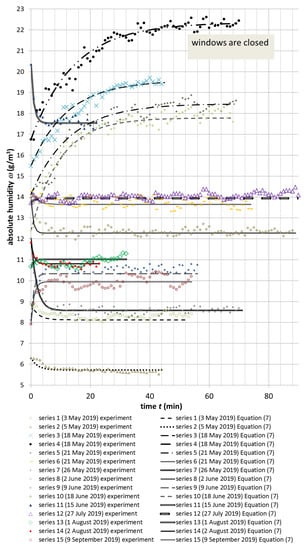
Figure 2.
Summary of the data of measurement of absolute humidity in the passenger cabins with the equation (Equation (7)).
In the case of cars that were not ventilated before driving (series 7, 8, 11) in which people had previously stayed, after switching on the ventilation for a greater flow while driving the car, a decrease in absolute humidity can be observed, where the humidity is removed by mechanical ventilation outside. In measurement series 1–6, 9–10, 12–15, the car was ventilated for two hours before driving. After the initial increase or decrease in absolute humidity, the absolute humidity content stabilizes at a more or less constant level. Figure 3 shows the relationship between the time of absolute humidity stabilization ts and the sum of the weight w of people in the car as well as the air change rate n in the car. The time to stabilize the absolute humidity in the car depends primarily on the air change rate in the car. The longest absolute humidity stabilization time is on average ts = 47 min for the air change rate from 4.17 1/h to 6.21 1/h, while the shortest stabilization time values (2 < ts < 8 min) of absolute humidity are reached above n = 27 1/h. In the case of the sum of the weight of people in the car, the minimum values of absolute humidity stabilization time are achieved for weights over 164 kg and reached the average value of ts = 5.3 min.
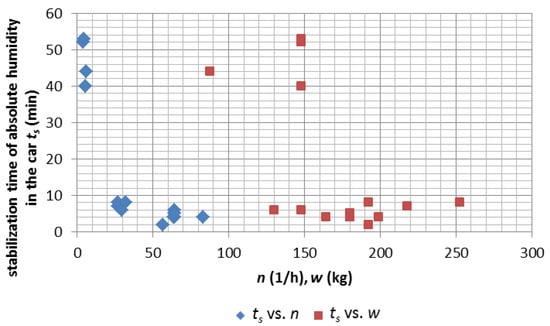
Figure 3.
The relationship between the time of absolute humidity stabilization ts in a car as a function of the sum of the weight w of people in the car and the air change rate n.
Figure 4 shows the absolute humidity as a function of time and temperature for the case of opening windows while driving the car, and the absolute humidity graph of the outside air. After opening the windows, a significant decrease in the absolute humidity inside the car can be observed compared to the absolute humidity of the outside air. In the case of the temperature inside the car cabin, a decrease in temperature was also observed. Opening the windows of the car while driving it quickly removes excess moisture from the car cabin; however, it causes great discomfort in the form of a draft, which can be particularly bothersome in the event of low outside air temperatures. When driving a car with open windows (Figure 5), the absolute humidity in the passenger car cabin is about equal to the absolute humidity of the outside air.
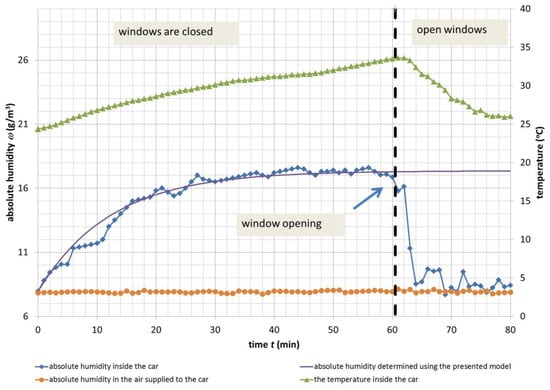
Figure 4.
The impact of window opening on the absolute humidity in the car cabin (3 adults: a, b, c; n = 4.9 1/h; data: 31 May 2019).
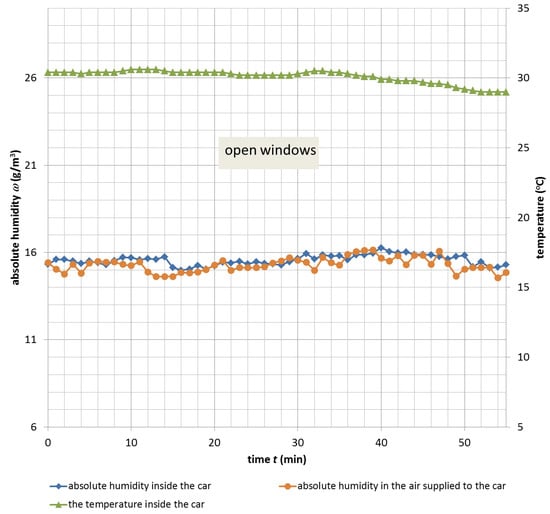
Figure 5.
Absolute humidity in the car while driving with open windows (2 adults: a, b; n = 32 1/h; data: 26 June 2019).
All measurements were made on a rainless day, and therefore the impact of precipitation on car humidity is not the subject of the study in this publication.
In order to develop a model of humidity changes as a function of time, a humidity balance was prepared:
where V (m3) is the volume of the car, t (h) is the time, ω (g/m3) is the absolute humidity, Qn (g/h) is the humidity supplied from the outside or discharged from the car by supply ventilation, and Qg (g/h) is the humidity generated by the driver and passengers.
It should be noted that the moisture buffering by materials, which in many models has been included [35,36,37,38], is omitted here. The humidity that is supplied from the outside or removed from the car by the supply ventilation is described by the following formula:
where n is the air change rate, ωa (g/m3) is the absolute external humidity, and ω (g/m3) is the absolute humidity inside the car.
The humidity generated by the driver and passengers is described by the following relationship (Equation (5)):
where qg (g/(h × person)) is the humidity emitted by one passenger and m is the number of persons (person).
After substituting the relationship in Equation (4) to the formula in Equation (3), the absolute humidity balance takes this form:
After the integration of Equation (5), the absolute humidity model is obtained as a function of time t:
Figure 2 compares the absolute humidity obtained from the model in Equation (7) with the experiment. The relative error was determined according to the following relationship (Equation (8)):
where ωexp is absolute humidity measured in in a passenger car while ωnum is absolute humidity determined using Equation (7). The relative error is 9.7%, while the average relative error is 1.5%.
Based on the measurement data and the simulation according to the formula in Equation (7), the humidity emissions by an adult and a six-year-old child were determined. The relationship between the humidity generated by an adult and a six-year-old child as a function of the interior temperature of a passenger car cabin is shown in Figure 6. The humidity generated by an adult in the temperature range 21.75–32.2 °C increases linearly and increases from 28 to 48 g/h; when above 32.2 °C, there is a significant increase in humidity generated by an adult from 48 g/h to 180 g/h. It should be noted here that the maximum value of humidity generated by an adult occurred at 42.85 °C, at which there is a risk of hyperthermia [40,41,42]. For five-year-old children, only the temperature range from 21.75 to 34.01 °C was examined, in which the humidity generated by the six-year-old child increased from 8 to 19.5 g/h. In the temperature range from 22 to 29 °C, the humidity generation by adults in a car is on average 4 times greater than by children aged six years old, while the body area of adults is 2.7 larger than the body areas for children aged six years old (Table 1). As a result of approximation, an approximate formula of the humidity generated by an adult qga and a child aged six years old qgc was obtained as a function of the temperature inside a passenger car:
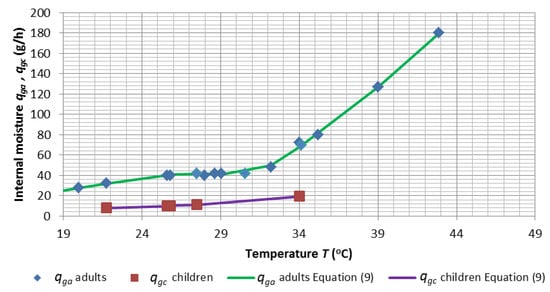
Figure 6.
Dependence of human-generated humidity depending on the temperature inside the car.
The shape coefficients of the function of the formula in Equation (8) are presented in Table 4. Based on the formula in Equation (9), it is possible to estimate the humidity generated by humans with a maximum relative error of 1% for an adult and 2% for a six-year-old child.
Table 4.
Coefficients of Equation (9).
The regulation of the supply ventilation flow rate in both the A and B cars is done by changing the rotational speed of the impeller and by setting the dampers in the supply channels. During all measurements, the ventilation flow rate was regulated by changing the rotational speed of the impeller, while the dampers were set in one unchanged position. Figure 7 shows the measured power consumption of the fan at the set impeller speed as a function of the air change rate for the supply ventilation for cars A and B. Based on the measured characteristics of the fan power as a function of the air change rate, it is possible to estimate the energy E consumed by the fan over a given time t:
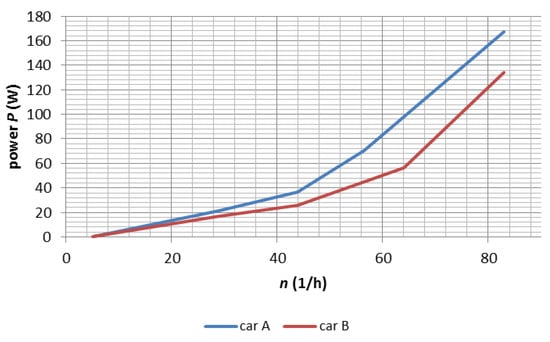
Figure 7.
Characteristics of fan power in cars A and B as a function of the air change rate.
During one hour, the fan’s energy consumption for the ranges of air change rates at 27–32 1/h, 56–64 1/h, and 83 1/h were on average 19 Wh, 63 Wh, and 150 Wh, respectively.
The presented model can be used in modern air quality controllers in the car cabin. The automatic adjustment system based on the number of passengers and the outside air humidity on the basis of the model can adjust the airflow to the car cabin to maintain adequate air humidity in the car. Humidity measurement can be made by using humidity sensors, while the number of passengers can be measured by strain gauges installed in the seats.
4. Conclusions
The paper presented a compact humidity model in a passenger car cabin. Based on the conducted research, the following conclusions were obtained:
- The absolute humidity in a passenger car cabin depends primarily on the air change rate and the number of passengers. For a small air change rate, the absolute humidity increases as a function of time.
- Human-generated humidity in the car cabin depends mainly on the temperature inside the car and the age of the person, and it can range from 20 to 180 g/(h × person) for an adult in the temperature range of 20–43 °C, while for a child under six years old, it ranges from 8 to 19.5 g/(h × person) in the temperature range 22–34 °C. It should be noted that the temperature 43 °C is the extreme temperature inside the vehicle. The results of the study indicate that inside a car, children under the age of six generate about four times less humidity than adults.
- Opening the windows quickly reduces the humidity in the car, which after some time reaches a value equal to the absolute humidity of the outside air. A similar effect was also obtained for the temperature.
- Driving a car with open windows keeps the temperature and absolute humidity more or less constant.
- The most efficient way to get rid of humidity from a car is to open windows or increase the efficiency of supply ventilation, which supplies air from the outside, while humidity is removed by leaks in the car cabin.
- The presented model can be used to predict the humidity in a passenger car and can be implemented in the automatic ventilation control systems of passenger cars.
In the next part of the research on the thermal comfort in the car, a model of heat exchange in the car cabin will be developed based on measurements of solar radiation, supply ventilation, and heat gains from people in the car.
Author Contributions
Conceptualization, K.G.-F. and T.J.T.; methodology, K.G.-F. and T.J.T.; formal analysis, T.J.T.; investigation, K.G.-F. and T.J.T.; resources, K.G.-F. and T.J.T.; writing—original draft preparation, K.G.-F and T.J.T.; writing—review and editing, K.G.-F. and T.J.T.; project administration, K.G.-F.; funding acquisition, K.G.-F. and T.J.T. All authors have read and agreed to the published version of the manuscript.
Funding
The research was carried out at the Bialystok University of Technology and financed from a subsidy provided by the Ministry of Science and Higher Education of Poland, from the resources of the WZ/WBiIS/4/2019 and WZ/WBiIS/9/2019 work and the project BUT InterAcademicPartnerships PPI/APM/2018/1/00033/DEC/1.
Conflicts of Interest
The authors declare no conflict of interest.
References
- Okokon, E.O.; Taimisto, P.; Turunen, A.W.; Amoda, O.A.; Fasasi, A.E.; Adeyemi, L.G.; Juutilainen, J.; Lanki, T. Particulate air pollution and noise: Assessing commuter exposure in Africa's most populous city. J. Transp. Health 2018, 9, 150–160. [Google Scholar] [CrossRef]
- Romanska-Zapala, A.; Bomberg, M.; Dechnik, M.; Fedorczak-Cisak, M.; Furtak, M. On preheating of the outdoor ventilation air. Energies 2020, 13, 15. [Google Scholar] [CrossRef]
- Finell, E.; Nätti, J. The combined effect of poor perceived indoor environmental quality and psychosocial stressors on long-term sickness absence in the workplace: A follow-up study. Int. J. Environ. Res. Public Health 2019, 16, 4997. [Google Scholar] [CrossRef] [PubMed]
- Zemitis, J.; Borodinecs, A.; Frolova, M. Measurements of moisture production caused by various sources. Energ. Build. 2016, 127, 884–891. [Google Scholar] [CrossRef]
- Aquino, S.; Alves de Lima, J.E.; Branco do Nascimento, A.P.; Reis, F.C. Analysis of fungal contamination in vehicle air filters and their impact as a bioaccumulator on indoor air quality. Air Qual. Atmos. Health 2018, 11, 1143–1153. [Google Scholar] [CrossRef]
- Kim, H.-H.; Park, G.-Y.; Lee, J.-H. Concentrations of particulate matter, carbon dioxide, VOCs and risk assessment inside Korean taxis and ships. Environ. Sci. Pollut. Res. 2019, 26, 9619–9631. [Google Scholar] [CrossRef] [PubMed]
- Gładyszewska-Fiedoruk, K.; Krawczyk, D.A. Ocena przyzwyczajeń Polaków oraz korzystania z wentylacji i klimatyzacji w świetle badań ankietowych (Assessment of the habits of Poles connected with ventilation and air conditioning systems usage—based on results of survey). In Rynek Gazu; Henryk, K., Ed.; Kaprint: Lublin, Poland, 2014; pp. 135–146. (In Polish) [Google Scholar]
- Błaszczyk, E.; Rogula-Kozłowska, W.; Klejnowski, K.; Kubiesa, P.; Fulara, I.; Mielżyńska-Švach, D. Indoor air quality in urban and rural kindergartens: Short-term studies in Silesia, Poland. Air Qual. Atmos. Health 2017, 10, 1207–1220. [Google Scholar] [CrossRef] [PubMed]
- Mansour, C.; Nader, W.B.; Breque, F.; Haddad, M.; Nemer, M. Assessing additional fuel consumption from cabin thermal comfort and auxiliary needs on the worldwide harmonized light vehicles test cycle. Transport. Res. D Transp. Environ. 2018, 62, 139–151. [Google Scholar] [CrossRef]
- Alahmer, A.; Omar, M.A.; Mayyas, A.; Dongri, S. Effect of relative humidity and temperature control on in-cabin thermal comfort state: Thermodynamic and psychometric analyses. Appl. Therm. Eng. 2011, 31, 2636–2644. [Google Scholar] [CrossRef]
- Berndt, D.; Muggli, J.; Wittwer, F.; Langer, C.; Heinrich, S.; Knittel, T.; Schreiner, R. MEMS-based thermal conductivity sensor for hydrogen gas detection in automotive applications. Sens. Actuators A Phys. 2020, 305. [Google Scholar] [CrossRef]
- Alahmadi, A. Design an optimum climate control system for efficient smart universities educational environment. Int. J. Sci. Technol. Res. 2020, 9, 440–449. [Google Scholar]
- Szczurek, A.; Maciejewska, M. Categorisation for air quality assessment in car cabin. Transport. Res. D Transp. Environ. 2016, 48, 161–170. [Google Scholar] [CrossRef]
- Chang, T.-B.; Sheu, J.-J.; Huang, J.-W.; Lin, Y.-S.; Chang, C.-C. Development of a CFD model for simulating vehicle cabin indoor air quality. Transport. Res. D Transp. Environ. 2018, 62, 433–440. [Google Scholar] [CrossRef]
- Moreno, T.; Pacitto, A.; Fernández, A.; Amato, F.; Marco, E.; Grimalt, J.O.; Buonanno, G.; Querol, X. Vehicle interior air quality conditions when travelling by taxi. Environ. Res. 2019, 172, 529–542. [Google Scholar] [CrossRef] [PubMed]
- Qi, C.; Helian, Y.; Liu, J.; Zhang, L. Experiment study on the thermal comfort inside a car passenger compartment. Procedia Eng. 2017, 205, 3607–3614. [Google Scholar] [CrossRef]
- Barnes, N.M.; Ng, T.W.; Ma, K.K.; Lai, K.M. In-cabin air quality during driving and engine idling in air-conditioned private vehicles in Hong Kong. Int. J. Environ. Res. Public Health 2018, 15, 611. [Google Scholar] [CrossRef]
- Lee, E.S.; Stenstrom, M.K.; Zhu, Y. Ultrafine particle infiltration into passenger vehicles. Part II: Model analysis. Transport. Res. D Transp. Environ. 2015, 38, 144–155. [Google Scholar] [CrossRef]
- Gładyszewska-Fiedoruk, K.; Nieciecki, M. Indoor air quality in a multi–car garage. Energy Procedia 2016, 95, 132–139. [Google Scholar] [CrossRef][Green Version]
- Yang, Z.; Long, Z.; Wang, G. Fast heating model for the aircraft cabin air. Energies 2019, 12, 3565. [Google Scholar] [CrossRef]
- Marć, M.; Śmiełowska, M.; Zabiegała, B. Concentrations of monoaromatic hydrocarbons in the air of the underground car park and individual garages attached to residential buildings. Sci. Total Environ. 2016, 573, 767–777. [Google Scholar] [CrossRef]
- Szczepanik-Ścisło, N.; Ścisło, Ł. Air leakage modelling and its influence on the air quality inside a garage. E3S Web Conf. 2018, 44, 00172. [Google Scholar] [CrossRef]
- Piasecki, M.; Kostyrko, K.B. Combined model for IAQ assessment: Part 1—Morphology of the model and selection of substantial air quality impact sub-models. Appl. Sci. 2019, 9, 3918. [Google Scholar] [CrossRef]
- Piasecki, M. Practical implementation of the indoor environmental quality model for the assessment of nearly zero energy single-family building. Buildings 2019, 9, 214. [Google Scholar] [CrossRef]
- Bahramnia, P.; Hosseini Rostami, S.M.; Wang, J.; Kim, G.-J. Modeling and controlling of temperature and humidity in building heating, ventilating, and air conditioning system using model predictive control. Energies 2019, 12, 4805. [Google Scholar] [CrossRef]
- Yu, S.; Cui, Y.; Shao, Y.; Han, F. Simulation research on the effect of coupled heat and moisture transfer on the energy consumption and indoor environment of public buildings. Energies 2019, 12, 141. [Google Scholar] [CrossRef]
- Alahmer, A.; Omar, M.; Mayyas, A.R.; Qattawi, A. Analysis of vehicular cabins’ thermal sensation and comfort state, under relative humidity and temperature control, using Berkeley and Fanger models. Build. Environ. 2012, 48, 146–163. [Google Scholar] [CrossRef]
- Kumar, S.; Cerny, J.; Kic, P. Air-conditioning in the cabins of passenger cars. Agron. Res. 2018, 16, 2088–2096. [Google Scholar] [CrossRef]
- Luangprasert, M.; Vasithamrong, C.; Pongratananukul, S.; Chantranuwathana, S.; Pumrin, S.; De Silva, I.P. In-vehicle carbon dioxide concentration in commuting cars in Bangkok, Thailand. J. Air Waste Manag. Assoc. 2017, 67, 623–633. [Google Scholar] [CrossRef] [PubMed]
- Ruiz, I.; Sprowls, M.; Deng, Y.; Kulick, D.; Destaillats, H.; Forzani, E.S. Assessing metabolic rate and indoor air quality with passive environmental sensors. J. Breath Res. 2018, 12, 036012. [Google Scholar] [CrossRef] [PubMed]
- U.S. EPA. Indoor air quality tools for schools reference guide. In IAQ Tools for Schools Action Kit, EPA 402/K-07/008; United States Environmental Protection Agency (U.S. EPA): Washington, DC, USA, 2009. [Google Scholar]
- Recknagel, H.; Sprenger, E.; Schramek, E.R. Taschenbuch für Heizung + Klimatechnik 07/08: Taschenbuch für Heizung + Klimatechnik; Oldenbourg Industrieverlag: Munich, Germany, 2006. (In German) [Google Scholar]
- Secretariat: BSI, PN-EN 13779:2007. Ventilation for Non-Residential Buildings. Performance Requirements for Ventilation and Room-Conditioning Systems; REHVA: Brussels, Belgium, July 2006. [Google Scholar]
- ASHRAE Standard. Thermal Environmental Conditions for Human Occupancy; ASHRAE Standard 55, Rev. 2012; ANSI Publications: Washington, DC, USA, 2012. [Google Scholar]
- Gasparin, S.; Berger, J.; Dutykh, D.; Mendes, N. An improved explicit scheme for whole-building hygrothermal simulation. Build. Simul. 2018, 11, 465–481. [Google Scholar] [CrossRef]
- Goto, Y.; Wakili, K.G.; Frank, T.; Stahl, T.; Ostermeyer, Y.; Ando, N.; Wallbaum, H. Heat and moisture balance simulation of a building with vapor-open envelope system for subtropical regions. Build. Simul. 2012, 5, 301. [Google Scholar] [CrossRef]
- Nadarajan, M.; Kirubakaran, D.V. Simulation studies on indoor relative humidity maintenance in rural residential buildings using sustainable building materials. IOSR J. Mech. Civ. Eng. 2016, 4, 51–57. [Google Scholar] [CrossRef]
- Tariku, F.; Kumaran, K.; Fazio, P. Determination of indoor humidity profile using a whole-building hygrothermal model. Build. Simul. 2011, 4, 61–78. [Google Scholar] [CrossRef][Green Version]
- Teleszewski, T.; Gładyszewska Fiedoruk, K. Characteristics of humidity in classrooms with stack ventilation and development of calculation models of humidity based on the experiment. J. Build. Eng. 2020, 31, 101381. [Google Scholar] [CrossRef]
- Horak, J.; Schmerold, I.; Wimmer, K.; Schauberger, G. Cabin air temperature of parked vehicles in summer conditions: Life-threatening environment for children and pets calculated by a dynamic model. Theor. Appl. Climatol. 2017, 130, 107–118. [Google Scholar] [CrossRef]
- Grundstein, A.; Meentemeyer, V.; Dowd, J. Maximum vehicle cabin temperatures under different meteorological conditions. Int. J. Biometeorol. 2009, 53, 255–261. [Google Scholar] [CrossRef] [PubMed]
- Fayazbakhsh, M.; Bahrami, M. Comprehensive modeling of vehicle air conditioning loads using heat balance method. In Proceedings of the SAE 2013 World Congress & Exhibition, Detroit, MI, USA, 16–18 April 2013. [Google Scholar] [CrossRef]


© 2020 by the authors. Licensee MDPI, Basel, Switzerland. This article is an open access article distributed under the terms and conditions of the Creative Commons Attribution (CC BY) license (http://creativecommons.org/licenses/by/4.0/).