Abstract
Since the temperature of a photovoltaic (PV) module is not consistent as it was estimated at a standard test condition, the thermal stability of the solar cell parameters determines the temperature dependence of the PV module. Fill factor loss analysis of crystalline silicon solar cell is one of the most efficient methods to diagnose the dominant problem, accurately. In this study, the fill factor analysis method and the double-diode model of a solar cell was applied to analyze the effect of J01, J02, Rs, and Rsh on the fill factor in details. The temperature dependence of the parameters was compared through the passivated emitter rear cell (PERC) of the industrial scale solar cells. As a result of analysis, PERC cells showed different temperature dependence for the fill factor loss of the J01 and J02 as temperatures rose. In addition, we confirmed that fill factor loss from the J01 and J02 at elevated temperature depends on the initial state of the solar cells. The verification of the fill factor loss analysis was conducted by comparing to the fitting results of the injection dependent-carrier lifetime.
1. Introduction
The fill factor (FF), open circuit voltage (Voc) and short circuit current (Jsc) of a solar cell are important parameters because they determine the maximum power that a solar cell can generate. It is well known that the fill factor of silicon solar cells is influenced by the recombination current and parasitic resistance. In order to clarify the effect of these factors on a fill factor, the double-diode model is generally used as a theoretical concept. In the double-diode model, the photo-generated current density reduces due to the saturation current densities (J01, J02), and parasitic resistance (Rs, Rsh) as the equation shows below.
where J is the diode circuit current density, Jph is the photo-generated current density, J01 is the recombination current density in quasi-neutral region, V is the diode voltage, q is the elementary charge, k is Boltzmann’s constant, n1 is the ideality factor for the diode 1, n2 is the ideality factor for the diode 2, and T is the absolute temperature. The J01 in the equation is the information of the recombination current from the base material (quasi-neutral region) and both side surface of the solar cell. J02 generally describes the Shockley-Read-Hall (SRH) recombination at the p-n junction (space charge region), but there are also other recombination sources such as edge recombination [1] and localized high defect region [2,3].
Analyzing the recombination and resistive loss of a solar cell from the perspective of fill factor is a very efficient method because it directly shows the gain of the conversion efficiency from the loss factor. Hence, there were some effort to extract fill factor loss at the space charge region (J02) by determining fill factor loss from J01 (FFJ01) and subtracting the pseudo fill factor (pFF) that is not influenced by the series resistance [4,5]. Afterward, A. Khanna proposed a method to quantify the fill factor loss of silicon solar cells due to parasitic resistance as well as J02, because there was a limitation that the shunt resistance must be extremely high to extract an exact fill factor loss due to J02 in this method. In addition, since this approach does not need to assume n2 value during the fitting procedure, it showed that a more accurate analysis is possible. The theoretical derivation is well described in [6].
This fill factor loss analysis was used in this experiment to investigate the source of fill factor loss depending on the elevated temperature, because the module efficiency assessed at the standard test condition (STC, 25 °C) reduces at the actual operating temperature [7]. Figure 1 shows the measured PV module temperature change according to the seasonal temperature in Daejeon and Seoul of South Korea. The PV module temperature rises to 60 °C which will highly degrade the module power when it is operating. The Voc reduction is well known for the main source of efficiency loss. Voc is a function of the saturation current (I0) which is strongly dependent on the temperature as it can be seen in Equations (2) and (3) [8]. Where q is the elementary charge, A is the area, D is the diffusion constant, ni is the intrinsic carrier concentration, L is the diffusion length, ND is the doping concentration, and T is kelvin temperature. By extracting the fill factor loss of each parameter (J01, J02, Rs, and Rsh), it will be able to provide an accurate diagnosis and appropriate solution to reduce the temperature dependence of the PV module.
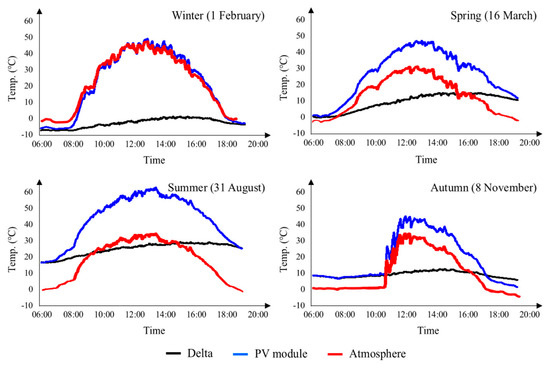
Figure 1.
Photovoltaic (PV) module temperature change according to seasonal temperature.
For the analysis of fill factor loss, industrial passivated emitter and rear cell (PERC), which is leading product in PV industries, was used [9]. Many researches for optimization of both side surface passivation [10,11,12,13,14,15,16] and laser ablation on rear aluminum oxide (AlOx) layer [17,18] for the local back surface field formation (LBSF) [19] have improved efficiency of the PERC and reached 22.8% [20]. In this paper, temperature dependence of two industrial type PERC samples were compared to inspect dominant factor of fill factor loss.
2. Experimental
2.1. Analysis Process of Fill Factor Loss
Figure 2 briefly summarizes the steps of the fill factor loss analysis. The analysis of the fill factor loss starts with the calculation of FFJ01. The FFJ01 can be determined when the effect of J02, Rs and Rsh is absent. With this assumption, Equation (1) changes to Equation (4).
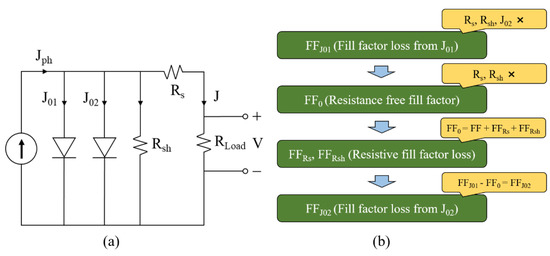
Figure 2.
(a) Equivalent circuit of solar cells with double-diode model, and (b) process of fill factor loss analysis.
By imposing the boundary condition J = 0 at V = Voc and J = Jsc at V = 0, relationship between J and V can be expressed in Equation (5), which FFJ01 is allowed to be obtained.
Afterwards, resistance free fill factor (FF0), which does not have loss from the parasitic resistance, is derived as in Equation (6) by considering the double-diode model at maximum power point (MPP). Where, Jmpp and Vmpp is the current density and voltage at power maximum point, respectively. Equation (6) is composed of three terms: real fill factor, fill factor loss from Rs (FFRs), and fill factor loss from Rsh (FFRsh), respectively from the left term.
As a last step, the fill factor loss from J02 can be readily determined from the difference of FFJ01 and FF0 Equation (7), because the difference comes from the absence of the J02 effect.
2.2. Sample Measurements with Elevated Temperature
Two industrial solar cells with PERC structure (Figure 3) were prepared as samples (PERC A and B). The PERC A and B were fabricated on different production lines, but the front contact pattern was unified to exclude optical loss due to the front contact. In case of the PERC A, silver paste for the front contact contains higher glass frit contents compared to the PERC B. The characteristics of illuminated J-V were measured by using an in-house solar simulator, which can control the temperature of substrate. Even though this fill factor analysis method assumed that J01 follows an n factor of 1, there were changes in the n factor depending on the temperature. Therefore, n factor at 1-sun, extracted from the Suns-Voc measurement, was used for analysis. The temperature of cells during the Suns-Voc measurement was controlled by using a box that has an ambient heater. The conditions of the experimental temperature were set to 25 °C, 45 °C, and 65 °C.
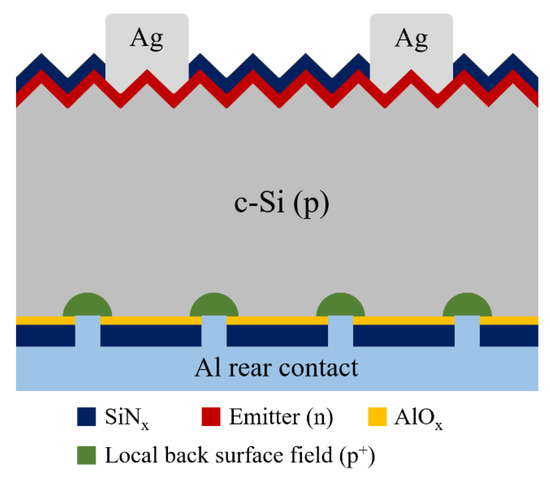
Figure 3.
Schematic of the industrial PERC solar cell structure.
3. Results and Discussion
3.1. Temperature Dependence
The two PERC solar cell samples were named by the PERC A and B. As a result of the illuminated J-V measurements (Table 1), Voc and fill factor of PERC B were 17 mV and 1.93 % higher at 25 °C, respectively. Jsc difference was not significant (~1.3 mA/cm2) and it comes from the different fraction of front metal contact. Graphs in Figure 4 show the drop of Voc and fill factor (depending on temperature), and also presents the average temperature coefficient as well. The average drop of Voc and fill factor with the PERC A cell were slightly higher than the PERC B cell. Especially, the larger fill factor drops occurred at 45 °C for the PERC A and 65 °C for the PERC B. Illuminated J-V measurements alone do not have enough evidence to accurately diagnose what the main problem is.

Table 1.
Results of illuminated J-V measurement and n factor (from Suns-Voc) of PERC A and B according to temperature dependence.
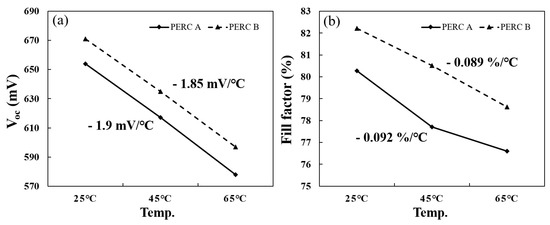
Figure 4.
Temperature coefficient of (a) Voc and (b) fill factor.
3.2. Results of Fill Factor Loss Analysis
Table 2 organizes the values of each fill factor loss according to the parameters from double-diode model. From this data, Figure 5 and Figure 6 shows the effect of each parameter on the total fill factor loss. At initial temperature, percentage of FFJ01 was higher than FFJ02 for the PERC B cell. On the other hand, FFJ02 had a higher percentage of total fill factor loss than FFJ01 for the PERC A cell. As the temperature rose, FFJ01 ratio of both PERC A and B increased while FFJ02 ratio decreased. This can be explained by the temperature dependence of J01 and J02 in Equations (8) and (9).
Table 2.
Results of fill factor loss analysis of PERC A and PERC B according to temperature (the values are absolute).
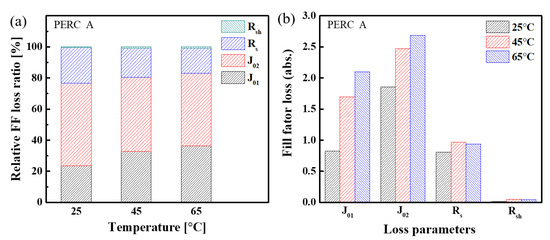
Figure 5.
Fill factor loss analysis results of PERC A: (a) Normalized fill factor ratio; (b) Absolute fill factor loss.
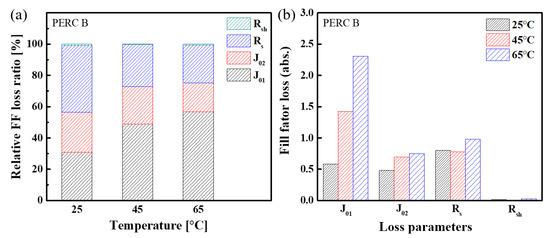
Figure 6.
Fill factor loss analysis results of PERC B: (a) Normalized fill factor ratio; (b) Absolute fill factor loss.
J01 is proportional to square of ni(T), which increases sensitively according to the temperature, while J02 is directly proportional to ni(T). Due to the difference of the temperature dependence, the effect of J01 becomes dominate as temperature goes up. However, the FFJ02 ratio and the absolute value are still higher than FFJ01 at 65 °C for the PERC A cell. A possible explanation is that the initial value of FFJ02 (1.86%) was twice higher than that of FFJ01 (0.82%) and helped increase at a high temperature.
In addition, the temperature dependence of FFJ02 for the PERC B cell (Figure 6b) reveals that the FFJ02 will not increase significantly at elevated temperature if the initial ratio to the total fill factor loss is relatively small. On the other hand, the difference of FFJ01 between 25 °C and 65 °C increased up to 20%, even though the initial difference was only 7%. This means that the effect of J01 on fill factor will be accelerated if the initial loss is relatively high.
In case of the PERC B cell, one can diagnose that the recombination of emitter, quasi-neutral region, or surface passivation have to be improved. Reduction of FFRs ratio for the PERC B cell will further reduce the temperature dependence, even though there were small variation at the elevated temperature. The ratio and temperature dependence of FFRsh were negligible for both PERC A and B cells.
3.3. Verification Through Injection Dependent-Carrier Lifetime
In order to verify the results of the fill factor loss analysis, the lifetime was measured through Sinton instrument’s Suns-Voc equipment at 25 °C. The recombination current density of the samples was evaluated by using a lifetime fitting method. Through the specific resistance and thickness of the wafer, the Auger recombination and the radiative recombination are represented as lifetime according to the excess carrier concentration as graphs in Figure 7 show.
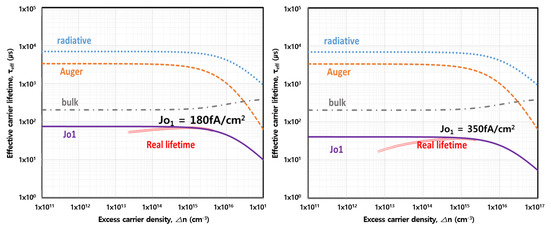
Figure 7.
Fitting results of injection dependent-carrier lifetime for the PERC A (Left) and B (Right).
The expressions for the intrinsic carrier lifetime and bulk lifetime can be expressed as follows.
Here, intrinsic recombination can be expressed as an Equation (12) [21].
Where n and p are the free electron and hole concentrations, n0 and p0 are the electron and hole concentration in thermal equilibrium, and △n is the excess carrier densities. The bulk lifetime of a wafer can be measured with quasi-steady-state photoconductance (QSSPC) equipment. To measure the bulk lifetime of the wafer, the doped layer was removed from the wafer using KOH solution after POCl3 diffusion, and then the Al2O3/SiNx stack passivation layer was deposited on both sides. Bulk lifetime can be calculated by the following two formulas [22,23].
Where W is the sample thickness, Seff is the surface recombination velocity. The Seff values were calculated as 9.8 cm/s at the 1015 cm−3 injection level which is commonly used [22]. As a result of our calculation, the bulk lifetime was 343 µs for our wafer. The graphs in Figure 7 shows these three lifetimes of radiative, Auger and bulk recombination. If the parameter of J01 is added to this formula, lifetime graph at high injection can be fit by using the formula below:
By fitting the lifetime graph through the J01 value, the J01 value was calculated as 350 fA/cm2 for the PERC A cell and 180 fA/cm2 for the PERC B cell. Similar to the results of the fill factor loss analysis, the J01 value was significantly higher for the PERC A cell.
Furthermore, we could draw the theoretical graph of FF0 as function of J02 (25 °C) by applying the J01 value from Figure 7 to the J-V equation of double diode model without resistance Equation (16). The J02 (25 °C) of the PERC A cell was extracted by finding the point that the FF0 from the fill factor loss analysis equal to the graph (black line in Figure 8). In this way, the J02 (25 °C) of the PERC A and B cells were assessed as 27 nA/cm2 and 7.35 nA/cm2, respectively. The difference of the J02 value was also expected from the graph in Figure 7. The graphs generally showed poor fitting results at low-level injection region. This means that the PERC A cell has poor properties of J02 or shunt resistance because these are well known as main reasons for low lifetime of solar cells in the low-level injection region [24].
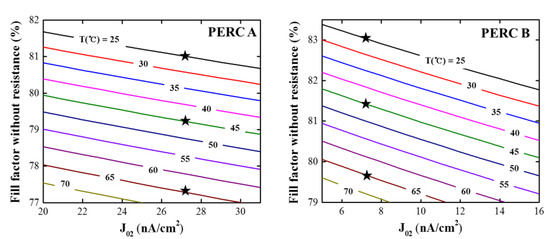
Figure 8.
Theoretical calculation of FF0 as function of the J02 (25 °C). The star marks are the FF0 value extracted from fill factor loss analysis (Table 2).
In case of the temperature above 25 °C, J01 and J02 values were calculated by using Equations (8) and (9). Through these J01 and J02 values, temperature conditions of the J02 (25 °C)-FF0 graph were extended from 30 to 70 °C. We confirmed that the FF0 from Table 2 matched quite well with the theoretical graph. Consequently, we confirmed that the fill factor loss analysis was conducted precisely by checking the theoretically extracted J01 and J02 values.
4. Conclusions
We conducted fill factor loss analysis to investigate the temperature dependence of industrial PERC cells based on the double diode model. While analyzing the loss of fill factor for the industrial PERC A and B cells, it was confirmed that both samples showed temperature dependence of fill factor (~0.092%/ °C). However, the main parameter that dominantly contribute to temperature dependence were different depending on the initial state of the samples.
For PERC A, J02 was the main parameter of fill factor loss in initial state (25 °C). However, the contribution of the J01 to the fill factor loss increased as the temperature rose. It could be estimated that the PERC A cell has potential to improve fill factor by optimizing J02 or shunt resistance. On the other hand, PERC B has a higher FFRs ratio at initial state (25 °C) than other parameters, but the ratio of FFRs reduced due to the rapid increase in the FFJ01. Therefore, we believe that the J01 has to be reduced for the PERC B cell by optimizing the doping process, passivation quality, and metal contacts.
In addition, we verified the accuracy of the fill factor loss analysis by comparing it to the fitting results of the injection dependent-carrier lifetime. The J01 and J02 values at 25 °C were extracted, and it was confirmed that the values of FF0 obtained from the fill factor loss analysis were in good agreement with the theoretically calculated values. In conclusion, it seems very important to reduce initial fill factor loss from the J01, because it has a high temperature dependence. In case of the J02 and Rs, they seem less detrimental for the reduction of fill factor at an elevated temperature. Also, we confirmed that the fill factor loss analysis used in this experiment is very efficient to diagnose the temperature dependence of the solar cells, as well as their initial state.
Author Contributions
K.H.M. designed experiments, performed the experiments and wrote manuscripts; Formal analysis, T.K.; data curation, M.G.K.; investigation, H.-e.S.; review and editing, Y.K. and H.-S.L.; supervision, D.K.; project administration and supervision, S.P.; writing-review and editing and project administration, S.H.L. All authors have read and agreed to the published version of the manuscript.
Funding
This research was funded by the Ministry of Knowledge Economy, Korea (Project No. 20183030019460), and funded by the Ministry of Science, ICT & Future Planning (Project No. 2017M1A2A2086911).
Acknowledgments
This work was conducted under the New and Renewable Energy Technology Development Program of the Korea Institute of Energy Technology Evaluation and Planning (KETEP) through a grant funded by the Ministry of Knowledge Economy, Korea (Project No. 20183030019460), and by the Technology Development Program to Solve Climate Changes of the National Research Foundation (NRF) funded by the Ministry of Science, ICT & Future Planning (Project No. 2017M1A2A2086911).
Conflicts of Interest
The authors declare no conflict of interest. Also, the funders had no role in the design of the study; in the collection, analyses, or interpretation of data; in the writing of the manuscript, or in the decision to publish the results.
References
- McIntosh, K. Lumps, humps and bumps: Three detrimental effects in the current–voltage curve of silicon solar cells, in: Centre for Photovoltaic Engineering. Univ. N. S. W. Aust. 2001, 171. [Google Scholar]
- Breitenstein, O.; Rakotoniaina, J.; Al Rifai, M.H.; Werner, M. Shunt types in crystalline silicon solar cells. Prog. Photovolt. Res. Appl. 2004, 12, 529–538. [Google Scholar] [CrossRef]
- Steingrube, S.; Breitenstein, O.; Ramspeck, K.; Glunz, S.; Schenk, A.; Altermatt, P.P. Explanation of commonly observed shunt currents in c-Si solar cells by means of recombination statistics beyond the Shockley-Read-Hall approximation. J. Appl. Phys. 2011, 110, 014515. [Google Scholar] [CrossRef]
- Greulich, J.; Glatthaar, M.; Rein, S. Fill factor analysis of solar cells’ current–voltage curves. Prog. Photovolt. Res. Appl. 2010, 18, 511–515. [Google Scholar] [CrossRef]
- Hoenig, R.; Glatthaar, M.; Clement, F.; Greulich, J.; Wilde, J.; Biro, D. New measurement method for the investigation of space charge region recombination losses induced by the metallization of silicon solar cells. Energy Procedia 2011, 8, 694–699. [Google Scholar] [CrossRef]
- Khanna, A.; Mueller, T.; Stangl, R.A.; Hoex, B.; Basu, P.K.; Aberle, A.G. A fill factor loss analysis method for silicon wafer solar cells. IEEE J. Photovolt. 2013, 3, 1170–1177. [Google Scholar] [CrossRef]
- Correa-Betanzo, C.; Calleja, H.; De León-Aldaco, S. Module temperature models assessment of photovoltaic seasonal energy yield. Sustain. Energy Technol. Assess. 2018, 27, 9–16. [Google Scholar] [CrossRef]
- Sproul, A.; Green, M. Improved value for the silicon intrinsic carrier concentration from 275 to 375 K. J. Appl. Phys. 1991, 70, 846–854. [Google Scholar] [CrossRef]
- The International Technology Roadmap for Photovoltaic (ITRPV). Available online: https://itrpv.vdma.org (accessed on 8 May 2020).
- Glunz, S.W. High-efficiency crystalline silicon solar cells. Adv. Optoelectron. 2007, 2007, 1–15. [Google Scholar] [CrossRef] [PubMed]
- Cuevas, A.; Kerr, M.; Schmidt, J. Overview of PECVD Silicon Nitride for Solar Cells. In Proceedings of the ANZSES 2003—Destination Renewables from Research to Market, Melbourne, Austrilia, 26–29 November 2003. [Google Scholar]
- Schmidt, J.; Merkle, A.; Bock, R.; Altermatt, P.P.; Cuevas, A.; Harder, N.-P.; Hoex, B.; Van De Sanden, R.; Kessels, E.; Brendel, R. Progress in the surface passivation of silicon solar cells. In Proceedings of the 23rd European Photovoltaic Solar Energy Conference, Valencia, Spain, 1–5 September 2008; pp. 1–5. [Google Scholar]
- Dingemans, G.; Kessels, W. Status and prospects of Al2O3-based surface passivation schemes for silicon solar cells. J. Vac. Sci. Technol. A 2012, 30, 040802. [Google Scholar] [CrossRef]
- Hoex, B.; Schmidt, J.; Pohl, P.; Van de Sanden, M.; Kessels, W. Silicon surface passivation by atomic layer deposited Al2O3. J. Appl. Phys. 2008, 104, 044903. [Google Scholar] [CrossRef]
- Hoex, B.; Gielis, J.; Van de Sanden, M.; Kessels, W. On the c-Si surface passivation mechanism by the negative-charge-dielectric Al2O3. J. Appl. Phys. 2008, 104, 113703. [Google Scholar] [CrossRef]
- Huang, H.; Lv, J.; Bao, Y.; Xuan, R.; Sun, S.; Sneck, S.; Li, S.; Modanese, C.; Savin, H.; Wang, A. 20.8% industrial PERC solar cell: ALD Al2O3 rear surface passivation, efficiency loss mechanisms analysis and roadmap to 24%. Sol. Energy Mater. Sol. Cells 2017, 161, 14–30. [Google Scholar] [CrossRef]
- Engelhart, P. Laser processing for high-efficiency silicon solar cells. In Proceedings of the Laser-based Micro- and Nanopackaging and Assembly III, San Jose, CA, USA, 28–29 January 2009; p. 72020S. [Google Scholar] [CrossRef]
- Grohe, A.; Knorz, A.; Nekarda, J.; Jäger, U.; Mingirulli, N.; Preu, R. Novel laser technologies for crystalline silicon solar cell production. In Proceedings of the Laser-based Micro- and Nanopackaging and Assembly III, San Jose, CA, USA, 28–29 January 2009; p. 72020P. [Google Scholar] [CrossRef]
- Riegel, S.; Mutter, F.; Lauermann, T.; Terheiden, B.; Hahn, G. Review on screen printed metallization on p-type silicon. Energy Procedia 2012, 21, 14–23. [Google Scholar] [CrossRef]
- Canadian Solar Sets a 22.80% Conversion Efficiency World Record for P-Type Large Area Multi-Crystalline Silicon Solar Cell. Available online: http://investors.canadiansolar.com/news-releases?items_per_page=10&page=3 (accessed on 1 June 2020).
- Kerr, M.J.; Cuevas, A. General parameterization of Auger recombination in crystalline silicon. J. Appl. Phys. 2002, 91, 2473–2480. [Google Scholar] [CrossRef]
- Al-Amin, M.; Grant, N.E.; Pointon, A.I.; Murphy, J.D. Iodine—Ethanol Surface Passivation for Measurement of Millisecond Carrier Lifetimes in Silicon Wafers with Different Crystallographic Orientations. Phys. Status Solidi A 2019, 216, 1900257. [Google Scholar] [CrossRef]
- Aberle, A.G. Surface passivation of crystalline silicon solar cells: A review. Prog. Photovolt. Res. Appl. 2000, 8, 473–487. [Google Scholar] [CrossRef]
- Lee, J.H.; Min, K.H.; Kang, M.G.; Jeong, K.T.; Lee, J.I.; Song, H.-E.; Park, S.; Park, J.-S. Efficiency characteristics of a silicon oxide passivation layer on p-type crystalline silicon solar cell at low illumination. Curr. Appl. Phys. 2019, 19, 683–689. [Google Scholar] [CrossRef]
© 2020 by the authors. Licensee MDPI, Basel, Switzerland. This article is an open access article distributed under the terms and conditions of the Creative Commons Attribution (CC BY) license (http://creativecommons.org/licenses/by/4.0/).