1. Introduction
Over the last few years, power systems around the globe experienced deep changes in their operation, mainly induced by the widespread of Intermittent Renewable Energy Sources (IRES). At European level, this revolution is currently involving a necessary review of market and operational rules, in the direction of a stronger integration among the European countries [
1,
2,
3,
4]. This integration is in progress and based on the measures reported in the new European guidelines and network codes, which deal with multiple issues, from market design to operational security [
5].
In this framework, the European Electricity Balancing Guideline [
6] published on December 2017, has the aim of creating an integrated electricity market, where European TSO can exchange balancing resources, introducing a set of standardized balancing products. Dedicated European platforms for their exchange are under development within the framework of several European projects, for example, TERRE (Trans European Replacement Reserve Exchange) [
7], MARI (Manual Activation Reserve Initiative) [
8], PICASSO (Platform for the International Coordination of Automated Frequency Restoration and Stable System Operation) [
9] and IGCC (International Grid Control Cooperation) [
10]. In particular, TERRE project is aimed at the realization of a European central platform, called LIBRA, for the exchange of balancing sources related to the activation of the procured Replacement Reserve (RR), needed to cope with expected unbalances in the upcoming delivery hour. The Italian Transmission System Operator (TSO), TERNA, is a participant of the project and it is testing new methodologies for the sizing of RR and its required activation throughout the TERRE process, trying to find areas of potential improvement, which opens up the possibility for a reduction of the procurement cost, without endangering the security of the power system. Hence, a new set of standardized products, as well as the new balancing platforms, has to be fully integrated in the framework of the Italian ancillary service market (called “Mercato per il Servizio di Dispacciamento, MSD”) [
11].
The present paper deals with the results obtained through some tests of new methodologies, pointing out the advantages that can be reached. First, the work shows the current reserves dimensioning and procuring rules, adopted by TERNA and how they can match with the standardized European products. The integration of the Italian ancillary service market with the TERRE project is then described. Finally, areas of potential development are identified in order to further improve the efficiency of the reserves sizing and procurement processes, aiming at minimizing system costs and, at the same time, coping with high system security standards.
The paper is organized in five Sections.
Section 2 deals with the Italian electricity market, whose organization is summarized.
Section 3 describes the Italian frequency control service mechanism, linking it to the ancillary service market and it introduces the project TERRE.
Section 4 is dedicated to the RR sizing methodologies to be adopted in the Italian Ancillary Service Market and reports the main results.
Section 5 is dedicated to hour-ahead RR activation demand sizing strategies to be adopted in the framework of the TERRE project.
Section 6 includes the conclusions.
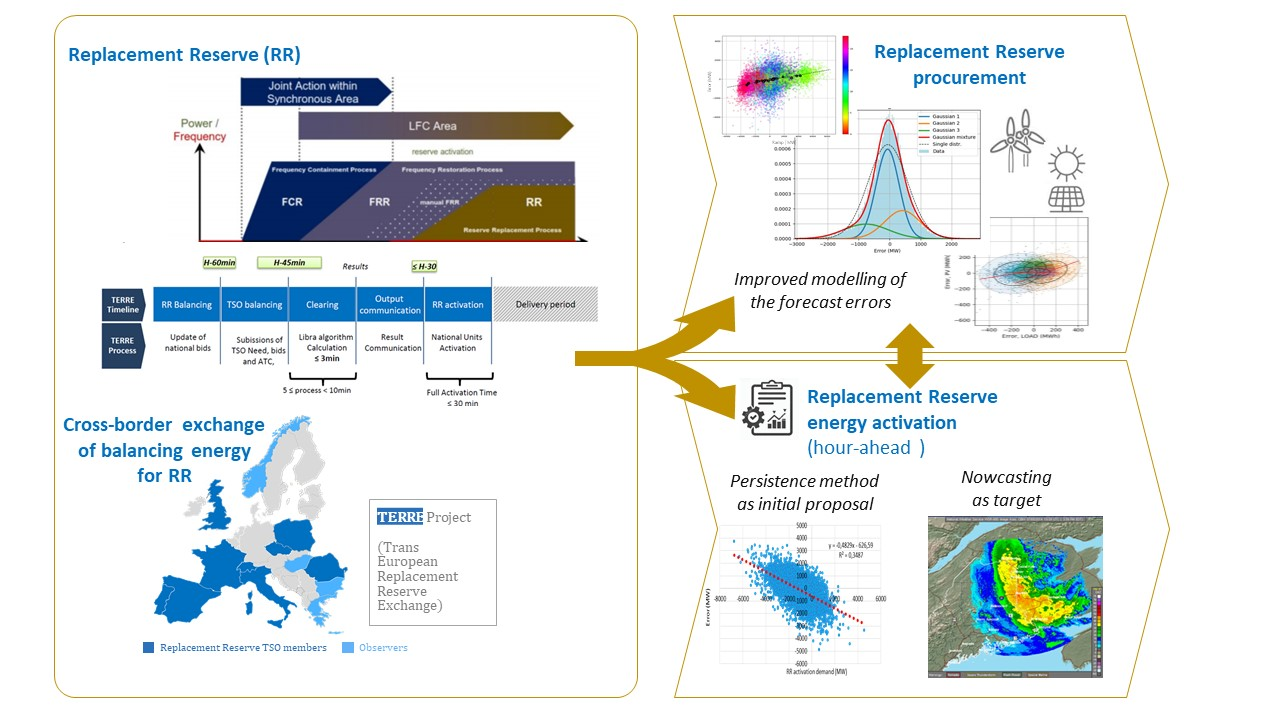
2. Italian Electricity Market
2.1. General Overview
The Italian electricity market was born in 1999 with the Legislative Decree no. 79 [
12], for the transposition at National level of the EU Directive 96/92/EC [
13], later updated by the EU Directive 2003/54/EC [
14] and Directive 2009/72/EC [
15]. It is organized in a Spot Electricity Market (named in Italian, Mercato a Pronti dell’Energia, MPE) and a Forward Electricity Market (named in Italian, Mercato a Termine dell’energia, MTE) [
16]. The Spot Electricity Market includes primary energy markets and ancillary services markets, in particular:
A Day-Ahead Market (DAM), called in Italian Mercato del Giorno Prima (MGP), as a first stage of the energy market;
An Intra-Day Market, called in Italian Mercato Infragiornaliero (MI), as a second stage of the energy market;
An Ancillary Services Market, called in Italian Mercato del Servizio di Dispacciamento (MSD).
Figure 1 shows the structure of the Italian Electricity Market, providing the right match between the general definitions and the Italian name of each market session.
In the MGP and MI, that is, in the energy markets, producers and end-users buy and sell wholesale electricity quantities for the delivery day. The energy markets are managed by the Italian Market Operator, named Gestore dei Mercati Energetici (GME). In fact, according to EU CACM [
17], GME is the Italian NEMO (Nominated Electricity Market Operator) for the day ahead and intraday markets. Both the energy markets are centralized non-discriminatory auctions—the rule for the definition of the final price for the bids accepted is the “clearing price.”
In the MSD and in the MB, that is, in ancillary services markets, the Italian TSO, named TERNA, gets all the means that it needs to operate the national power system, coping with all the relevant security constraints. It consists of centralized discriminatory auction—the adopted pricing rule is based on a “pay as bid” mechanism. TERNA operates in this market to obtain resources for solving congestions, procuring frequency reserves and ensuring the real-time balance of the power system.
Last, the MTE is a Forward Energy Market, where the exchange of energy is based on bilateral contracts between two market operators at freely negotiable prices.
2.2. Italian Energy Markets Details
The Italian Day-Ahead Market (MGP) is the place where the exchange of hourly supply offers and demand bids take place for the next day. All the market operators can join the MGP, with bids that can be simple or multiple, that is, consisting of one or more price-quantity pairs [€/MWh-MWh/h]. The Italian NEMO (GME) manages and selects offers and bids maximizing social welfare, taking into account the transmission limits between bidding zones, notified by the Italian TSO, TERNA. Accepted supply offers are paid at the Zonal Clearing Price. Accepted demand bids are paid at the National Single Price (named in Italian Prezzo Unico Nazionale, PUN). Accepted offers/bids fix the injection and withdrawal schedules of every offer point and for each hour of the following day. The participation at MGP is not mandatory.
The Italian Intra-Day Market (MI) is the place where the trading of hourly supply offers and demand bids take place for the next day, modifying injection and withdrawal schedules resulting from the MGP. It includes seven sessions and enables market participants to adapt their schedules in order to cope with technical restrictions of their conventional power plants, as well as to reflect their most updated forecast for IRES and demand.
The Italian NEMO, GME, matches offers and bids of MI, according to a merit order criterion, considering the residual cross-zonal capacities (after the MPG). Accepted offers and bids are paid at the zonal clearing price (a proper non-arbitrage fee is applied to consumption schedules in order to mitigate arbitrage opportunities induced by the PUN application in the day-ahead market). Accepted offers and bids alter the initial schedules (coming from MGP), defining updated injection and withdrawal schedules. The participation at MI is also not mandatory.
The Italian NEMO join the Price Coupling of Regions (PCR) project [
18], aimed to develop an integrated European day-ahead market algorithm, which simultaneously accepts supply and demand bids, computes energy prices and implicitly allocates cross-zonal capacities over all the coupled European region.
2.3. Italian Ancillary Market Details
The Italian ancillary service market (MSD) is the place where the trading of supply offers and demand bids in respect of ancillary services is managed by the Italian TSO, TERNA. In this market, the Italian TSO selects resources, for solving congestions, procuring frequency reserve and ensuring the real time balance of the power system. The MSD is organized in two stages:
- -
A planning stage (Ex-Ante MSD in Italian), where TERNA accepts offers and bids for relieving congestions and creating adequate reserve margins;
- -
A real-time Balancing Market (Mercato del Bilanciamento, MB, in Italian), where TERNA accepts offers and bid in real time for balancing the system and for relieving congestions.
In both the markets, the demand is expressed by the TSO, while the units authorized to participate in these markets, submit (incremental and decremental) bids.
The participation at MSD is possible only for some units qualified for supplying ancillary services and for them it is mandatory. Each generating units with an installed capacity higher than 10 MVA and technically able to modulate effectively and predictably its production (“Relevant Units”), are forced to participate in this markets. Instead, enabled but not forced to participate are the generating units with an installed capacity lower than 10 MVA, the demand units, the generating units powered by IRES—several pilot projects are ongoing relating to the participation in MSD of non-relevant production and demand units, which can be enabled to MSD on an aggregate basis, forming Virtual Enabled Units (“Unità Virtuali Abilitate, UVA”) [
19].
Offers and bids accepted according to an economic merit order criterion, considering the necessity for safeguarding the right system operation, are valued at the offered price (“pay as bid” criterion). The outcomes of these markets determine the final injection and withdrawal schedules of each offer point and each time interval (against which imbalances are evaluated).
3. Frequency Control Service and Ancillary Service Market
3.1. General Overview
At European level, the power system frequency control is organized in three hierarchical levels, called primary, secondary and tertiary control, with a different involvement of resources (reserve of power), including mainly the synchronous generators connected to the grid [
20,
21,
22].
The primary frequency control is automatic and based on the primary reserve, guaranteed by the synchronous generators connected to the electric grid and running, that have to vary the power supplied, to restore the energy balance and to bring the frequency to a value closer to the nominal one (50Hz). Primary reserve and regulation is currently not traded in MSD but it is a mandatory requirement for all relevant units.
The secondary control is automatic and based on the secondary reserve provided by generators connected to the grid—they have to vary their power supply in order to restore the nominal value of the frequency. The service must be completely delivered within 180 s, so only some generators can provide it. At European level the secondary reserve is called automatic Frequency Restoration Reserve (aFRR), defined as the active power reserves, available to re-establish the frequency to the rated value and, for synchronous areas comprising more than one Load-Frequency Control (LFC) area, to bring back the power balance to the scheduled value.
In fact, FFR includes operating reserves with an activation time typically between 30 s and up to 15 min and it is divided into two types:
- -
automatic Frequency Restoration Reserve (aFRR), activated automatically and in a continuous manner;
- -
manual FRR (mFFR), manually activated by TSO and having, typically, a longer full activation time.
The tertiary frequency control is based on a set of different tertiary reserves, which are active power reserves used for restoring the necessary FRR as well as to cope with forecast uncertainties and/or unexpected events. There are two types of tertiary control reserve:
- -
Spinning tertiary control reserve, fully delivered within 15 min, in order to restore the secondary reserve. It can be activated manually and it corresponds to the European manual Frequency Restoration Reserve (mFRR).
- -
Replacement tertiary control reserve, fully delivered within 120 min and necessary to restore the tertiary reserve against shifts in demand, injection from IRES, long-lasting faults of power plants. It corresponds to the European Replacement Reserve (RR).
In
Table 1 the Italian and the European definitions of reserve are matched.
A key element, peculiar of the Italian electricity market design, is that tertiary reserves (mFRR and RR) are procured only on spot bases in the Ancillary Service Market, which is run after the DAM clearing [
23]. This approach requires tailored reserve dimensioning and procurement strategies. In addition, since RR is not a mandatory product according to the European Regulation [
6], a very wide range of procurement strategies (where applied) are adopted in Europe for its procurement [
24,
25].
3.2. Italian Replacement Reserve (RR) Sizing and TERRE Project
The Replacement Reserve (RR) is divided into upward and downward RR, where the first one corresponds to an increasing in injection or a reduction in withdrawals, the second one corresponds to a reduction in injection or an increasing in withdrawals.
The Italian upward RR is sized to face:
- -
the unplanned unavailability of the thermal production unit having the highest injection schedule in the area (increased by the amount of the upward secondary and tertiary reserve allocated on it),
- -
the demand and IRES forecast errors, assessed for a probability level of 99.7% and assuming the independence of these errors,
- -
the unplanned loss of all the thermal production units in testing.
Instead, the Italian downward RR is sized to face:
- -
the unscheduled unavailability of the pumping storage unit having the highest withdrawal schedule (increased by the amount of downward secondary and tertiary reserve allocated on it),
- -
the demand and IRES forecast errors, assessed for a probability level of 99.7% and assuming the independence of these errors,
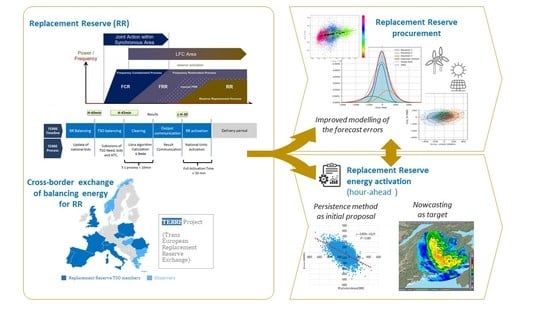
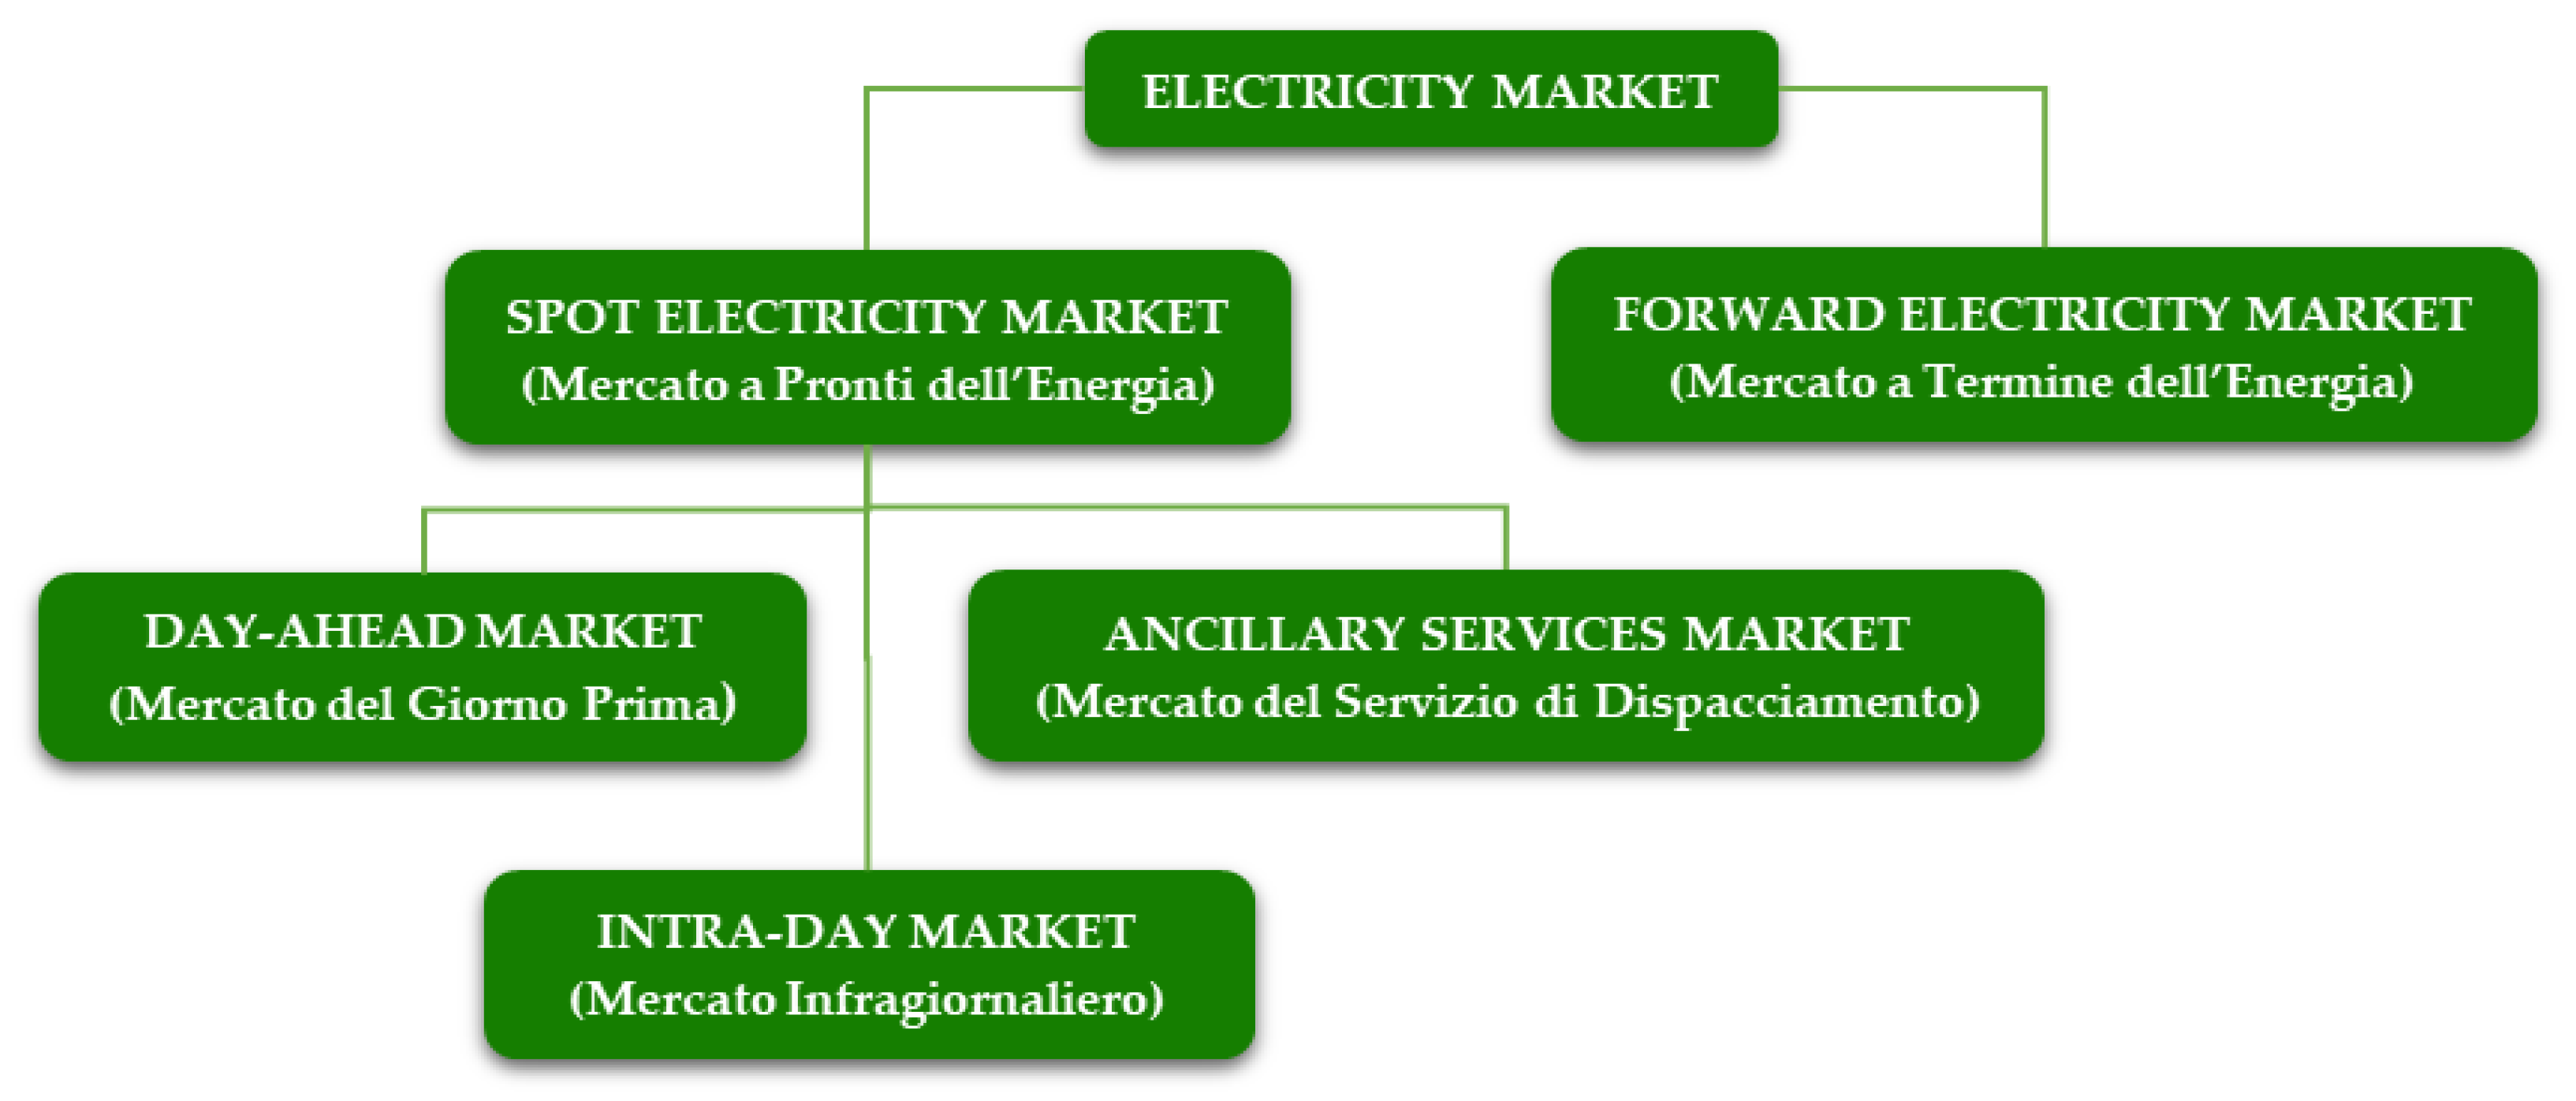
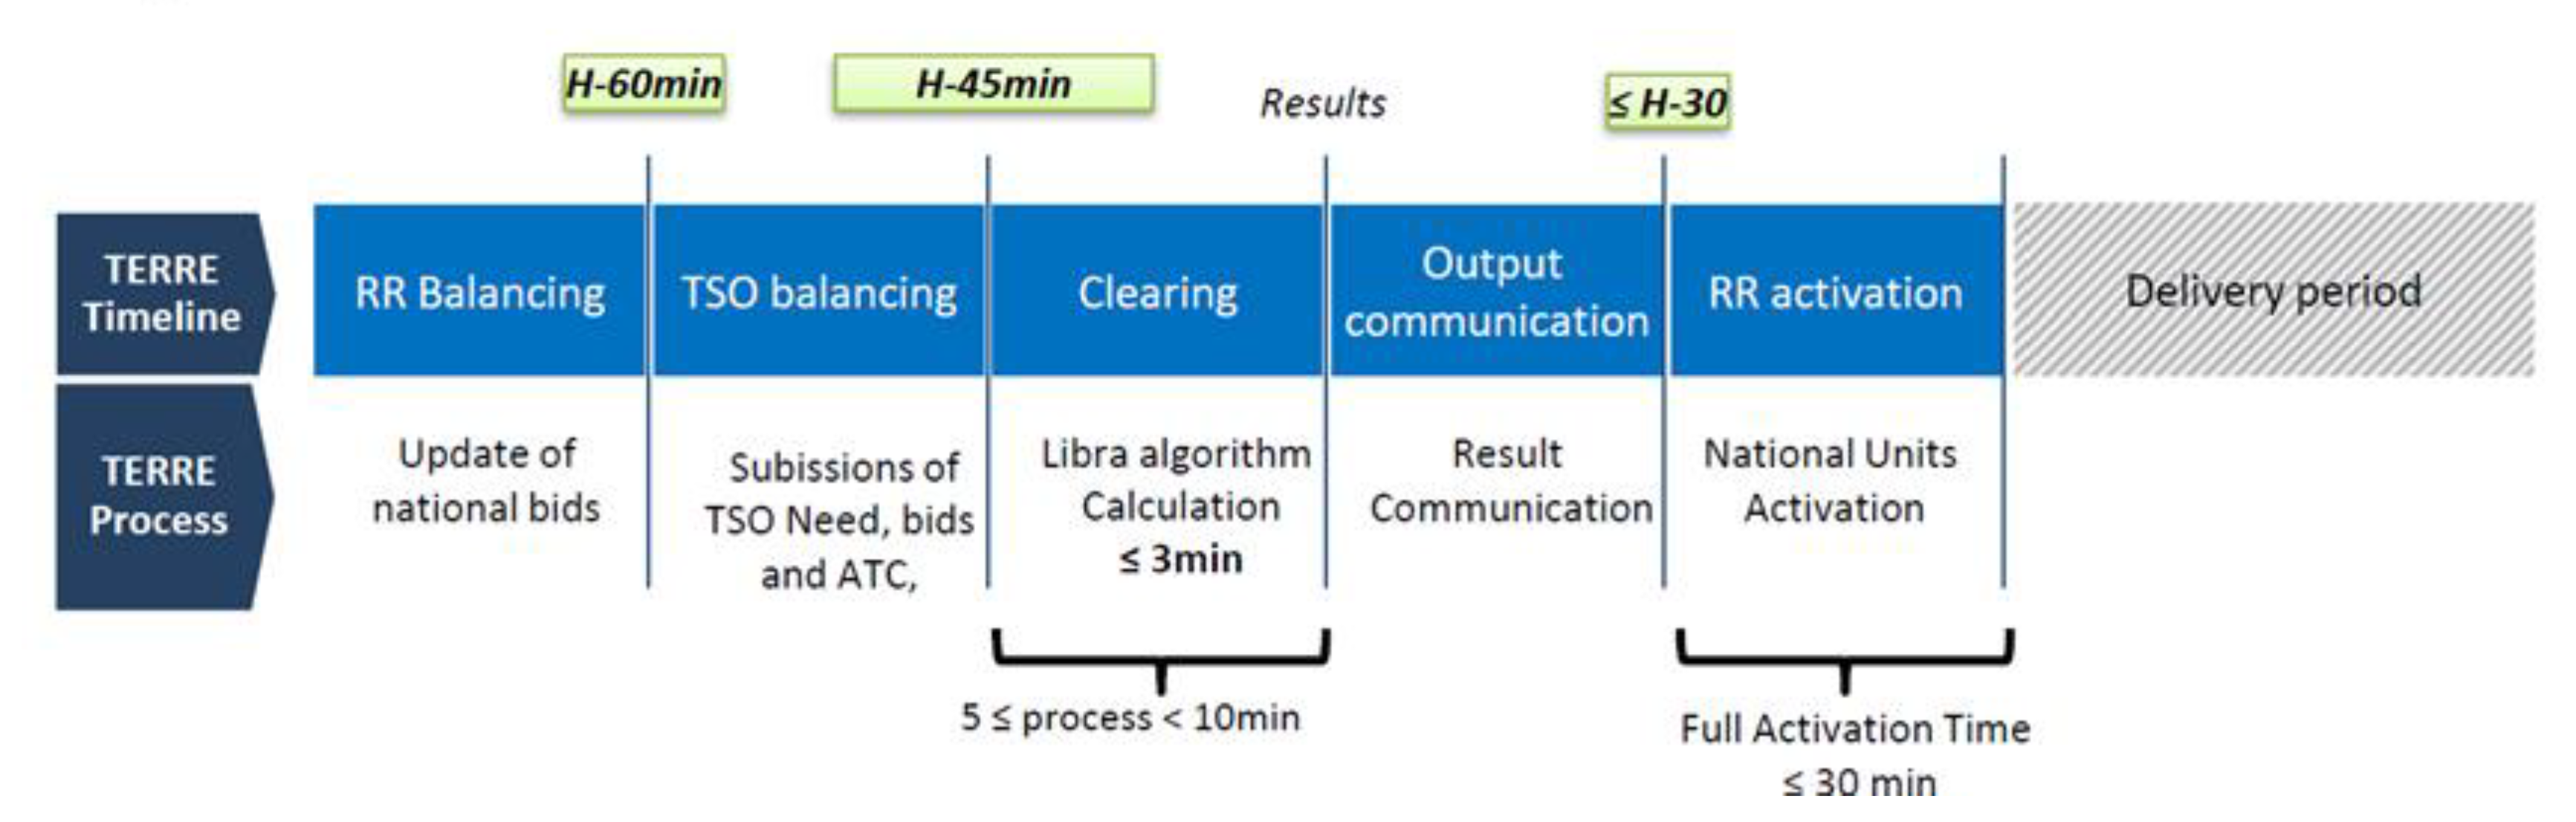
TERRE (Trans European Replacement Reserve Exchange) project is aimed at the realization of a European central platform, called LIBRA, for the exchange of balancing sources for the activation of the procured Replacement Reserve (RR) (
Figure 2) [
26]. The offers will be ordered according to their price, defining a Common Merit Order (CMO) list and they will be activated based on the economic merit and remunerated at the marginal price (
Figure 3) [
26].
Figure 3 shows the time steps in the process of selection of the resources:
The offers will be submitted simultaneously to the ones for the real-time Italian balancing market phase. It means that TERNA will be able to balance the system, using at the same time two resources—the resources from LIBRA (defining their need, in a time between H-60’ and H-45’ and activating them at the time H-30’) and the resources from the Italian balancing market (defining their need at the time H-30’ and activating them at the time H-15’). A different offer structure is adopted in the two processes—at national level the offers have 3 upward/downward steps, while TERRE offers will have only one upward/downward step.
4. Identification and Test of a New Methodology for Sizing RR Requirements
Related to the RR sizing, areas of potential improvement have been identified and proposed as an alternative methodology, which opens up the possibility to a reduction of the procurement cost, without endangering the security of the electric system.
4.1. New Sizing Methodology for RR Requirements
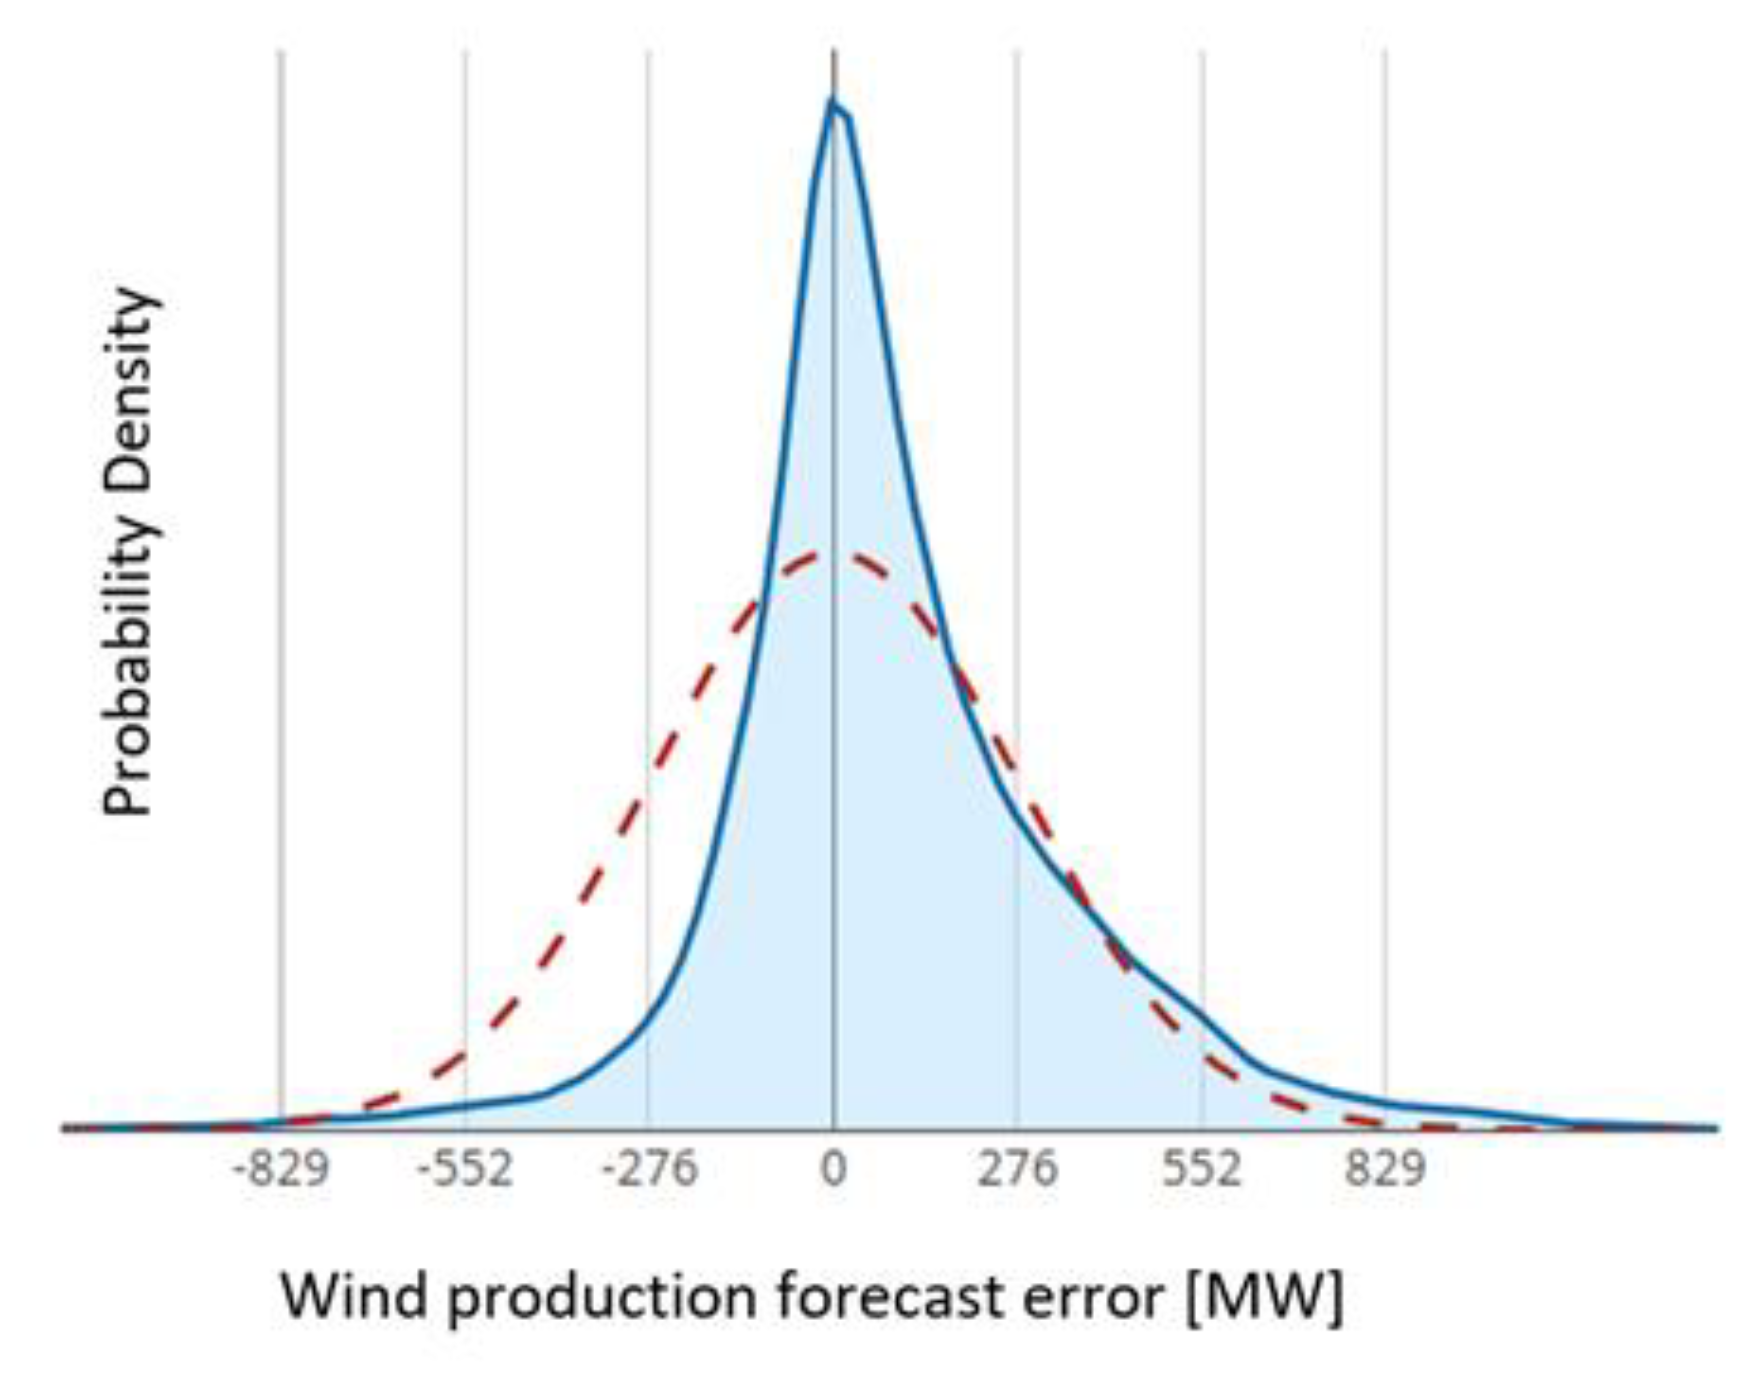
A new methodology for sizing the RR has been proposed in relation to the forecast error component. An assessment of the actual forecast errors, occurred in the years 2017 and 2018, identified a non-normality in the distributions of the errors for load, wind and photovoltaic production forecasts (in terms of hourly average power infeed). Consequently, the ranges currently adopted for sizing the RR does not exactly correspond to the expected reliability standard of 99.7%, due to the presence of wider tails.
Figure 4 shows the (wind) forecast error distribution registered by TERNA in 2017 and 2018, compared to a normal distribution—a sizing methodology that assumes a normal distribution could underestimate the expected level of risk (or lead to an oversizing).
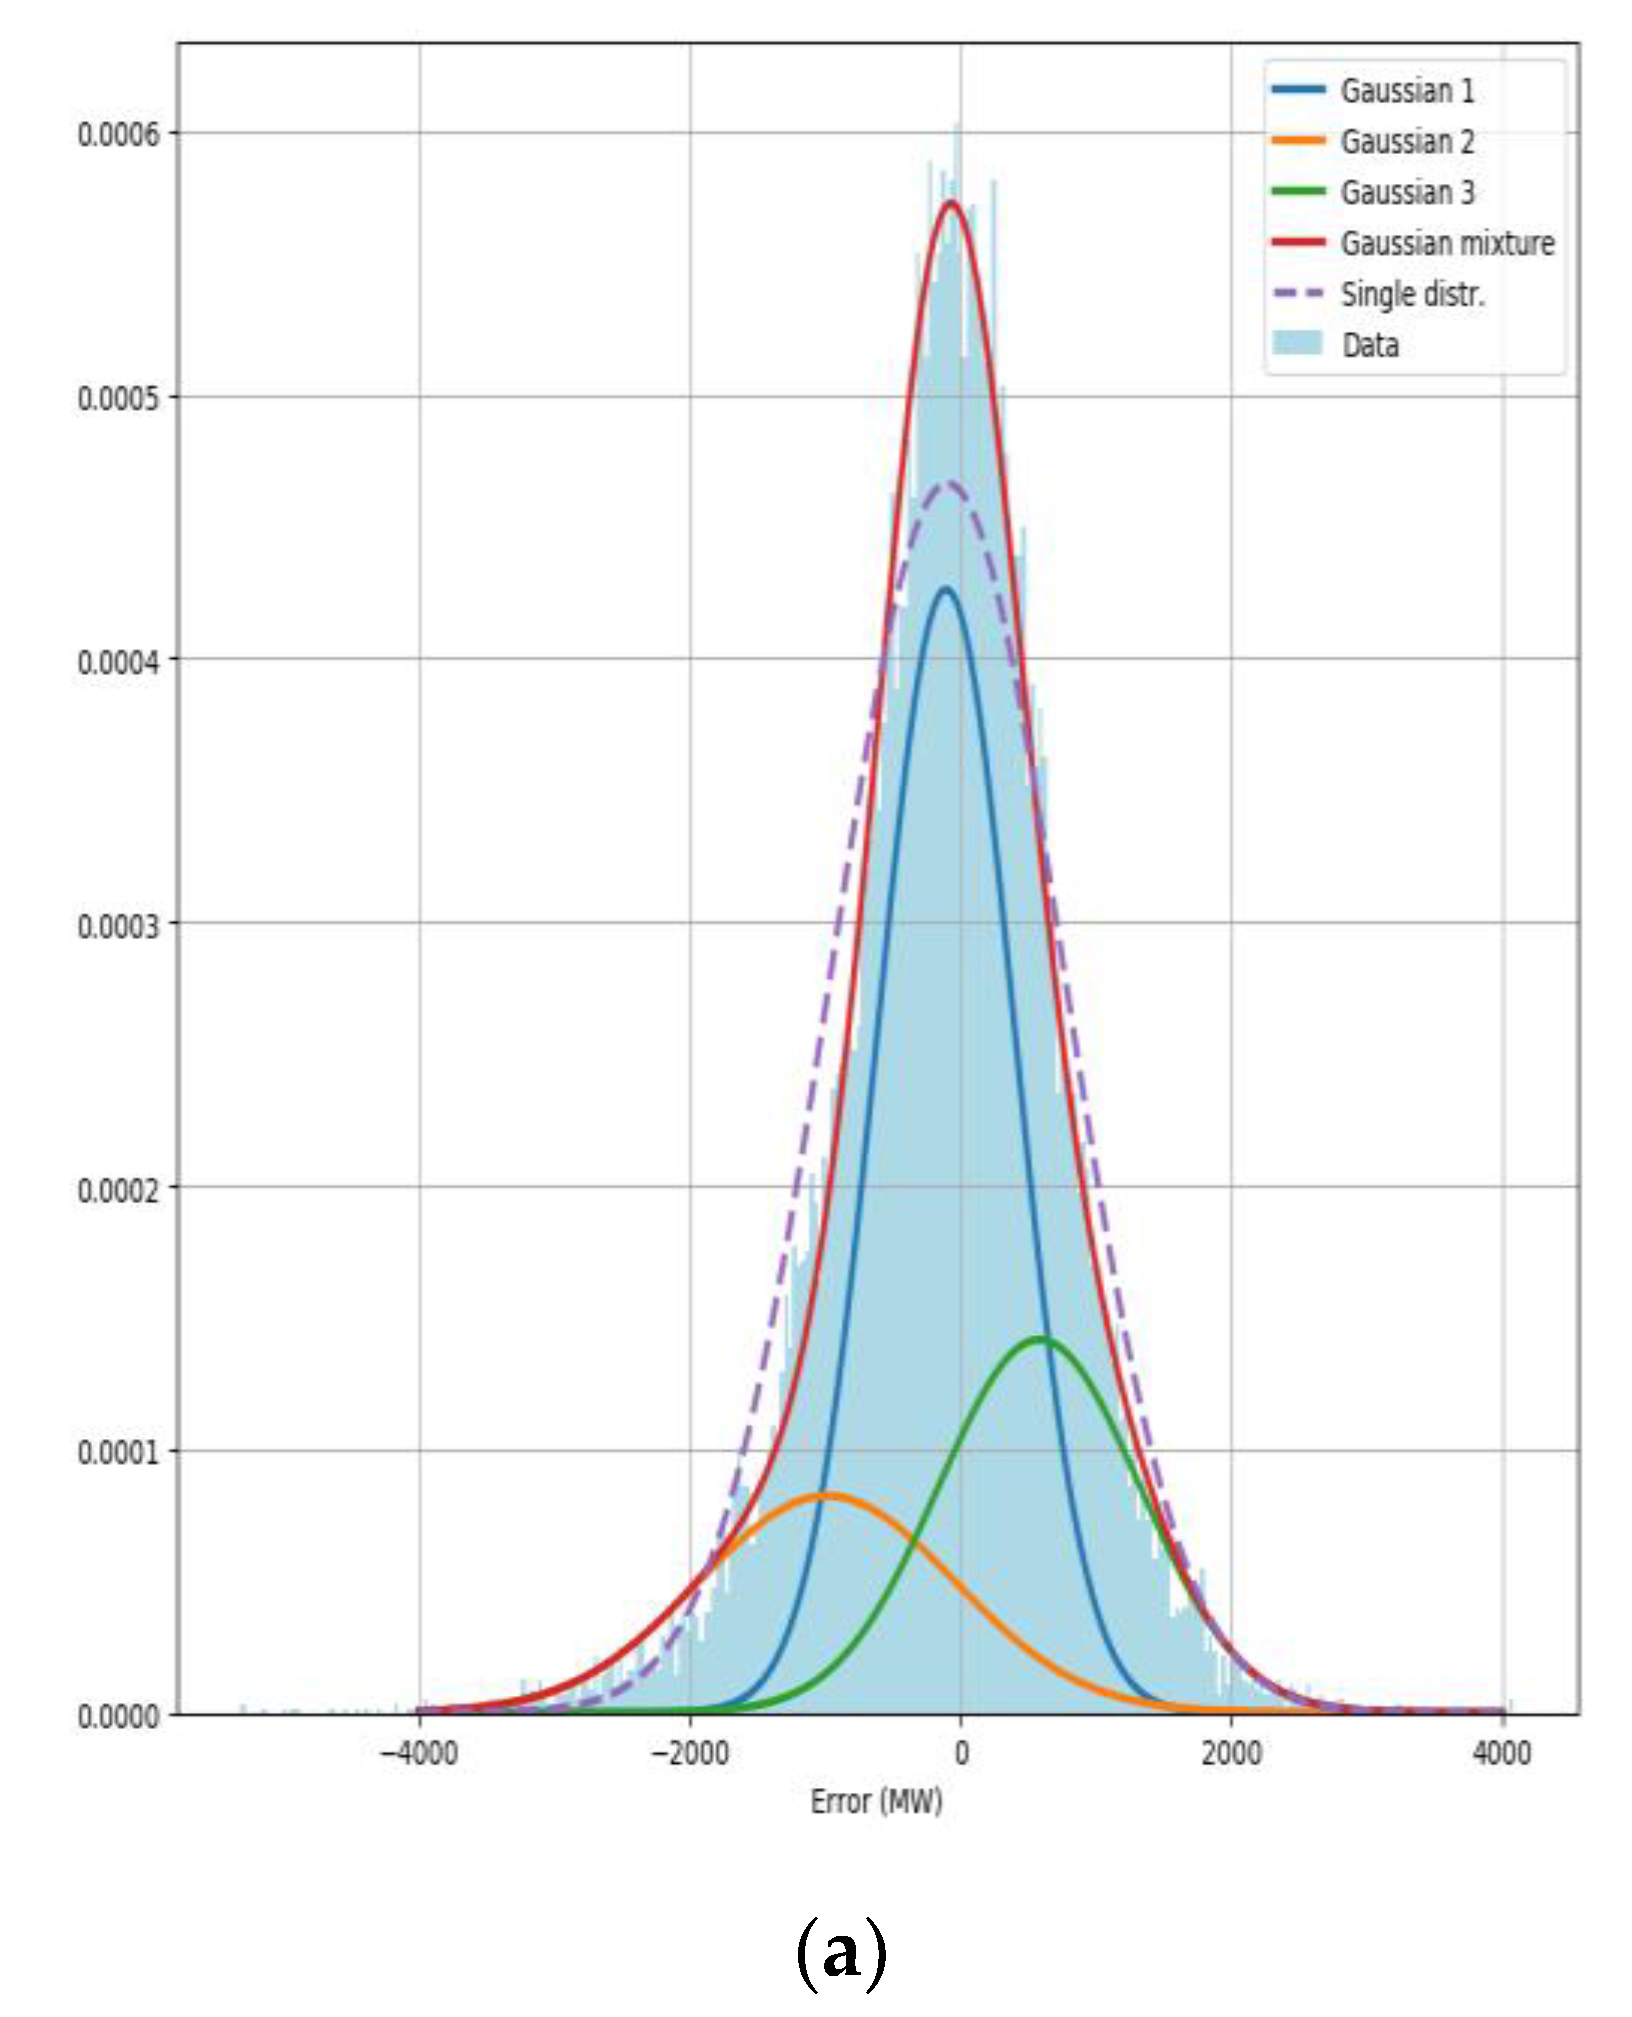
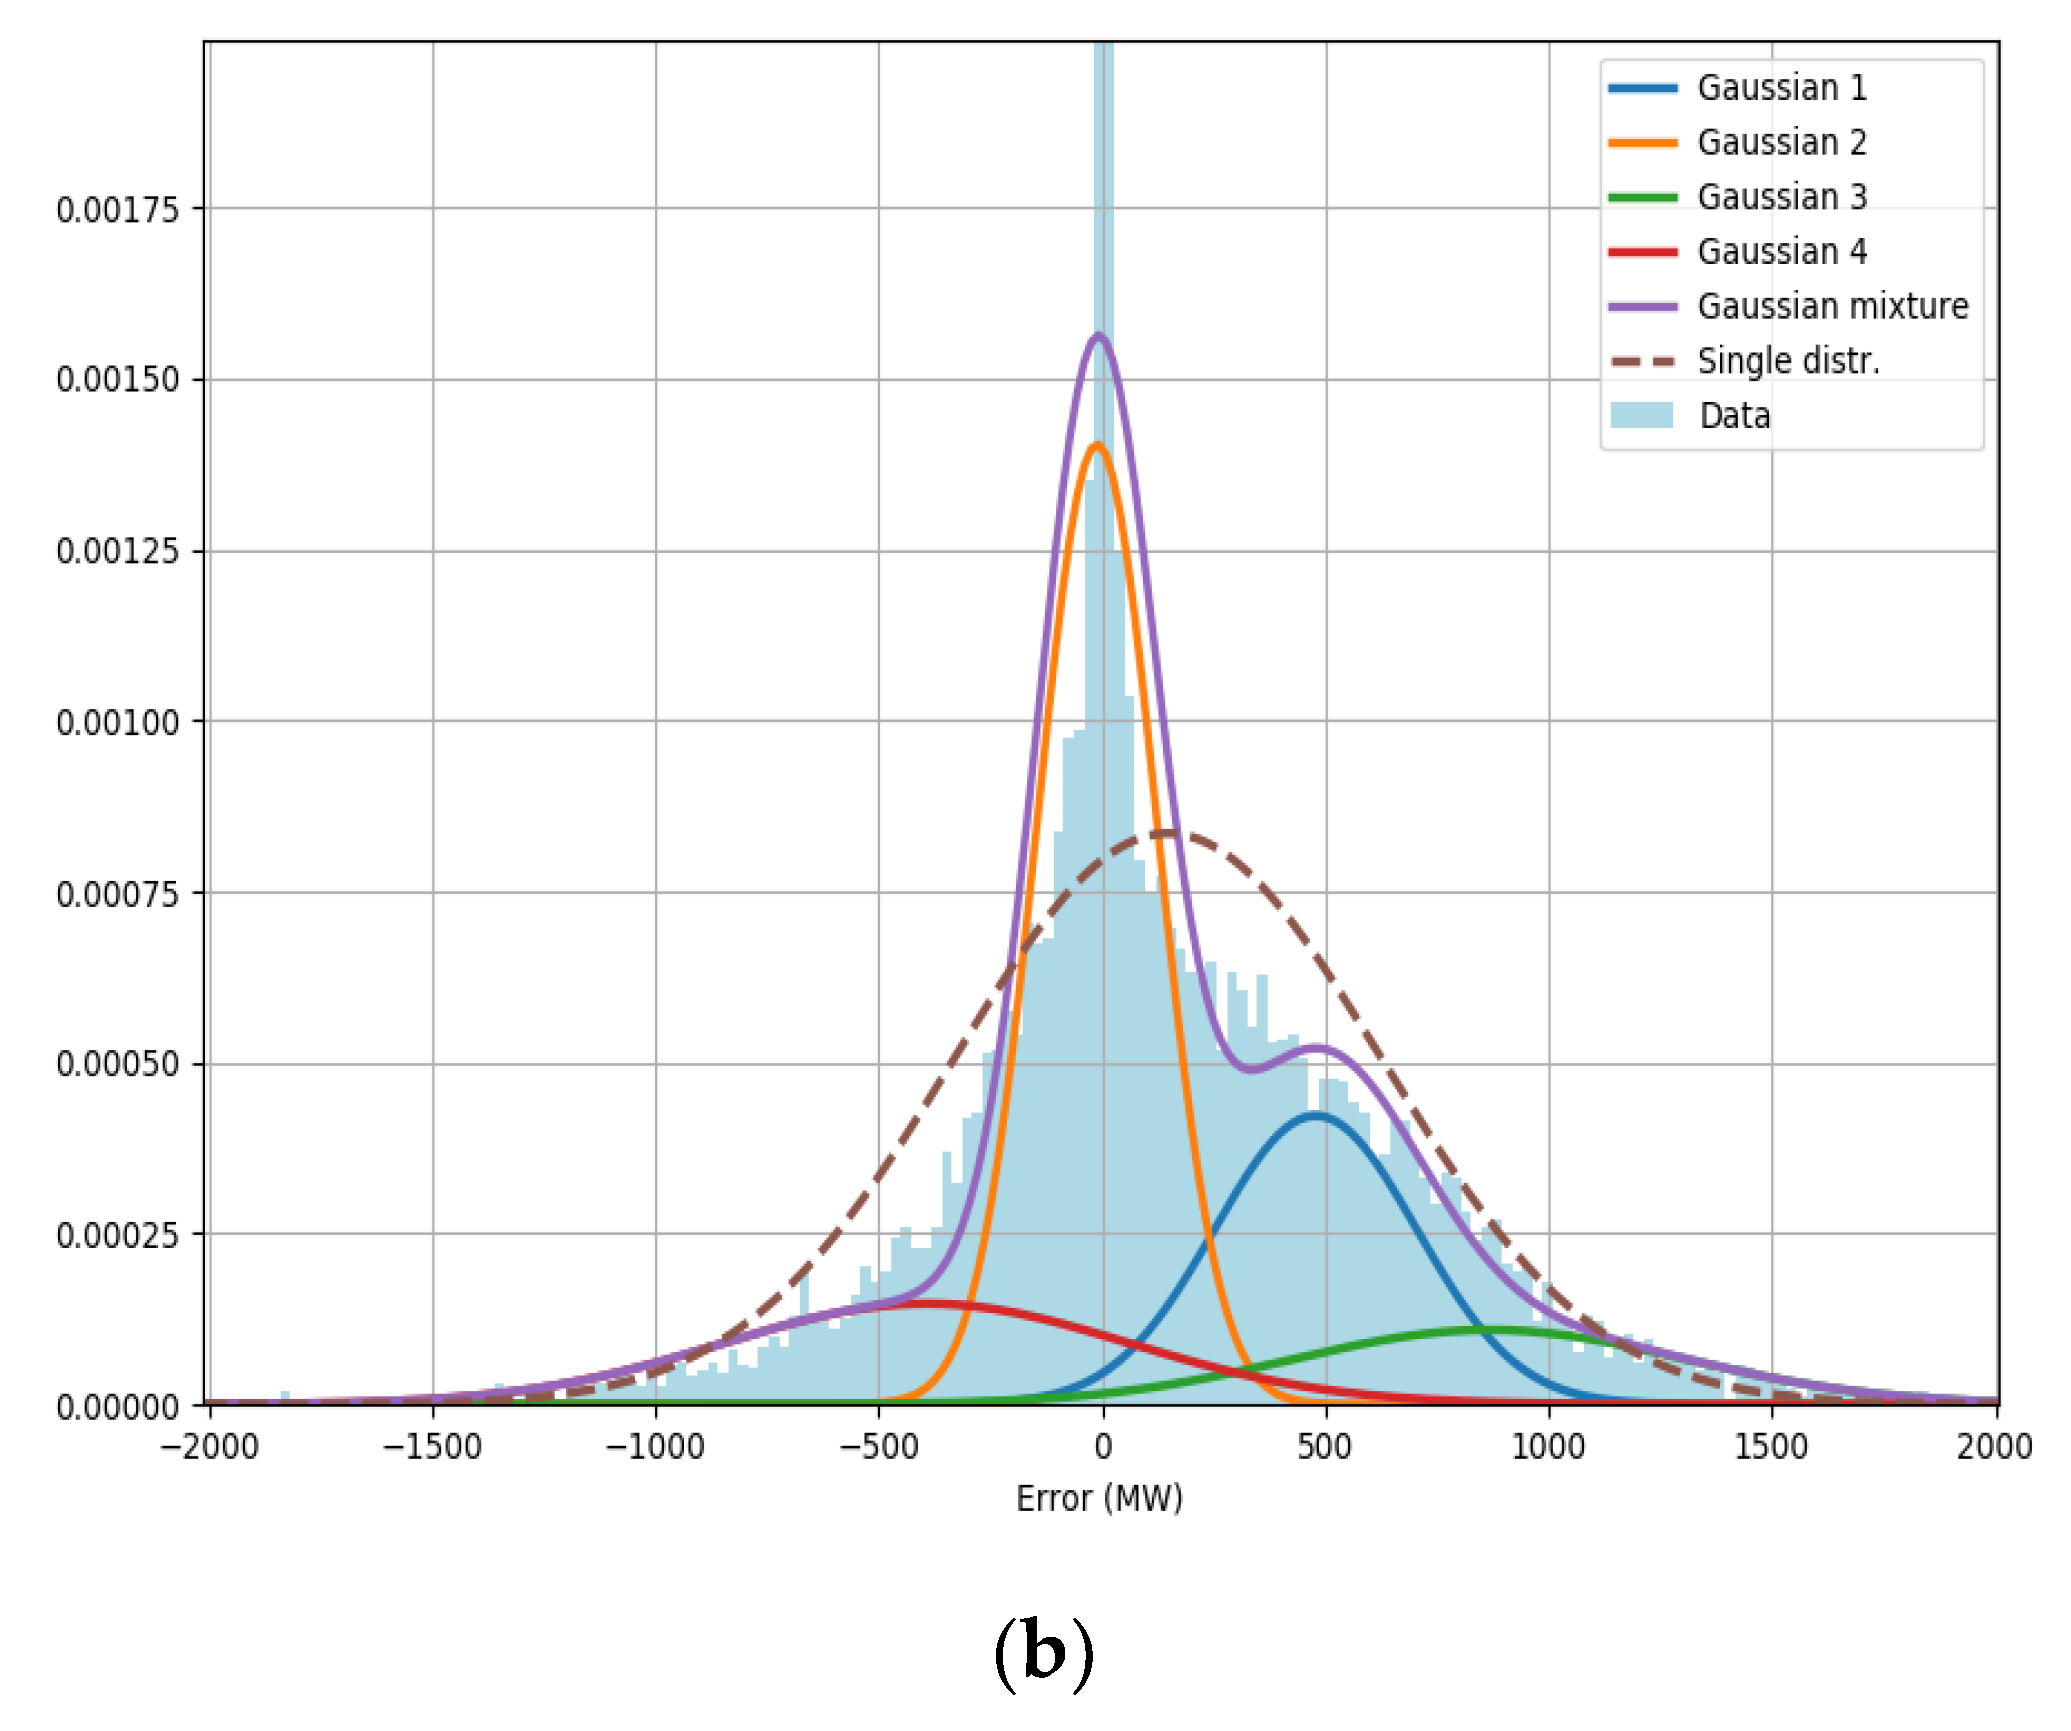
In a first stage, in order to obtain a better representation of the error distribution (for the whole Italian power system as well as for each bidding zone), the univariate Bayesian Gaussian Mixture Model (BGMM) has been adopted [
27]. This method aims at modeling the error distribution as a linear combination of a finite number of Gaussian distributions with unknown parameters and, for the extent of our knowledge, it is the first time that it has been applied to this problem. Means, variances and weights of the Gaussians are determined adopting the Expectation-Maximization (EM) algorithm. The model found a three Gaussian decomposition suitable for load and wind forecast error modelling, while four Gaussians are needed for properly modelling solar forecast error.
Figure 5 shows the load forecast error decomposition for the whole Italian power system. The final distribution (“Gaussian Mixture”) is shown, as well as its components (Gaussian 1, 2, 3 and, where used, 4) and compared with a single Gaussian distribution. The resulting BGMM distribution allows to better compute the amount of upward and downward reserve needed to cover the 99.7% reliability standard.
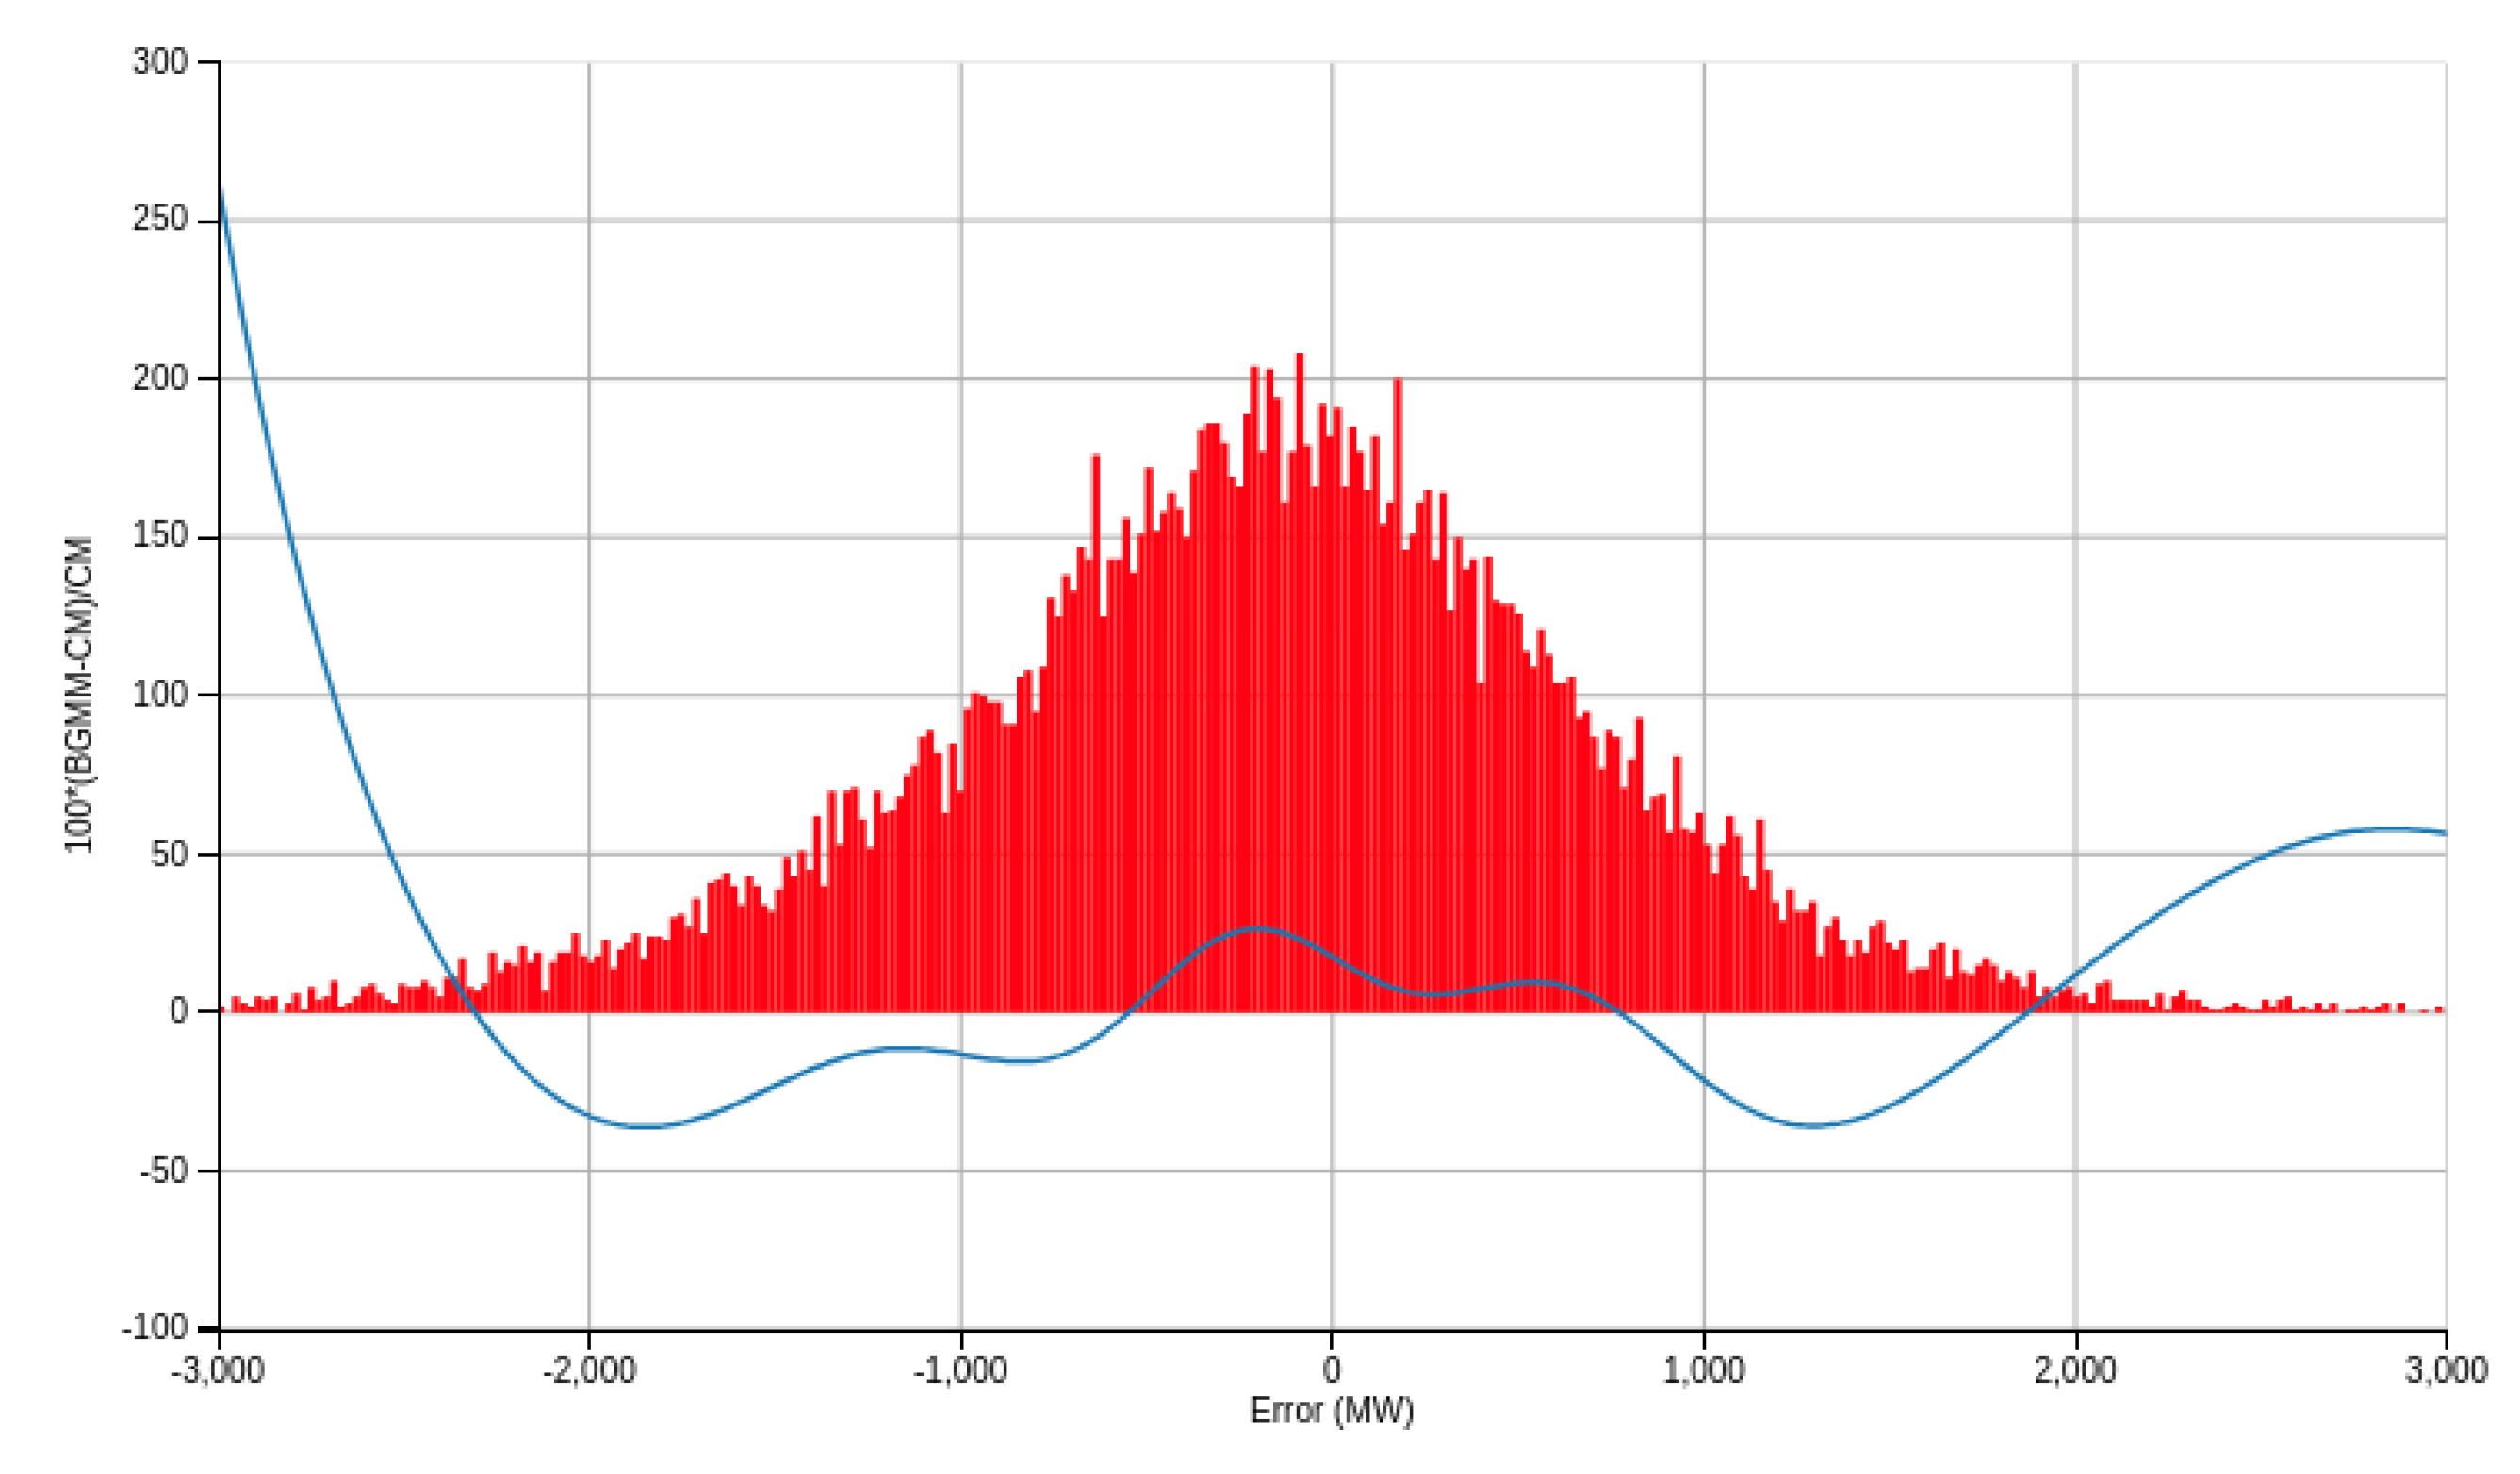
Figure 6 shows the difference between the BGMM distribution and a classical normal distribution approximating actual forecast error for national load—the largest differences occur in the tails, where the BGMM model better appreciates the long tails of the actual distribution of the forecast error. The blue line is the difference computed as (BGMM-CM)/CM, while the red bars simply show the actual forecast error distribution (using an arbitrary y-axis), as a reference for better appreciating the impact of the difference. This is relevant because the 99.7% reliability standard adopted for dimensioning RR requirements is hugely affected by the tails representation.
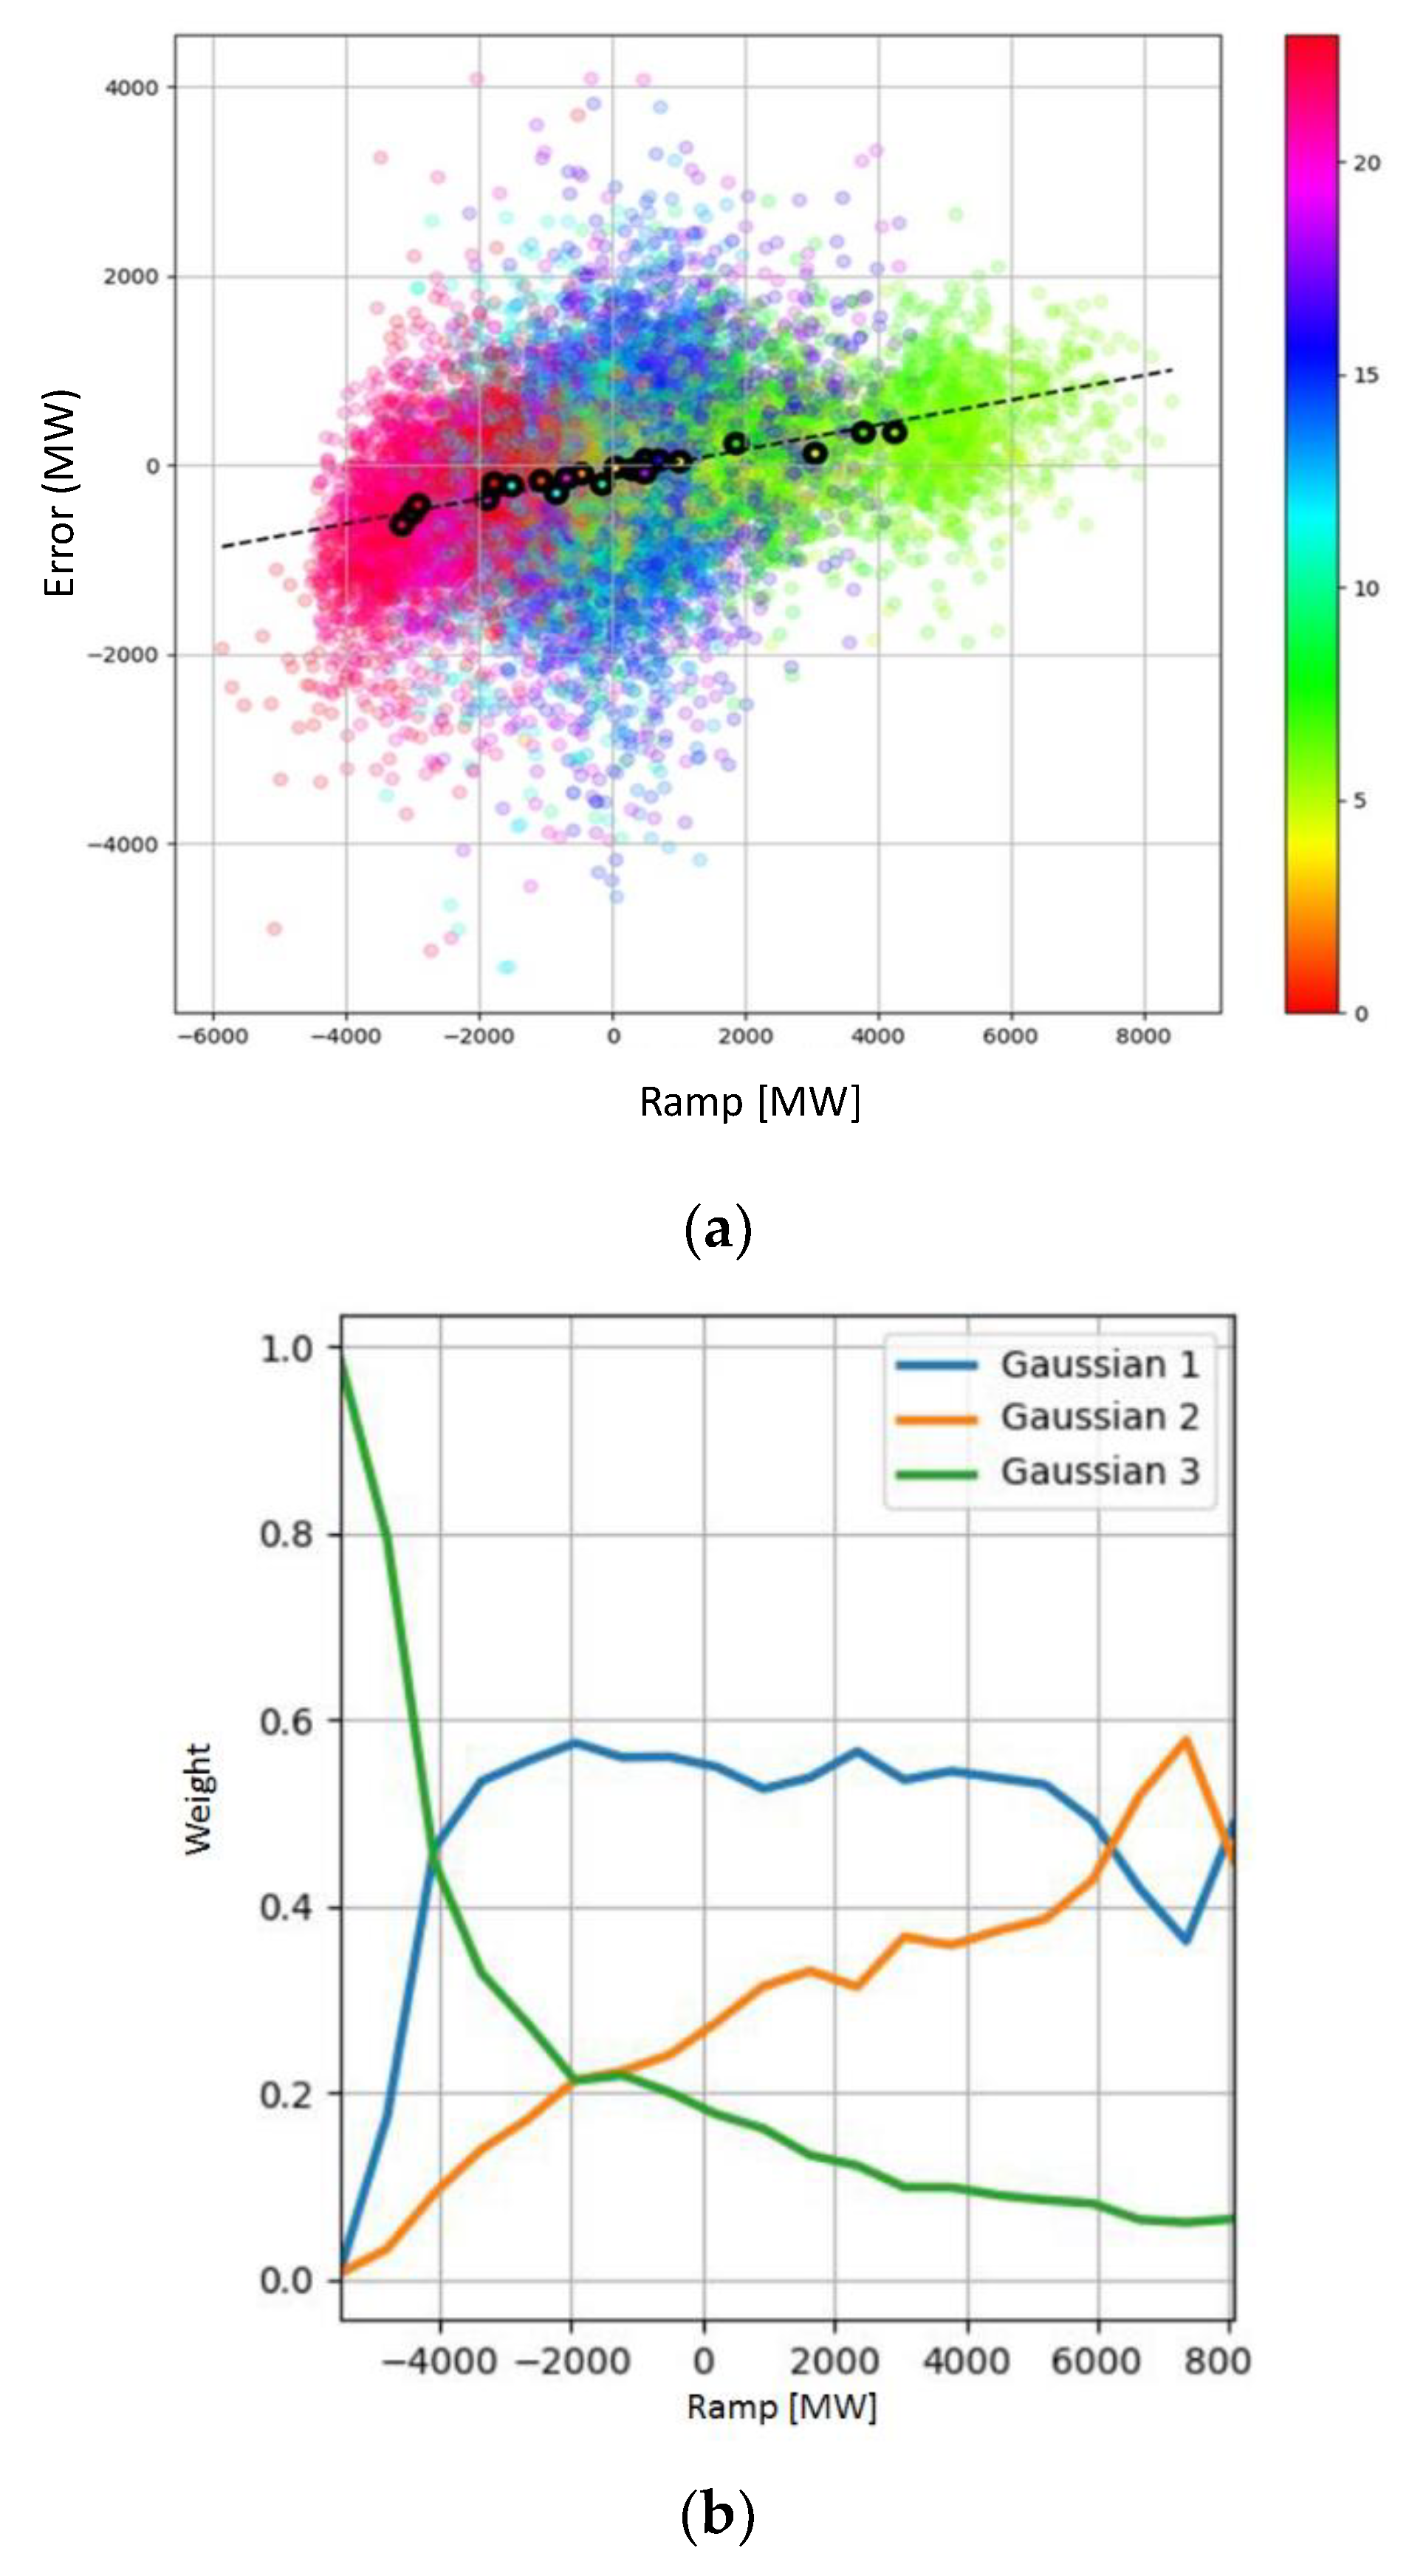
In a second phase, a data driven analysis has been made to understand if the error clusters, identified by the BGMM, were related to specific quantities, exogenous variables or operating conditions. An excellent regressor for the forecasting load error is the expected ramp value, defined as the difference between the load at hour h + 1 and the load at hour h—in
Figure 7a a scatter plot of 2017 and 2018 data is shown (hourly ramp value on x-axis and forecast error on y-axis) together with their linear regression. Here the main parameters of the regression:
Hence, weights of the Gaussians used for representing load forecast errors can be expressed as function of the hourly load ramp—results are shown in
Figure 7b.
Therefore, the analysis has confirmed the possibility to adopt dynamic formulations of the forecast errors, allowing sizing the reserve requirement based on expected operating conditions.
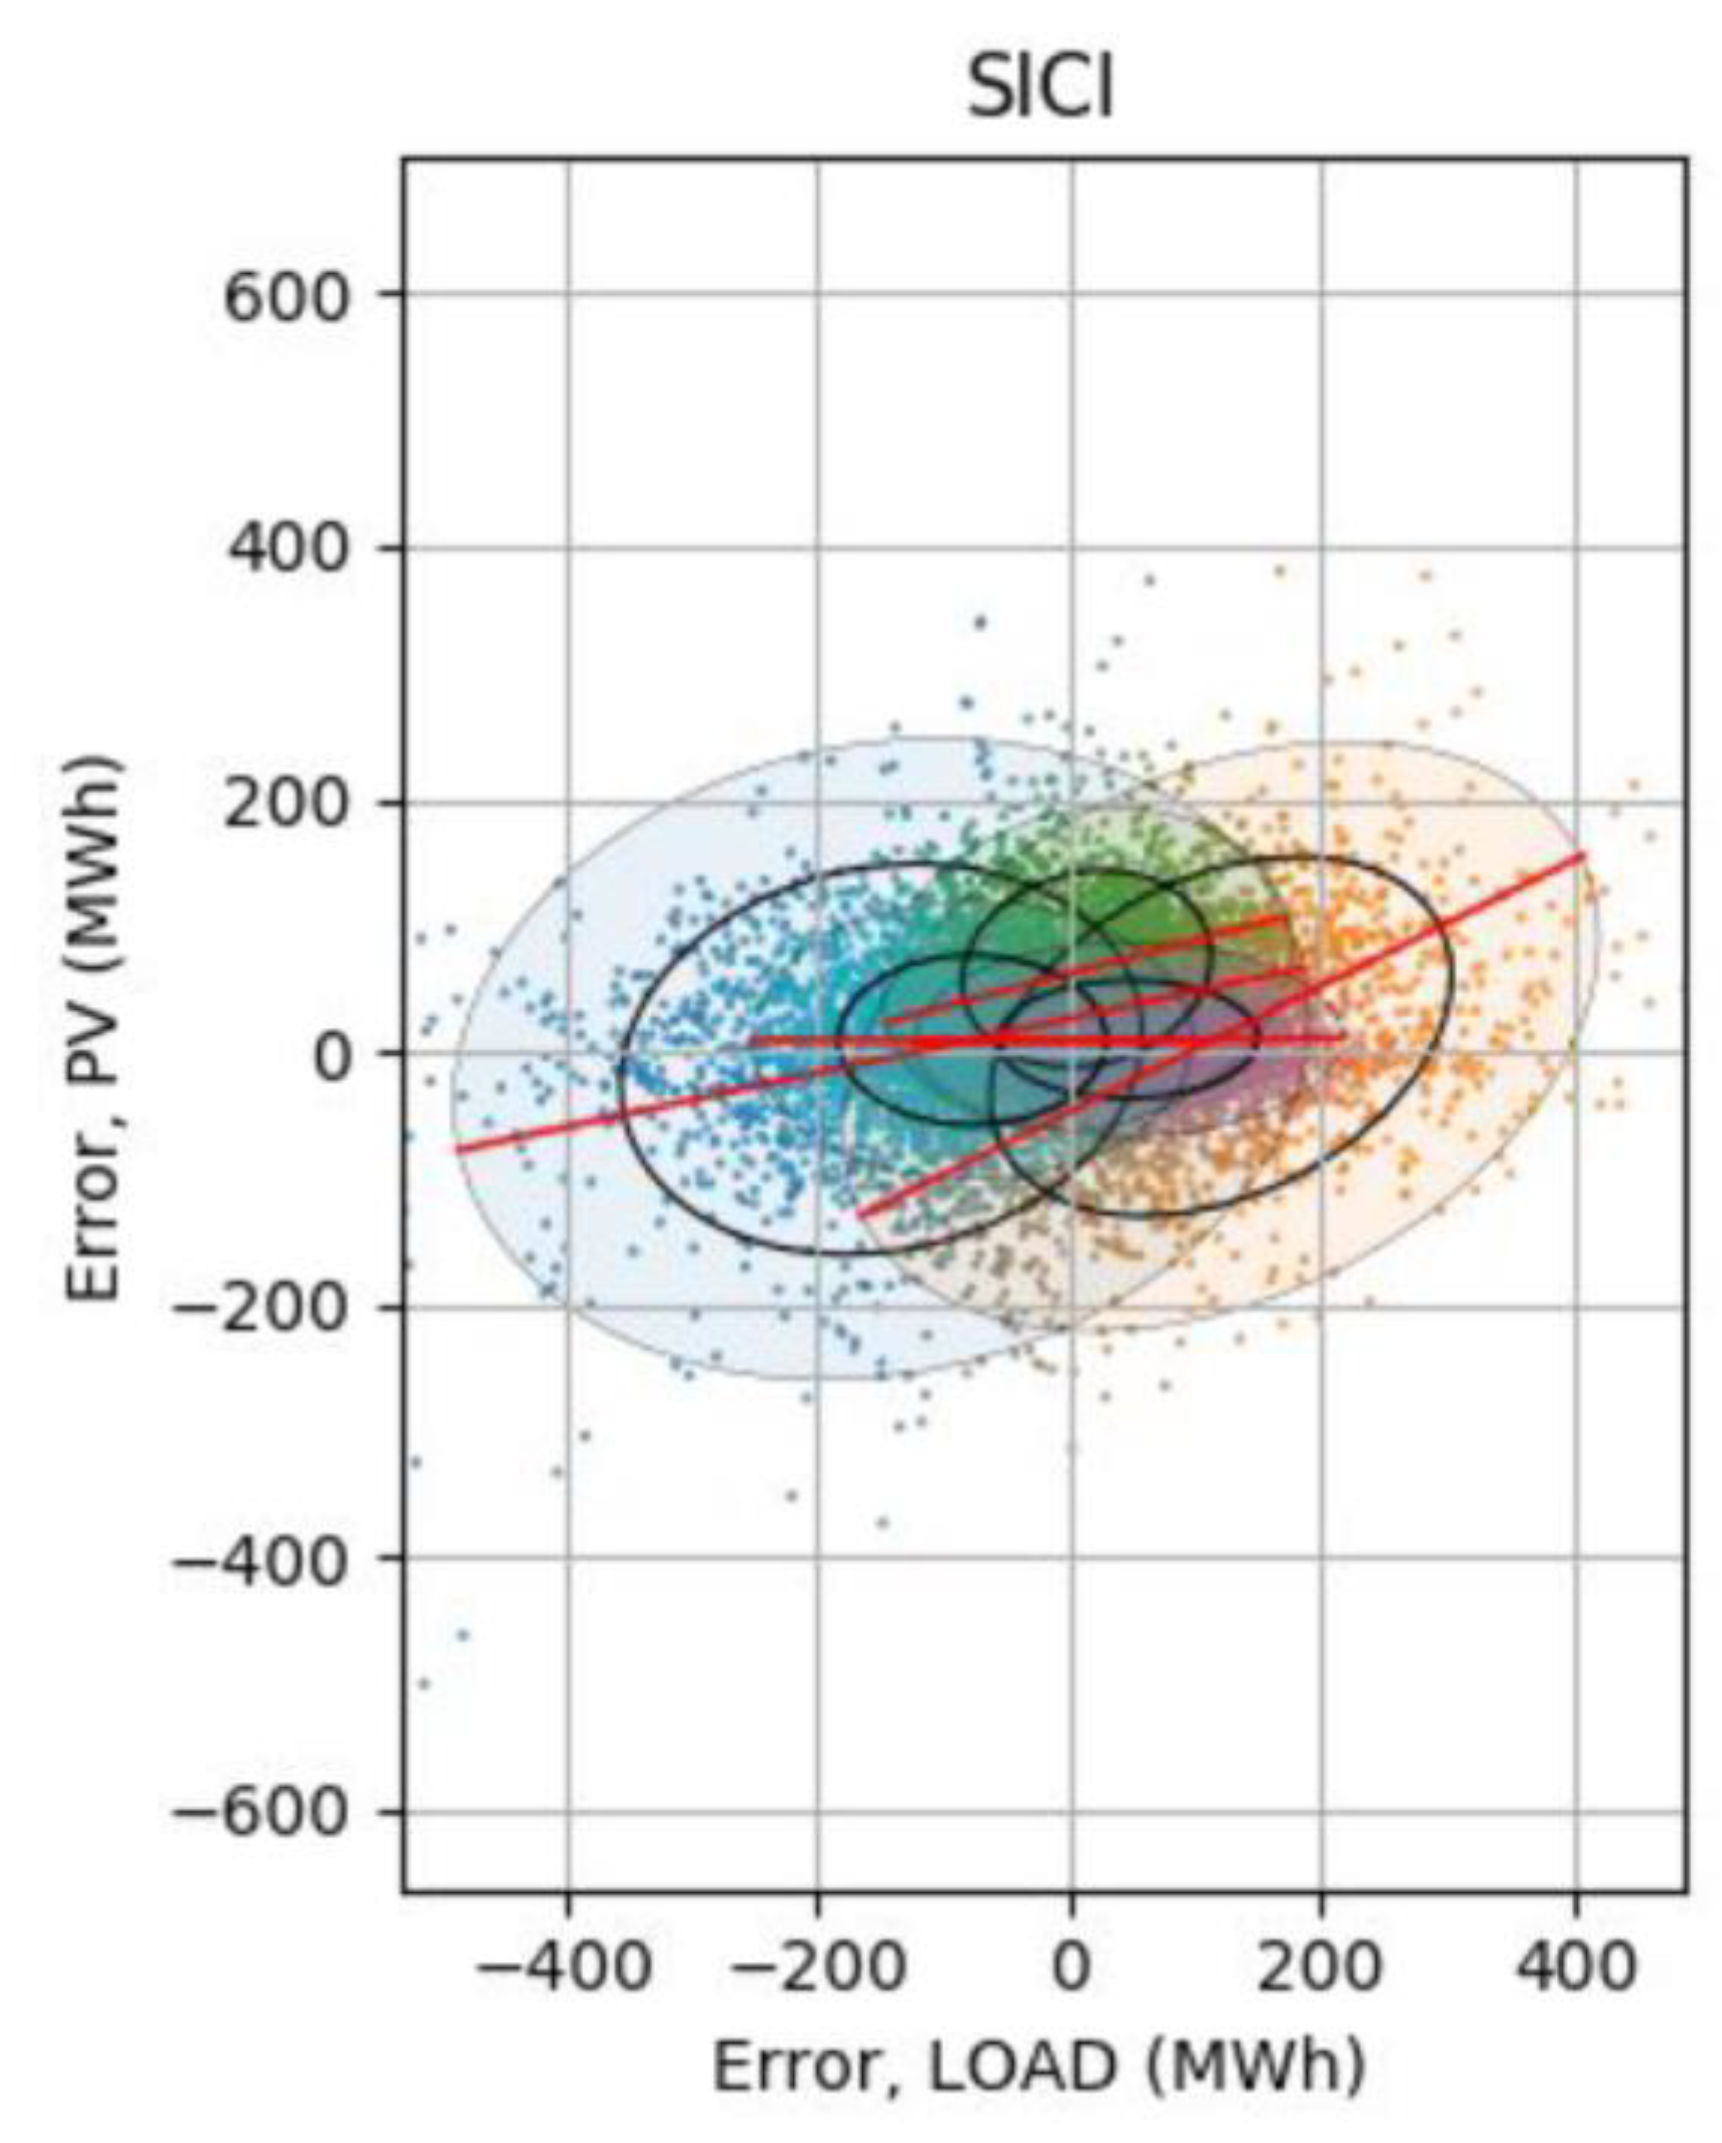
Another aspect studied is the potential correlation between the errors of different variables involved in the same market zone, initially assumed as independent. The study has been performed with a bivariate BGMM and revealed the existence of correlations between the load forecast error and the photovoltaic production forecast error for some bidding zones and for some particular clusters.
Figure 8 shows bivariate BGMM distributions approximating forecast error for Sicily bidding zone—results suggest to classify samples in 4 clusters, where the link between solar and load forecast error is different (the purple class, with a horizontal BGMM distribution clearly represents night hours). Instead, the wind production forecasting error has not revealed a significant statistical correlation with the other two variables.
The adoption of the new method and of the correlations between the variables could bring an optimization in the procurement of services, allowing sizing the requirement of reserve, in order to guarantee the security of the system with a level of effective risk of 99.7% and avoiding over/under procurements. In particular, instead of assuming independent errors for all the variables, for each relevant cluster of system conditions (and according to the available forecast), the reserve for coping with the 99.7% risk could be dimensioned using the most appropriate (bivariate or univariate) distributions.
4.2. Comparison between Methods Existing
A comparison between the new and the currently applied methods has been carried out for six days of the year 2019. The reserve value obtained from the application of the two methodologies have been grouped for the whole Italian system hourly.
Figure 9 shows the comparison between the hourly average values obtained applying the bivariate Bayesian Gaussian Mixture Model (blue lines) and the values obtained applying the classic methodology (orange lines), both for the upward and for the downward errors.
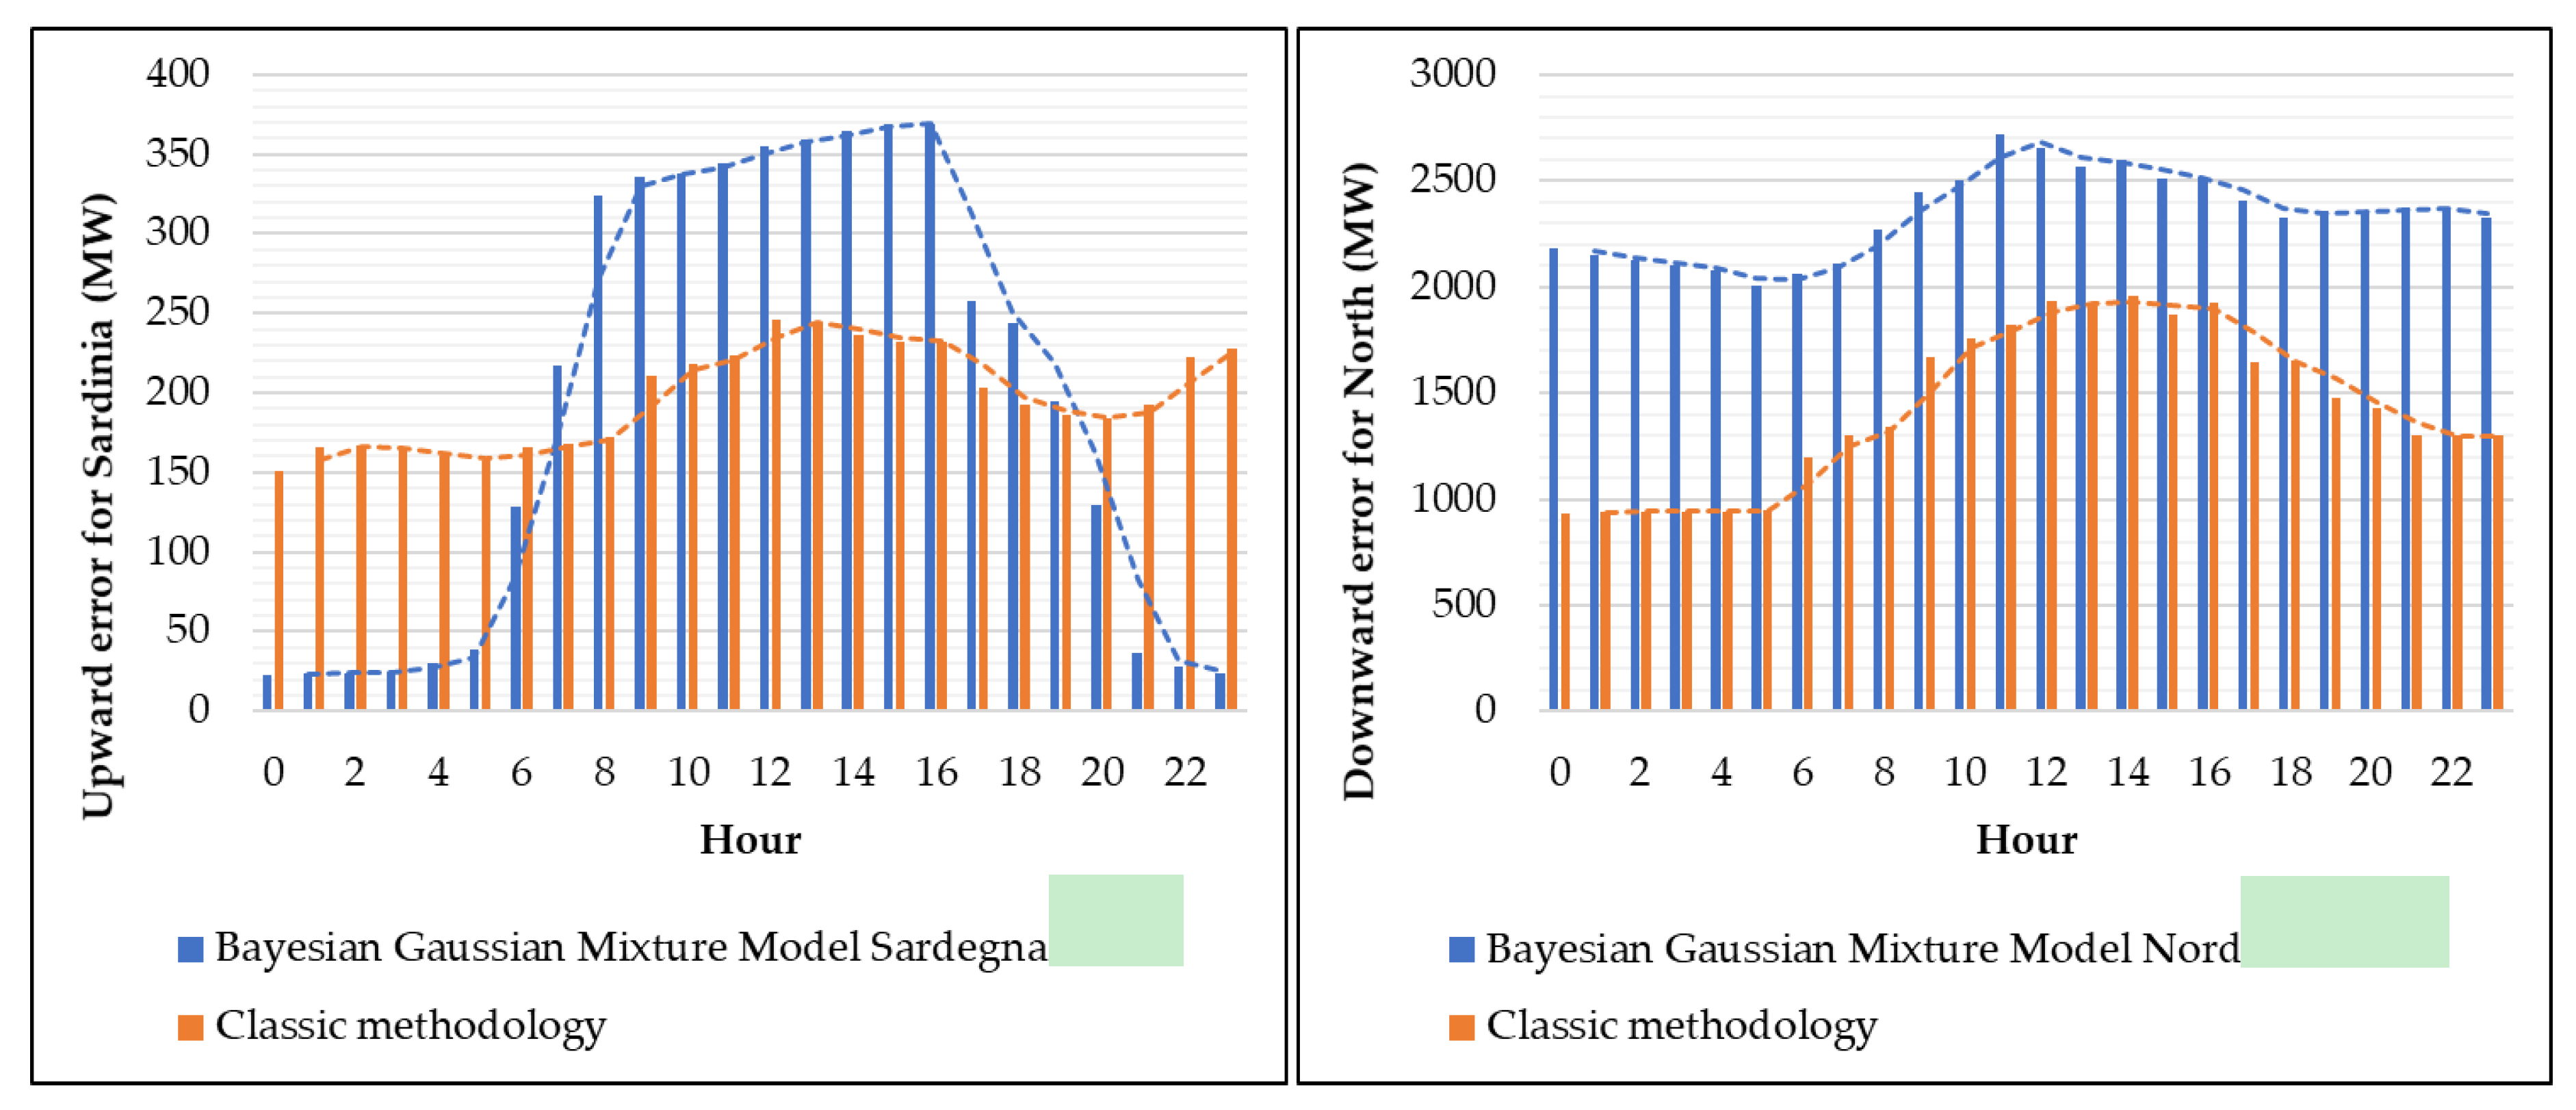
It is clear that, at a national level, there are not significant differences. Zooming in the analysis in reference to the Italian market bidding zones (formally established in [
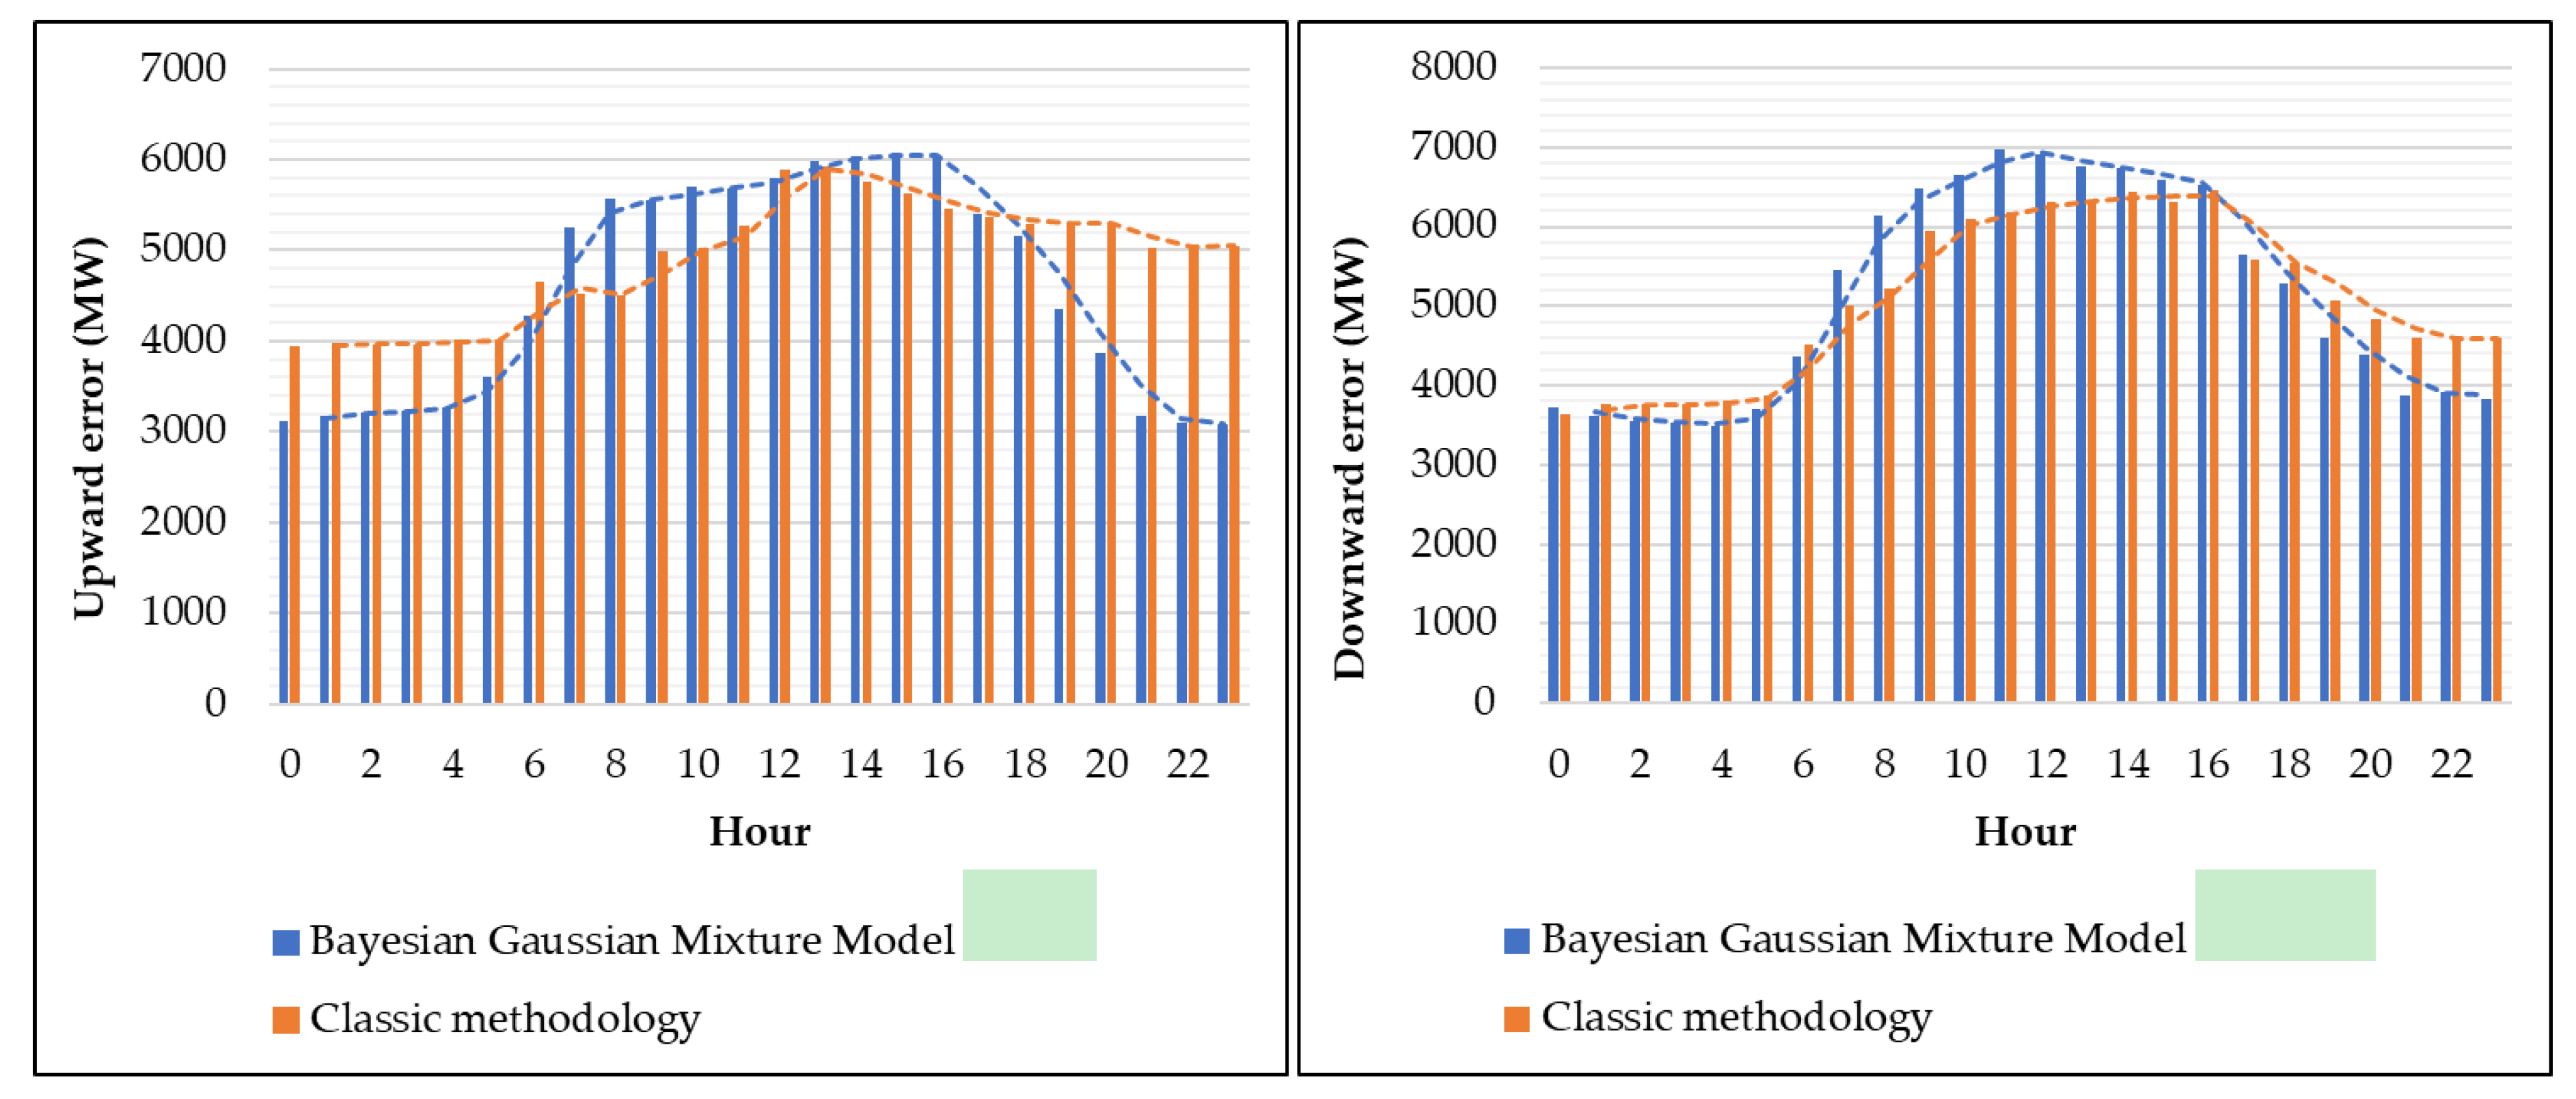
28]), the results change. For example, in reference to the North and Sardinia zones, the new methodology is providing higher values of downward reserve requirements in the North zone, while it is showing a strong dependency on the time interval in the Sardinia zone (highlighting a strong dependency from the solar profile).
Figure 10 refers to the upward error for Sardinia zone and downward error for North zone, hour by hour, where each hour represents the average of values of the six days in the same hour.
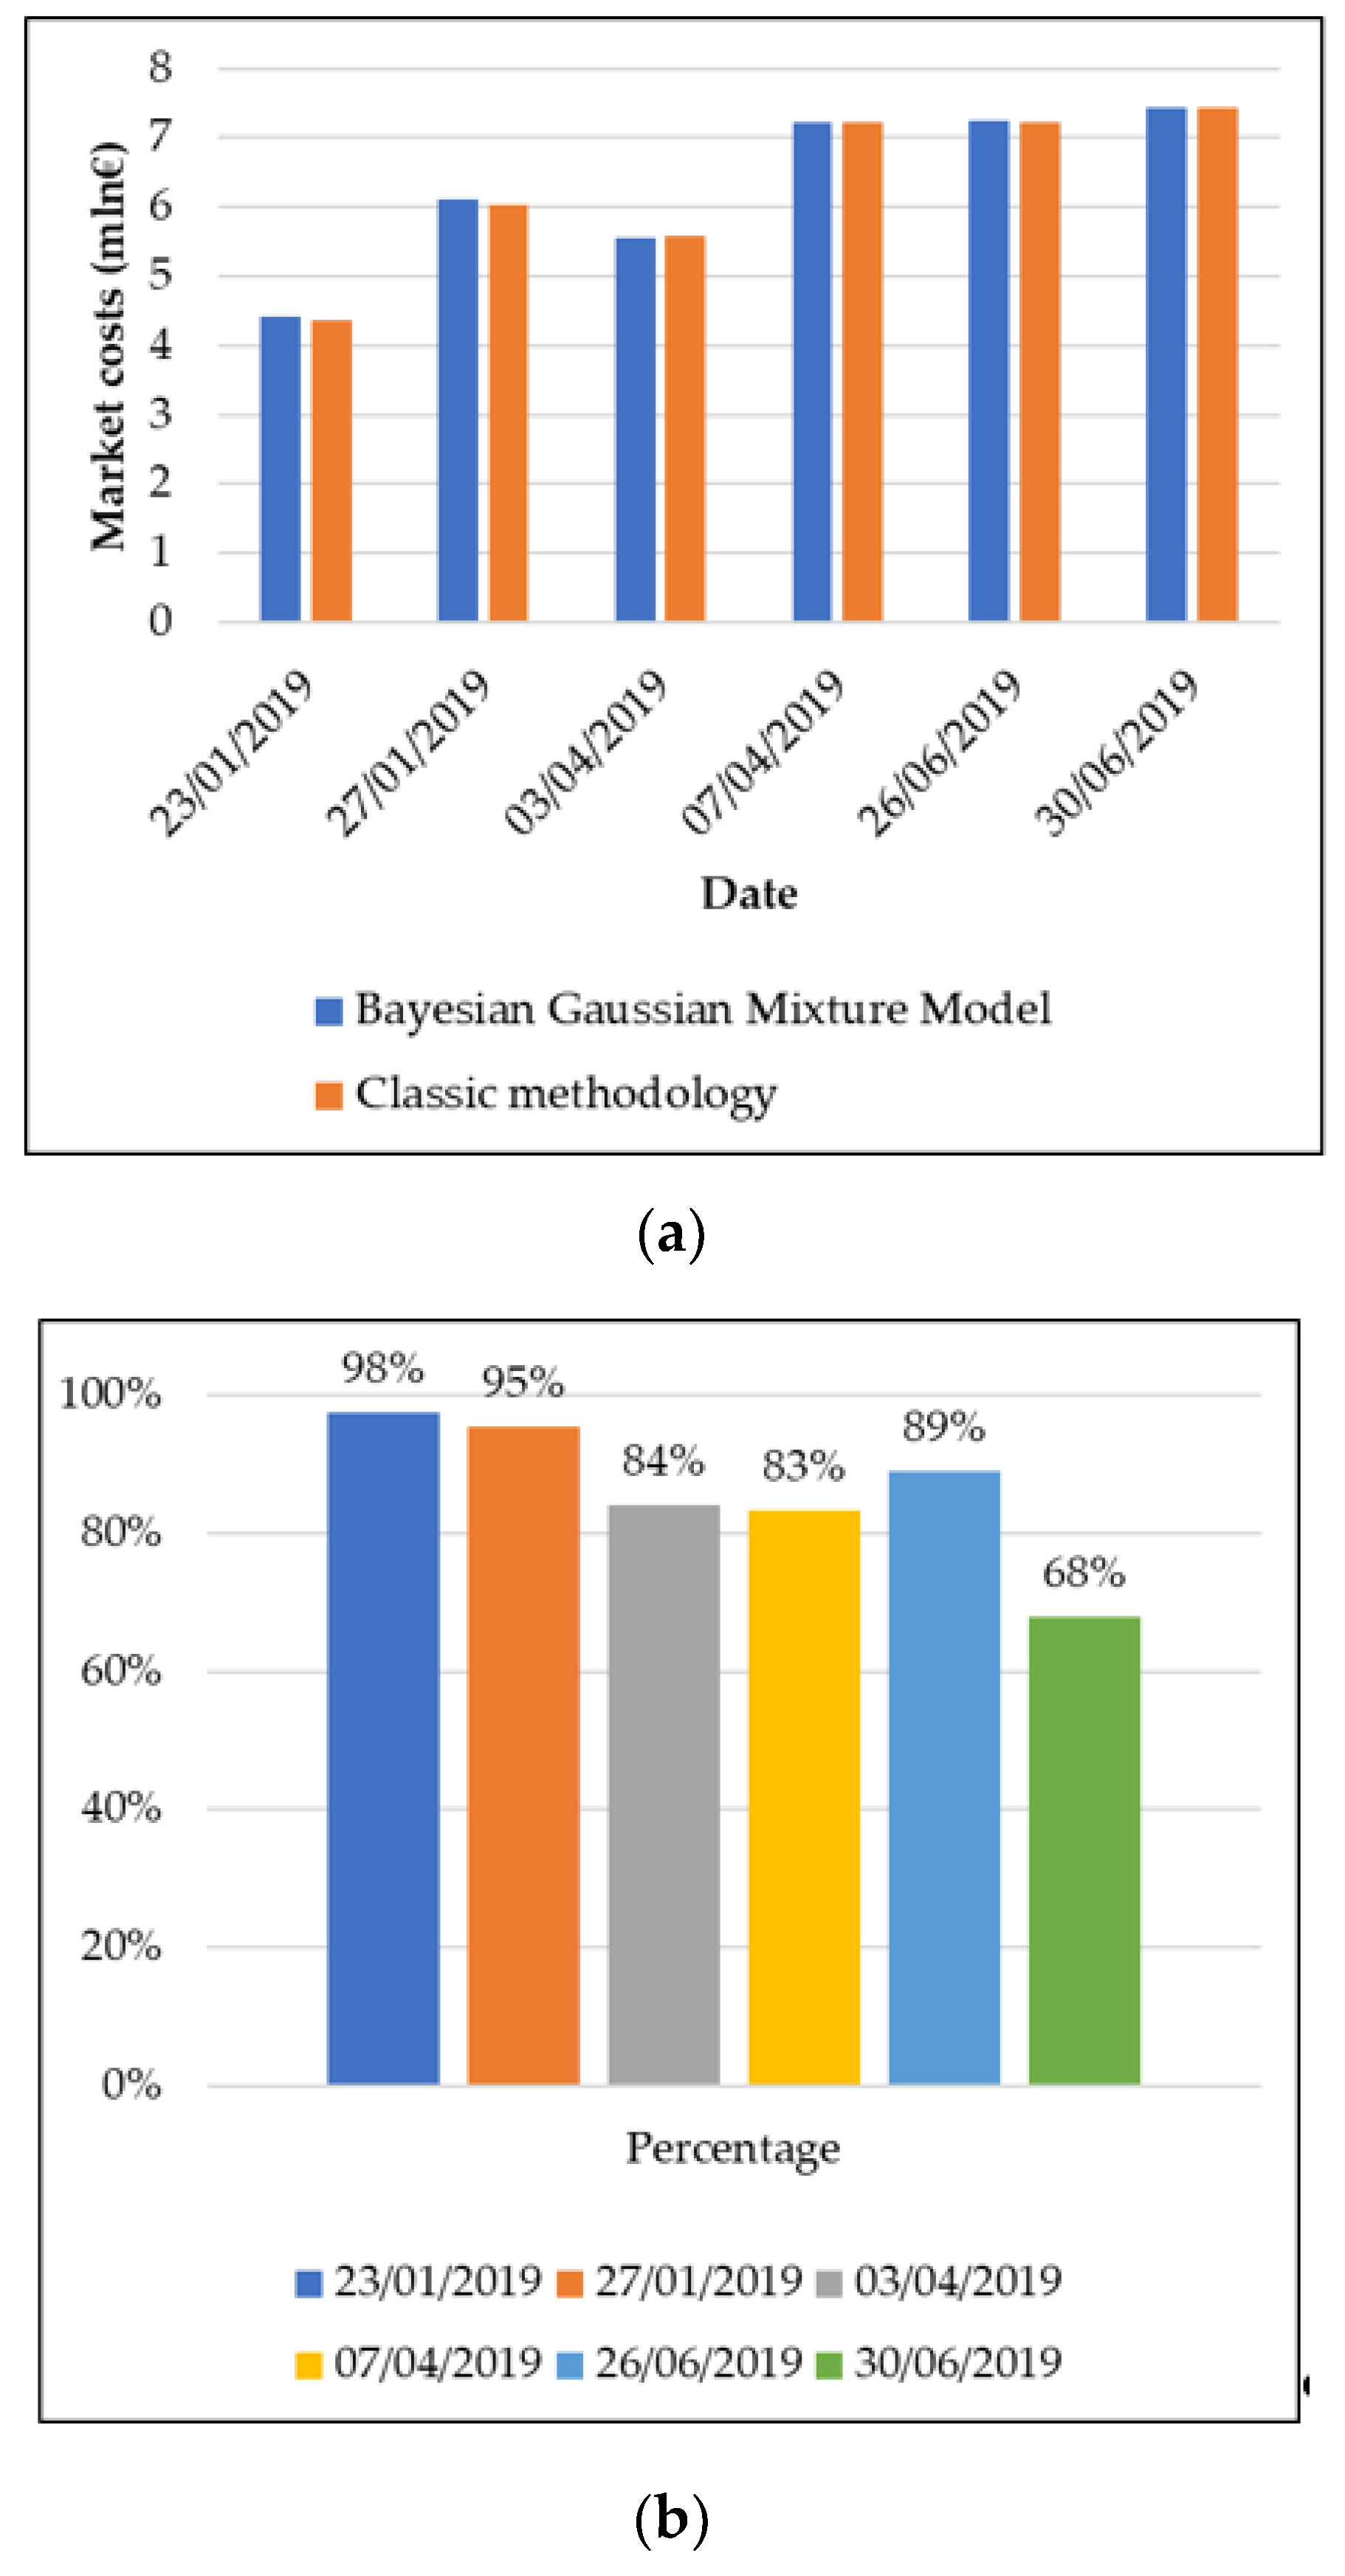
In order to test the economic impact of the new methodology, additional simulations have been carried out for computing the difference in terms of reserve procurement costs for the six days under assessment (one working day and one Sunday of 3 different months of the year)—the official algorithm and tools actually adopted for clearing the Ancillary Service Market has been used, fixing all the other input data except for the RR requirements.
Figure 11a shows that there are no significant market cost differences when switching to the new RR requirements defined according to the BGMM approach. However, considering that RR requirements are implemented in form of soft constraints, a potential deficit of resources for the procurement of downward reserve in the North zone could appear (with a relevant penalty in the objective function), as shown in
Figure 11b, where the percentage of the coverage of the requirement for the RR in the North zone for the six reference days are represented. Therefore, through the application of the new methodology, the higher value of downward reserve requirement in the North zone is difficult to be fulfilled (given the current set of available resources), highlighting a lack of downward reserve for coping with the 99.7% reliability standard (only an extraordinary use of pumped-storage could mitigate this issue).
5. Hour-Ahead RR Activation Demand Sizing
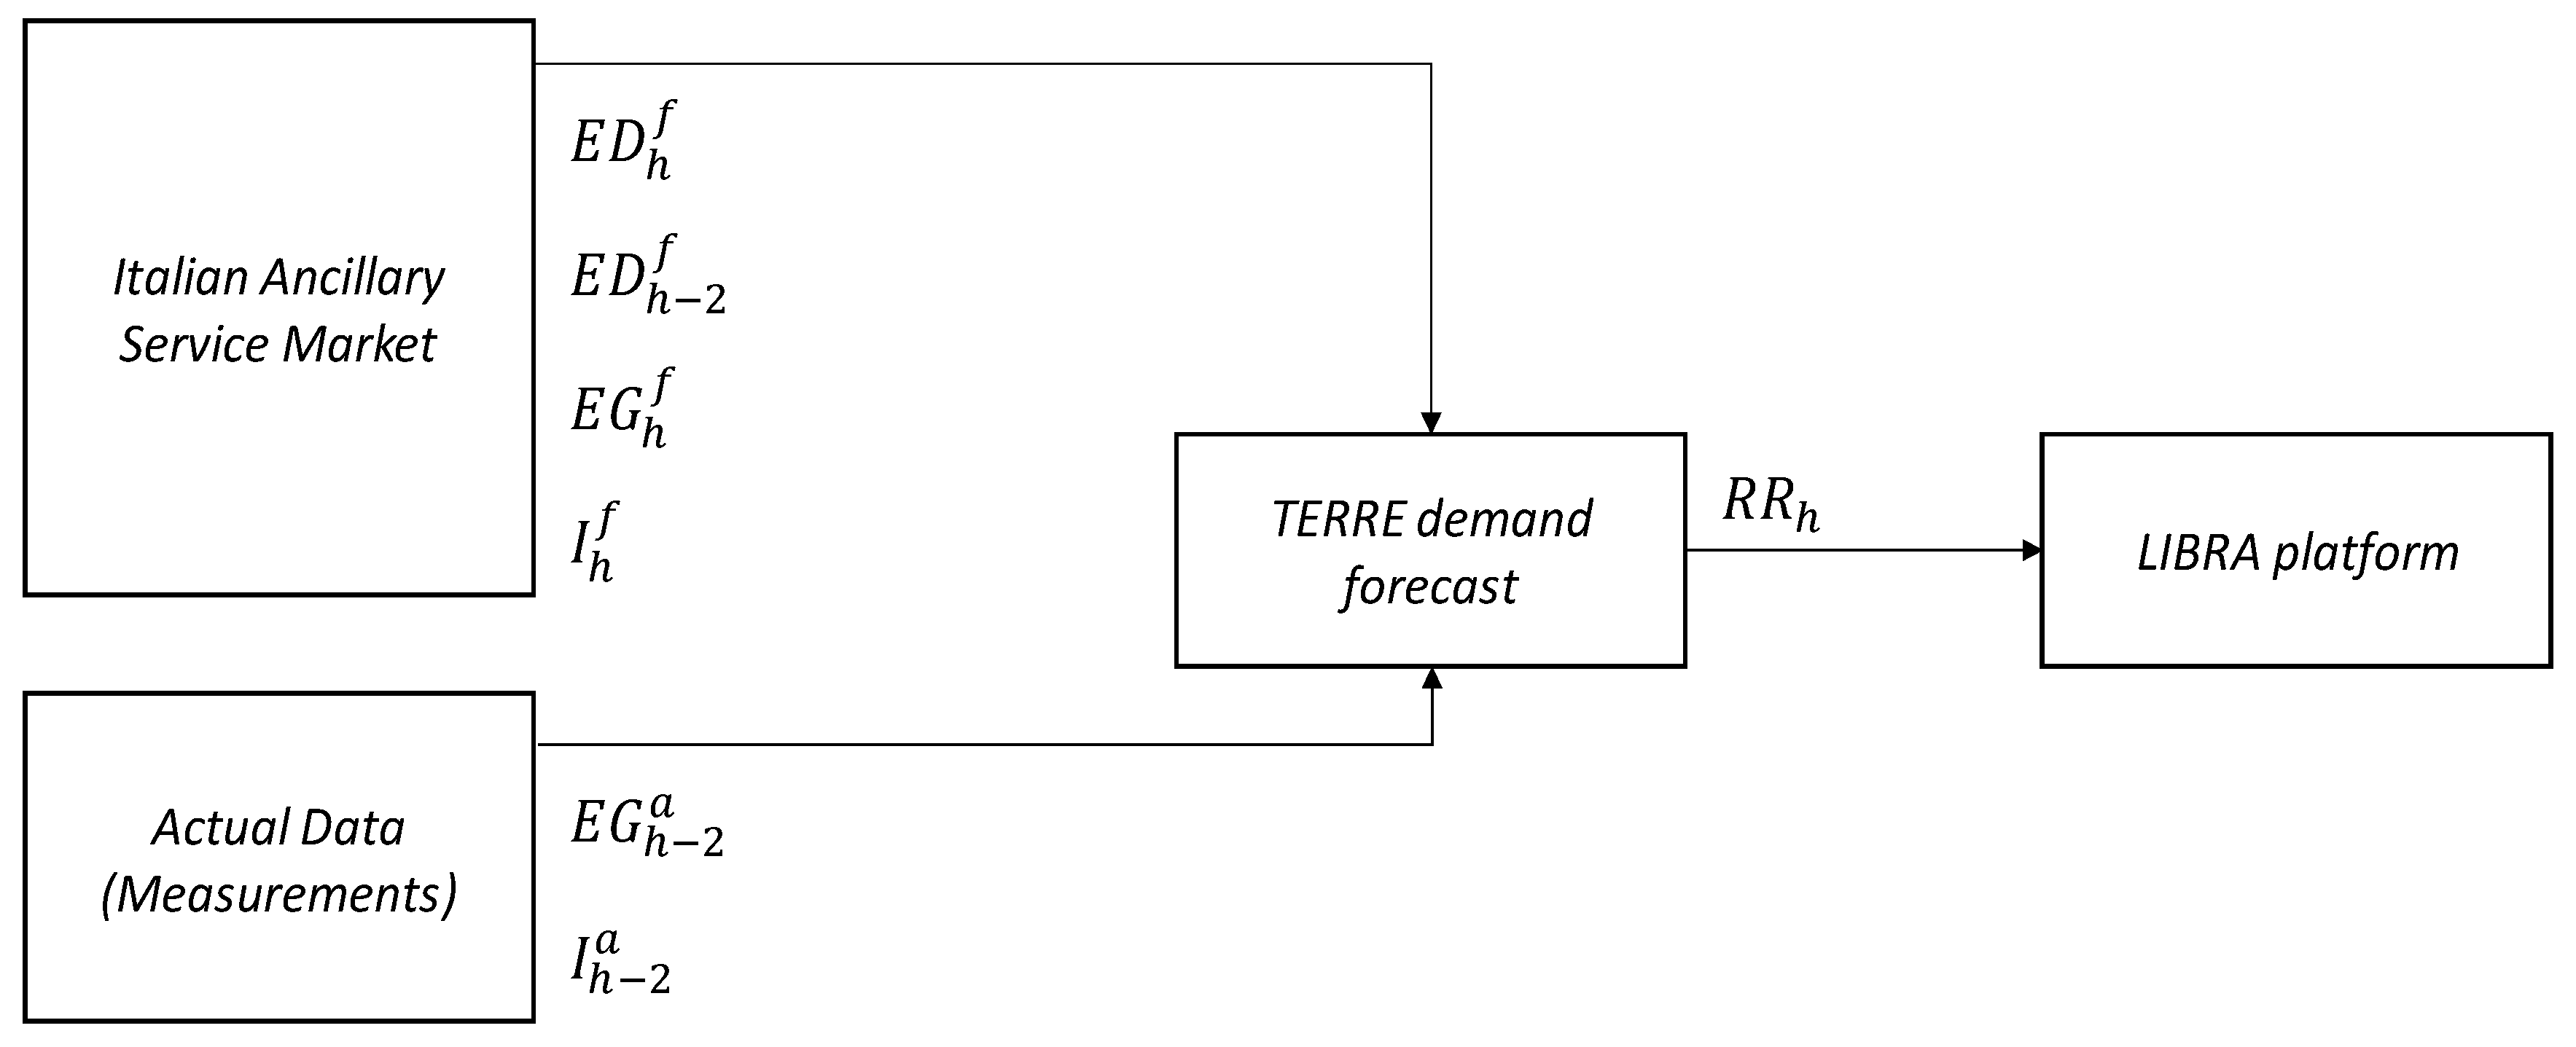
5.1. Test of a Persistence Method
As shown in
Figure 3, the national TSOs, as TERNA in Italy, have to size the RR that they need and then, close-to-real-time, activate these resources in order to balance the system in the framework of their national balancing schemes or submitting the request to the LIBRA platform for each hour. Since the TERRE process is running in advance to the Italian balancing market for a given delivery period, it is important for TERNA to anticipate balancing actions in this framework (having this platform an higher liquidity compared to the national market) but paying attention to minimize the risk of counteractions required in real-time (due to an over/under activation occurred on LIBRA). Hence, the expected net imbalance between generation and load schedules and actual data shall be predicted between 60 min and 45 min before the start of the delivery hour. For achieving this goal, in the early stage of implementation, the RR activation demand sizing approach adopted by TERNA is going to be based on a persistence method, similar to the one adopted currently in the Italian real-time balancing market, that is, assuming that the forecasting error at hour h is equal to the forecasting error at hour h-2 (the last for which all the actual data are available). In fact, as stated in most of the available literature [
29,
30,
31,
32], the persistence approach is hard to beat in the so called ultra/very short-term forecast time horizons (e.g., less than 1 h-ahead) while most-advanced predictive models, that could provide better performances on the 1 h time horizons, require extensive training and testing since the selection of the most suitable model is widely recognized as a data driven exercise.
Mathematically the calculation of the RR activation demand to be sent to LIBRA will be based on the formula (1) and flow-chart shown in
Figure 12. Since the analysis has been carried out with the data relating to the year 2018, actual values were available, so it was possible to calculate the expected error made in assuming that the forecasting error at hour h is equal to that one at hour
h-2 (2).
where:
forecasted energy demand for the hour h;
: forecasted energy demand for the hour h − 2;
forecasted energy generation for the hour h.
actual energy generation for the hour h − 2.
forecasted energy import for the hour h.
actual energy import for the hour h − 2.
Applying this method, the results obtained are summarized at National and at bidding zone level, in terms of minimum, maximum, average value and standard deviation of the RR required and error in
Table 2.
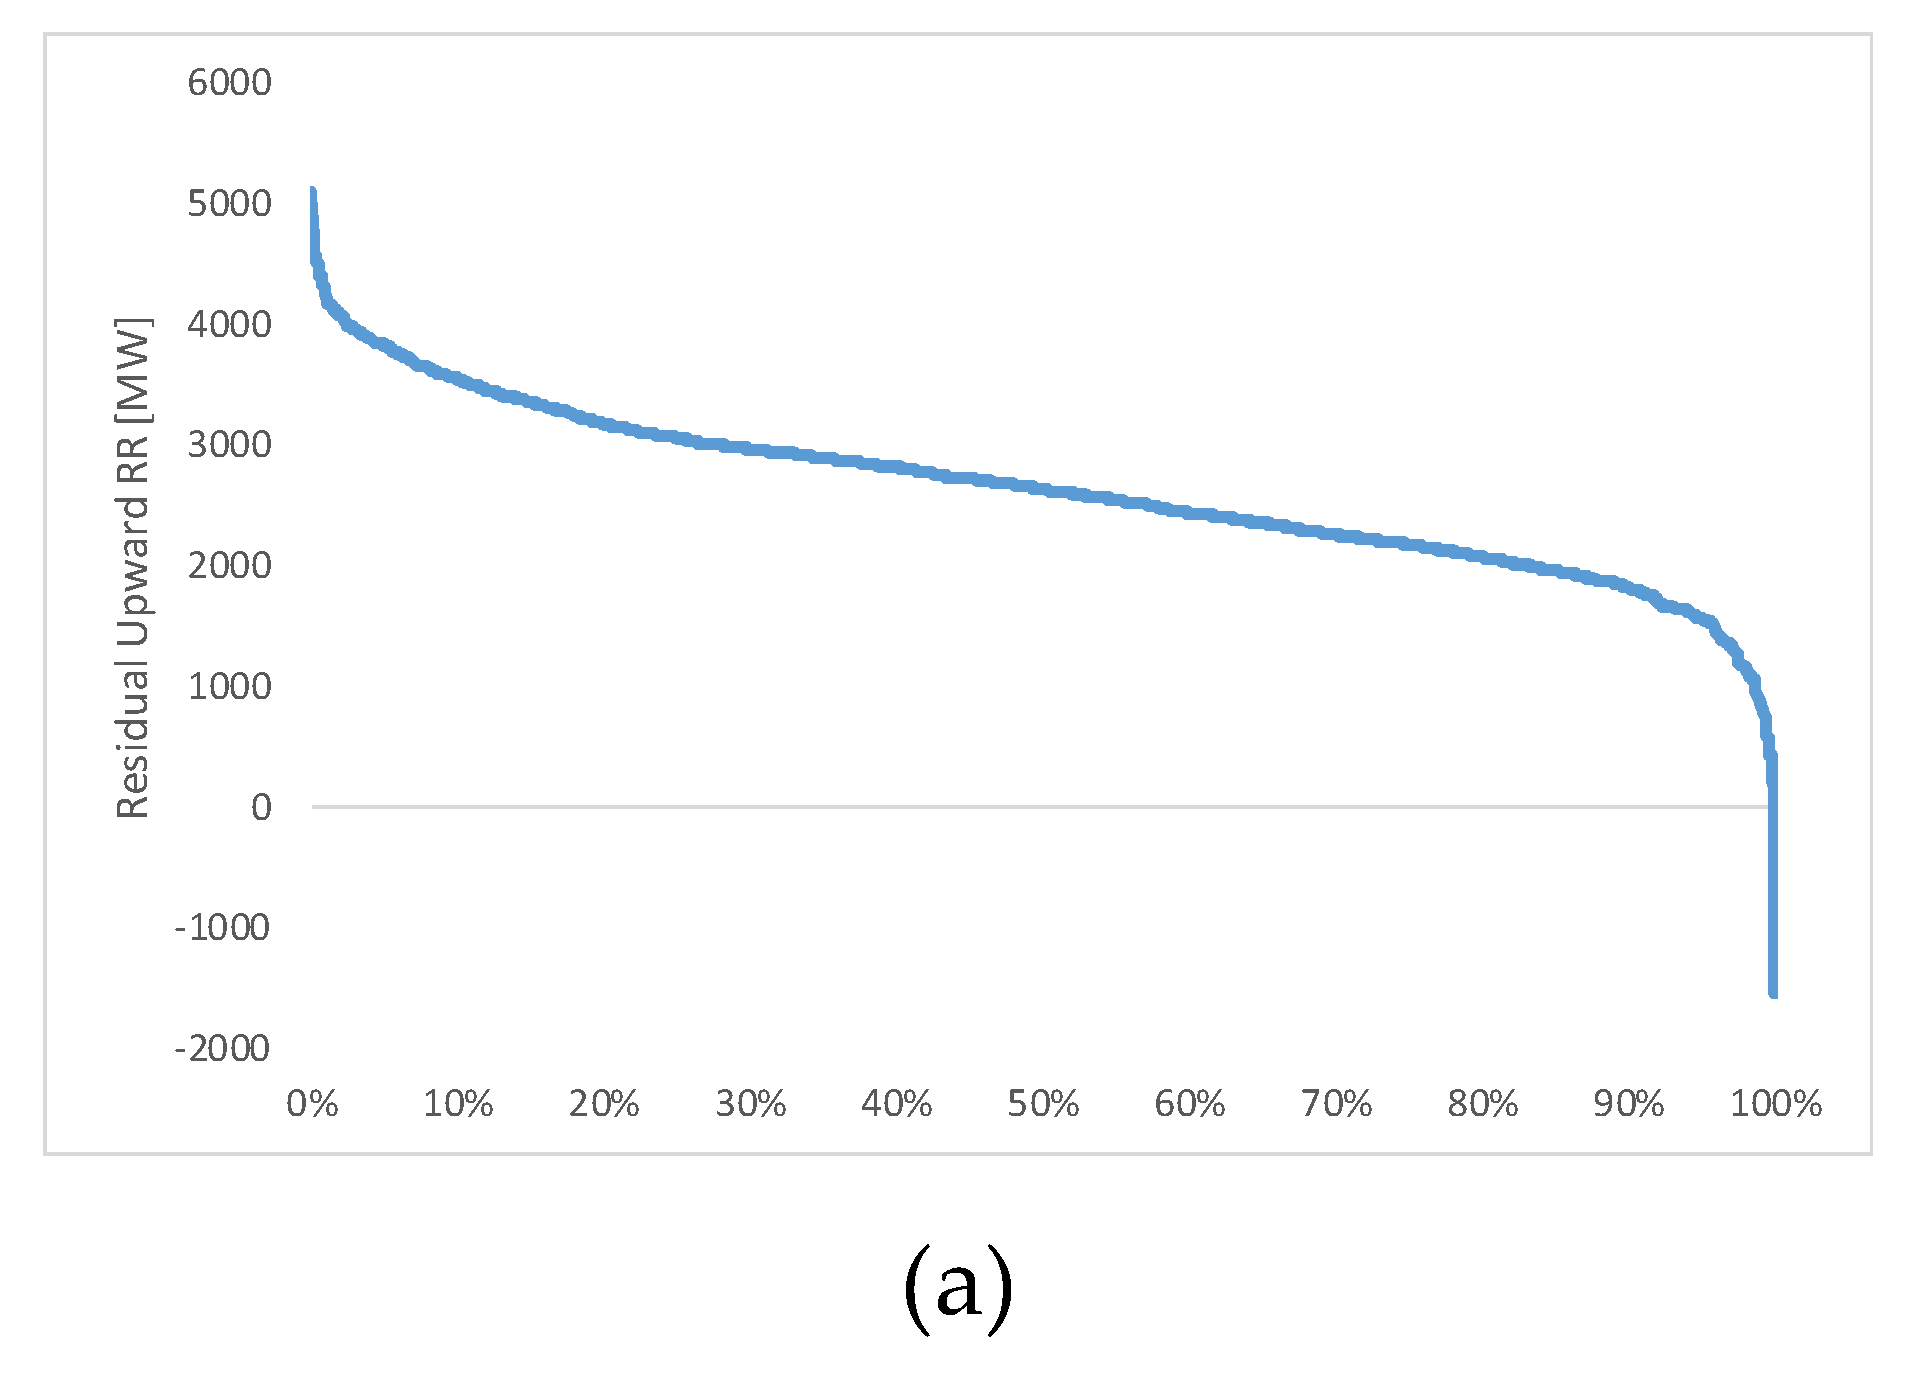
In order to check the compatibility of the proposed method for dimensioning RR activation and the current RR procured in the Ancillary Service Market, the hourly RR activation demand estimated for 2018 and the hourly RR actually procured in 2018 are compared in
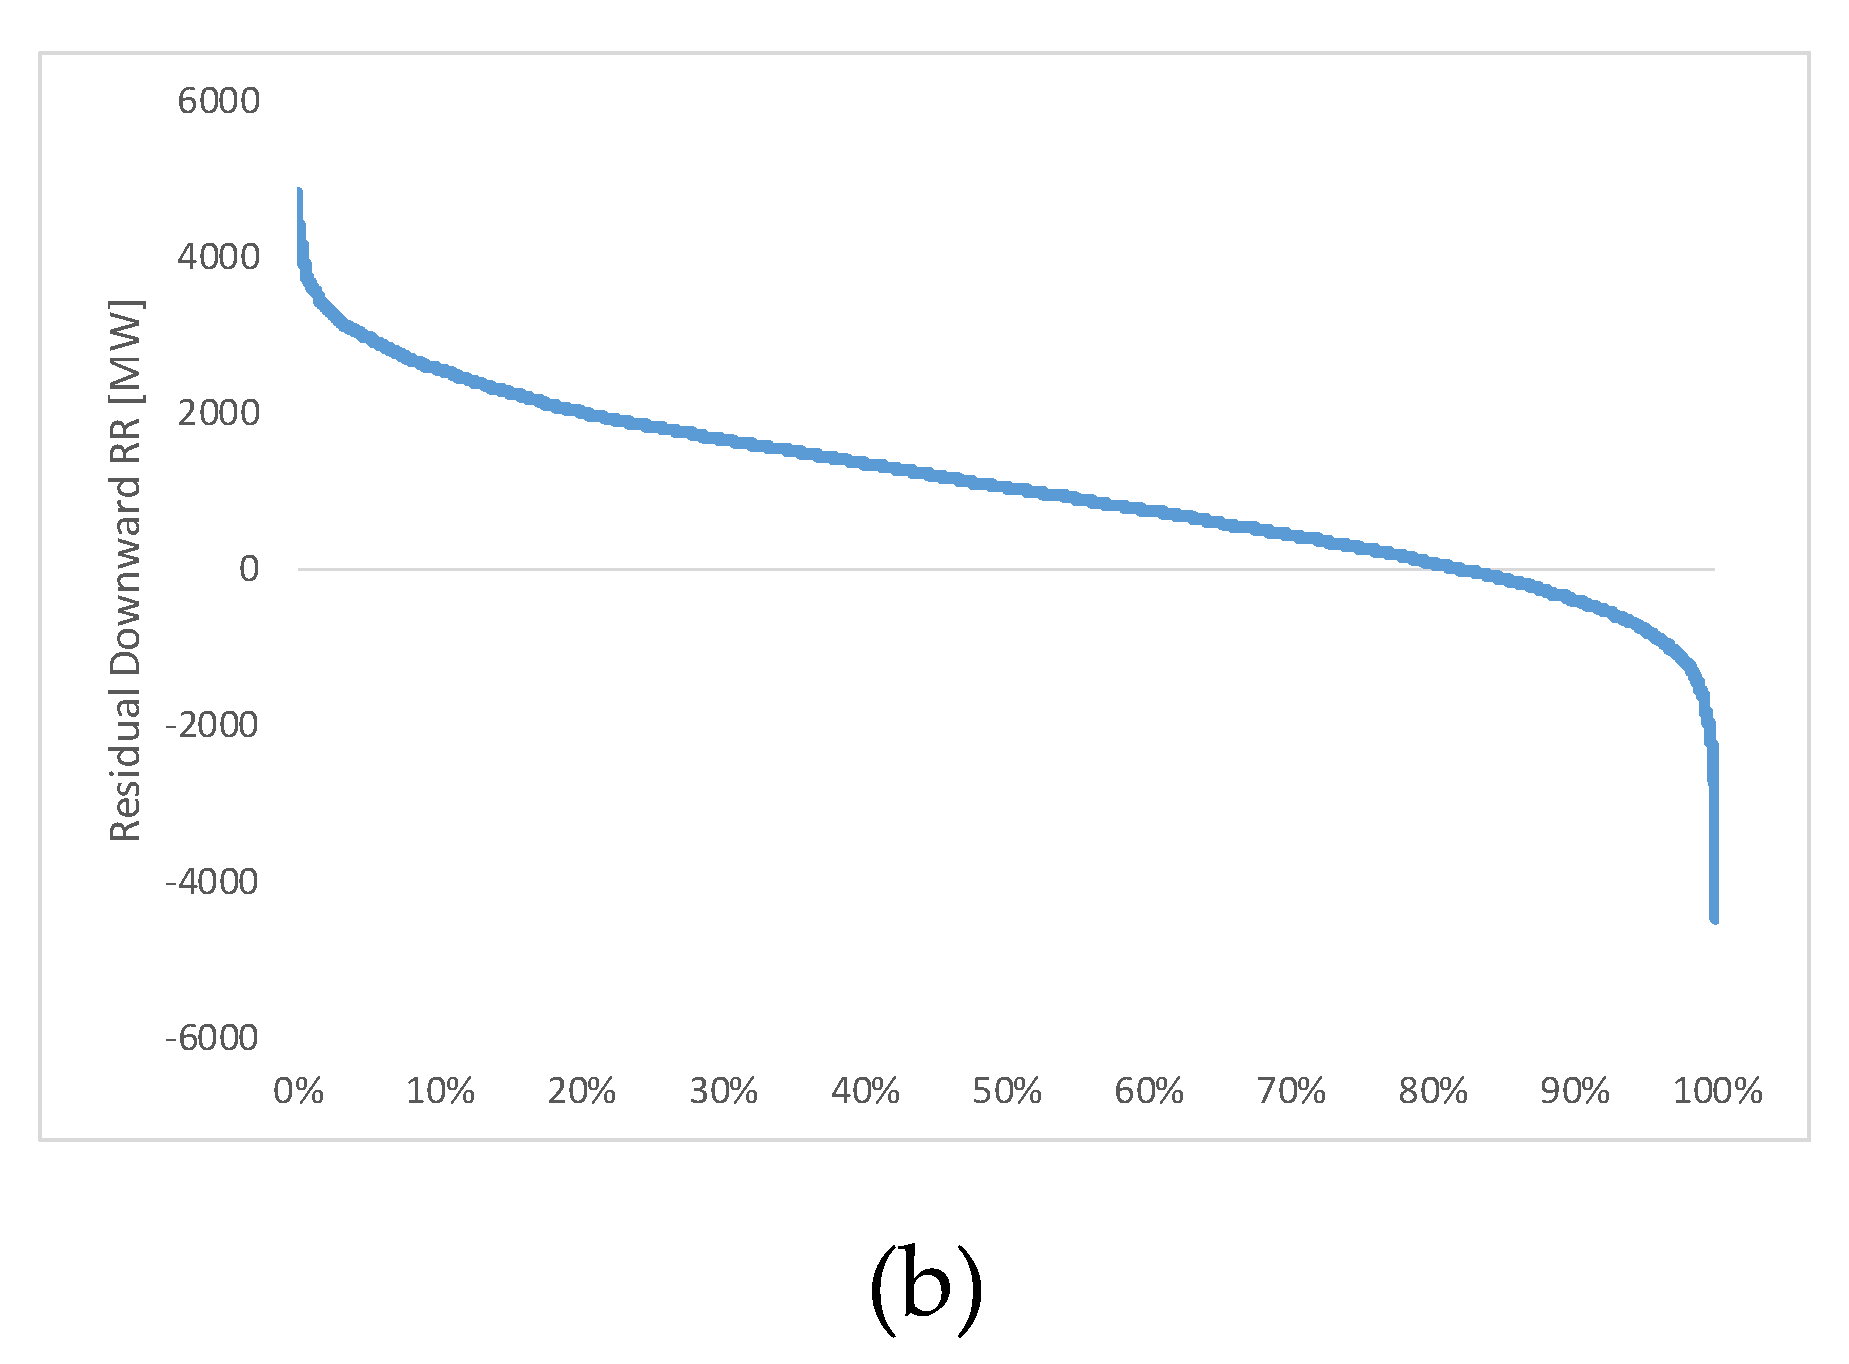
Figure 13. Looking at the incremental activation (
Figure 13) the authors found that only in one case the procured RR was not sufficient to cover the expected demand, meaning that in this hour available resources from neighboring countries would be procured on the LIBRA platform. The fact that this is a very rare event is quite important, because Italy is typically and importing Country and import capacity could be not available for balancing in real-time (because fully allocated in the previous market sessions).
At the opposite, looking at the downward side, the number of cases where the expected activation is higher than the actually procured downward RR reserve is not sufficient increases up to 18%. In this case, selecting downward quantities in other countries and consequently reducing the import flow (which is an achievable action in all the timeframes), will solve the issue.
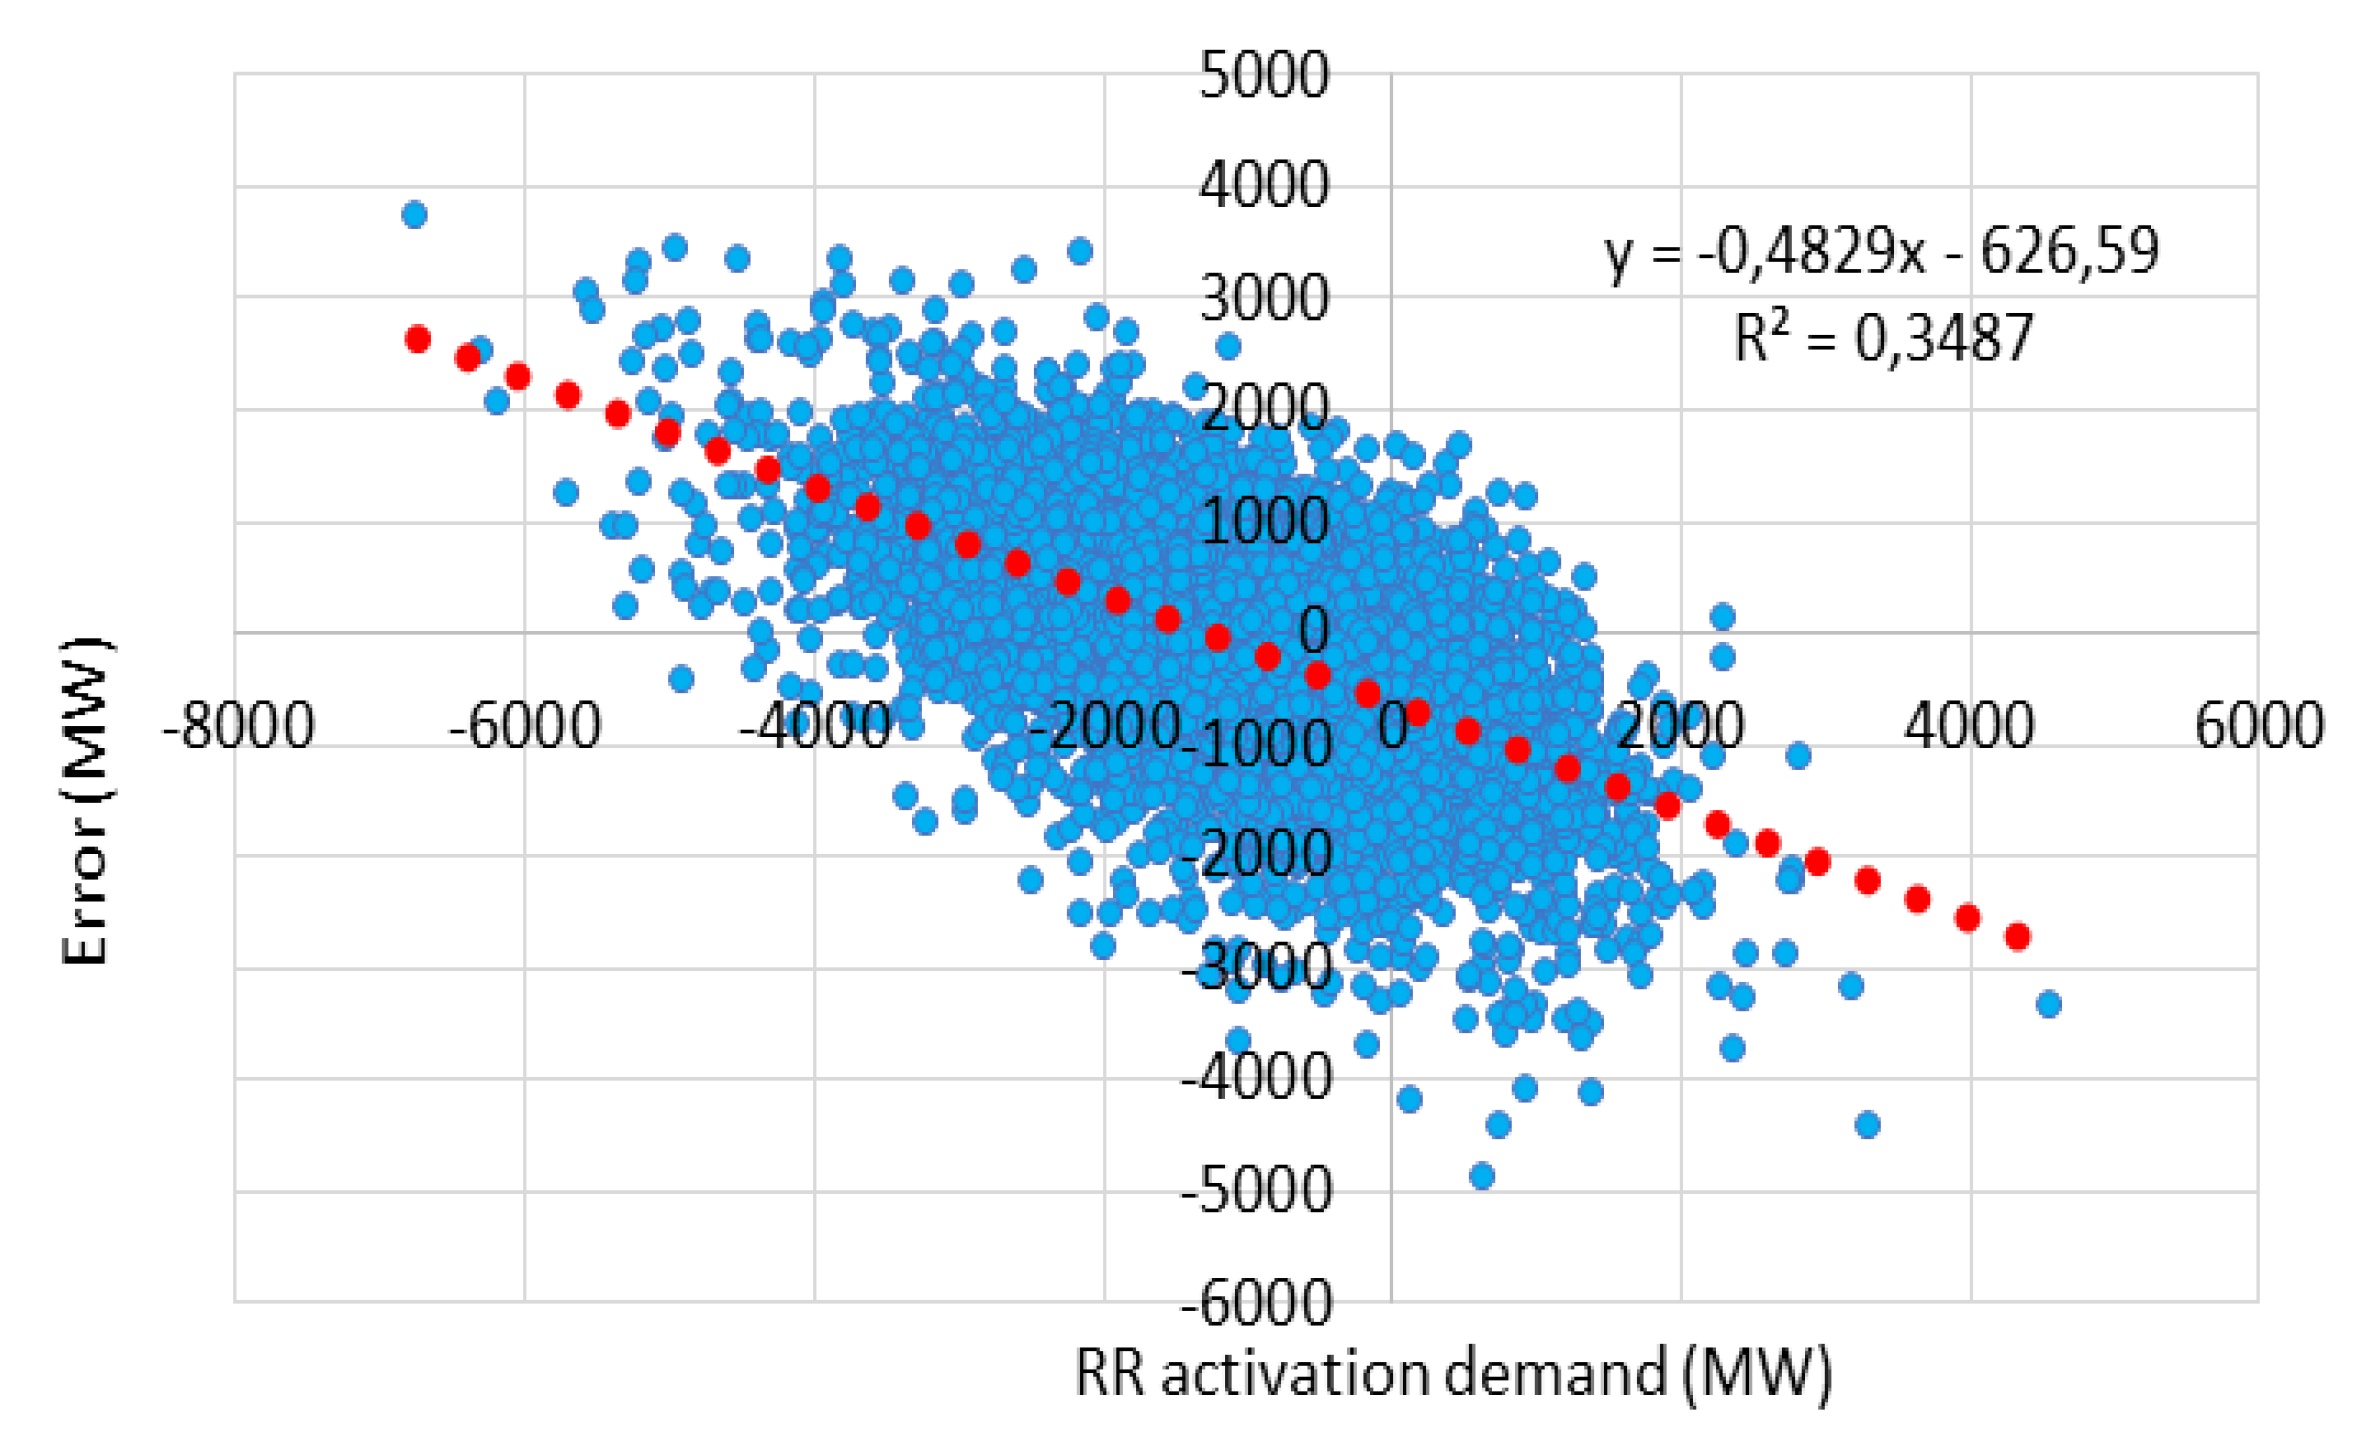
Finally, plotting estimated error in the RR activation demand against the demand itself (
Figure 14), it comes out clear that the persistence method tends to amplify the balancing activation, especially in extreme cases. This tendency highlights that:
expected lack of resources identified above are not critical issues for the actual balancing of the system;
potential improvements should be investigated in order to avoid over activations to be counteracted in the successive real-time balancing stage.
5.2. Identification of Alternative Techniques to be Investigated for Error Reduction
In order to obtain an optimization of RR resources activation, it has been investigated the availability of innovative predictive techniques able to reduce the forecasting error, since a correct forecast would lead to an increase in the quality of the power supply and to a reduction of the procurements cost. A literature review [
32,
33,
34,
35,
36,
37,
38,
39,
40] highlighted that so called nowcasting techniques could improve forecast accuracy in the time horizon from 1 to few hours in advance. These methodologies combine real-time measurements on the current state of the system (e.g., measured irradiance, wind speed, satellite imagines, radar data, etc.) with machine learning predictive algorithm on the short term horizon.
Several papers compare the forecast accuracy of different predictive techniques using persistence method as benchmark [
30,
32,
40]. For the scope of this study, the authors found [
32] as the most relevant one, because it assesses the forecast accuracy for very-short lead times (the ones they are interested in). In particular, in [
32] the statistical methods Artificial Neural Networks (ANN) and Auto-Regressive Moving Average (ARMA) were compared with two downscaling approaches for wind speed and wind energy, one using the explanatory variables deriving from the Numerical Weather Prediction (NWP) model (LR no-obs) and one adding local observations (LR obs). The performances of these models are compared in Reference [
32] in terms of Normalized Root Mean Square Error (NRMSE), defined with the formula (3):
where:
i-th forecasted value
i-th observation corresponding to
average value of the observations
number of forecast
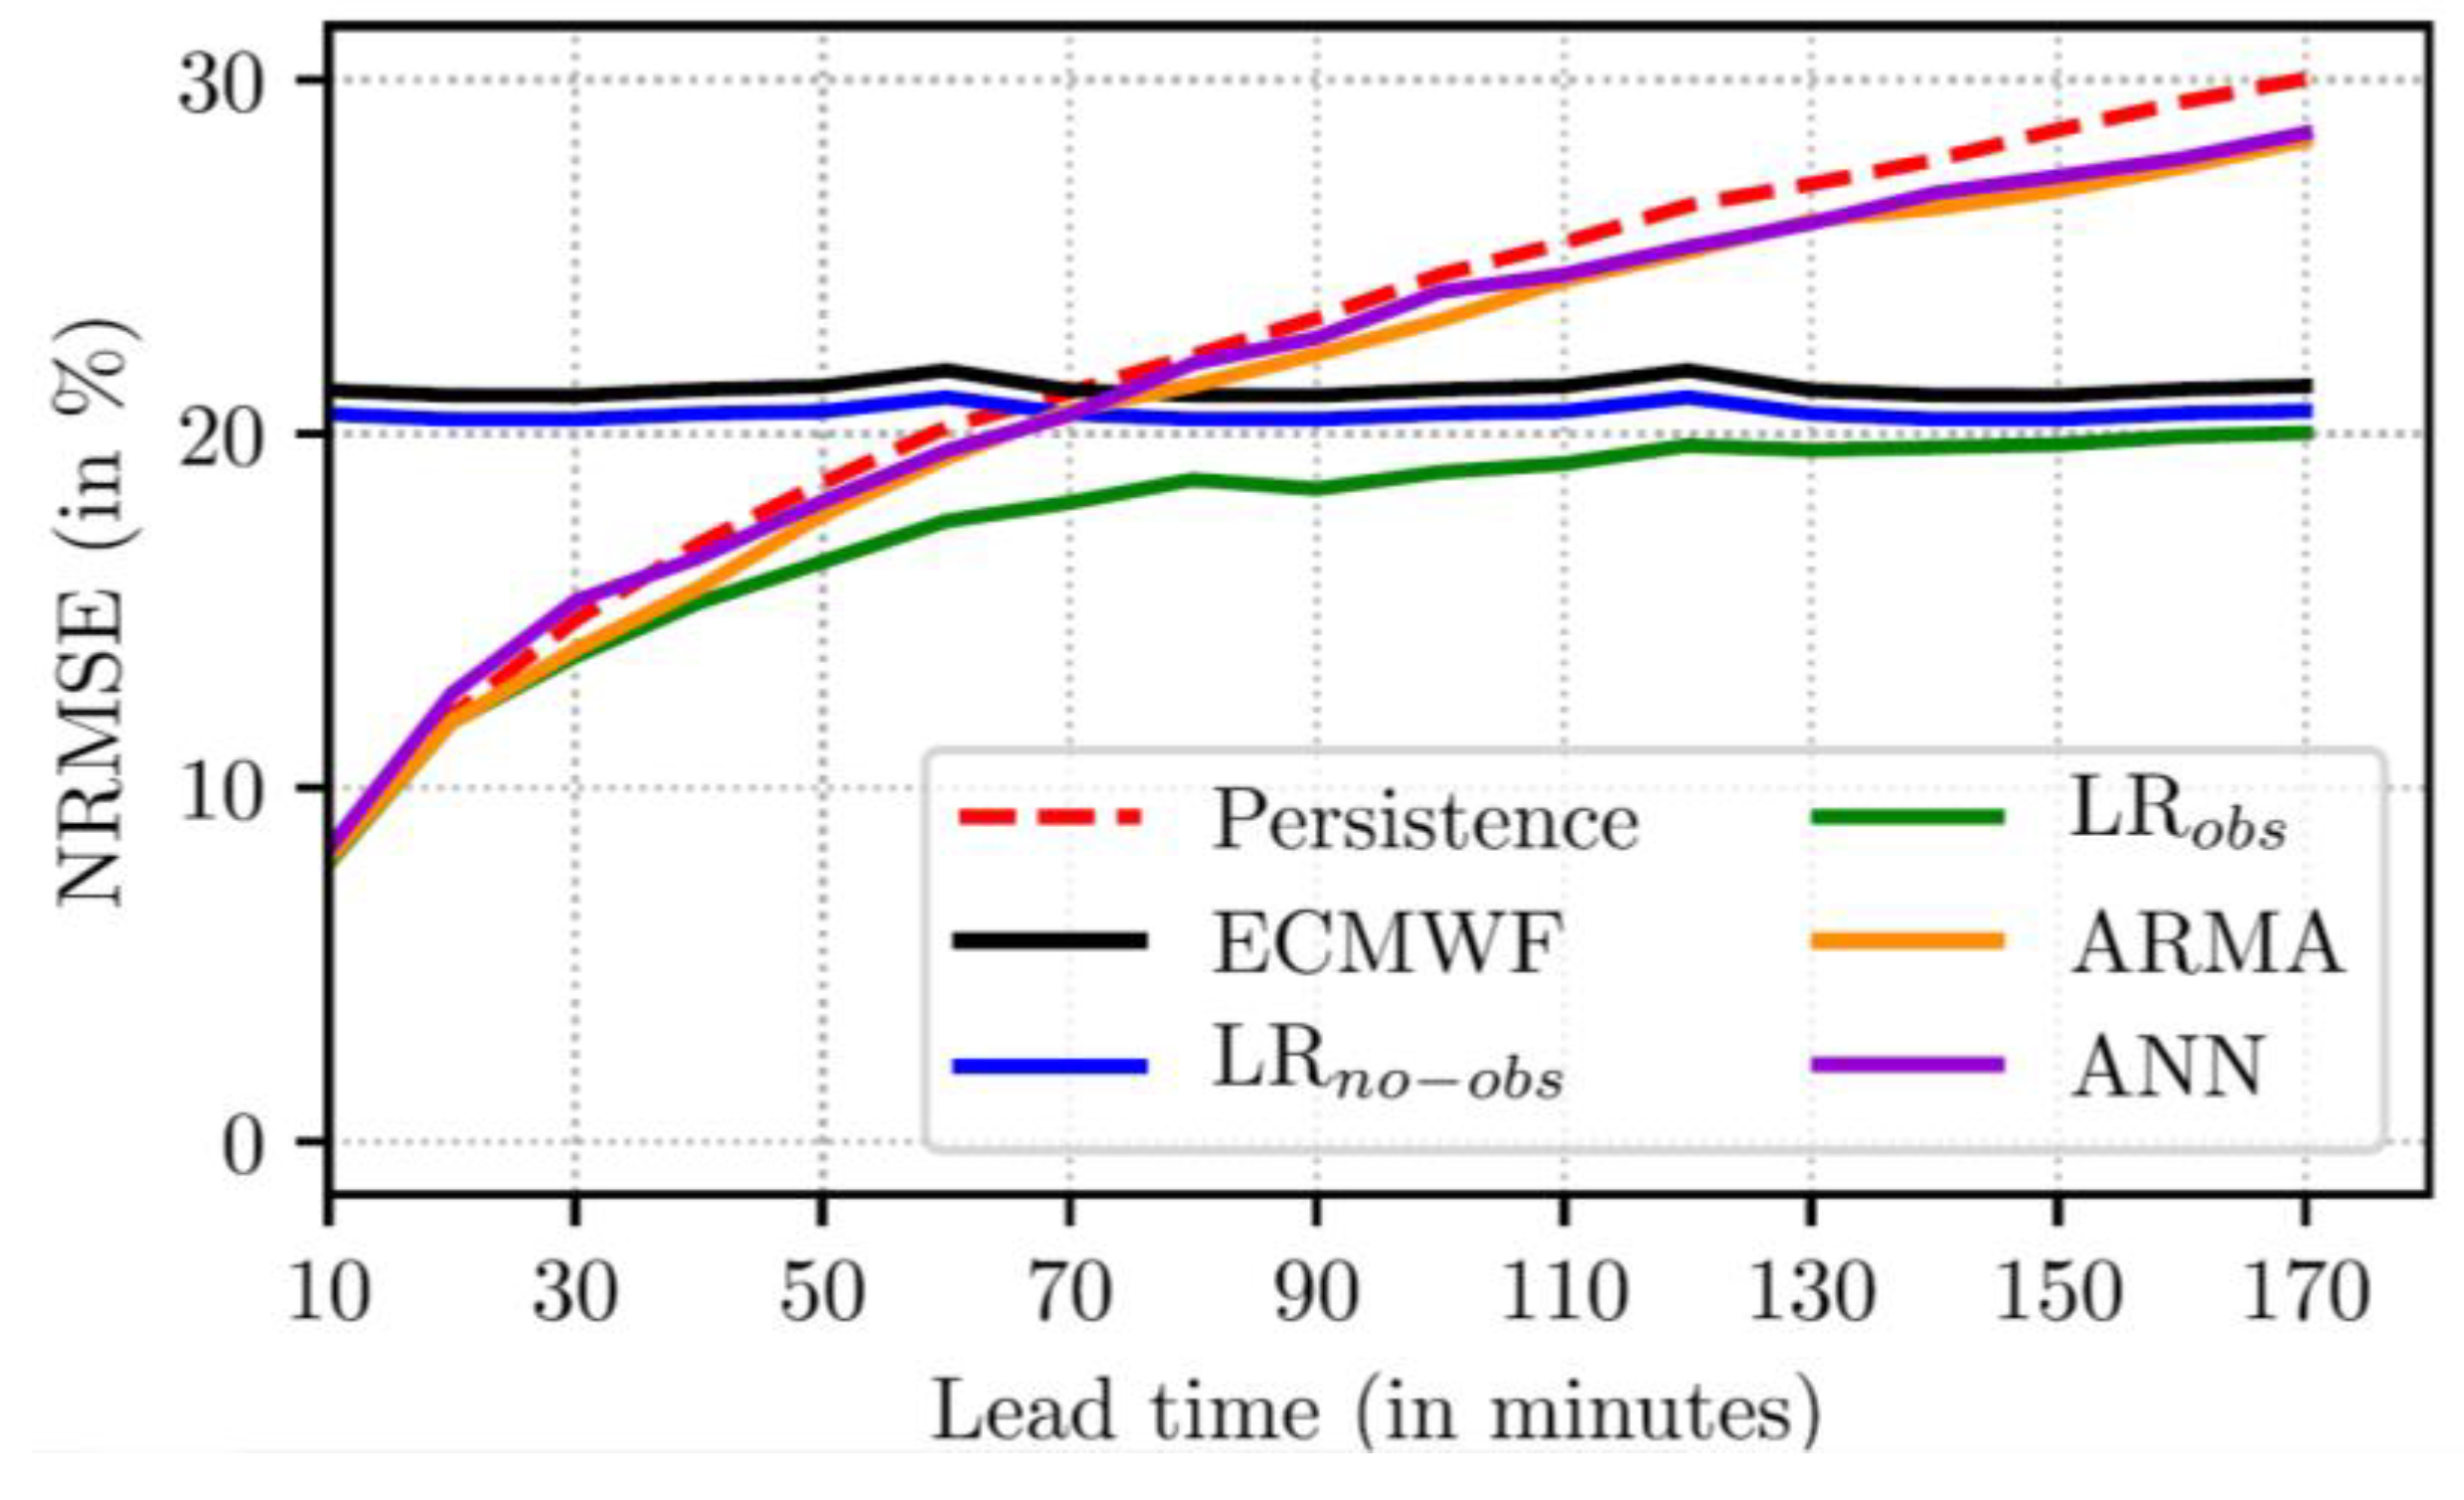
The proposed results show that nowcasting techniques (LRobs) would allow a significant improvement in the forecast performances for lead-time longer than 45–50 min, furthermore the LRobs method is better than the persistence method for each lead-time considered, although the two methods converge for times less than 30 min.
In order to check the applicability of the results presented in [
32] to the RR activation demand problem discussed in this paper, the NRMSE is calculated for the forecasting error of the RR activation demand computed according to the persistence method on 2018 data described in
Section 5.1. The NRMSE value obtained for the persistence method applied to the 1-h ahead RR activation demand forecast problem is of about 17%—this value is compatible with the trend shown in
Figure 10, confirming the opportunity to further investigate nowcasting approach to be adopted for properly dimensioning 1-h ahead RR activation demand to be submitted by Terna to the LIBRA platform.
6. Conclusions
The Italian power system is characterized by a huge penetration of IRES, whose power production is strongly depending on weather conditions. On the other hand, also the power demand varies significantly in function of the weather conditions and variables, for example, air temperature. Hence, a proper review of operational processes and practices is required for improving procurement strategies to be adopted in the ancillary service markets and in the upcoming European platforms.
This study shows the importance of an appropriate assessment of the forecast errors when they are used for sizing Replacement Reserve requirements—actual forecast error distributions show longer tails if compared to a normal distribution, implying an under estimation of the reserve needed for copying with high reliability standards (99.7%). An analysis on the correlation between the forecast error of different variables and/or different bidding zones, as well as on the dependency on the operating conditions, highlighted the opportunity to conduct further investigation in this sense, optimizing the forecast error model. These improved models could be adopted by a TSO, when procuring RR, with particular reference to the Italian TSO and its activity in the Italian Ancillary Service Market.
Within the framework of the European TERRE project and the related European balancing platform LIBRA, the real-time balancing process will shortly be integrated with a new “close to real-time” process, which starts 60 min in advance to the delivery hour and where available RR resources are activated (sending them an order 30 min in advance to the delivery hour), in order to balance the expected system imbalance in the upcoming delivery hour. For this scope, TSOs have to formulate the RR activation demand to be submitted to the LIBRA platform between 60 and 45 min in advance to the delivery hour. This paper describes the sizing methodology proposed for the initial stage of the process, which is based on a persistence method, showing its results using real data for the whole 2018 and highlighting potential limitations of this approach. In order to overcome these limitations, a literature review on alternative approaches has been carried out, identifying nowcasting techniques as a relevant alternative for the very short term forecast horizon—these methodologies will be further investigated and tested in the future, using the persistence method as a benchmark.
Author Contributions
Conceptualization L.P. (Lorenzo Papi) and F.Q.; methodology, L.P. (Lorenzo Papi) and F.Q.; validation, M.C., M.C.F.; formal analysis, L.P. (Lorenzo Papi), L.P. (Lucrezia Promutico) and V.R.; investigation, L.P. (Lorenzo Papi), L.P. (Lucrezia Promutico) and V.R.; data curation, L.P. (Lorenzo Papi), L.P. (Lucrezia Promutico) and V.R.; writing—original draft preparation, L.P. (Lorenzo Papi); writing—review and editing, M.C.F., F.Q. and M.C.; supervision, F.Q.; project administration, M.C.F. and M.C. All authors have read and agreed to the published version of the manuscript.
Funding
This research received no external funding.
Acknowledgments
The authors are grateful to M. Aufiero (Milano Multiphysics) and F. Di Lecce (Milano Multiphysics) for their crucial contribution on the Replacement Reserve sizing methodology.
Conflicts of Interest
The authors declare no conflict of interest.
Nomenclature List
| aFRR | Automatic Frequency Restoration Reserve |
| ANN | Artificial Neural Network |
| ARMA | Auto-Regressive Moving Average |
| BGMM | Bayesian Gaussian Mixture Model |
| BSP | Balancing Service Provider |
| CACM | Capacity Allocation & Congestion Management |
| CMO | Common Merit Order |
| DAM | Day-Ahead Market |
| FRR | Frequency Restoration Reserve |
| GME | Gestore dei Mercati Energetici |
| IGCC | International Grid Control Cooperation |
| IRES | Intermittent Renewable Energy Sources |
| LFC | Load Frequency Control |
| MARI | Manual Activation Reserve Initiative |
| MB | A real-time Balancing Market (named in Italian Mercato del Bilanciamento) |
| mFRR | Manual Frequency Restoration Reserve |
| MGP | Italian Day-Ahead Market (named in Italian Mercato del Giorno Prima) |
| MI | Intra-Day Market (named in Italian Mercato Infragiornaliero) |
| MPE | Spot Electricity Market (named in Italian, Mercato a Pronti dell’Energia) |
| MSD | Italian ancillary service market (named in Italian, Mercato per il Servizio di Dispacciamento) |
| MTE | Forward Electricity Market (named in Italian, Mercato a Termine dell’Energia) |
| NEMO | Nominated Electricity Market Operator |
| NRMSE | Normalized Root Mean Square Error |
| NWP | Numerical Weather Prediction |
| PCR | Price Coupling of Regions |
| PICASSO | Platform for the International Coordination of Automated Frequency Restoration and Stable System Operation |
| PUN | National Single Price (named in Italian Prezzo Unico Nazionale) |
| RR | Replacement Reserve |
| TERRE | Trans European Replacement Reserve Exchange |
| TSO | Transmission System Operator |
| UVA | Virtual Enabled Units (named in Italian Unità Virtuali Abilitate) |
| XB | Cross Border |
References
- Kannavou, M.; Zampare, M.; Capros, P. Modelling the EU Internal Electricity Market: The PRIMIES-IEM Model. Energies 2019, 12, 2887. [Google Scholar] [CrossRef]
- Koltsaklis, N.; Dagoumas, A. Policy Implications of Power Exchanges on Operational Scheduling: Evaluating EUPHEMIA’s Market Products in Case OF Greece. Energies 2018, 11, 2715. [Google Scholar] [CrossRef]
- Beus, M.; Pavić, I.; Štritof, I.; Capude, T.; Pandžić, H. Electricity Market Design in Croatia within the European Electricity Market-Recommendations for the Further Development. Energies 2018, 11, 346. [Google Scholar] [CrossRef]
- Bompard, E.; Zalzar, S.; Huang, T.; Purvins, A.; Masera, M. Baltic Power Systems’ Integration into the EU Market Coupling under Different Desynchronization Schemes: A Comparative Market Analysis. Energies 2018, 11, 1945. [Google Scholar] [CrossRef]
- ENTSO-e. Network Code. Available online: https://www.entsoe.eu/network_codes/ (accessed on 30 March 2020).
- The European Commission. Commission regulation (EU) 2017/2195 of 23 November 2017 establishing a guideline on electricity balancing. Off. J. Eur. Union 2017. [Google Scholar]
- ENTSO-e. Trans European Replacement Reserves Exchange (TERRE). Available online: https://www.entsoe.eu/network_codes/eb/terre/ (accessed on 30 March 2020).
- ENTSO-e. Manually Activated Reserves Initiative (MARI). Available online: https://www.entsoe.eu/network_codes/eb/mari/ (accessed on 30 March 2020).
- ENTSO-e. The Platform for the International Coordination of Automatic Frequency Restoration and Stable System Operation (PICASSO). Available online: https://www.entsoe.eu/network_codes/eb/picasso/ (accessed on 30 March 2020).
- ENTSO-e. The international Grid Control Cooperation (IGCC). Available online: https://www.entsoe.eu/network_codes/eb/imbalance-netting/ (accessed on 30 March 2020).
- Terna. Italian Grid Code, Capitolo 4—Regole per il Dispacciamento. Available online: https://download.terna.it/terna/Capitolo%204_8d7d19fd2b6b1c4.pdf (accessed on 30 March 2020).
- Legislative Decree. 79 16/03/1999. Attuazione della direttiva 96/92/CE recante norme comuni per il mercato interno dell’energia elettrica. Gazz. Uff. 1999, 75. [Google Scholar]
- The European Parliament and the Council of the European Union. Directive 96/92/EC of the European Parliament and of the Council of 19 December 1996 concerning common rules for the internal market in electricity. Off. J. Eur. Union 1997. [Google Scholar]
- The European Parliament and the Council of the European Union. Directive 2003/54/EC of the European Parliament and of Council of 26 June 2003 concerning common rules for the internal market in electricity and repealing Directive 96/92/EC. Off. J. Eur. Union 2003. [Google Scholar]
- The European Parliament and the Council of the European Union. Directive 2009/72/EC of the European Parliament and of Council of 13 July 2009 concerning common rules for the internal market in electricity and repealing Directive 2003/54/EC. Off. J. Eur. Union 2009. [Google Scholar]
- Rossi, F. Gestione dei Sistemi Elettrici nei Mercati Liberalizzati; Edizioni Scientifiche Italiane: Naples, Italy, 2007. [Google Scholar]
- The European Commission. Commission regulation (EU) 2015/1222 of 24 July 2015 establishing a guideline on capacity allocation and congestion management. Off. J. Eur. Union 2015. [Google Scholar]
- Mercato Elettrico. Price Coupling of Regions (PCR). Available online: https://www.mercatoelettrico.org/it/Mercati/MercatoElettrico/PCR.aspx (accessed on 30 March 2020).
- Delibera 300/2017/r/eel Testo Coordinato Delle Integrazioni e Modifiche Apportate con le Deliberazioni 372/2017/r/eel e 422/2018/r/eel. Prima Apertura del Mercato per il Servizio di Dispacciamento (msd) alla Domanda Elettrica ed alle Unità di Produzione Anche da Fonti Rinnovabili non già Abilitate Nonché ai Sistemi di Accumulo. Istituzione di Progetti Piloti in Vista Della Costituzione del Testo Integrato Dispacciamento Elettrico (tide) Coerente con il balancing code Europeo. Available online: https://www.autorita.energia.it/allegati/docs/17/300-17.pdf (accessed on 5 June 2020).
- Gatta, F.M. Impianti Elettrici, 2nd ed.; Esculapio: Bologna, Italy, 2018; pp. 217–224. [Google Scholar]
- UCTE. P1-Policy 1: Load-Frequency Control and Performance; ENTSO-e: Brussels, Belgium, 2009. [Google Scholar]
- Terna. Italian Grid Code, Allegato A22—Procedura per la Selezione Delle Risorse per la Fase di Programmazione. Available online: https://download.terna.it/terna/0000/0105/39.PDF (accessed on 30 March 2020).
- Terna. Italian Grid Code, Allegato A24—Individuazione Zone della Rete Rilevante. Available online: https://download.terna.it/terna/0000/1147/45.PDF (accessed on 30 March 2020).
- METIS Technical Note T4—Overview of European Electricity Markets. Available online: https://ec.europa.eu/energy/sites/ener/files/documents/metis_technical_note_t4_-_overview_of_european_electricity_market.pdf (accessed on 30 March 2020).
- ENTSO-e. Survey on Ancillary Services Procurement, Balancing Market Design. 2017. Available online: https://eepublicdownloads.blob.core.windows.net/public-cdn-container/clean-documents/Publications/Market%20Committee%20publications/ENTSO-E_AS_survey_2017.pdf (accessed on 30 March 2020).
- Turchiano, M. Progetto TERRE. In Proceedings of the Regolamento (EU) 2017/2195 Bilanciamento elettrico e progetto TERRE, Milan, Italy, 18 January 2018. [Google Scholar]
- Roberts, S.J.; Husmeier, D.; Rezek, I.; Penny, W. Bayesian Approaches to Gaussian Mixture Modeling. IEEE Trans. Pattern Anal. Mach. Intell. 1998, 20, 1133–1142. [Google Scholar] [CrossRef]
- Terna. Italian Grid Code, Revisione Configurazione Zonale. 2018. Available online: https://download.terna.it/terna/0000/0105/39.PDF (accessed on 11 May 2020).
- Chang, W.Y. A Literature Review of Wind Forecasting Methods. J. Power Energy Eng. 2014, 2, 161–168. [Google Scholar] [CrossRef]
- Foley, A.M.; Leahy, P.G.; Marvuglia, A.; McKeogh, E.J. Current methods and advances in forecasting of wind power generation. Renew. Energy 2012, 37, 1–8. [Google Scholar] [CrossRef]
- Giebel, G.; Kariniotakis, G. Best Practice in Short-Term Forecasting. A Users Guide. European Wind Energy Conference and Exhibition 2007. Available online: http://www.ewec2007proceedings.info (accessed on 30 March 2020).
- Dupré, A.; Drobinski, P.; Alonzo, B.; Badosa, J.; Briard, C.; Plougonven, R. Sub-hourly forecasting of wind speed and wind energy. Renew. Energy 2019, 145, 2373–2379. [Google Scholar] [CrossRef]
- Haupt, S.E. Short-Range Forecasting for Energy. In Weather & Climate Services for the Energy Industry; Troccoli, A., Ed.; Palgrave Macmillan: London, UK, 2018; pp. 97–104. [Google Scholar]
- Haupt, S.E.; Kosović, B. Variable Generation Power Forecasting as a Big Data Problem. IEEE Transit. Sustain. Energy 2017, 8, 725–732. [Google Scholar] [CrossRef]
- World Metereological Organization. Guidelines for Nowcasting Techniques, 2017th ed.; WMO-No. 1198; WMO: Geneva, Switzerland, 2017. [Google Scholar]
- Otero-Casal, C.; Patlakas, P.; Prósper, M.A.; Galanis, G.; Miguez-Macho, G. Development of a High-Resolution Wind Forecast System Based on the WRF Model and a Hybrid Kalman-Bayesian Filter. Energies 2019, 12, 3050. [Google Scholar] [CrossRef]
- Mass, C.; Mass, C.F. Nowcasting: The Next Revolution in Weather Prediction. Bull. Am. Metereological Soc. 2011, 93, 797–809. [Google Scholar] [CrossRef]
- Mahoney, W.P.; Parks, K.; Wiener, G.; Liu, Y.; Myers, W.L.; Sun, J.; Delle Monache, L.; Hopson, T.; Johnson, D.; Haupt, S.E. A Wind Power Forecasting System to Optimize Grid Integration. IEEE Trans. Sustain. Energy 2012, 3, 670–682. [Google Scholar] [CrossRef]
- Orwig, K.D.; Ahlstrom, M.L.; Banunarayanan, V.; Sharp, J.; Wilczak, J.M.; Freedman, J.; Haupt, S.E.; Cline, J.; Bartholomy, O.; Hamann, H.F.; et al. Recent Trends in Variable Generation Forecasting and Its Value to the Power System. IEEE Trans. Sustain. Energy 2015, 6, 924–933. [Google Scholar] [CrossRef]
- Heinemann, D.; Lorenz, E.; Girodo, M. Forecasting of Solar Radiation; Solar: Denver, CO, USA, 2006. [Google Scholar]
Figure 1.
Italian Electricity Market organization.
Figure 1.
Italian Electricity Market organization.
Figure 2.
Trans European Replacement Reserve Exchange (TERRE) process [
26].
Figure 2.
Trans European Replacement Reserve Exchange (TERRE) process [
26].
Figure 3.
TERRE process timeline [
26].
Figure 3.
TERRE process timeline [
26].
Figure 4.
Comparison of normal and non-normal distribution, referred to the wind production error distribution. The red dashed line depicts the normal distribution, along with vertical lines for the −3 to +3 sigma values. The blue line is obtained with a Gaussian Kernel Density Estimator.
Figure 4.
Comparison of normal and non-normal distribution, referred to the wind production error distribution. The red dashed line depicts the normal distribution, along with vertical lines for the −3 to +3 sigma values. The blue line is obtained with a Gaussian Kernel Density Estimator.
Figure 5.
Forecast error distribution for Italy and decomposition adopting Bayesian Gaussian Mixture Model (BGMM) for load (a) and solar (b).
Figure 5.
Forecast error distribution for Italy and decomposition adopting Bayesian Gaussian Mixture Model (BGMM) for load (a) and solar (b).
Figure 6.
Difference between a normal distribution approximating National load forecast error and the 3-Gaussians BGMM model (BGMM) shown in
Figure 5a.
Figure 6.
Difference between a normal distribution approximating National load forecast error and the 3-Gaussians BGMM model (BGMM) shown in
Figure 5a.
Figure 7.
Load forecast error distribution at National level as function of the expected load ramp (a). Weights of the three Gaussians adopted for representing the forecast error distribution, as a function of the hourly load ramp (b).
Figure 7.
Load forecast error distribution at National level as function of the expected load ramp (a). Weights of the three Gaussians adopted for representing the forecast error distribution, as a function of the hourly load ramp (b).
Figure 8.
Approximation of load and solar forecast error distribution using multiple bivariate BGMM distributions for Sicily Bidding zone.
Figure 8.
Approximation of load and solar forecast error distribution using multiple bivariate BGMM distributions for Sicily Bidding zone.
Figure 9.
Comparison between the two methods: upward error for the whole Italian power system, hour by hour and downward error for the whole Italian power system, hour by hour.
Figure 9.
Comparison between the two methods: upward error for the whole Italian power system, hour by hour and downward error for the whole Italian power system, hour by hour.
Figure 10.
Comparison between the two methods: upward error for Sardinia zone, hour-by-hour and downward error for North zone, hour by hour.
Figure 10.
Comparison between the two methods: upward error for Sardinia zone, hour-by-hour and downward error for North zone, hour by hour.
Figure 11.
Comparison between ancillary service markets costs (a). Percentage of the coverage of the requirement for the Replacement Reserve (RR) in the North zone for the six reference days (a percentage lower than 100% means that in some hours the submitted RR requirements cannot be fulfilled with available offers submitted to the Ancillary Service Market) (b).
Figure 12.
Data flow and sources for the RR activation demand computation.
Figure 12.
Data flow and sources for the RR activation demand computation.
Figure 13.
Duration curves of the estimated residual RR. In (a) residual upward RR, in (b) residual downward RR are shown.
Figure 13.
Duration curves of the estimated residual RR. In (a) residual upward RR, in (b) residual downward RR are shown.
Figure 14.
Forecast error of the RR activation demand estimated with a persistence method against the estimated RR activation demand.
Figure 14.
Forecast error of the RR activation demand estimated with a persistence method against the estimated RR activation demand.
Figure 15.
Comparison between ECMWF (European Centre for Medium-Range Weather Forecast), ARMA (Auto-Regressive Moving Averaged), ANN (Artificial Neural Network), LRobs (nowcasting methodology), LRno-obs (classic downscaling) [
32].
Figure 15.
Comparison between ECMWF (European Centre for Medium-Range Weather Forecast), ARMA (Auto-Regressive Moving Averaged), ANN (Artificial Neural Network), LRobs (nowcasting methodology), LRno-obs (classic downscaling) [
32].
Table 1.
Correspondence between the Italian and European definitions of reserve.
Table 1.
Correspondence between the Italian and European definitions of reserve.
| Italian Definitions | European Definitions |
|---|
| Secondary reserve | automatic Frequency Restoration Reserve (aFRR) |
| Spinning tertiary control reserve | manual Frequency Restoration Reserve (mFRR) |
| Replacement tertiary control reserve | Replacement Reserve (RR) |
Table 2.
Minimum, maximum, average value and standard deviation of RR and error.
Table 2.
Minimum, maximum, average value and standard deviation of RR and error.
| | RR (MW) |
|---|
| Minimum | Maximum | Average value | Std. Dev. |
|---|
| ITA | −6750 | 4553 | −1168 | 1135 |
| ZONE 1 | −2681 | 1293 | −43 | 240 |
| ZONE 2 | −3304 | 1600 | −356 | 472 |
| ZONE 3 | −4148 | 3448 | −345 | 773 |
| ZONE 4 | −1041 | 680 | −35 | 137 |
| ZONE 5 | −1334 | 1257 | −22 | 188 |
| ZONE 6 | −2887 | 4440 | −367 | 687 |
| | Error (MW) |
| | Minimum | Maximum | Average value | Std. Dev. |
| ITA | −4862 | 3738 | −63 | 928 |
| ZONE 1 | −1569 | 2581 | −10 | 209 |
| ZONE 2 | −1621 | 3413 | 123 | 336 |
| ZONE 3 | −3681 | 2999 | 122 | 657 |
| ZONE 4 | −907 | 587 | −10 | 93 |
| ZONE 5 | −1046 | 865 | −83 | 197 |
| ZONE 6 | −4811 | 1653 | −206 | 439 |
© 2020 by the authors. Licensee MDPI, Basel, Switzerland. This article is an open access article distributed under the terms and conditions of the Creative Commons Attribution (CC BY) license (http://creativecommons.org/licenses/by/4.0/).

 ,
, 


