1. Introduction
Climate change scientists generally agree that carbon dioxide (CO2) emissions, which lead to global warming, arise from using fossil fuels, namely coal, oil and gas, as energy sources. In this scenario, alleviating the effects of global warming and climate change necessitates substantial reductions in the use of fossil fuel energy. This is one of the most pressing demands on the international community to protect the global environment.
McCollum et al. note that global clean energy investments should exceed fossil fuel energy investments by 2025 in order to meet the Paris Agreement [
1,
2], which aims to hold the global average temperature growth below 2 °C compared with the preindustrial environment. Furthermore, McCollum et al. warn that, if the prices of crude oil are low in the decades ahead, the chances of mitigating global warming will also be low [
3]. Staples et al. argue that greenhouse gases would diminish by 9–68% if fossil fuels were to be replaced by bioenergy sources in heating and electricity production [
4].
Mitigating global warming requires scientists and social scientists of all persuasions to concentrate on reducing carbon emissions. Much of climate change scientific research relies on science and engineering. Useful contributions can also arise from an economic and financial market-based approach to tackling the problem of carbon emissions that would focus on examining the causality from stock market returns to CO2 emissions arising from fossil fuels. Such an approach would require a negative correlation between stock market returns and CO2 emissions. Such a negative effect would encourage financial decisions that contribute to higher stock returns and lower CO2 emissions, as compared with lower stock returns and higher CO2 emissions.
In a study of 22 developing countries, Sadorsky obtained a positive relationship between stock market growth and the demand for energy [
5]. Furthermore, several studies have reported that increases in energy demand tends to increase CO2 emissions (see, for example, [
6,
7,
8]). However, Paramati et al. examined the relationship between stock market growth and energy production from renewable sources in G20 countries from 1991 to 2012, and found that using renewable energy sources reduced CO2 emissions and increased economic output [
9].
Brockway et al. reported that the fossil fuel return-on-investment ratios are likely to approach those of renewable energy, since exploring new sources tends to be more expensive [
10]. Moreover, Egli et al. found that the upfront costs for solar and wind energy production have fallen significantly in Germany over the last 18 years [
11]. King and van den Bergh argued that the use of solar and wind energies had to increases two to three times faster than at present in order to maintain the current yearly energy supply growth rate of 0.5% [
12].
Wilson and Staffell noted that the British policy of replacing coal combustion with gas combustion has lowered total CO2 emissions in the UK by 6% in 2016 alone [
13]. Rinscheid and Wustenhagen stated that Germany’s recent decision to eliminate coal combustion by 2038 is far below the apparent expectations of the German public [
14].
In this paper, we use a financial market-based approach to investigate whether positive stock returns cause changes in CO2 emissions, or vice-versa. In determining which factor is the leader (cause) and which is the follower (effect), we will use the Granger test [
15,
16] of (non-)causality. If Granger causality can be determined in any direction, this will enable a clear directional statement regarding temporal predictability between stock returns and CO2 emissions.
The connection between financial development and carbon emissions has been less discussed and analyzed. For example, Shahbaz et al. examined bidirectional causality between financial development and CO2 emissions in Malaysia from 1971 to 2011 [
17]. Omri found bidirectional causality between energy consumption and CO2 emissions for several developing countries for the period 1990–2011 [
18]. Ren et al. discovered unidirectional causality from financial investments to CO2 emissions in China from 2000 to 2010 [
19]. Su et al. showed a similar result between Chinese GDP and CO2 emissions from 1992 to 2010 [
20].
A reason why financial development could lead to the rise of CO2 emissions is that financial development is related to the industrial structure, and CO2 emissions are also closely related to the industrial structure. Pertinent recent research on this topic has been conducted by Xu and Huang [
21] regarding spatial research on the effect of the financial structure on CO2 emissions; by Zhao and Yang [
22] on whether financial development influences CO2 emissions in Chinese provinces; by Tamazian, Chousa and Vadlamannati (2009) on the effects of higher economic and financial development on environmental degradation in BRIC countries [
23]; by Jalil and Feridun (2011) on the impact of growth, energy and financial development on the environment in China [
24]; by Zhang (2011) on the impact of financial development on carbon emissions in China [
25]; by Ozturk and Acaravci (2013) on the long-run and causal analysis of energy, growth, openness and financial development on carbon emissions in Turkey [
26]; by Haseeb, Xia, Baloch, and Abbas (2018) on financial development, globalization, and CO2 emission in the presence of the environmental Kuznets curve for BRICS (Brazil, Russia, India, China, and South Africa) countries [
27]; by Ahmad, Khan, Rahman and Khan (2018) on whether financial development asymmetrically affects CO2 emissions in China based on the NARDL model [
28]; by Boutabba (2014) on the impact of financial development, income, energy and trade on carbon emissions in India [
29]; by Xiong, Tu and Ju (2017) on reconciling regional differences in financial development and carbon emissions using a dynamic panel data approach [
30]; and by Huang and Zhao (2018) on the impact of financial development on trade-embodied carbon dioxide emissions in Chinese provinces [
31].
Although not examining carbon emissions, Ziaei (2015) found that stock market returns had a unidirectional and positive effect on energy consumption while, as above [
32], Tamazian et al. (2009) investigated the relationship between stock markets and CO2 emissions in BRIC countries from 1992 to 2004 [
23]. They concluded that the development of financial systems tended to reduce CO2 emissions per capita in developing countries.
To the best of our knowledge, this paper is the first to investigate the relationship between stock market returns and carbon emissions for developed economies with sophisticated financial markets. The primary purpose of the paper is to examine the existence of a negative correlation between stock returns and carbon emissions arising from carbon emissions from fossil fuels, and to test for causality between stock returns and carbon emissions. In order to examine further connections between CO2 emissions and stock returns, we use three regressions with the whole data set to detect the sign of the causality and statistical significance, namely the relative changes in emissions from coal and stocks, oil and stocks, and gas and stocks.
The remainder of the paper is organized as follows: the data and methodology are discussed in
Section 2, the empirical results are evaluated in
Section 3, and some concluding remarks are presented in
Section 4.
2. Data and Methodology
The empirical data include annual CO2 emissions from fuel combustion of the three main fossil energy sources, namely coal, oil and gas. The CO2 emissions data are obtained from the [
33] International Energy Agency (IEA) (2020), which provides reliable data of greenhouse gases arising from energy production. The annual reference data come from stock markets, where the focus is on countries with sophisticated financial markets that are included in the Morgan Stanley Capital International (MSCI) World Index from 1971 to 2017.
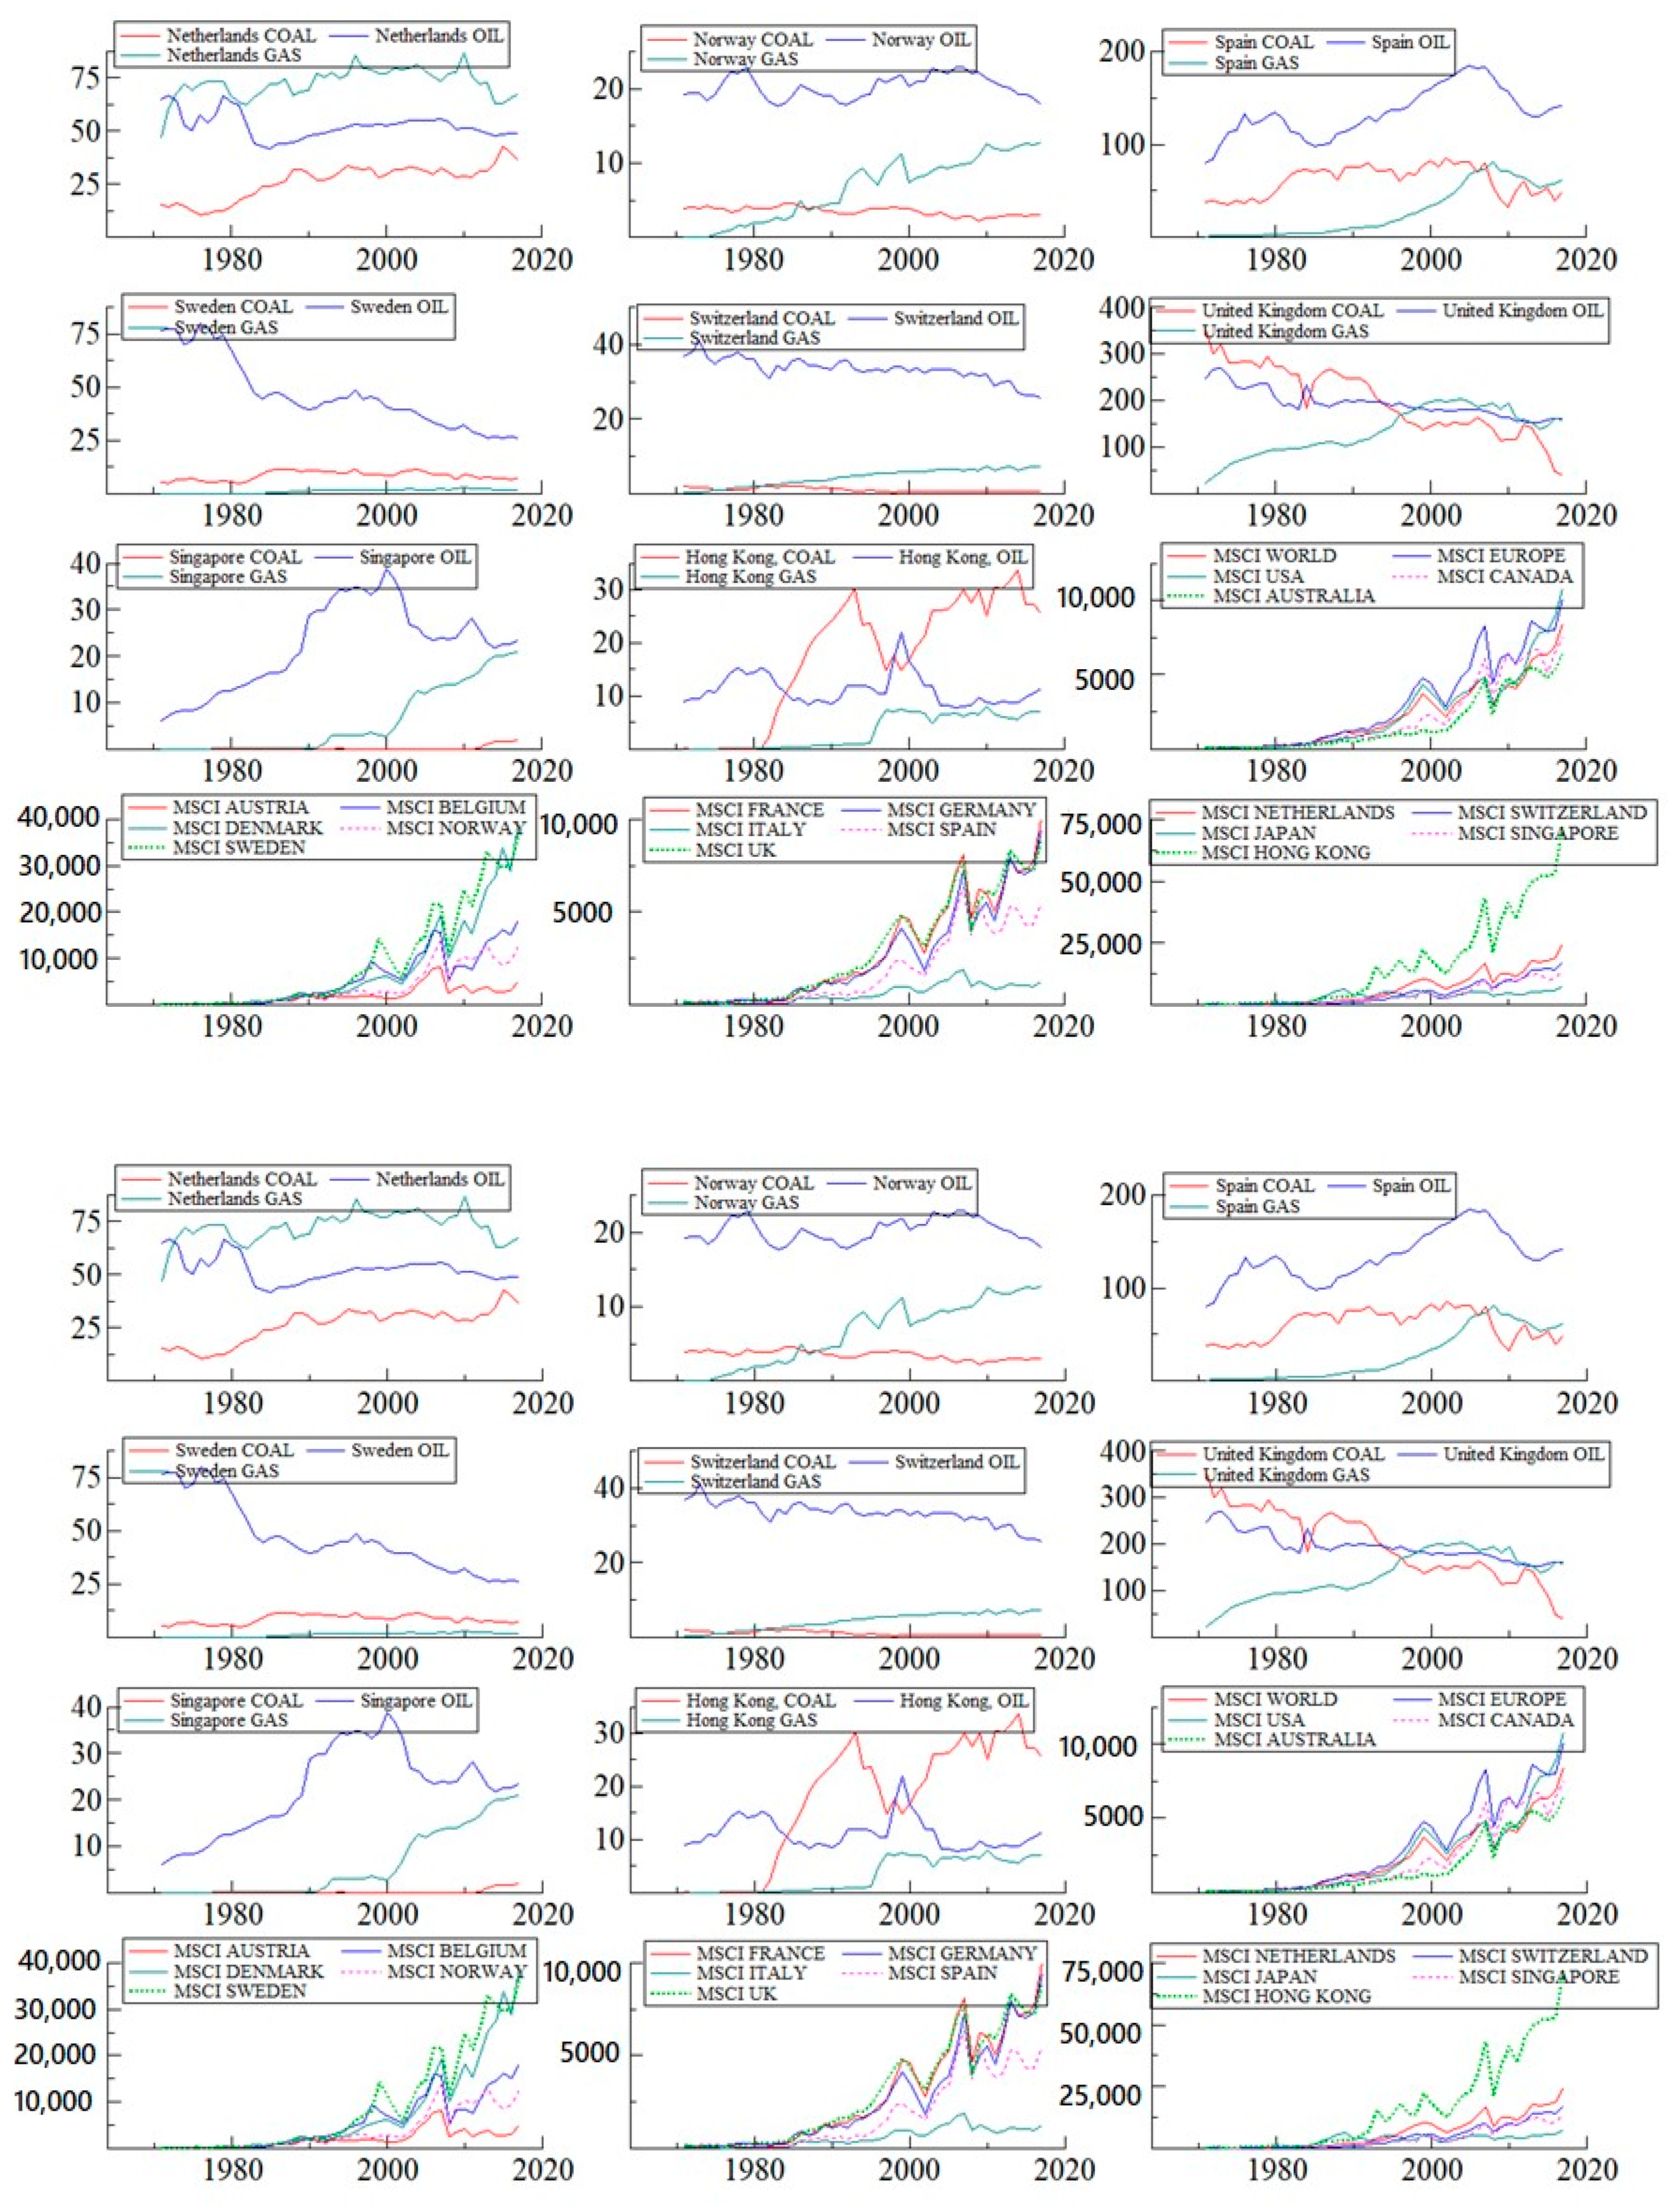
In addition to data for the world and Europe, the 18 countries in the data set include the USA, Canada, Australia, Japan, Austria, Belgium, France, Denmark, Germany, Italy, The Netherlands, Norway, Spain, Sweden, Switzerland, UK, Singapore and Hong Kong. Thus, we use 20 annual time series with 47 observations of CO2 emissions (in million tons) from the combustion of coal, oil and gas. The annual MSCI price ratings are reported in US dollars, with dividends reinvested.
The country variables and an aggregate variable, namely the MSCI World Index, are presented in
Table 1. The CO2 emissions from three fossil fuels are given in millions of tons, and the MSCI stock index (large and mid-cap) prices with dividends reinvested are in US dollars.
Figure 1 presents the annual series of CO2 emissions from combusting coal (red line), oil (blue line), and gas (turquoise line). The 20 time series are from 1971 to 2017. The MSCI stock indices are presented in four groups, specifically: (1) World, Europe, USA, Canada and Australia; (2) Austria, Belgium, Denmark, Norway and Sweden; (3) France, Germany, Italy, Spain and UK; and (4) The Netherlands, Switzerland, Japan, Singapore and Hong Kong.
According to the augmented Dickey–Fuller (ADF: [
34] Dickey and Fuller, 1981) tests, based on including an intercept and a deterministic time trend (see
Table 2), all the series in
Figure 1 are found to be nonstationary with a unit root, while all the relative changes (or logarithmic returns) in emissions and MSCI returns are found to be stationary, where the relative changes in CO2 emissions are calculated as follows:
with
CO2t (
CO2t − 1) denoting annual carbon emissions in year
t (
t − 1). Siimlarly, the logarithmic returns in the MSCI stocks index are calculated as:
with
Pt (
Pt − 1) denoting the MSCI index price (with dividends included) in year
t (
t − 1).
For these reasons, the empirical analysis will use the logarithmic returns of fuel combustion and the stock index.
3. Empirical Results
The correlations for 1971–2017, where the variables are the relative changes in CO2 emissions in coal, oil, and gas and stock, are shown in
Table 3,
Table 4,
Table 5,
Table 6,
Table 7,
Table 8,
Table 9,
Table 10,
Table 11,
Table 12,
Table 13,
Table 14,
Table 15,
Table 16,
Table 17,
Table 18,
Table 19,
Table 20,
Table 21 and
Table 22.
Table 3,
Table 4,
Table 5,
Table 6,
Table 7,
Table 8,
Table 9,
Table 10,
Table 11,
Table 12,
Table 13,
Table 14,
Table 15,
Table 16,
Table 17,
Table 18,
Table 19,
Table 20,
Table 21 and
Table 22 present the correlation matrices of all the stationary logarithmic returns series. Tables reveal that, for coal combustion, the highest negative correlation between stock market returns and CO2 emissions is for Switzerland at −0.28, while the highest positive correlation is for UK at 0.18. For oil combustion, the highest negative correlation between MSCI and CO2 emissions is for Australia at −0.35, while the highest positive correlation is for Norway at 0.32. For gas combustion, the highest negative correlation between MSCI and CO2 emissions is for Denmark at −0.28, while the highest positive correlation is for Austria at 0.27.
The correlation coefficients in
Table 3,
Table 4,
Table 5,
Table 6,
Table 7,
Table 8,
Table 9,
Table 10,
Table 11,
Table 12,
Table 13,
Table 14,
Table 15,
Table 16,
Table 17,
Table 18,
Table 19,
Table 20,
Table 21 and
Table 22 are unconditional, and represent the average values for the sample period, 1972–2017, as one year is lost in calculating the log-returns. The rolling window method reveals the evolution of the correlation coefficients, and can be calculated using the relative changes in emissions and MSCI returns from 1972 to 1981. The correlation coefficients are given as
, where
i rfeers to the relative change in fossil fuel (coal, oil and gas, respectively) emissions,
j refers to MSCI returns of country
j, and
t refers to the period 1972–1981, whereby the window is rolled progressively one year ahead.
Using the rolling window approach and data, for each pair, we obtain 37 coefficients for ten-year rolling window correlation coefficients.
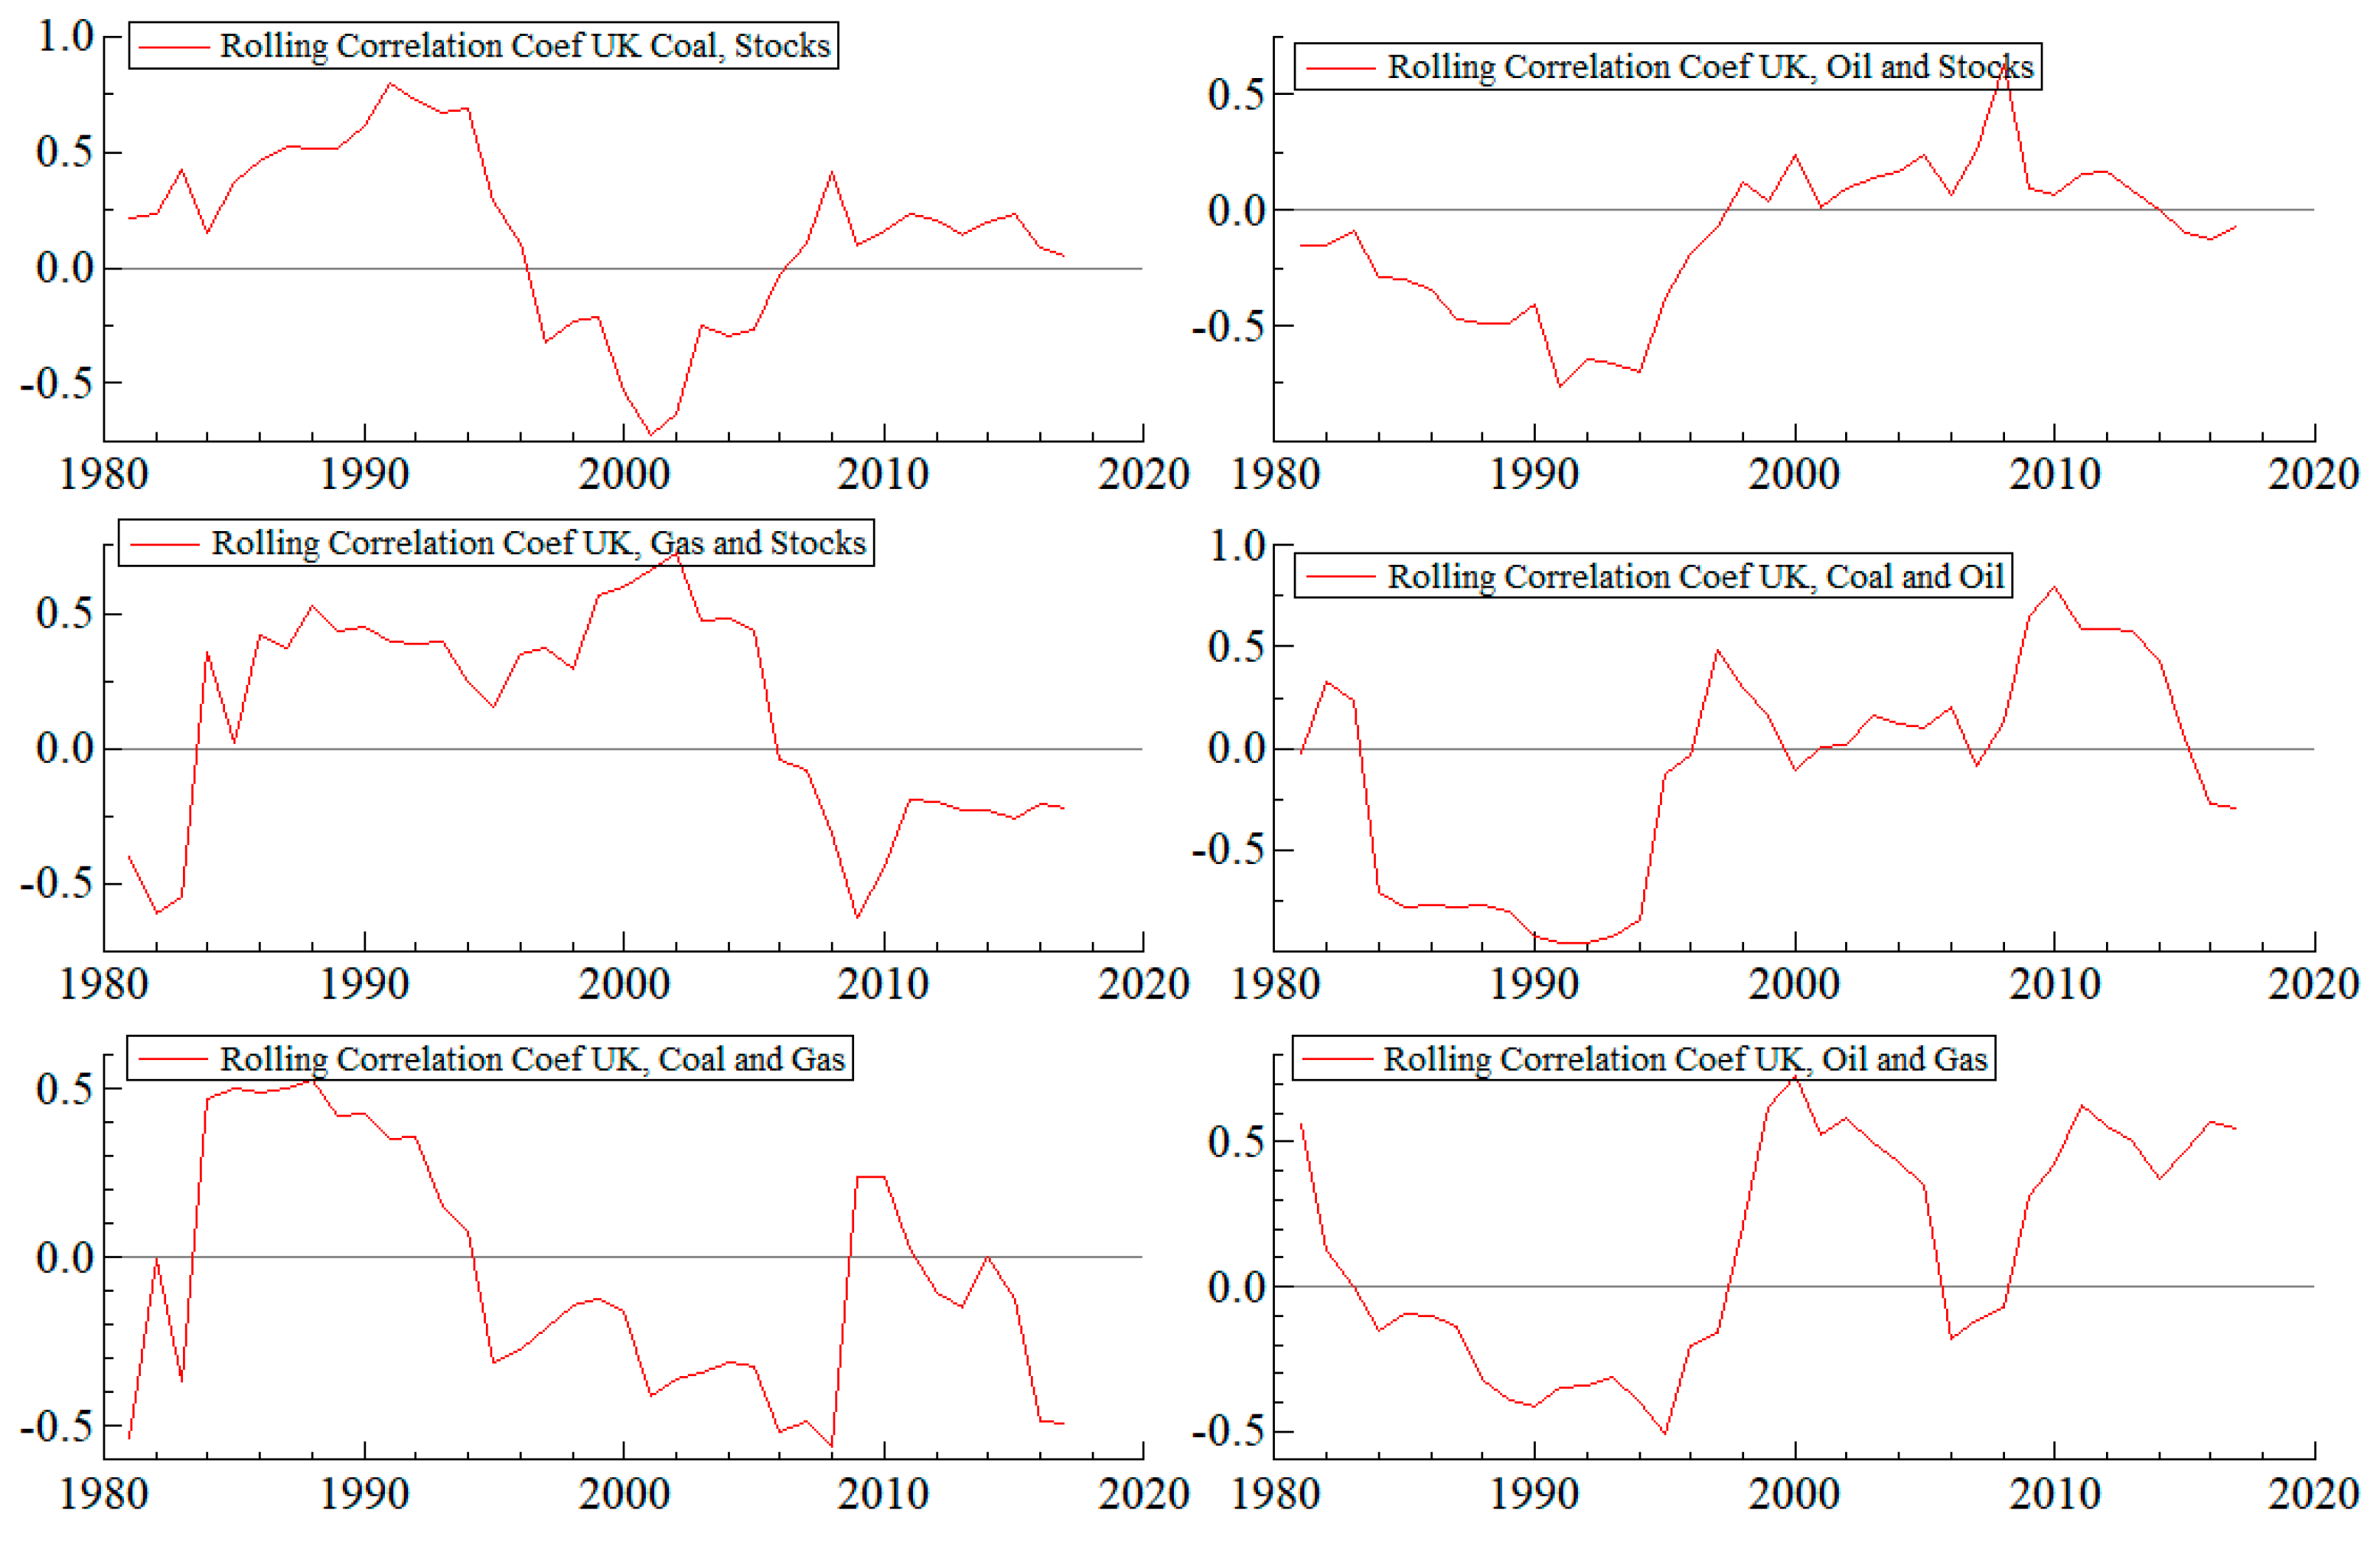
Figure 2 gives an illustration of the rolling window coefficients for the UK. The figure shows the evolution of the correlation coefficient between coal-origin CO2 emissions and stock returns in the UK approaches zero, which differ from the average sample unconditional correlations. Nevertheless, the correlation coefficients between both oil and gas CO2 emissions and stock returns are negative for 2008–2017, as are the unconditional correlations over the longer period, 1972–2017.
The rolling window correlations for UK are negative for all three fossil fuels, namely coal, oil and gas, for substantial subperiods of the full set of sample observations.
Table 23 reports the last rolling window correlations between 2008 and 2017 for annual MSCI country index returns and annual relative changes in CO2 emissions from coal, oil and gas.
Table 23 reveals that the highest positive correlation between CO2 emissions from coal and stock returns is in Japan at 0.65. This is probably because of the Fukushima nuclear disaster as the unconditional correlation in
Table 8 is −0.14. The highest negative correlation between stock returns and CO2 emissions is in Italy at −0.51, and progress seems to have been climate friendly as the average correlation in
Table 14 is −0.13. The highest positive correlation between CO2 emissions from oil and stock returns is in Norway at 0.48, which has increased from the unconditional correlation in
Table 16 at 0.32 in the last subsample, 2008–2017.
The highest negative correlation for oil and stock returns is in Germany at −0.42, indicating a positive development since the unconditional correlation in
Table 13 is 0. Furthermore, the highest positive correlation between CO2 emissions from gas combustion and stock returns is in Sweden at 0.62, with a significant increase from the average correlation coefficient in
Table 18 at 0.04. The highest negative correlation between relative change in CO2 emissions from gas combustion and stock returns is in Spain at −0.52, which is a substantial improvement from the unconditional correlation of 0.11 in
Table 17.
Calculating the average correlation coefficients in
Table 23 for the last subsample—2008–2017, in the European MSCI index countries (namely, Austria, Belgium, France, Denmark, Germany, Italy, The Netherlands, Norway, Spain, Sweden, Switzerland, and UK) produces the following average correlations between the pairs: stock returns and coal at −0.02, stock returns and oil at −0.02; and stock returns and gas at 0.04. The unconditional average correlations in
Table 9,
Table 10,
Table 11,
Table 12,
Table 13,
Table 14,
Table 15,
Table 16,
Table 17,
Table 18,
Table 19 and
Table 20 are −0.03, 0.12 and 0.03, respectively. Thus, there is a modest negative correlation between stock returns and CO2 emissions from oil combustion when the European Union Emissions Trading System (EU ETS) trading phases 2 and 3 have been active.
Table 24 presents the Granger causality test results where the null hypothesis is that the stock returns do not Granger-cause the relative change in CO2 emissions, or vice-versa, and the alternative hypotheses is that there is a unidirectional or bidirectional Granger-causal relationship. The null hypothesis is tested using a 5% significance level. The test statistic follows the
F distribution with
m and
n − k degrees of freedom:
where
m is the number of lagged variables in the restricted (null) regression,
n is number of observations for estimation and testing,
k is number of estimated parameters in the unrestricted (alternative) regression,
RSSR is the residual sum of squares in the restricted (null) regression, and
RSSU is the residual sum of squares in the unrestricted (alternative) regression.
The results in
Table 24 show that all the statistically significant causality findings are unidirectional, where the stock market returns Granger-cause CO2 emissions, but not the reverse. If the causality test does not find statistically significant causality, the entries are given as “No causality”. The sign → indicates unidirectional causality from one variable to another.
The outcomes of the causality tests are quite clear for the countries that are included in the [
35] Morgan Stanley Capital International (MSCI) World Index (2020) from 1971 to 2017.
Table 24 reports causality from stock returns to CO2 emissions from coal combustion for the USA, Austria, Belgium, Italy and Norway. In addition,
Table 24 reports statistically significant causality from stock returns to CO2 emissions from oil combustion for the USA, Japan, The Netherlands, Spain and Singapore. Finally, the only significant causality from stock returns to CO2 emissions from gas combustion is identified as Spain.
The causality tests suggest that stock returns should explain relative changes in carbon emissions from coal and oil, but not gas. In order to detect this based on regression analysis, we use three linear regressions with dummy variables (LDV):
where
if
, and 0 otherwise. The dependent variable is the relative change of CO2 emissions from coal (the second regression is for oil, and the third regression is for gas) for country
i, and the explanatory variable is stock returns in MSCI-world country
i. Newey–West HAC (Heteroskedasticity and Auto-Correlation) robust standard errors are calculated.
Table 25 shows the panel regression results. The table reveals that, when stock returns rise by 1%, emissions from coal are reduced by 9% at the 6.5% significance level. When stock returns rise by 1%, emission from oil increases by 2% at the 0.1% significance level. When stock returns rise by 1%, there are no significant effects of emissions on gas. Thus, it seems that positive stock returns reduce CO2 emissions from coal, but increases CO2 emissions from oil.
4. Concluding Remarks
The international community seems to be generally agreeable that scientific evidence shows the use of fossil fuels, namely coal, oil and gas, as energy sources, leads to carbon dioxide (CO2) emissions, and hence to the destructive effects of global warming and climate change. It follows that mitigating the effects of global warming and climate change necessitates substantial reductions in the use of fossil fuel energy.
This paper used a financial market-based approach to investigate whether positive stock returns cause changes in CO2 emissions based on the Granger causality test to determine cause and effect, or leader and follower. It was shown that if Granger causality could be determined in any direction, this would enable a clear directional statement to be made regarding temporal predictability between stock returns and CO2 emissions.
The empirical data included annual CO2 emissions from fuel combustion of the three main fossil energy sources, namely coal, oil and gas, based on 18 countries that are in the Morgan Stanley Capital International (MSCI) World Index from 1971 to 2017. The empirical results showed clearly that all the statistically significant causality findings were unidirectional from the stock market returns to CO2 emissions from coal, oil and gas, but not the reverse.
Therefore, as stock returns can affect carbon emissions, a financial-market based approach could be a useful addition to the variety of public and private policy armory considerations to mitigate the debilitating effects of carbon emissions on the global environment.
Specifically, for emissions from coal combustion, the results are encouraging as the market-oriented approach to deal with climate change requires a negative correlation between the variables. However, the results from oil reveal that positive stock returns have failed to reduce CO2 emissions suggesting that further research is required before any conclusive policy recommendations can be made.
Furthermore, the relationship between gas combustion and stock returns also needs more detailed investigation in order to suggest relevant policy recommendations. It may be that economic factors that affect the relationship between fossil energy emissions and stock returns have gradually changed over the last 50 years, but this needs more frequent data for greater precision. If the relationship has not developed gradually, the empirical results might suggest that we would need different regulations regarding coal and oil in order to mitigate the effects of global warming and climate change.


