Article

Experimental Study on Energy Efficiency of Multi-Functional BIPV Glazed Façade Structure during Heating Season

Laboratory for Sustainable Technologies in Buildings, Faculty of Mechanical Engineering, University of Ljubljana, SI-1000 Ljubljana, Slovenia
*
Author to whom correspondence should be addressed.
Energies 2020, 13(11), 2772; https://doi.org/10.3390/en13112772
Submission received: 29 April 2020 / Revised: 19 May 2020 / Accepted: 26 May 2020 / Published: 1 June 2020
(This article belongs to the Special Issue Evaluation of Energy Efficiency and Flexibility in Smart Buildings)

Abstract

:
Building integrated photovoltaics (BIPV) is technology that can significantly increase the share of renewable energy in final energy supply and are one of essential technologies for the nearly zero-energy buildings (nZEB), new build and refurbished. In the article (a) an experimental semitransparent BIPV glazed façade structure with 60% of PV cell coverage is shown; (b) energy efficiency indicators were developed based on identified impact parameters using experimental data; and (c) multi-parametric models of electricity generation, preheating of air for space ventilation, and dynamic thermal insulation features that enable prediction of solar energy utilization in different climate conditions are shown. The modeled efficiency of electricity production of BIPV was in the range between 8% and 9.5% at daily solar radiation above 1500 Wh/day, while low impact of outdoor air temperature and ventilation air flow rate on PV cell cooling was noticed. Between 35% and 75% of daily solar radiation can be utilized by preheating the air for space ventilation, and 4.5% to 7.5% of daily solar radiation can be utilized in the form of heat gains through opaque envelope walls.

Graphical Abstract

1. Introduction

Buildings in Europe are responsible for 36% of all greenhouse gas emissions. To fulfil targets presented in the Paris climate agreement, emissions in the building sector must be decreased by 90% [1]. Building integrated photovoltaics (BIPV) in form of façade structures are solutions that can significantly contribute to this goal, as well as increase the share of renewable energy in the final energy supply. As such, BIPV are one of the essential technologies for the nearly zero energy buildings. Regarding to the structure of building stock and for ensuring the cost effectiveness of BIPV in general, solutions for refurbishment of buildings are of great interest [2]. Among several design options, BIPV glazed façade with a natural or forced ventilated air gap has several comparative advantages and are from the architectural perspective upgraded double ventilated façades [3].
One way to fulfil this goal is in the multi-functionality of BIPV solutions. Relative low efficiency of solar energy utilization with PV cells can be improved by solar concentrators or tracking devices, although in case of BIPV applications, it is more convenient to upgrade PV modules to combine power and heat generators to so called photovoltaic thermal building structures (BIPV/T). The liquid heat transfer media can be used to supply the heat to the buildings [4,5], although preheating of ventilation air for building ventilation is a better option because such applications operate as a low exergy system [6]. In [7] opaque PV modules are cooled by air flowing through the forced ventilated air gap and authors report that the overall energy efficiency during the winter months was in the range between 48% to 52% on the monthly basis. Analysis of natural ventilated semitransparent BIPV designed as a double façade structure is shown in [8] showing energy and environmental advantages of semitransparent BIPV over the opaque PV modules. In [9] authors propose solutions for forced ventilated close loop BIPV/T based on the analytical modeling and point out the need for experimental validation.
The second most common cited advantage of ventilated BIPV structures is the increase of the PV cell efficiency by cooling. Buoyancy driven natural ventilated semitransparent BIPV consisting of see-through a-Si PV cells was studied by [10]. Authors have shown that daily energy output can be increased by 1.9% to 3% due to the lower operating PV cell temperature. Ventilated BIPV façade was studied by [11] and authors claim that the PV modules efficiency can be increased by 2.2% on the annual basis in case of natural ventilation and up to 4.7% to 5.7% in cases of forced ventilation with different air flow rates. Similar results, 2.5% increase in annual electricity production by ventilated façade mounted opaque PV modules, are reported in [12].
Ventilation of buildings significantly contributes to the wellbeing in buildings. Not only bioeffluents, but pollutants such as formaldehyde and odors, can be efficiently removed from indoor air [13]. Proper indoor air quality (IAQ) increases the occupant’s productivity as well [14]. Mechanical ventilation systems with heat recovery could efficiently reduce heat demand, but significantly increase the electricity demand, especially in commercial buildings. Nevertheless, in [15] it is shown that in all-glass buildings with BIPV façade structures, electricity demand for ventilation, even in case of the ventilation systems that fulfill present requirements about energy efficiency, is dominant compared to heating, cooling, and lighting systems, measured by primary energy needed. Central mechanical ventilation systems are difficult to adjust to the presence of occupancies and their personal physiological needs. Furthermore, decentralized ventilation can be energy efficient in most European climate regions [16]. Dynamic insulation is a part of the building envelope where outdoor air passes through a porous thermal insulation layer towards the interior and redirects heat loss flux. Research on this technique is shown in [17]. The authors have shown that dynamic thermal transmittance of a ventilated structure having static U 0.3 W/m2K decreases to 0.15 W/m2K at air flow rate 0.75 1/s per m2 of the building structure area. Similarly, transmission heat losses of the envelope building structure can be decreased if the air gap, designed inside the building structures, is ventilated by outdoor air, and then transferred into the buildings as preheated air. In [18] building ventilated opaque BIPV was studied at a steady state outdoor temperature, solar irradiation, and wind velocity. Indoor heat gains were investigated using computational fluid dynamics (CFD) techniques and compared to static heat losses expressed by thermal transmittance U of the building envelope structure.
In the presented article, a multi-functional modular semitransparent BIPV glazed façade structure was designed, built, in-situ tested, and analyzed during winter-time conditions. M-Si PV cells are built in the BIPV in form of double side glass laminated PV module with 60% PV cell packing factor, which make the BIPV is semitransparent. Modular units can be multiplied according to needs of particular flat/office/building in new, as well as in renovated buildings. Thick temperate glass layers (4 mm each) of BIPV also result in the specific thermal response of the structure. Several aspects of functionality of solar energy utilization are addressed and evaluated, such as (a) electricity production, preheating of air for space ventilation and dynamic thermal insulation performance; (b) overall efficiency of solar energy utilization is determined in form of approximation multi-parametric model, providing a tool for evaluation of such BIPV glazed façade structure in different climate conditions; and (c) all models are developed on the base of diurnal averaging of independent variables, which enables integration in buildings thermal response models.

2. Object of Research and Research Methods

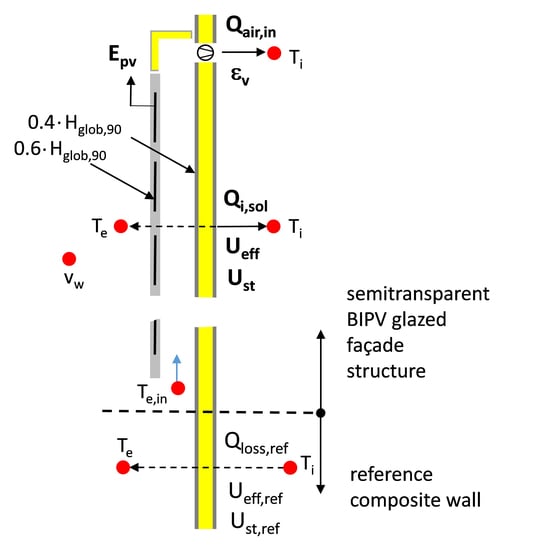
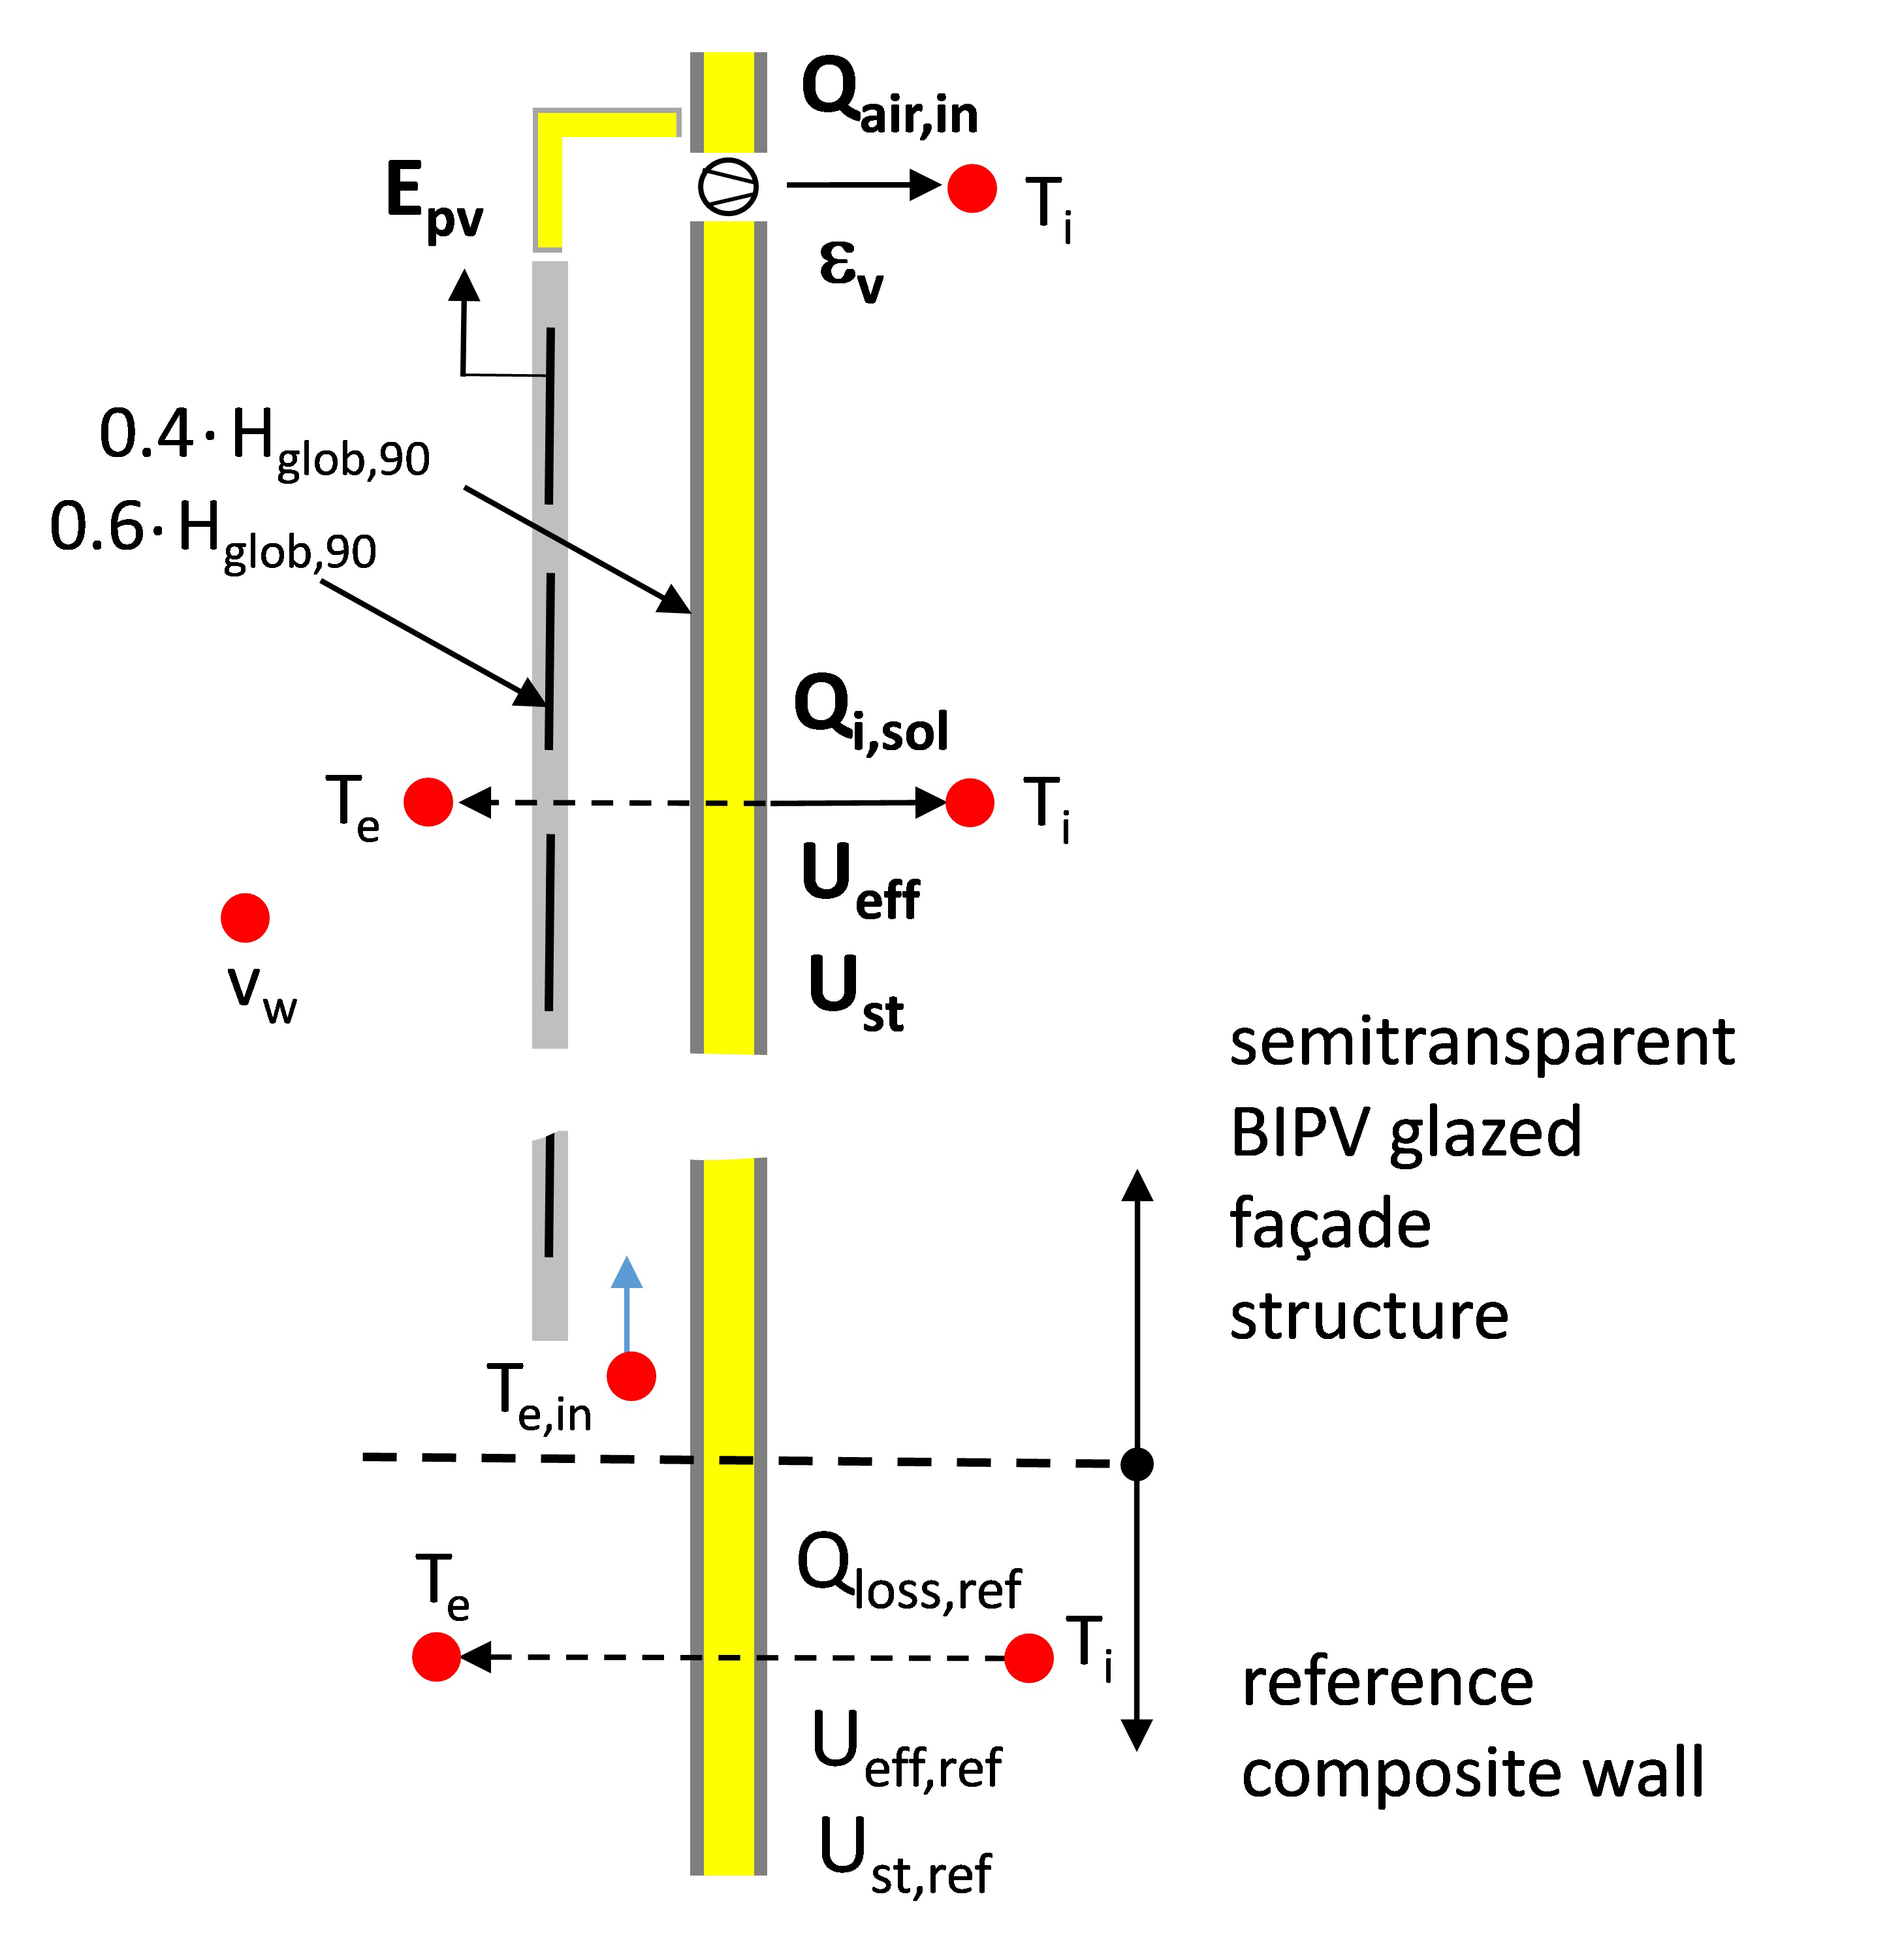
2.1. Semitransparent BIPV Glazed Façade Structure with Forced Ventilated Air Gap

In general term, BIPV are multifunctional devices because they incorporate passive functions of ordinary façade (or roof) structures, for example, precipitation and sound protection with active renewable energy utilization. In this way lower production of electricity compared to self-stand systems, as a consequence of the position of installation defined by the building envelope, can be compensated at least in terms of investment. Nevertheless, in the presented article, the multifunctional nature of the examined BIPV glazed façade structure is evaluated in terms of utilization of solar energy thereby increasing energy efficiency of the building, while improving indoor living comfort. A pilot BIPV glazed façade structure was designed to fit new buildings and could be used for energy refurbishment as well, possibly eliminating the need for additional thermal insulation. It consisted of a transparent glass façade with integrated PV cells and forced ventilated air gap which, beside electricity production, enabled preheating of fresh supply air and it to act as dynamic thermal insulation (Figure 1). In this way, the heat losses of façade envelope decrease as consequence of the lower (static) thermal transmittance Ust and because part of transition heat losses preheats the air that flows inside the ventilated air gap. Both effects are evaluated with dynamic thermal transmittance Ueff. To increase the efficiency of solar energy utilization, the BIPV was designed as a semitransparent structure with 60% of opaque PV cell area. Another reason for this BIPV design follows from optimization of multilayer glazing according to the natural heating, shading, daylight, and occupancies view towards the outdoor environment [15]. A similar conclusion is presented in [8]. In this way, both the ventilated BIPV on the opaque façade structure and BIPV glazing can be combined with the same architectural appearance of the building. BIPV were produced by [19] and consist of two 4 mm hard glass panes and encapsulated layer. Monocrystalline silicon cells with reference efficiency 18.5% [19] and size 156 × 156 mm are installed in the BIPV glazed structure.
The BIPV glazed façade structure was installed in front of the opaque south orientated façade wall of laboratory unit in the way, and an 80 mm thick air gap, which was between BIPV glazed structure and façade wall, was formed. The façade wall (Figure 1a) consisted of a thermal insulation layer (d 0.035 m, λ 0.035 W/mK), lined by an inner and outer layer of solid wood (d 0.005 m, λ 0.14 W/mK) made of two transversely glued soft wood plates. Such building structures are often installed as opaque parapet as part of glazed building façade structures, since its thermal transmittance Ust (1.027 W/m2K) does not exceed the common required level for glazed façades (e.g., in Slovenia Umax equals 1.3 W/m2K). The surface of the structure has absorptivity of solar irradiation αs 0.65 and emissivity of IR irradiation εIR 0.9, which is close to that of concrete façade structures. The section of the experimental BIPV glazed façade structure is 0.435 m wide and 1.167 m high, with area ABIPV 0,508 m2. All support structures, such as the installing frame and outdoor and indoor air channels were thermal insulated to keep heat transfer close to the 2D problem.
The air gap was forced ventilated by two DC fans with power of 2 W at a supply voltage of 12 V. By changing the supply voltage, ventilation air flow rate V ˙ a , i n was set on a daily basis to the value between 0 m3/h and 61.5 m3/h and kept constant all day long. If reverse flow fans were used instead, the overheating protection by forced ventilation of the air gap with cooler indoor air instead of warmer outdoor air, could be applied. The thermal response of the BIPV glazed façade structure in case of the non-ventilated air gap was tested to examine the static thermal transmittance Ust of the structure, while other discrete values of ventilation air flow rates were selected based on the indoor air quality (IAQ). It was assumed that the office with a net volume Vn of 35 m3 and a useful area Au 14 m2 will be equipped by the pilot BIPV shown in Figure 1. One person (1.2 met, 1 clo) occupied the office between 8:00 and 17:00 and emitted SCO2 800 mg of CO2 per minute [20]. No brake or leaving from the office was assumed. When the person started to work, the CO2,8:00 concentration was equal to the outdoor concentration 500 ppm. The first order concentration model was used to determine transient CO2,t concentrations assuming constant conservative (decay factor k = 0) pollutant source SCO2 [21]:
C C O 2 , t = S C O 2 + C C O 2 , 8 : 00 V ˙ a , i V ˙ a , i + k . V n d e c a y 0 ( mg m 3 )
C C O 2 , t = C C O 2 , t + ( C C O 2 , t = 0 C C O 2 , t ) e V ˙ a , i V n t ( mg m 3 ) .
Taking into account IAQ quality categories as defined in [22], the CO2,17:00 concentration that appeared in the office at the end of the workday (at 17:00) did not exceed class III (1350 ppm above outdoor concentration) if office was ventilated with constant air flow rate V ˙ a , i n 19.5 m3/h, and class I requirements (550 ppm above outdoor concentration) were achieved if office was ventilated with constant air flow rate V ˙ a , i n 62 m3/h.

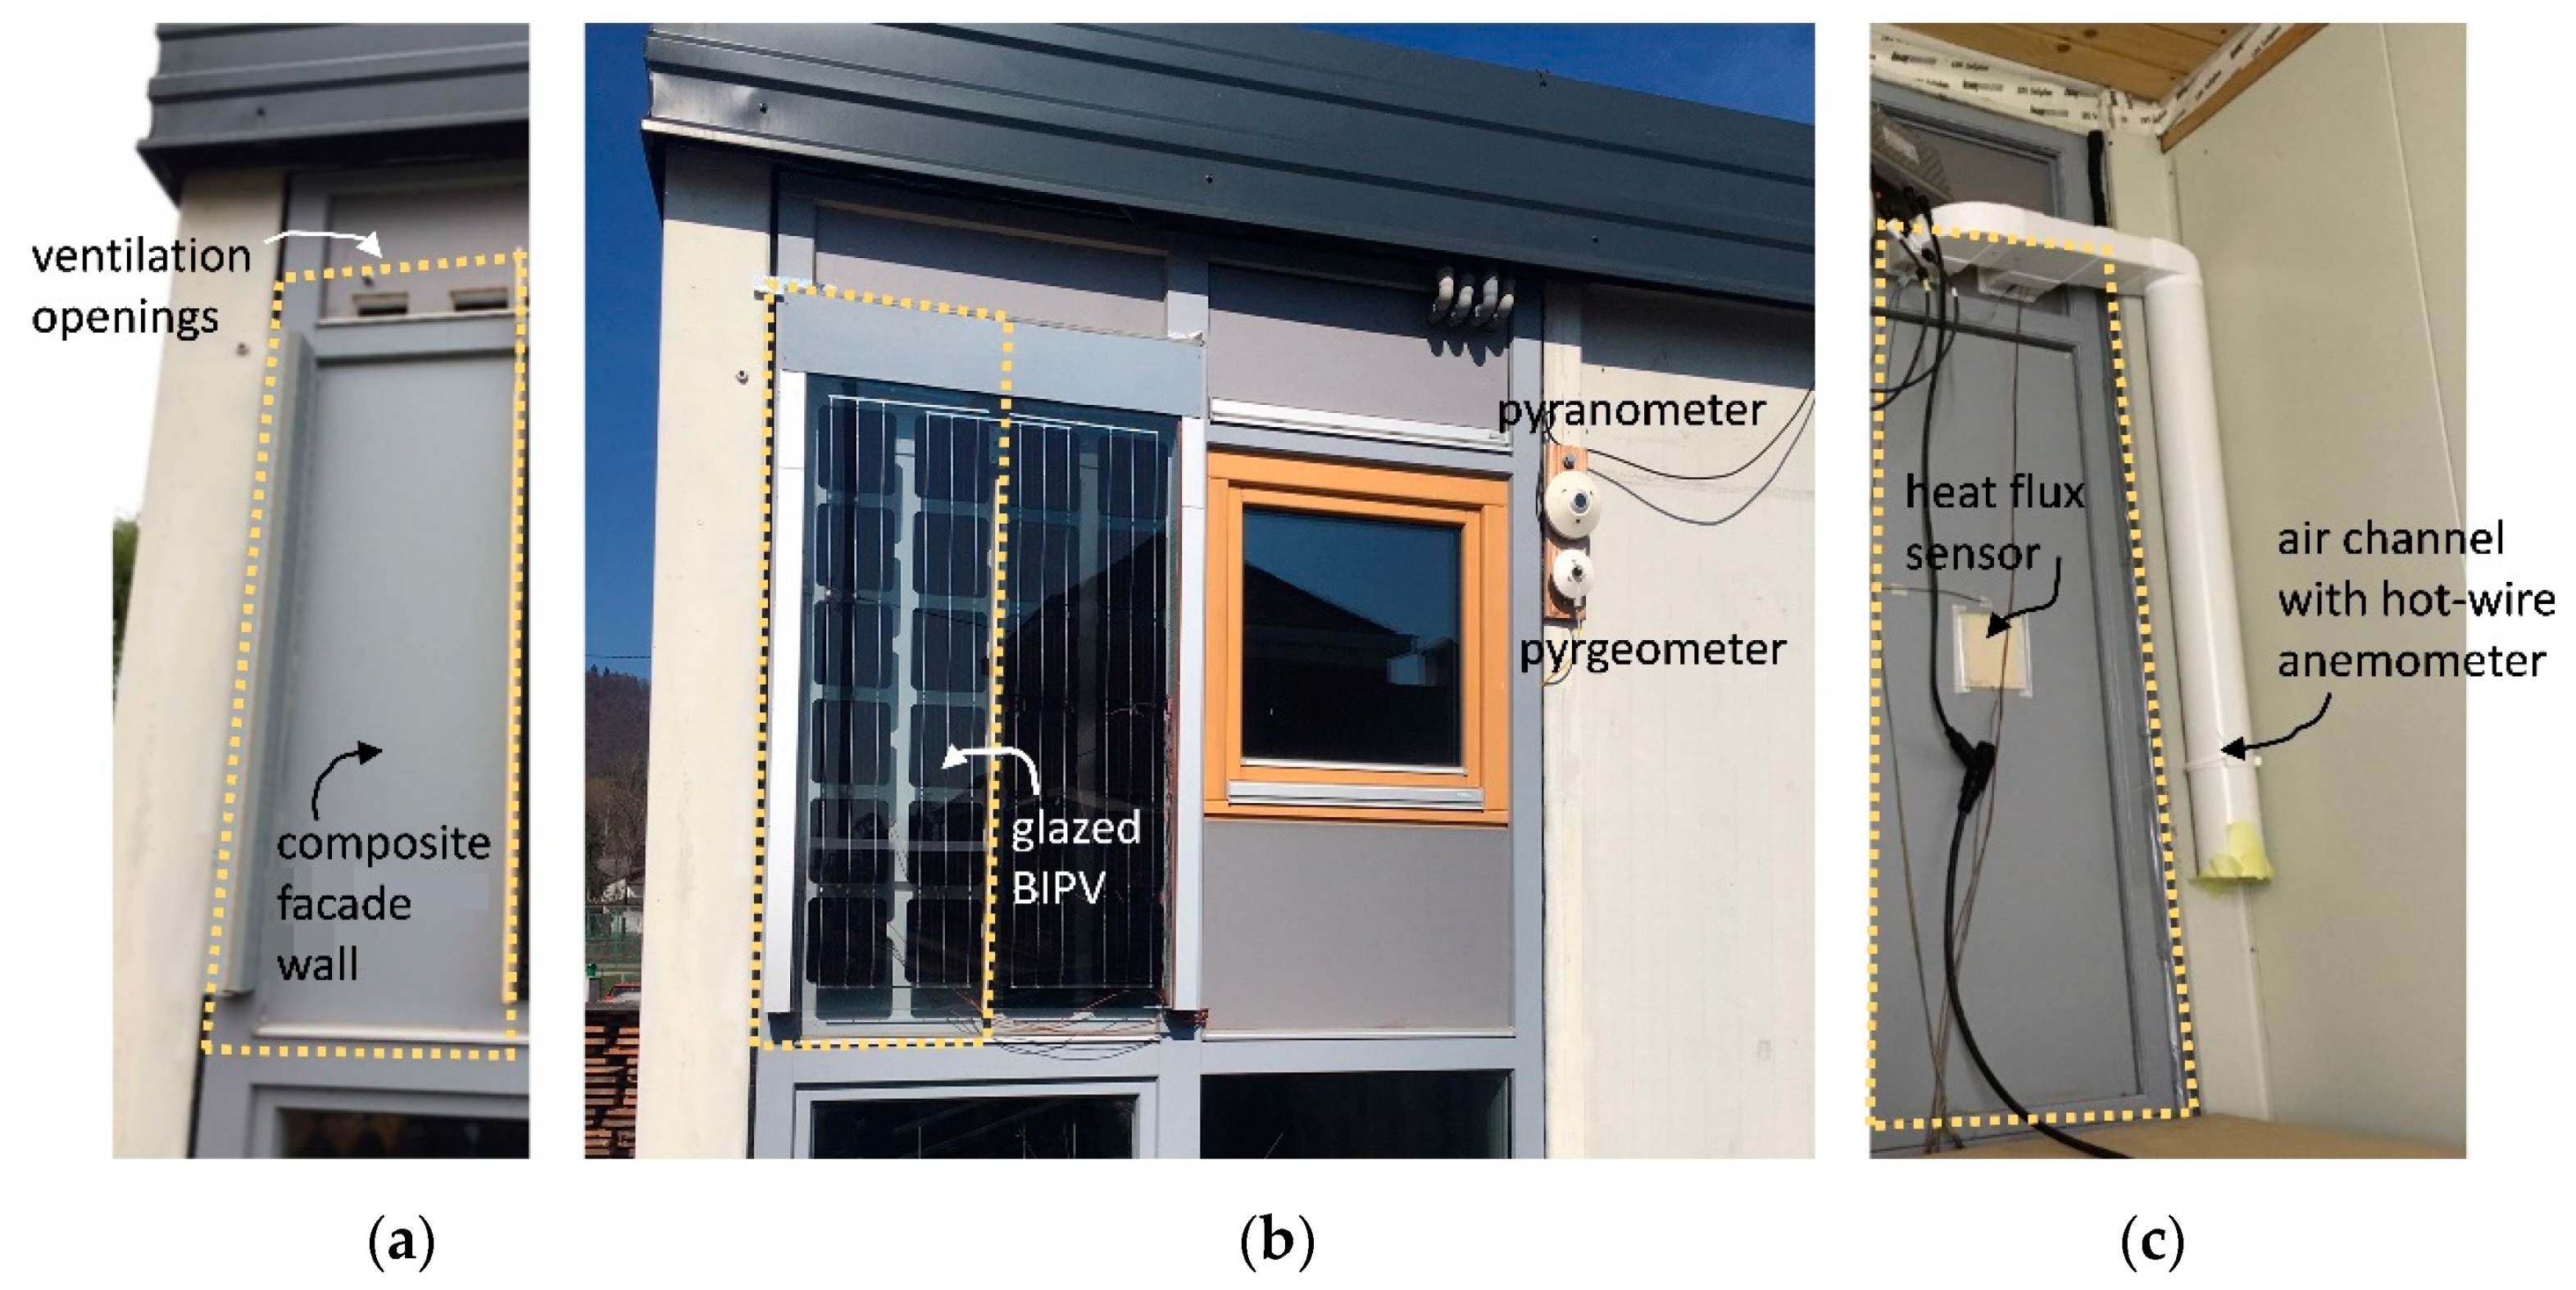
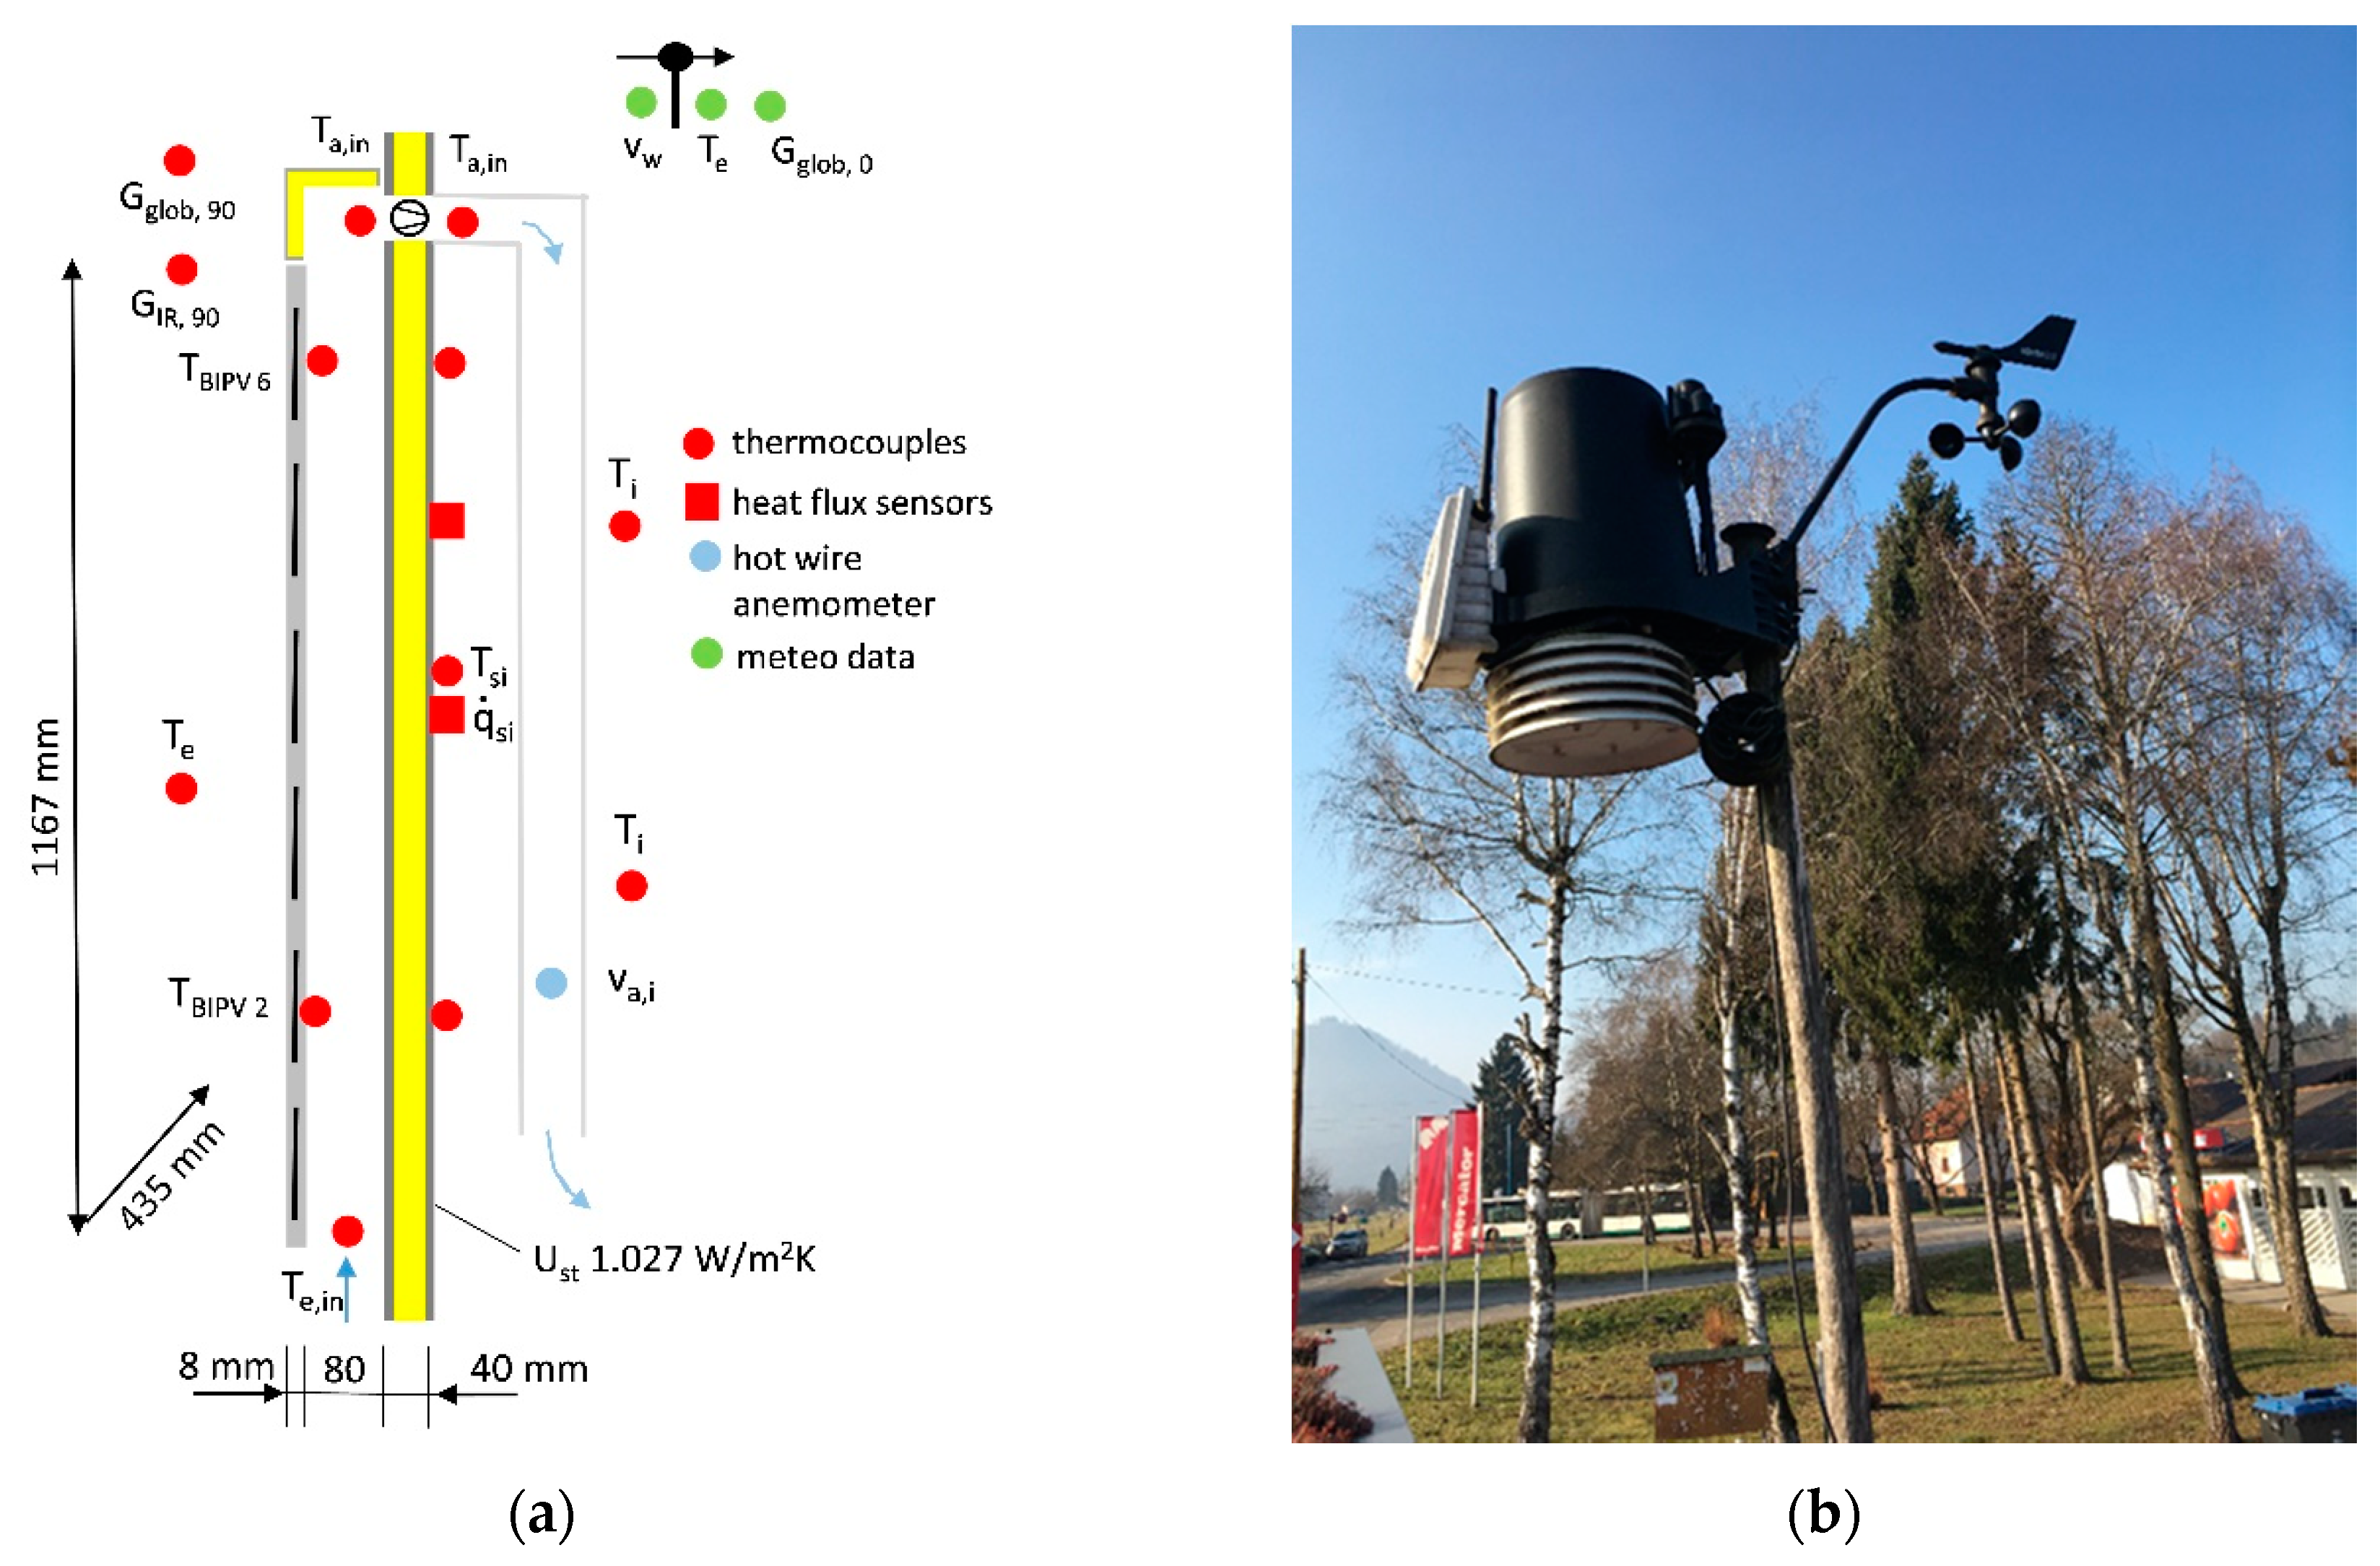
2.2. Experiment Setup

The pilot BIPV glazed façade structure was installed on the south oriented façade wall of laboratory building (Figure 1). The indoor environment was heated and cooled with a split air–air heat pump. An appliance built-in control unit was used to control indoor air temperature and because large solar gains were caused by other glazed structures, the laboratory building was often chilled at noon. This resulted in indoor air temperature periodical oscillations, but we want to point out that at least Class II [22] of thermal comfort was achieved during the experiment. BIPV and the laboratory building were equipped with sensors shown in Figure 2. Global solar radiation on the vertical surface was measured with a Kipp & Zonen CMP3 pyranometer (measurement uncertainty ± 5%) [23]. Downward atmospheric long-wave radiation was measured with a Kipp & Zonen CG1 pyrgeometer (measurement uncertainty ± 4%). Other meteorological parameters were measured using a Vantage Pro 2 weather station: ambient air temperature (± 0.5 °C) and wind velocity (± 5%) [24]. The weather station was installed on the roof of the laboratory test building (Figure 2b). Temperatures of air (indoor and in the ventilated air gap) and surface temperatures (BIPV and façade wall) were measured with calibrated K-type thermocouples (± 0.25 °C). Heat flux at the interior surface of the composite façade wall was measured with an AHLBORN FQ A018 C sensor (± 8%) [25]. Air velocity in the middle of the round tube was measured with an Almemo thermoanemometer FV A645 TH3 (± 3%). All measured data was monitored in one-minute intervals, using a data acquisition units Agilent 34970A [26] and AHLBORN Almemo 2290-4, the latter only for the thermoanemometer.

2.3. Research Methods

The energy efficiency of functionality mode, as well as total energy efficiency of solar energy utilization, were determined on the basis of an in situ experiment. The efficiency of PV was determined on the basis of measured transmittance of solar irradiation and temperature of the inner surface of BIPV glazing TPV,si. The in situ experiment was performed between 25 December 2019 and 15 April 2020. Measured data were gathered in 1-minute intervals (Δtmeas). The solar irradiation Gglob,90 and outdoor air temperature Te during the experiment are shown in Figure 3. The range of meteorological parameters appearing during the experiments are shown in Table 1.
Energy efficiency indicators were developed as diurnal values by summarizing and averaging the measured data. Although most indicators involve diurnal average values, some of them are developed using shorter time intervals. For example, the efficiency of electricity production indicators involve average meteorological data for the day-time period when Gglob,90 > 0 W/m2 or the efficiency indicators related to preheating of the ventilation air were developed taking into account the occupancy period in office buildings (8:00 to 17:00).
In the second evaluation step, statistical methods were used to define the influential parameters for each of the energy efficiency indicators.
In the final evaluation step, influential parameters were involved as independent variables in the statistical evaluation of multi-parametric approximation models developed for each of energy efficiency indicators. These approximation models can be integrated into models for determining the energy performance of buildings on the basis of daily energy balance and can be used for climate conditions at least in the range of values of meteorological parameters as listed in Table 1.

3. Energy Efficiency Indicators

Although experimental data was gathered in one-minute intervals, the energy efficiency of solar energy utilization with the pilot BIPV glazed façade structure, and the indicators of each operation mode of the BIPV façade structure are presented as daily average or integral values. As such, indicators can be implemented in a monthly calculation procedure, which is still commonly used in engineering practice, and can be used for assessment of nZEB as well [27]. The indicators are schematically presented in Figure 4. In addition to those solar energy utilization indicators for which the approximation models were developed, some other are shown to emphasize the advantages of the pilot BIPV glazed façade structure.

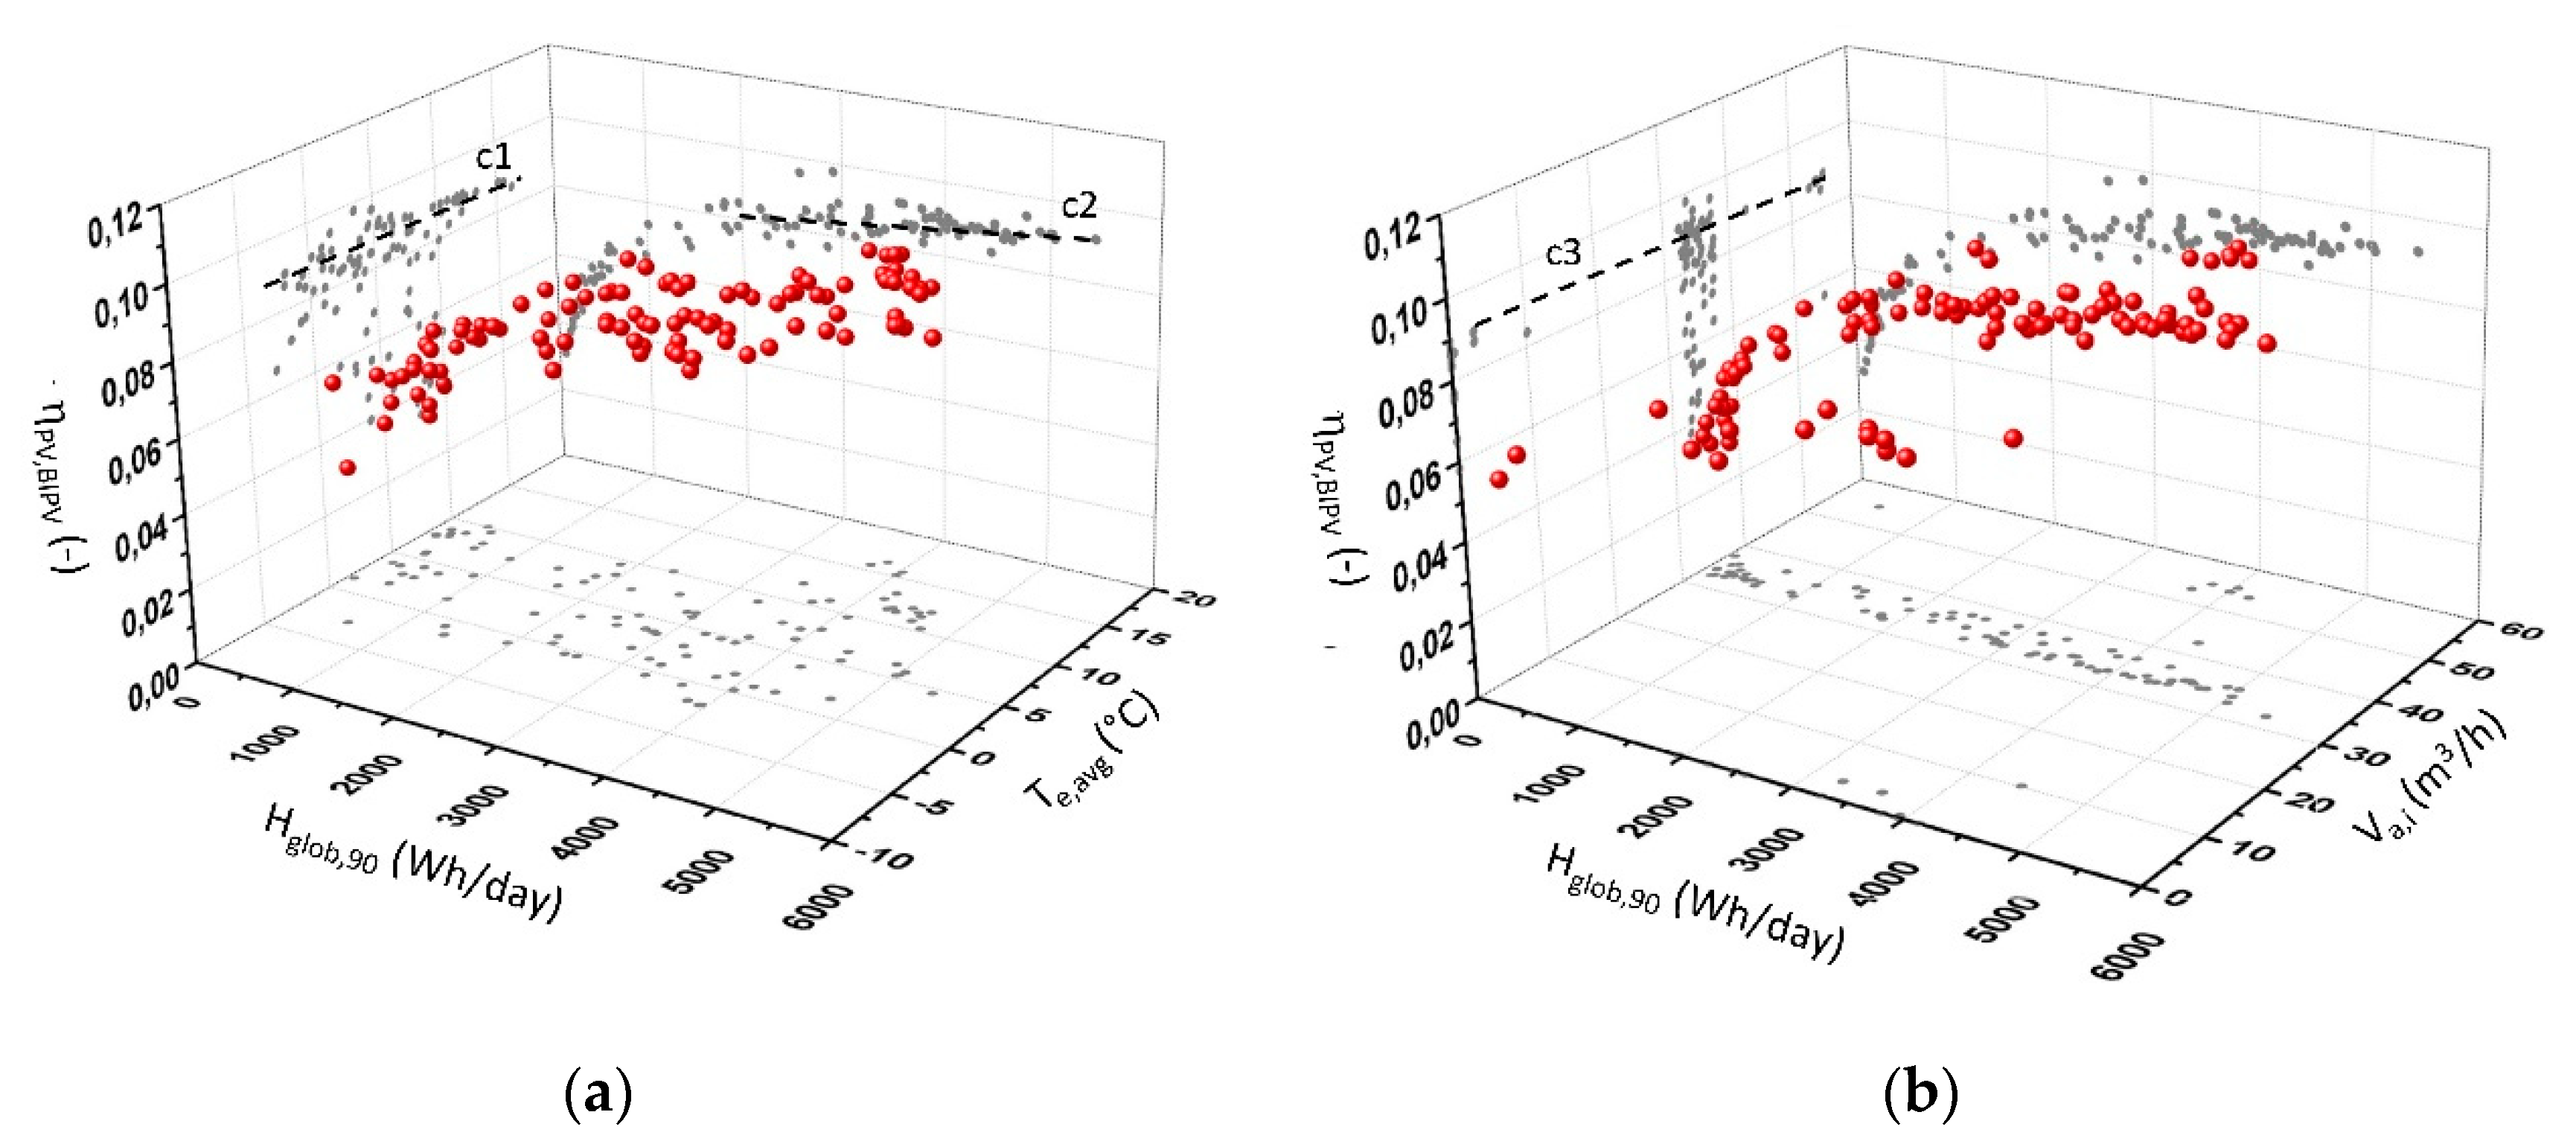
3.1. Electricity Production

The amount of diurnal produced electricity was determined by analytical model considering the measured values of influenced parameters in each time step of observation Δtmeas. Daily amount of produced electricity is determined by equation:
E P V = 1 60 t s r t s s A P V n P V K T K G G g l o b , β Δ t m e a s   ( Wh day ) ,
where tsr‘ and tss‘ are sunrise and sunset time relative to the BIPV structure, respectively, indicating the time frame when PV cells produce electricity. KT is the efficiency factor that corresponds to corrected PV cell efficiency and includes temperature coefficient β, which depends on PV cell technology. Value −0.46%/K was assumed for m-Si cells [28,29,30]. APV and nPV are the area of an individual PV cell (0.156 × 0.156 m) and the number of PV cells in the BIPV [15,19]. Because BIPV has relatively thick glass layers (4 + EPA + 4 mm, λ 0.76 W/mK), the PV cell temperature TPV was modelled by combining the heat transfer model and measurements of surface temperature on the outer and inner glass. The surface glass temperatures were measured behind the 2nd row and 6th row of the PV cell (TBIPV,2, TBIPV,6). It was found that in the case of ventilated air gap, there was not a significant difference between both temperatures, and an average value was used as the representative surface glass temperature. According to the CFD computer simulations, the combined surface heat transfer coefficient hr+c,e 15 W/m2K and hr+c,i 6 W/m2K were assumed and PV cell temperature TPV is approximated in the following way:
K T = η r e f ( 1 + β ( ( T P V , s i + 0.0064 + 0.0013 G g l o b , β T P V ) 25 ) ) ( ) ,
where TPV,si is temperature of the BIPV surface behind the PV cell towards the air gap. The reference efficiency ηref was taken from producer data [19] and is equal to 0.185. Solar irradiation correction factor KG considers the decrease of PV cell efficiency at low level of solar irradiation [15]:
K g = 1   if   G g l o b , 90 200 W m 2   and   0.029 ln ( G g l o b , 90 ) 0.0037 η r e f   if   G g l o b , 90 < 200 W m 2 .
To investigate the impact of ventilation of the air gap on PV cell overheating, diurnal overheating hours OHH was introduced. OHH is defined as diurnal sum of the difference between modeled PV cell temperature and PV cell reference temperature 25 °C:
O H H = 1 60 t s r t s s δ ( T P V 25 ) Δ t m e a s δ = 1   if   ( T P V 25 ) > 0   otherwise   δ = 0 ( Kh day ) .
As an example, Figure 5 shows measured data for two selected days—the clear sky and overcast cloudy day, and diurnal variables involved in energy efficiency modeling—daily solar radiation received by BIPV Hglob,90, average daily outdoor air temperature during PV cell operation Te,avg,PV, average wind velocity during PV cell operation time vW,avg,PV (m/s), and V ˙ a , i n ventilation air flow rate.
In the case presented in Figure 5a, BIPV was not ventilated, while in the case shown in Figure 5b BIPV was ventilated with air flow rate V ˙ a , i n . Concerning the surface glass temperature behind the PV cells (TBIPV,2 and TBIPV,6), it can be seen that temperatures differ only in the case of non-ventilated (closed) air gap (mark c) as consequence of buoyancy driven convection—by solar irradiation during day-time and by heat flux due heat losses during the night-time. This causes counter flow pattern during the night-time and higher TBIPV,6 when compared to TBIPV,1.

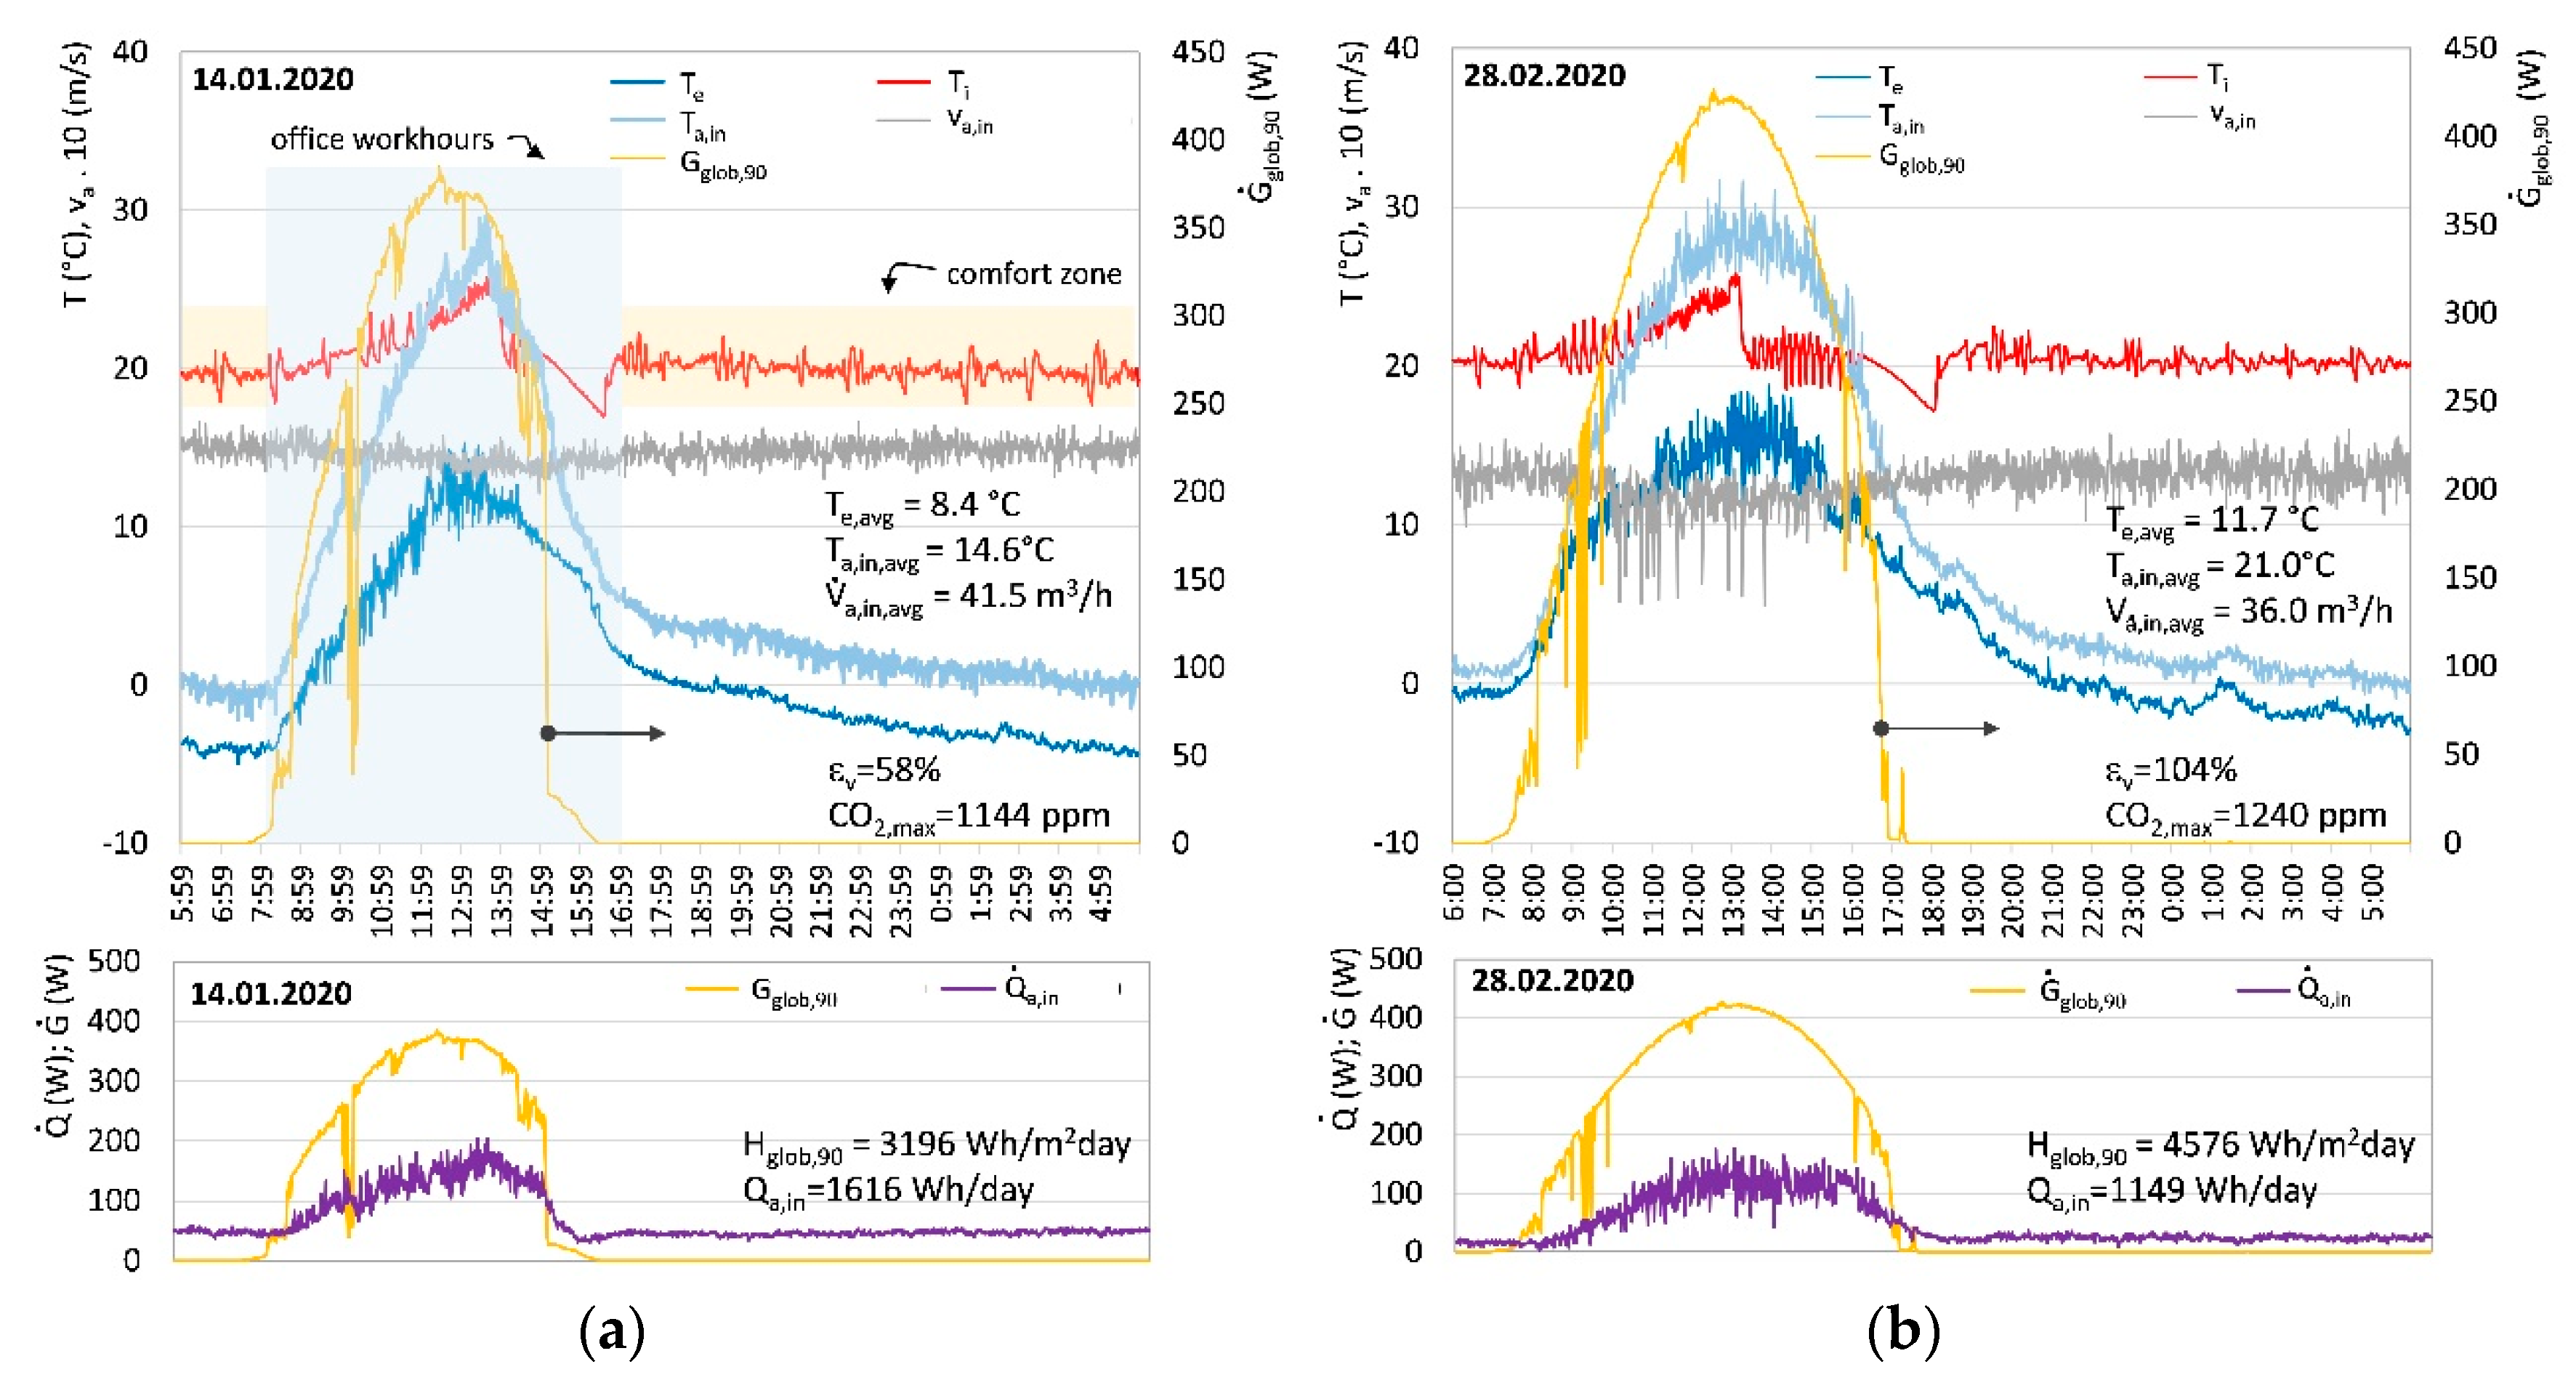
3.2. Preheating of Ventilation Air

The air gap formed by BIPV was force ventilated by outdoor air. Two by two temperature sensors were installed at the outlet openings, on both sides of fans. It was found that an increase of the air temperature caused by fans can be neglected. Data on air velocity in the center of the supply pipe, gathered by a hot-wire anemometer, was used to determine volumetric air flow using a continuity equation. Because air flow is turbulent even in case of lowest flow rate set, the volume (and mass) air flow rate was determined by averaging velocity using the Blasius formula and continuity equation. Daily heat transferred into the building by preheated air was determined by the sum of one-minute experimental data over the 24-hour period starting each day at 6:00 in the morning:
Q a , i n = 1 60 6 : 00 + 6 : 00 1 3600 ρ a c p , a V ˙ a , i n ( T a , i n T e ) Δ t m e a s ( Wh day ) ,
where ρa is air density, cp,a specific heat capacity of air, V ˙ a , i n is volume air flow rate, Ta,in is supply air temperature, and Te is outdoor temperature. Preheating efficiency of ventilation air, value that can be compared to the heat recovery efficiency in case of mechanical ventilation with recovery unit, is defined by averaging supply air, outdoor air, and indoor air temperatures over the occupied office hours (8:00–17:00), assuming constant ventilation air flow rate during observation period:
ε v = ( T a , i n , a v g T e , a v g T i , a v g T e , a v g ) 8 : 00 17 : 00 100 ( % ) .
Preheating efficiency εv can be above 100% if Ta,in,avg > Ti,avg, and Te,avg < Ti,avg. Figure 6 shows an example of experimental data for the selected days. The average air inlet temperature during work-hours Ta,in,avg, the integrated solar radiation Hglob,90 received by the BIPV, and heat transferred by air into the building Q ˙ a , i n are shown as well. Because average supply air temperature Ta,in,avg in Figure 6b is above average indoor air temperature Ti,avg while average outdoor temperature Te,avg is below Ti,avg, the air preheating efficiency is above 100%.

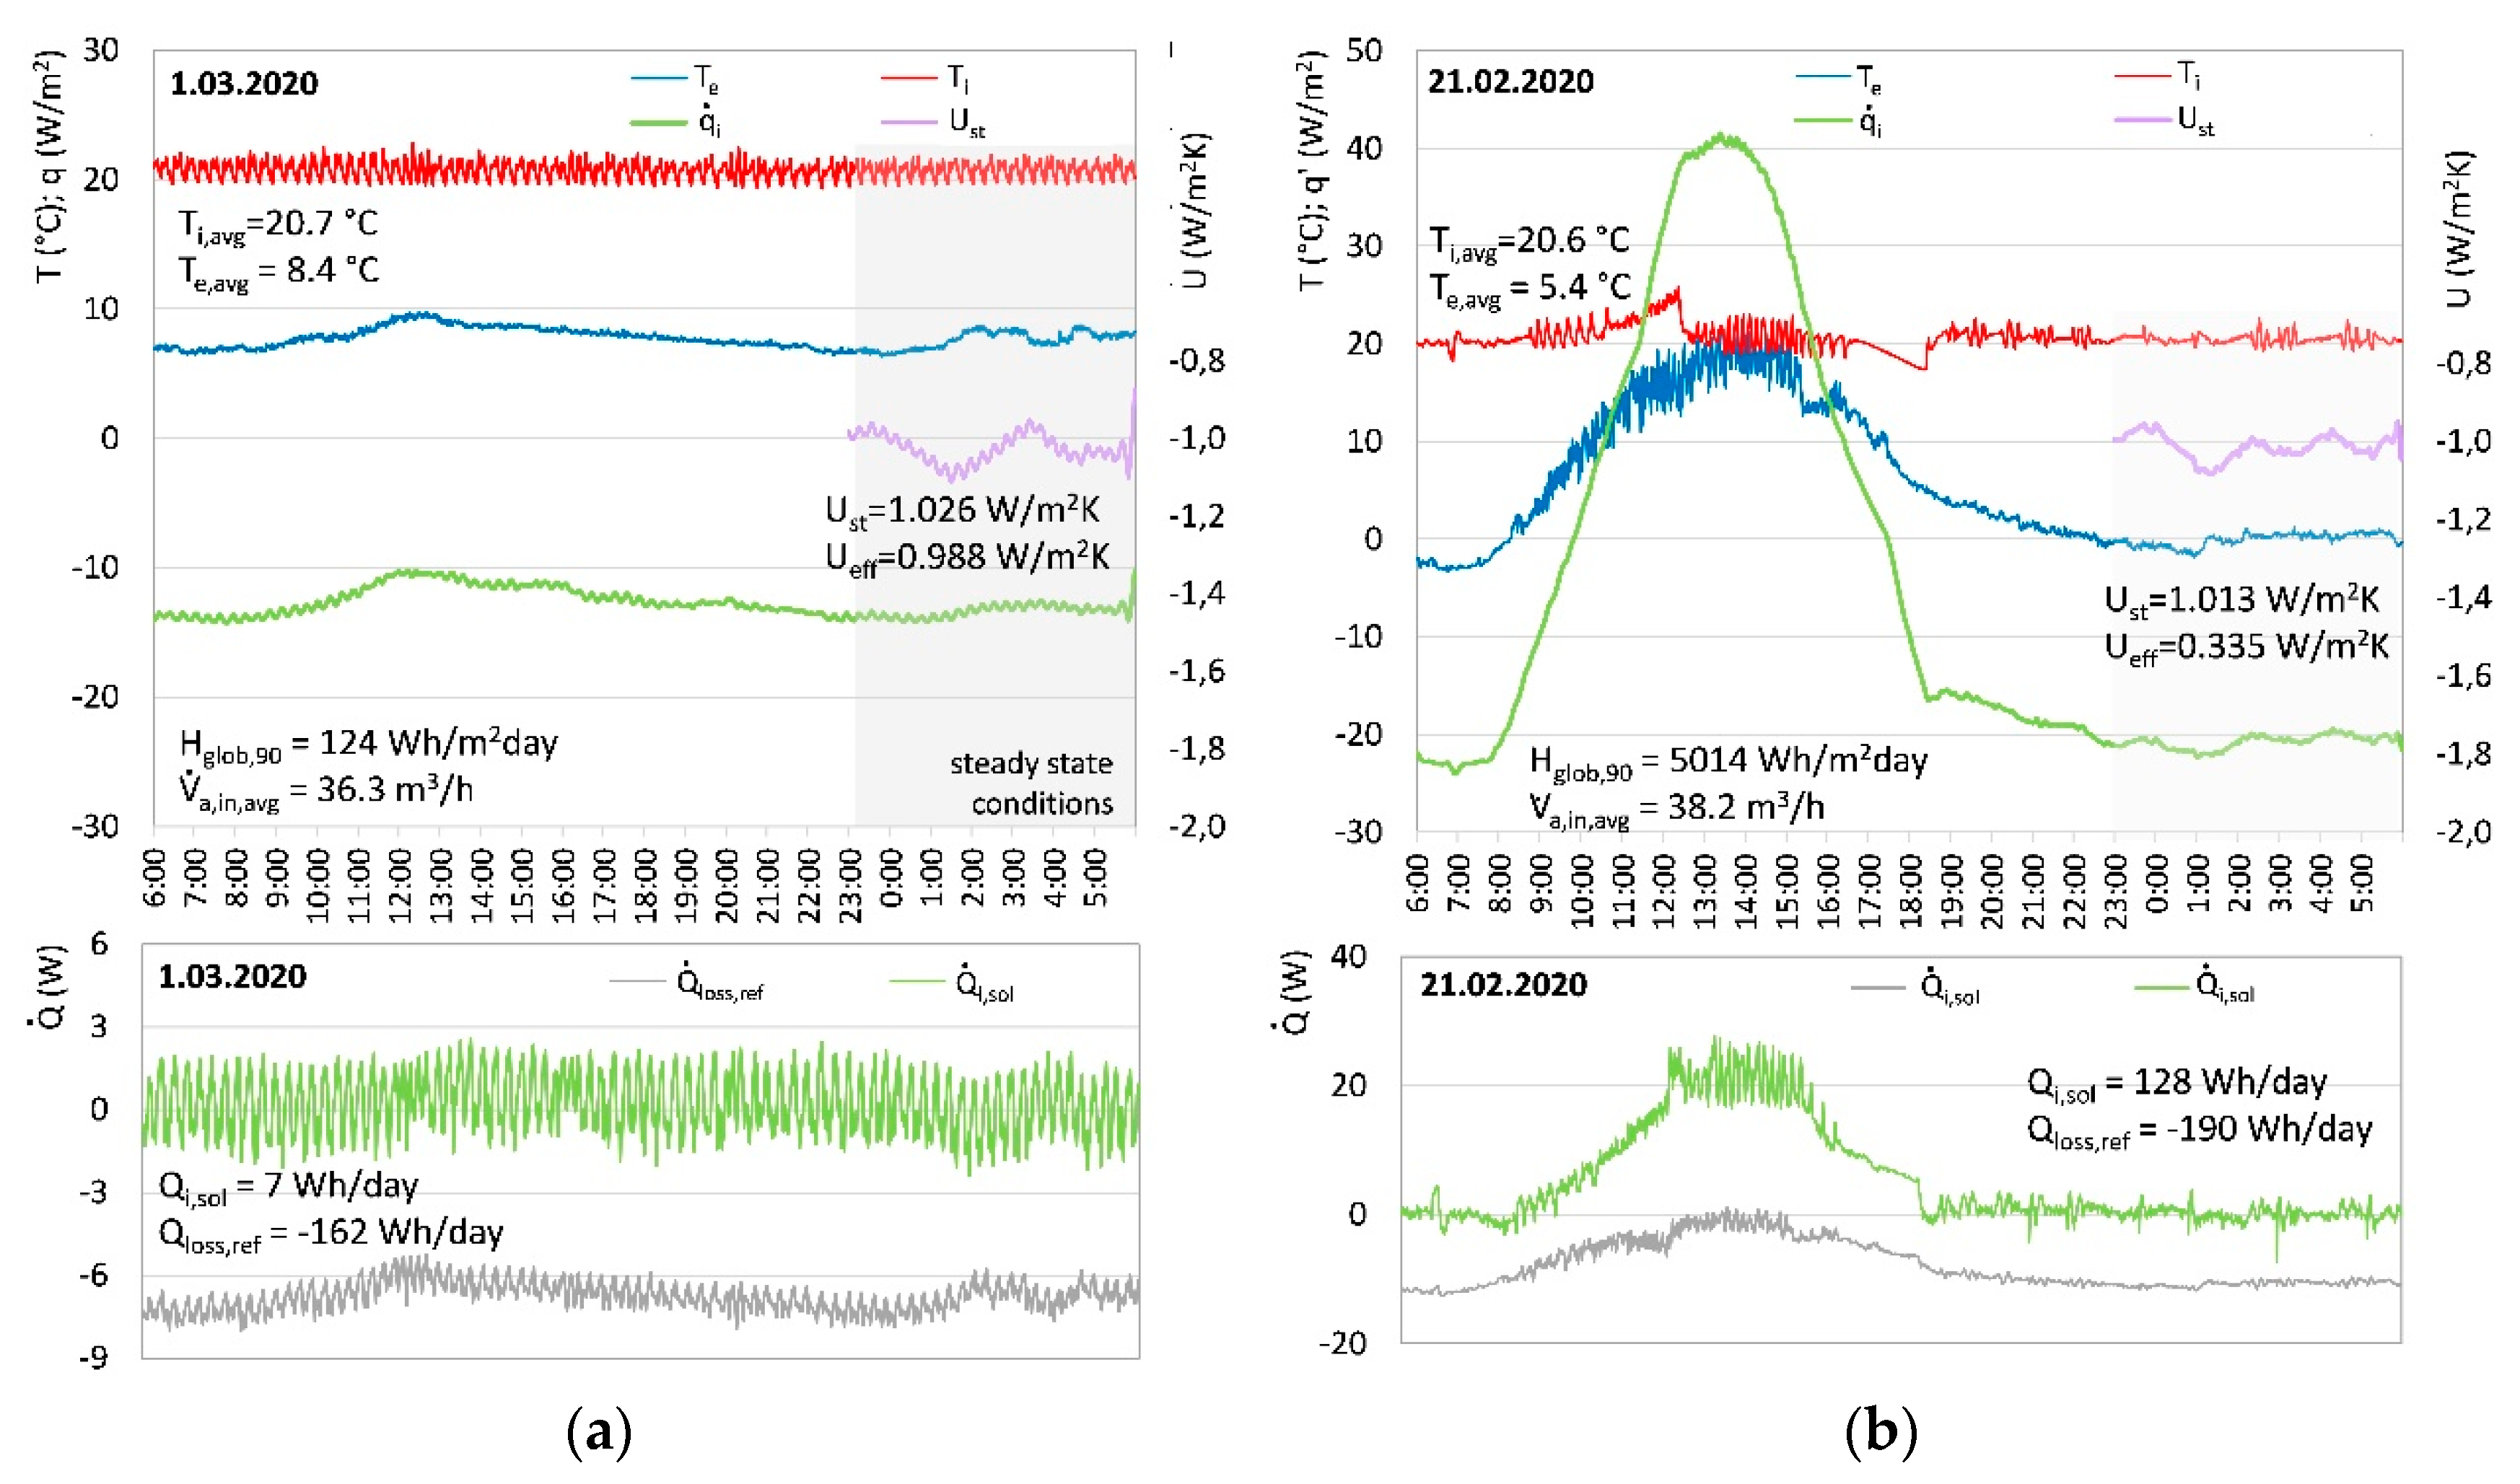
3.3. Dynamic Thermal Insulation

Because building envelope structure is ventilated and air is supplied to the indoor space, part of the heat losses can be recovered and the BIPV structure acts as dynamic thermal insulation. Efficiency of heat loss recovery is determined by comparing daily actual heat losses to theoretical ones at steady state conditions, taking into account reference thermal transmittance of the composite façade wall, which was upgraded with the BIPV structure—Ust 1.027 W/m2K (Figure 1). Transmission heat losses of the BIPV structure were evaluated by static thermal transmittance Ust, while effective thermal transmittance Ueff was evaluated based on the transient thermal response of the BIPV structure. Ust was determined by instant indoor Ti and outdoor Te air temperatures and heat flux was measured on the internal surface of the structure q ˙ s i using measured values for the period between 23:00 and 6:00+ o’clock in each day, to minimize the impact of accumulated solar energy. At that period, the heat transfer was close to the steady state, because the temperature difference (Ti − Te) was almost constant. With the Ust value, the impact of the double skin façade, as well as the forced ventilation of the air gap, was evaluated and compared to that of the Ust of the reference building envelope structure (Figure 2a). The dynamic thermal transmittance Ueff was defined in the similar way, the only difference was in the evaluation period, which was in this case all day long (6:00 to 6:00+1 day). The following equations were used:
U s t = 1 7 1 60 23 : 00 + 6 : 00 q ˙ s i ( T i T e ) Δ t m e a s ( W m 2 K ) ,
U e f f = 1 24 1 60 6 : 00 + 6 : 00 q ˙ s i ( T i T e ) Δ t m e a s ( W m 2 K ) .
The impact of unsteady parameters (Hglob,90, Te, and vW ), as well as impact of ventilation air flow rate V ˙ a , i n , are considered by the effective thermal transmittance Ueff. Examples of evaluation are shown in Figure 7.

3.4. Overall Efficiency of Solar Energy Utilization

Overall efficiency of solar energy utilization by the pilot BIPV glazed façade structure includes energy gains related to production of electricity, preheating of ventilation air, and decreased transmission heat losses due to the dynamic thermal insulation. In fact, the latter is not achieved solely by utilization of solar energy but also due to lower thermal transmittance of the BIPV structure, nevertheless all indicators are normalized to diurnal received solar radiation Hglob,90. The overall efficiency is defined by the sum of partial efficiencies in the following way:
η s o l . B I P V = η P V , B I P V + η a , B I P V + η i , s o l , B I P V = ( E P V + Q a , i + | ( Q l o s s , r e f Q l o s s , i ) | H g l o b , 90 A B I P V ) ( ) ,
where:
η P V , B I P V = E P V H g l o b , 90 A B I P V = η P V ( A P V n P V 0 , 6   A BIPV A B I P V ) = K T K G ( A P V n P V 0 , 6   A BIPV A B I P V ) ( ) ,
η a , B I P V = Q a , i n H g l o b , 90 A B I P V = 0.34 1 60 8 : 00 17 : 00 V ˙ a , i n ( T a , i n T e ) Δ t m e a s H g l o b , 90 A B I P V ( ) ,
η i , s o l , B I P V = | ( U s t , r e f 1 , 027 W / m 2 K ( T i , a v g T e , a v g ) 24 ( 1 60 6 : 00 + 6 : 00 q ˙ s i Δ t m e a s ) ) A B I P V | H g l o b , 90 A B I P V ( ) .
The constant 0.34 replaces the product of air density and specific heat capacity. Figure 8 shows an example of overall efficiency of solar energy utilization ηsol,BIPV determined by measured data in two days during the experiment period.

4. Results and Discussion

4.1. Parametric Study

The impact of daily solar radiation, average daily outdoor air temperature, and ventilation air flow rate on the static thermal transmittance Ust was analyzed and shown in Figure 9a. The Ust was determined from measured data, gathered between 23:00 and 6:00 the next morning. It can be concluded that the Ust is practically independent of daily solar radiation Hglob,90 (c2), and values in the middle of the air flow rate range are ~ 0.04 W/m2K lower when compared to that of the reference composite façade wall (c1) due to the increased thermal resistances of the BIPV and air gap. No significant impact of mid-range daily average outdoor air temperatures Te,av can be seen either. This result corresponds to the fact that composite wall is light-weight with limited potential for storing the (solar) heat. This also confirms that the thermal response through the previous day does not affect the heat response of the BIPV the next day, leading to the conclusion that energy efficient indicators can be determined by averaging data over the proposed time period (6:00 to 6:00+). The impact of the air flow rate Va,i can be noticed only when the air gap was not ventilated (Ust is lowered to the range between 0.80 to 0.85 W/m2K) and at its highest air flow rate, at which Ust increases to 10 W/m2K (c3). Some additional data would increase the credibility of this finding.
The dynamic thermal transmittance Ueff shows a significantly greater dependence on the influencing parameters (Figure 10). In theory, at low daily solar radiation (Hglob,90 < 300 Wh/day) dynamic thermal transmittance approaches static one (c1) regardless of the outdoor air temperature. At higher daily solar radiation Ueff decrease linearly (c4), while it increases with the decreasing of the outdoor air temperature Te,avg (c2). The dynamic thermal transmittance Ueff of BIPV is 0.2 W/m2K or lower if daily average outdoor temperature is above ~ 9 °C and the solar radiation is above 4000 Wh/day, and when the outdoor temperature Te,avg is above ~ 5 °C, the daily solar radiation Hglob,90 will be not less than 2500 Wh/day, if BIPV is not ventilated (c3). The slope of Ueff decrease is higher in case of non-ventilated BIPV (c5) when compared to the slope of Ueff decrease in the case of ventilated BIPV (c4). The decrease of the Ueff with increased ventilation air flow rate Va,i is more evident at higher air flow rates (C6), while it is not seen at daily solar radiation below 2000 Wh/day. Negative Ueff were observed at the highest air flow rates. The wind velocity vw at the experiment location was so low (Table 1) during the whole period of experiment that it cannot be treated as impact parameter.
The average daily efficiency of electricity production is shown in Figure 11. One must note that values are defined for the BIPV façade structure as whole, while PV cells only cover 60% of BIPV structure. The daily efficiency ηPV,BIPV increases slightly (c2) with daily solar radiation Hglob,90 above 2500 Wh/day, while at such conditions efficiency is almost temperature independent (c1). The reason can be in the design of glazed BIPV, which contains two relatively thick glass panes (2 × 4 mm). By measurement it was determined that absorptivity of the transparent area of BIPV is ~ 19.5%. It was also discovered that an increase of the ventilation air flow rate Va,i causes only minor increase of efficiency because of the PV cells cooling (c3). It can be that at higher air flow rate the fully developed flow occurs at a larger distance from the inlet opening. Nevertheless, as mentioned before, the difference between PV cell temperatures (meaning as measured—the temperature of the inner glass of the BIPV behind the PV cell) in the 2nd and 6th rows only differ for < 1–1.5 °C during clear sky conditions at air flow rates above 15 m3/h, while temperature differences up to 5.5°C were noticed in similar weather conditions in case of buoyancy convection in closed air gap. This finding indicates that additional research will be useful in the future. In this case as well, we found no evidence of impact of the wind velocity vw on the PV cell efficiency as well.
If supply air is predominantly preheated by heat losses through composite façade wall (c1 in Figure 12), the efficiency of solar energy utilization ηa,BIPV for preheating of the supply air for space ventilation may rise over the value of one. In practice, this is the case in days with low daily solar radiation Hglob,90 (threshold is at ~500 Wh/day). Such cases appear at daily average outdoor air temperatures Te,avg below 8 °C (c2). Where daily solar radiation Hglob,90 is above that threshold value, the ηa,BIPV is in the range 0.50 to 0.75 showing a slightly negative trend due to the increased heat losses of the BIPV glazed façade structure (c3). Consequently, at daily solar radiation above 4000 Wh/day, it will be slightly below the 0.5. This means that the decrease of ventilation heat losses is comparable to the mechanical ventilation with heat recovery. Results also show a slight increase of efficiency with the ventilation air flow rate V ˙ a , i n (c4), while no significant impact of the wind velocity vw on the ηa,BIPV can be found from experimental results.
Solar radiation that passed through glazed BIPV façade structure was absorbed on the opaque composite façade wall. Consequently, heat loss decreased or even turned into the heat gain. If solar heat gains exceed steady-state heat loss on the daily basis, the value of ηi,sol,BIPV will be greater than zero. The heat gains are defined by the product of the ηi,sol,BIPV and daily solar radiation Hglob,90. Figure 13 shows how ηi,sol,BIPV depends on influence parameters: daily solar radiation Hglob,90, daily average outdoor temperature Te,avg, and ventilation air volume flow rate Va,i. One must note, that only 40% of the total BIPV structure is transparent. The ηi,sol,BIPV slightly rises with daily solar radiation if Hglob,90 is larger than 500 Wh/day, where it will be in the range between 0.06 and 0.08 (c1). In case of non-ventilated BIPV, it is significantly higher (c2)—between 0.10 and 0.12. The efficiency rise varies slightly with the outdoor air temperature Te,avg as well (c3). At lower solar radiation, the ηi,sol,BIPV rises up to 0.30. Obviously, at such low solar energy potential, increased thermal resistance of the BIPV structure contributes more significantly to decreased heat losses than solar radiation itself. Ventilation air flow rate has a negative and quite small impact on the ηi,sol,BIPV, but it must be considered in a multi-parametric regression model. A small negative impact of wind velocity vw was also noticed. Furthermore, it was noticed that heat flux that enters the building has a small-time delay because of the low thermal capacity of the composite façade wall (Figure 6b).

4.2. Multi-Parametric Model of Overall Efficiency of Solar Energy Utilization

In the previous section it was shown which variables have the greatest impact on the overall efficiency of solar energy utilization of the BIPV façade structure. To be able to predict energy efficiency of such structure in different climate conditions based on the diurnal data, multiple linear regression models were developed for each component of overall efficiency of solar energy utilization—ηPV,BIPV, ηa,BIPV, and ηi,sol,BIPV. Statistical regression analysis was made within MS Excel using built-in LINEST function, which fits the data using the least squares method. The level of significance for the regression coefficients of each predictor (independent variable) were tested using Student’s t-tests with built-in T.DIST.2T function. Only terms with p-value < 0.05 were used in the final multiple linear regression models. Developed models are of the form:
η P V , B I P V = 0.01207 ln ( H g l o b , 90 ) 0.000414 ( T P V , r e f 25 ° C T e , a v g ) 0.000147 V ˙ a , i , a v g ,
η a , B I P V = 340.775 H g l o b , 90 0.0783 T e , a v g + 0.02807 V ˙ a , i , a v g ,
η i , s o l , B I P V = 7.867 H g l o b , 90 + 0.00152 ( T i T e , a v g ) + 0.0078 ln ( V ˙ a , i , a v g ) 0.0072 v w , a v g ,
where all independent variables are daily integrals or average values. The accuracy of the developed multiple linear regression models of solar energy utilization efficiencies was tested with widely used indices [31,32]: the adjusted coefficient of determination R2adj, the normalized mean bias error (NMBE) and the coefficient of variation of the root-mean-square error CV(RMSE) which are defined by the following equations:
R 2 a d j = 1 n 1 n ( p + 1 ) ( 1 R 2 ) ,
N M B E = 1 M ¯ i = 1 n ( M i P i ) n p 100 ,
C V ( R M S E ) = 1 M ¯ i = 1 n ( M i P i ) 2 n p 100 2 .
Detailed explanation as well as calibration criteria of ASHRAE and other agencies can be found in [31]. Figure 14 presents the comparison of individual efficiencies of overall efficiency of solar energy utilization obtained from measured values and determined with developed multiple linear regression models (Equations (15)–(17)). The statistical parameters are also shown on the figures.
It can be seen that R2adj exceeds the recommended value of 0.75 for all three regression models. Also, NMBE is within ± 5%, which is the calibration criteria in the case of monthly calculation methods. Only CV(RMSE), which should be below 15%, is slightly higher in the case of ηa,BIPV, which is probably is the consequence of the narrow range of ventilation air flow rates. Nevertheless, we can conclude that the developed multi-parametric regression models are adequate and can be used to evaluate the energy efficiency performance of the analyzed BIPV façade structure within the ranges of meteorological conditions that appeared during the experiments. It should be noted that the conditions during the experiment were quite typical for a moderate and continental climate.

5. Conclusions

In this paper research on energy efficiency of the glazed BIPV façade structure with forced ventilated air gap is presented. Today, BIPV is considered to be one of the most important technologies by which, especially in the urban environment, the standards for the nearly or even zero energy buildings can be achieved. The studied BIPV element is designed as a modular unit that can be used in new, and with even greater advantages, in renovated buildings. The energy efficiency indicators were defined for each of the solar energy utilization modes—electricity production, energy savings due to decreased transmission heat losses and due to decreasing ventilation heat losses by preheating air for space ventilation. Results based on all-winter season experimental results had shown that up to 10% of daily solar radiation could be utilized for electricity and heat supply while preheating of the air utilizes up to 75% of daily received solar radiation. In the case of no clear sky conditions (low daily solar radiation) the efficiency of heat utilization increases further due to the dynamic thermal insulation effect. This are general figures. For day-to-day analyses in different climate conditions, the multi-parametric regression models were developed.
In follow-up research the impact of orientation of the BIPV façade structure with forced ventilated air gap will be studied and multi-parametric models developed, which will consider the thermal transmittance of the opaque envelope wall as an independent variable. The study of the impact of the other techniques for decreasing the PV cell temperature, like phase change materials, will also be interesting.

Author Contributions

Conceptualization, S.M., C.A., and S.D.; methodology, S.M.; validation, S.D., C.A., and L.P.; writing—original draft preparation, S.D. and C.A.; writing—review and editing, S.M. All authors have read and agreed to the published version of the manuscript.

Funding

The authors acknowledge the financial support from the Slovenian Research Agency (research core funding No. P2-0223 (C)).

Conflicts of Interest

The authors declare no conflict of interest.

Nomenclature

Am2area
α(-)absorptivity
β(-)temperature coefficient
Cmg/m3, ppmpollutant concentration
cp(J/kgK)specific heat capacity
dmthickness
Δτmeasminmeasuring interval
E ˙ Welectrical power
EWh/daydiurnal production of electricity
ε(-)emissivity
G ˙ Wsolar irradiation power
GW/m2solar irradiation
hW/m2Ksurface heat transfer coefficient
HWh/m2daydiurnal solar radiation
k1/daypollutant decay factor
η(%)efficiency
KG(-)solar irradiation factor
KT(-)temperature factor
λW/mKthermal conductivity
M(-)measured value
n(-)number of
OHH(Kh/day)diurnal overheating hours
P(-)Predicted value
q ˙ (W/m2)density of heat flux
Q ˙ (W)heat power
Q(Wh/day)diurnal delivered heat
ρ(kg/m3)density
Smg/minsource of pollutant
T°Ctemperature
UW/m2Kthermal transmittance
vm/svelocity
Vm3volume
V ˙ m3/hflow rate
7, 24h/dayconstants
60min/hconstant
Index
a air
avg; avg,day average, diurnal average
avg, PV diurnal average during PV electricity production
BIPV pilot building integrated PV glazed façade structure
e outdoor, external
eff effective, dynamic
g glass
glob,90 solar on vertical surface
glob,90,day solar on vertical surface diurnal
i indoor, internal
in inlet
IR infrared, long wavelength
IR,90,day infra-red on vertical surface diurnal
loss heat loss
max maximum, maximum at the end of working hours
n net
PV photovoltaic
PV,si on inner glass surface of BIPV structure
r+c combined radiative and convection
ref reference, reference structure
s solar, short wavelength
si internal surface
sol generated by solar energy
st static
v ventilation
w wind
2, 6 second row, sixth row of PV

References

  1. Sombsthay, A.; Beauvais, A.; Moser, D.; Tecnalia, E.B.; Gaymard, G.; Delmer, G.; Gurdenli, L.; Machado, M.; Po, R.; Krawietz, S.; et al. Solar Skins: An Opportunity for Green Cities; SolarPower Europe and ETIP PV: Brussels, Belgium, 2019. [Google Scholar]
  2. Farghaly, Y.; Hassan, F. A Simulated Study of Building Integrated Photovoltaics (BIPV) as an Approach for Energy Retrofit in Buildings. Energies 2019, 12, 3946. [Google Scholar] [CrossRef] [Green Version]
  3. Ramirez-Balas, C.; Fernandez-Nieto, E.; Narbona-Reina, G.; Sendra, J.J.; Suarez, R. Thermal 3D CFD Simulation with Active Transparent Façade in Buildings. Energies 2018, 11, 2264. [Google Scholar] [CrossRef] [Green Version]
  4. Yang, X.; Zhou, J.; Yuan, Y. Energy Performance of an Encapsulated Phase Change Material PV/T System. Energies 2019, 12, 3929. [Google Scholar] [CrossRef] [Green Version]
  5. Good, C.; Andersen, I.; Hestnes, A.G. Solar Energy for net Zero Energy Buildings—A Comparison between Solar Thermal, PV and Photovoltaic–Thermal (PV/T) Systems. Solar Energy 2015, 122, 986–996. [Google Scholar] [CrossRef] [Green Version]
  6. Agathokleous, R.A.; Kalogirou, S.A. Double Skin Facades (DSF) and Building Integrated Photovoltaics (BIPV): A Review of Configurations and Heat Transfer Characteristics. Renew. Energy 2016, 89, 743–756. [Google Scholar] [CrossRef]
  7. Agrawal, B.; Tiware, G.N. Optimizing the Energy and Exergy of Building Integrated Photovoltaic Thermal (BIPVT) Systems under Cold Climatic Conditions. Appl. Energy 2010, 87, 417–426. [Google Scholar] [CrossRef]
  8. Saadon, S.; Gaillard, L.; Menezo, C.; Giroux-Julien, S. Exergy, Exergoeconomic and Enviroeconomic Analysis of a Building Integrated Semi-Transparent Photovoltaic/Thermal (BISTPV/T) by Natural Ventilation. Renew. Energy 2020, 150, 981–989. [Google Scholar] [CrossRef]
  9. Vats, K.; Tiwari, G.N. Performance Evaluation of a Building Integrated Semitransparent Photovoltaic Thermal System for Roof and Façade. Energy Build. 2012, 45, 211–218. [Google Scholar] [CrossRef]
  10. Peng, J.; Lu, L.; Yang, H.; Ma, T. Comparative Study of the Thermal and Power Performances of a Semi-Transparent Photovoltaic Façade under Different Ventilation Modes. Appl. Energy 2015, 138, 572–583. [Google Scholar] [CrossRef]
  11. Shahrestani, M.; Yao, R.; Essah, E.; Shao, L.; Oliveira, A.C.; Hepbasli, A.; Biyik, E.; del Caño, T.; Rico, E.; Lechón, J.L. Experimental and Numerical Studies to Assess the Energy Performance of Naturally Ventilated PV Façade Systems. Sol. Energy 2017, 147, 37–51. [Google Scholar] [CrossRef]
  12. Martín-Chivelet, N.; Gutiérrez, J.C.; Alonso-Abella, M.; Chenlo, F.; Cuenca, J. Building Retrofit with Photovoltaics: Construction and Performance of a BIPV Ventilated Façade. Energies 2018, 11, 1719. [Google Scholar] [CrossRef] [Green Version]
  13. Kosonen, R.; Tan, F. The Effect of Perceived Indoor air Quality on Productivity loss. Energy Build. 2004, 36, 981–986. [Google Scholar] [CrossRef]
  14. Mofidi, F.; Akbari, H. Integrated Optimization of Energy Costs and Occupants’ Productivity in Commercial Buildings. Energy Build. 2016, 129, 247–260. [Google Scholar] [CrossRef]
  15. Domjan, S.; Arkar, C.; Begelj, Ž.; Medved, S. Evolution of All-Glass Nearly Zero Energy Buildings with Respect to the Local Climate and Free-Cooling Techniques. Build. Environ. 2019, 160, 106183. [Google Scholar] [CrossRef]
  16. Kim, M.K.; Baldini, L. Energy Analysis of a Decentralized Ventilation System Compared with Centralized Ventilation Systems in European Climates: Based on Review of Analyses. Energy Build. 2016, 111, 424–433. [Google Scholar] [CrossRef]
  17. Imbabi, M.S.-E. A Passive–Active Dynamic Insulation System for All Climates. Int. J. Sustain. Built Environ. 2012, 1, 247–258. [Google Scholar] [CrossRef] [Green Version]
  18. Lai, C.-M.; Lin, Y.-P. Energy Saving Evaluation of the Ventilated BIPV Walls. Energies 2011, 4, 948–959. [Google Scholar] [CrossRef]
  19. Union Glass, S.r.i, Union Glass High-Technology Glass. Available online: http://unionglass.it/index.php (accessed on 15 January 2019).
  20. Emmerich, S.J.; Persily, A.K. State-of-the-Art Review of CO2 Demand Controlled Ventilation Technology and Application; NIST: Gaithersburg, MD, USA, 2001. [Google Scholar]
  21. Masters, G.M.; Ela, W.P. Introduction to Environmental Engineering and Science, International ed.; Prentice-Hall: Englewood Cliffs, NJ, USA, 1991. [Google Scholar]
  22. Energy Performance of Buildings—Ventilation of Buildings—Part 1: Indoor Environmental Input Parameters for Design and Assessment of Energy Performance of Buildings Addressing Indoor Air Quality, Thermal Environment, Light and Acustics; EN 16798-1:2019; CEN: Brussels, Belgium, 2019.
  23. Kipp & Zonen. Available online: www.kippzonen.com (accessed on 16 May 2020).
  24. Davis Instruments. Available online: www.davisinstruments.com (accessed on 16 May 2020).
  25. Ahlborn Mess—und Regelungstechnik GmbH. Available online: www.ahlborn.com (accessed on 16 May 2020).
  26. Agilent Technologies, Inc. Available online: www.agilent.com (accessed on 16 May 2020).
  27. The International Organization for Standardization. Energy Performance of Buildings—Energy Needs for Heating and Cooling, Internal Temperatures and Sensible and Latent Heat Loads—Part 1: Calculation Procedures; CEN: Brussels, Belgium, 2017. [Google Scholar]
  28. Singh, P.; Ravindra, N.M. Temperature Dependence of Solar Cell Performance—An Analysis. Sol. Energy Mater. Sol. Cells 2012, 101, 36–45. [Google Scholar] [CrossRef]
  29. Dash, P.K.; Gupta, N.C. Effect of Temperature on Power Output from Different Commercially available Photovoltaic Modules. Int. J. Eng. Res. Appl. 2015, 51, 148–151. [Google Scholar]
  30. Kamuyu, W.C.L.; Lim, J.R.; Won, C.S.; Ahn, H.K. Prediction Model of Photovoltaic Module Temperature for Power Performance of Floating PVs. Energies 2018, 11, 447. [Google Scholar] [CrossRef] [Green Version]
  31. Ruiz, G.R.; Bandera, C.F. Validation of Calibrated Energy Models: Common Errors. Energies 2017, 10, 1587. [Google Scholar] [CrossRef] [Green Version]
  32. Domjan, S.; Medved, S.; Černe, B.; Arkar, C. Fast Modelling of nZEB Metrics of Office Buildings Built with Advanced Glass and BIPV Facade Structures. Energies 2019, 12, 3194. [Google Scholar] [CrossRef] [Green Version]
Figure 1. Experimental semitransparent building integrated photovoltaics (BIPV) glazed façade structure (shown by the rectangle section). (a) The façade wall with two ventilation openings, each of them was enclosed by a fan; (b) BIPV glazed structure installed 80 mm in front of the façade wall, and (c) interior of experimental BIPV façade structure—air channels were thermal insulated during the experiment.
Energies 13 02772 g001
Figure 2. Position of sensors (a) and meteorological station Vantage Pro 2 (b).
Energies 13 02772 g002
Figure 3. Solar irradiation received by BIPV Gglob,90 and outdoor air temperature Te, which occurred during the experiment.
Energies 13 02772 g003
Figure 4. Scheme of indicators of the efficiency of solar energy utilization with the pilot semitransparent BIPV glazed façade structure; diurnal electricity production EPV; diurnal heat supplied with preheated air for space ventilation Qa,in; and heat gains through the opaque façade wall Qi,sol were the basis for developing approximation models of energy efficiency, while others, such as static Ust, dynamic thermal transmittance Ueff, and preheating efficiency εv, are used to emphases the advantage of the pilot semitransparent BIPV glazed façade structure.
Energies 13 02772 g004
Figure 5. Graphs showing instant ηPV and average diurnal PV cell efficiency ηPV,avg, instant electricity power E ˙ P V , and diurnal production of electricity EPV (a), PV cell temperatures (glass surface temperatures behind PV cell towards ventilated air gap) in the 2nd (TBIPV,2) and the 6th row (TBIPV,6) in BIPV, overheating hours (OHH) and selected meteorological data—solar irradiation Gglob,90, diurnal solar radiation Hglob,90, and instant and daily average outdoor air temperature (Te, Te,avg) (b).
Energies 13 02772 g005
Figure 6. Graphs showing outdoor and indoor air temperatures and the temperature of supplied preheated air (Te, Ti, and Ta,in); velocity, ventilation air volume flow rate, and heat flux by preheated air (va, V ˙ a , i n , and Q ˙ a , i n ); average ventilation air temperature during office occupant hours Ta,in,avg; air preheating efficiency (εv); as well as solar irradiation Gglob,90; and diurnal solar radiation Hglob,90; as well as diurnal heat transferred into the ventilated space by preheated air Qa,in; (a) for 14 January 2020 and (b) for 28 February 2020.
Energies 13 02772 g006
Figure 7. An example of measured values used for the evaluation of the energy efficiency of dynamic thermal insulation of the BIPV glazed façade structure. (a) In the case of heavy cloudy day (1 March 2020), because the air gap was ventilated, Ust was equal to reference thermal transmittance of composite façade structure (Uref 1.027 W/m2K) and Ueff was very close to the Ust; (b) even in the case of clear sky weather (21 February 2020), the Ust was very close to the reference value, while dynamic thermal transmittance was much lower, indicating a significant difference in diurnal transmission heat loss Qi,sol from the pilot BIPV glazed façade structure.
Energies 13 02772 g007
Figure 8. Overall efficiency of solar energy utilization ηBIPV of the pilot BIPV glazed façade structure (a) on 8th January 2020 and (b) on 20th February 2020; in the case (a) the ventilation air flow rate V ˙ a , i n was 3.5 m3/h, and consequently, the utilization of solar energy for preheating of the ventilation air decreased, while the temperature of the supply air Ta,in increased above indoor air temperature and efficiency εv was above 100%; the case (b) was the opposite because V ˙ a , i n was much higher and utilization of solar energy was higher, while preheating air efficiency εv was significantly lower.
Energies 13 02772 g008
Figure 9. Static thermal transmittance Ust of the glazed BIPV façade structure with a forced ventilated air gap; (a) impact of the daily solar radiation Hglob,90 received by the BIPV façade structure and average daily outdoor air Te,avg (equal to the temperature of the ventilation air at the inlet of the air gap); (b) impact of the solar radiation and ventilation air flow rate Va,i.
Energies 13 02772 g009
Figure 10. Dynamic thermal transmittance Ueff of the BIPV façade structure with a forced ventilated air gap; (a) impact of the daily solar radiation Hglob,90 received by the BIPV façade structure and average daily outdoor air Te,avg; (b) impact of the solar radiation and ventilation air flow rate Va,i.
Energies 13 02772 g010
Figure 11. Average daily efficiency of electricity production by glazed BIPV determined considering that surface area of PV cell in glazed BIPV is 60%; (a) impact of the daily solar radiation Hglob,90 and average daily outdoor air Te,avg; (b) impact of the solar radiation and ventilation air flow rate V ˙ a , i n .
Energies 13 02772 g011
Figure 12. Average daily efficiency of solar radiation utilization for preheating of the supply air for space ventilation; (a) impact of the daily solar radiation Hglob,90 and average daily outdoor air Te,avg; (b) impact of the solar radiation and ventilation air flow rate V ˙ a , i n .
Energies 13 02772 g012
Figure 13. Average daily solar heat gains through composite façade wall behind the glazed BIPV façade structure expressed by efficiency ηi,sol,BIPV; (a) impact of the daily solar radiation Hglob,90 and average daily outdoor air Te,avg; (b) impact of the solar radiation and ventilation air flow rate V ˙ a , i n .
Energies 13 02772 g013
Figure 14. Correlation of components of overall efficiency of solar energy utilization ηsol,BIPV determined by experimental results and multi-parametric regression models; statistical indicators are also shown for (a) ηPV,BIPV, (b) ηa,BIPV, and (c) ηi,sol;BIPV.
Energies 13 02772 g014
Table 1. Average and extreme values of meteorological variables during the duration of the experiment.
Meteorological VariableAverage
Exp. Period
Max
Daily av.
Min
Daily av.
MaxMin
Outdoor air temperature Te (°C)5.7516.3−2.825.6−8.7
Solar irradiation Gglob,90 (W/m2)11324h 84146
Solar radiation Hglob,90,day (Wh/m2day)2706 5410274
IR sky radiation HIR,90,day (Wh/m2day)7858 87916924
Wind velocity vw (m/s)0.491.840.035.60.0

