1. Introduction
There are currently many countries that are committed to taking measures to reduce the effects of climate change. These commitments have been reached in the different Conferences of the Parties (COP) that have been held. The Conference of the Parties is the decision-making body for the United Nations Framework Convention on Climate Change. Within these conferences, COP3 1997 in Kyoto, Japan, and COP 21 2015 in Paris, France, can be highlighted.
As indicated in [
1], there are three public support mechanisms for the development of renewable energy. These mechanisms are the Feed-in Tariff system, tax incentives, and renewable portfolio standard (RPS). The Feed-in Tariff system is a remuneration that includes a premium over the wholesale electricity market price, and at the same time there is a guarantee from the Administration that all the energy produced will be sold. Instead, the RPS system assumes an obligation in the production of renewable energy, i.e., the Administration requires from companies producing electricity that a certain proportion of their electricity is from renewable sources. For each megawatt hour (MWh) of electricity generated from renewable sources, the Administration provides companies with a green certificate negotiable in a secondary market. If the Administration wants to promote the development of a certain renewable energy technology, it delivers more than one green certificate for each MWh of electricity generated.
As indicated in [
2], the Feed-in Tariff system is appropriate to support renewable energy at an early stage of its development, while the RPS system is appropriate to support renewable energy in more mature and evolved markets.
The methodology presented in this work could be applied both to the Feed-in Tariff system, based on a fixed price remuneration that includes a premium, and to the PRS system, based on a fixed amount of energy subsidized by negotiable green certificates.
France has been obliged by the regulations of the European Union [
3] to ensure that 23% of the final energy demanded comes from renewable sources by 2020.
As indicated in [
4], France had an installed capacity of photovoltaic energy of 8.5 GW in 2018. The production of photovoltaic electrical energy was 10.2 TWh, which represents 2.1% of electricity consumption in the entire country.
In 2015, France passed a law [
5] to begin the transition that will allow for a reduction in the final consumption of nuclear energy throughout the country to 50% and, at the same time, allow the consumption of renewable energy to be increased to 23% in 2020 and up to 32% in 2030. To achieve this goal, it will be necessary to install 10.2 GW of photovoltaic power in 2018 and between 18.2 and 20.2 GW five years later in 2023.
Hence, in order to achieve these above-mentioned objectives related to photovoltaic energy, France has established a regulatory framework with the objective of increasing the installed capacity in photovoltaic energy. This regulatory framework is a Feed-in Tariff system, and it is based, on the one hand, on public aid for promoters’ projects scheme so as to allow for an increase in profitability in these projects these projects. On the other hand, this regulatory framework also establishes limits for these public subsidies, which benefits the Administration.
In this work, evaluation of a photovoltaic energy project with a large installed power capacity, specifically 12 MW peak, will be carried out. The novel element of this evaluation is that it will be done by applying the theory of real options. Application of this theory makes sense because French legislation (that regulates the development of photovoltaic projects of more than 100 KW) contains two real options: a put option in favor of the promoter, which adds value to the project, and a call option, in favor of the Administration, which subtracts value from the project. In this work, calculation of the Net Present Value (NPV) will be carried out by the traditional method, that is, without including the value of the options, and then the calculation of the two real options indicated above will be accomplished. Following the theory of real options, the Expanded Net Present Value of the project will be obtained by adding to the NPV without options, the value of the put option, and in this way the total value of the project for the developer will be obtained.
The theory of real options has its foundation in financial options. The starting point of the theory of valuation of financial options was in 1973 from the works of Black and Scholes [
6] and Merton [
7]. The subsequent contribution of Cox et al. [
8] is also noteworthy. Since that time, there have been many authors who have relied on the theory of financial options for developing the theory of real options. Notable examples include [
9,
10,
11,
12].
The real options had their first application in the valuation of investment projects in natural resource reserves of a non-renewable nature, such as oil leases on the high seas. Among the most outstanding contributions, studies in [
13,
14,
15,
16,
17,
18,
19,
20] may be mentioned.
Subsequently, many authors have applied the theory of real options in the valuation of investment projects in electricity generation from renewable sources, such as offshore concessions, wind energy exploitation, small hydropower projects, etc. The following examples are noteworthy [
21,
22,
23,
24,
25,
26,
27,
28,
29,
30,
31,
32].
2. Materials and Methods
The methodology can be divided into nine stages. First, the method of real options is described. Second, the technical aspects that define the photovoltaic project are indicated, as well as the characteristics of solar irradiation of the location where the project is built. Third, the characteristics of a regulatory framework for renewable energy in France are described. Fourth, the real options embedded in the regulatory framework are described. Fifth, the valuation of these real options is specified. Sixth is the specification of the valuation of public aid. Seventh, the valuation of the project is described. Next, as with any long-term project, a photovoltaic plant faces several sources of uncertainty, which are specified as random variables for the economic evaluation of the project. Finally, the value of the real options is calculated.
2.1. Method of Real Options
The traditionally used project valuation method involves subtracting the current value of investments of the project from the present value of free cash flows. The discount rate must be adjusted for the risk of the project. This method allows us to calculate the Net Present Value (NPV).
The method of valuation by real options arises from the difficulty of using the traditional method to value discounted free cash flows of those investments that have certain characteristics, such as the operational flexibility of project management when decision making is based on the information received, uncertainty in the generation of free cash flows, translated into high volatility of the project or net a present value of the project which is close to zero. For projects of this type, the real options method has been applied as a complement to the free cash flow discounted valuation method. In this way, if we add the NPV obtained by the traditional method to the current value of the real option contained in the project, the total project value or extended NPV is obtained.
An option is a right that gives its owner the ability to buy or sell an asset for a specified period of time or on a specified date (called the expiry date) at a specified price, which is called the strike price. In order to have this right, it is necessary to pay a price, called the option premium.
European options are those that can only be exercised on the expiry date, while American options can be exercised throughout the entire period in which the right is in force.
The intrinsic or theoretical value of a purchase option is obtained by subtracting the option’s strike price from the market value of the underlying asset (the difference cannot be negative, so if this were the result, the intrinsic value would be null). This value reflects the profit obtained by the owner of a purchase option if he exercises the option. The intrinsic or theoretical value of a put option is obtained by subtracting the market value of the underlying asset from the option’s strike price (the difference cannot be negative, so if this were the result, the intrinsic value would be null). This value reflects the profit obtained by the owner of a put option should he exercise it.
The first options used were financial, which grant the right to buy or sell financial assets such as stocks, stock indices, currencies, interest rates, and futures. From these financial options, real options emerged, which grant the right to buy or sell real assets which are generally the free cash flows generated by the investment project. Among the real options, the most used in project valuation are the options to expand the project, reduce the project, delay or defer the project, temporarily close the project, and leave the project.
The option to expand a project gives its owner the right to purchase an additional part of the project at a cost, which is the additional investment to carry out the expansion. The expansion option can be interpreted as a call option of the free cash flows generated by the part of the project that is being expanded, paying the necessary investment in exchange for the expansion (strike price).
The option to reduce gives its owner the right to sell a part of the project in exchange for making a profit from the sale or the right to withdraw a part of the project in exchange for saving costs. The option to reduce can be interpreted as a put option to sell the free cash flows generated by the part of the project that is reduced, entering in exchange a price for the sale or a cost savings (strike price).
The option to leave a project gives its owner the right to sell or liquidate the entire project for a set price, or the right to sell the entire project in exchange for cost savings. The abandonment option can be interpreted as an option to sell the free cash flows of the project that is abandoned, entering in exchange a price for the sale or a costs savings (strike price).
The option of temporarily closing a project gives its owner the right to temporarily close a project in exchange for cost savings. This option reduces the value of the project, so it has the same approach as the option to reduce, i.e., remove a part of the project in exchange for costs savings. The temporary closing option can be interpreted as a put option for the free cash flows of the period that closes and instead entering a price equal to the cost savings (strike price).
The delay option gives its owner the right to delay the start of the project for a period of time. The option to delay is interpreted as a call option of the free cash flows of the delayed project in exchange for the investment after the delay (strike price).
Another group of options exist that are generated from the regulatory power of the Administration. These regulatory real options give their owner the right to buy or sell a certain underlying asset at some point in the future at a pre-set price. The options analyzed in this work belong to this last group.
2.2. General Characteristics of the Project
In photovoltaic solar energy generation, two types of installations are distinguished. On the one hand, there are the installations connected to the electrical distribution grid, and on the other hand there are the isolated installations. Approximately 90% of the installed power is connected to the distribution grid. This includes systems installed on the roofs of houses and buildings, as well as large photovoltaic power plants.
Isolated photovoltaic energy production systems are justified by the impossibility of extending the electricity distribution network to remote villages, which is often the case in developing countries. In these countries, rural electrification using photovoltaic energy has recently become a growing market. In systems isolated from the grid, the most important part in the cost of installation is the battery, which is even higher than that of photovoltaic modules. In the distribution of costs of an isolated installation with accumulation, if the periodic replacement is considered for 25 years of operation, the photovoltaic modules represent approximately 20% of the total cost, while the cost of the batteries represents 45%.
The project analyzed in this work is included in the type of systems connected to the electrical distribution grid. In this sense, the installation does not include the use of batteries, since all electricity produced is discharged directly into the electricity grid. It is for this reason that the cost of batteries is not included in the installation cost.
The investment project is a hypothetical photovoltaic (PV) solar park with an installed nominal capacity of 12,000 kilowatt peak (KWp). The capacity of a photovoltaic plant is usually expressed in kilowatt peak (KWp) and represents the nominal capacity of the generator under standard conditions. The real capacity is different from the nominal one, since the generation of electricity is influenced by the real conditions due to the location of the plant [
33].
As indicated in [
34], the global horizontal irradiation (GHI) in France take values in the range between 900 and 1700 KWh per square meter per year onto the horizontal surface.
Figure 1 shows a map of France with the GHI values.
It is assumed that the location of this photovoltaic park is in the southeast of France in which the GHI is 1450 KWh/m² per year. This corresponds to a solar irradiation on a photovoltaic module at optimal angle of 1670 KWh/m², and the annual electricity output per KWp is 1380 KWh, as indicated in [
32].
Based on this characteristic, it can be considered a representative type of photovoltaic plant; therefore, the analysis presented here could be easily generalized to other locations and plant sizes.
Thus, the annual production of electricity for the first functioning year of the plant is obtained by considering the power capacity of the plant, 12,000 KWp, and multiplying it by the electricity factor assumed for the location of the plant, 1380 KWh/KWp. Therefore, the annual production of the project is estimated at 16,560 MWh per year. As indicated in [
33], the production of electricity by photovoltaic plants is not constant over the entire life of a project, so an annual reduction of 0.2 percent for total production is assumed.
To estimate investment costs, a ground-mounted photovoltaic plant of more than 1000 KWp has costs ranging from 1000 to 1400 €/KWp. It is considered that in 2015 the investment cost of the plant was 1200 € per installed KWp, i.e., a total cost of 14,400,000 euros. This value is in accordance with the investment cost obtained for the year 2015 in [
35], which is 1240 US
$ per installed KWp. It was assumed that the construction of the installation would be carried out in 2015, so the photovoltaic plant would start operating in 2016. The estimated lifespan of this plant was 25 years, and during these 25 years amortization of the investments will take place.
As an industrial plant, a photovoltaic plant requires constant maintenance to ensure proper operation. The maintenance of such facilities is quite easy to carry out as there are few systems.
For the start-up date 2016, a value for fixed operation costs of 35 €/KW, based on data obtained from [
33], was assumed, which results in a total operating cost of 420,000 €/year. It is hypothesized that the plant costs will increase over the life of the project according to the L coefficient described in
Section 2.3, which considers both the evolution of labor costs and industrial market prices.
2.3. Regulatory Framework for Renewable Energy in France
The French Administration has established an economic subsidy for these photovoltaic projects under a Feed-in Tariff scheme. The scheme is contemplated in Article 85 of the Law N° 2000-108 [
36]. The obligation to purchase electricity of renewable origin, as well as tariffs, is regulated.
Subsequently, the decree of 04 March 2011 was passed [
37] fixing the purchase conditions of the electricity produced by plants using solar radiation.
Different decrees have been issued since enactment of the law. In these decrees, the values of the rates to be applied to photovoltaic projects have been successively established. In the case of solar energy, a decree was passed on 7 January 2013 [
38] to regulate the purchase of photovoltaic electricity.
Subsequently, a decree was approved on 25 April 2014 [
39], in which the provisions of the Decree of 7 January 2013 were derogated. However, the provisions of the decree of 7 January 2013 continued to apply to facilities, for which the producers had sent a connection request to the operator before 10 March 2014.
This decree of 25 April 2014 [
39], was last amended on 9 May 2014, and it is still in force today.
In this paper we will assume that the photovoltaic installation under study is in this particular situation mentioned in the decree of 25 April 2014 [
36], so the provisions of the Decree of 7 January 2013 [
38] will apply.
According to article 10 of the Law N° 2000-108 [
36], the electricity distributor is obliged to buy all electricity of renewable origin. It is also established that the sale prices of this renewable electricity must guarantee a normal profitability for the promoters of the projects. To achieve this, the Administration establishes a price scheme based on different amounts according to the characteristics of renewable energy projects. Article 10 provides a framework for various facilities to benefit from the obligation to purchase by Électricité de France (EDF) or non-nationalized distributors the electricity they produce.
The tariffs that remunerate electricity of photovoltaic origin are reduced every three months. The rate of this reduction is variable and will depend on the amount of installed power that requests to join the public support scheme in the last three months. For example, if the request for public support in the last three months is made by projects with an installed capacity of less than 5 MW, the reduction rate is 0%, and instead, if the projects requesting aid in the last three months add an installed capacity of more than 65 MW, the rate of reduction of the tariff is 9.5%.
According to the regulations, the tariffs for the remuneration of photovoltaic energy are classified from T1 to T5. Each of these tariffs differs from the others based on the characteristics of each type of project, such as the use of the building where the project is carried out, installed power, location of the assembly, etc. The higher tariff pays for smaller projects in residential buildings, while the lower tariff (T5) is to pay for the electricity of large projects with more than 100 KW of installed capacity.
The amount of the T5 tariff, for projects with an installed capacity greater than 100 KW, was established between 01 July 2014 and 30 September 2014 at 69.8 €/MWh.
For the purpose of the quantitative analysis, it assumes that tariffs will keep decreasing at the same rate until the date in which the simulated photovoltaic plant enters into service on January 2016, with a generating capacity of 59.5 €/MWh. The tariff to apply for this type of plant is guaranteed for 20 years by Decree 04 March 2011 [
37], Article 3. In Article 6, a limit on the annual production of subsidized energy stated as 1500 h of sun is established. The total amount of annual energy to be purchased, which is calculated every 12 months and based on the date of effect of the purchase agreement, has a cap. The cap on the amount of subsidized electricity is calculated by multiplying the installed peak power over a period of 1500 h.
Table 1 below summarizes the main conditions for acquisition tariffs:
Each purchase agreement contains provisions relating to the indexation of tariffs that apply to it. This indexing is done annually on 1st November by the application of a coefficient as defined below:
where in
ICHTrev-TS is an index of hourly cost of labor (all employees) in the mechanical and electrical industries (value on November 1st for each year);
FM0ABE1 is an index of producer market prices for the French industry; and
ICHTrev-TS0 FMABE10 are the values of indices ICHTrev-TS and FM0ABE1, respectively, on 1 November of the previous year to the date of effect of the purchase contract.
2.4. Identification of the Real Options Embedded in the Regulatory Framework
The remuneration system embedded in French legislation that provides support for the development of photovoltaic energy plants includes real options. The real options can be described as follows: Law N° 2000-108 [
36] establishes that any producer has a right to sell the electricity at regulated tariff prices every year, this system is known as Feed-in Tariff. The producer has the right, but not the obligation to do it, so alternatively he could sell at the wholesale market price, also named as the “pool price”. The possibility for the producer to sell at a regulated rate or at a market price can be assimilated to a put option held by the producer.
Moreover, the sale of subsidized electricity at a regulated tariff can be maintained for 20 years. From year 21 to the end of the project life (year 25), the producers of photovoltaic energy must revert to market price and sell their production as any other unsubsidized generator providing power to the French energy pool. That is, from year 21 to year 25, the Administration has the right to avoid continuing to pay the subsidy contained in the regulated tariff. Also, the Administration has the possibility of establishing an annual limit to the volume of subsidized production, which is set at 1500 h per year. These two limits allow the Administration to reduce the amount of public aid, and they can also be assimilated to a call option that the Administration owns.
Thus, French regulatory framework for promoting the installation of photovoltaic plants presents two regulatory real options: (i) an annual put option held by producers, consisting of an annual choice between Feed-in Tariff system and electricity market sale prices; (ii) a call option held by the Administration, based on two facts—on the one hand, the right not to pay any subsidy for photovoltaic power from year 21 onwards, and on the other hand, the possibility of limiting annual subsidized production to a total of 1500 h.
In this case, for a peak of 12,000 KW installed nominal power, the maximum volume of subsidized electricity production is obtained by multiplying 12,000 KWp by 1500 h, resulting in the amount of 18,000 MWh per year. As the actual volume of electricity produced by the plant in its first year of operation is 16,560 MWh, and onwards is reduced by 0.2%, all these amounts are under the regulated limit of 18,000 MWh. Therefore, in the case of this photovoltaic plant, this limit has no influence on the value of the call option that the Administration has.
2.5. Project Uncertainties
In this analysis, it has been considered that the three variables with the most influence on the free cash flows of the project are the following:
market price of electricity;
evolution of labor costs (measured by cost index ICHTTS); and
evolution of industrial prices (index PPEI).
Following [
40,
41,
42], it has been considered that electricity prices follow a stochastic process of mean reversion and with Poisson jumps. According to [
43], this same behavior can be assimilated to evolution of labor costs and evolution of industrial prices. To model these three variables, the method described in [
43] has been used.
A detailed description of the simulation for each of the variables subject to uncertainty in this model is provided in the following sub-sections.
2.5.1. Formation of Electricity Sales Prices
First, the following two types of prices are distinguished.
The Wholesale Electricity Market Price
Table 2 shows the historical diary base price of electricity in the French power Exchange (EPEX).
Using a simulation model based on the methodology established in [
43], and based on this historical data, electricity prices are projected from 2016 to 2041, that is, electricity prices are obtained for the 25 year lifespan of the project.
Remuneration of Photovoltaic Solar Energy
Taking into account the specifications established in [
36], the following concepts are specified:
In the first year (2016), the initial tariff takes a value of 59.525 €/MWh. This value is afterwards annually actualized by the L coefficient, as indicated in the legal documents regulating the French market (T0);
Annual tariff increase (L coefficient). As indicated in normative, from year 2 until year 20 (Lt); and
Price of electricity in the wholesale market (“pool price”) (Pt).
With all these elements, the value of the real options can be calculated using different scenarios for the acquisition of the electricity generated by the solar park. The tariffs, T, for the remuneration per MWh produced under each scenario are the following:
(A) Wholesale electricity market price (“pool price”): photovoltaic park revenues rely only on the price of electricity in the wholesale market. No premium is added to the normal remuneration obtained from the market. From year 1 onwards (2016–2040), the tariff per MWh generated is
(B) Feed-in Tariff system: photovoltaic park revenues rely only on electricity sale prices to rate (regulated tariff) with a 20 year limit and a limit of 1500 h on the volume of subsidized production. In this case, three separate sub-periods must be considered:
(C) Option to choose between (A) the pool price or (B) Feed-in Tariff system.
The producer can choose the form of remuneration. Naturally, rational selection of the sale price will depend on which of the alternatives has reached a higher value.
(D) Sale to tariff price without 20 year limits and 1500 h on the volume of subsidized production, during the 25 year lifespan of the project.
Using the simulation model based on [
43] and applying the Monte Carlo method, the projection of the 4 types of electricity rates discussed above is carried out throughout the lifespan of the project. In
Figure 2, this projection can be observed.
2.5.2. Hourly Labor Cost Index
A simulation of the index of Hourly Labor Cost Index (all employees) in the mechanical and electrical industries (ICHTTS) is performed.
In
Table 3, the historical values of the ICHTTS in France (Base 2008) is shown.
Using the simulation model based on [
43] and applying the Monte Carlo method, the projection of the Labor Hourly Cost Index is carried out throughout the lifespan of the project.
2.5.3. Producer Prices Index of French Industry
In
Table 4, the historical values of the Producer Prices Index for the French industry PPEI in France (Base 2006) are shown. This index is needed for the calculation of coefficient L, as designed in the process of updating regulated electricity tariffs.
Using the simulation model based on [
43] and applying the Monte Carlo method, the projection of the Producer Prices Index of the French Industry is carried out throughout the lifespan of the project.
2.6. Valuation of the Real Options
The value of the put option held by the promoter can be calculated as the difference between value of the Net Present Value (NPV) obtained by applying the price result of choosing (B) Feed-in Tariff system or (A) wholesale electricity market price (“pool price”), minus the Net Present Value obtained by applying (A) Wholesale electricity market price (“pool price”), that is:
where
NPV (A): this NPV is obtained applying (A) wholesale electricity market price (“pool price”).
NPV (C): this Net Present Value is obtained by applying the price result of choosing (B) Feed-in Tariff system with limits of 20 years and 1500 h on the volume of subsidized production or (A) wholesale electricity market price (“pool price”). It is assumed that the system initially established for the sale of electric power will be at pool prices, and that the promoter may choose to replace it with the sale system with tariffs (Feed-in Tariff system), depending on which of the two systems offers a higher value.
The value of the call option in favor of the Administration is calculated as the difference between value of the Net Present Value obtained by applying (D) tariff price without the limits of 20 years and 1500 h on the volume of subsidized production, minus the Net Present Value obtained by applying (B) Feed-in Tariff system (with a limit of 20 years and limit of 1500 h on the volume of subsidized production), that is:
where
NPV (B): this NPV is obtained by applying (B) Feed-in Tariff system (with a 20 year limit and a limit of 1500 h on the volume of subsidized production);
NPV (D): this Net Present Value is obtained by applying (D) tariff price without the 20 year limit and 1500 h limit on the volume of subsidized production.
The values of the three variables previously analyzed in
Section 2.5 are randomly entered in the simulation model, and a random NPV value is obtained with each random combination of these three variables. The hypothesis is assumed that the annual tariff growth rates and operating costs coincide with the value of the coefficient L defined above in Expression (1). The free cash flows of the project are then calculated and discounted at a rate equal to the profitability offered by the 10-year Bond of the French Treasury during the period 2008–2014 [
47], which is 2.839 percent. This discount rate is considered the risk-free rate (r
f). To obtain a sufficiently representative number of NPV values, the Monte Carlo method was applied.
2.7. Valuation of the Public Aids
The value of public aid is equal to the value of the put option held by the promoter.
2.8. Valuation of NPV Extendedof the Project
The total value of the project is known as NPV extended, and it is calculated by adding the value of the put option held by the promoter to the NPV without options, that is, without flexibility:
To obtain the NPV value without flexibility, free cash flows are obtained by applying (A) wholesale electricity market price (“pool price”), and are discounted at a rate equal to the weighted average cost of capital or WACC. This WACC has a value of 4.8 percent [
31]. The annual growth rates of operating costs are assumed to coincide with the value of the coefficient L defined above in Expression (1). In the simulation model, the values of the three variables discussed previously in
Section 2.4 are entered randomly, and a random NPV value is obtained with each random combination of these three variables. The Monte Carlo method is applied to obtain a sufficiently representative number of NPV values.
4. Sensitivity Analysis and Discussion
In this section, a sensitivity analysis and a discussion of the results will be carried out.
The first variable that it is going to make changes in its value is the category T5 regulated tariff or large-scale projects with a capacity greater than 100 KW, which keeps the rest of the variables constant. The changes considered are to increase the value of the regulated tariff and then repeat the Monte Carlo simulations for each of the new scenarios. Four cases have been studied which consider increases in the T5 regulated tariff by 25%, 50%, 75%, and by 100%.
A second variable that it is going to change are the limits established by the Administration. These limits are the amounts of 20 years and 1500 h per year for the volume of subsidized production. The changes considered are to increase the value of these limits by 25%, i.e., the amounts of 25 years and 1875 h per year for the volume of subsidized production and to decrease the value of the initial limits by 25%, 50%, 75%, and 100%. The Monte Carlo simulation is repeated for each scenario.
In all these cases, the impacts on the value of the options, the value of the extended NPV, and the value of public aid will be determined.
Figure 3 and
Figure 4 show the results obtained for the average values and percentage changes in base scenario due to changes in the variable category T5 regulated tariff.
It can be seen in
Figure 3 that the NPV extended began to be positive with 75% tariff increases. In this case, the NPV without flexibility was negative, but by adding the value of put option the sum was greater than zero.
The NPV extended was negative for increases of the regulated tariff of 25% and of 50%. For increases of 75% and 100% it was positive.
The breakeven point of the project was achieved with an increase in the regulated rate of 59%, that is, with this rate increase, NPV extended would be zero.
It can be seen in
Figure 4 that increases of the regulated tariff had a multiplier effect on the value of public aid, since the value of these increased by a bigger percentage.
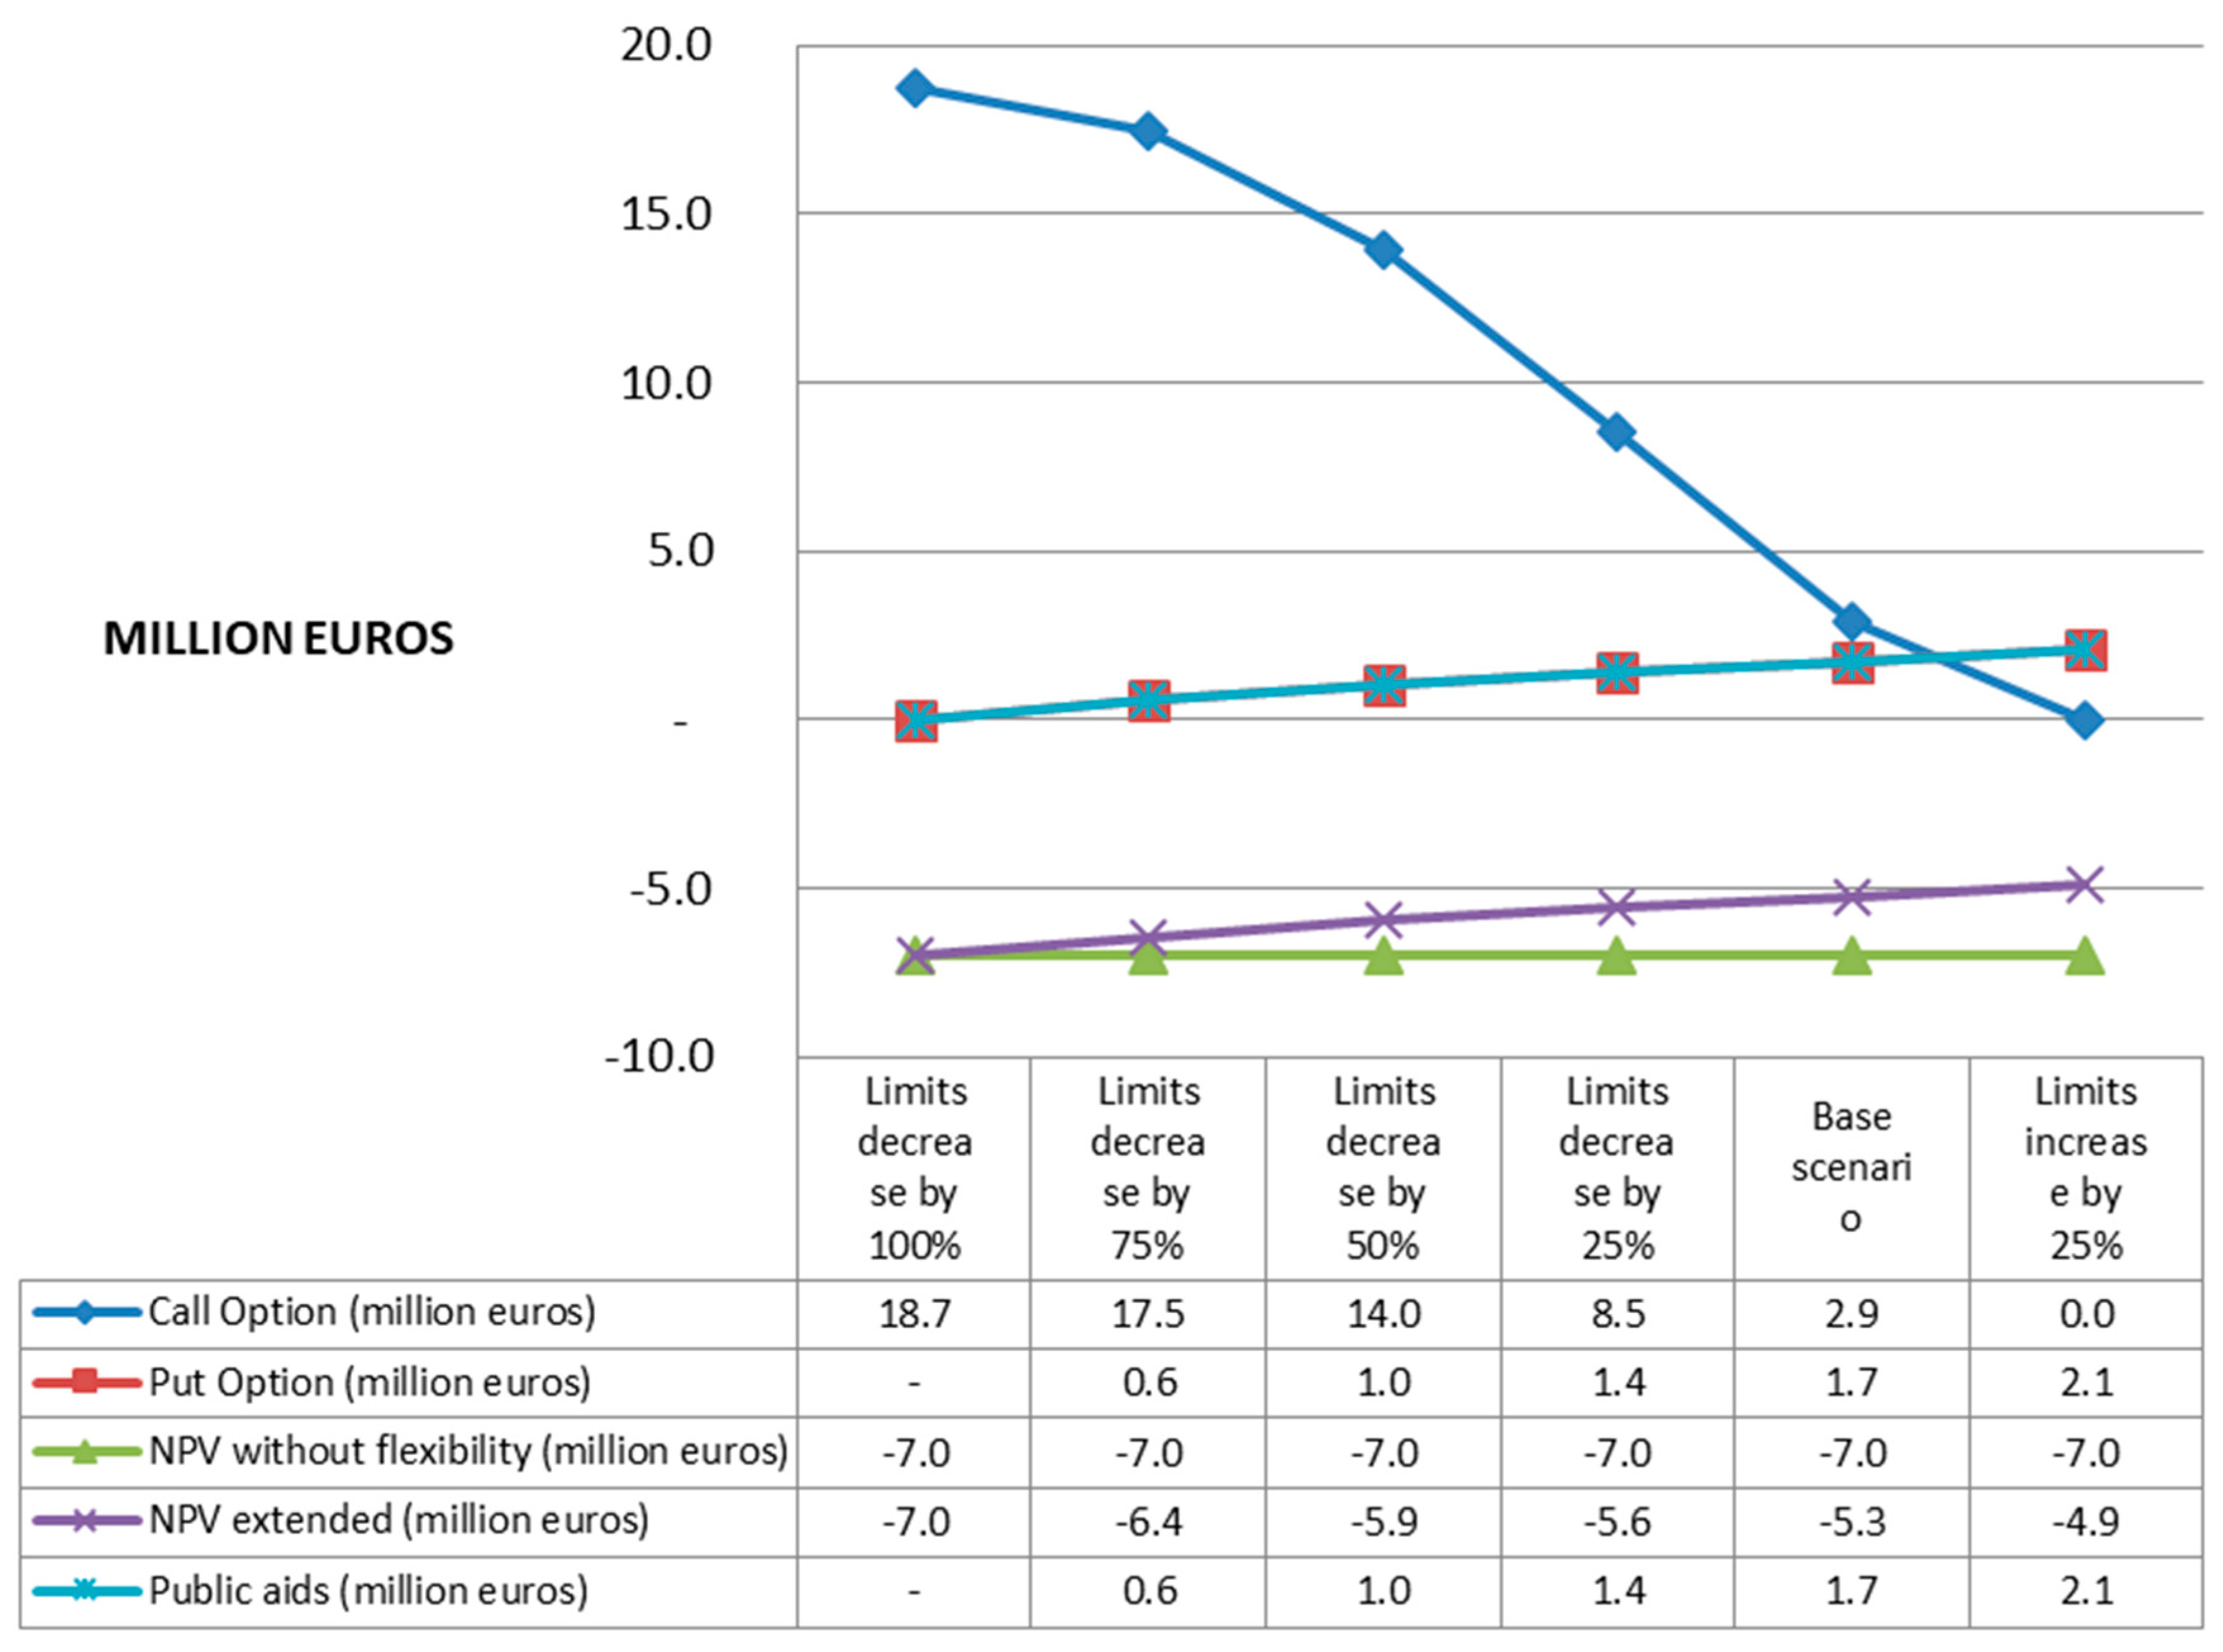
Figure 5 and
Figure 6 show the results obtained for the average values and percentage changes in the base scenario due to changes in the limits of subsidized electric power production (20 years + 1500 h).
It can be seen in
Figure 5 that the extended NPV was negative in all cases, and a decrease of the limits produced decreases of the values of the NPV extended and public aid to the promoter.
Conversely, a decrease of the limits produced increases of the values of the call option. This result was expected since the call option held by the Administration keeps it from paying a higher amount of public aid.
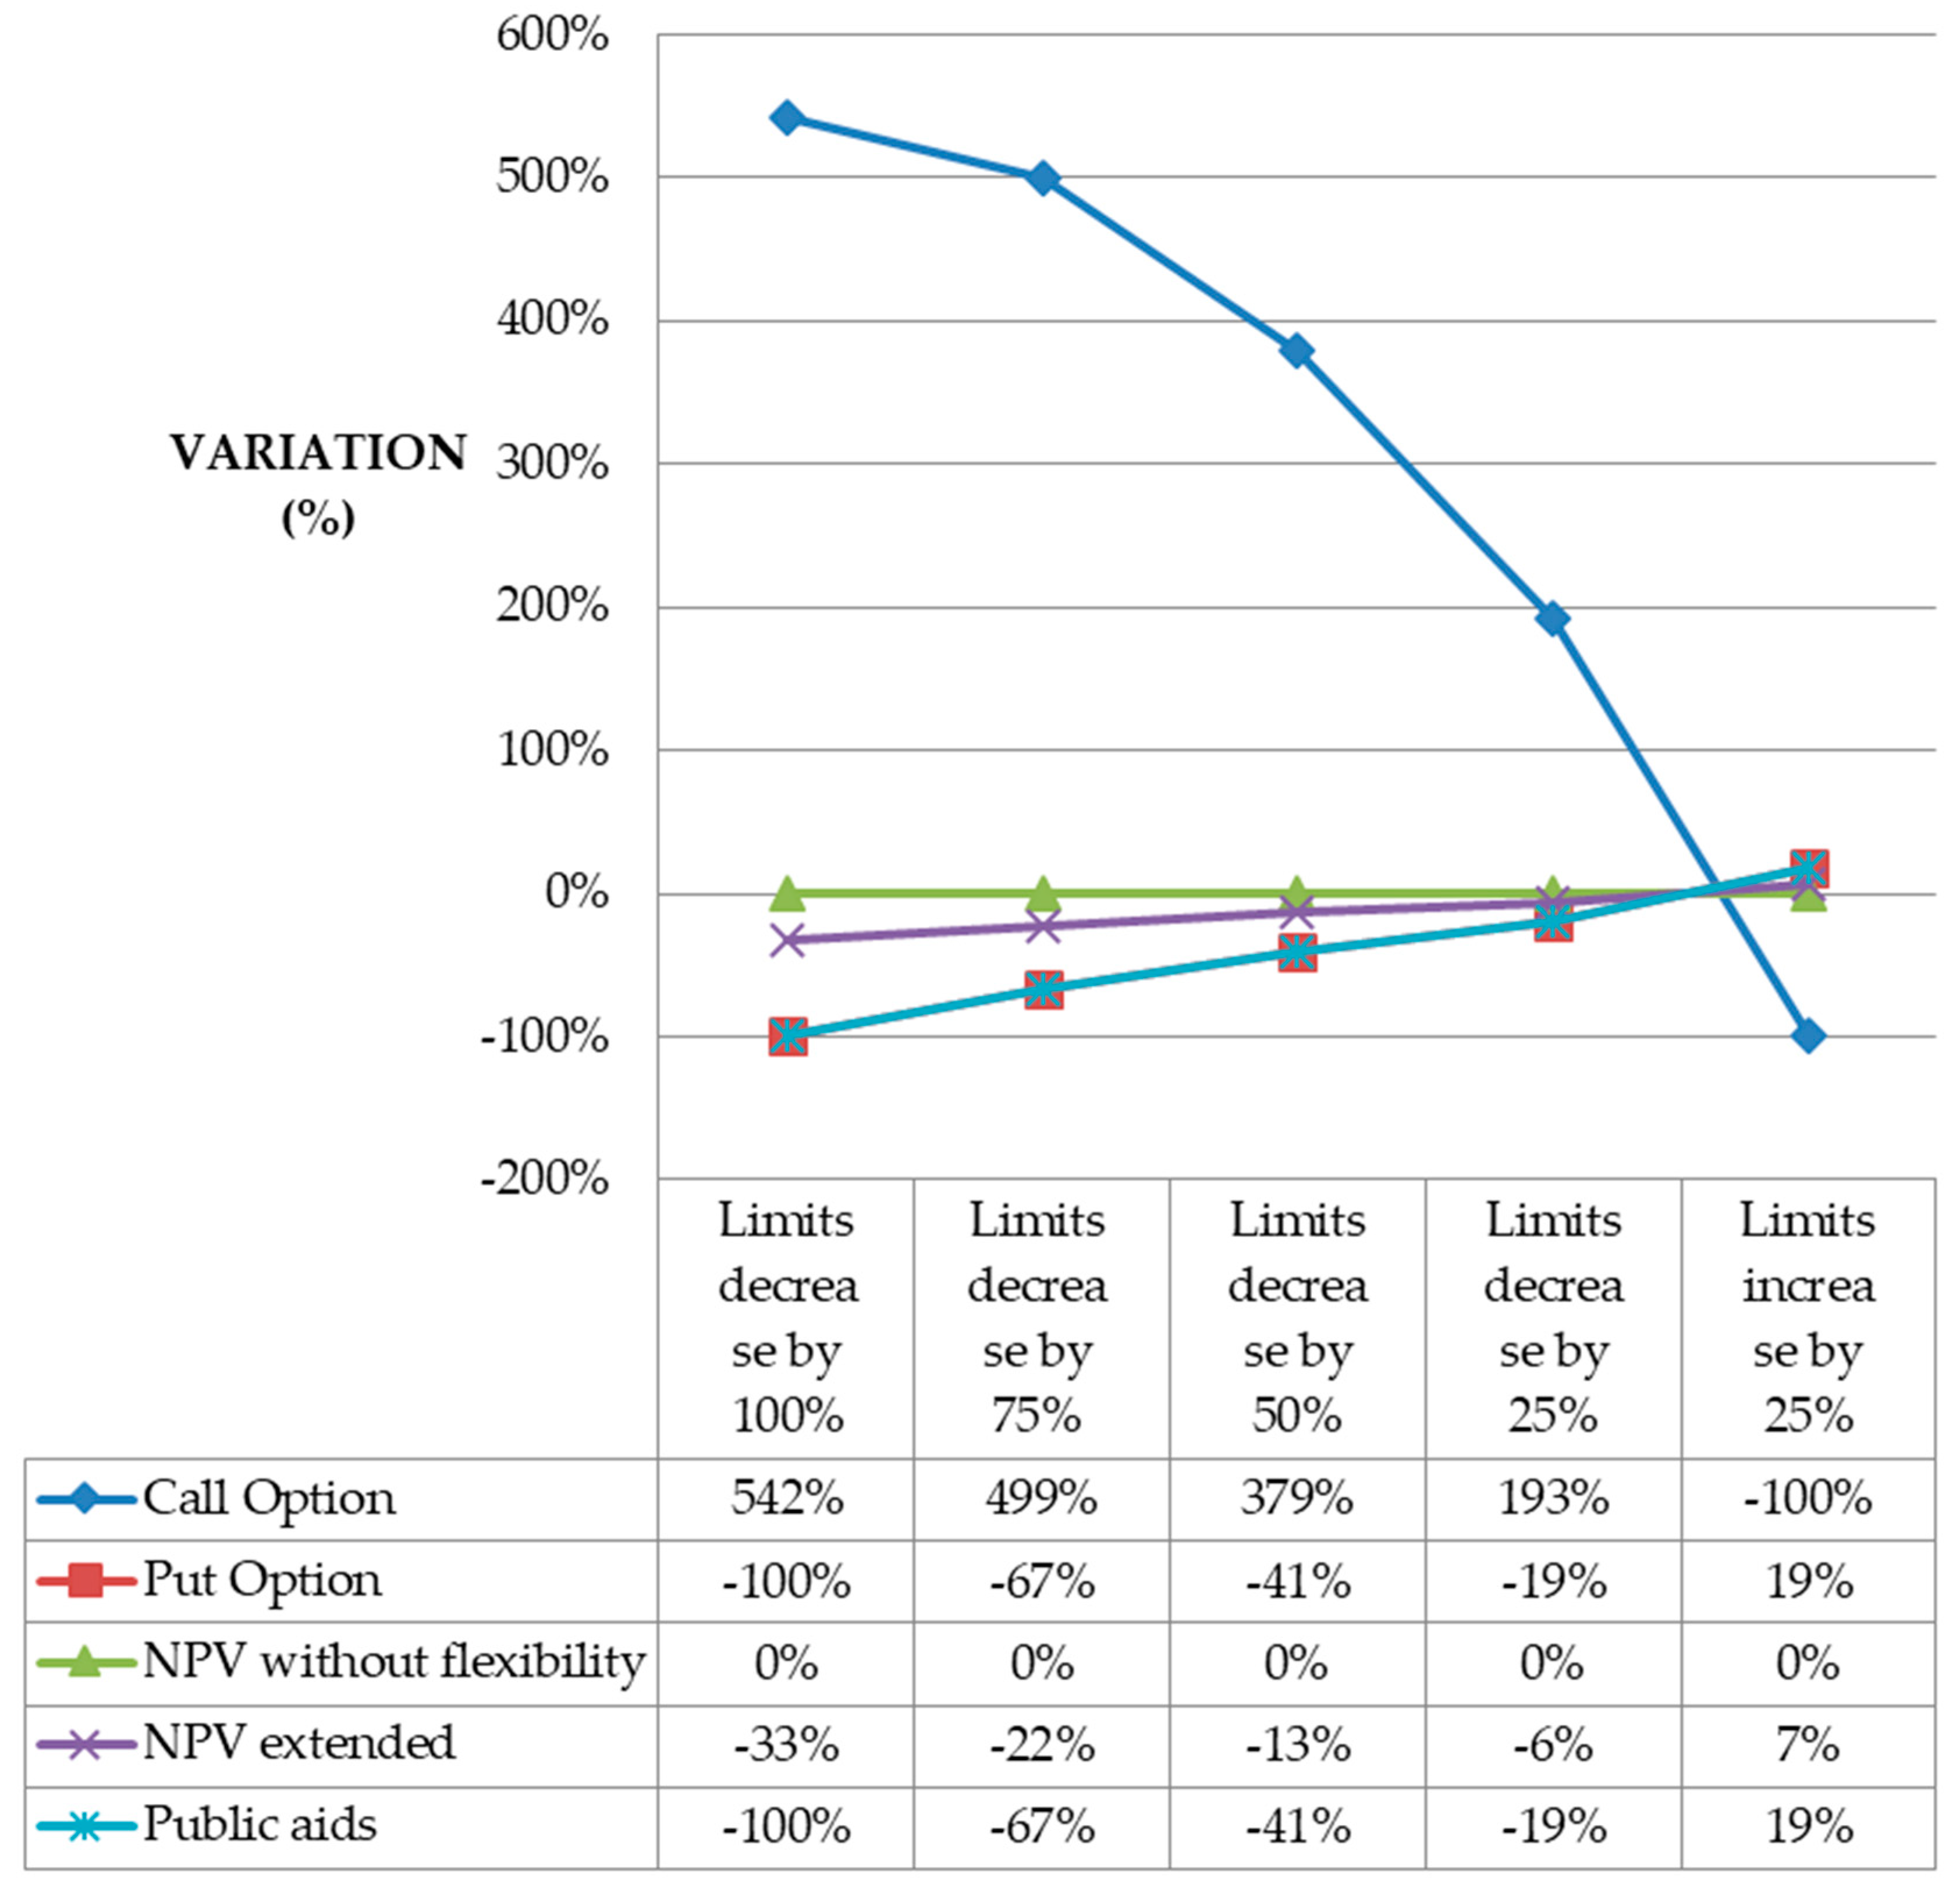
It can be seen in
Figure 6 that decreases of the limits had an inverse multiplier effect on the value of the call option, since the value of this option increased in a bigger percentage. Conversely, if the limits increased by 25%, a decrease in the value of the call option in a higher percentage was produced.
It is observed that when the limits to the amount of subsidized energy decreased, there was a decrease in the extended NPV, albeit to a lesser extent. At the same time, if the limits were increased, there was an increase in the extended NPV, albeit to a lesser extent. For example, if the limits on the amount of subsidized energy were increased by 25%, the extended NPV of the project only increased by 7%. This can be interpreted as the variation of the limits to the amount of subsidized electrical energy weakly influences the value of the project. For this reason, in order to make the project profitable, that is, positive values of extended NPV, the regulations should increase other variables such as the regulated tariff.
Thus,
Figure 5 and
Figure 6 show that increases in the limits of subsidized electric power production reduce the value of the call option held by the Administration. At the same time, these increases in limits increase the value of the put option and public aid, which benefits the promoters of the projects.
5. Conclusions
The purpose of this work is to analyze the French regulatory framework for renewable energy. In particular, the work focuses on the influence that the aforementioned regulatory framework has on the value of electricity generation projects from photovoltaic energy. Associated real options appear in the French legislation for renewable energy, which reflects the support of public administration and influences the value of projects.
This paper transposes, into a fictitious photovoltaic park project, a methodology that the author proposes for any other type of renewable energy investment project carried out in any other country such as France, which has a stable regulatory framework for the development of renewable energies based on a Feed-in Tariff system.
The main contribution of this document is to show the methodology for evaluating renewable energy projects in any country that has a regulatory framework for the development of renewable energy.
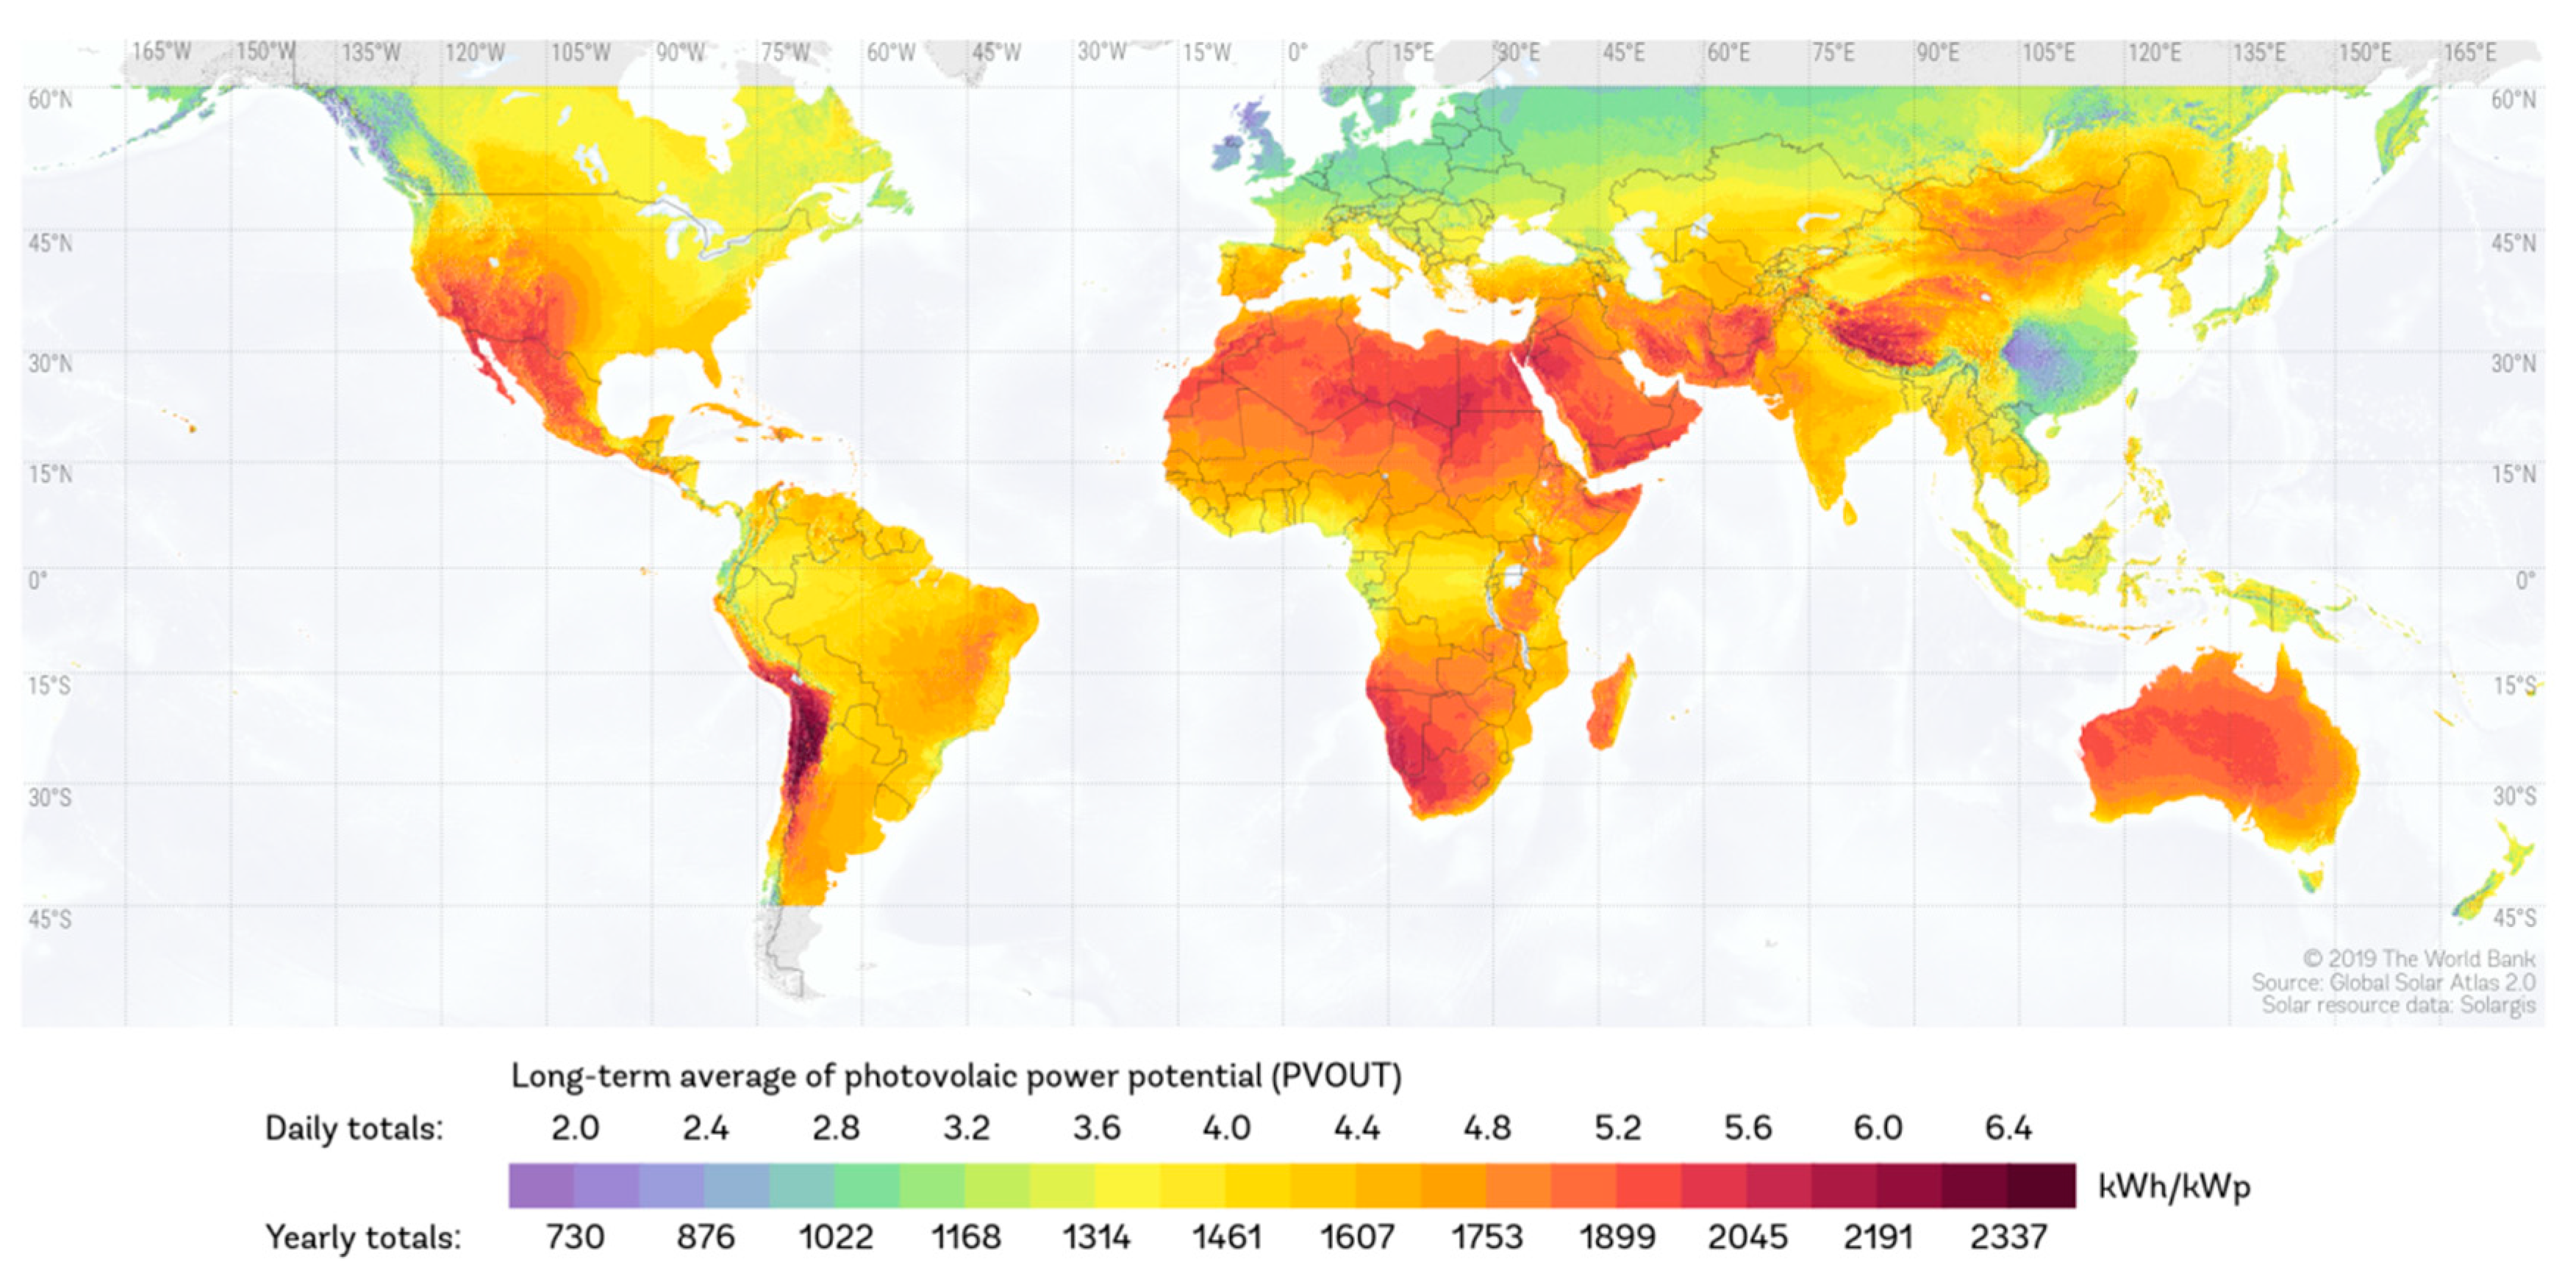
The result shows that the project subtracts value from the developer since a negative value of the expanded Net Present Value is obtained. The main reason for the low profitability of the project is the low solar irradiation that exists in France and, therefore, the low value of the electricity produced annually. The value considered for the object of this work located in the southeast of France for the photovoltaic power potential is 1380 KWh/KWp.
It is noteworthy that the break-even point for this variable was obtained with an annual photovoltaic power potential value of 2100 KWh/KWp. In other words, applying this value of photovoltaic power potential, the extended NPV would be zero. A world map with the values of annual photovoltaic power potential in KWh per KWp is shown below. It can be seen in
Figure 7 that only the brown areas reach this value of 2100 KWh/KWp.
To perform the economic analysis of existing real options embedded in the regulatory framework, the case of a particular project based on some assumptions about the characteristics of the plant is evaluated here. This methodology used and the results obtained for this project can be extrapolated to a wider set of photovoltaic projects, giving us a general idea of the support of the French administration for the development of photovoltaic power and the influence of the regulatory real options on the profitability of projects.
The put option held by the producer consists of an annual choice between system Feed-in Tariff and electricity market sale prices. This option favors the promoter since it increases the NPV of the project. The call option maintained by the Administration provides a benefit for the public sector, since this option represents a limit in subsidized electricity production.
The analysis of projects based on the valuation of real options, on the one hand, allows public authorities to analyze the economic effect that limits placed on subsidized electricity production have on the value of projects, and on the other hand, provides the promoters of photovoltaic electricity generation projects much help in evaluating the put option, which consists of choosing the most convenient remuneration system for the electricity produced and thus determining the extended NPV of the project.
Finally, as a future line of research, application of the methodology described in this work is proposed to analyze the support system for renewable energy based on renewable portfolio standard (RPS).


