Article

Liquid Water Transport Behavior at GDL-Channel Interface of a Wave-Like Channel

State Key Laboratory of Engines, Tianjin University, Tianjin 300350, China
*
Authors to whom correspondence should be addressed.
Energies 2020, 13(11), 2726; https://doi.org/10.3390/en13112726
Submission received: 10 April 2020 / Revised: 1 May 2020 / Accepted: 19 May 2020 / Published: 28 May 2020
(This article belongs to the Special Issue Polymer Electrolyte Membrane Fuel Cell Systems)

Abstract

:
This paper evaluates the liquid water at the gas diffusion layer-channel (GDL-channel) interface of reconstructed GDL microstructures with uniform and non-uniform fiber diameters in wave-like channels. A non-uniform GDL microstructure is reconstructed for the first time at the GDL-channel interface to evaluate droplet motion. The three-layer GDL microstructures are generated using the stochastic technique and implemented using the OpenFOAM computational fluid dynamics (CFD) software (OpenFOAM-6, OpenFOAM Foundation Ltd., London, UK). The present study considers the relationship between reconstructed GDL surfaces with varying fiber diameters, wettability, superficial inlet velocity and droplet size. Results show that the droplet detachment and the average droplet velocity decrease with an increase in the fiber diameter as well as the structural arrangement of the fibers. Under the non-uniform fiber arrangement, the removal rate of water droplets is not significantly improved. However, the choice of smaller fiber diameters facilitates the transport of droplets, as hydrophobicity increases even at slight surface roughness. The results also indicate that the average droplet velocity decreases under low inlet velocity conditions while increasing under high inlet velocity conditions. Therefore, the structural make-up of the GDL-channel interface influences the droplet dynamics, and the implementation of a non-uniform GDL structure should also be considered in the GDL designs.

Graphical Abstract

Highlights

-
VOF model is designed to analyze the two-phase flow on reconstructed GDL microstructures.
-
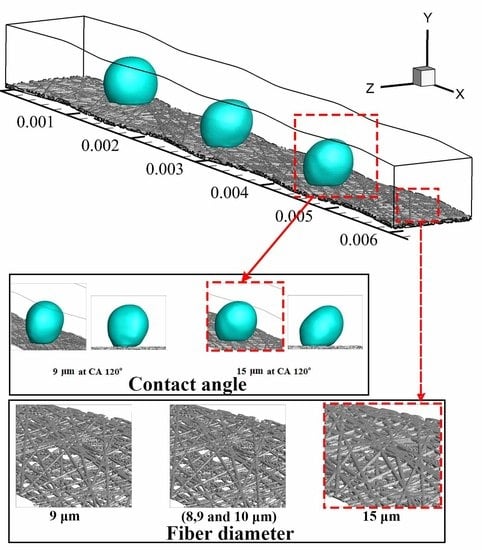
Fiber diameter of the GDL influences the contact angle of liquid water on its surface.
-
Non-uniform fibrous structures promote the transport of liquid water.
-
Choice of smaller fiber diameter favours in-plane average speed of liquid water.
-
The droplet speed decreases under low inlet velocity, whereas it increases under high velocity.

1. Introduction

The proton exchange membrane fuel cells (PEMFCs) have technically expanded over the past several decades and continued to make inroads into new areas. Even with the recent evolution of artificial intelligence (AI), the future of PEMFCs appears fantastic. It has been projected that the AI’s technological contrivance in PEMFCs will undoubtedly position it as a future smart energy system with great potential [1,2]. This high-power density energy device, through research and development, has become a promising power source for automobiles, spacecraft, submarines, and stationary and portable applications due to the unique benefits associated with it [3,4]. Generally, the PEMFC consists of several components, including membrane electrode assembly (MEA), flow channel and graphite plate [5]. Of these components, the MEA is the kernel component, which comprises a polymer electrolyte membrane (PEM), two catalyst layers (CL) and two gas diffusion layers (GDL). In particular, the GDL is a core component of the MEA because it not only serves as a bridge between the PEM and the graphite plate, but most importantly, serves as a platform where multiphase reactant and product transport takes place [6]. Due to its strategic role in efficient water management in PEMFCs, the significant importance of GDLs has attracted much attention among fuel cell researchers and designers.
The GDLs are often thin, electrically and thermally conductive porous sheets in the form of woven carbon cloth, woven carbon paper (carbon felt) or non-woven carbon fiber paper randomly oriented to form a porous layer [7]. The woven carbon cloth is made of fiber bundles arranged in an intertwined manner with carbon fibers of constant diameter. While the woven carbon paper (carbon felt) is made of fibers that appear mostly curved in a spaghetti fashion. In non-woven carbon papers, the fibrous arrangement has carbon fibers with constant diameter. Carbon paper fiber diameters typically range from 5–10 µm [8,9,10]. Thus, the core functions of GDLs include: (1) provision of pathway for reactant transport to the CL, (2) facilitates product water removal from the MEA, (3) aids in electron conduction through the membrane [11], (4) provides heat transfer from the CL to the current collector during PEMFC operation, (5) provision of mechanical support to hold the MEA from bulging as a result of product water absorbency which could damage the CL or heighten the pressure drop across the flow pathway.
During PEMFC operation, the cathode side GDL is prone to flooding as a result of product water accumulation, and if not tackled, the generated product water can lead to performance and degradation issues [12,13]. This is attributable to the electrochemical activity that produces water vapor as its by-product. Throughout this electrochemical reaction, the vapor condenses to liquid water as soon as the partial pressure of the vapor is higher than the saturation pressure. As a result, the cathode side design of GDL is a leading factor in overall PEMFC performance through improved reactant transport and water removal. Consequently, in order to achieve this goal, GDLs need to be carefully designed to fulfill their intended functions. Conscientiously designing GDLs suggests that the pores would remain relatively dry to prevent flooding with product water [14]. To date, various numerical studies have been performed to explore the influences of GDL properties (including polytetrafluoroethylene (PTFE) loadings [15], thickness [16,17], porosity [17,18], permeability [18] and wettability [11]) on water management in PEMFCs. However, some work has also been performed on the effect of the GDL fiber diameter on the transport of liquid water.
The importance of studying GDL in-plane fiber structures cannot be overemphasized as it mostly affects GDL resistance, particularly in terms of reducing electrical and thermal resistance [8]. There seems to be a correlation between fiber diameter and strength since an increase in fiber diameter leads to a decrease in overall resistance. Hwang et al. [19] and Hung et al. [20] in their separate surveys support this theory. Nevertheless, studies on fiber diameter impact on product water transport behavior and removal on a reconstructed GDL carbon cloth are very scarce. Based on the available literature, evaluation of two-phase flows in reconstructed GDL microstructures is carried out using various models such as the pore-network modeling (PNM) [21,22,23], the lattice Boltzmann method (LBM) [10,24] and the volume of fluid (VOF) method [9,15,25,26,27,28,29,30,31,32]. These popular methods have their strengths and weaknesses. The PNM technique is favorably suitable for studying flows within the porous media, but the condition outside the porous media (e.g., the channel) is hard to consider using this technique. While the LBM can trace the droplet interface, effectively implement real GDL porous media and non-slip boundary conditions [33], but the LBM negatives includes thermodynamic incoherence, surface tension dependence and it is not ideal for simulating large-scale flows. As for the VOF technique, the method is commonly used by many researchers to explore the two-phase flow within [34] and outside the porous media [26], because of its efficient capability of tracking the air-water interface inside the computation domain [27]. The VOF model is intended for two or more immiscible fluids, where the two-phase flow interface is of paramount interest.
Park et al. 2010 [9] numerically reconstructed a 3D microstructure of GDL for crossflow two-phase flow analysis. They predicted that the amount of pressure gradient caused by the crossflow is adequate and sufficient to expel accumulated product water in the GDL. In a similar vein, Yin et al. 2014 [25] developed a 3D transient two-phase VOF model to investigate the realistic water intrusion process in a reconstructed GDL microstructure. They reported the effects of differential pressure and variable contact angle on the process of liquid water transport along the in-plane direction caused by crossflow. Niu et al. 2018 [27] also evaluated the impact of varying PTFE loadings on the relationship of the capillary pressure and water saturation in the mixed-wettability GDL using a three-dimensional VOF model. Based on their results, there were good agreements between the VOF simulated Pc-s curves, and results obtained from the LBM, and experiments. Additionally, Niu et al. 2017 [28] in their work employed a 3D two-phase model based on the VOF to evaluate product water–air cross flow within a GDL microstructure placed between two adjacent straight channels. They exhaustively considered the detailed porous GDL microstructures, various two-phase cross flows, and concluded that the water droplet at the higher-pressure channel corner could easily be removed via crossflow compared to droplets at other locations. Although most of the reported work focused on two-phase flow through-plane and in-plane concerning cross flows in GDLs, with varying contact angles and microstructures, it should be noted that little has been done about liquid water transport on the surface of the GDL microstructure (in-plane).
Besides the contact angle and GDL microstructure, surface roughness also plays a significant role in water transport in the GDL. He et al. 2010 [29] used a 3D VOF model to investigate the effect of GDL surface roughness on water behavior in PEMFC channels. Rectangular and triangular roughness element types were used to evaluate the surface roughness effect on liquid water transport. They concluded that the roughness element density and element type roughness significantly affects water transport. As such, water behavior depends on the surface property of the GDL surface. Chen et al. 2012 and 2013 [30,31] investigated the influence of GDL surface roughness on liquid water transport and dynamic behaviors of a water droplet in a micro gas channel of a PEMFC using the VOF model. They concluded that GDL surface roughness affects droplet detachment, transport, water coverage and pressure drop across the channel. However, in the above studies, the roughness of the GDL surface was represented by an array of cubic holes distributed on the GDL surface and lathy rectangles with a square cross-section, respectively. These were used as assumptions in their work, while microscopic roughness of fiber ridges was neglected. To address this issue, Ashrafi and Shams 2016 [32] developed a 2D two-phase VOF model to study the effect of the GDL heterogeneous surface on droplet transport in PEMFC channels. They used a random function to generate a non-uniform GDL surface in terms of roughness density and roughness height. Based on their results, they concluded that the varied surface of GDLs significantly affects droplet transport in the microchannel. The GDL surface structure has a major impact on droplet elongation and pressure drop. Measurement of the droplet dynamics on a realistic GDL-channel interface is therefore necessary to explain the motion of the liquid water in the flow channels.
Researchers have devoted a great deal of energy and time to examining two-phase flow behavior through GDL microstructures, but with little focus on water transport on the GDL-channel interface. The majority used simplified assumptions where the GDL was assumed to be a smooth wall. It is very crucial to study this since little has been dedicated to studying GDL-channel interface water transport using a more realistic GDL microstructure. This is attributable to the observations of the researchers [33], which highlighted the influence of the fiber diameter on the GDL microstructure and the emerging need to artificially manipulate the GDL microstructure [15]. Artificial manipulation of the GDL microstructure may potentially boost both the transport characteristics of the GDL and the overall cell performance.
Therefore, in this present work, the reconstructed GDL microstructures of Toray carbon paper (TGP-H-060) are built based on a stochastic model [15,27], in conjunction with a 3D two-phase VOF model to evaluate product water transport at the GDL-channel interface. The reconstructed GDL is coupled with a wave-like channel in the OpenFOAM CFD framework and the VOF model implemented thereafter. Thus, the primary objective of this paper is to numerically investigate the transport of liquid water on the GDL-channel interface of GDLs with a uniform and non-uniform fiber diameter in a wave-like channel. In reality, carbon papers have been reported to have fixed fiber diameters [9,10,35], but an attempt has been made in this paper to compare carbon papers with constant fiber diameter against carbon papers with non-uniform diameter. Furthermore, the effects of surface structure, GDL contact angle, superficial inlet velocity, and droplet size on product water behavior are considered. This is to provide further insight into product water transport on GDL surfaces, as well as to offer guidelines to designers and PEMFC operators on alternative design of the GDL microstructure.

2. Numerical Methods

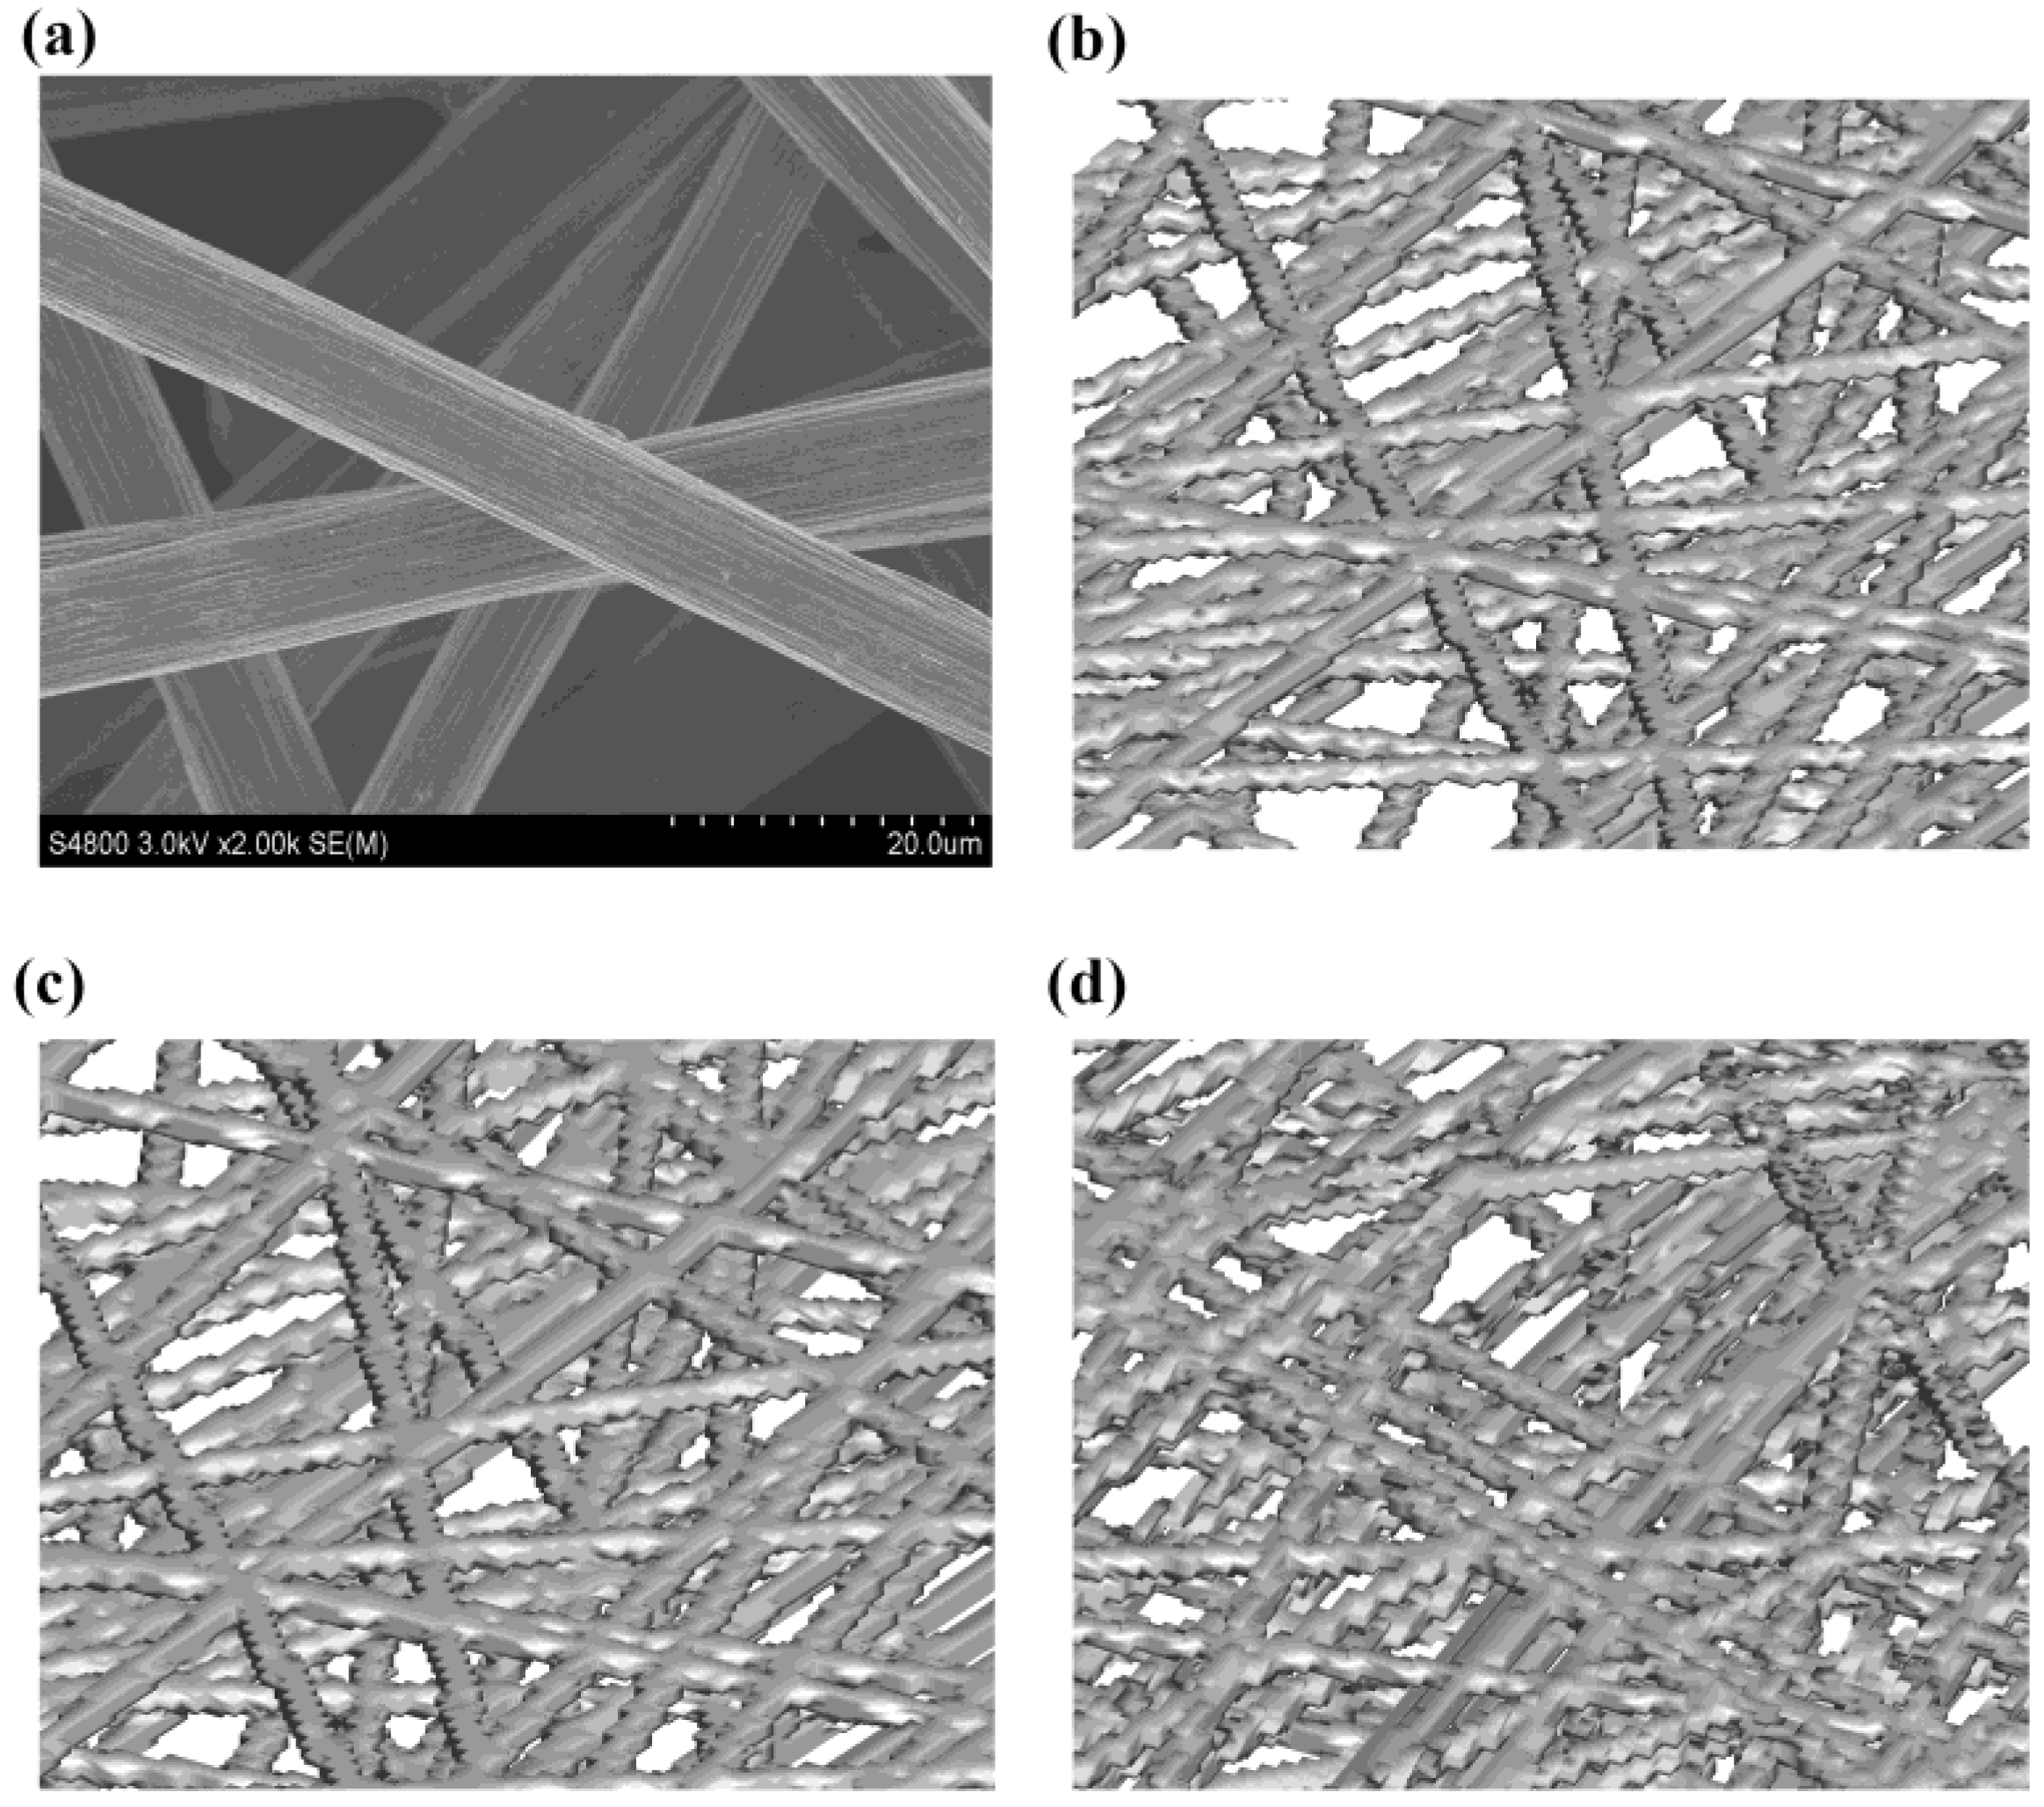
2.1. Algorithmic Reconstruction of GDL Microstructure

In the present study, the stochastic method [36] is used to reconstruct the Toray carbon paper GDL (TGP-H-060) microstructure. The algorithm employed in the GDL generation is implemented in OpenFOAM based on the following input parameters:
  • Fiber radius
  • Fiber height
  • Number of layers
  • Target porosity
The numerically reconstructed GDL is generated using the following algorithm:
i.
Initiate the state of the pseudo-random number generator.
ii.
Estimate the number of fibers required per layer from porosity.
iii.
Randomly generate the points for the fiber layers on specified planes.
iv.
Randomly generate the fiber orientations for fibers.
v.
Calculate porosity.
vi.
When necessary: Change the number of fibers per layer and iterate steps i and iii–v until porosity converges.
vii.
Create all the layers.
Figure 1 shows the algorithmic approach used in the generation and discretization of the numerically reconstructed GDL microstructure coupled to a channel. This algorithmic approach based on in-house code is implemented through open-source software, CFD software (OpenFOAM) using a topoSetDict function. The Toray carbon paper GDL (TGP-H-060) micrograph from the [37] experiment is reconstructed on the basis of a stochastic model [27,28,36,38]. Figure 2 presents the micrograph of the SEM sample for Toray with fiber diameter of 8.3 µm and 3D reconstructed GDL carbon papers. Non-woven carbon papers such as Toray carbon paper GDL (TGP-H-060) usually have constant fiber diameter and porosity. As such, in this work, GDL microstructures with different fiber diameters have been reconstructed, for the purpose of investigating water transport behavior on the GDL-channel interface.

2.2. Governing Equations

The governing equations; the continuity and momentum conservation equations are solved using the VOF model with interface reconstruction.
Continuity equation:
Since in this analysis, only two fluids are considered, the volume fraction of the gas and liquid phase is α l and α g , respectively. The interface between the two phases is, therefore, tracked by solving the equation of continuity in each computational cell. The mass conservation (continuity) equation is expressed as shown in Equation (1).
V = 0
The phase conservation equation governs the velocity field of the two-phase mixture in the channel as expressed in Equation (2).
α l t + ( V α l ) + [ V r α l ( 1 α l ) ] = 0
The gas phase volume fraction α g is calculated on the basis of the following constraint
α g = 1 α l
where V denotes the velocity vector of the two interacting phases distributed across the flow domain, while V r , which is termed the compression velocity, represents the relative velocity of both phases at interface. The velocity vector and compression velocity are computed based on the following constraints.
V = α l V l + ( 1 α l ) V g
V r = V l V g
Momentum conservation equation:
( ρ V ) t + ( ρ V V ) [ μ ( V + V ) ] = p d g x ρ + f s
where ρ and μ represent the averaged liquid phase density and dynamic viscosity of the interacting mixture, respectively. Both of which are calculated using the volume fraction as a weighting factor based on the following constraints:
ρ = α l ρ l + ( 1 α l ) ρ g
μ = α l μ l + ( 1 α l ) μ g
Additionally, p d , g and f s in Equation (6), denote the modified pressure, gravitational acceleration vector and momentum source term linked to the surface tension effect, respectively. The modified pressure p d is employed to simplify the boundary conditions and computed using the following constraint:
p d = p ρ g x
where g and x represents the gravity and position vector, respectively. Applying the continuum surface force (CSF) model, the momentum source term which accounts for the volumetric surface tension between the interacting phases is expressed as:
f s = σ   κ   α l
κ = ( n w cos θ + t w s i n θ )
where σ , κ , n w and t w represents the surface tension coefficient, the mean surface curvature at the two-phase interface, the unit normal vector to the wall and unit normal tangential vector to the wall, respectively. Furthermore, θ denotes the static contact angle and assumed constant.

2.3. Model Assumptions

The stochastic method [26,31] used in generating the reconstructed GDL microstructure is based on the following assumptions:
  • The GDL is treated as carbon paper.
  • The carbon fibers in the GDL microstructure are straight cylinders randomly arranged in a plane with uniform and non-uniform diameters.
  • The carbon fiber orientation is perpendicular to the direction of the GDL thickness and can be overlapped.
  • The procedure with polytetrafluoroethylene treatment is ignored.
  • The two-phase flow inside the channel is incompressible, transient and laminar.
  • Transport properties of the fluids keep constant, and no phase change occurs in the process.

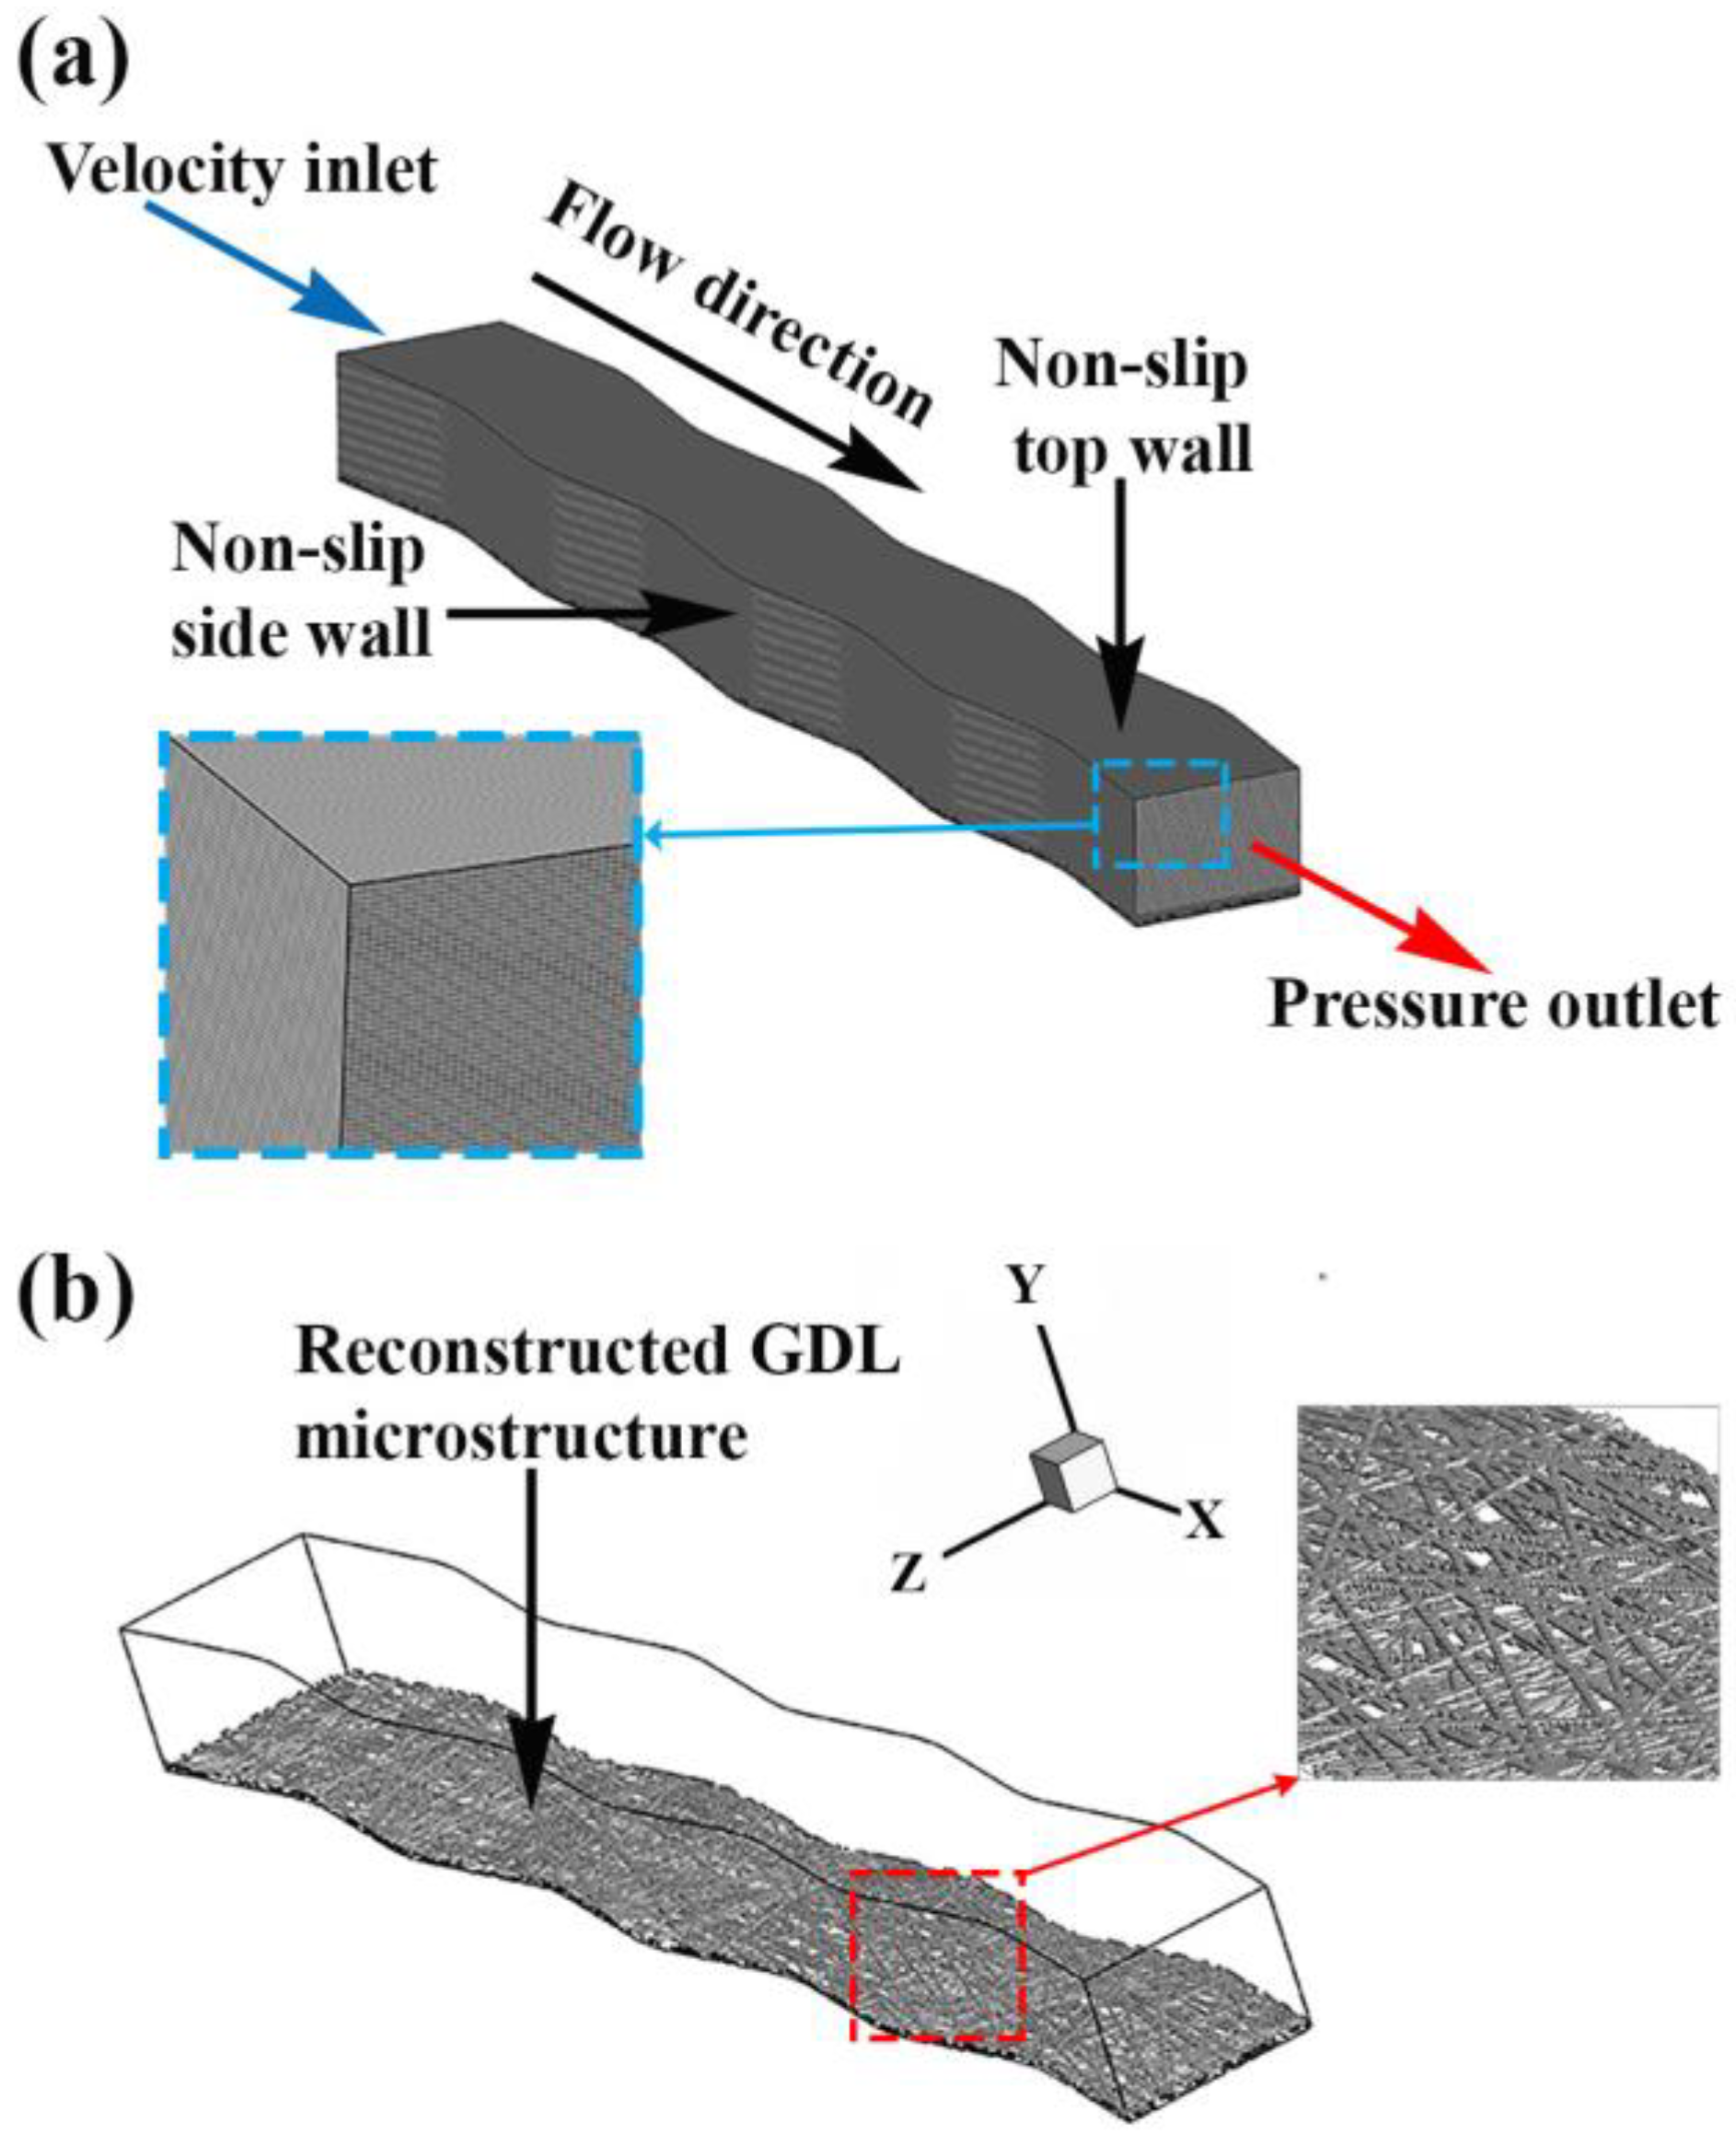
2.4. Computational Domain

Ideally, the GDL is a complex porous media microstructure made of carbon paper or carbon cloth. The pore morphology of the realistic GDL is considered in this GDL-channel interface two-phase flow analysis. As such, the bi-directional GDL microstructure is reconstructed using a stochastic method [36] and treated as a carbon paper.
A stochastic algorithm is implemented on OpenFOAM CFD software to generate a reconstructed GDL microstructure with a specified target porosity of 0.8 [27] and patched under a wave-like gas flow channel of dimension 6 mm × 0.5 mm × 0.7 mm (Figure 3a). The wave-like flow channel is designed based on a channel amplitude of 0.1 mm, channel pitch of 1.5 mm and a bend radius of 1 mm. The fiber diameter of the reconstructed GDL microstructures are uniform and non-uniform; the uniform test cases had diameters 8 μm, 9 μm and 15 μm. While the non-uniform fibrous arrangement had fibers generated randomly with the diameter varying from 8 μm through 10 μm and distributed in two separate 20:50:30 and 50:30:20 ratios (i.e., the ratio of 8 μm to 9 μm and 10 μm is either 20:50:30 or 50:30:20).

2.5. Boundary and Initial Conditions

The boundary conditions are defined at the inlet and outlet of the channel, the wave-like two side walls, the top wall, and the reconstructed GDL surface (Figure 3a). A uniform velocity profile is specified at the inlet of the flow, and the inlet airflow is assumed to be fully developed before meeting the patched droplet positioned 1 mm from the channel inlet. As such, the boundary condition at the channel inlet is the velocity-inlet. At the channel outlet, a constant pressure condition is employed, and the boundary condition set as the pressure-outlet. The static contact angle is specified as a boundary condition on each wall layer. All the walls of the channel are subject to the no-slip boundary condition at t = 0. The computation is initialized at t = 0 with the uniform air inlet velocity and gauge pressure set at zero, with gravitational force considered along the negative y-direction.
The baseline case simulation conditions are 10 m s−1 air inlet velocity, 1 bar pressure, temperature and the GDL surface static contact angle of 120˚ [28,38], while the side/top contact angle is set at 82˚; and based on the actual operating condition of a single fuel cell with current density of 1 A cm−2 [39]. The size of the droplet is 200 µm and patched on a three-layered 24 µm, 27 µm and 45 µm thick reconstructed GDL microstructure. The baseline superficial inlet air velocity is equal to 10 m s-1 in the present study, while the surface tension coefficient between the two-phases (liquid water and air) is set as 0.072 N m−1.

2.6. Numerical Procedures

The OpenFOAM CFD software is primarily used in VOF formulations through its implementable VOF-based solvers. In this work, because of its adaptability, the interFoam solver is used to solve multi-phase problems. As such, the wave-like flow channel and the GDL are both discretized with structured hexahedral mesh generated using OpenFOAM CFD software. The computational domain for the VOF model contains 15 million hex cells. Consequently, the advected volume fraction in Equation (2) is resolved by using the multidimensional limit for explicit solution (MULES) algorithm, which functions as a very powerful mechanism for ensuring the boundedness of scalar fields. While using the second-order scheme, the governing equations are discretized. The PIMPLE scheme, which incorporates the semi-implicit method for the pressure-linked equation (SIMPLE) scheme and pressure implicit with splitting of operators (PISO), is responsible for the pressure and velocity coupling solution. Using the PISO algorithm, Equations (1) and (6) are solved and the under-relaxation factor used in this work is set as unity. It is intended to prevent solution damping, which can result in longer computational time. Therefore, OpenFOAM, which is open-source CFD software, is used to carry out all the numerical simulations. The simulations in this analysis were conducted on the Tianhe-HPC1 system of the National Supercomputing Center in China. While the parallel approach open-MPI is adopted to speed up the simulation, and each case simulation lasted approximately 672 CPU hours using 112 Intel Xeon @2.93 GHz processors.

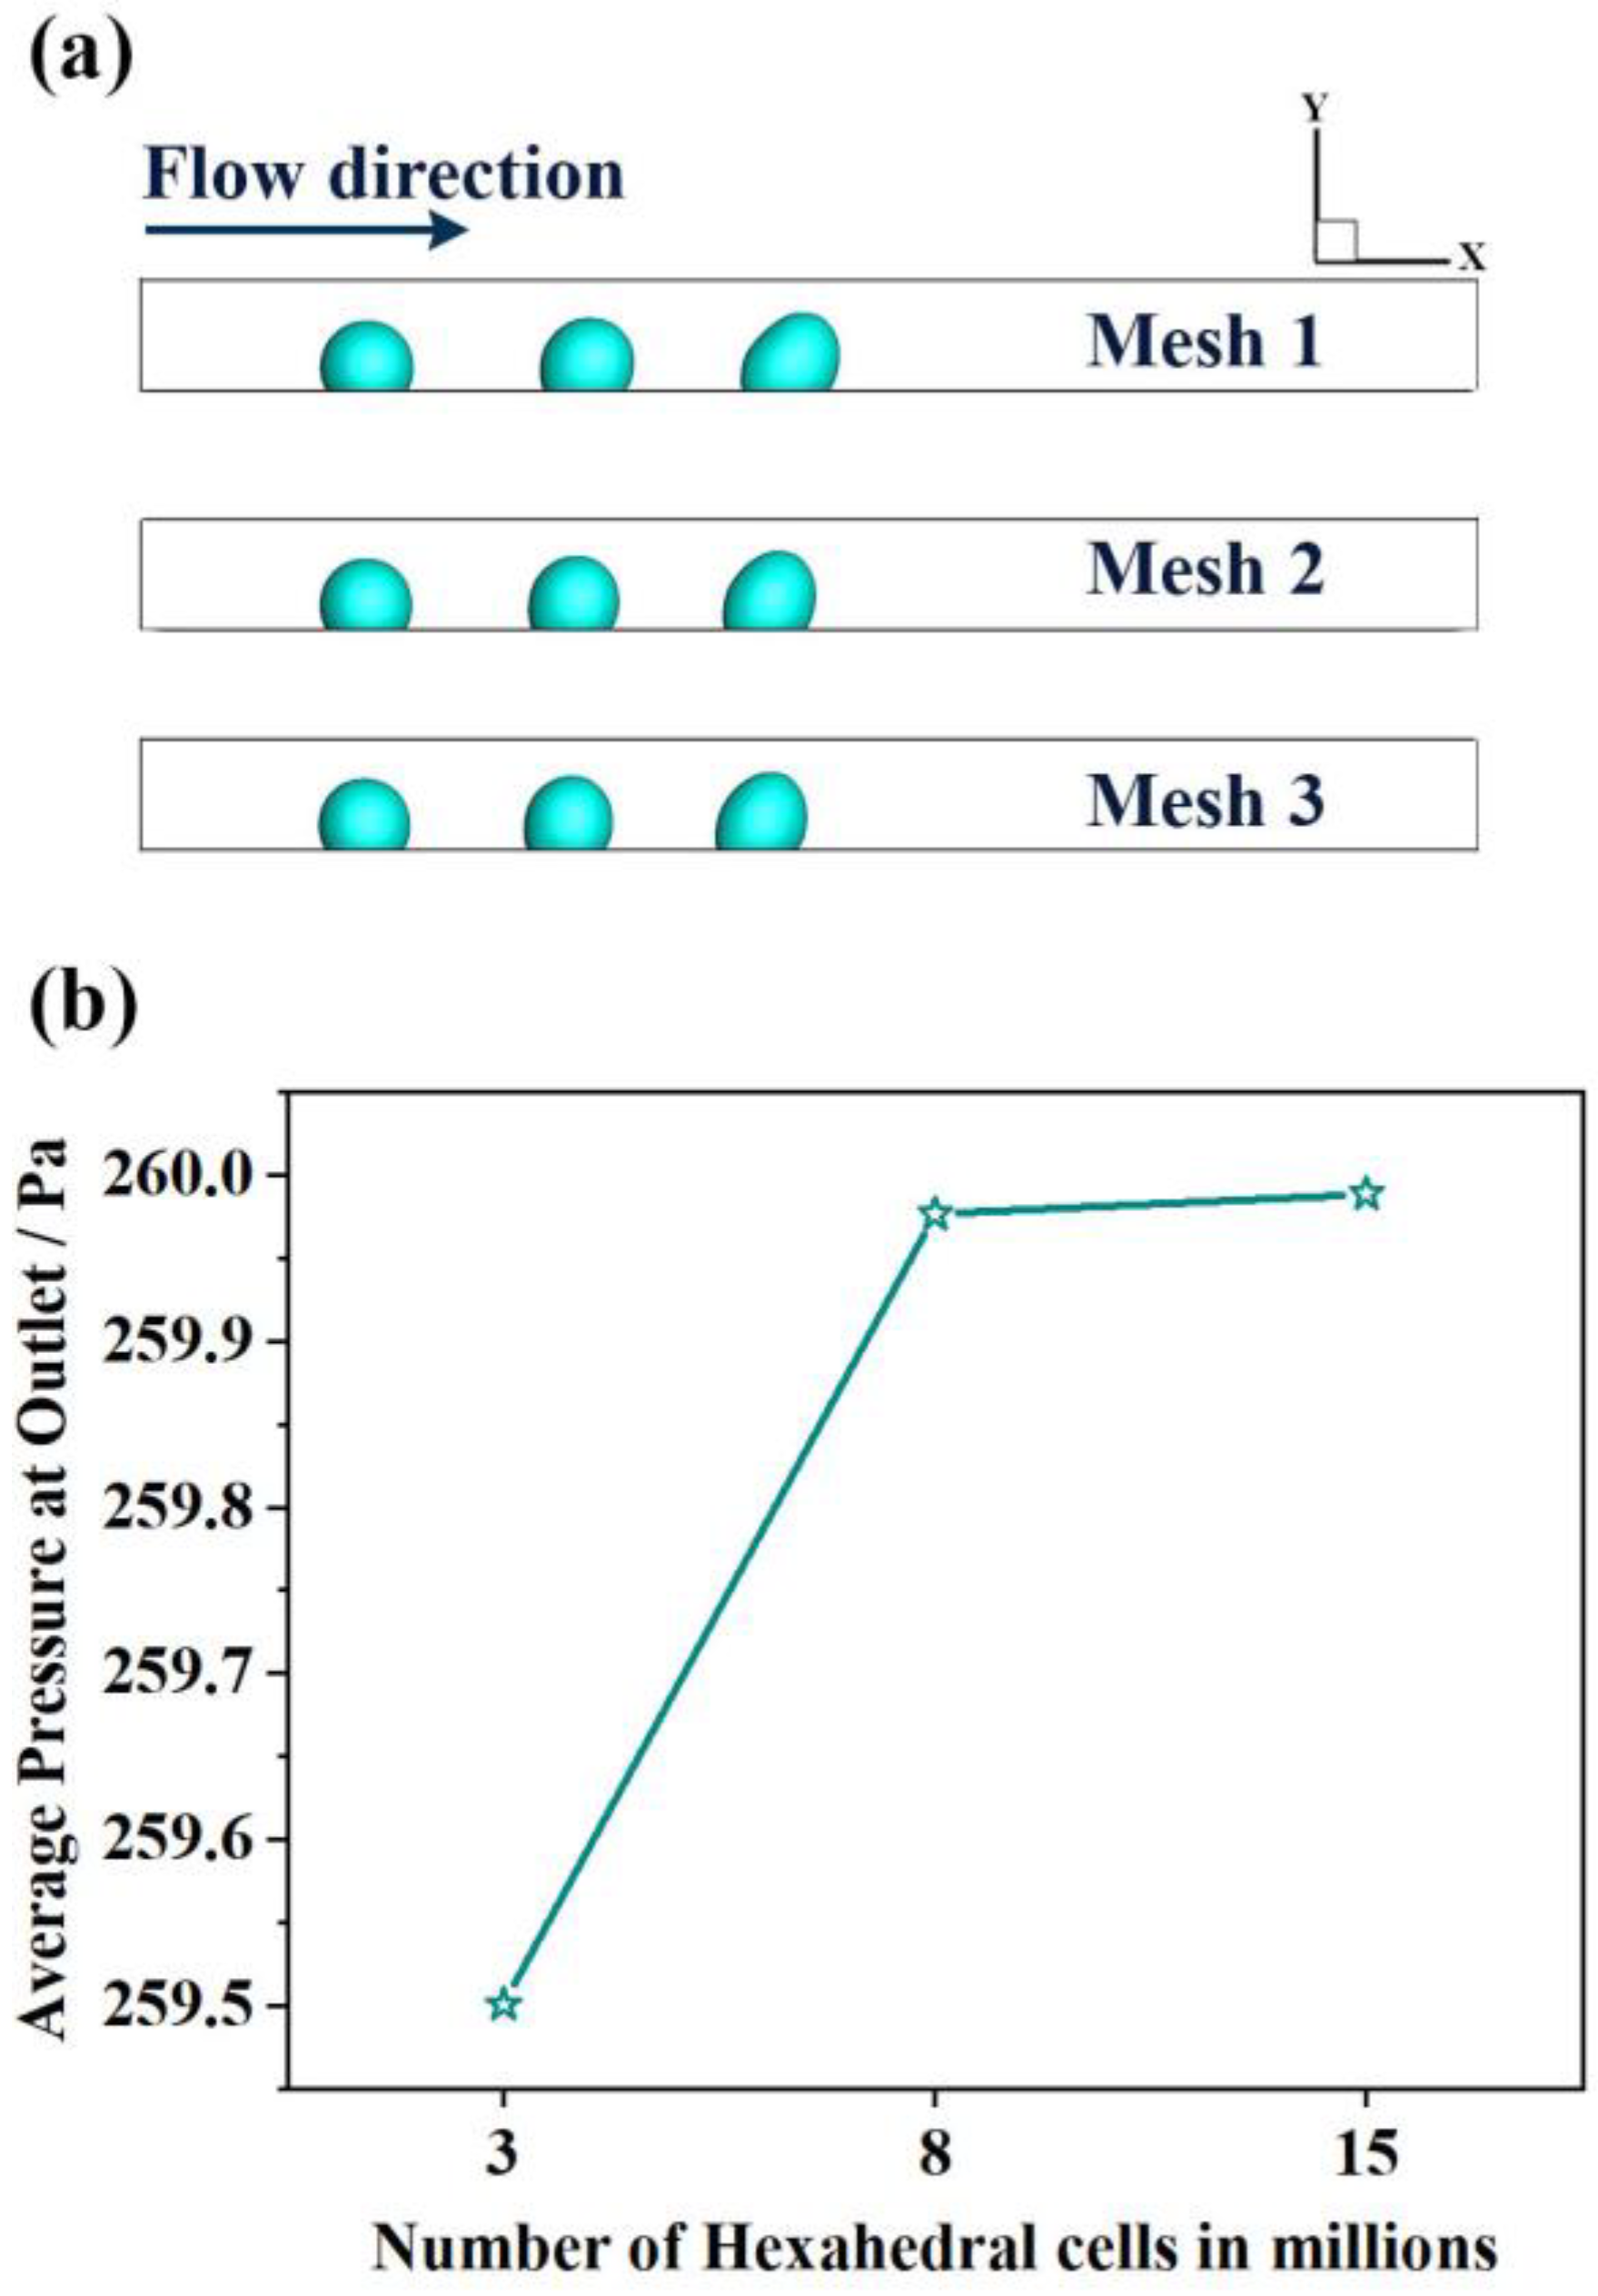
2.7. Model Validation and Grid Independence

The model used in this present work to evaluate the two-phase flow dynamics at the GDL-channel interface has been extensively validated in our group and details published [27]. To ensure accuracy of results, a stepwise approach of increasing the hexahedral grid number was adopted. This yielded three different hexahedral mesh sizes, as shown in Figure 4. Consequently, a grid and a time-step independence test have been carried out. Spatio-temporal position of the droplet and average pressure at channel outlet were the key metrics used to evaluate the grid independency test. Figure 4a shows the position of the droplet for different mesh numbers (e.g., 3 million in mesh 1, 8 million in mesh 2, 15 million in mesh 3), while Figure 4b shows the average pressure at channel outlet. Consequently, though the results of mesh 2 and mesh 3 are almost the same but to ensure the accuracy of the simulation results, mesh 3 was selected. In all cases, an adjustable time step size was used and sustained at 2 × 10⁻⁸ s.

3. Results and Discussion

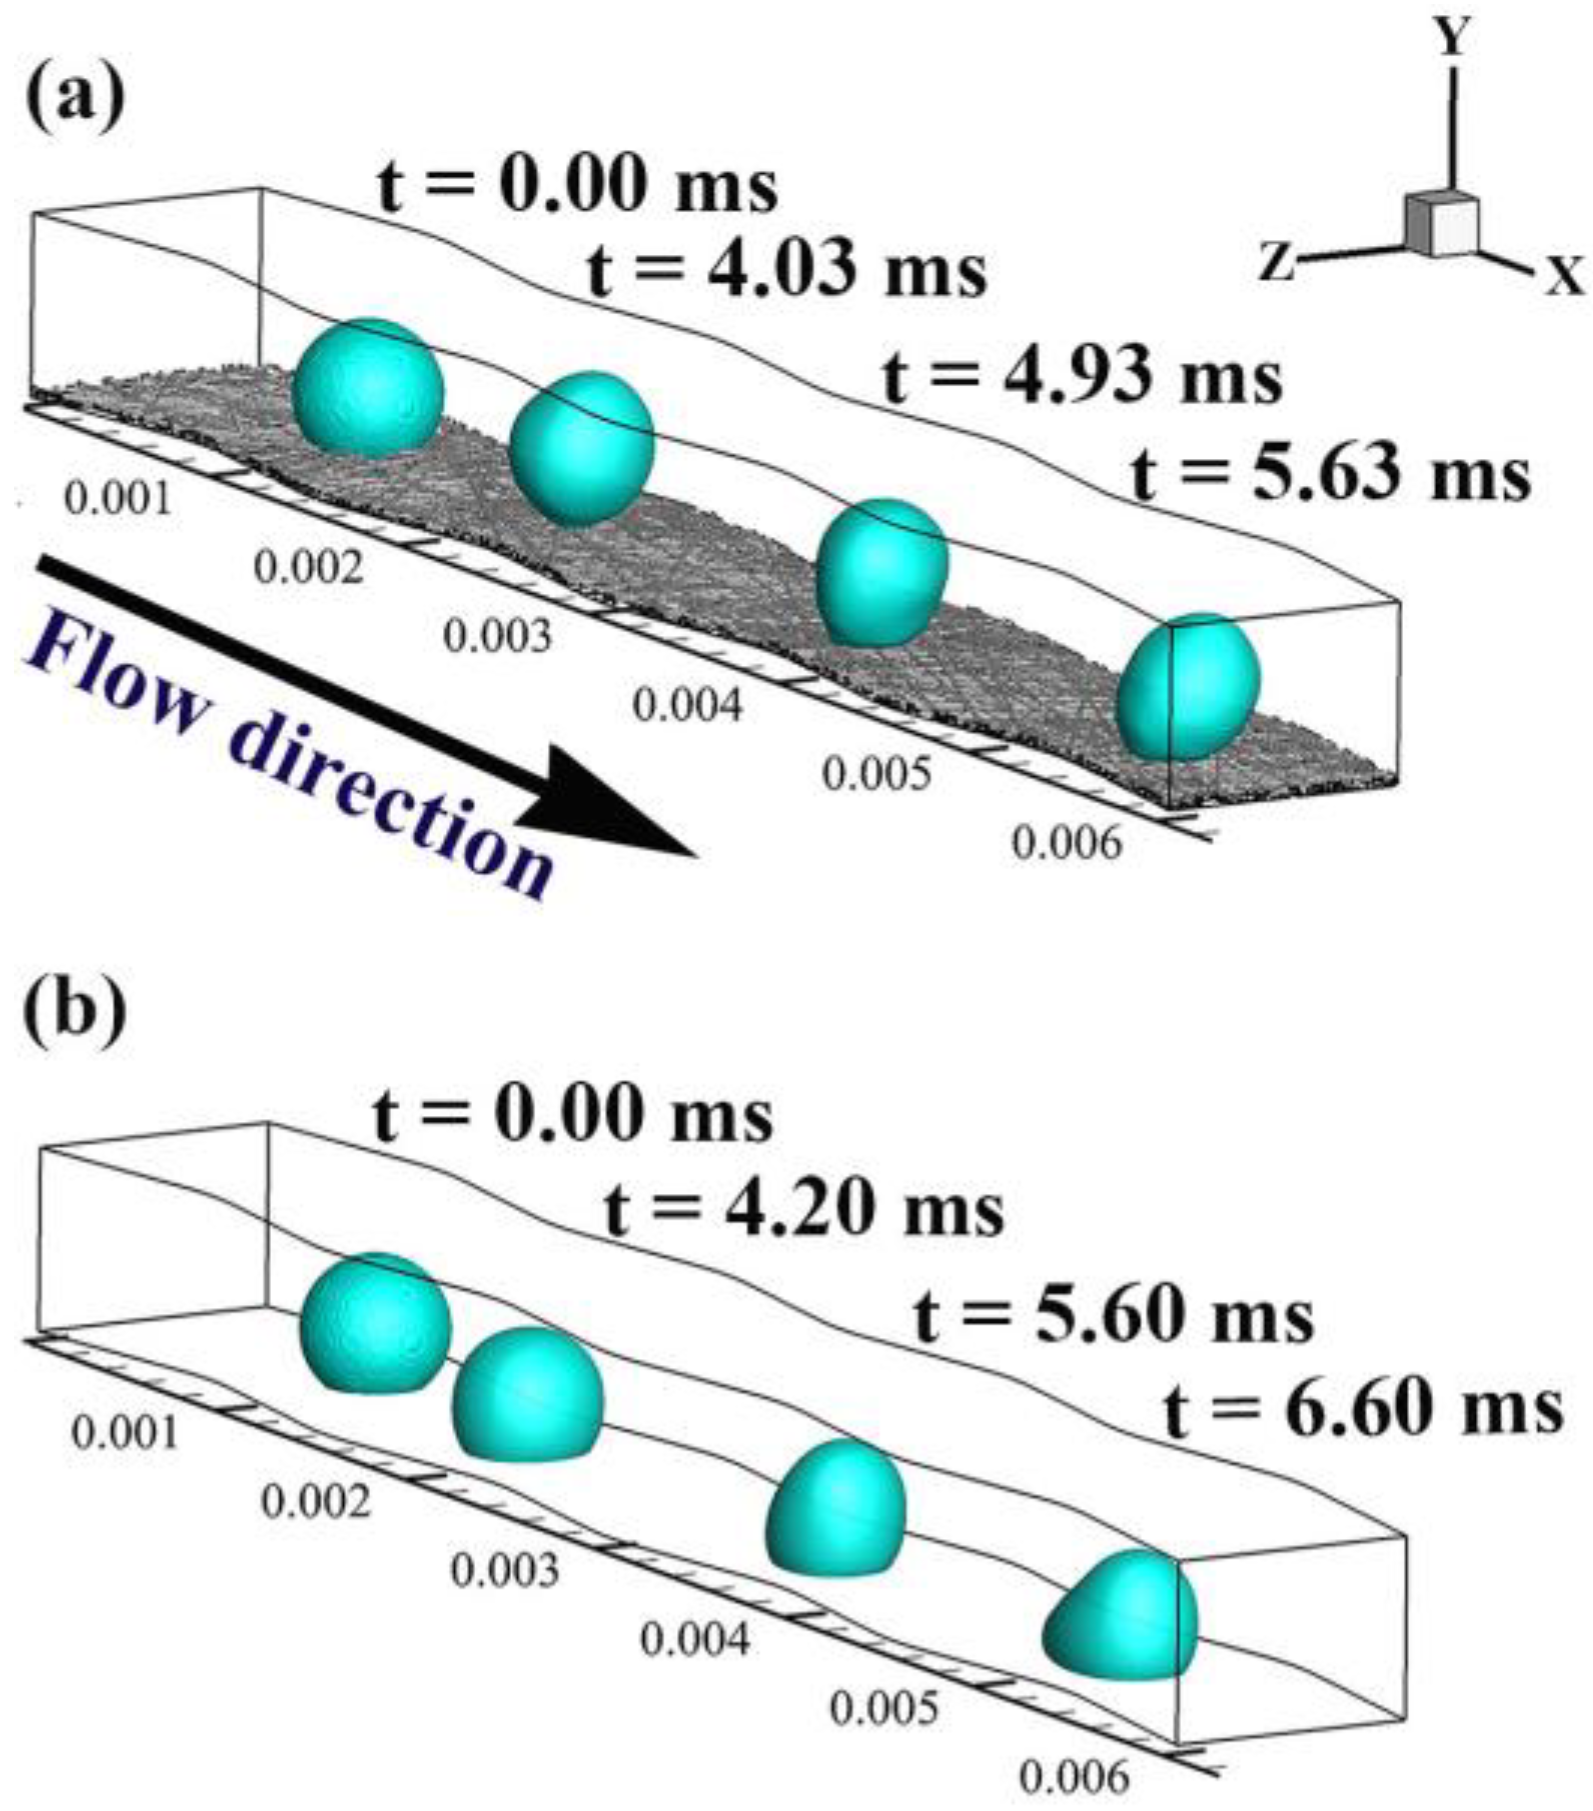
3.1. Comparative Check: Rough versus Smooth Surface

The dynamic droplet behavior in a wave-like channel with a smooth surface is compared to that in a rough surface channel (with the GDL microstructure patched on to the channel bottom). The static contact angle, nevertheless, is a quantitative measure of a liquid wetting a solid. Geometrically, it is defined as the angle created by a liquid at the boundary of three phases, where a liquid, gas and solid intersect. As such, under similar boundary and operating conditions, the droplet speed slightly increased on the GDL-channel interface with a fiber diameter of 9 µm, as shown in Figure 5. This is a stark reminder that the microstructural surface of GDLs tends to raise the contact angle between the liquid and rough surface [32,40]. This slight increase in surface contact angle is due to the porous nature of the GDL surface as there is a triple-phase of solid (fiber), liquid and gas (air pockets). The pores between the fibers tend to act as a means of trapping air, and these air pockets eventually help to increase the average speed of droplets. This agrees with the findings of Miwa et al. [40], where they asserted that there is a strong correlation between contact angle and surface structure.
Additionally, the adhesive force appears to be more dominant on the smooth surface with a smaller surface tension effect. As such, the droplet has a larger contact area with the surface with lower stress, whereas on the rough surface, the cohesive force is more dominant due to the composite nature of the surface. The composite nature of the surface raises the hydrophobicity of the rough surface. Therefore, the surface tension effect is more significant, with a reduced contact area and more substantial stress. These explain why the average droplet speed is higher on the rough surface compared to the smooth surface.

3.2. Analysis of Permeability

Previous studies have shown that parameters such as porosity, fiber diameter and thickness influence the permeability of porous microstructures [35,41]. Vallabh et al. 2010 [35] reported the correlation between fiber diameter and permeability. While the porosity of the same microstructure can remain constant, the permeability is influenced by fiber details such as the fiber diameter. As a result, the increase in fiber diameter increases the permeability of porous microstructures. In the light of this, there are certain relationships that have also helped to prove the relationship between fiber diameter and permeability. The Kozeny–Carman (KC) relationship and the Davies empirical relationship [42] have been used to model and predict this phenomenon.
The KC relation is given by
k = C ε 3 ( 1 ε ) 2
where ɛ, k, and C represents the porosity, permeability m2, and Kozeny–Carman constant m2, respectively. The KC constant is dependent on fiber diameter and the model is generally suitable if the GDL porosity change is assumed negligible [43].
The empirical model proposed by Davies is given as
k = R 2 ( 64 ( 1 ε ) 1.5 ( 1 + 56 ( 1 ε ) 3 ) ) 1
where R is radius of fiber and the empirical relation is most suitable in cases where the porosity is greater than 0.7 [35,42].
Results show that as the carbon fiber diameter increases, the permeability also increases linearly, as shown in Figure 5.
The trend shown in Figure 6 is similar to the relationship between Davies and KC, but with some differences in values. This difference can be attributed to some model-related assumptions. The KC relationship has been reported to be mostly inaccurate in predicting permeability in fibrous media, but useful within a narrow porosity range peculiar to granular porous media. In the meantime, Davies is best suited when porous media porosity is above 0.7. As such, the permeability values recorded in the present model can be attributed to the random orientation of the fiber and overlap during the reconstruction process. However, the figure shows that carbon fiber diameter also plays a significant role in GDLs and two-phase flow transport. A decrease in the fiber diameter leads to, as predicted, a decrease in the value of the permeability and an increase in overall resistance of the GDL. This agrees with the findings of [41].
Non-uniform fiber arrangement (unequal fiber diameter) is also f0ound to alter the permeability of the GDL-channel interface. This is also possible because, in fibrous porous media, the fiber diameter and orientation impact their morphology and topology. As such, the permeability of 4.325 × 10⁻¹² m2 and 4.31 × 10⁻¹² m2 was recorded for non-uniform (20:50:30) and non-uniform (50:30:20), respectively. This further highlights the possibility of manipulating the microstructural characteristics of GDL by means of artificial rearrangement. The higher the proportion of the larger fibers is, the higher the permeability. Thus, re-arrangement and unequally sized fibers would alter pore distribution and influence permeability. This indicates that permeability is not only a function of porosity, but also a function of fibrous arrangement. It is therefore possible to improve performance or reduce the same through GDL artificial manipulation.

3.3. Effect of Surface Structure

Figure 7 shows the spatio-temporal droplet positions of liquid water in-plane along the reconstructed GDL surface with different fiber diameters under similar operating conditions to that presented in Section 2.5. It demonstrates the droplet dynamics and speed with respect to time and highlights the different behaviors of droplet transport along the GDL surface with different fiber diameters. The size of the fiber diameter affects droplet behavior; hence, the finer the surface (reduced fiber diameter), the faster the average speed of the droplet (Figure 7a–c and Figure 8). This reduction in average droplet speed, especially if the fiber diameter is increased, is a result of the raised rough surface. Although roughness helps in hydrophobicity, the excessive increase in fiber diameter impedes water transport on the surface of GDL. As seen in Figure 8, there is at least a 0.19% and 1.44% reduction in x-component average droplet velocity, for increasing the fiber diameter from 8 µm to 9 µm and 15 µm, respectively. Furthermore, the droplet is purely driven by the pressure difference across the channel. The hysteresis reduces with an excessive increase in the size of the fiber due to reduced air pockets. As a result, since surface roughness increases hydrophobicity, excessive roughness drastically impedes droplet speed as the detachment speed drops. This is because the average droplet velocity depends on interconnectivity of the air-trapped pores.
Furthermore, a GDL microstructure having non-uniform fiber diameter (Figure 7d,e) was compared alongside the randomly-uniform GDL microstructure. The disproportionate amount of fibers having diameters 8, 9 and 10 µm is created in two different ratios of 20: 50:30 and 50:30:20. As shown in Figure 7f, the average speed of the droplet on the GDL surfaces with the non-uniform fiber diameter is quite comparable and similar to 9 µm fibrous surfaces under the same contact angle 105˚. This slight improvement, irrespective of some large-sized fibers which constitute the non-uniform microstructure, is as a result of the finer air pockets between the small 8 µm fibers; the lower the fiber diameter with increased proportion, the quicker the droplet detachment. Therefore, droplet behavior can be controlled via artificial microstructural manipulation of the GDL.

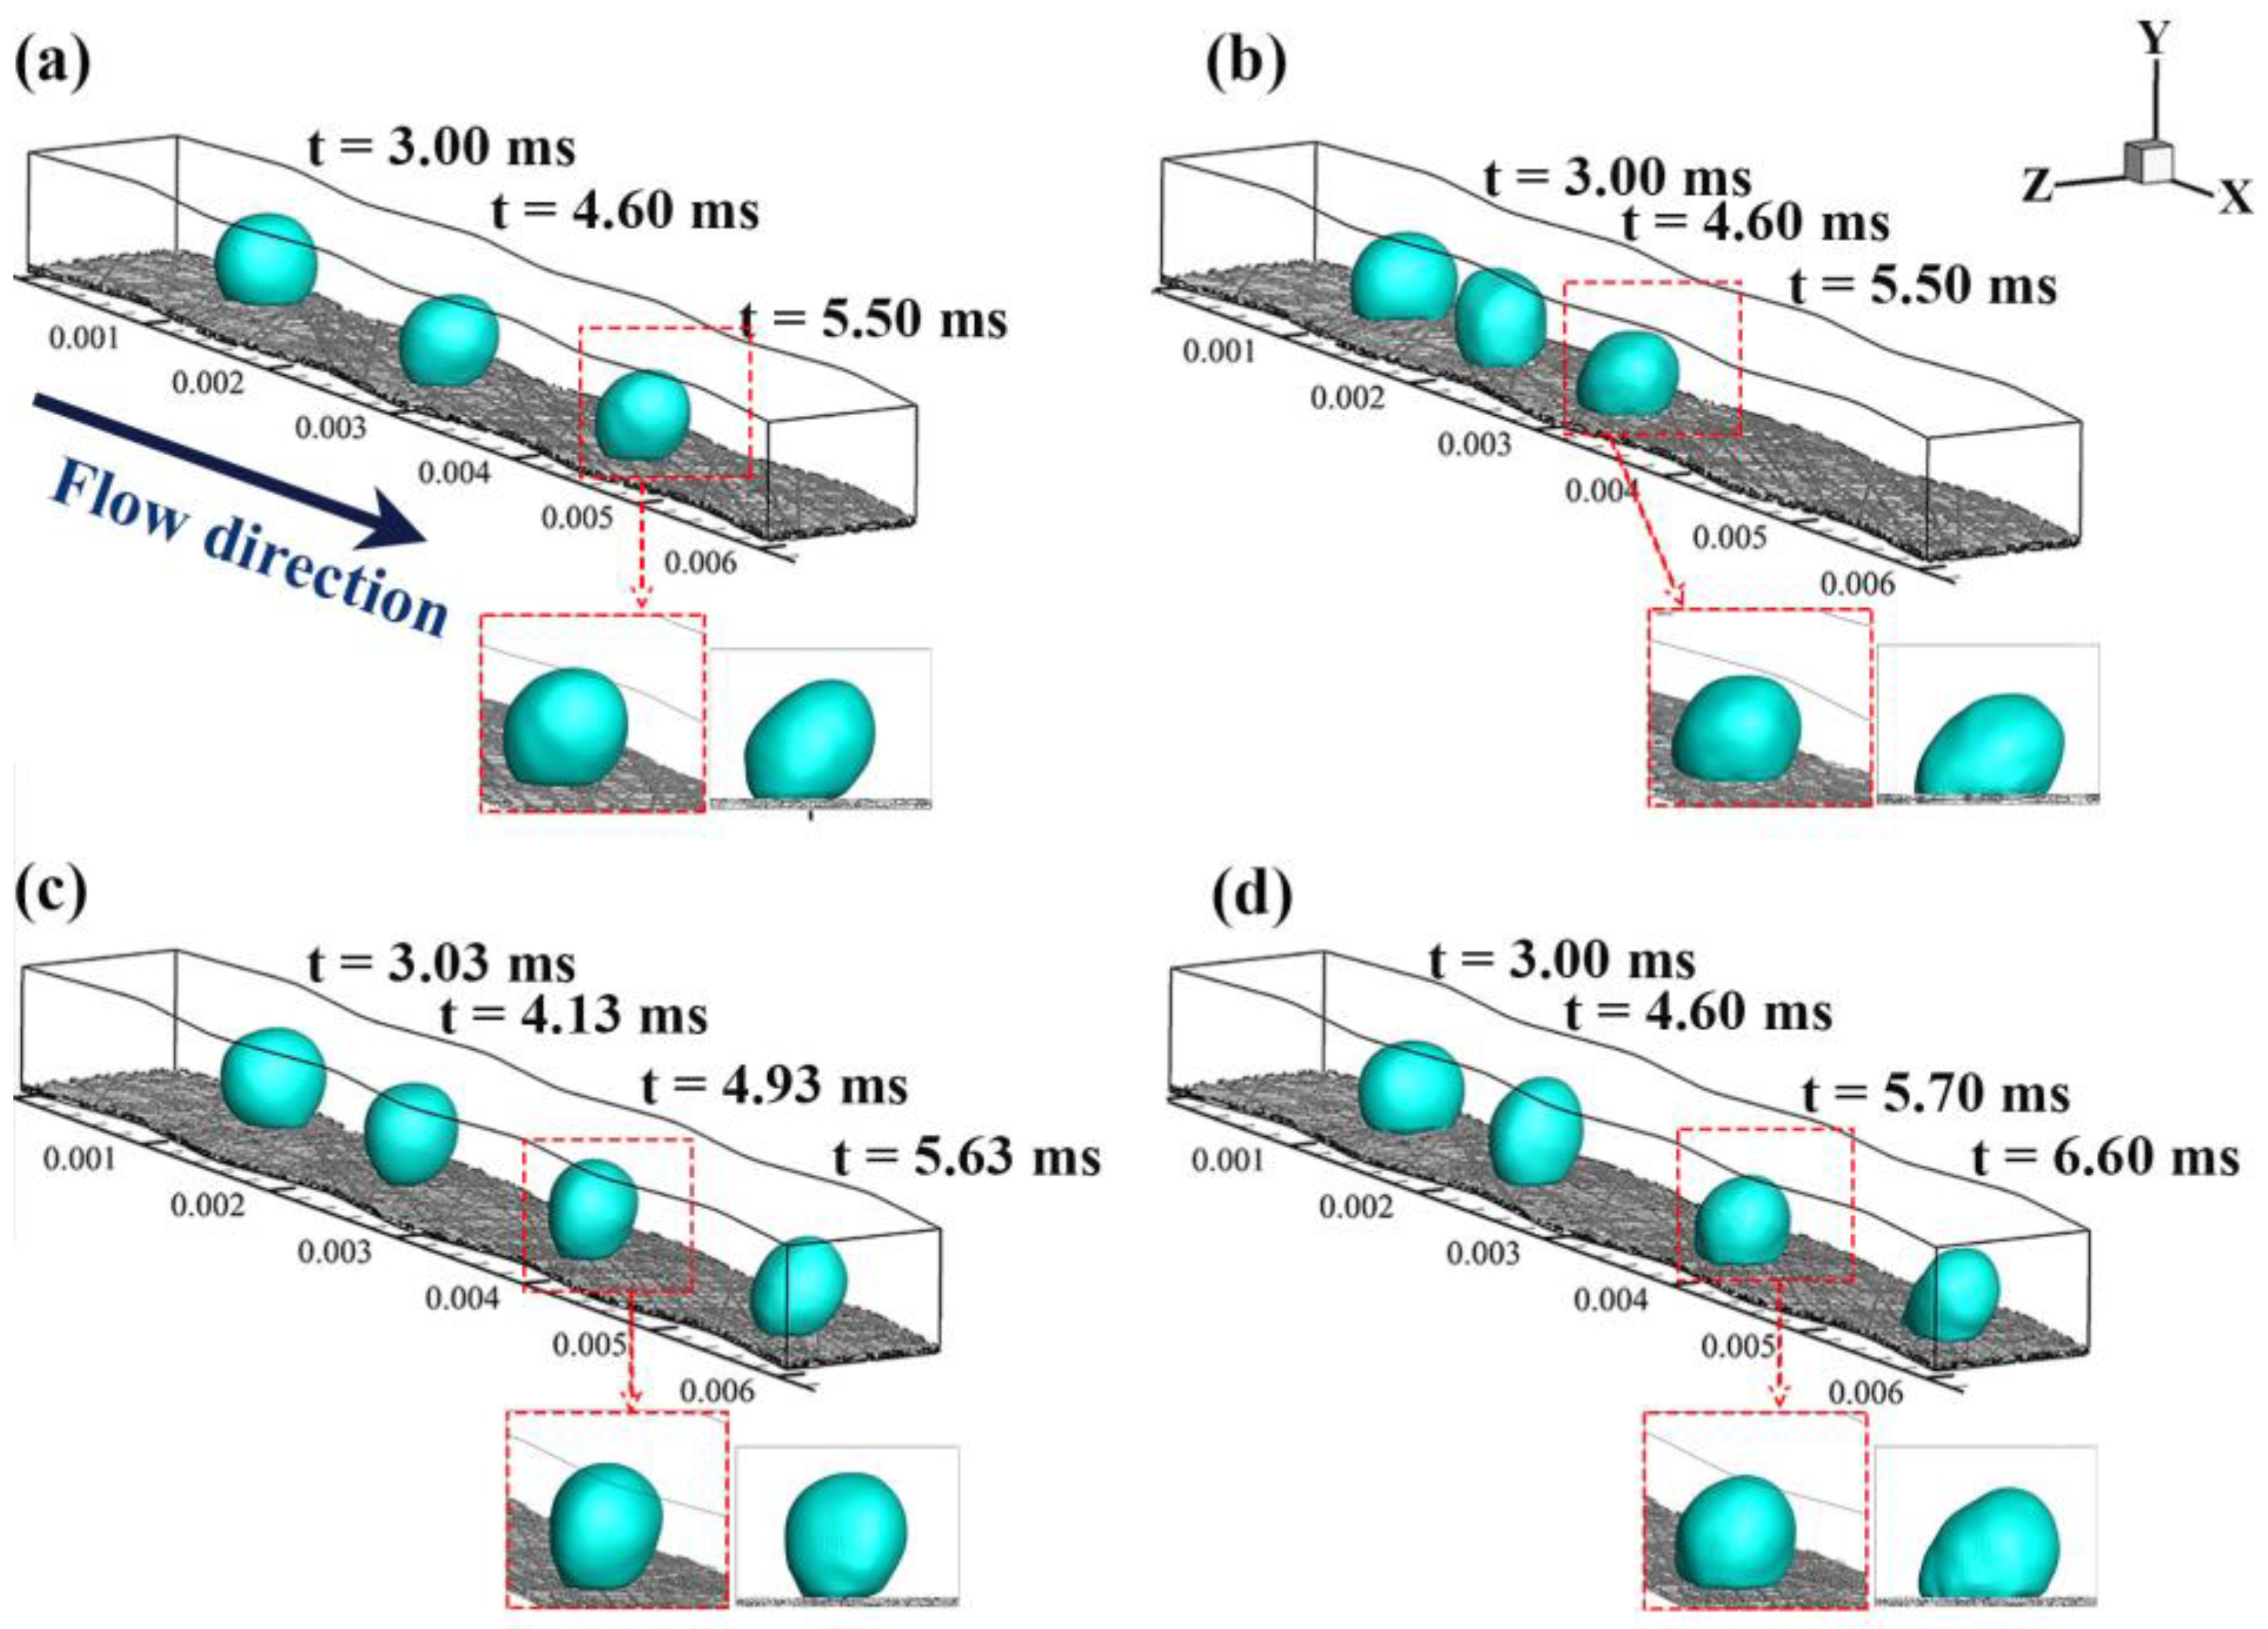
3.4. Effect of GDL Contact Angle

One of the most critical parameters in water management with application to PEMFC is the droplet contact angle on the GDL surface. They directly affect specific significant properties of the GDL microstructure with substantial effects on liquid water transport on the GDL surface. This section evaluates the contact angle effect concerning droplet average speed or removal rate. A comparative analysis is carried out to evaluate the droplet behavior on the GDL surface with fiber diameters 15 µm, under surface contact angles of 120˚ and 105˚, respectively (Figure 9a,b). A similar evaluation is conducted for a channel with the GDL surface of fiber diameters 9 µm, as shown in Figure 9c,d.
As seen in Figure 9, as much as roughness enhances hydrophobicity, excessive roughness adversely affects droplet speed [6,32]. The propagation of the droplet involves multi-scale forces such as external force and viscous stresses. The external forces, which include inertia and gravity, are seen to influence droplet speed greatly. Furthermore, it is clear as shown, that the higher the surface contact angle, the higher the surface tension. The resultant effect leads to quicker droplet motion on the GDL surface. It can also be seen how under reduced surface contact angle conditions the droplet contact area appears larger. This implies that as the GDL surface contact angle drops, the adhesive force becomes more influential, leading to average droplet speed reduction. Therefore, the GDL fiber diameter alongside the contact angle has a significant influence on the external forces acting on liquid water on the GDL-channel interface. Since at higher surface contact angle, the droplet average speed appears to be higher due to strengthened inertial forces, which are responsible for quick detachment and distortion. This distortion or oscillation contributes significantly to water transport at the interface between the GDL and channel.
Additionally, Figure 10 shows the temporal evolution of the droplet in the channel under different contact angles. As seen, the droplet contact area is smaller when the surface contact angle is high (Figure 10a). While under the reduced contact angle of 105˚ (Figure 10b), the droplet contact area is more substantial, which explains why the droplet appears more deformed in the forward direction, as shown in Figure 10b. This shows that as surface contact angle reduces, the adhesive force becomes much dominant and thus consequently a reducing droplet detachment rate. As a result, with an increase in the contact angle, the droplet advances with very little resistance.

3.5. Effect of Droplet Size

Further simulations were carried out to evaluate the effect droplet size has on the GDL surface as regards the droplet expulsion rate. To this end, under similar operating conditions as already stated in Section 2.5, two droplets with radius 200 and 150 µm, respectively, were patched on the GDL surface of the wave-like channels (Figure 11). Consequently, a large droplet size would lead to an increase in the average droplet speed. As such, as the droplet size increases, the imbalance between forces acting on the droplet surface rises correspondingly. The effect of this process is an increase in inertia and shear forces with improved detachment rate. This explains why an increase in size of droplets via coalescence has been reported to aid quicker droplet expulsion [44]. Consequently, this assertion is valid because fluid flow in channels is pressure-driven, and so the large droplet acquires more kinetic energy as a result of its size and degree of oscillation. As a result, these culminate in an increased average droplet speed.

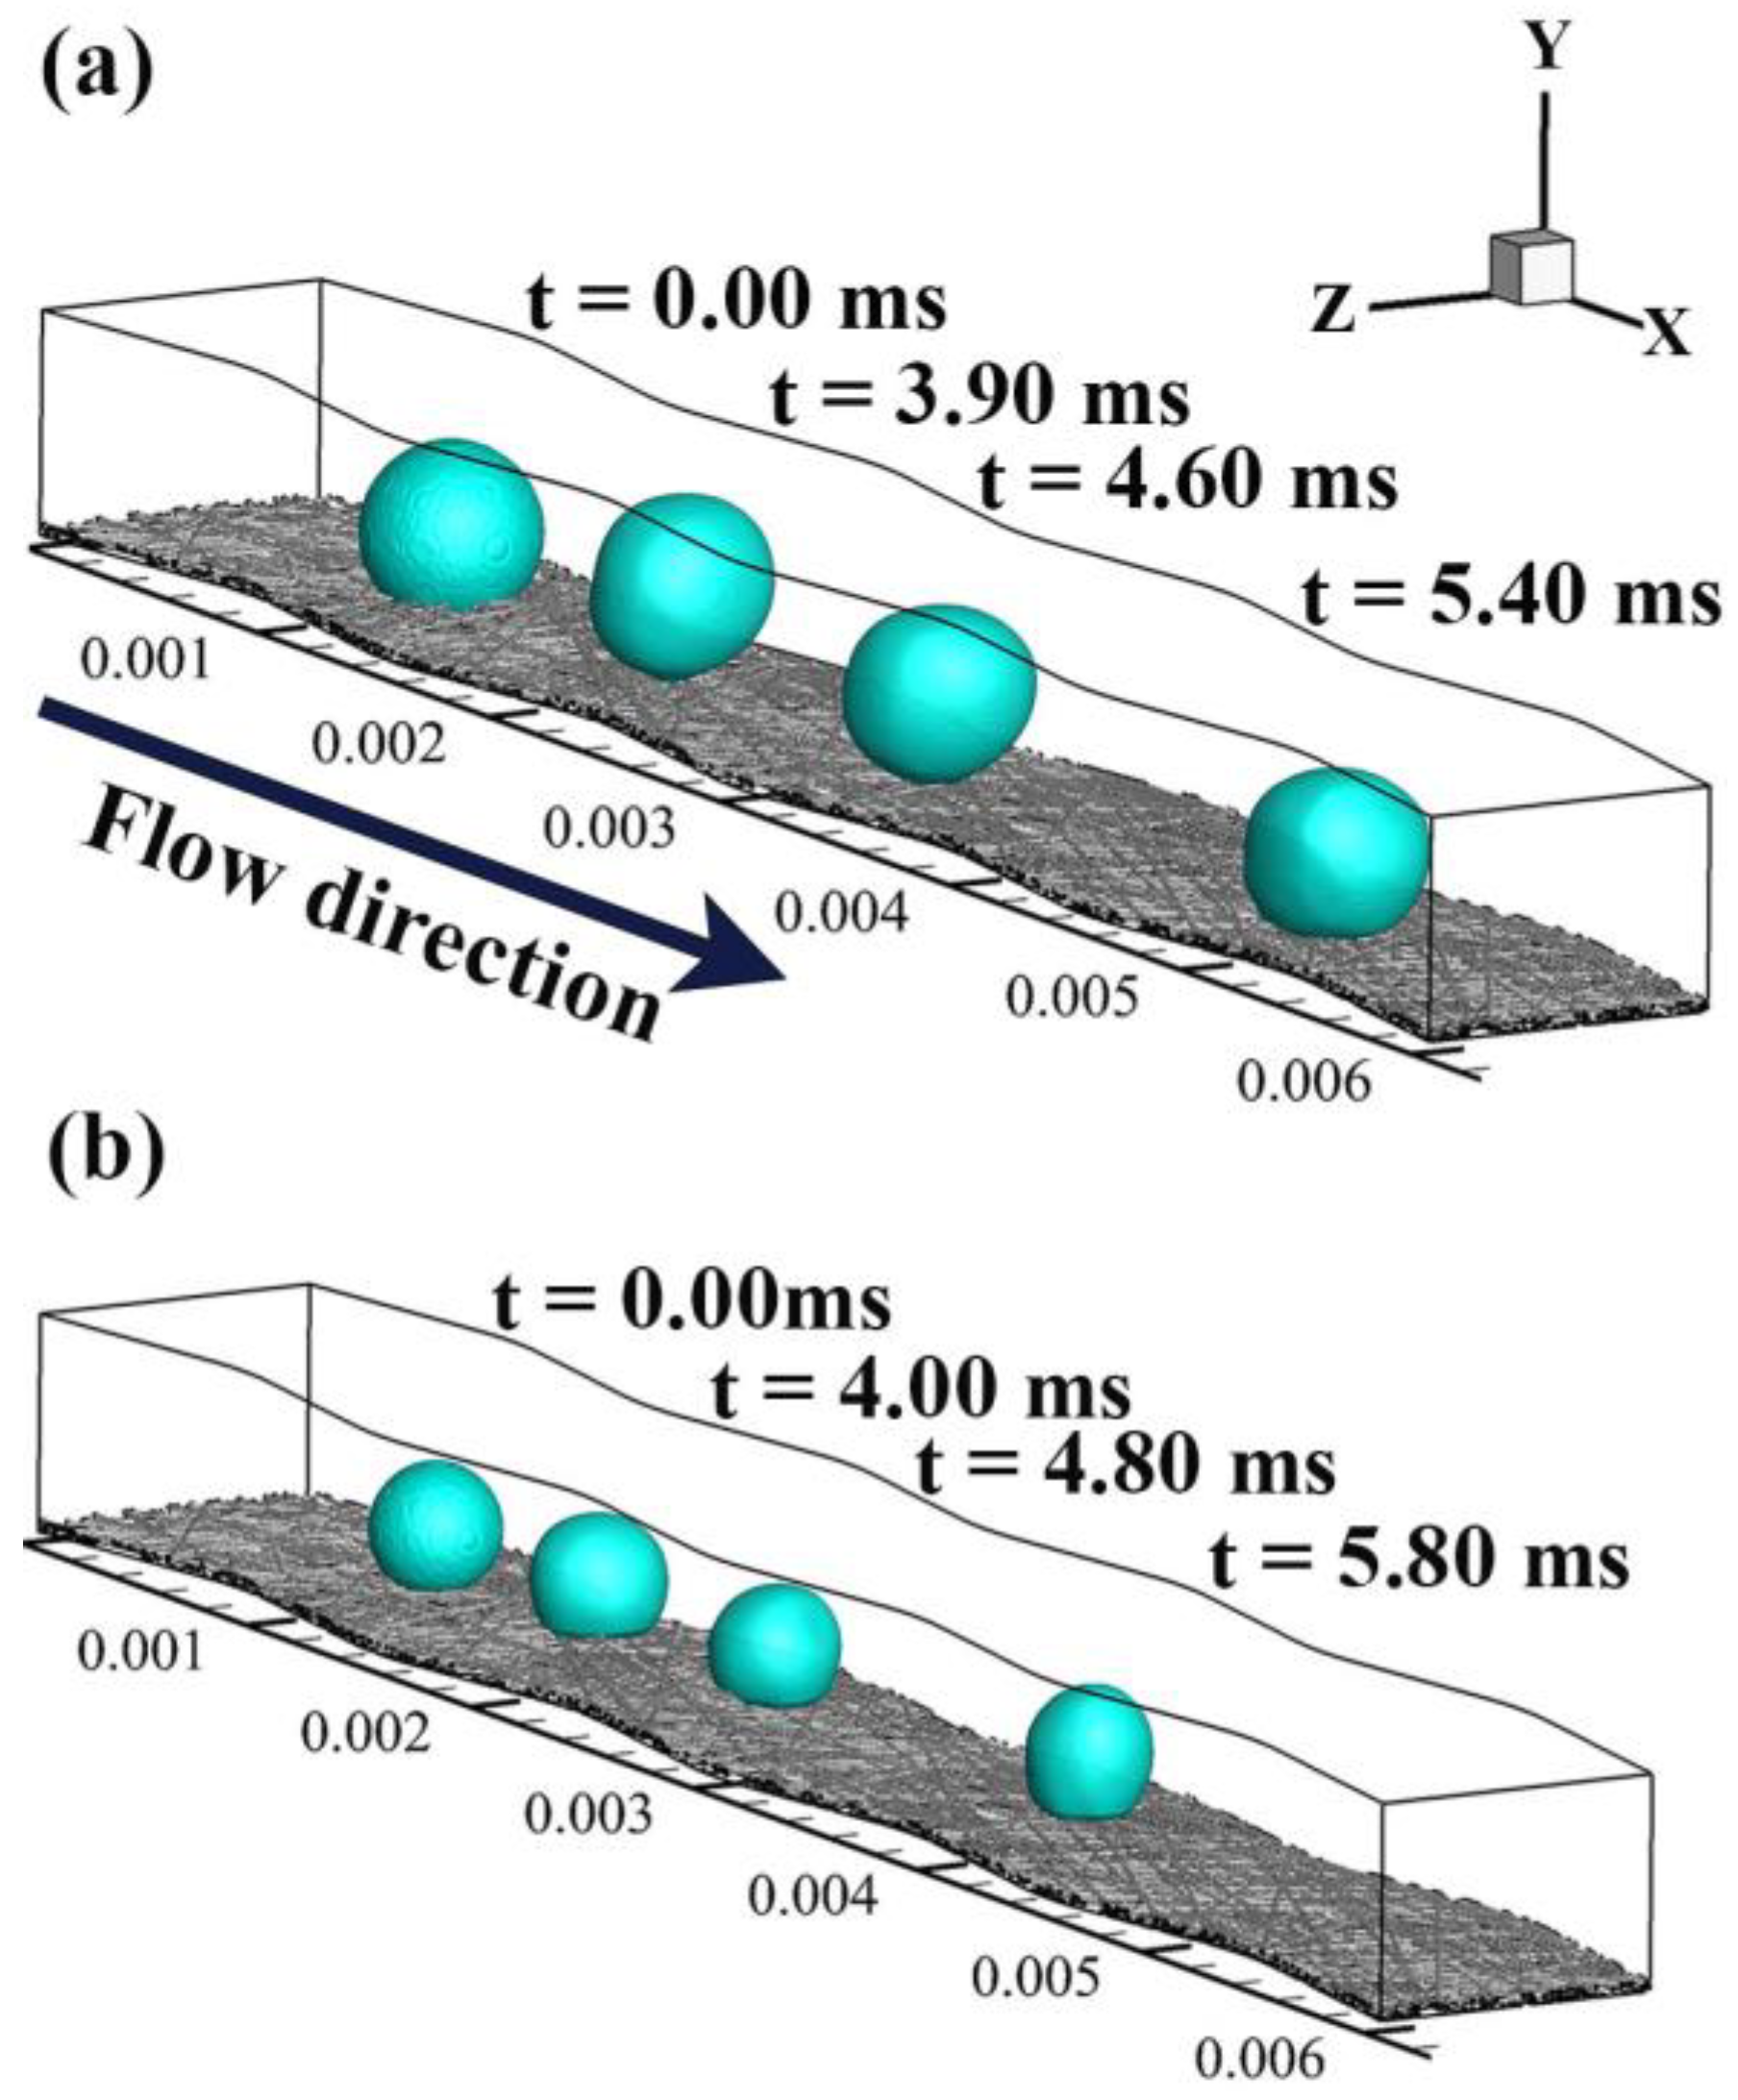
3.6. Effect of Superficial Velocity

In this section, the effects of the superficial inlet velocity are investigated. As illustrated in Figure 12, the average droplet speed reduces as the inlet gas velocity decreases, a phenomenon caused by decreased inertia. However, due to the nature of the GDL surface, under high inlet gas velocity conditions, the dominant force acting on the liquid water becomes inertial with increased air shear stress.
This heightened air shear stress is responsible for the slightly increased droplet mean size [32,44]. As such, the droplet expulsion rate would always be higher under high inlet gas velocity, which implies that liquid water transport on the GDL surface is a function of the inlet gas velocity [6]. While the drag force from the shear gas flow can quickly separate a water droplet from the GDL surface under high inlet gas velocity, a slightly lower inlet gas velocity can hardly detach the droplet from the GDL surface. Therefore, the viscous forces are more influential at lower inlet velocity [45]. This means that the influence of friction tends to be higher than the forces of inertia, slowing down droplet motion. Moreover, subsequently facilitating droplet predilection to the channel sidewall. As such, it would be beneficial if the sidewall contact angles are made highly hydrophilic, as this will enable complete droplet detachment off the GDL surface through the sidewalls to the top wall.

4. Conclusions

In the present study, a three-dimensional VOF model is used to analyze liquid water transport on the GDL-channel interface of a wave-like channel. The hydrophobic GDL microstructures with different fiber diameters and arrangements were reconstructed using the stochastic method and in-plane liquid water behavior on the reconstructed surfaces evaluated. It is found that the microstructural details of the GDL influence water behavior on the surface. Surface roughness depending on the fiber details (diameter) to an extent, influences fluid flow since it raises the hydrophobicity of the contact surface. This dynamic behavior of slightly increased hydrophobicity is a result of the composite nature of the microstructure caused by the solid, liquid and air. These trapped air pockets are generated by the air trapped inside the fiber pores. Consequently, the adhesive forces are more dominant on very smooth surfaces, while the cohesive forces are dominant on the rough surface. Superficial inlet velocity is also a critical determinant of droplet activity on the GDL-channel interface, as higher velocity favors droplet velocity through increased inertial forces that can destabilize and detach droplets on rough surfaces. Therefore, depending on the GDL-channel interface surface structure, the hysteresis reduces with an excessive increase in fiber diameter, which invariably reduces detachment rate and average droplet speed. As such, the smaller the fiber diameter, the higher the droplet acceleration rate. Results also show that there is a correlation between fiber diameter and permeability, and an increase in fiber diameter contributes to a corresponding increase in permeability. The low permeability associated with the smaller diameter fibrous surface also leads to the rapid motion of the droplet on the GDL-channel interface.
The surface contact angle has a noticeable effect on droplet acceleration, since an increase in surface contact angle can lead to an increase in the droplet surface tension. This positive phenomenon is responsible for the increased average speed of the droplet on the hydrophobic GDL surfaces. Finally, in order to improve water transport on GDLs, the choice of non-uniform fibrous structures would benefit water transport compared to uniform fibers with larger diameters. As a result, the GDL designs for enhanced transport of droplets would be improved with the choice of fibers with smaller diameters.

Author Contributions

Conceptualization, I.S.A.; data curation, I.S.A. and D.J.; investigation, I.S.A.; resources, Z.N. and K.J.; supervision, Z.L. and K.J.; validation, Z.N.; writing—original draft, I.S.A.; writing—review and editing, I.S.A., A.-U.-H.N., Z.L. and K.J. All authors have read and agreed to the published version of the manuscript.

Funding

This work is supported by the National Key Research and Development Program of China (2018YFB0105505), the China–UK International Cooperation and Exchange Project (Newton Advanced Fellowship) jointly supported by the National Natural Science Foundation of China (Grant No. 51861130359) and the UK Royal Society (Grant No. NAF/R1/180146), and the National Natural Science Foundation of Tianjin (China) for Distinguished Young Scholars (Grant No. 18JCJQJC46700).

Conflicts of Interest

The authors declare no conflict of interest.

List of Symbols

α g
Volume fraction of the gas phase
α l
Volume fraction of the liquid phase
CKozeny–Carman constant/m2
ɛPorosity
f s
Momentum source term linked to the surface tension effect/N
g
Gravitational acceleration vector/m s−2
kPermeability m2
κ
Mean surface curvature at the two-phase interface/m−1
μ
Dynamic viscosity of the interacting mixture/Pa s
n w
Unit normal vector to the wall
p d
Modified pressure/kPa
RRadius of fiber/µm
ρ
Averaged liquid phase density/kg m−3
σ
Surface tension coefficient/J s−1
t w
Unit normal tangential vector to the wall
θ
Static contact angle/˚
V
Velocity vector/m s−1
V g
Gas phase velocity vector/m s−1
V l
Liquid phase velocity vector/m s−1
V r
Relative velocity of both phases at interface/m s−1
x
Position vector/m

References

  1. Jin, D.; Ocone, R.; Jiao, K.; Xuan, J. Energy and AI. Energy AI 2020, 1, 100002. [Google Scholar] [CrossRef]
  2. Bejan, A. AI and freedom for evolution in energy science. Energy AI 2020, 1, 100001. [Google Scholar] [CrossRef]
  3. Zhang, X.; Higier, A.; Zhang, X.; Liu, H. Experimental studies of effect of land width in PEM fuel cells with serpentine flow field and carbon cloth. Energies 2019, 12, 471. [Google Scholar] [CrossRef] [Green Version]
  4. Hyun Kim, J.; Tae Kim, W. Numerical investigation of gas-liquid two-phase flow inside PEMFC gas channels with rectangular and trapezoidal cross sections. Energies 2018, 11, 1403. [Google Scholar]
  5. Ijaodola, O.; Ogungbemi, E.; Khatib, F.N.; Wilberforce, T.; Ramadan, M.; El Hassan, Z.; Thompson, J.; Olabi, A.G. Evaluating the effect of metal bipolar plate coating on the performance of proton exchange membrane fuel cells. Energies 2018, 11, 3203. [Google Scholar] [CrossRef] [Green Version]
  6. Mortazavi, M.; Tajiri, K. In-Plane Microstructure of Gas Diffusion Layers with Different Properties for PEFC. J. Fuel Cell Sci. Technol. 2014, 11, 1–9. [Google Scholar] [CrossRef] [Green Version]
  7. Benziger, J.N.; David, B.; Tom, B.; Johannah, I. Water flow in the gas diffusion layer of PEM fuel cells. J. Membr. Sci. 2005, 261, 98–106. [Google Scholar] [CrossRef]
  8. Fadzillah, D.M.; Rosli, M.I.; Talib, M.Z.M.; Kamarudin, S.K.; Daud, W.R.W. Review on microstructure modelling of a gas diffusion layer for proton exchange membrane fuel cells. Renew. Sustain. Energy Rev. 2016, 11, 235. [Google Scholar] [CrossRef]
  9. Park, J.W.; Jiao, K.; Li, X. Numerical investigations on liquid water removal from the porous gas diffusion layer by reactant flow. Appl. Energy 2010, 87, 2180–2186. [Google Scholar] [CrossRef]
  10. Froning, D.; Brinkmann, J.; Reimer, U.; Schmidt, V.; Lehnert, W.; Stolten, D. 3D analysis, modeling and simulation of transport processes in compressed fibrous microstructures, using the Lattice Boltzmann method. Electrochem. Acta 2013, 110, 325–334. [Google Scholar] [CrossRef] [Green Version]
  11. Vinh, N.D.; Kim, H.M. Comparison of numerical and experimental studies for flow-field optimization based on under-rib convection in polymer electrolyte membrane fuel cells. Energies 2016, 9, 844. [Google Scholar] [CrossRef] [Green Version]
  12. Shen, J.; Liu, Z.; Liu, F.; Liu, W. Numerical simulation of water transport in a proton exchange membrane fuel cell flow channel. Energies 2018, 11, 1770. [Google Scholar] [CrossRef] [Green Version]
  13. Kakaee, A.H.; Molaeimanesh, G.R.; Elyasi Garmaroudi, M.H. Impact of PTFE distribution across the GDL on the water droplet removal from a PEM fuel cell electrode containing binder. Int. J. Hydrog. Energy 2018, 43, 15481–15491. [Google Scholar] [CrossRef]
  14. Balzarotti, R.; Latorrata, S.; Mariani, M.; Gallo, S.P.; Dotelli, G. Optimization of Perfluoropolyether-Based Gas Diffusion Media Preparation for PEM Fuel Cells. Energies 2020, 13, 1831. [Google Scholar] [CrossRef] [Green Version]
  15. Niu, Z.; Bao, Z.; Wu, J.; Wang, Y.; Jiao, K. Two-phase flow in the mixed-wettability gas diffusion layer of proton exchange membrane fuel cells. Appl. Energy 2018, 232, 443–450. [Google Scholar] [CrossRef]
  16. Jeong, H.C.; Ki Tae, P.; Dong, H.J.; Sang, G.K.; Sung, H.K. Numerical modeling and experimental study of the influence of GDL properties on performance in a PEMFC. Int. J. Hydrog. Energy 2011, 36, 1837–1845. [Google Scholar]
  17. Niu, Z.; Wu, J.; Bao, Z.; Wang, Y.; Yin, Y.; Jiao, K. Two-phase flow and oxygen transport in the perforated gas diffusion layer of proton exchange membrane fuel cell. Int. J. Heat Mass Transf. 2019, 139, 58–68. [Google Scholar] [CrossRef] [Green Version]
  18. Yiotis, A.G.; Kainourgiakis, M.E.; Charalambopoulou, G.C.; Stubos, A.K. Microscale characterisation of stochastically reconstructed carbon fiber-based Gas Diffusion Layers; effects of anisotropy and resin content. J. Power Sources 2016, 320, 153–167. [Google Scholar] [CrossRef]
  19. Hwang, C.; Masayoshi, I.; Hiroshi, I.; Tetsuhiko, M.; Akihiro, N.; Yasuo, H.; Naoto, Y.; Atsushi, K.; Tetsuya, Y. Influence of properties of gas diffusion layers on the performance of polymer electrolyte-based unitized reversible fuel cells. Int. J. Hydrog. Energy 2011, 36, 1740–1753. [Google Scholar] [CrossRef] [Green Version]
  20. Hung, C.J.; Liu, C.H.; Ko, T.H.; Chen, W.H.; Cheng, S.H.; Chen, W.S.; Yu, A.; Kannan, A.M. Effect of diffusion layers fabricated with different fiber diameters on the performance of low temperature proton exchange membrane fuel cells. J. Power Sources 2013, 221, 134–140. [Google Scholar] [CrossRef]
  21. Shahraeeni, M.; Hoorfar, M. Pore-network modeling of liquid water flow in gas diffusion layers of proton exchange membrane fuel cells. Int. J. Hydrog. Energy 2014, 39, 10697–10709. [Google Scholar] [CrossRef]
  22. Agaesse, T.; Lamibrac, A.; Büchi, F.N.; Pauchet, J.; Prat, M. Validation of pore network simulations of ex-situ water distributions in a gas diffusion layer of proton exchange membrane fuel cells with X-ray tomographic images. J. Power Sources 2016, 331, 462–474. [Google Scholar] [CrossRef] [Green Version]
  23. Straubhaar, B.; Pauchet, J.; Prat, M. Pore network modeling of condensation in gas diffusion layers of proton exchange membrane fuel cells. Int. J. Heat Mass Transf. 2016, 102, 891–901. [Google Scholar] [CrossRef] [Green Version]
  24. Gao, Y.; Montana, A.; Chen, F. Evaluation of porosity and thickness on effective diffusivity in gas diffusion layer. J. Power Sources 2017, 342, 252–265. [Google Scholar] [CrossRef]
  25. Yin, Y.; Wu, T.; He, P.; Du, Q.; Jiao, K. Numerical simulation of two-phase cross flow in microstructure of gas diffusion layer with variable contact angle. Int. J. Hydrog. Energy 2014, 39, 15772–15785. [Google Scholar] [CrossRef]
  26. Ferreira, R.; Falcao, D.; Oliveria, V.; Pinto, A. Numerical simulations of two-phase flow in proton exchange membrane fuel cells using the volume of fluid method—A review. J. Power Sources 2015, 277, 329–342. [Google Scholar] [CrossRef]
  27. Niu, Z.; Wang, Y.; Jiao, K.; Wu, J. Two-Phase Flow Dynamics in the Gas Diffusion Layer of Proton Exchange Membrane Fuel Cells: Volume of Fluid Modeling and Comparison with Experiment. J. Electrochem. Soc. 2018, 165, F613–F620. [Google Scholar] [CrossRef]
  28. Niu, Z.; Jiao, K.; Wang, Y.; Du, Q.; Yin, Y. Numerical simulation of two-phase cross flow in the gas diffusion layer microstructure of proton exchange membrane fuel cells. Int. J. Energy Res. 2018, 42, 802–816. [Google Scholar] [CrossRef] [Green Version]
  29. He, G.; Yamazaki, Y.; Abudula, A. The effect of wall roughness on the liquid removal in micro-channels related to a proton exchange membrane fuel cell (PEMFC). J. Power Sources 2010, 195, 1561–1568. [Google Scholar] [CrossRef]
  30. Chen, L.; Luan, H.B.; He, Y.L.; Tao, W.Q. Effects of Roughness of Gas Diffusion Layer Surface on Liquid Water Transport in Micro Gas Channels of a Proton Exchange Membrane Fuel Cell. Numer. Heat Transf. Part A Appl. 2012, 62, 295–318. [Google Scholar] [CrossRef]
  31. Chen, L.; He, Y.L.; Tao, W.Q. Effects of surface microstructures of gas diffusion layer on water droplet dynamic behaviors in a micro gas channel of proton exchange membrane fuel cells. Int. J. Heat Mass Transf. 2013, 60, 252–262. [Google Scholar] [CrossRef]
  32. Ashrafi, M.; Shams, M. Effects of heterogeneous surface of gas diffusion layers on droplet transport in microchannels of PEM fuel cells. Int. J. Hydrog. Energy 2015, 41, 1–16. [Google Scholar] [CrossRef]
  33. Chen, S.; Doolen, G.D. Lattice Boltzmann method for fluid flows. Annu. Rev. Fluid Mech 1998, 30, 329–364. [Google Scholar] [CrossRef] [Green Version]
  34. Palakurthi, N.; Konangi, S.; Ghia, U.; Comer, K. Micro-scale simulation of unidirectional capillary transport of wetting liquid through 3D fibrous porous media: Estimation of effective pore radii. Int. J. Multiph. Flow 2015, 77, 48–57. [Google Scholar] [CrossRef]
  35. Vallabh, R.; Banks-Lee, P.; Seyam, A.F. New approach for determining tortuosity in fibrous Porous Media. J. Eng. Fibers Fabr. 2010, 5, 7–15. [Google Scholar] [CrossRef] [Green Version]
  36. Thiedmann, R.; Fleischer, F.; Hartnig, C.; Lehnert, W.; Schmidt, V. Stochastic 3d modeling of the gdl structure in pemfcs based on thin section detection. J. Electrochem. Soc. 2008, 155, B391–B399. [Google Scholar] [CrossRef]
  37. Flückiger, R.; Marone, F.; Stampanoni, M.; Wokaun, A.; Büchi, F.N. Investigation of liquid water in gas diffusion layers of polymer electrolyte fuel cells using X-ray tomographic microscopy. Electrochim. Acta 2011, 56, 2254–2262. [Google Scholar] [CrossRef]
  38. Zhou, X.; Niu, Z.; Li, Y.; Sun, X.; Du, Q.; Xuan, J.; Jiao, K. Investigation of two-phase flow in the compressed gas diffusion layer microstructures. Int. J. Hydrog. Energy 2019, 44, 26498–26516. [Google Scholar] [CrossRef]
  39. Anyanwu, I.S.; Hou, Y.; Xi, F.; Wang, X.; Yin, Y.; Du, Q.; Jiao, K. Comparative analysis of two-phase flow in sinusoidal channel of different geometric configurations with application to PEMFC. Int. J. Hydrog. Energy 2019, 44, 13807–13819. [Google Scholar] [CrossRef]
  40. Miwa, M.; Nakajima, A.; Fujishima, A.; Hashimoto, K.; Watanabe, T. Effects of the Surface Roughness on Sliding Angles of Water Droplets on Superhydrophobic Surfaces. Langmuir 2000, 16, 5754–5760. [Google Scholar] [CrossRef]
  41. Habibi, M.; Ruiz, E.; Lebrun, G.; Laperrie‘re, L. Effect of surface density and fiber length on the porosity and permeability of nonwoven flax reinforcement. Text. Res. J. 2018, 88, 1776–1787. [Google Scholar] [CrossRef]
  42. Davies, C.N. The Separation of Airborne Dust and Particles. Proc. Instit. Mech. Eng. Pt. B Manag. Eng. Manuf. 1953, 1, 185–231. [Google Scholar]
  43. Feser, J.P.; Prasad, A.K.; Advani, S.G. Experimental characterization of in-plane permeability of gas diffusion layers. J. Power Sources 2006, 162, 1226–1231. [Google Scholar] [CrossRef]
  44. Anyanwu, I.S.; Hou, Y.; Chen, W.; Pan, F.; Du, Q.; Xuan, J.; Jiao, K. Numerical investigation of liquid water transport dynamics in novel hybrid sinusoidal flow channel designs for PEMFC. Energies 2019, 12, 4031. [Google Scholar] [CrossRef] [Green Version]
  45. Bao, N.; Zhou, Y.; Jiao, K.; Yin, Y.; Du, Q.; Chen, J. Effect of Gas Diffusion Layer Deformation on Liquid Water Transport in Proton Exchange Membrane Fuel Cell. Eng. Appl. Comp. Fluid Mech. 2014, 8, 26–43. [Google Scholar]
Figure 1. Algorithmic approach employed in discretization of the GDL-channel domain.
Energies 13 02726 g001
Figure 2. GDL carbon paper micrographs. (a) Toray (TGP-H-060) image; (b) 3D reconstructed 8 µm fiber diameter; (c) 3D reconstructed 9 µm fiber diameter; (d) 3D reconstructed non-uniform fiber diameter.
Energies 13 02726 g002
Figure 3. Computational domain. (a) Boundary conditions; (b) reconstructed GDL microstructure patched to the channel bottom.
Energies 13 02726 g003
Figure 4. Grid independence validation test. (a) Spatio-temporal position of the droplet; (b) the average pressure at channel outlet for different mesh numbers.
Energies 13 02726 g004
Figure 5. Comparative evaluation of droplet temporal evolution on: (a) rough; (b) smooth GDL surface at a static contact angle of 120˚.
Energies 13 02726 g005
Figure 6. Comparison of the effect of fiber diameter on permeability using the KC relation, the Davies relation and the simulated result.
Energies 13 02726 g006
Figure 7. Surface structure effect with fiber diameters (a) 8 µm, (b) 9 µm, (c) 15 µm, (d) non-uniform (20:50:30) and (e) non-uniform (50:30:20). (f) Spatio-temporal droplet positions at different times (2.5 ms, 4.0 ms, 4.8 ms, and 5.5 ms, respectively) on X-Y plane.
Energies 13 02726 g007
Figure 8. Effect of GDL microstructural arrangement with different fiber diameter on the (a) average pressure across channel (b) X-component average velocity of the droplet inside channel.
Energies 13 02726 g008
Figure 9. GDL contact angle effect on the surface microstructure of fiber diameter (a) 15 µm at 120˚, (b) 15 µm at 105˚, (c) 9 µm at 120˚ and (d) 9 µm at 105˚ with their exploded top and X-Y side view, respectively.
Energies 13 02726 g009
Figure 10. Spatio-temporal droplet evolution on the GDL surface with a fiber diameter of 15 µm at contact angles of (a) 120˚ and (b) 105˚, respectively.
Energies 13 02726 g010
Figure 11. Temporal droplet evolution under similar operating conditions with different droplet sizes (a) 200 µm and (b) 150 µm.
Energies 13 02726 g011
Figure 12. Droplet temporal positions under different superficial inlet velocities (a) 10 m s−1 and (b) 5 m s−1, respectively.
Energies 13 02726 g012

