Article

Flow Boiling of Low-Pressure Water in Microchannels of Large Aspect Ratio

1
State Key Laboratory of Multiphase Flow in Power Engineering, Xi’an Jiaotong University, Xi’an 710049, China
2
Science and Technology on Solid State Laser Laboratory, The 11th Research Institute of China Electronics Technology Group Corporation, Beijing 100015, China
*
Author to whom correspondence should be addressed.
Energies 2020, 13(11), 2689; https://doi.org/10.3390/en13112689
Submission received: 7 February 2020 / Revised: 18 May 2020 / Accepted: 19 May 2020 / Published: 27 May 2020
(This article belongs to the Special Issue Engineering Modeling of Advanced Heat Transfer Problems)

Abstract

:
Flow boiling heat transfer in microchannels can provide a high cooling rate, while maintaining a uniform wall temperature, which has been extensively studied as an attractive solution for the thermal management of high-power electronics. The depth-to-width ratio of the microchannel is an important parameter, which not only determines the heat transfer area but also has dominant effect on the heat transfer mechanisms. In the present study, numerical simulations based on the volume of fraction models are performed on the flow boiling in very deep microchannels. The effects of the depth-to-width ratio on the heat transfer coefficient and pressure drop are discussed. The bubble behavior and heat transfer characteristics are analyzed to explain the mechanism of heat transfer enhancement. The results show the very deep microchannels can effectively enhance the heat transfer, lower the temperature rise and show promising applications in the thermal management of high-power electronics.

Graphical Abstract

1. Introduction

With the rapid development of the microelectronic technology, the size of electronic devices has been downscaled intensively and integrated with billions of transistors, and the resulting high-power dissipation and the excessive temperature can cause a rapid deterioration in reliability. Microchannel heat sinks offer several prospective advantages, including compact size, low weight, and high cooling performance. [1] The flow boiling in microchannels shows a promising heat transfer capacity for the thermal management of high-power electronic devices [2]. However, flow instabilities, reversed flow and dryout phenomenon in microchannels lead to undesirable characteristics such as flow rate oscillations, high pressure drop and temperature oscillations. Microchannel heat sinks still need to be optimized for improved heat transfer performance.
A number of numerical and experimental studies have been reported on the heat transfer characteristics of microchannel heat sinks. Salimpour et al. [3] performed the geometric optimization of microchannel heat sinks with rectangular, elliptic, and isosceles triangular cross-sections. They found that microchannels with triangular cross-sections showed worse performance than that with rectangular or elliptic cross-sections. Kalaivanan and Rathnasamy [4] experimentally studied the laminar forced convection through rectangular microchannels with two types of channel structures using ethanol, methanol and an ethanol–methanol mixture as working fluids. The heat transfer coefficient and Nusselt number were evaluated based on the temperature distribution. Lorenzini and Joshi [5] simulated the two-phase flow boiling in microchannels with non-uniform heat flux using water as working fluid. They found that three parameters, including saturation pressure, subcooling and flow arrangement, played vital roles in the cooling performance. Dharaiya and Kandlikar [6] conducted numerical simulations of microchannels with aspect ratios ranging from 0.1 to 10. They proposed the correlations for Nusselt number as a function of channel aspect ratio for both developing and fully developed laminar flows, providing useful guidelines and information for the design and optimization of microchannel heat sinks. Rui et al. [7] showed that the thermal resistance of single-phase flow in microchannel heat sinks with liquid metal was relatively lower compared to that of water. They concluded that liquid metal could be a better working fluid than water, but it had a slightly higher pressure drop. In the study by Lee and Mudawar [8], it was found that the two-phase heat transfer in microchannels strongly depended on the mass flow rate. By dividing the mass flow rate into three regions of high, medium and low flow rates, they found that predictions of the heat transfer coefficient became more accurate.
The aforementioned studies indicate that the structure and dimension of rectangular microchannels play an important role in heat transfer characteristics. Methods such as adding obstructions and opening holes in the sidewalls of channels are effective ways to improve the cooling performance. Deng et al. [9] numerically investigated the thermal resistance, pressure drop and pumping power of heat sinks with double-layered microchannels for high-power microelectronic devices, and proposed to use the double-layered microchannels with a rectangular shape for optimum cooling performance. Jing and He [10] proposed a heat sink with staggered double-layer microchannels, and their simulations demonstrated that the offset in width direction between the two layers of microchannel could improve the thermal performance of double-layered microchannel heat sinks with a small channel aspect ratio and a large vertical rib thickness. Xie et al. [11] numerically investigated the cooling performance of microchannel heat sinks with multistage bifurcations in the laminar flow regime. They found that the cooling performance of the microchannel heat sinks with multistage bifurcation flow was better than that of the straight microchannel heat sink, and proposed that the maximum number of stages of bifurcations is 2. Xie et al. [12] further studied the influence of rectangular-shaped flow obstructions on the laminar flow and heat transfer characteristics of microchannel heat sink using a CFD model. They reported that the obstructions placed in the micro-channel heat sink could improve the cooling performance. Hung et al. [13] investigated the hydraulic and thermal performance of the porous microchannel heat sinks with various configuration designs. They concluded that the sandwich distribution design provided the best performance where both the cooling performance and pressure drop were concerned. Lin et al. [14] studied the optimization of a water-cooled, silicon-based double-layer microchannel heat sink using the thermal resistance network analysis. The parameters, including channel number, bottom channel height, vertical rib width, and thicknesses of two horizontal ribs, were optimized.
Compared to the above techniques, increasing the aspect ratio is a promising and simple method to enhance the cooling performance of microchannel heat sinks. Naphon and Khonseur [15] experimentally studied the heat transfer characteristics and pressure drop in the air-cooling micro-channel heat sinks, and proposed that the aspect ratio of channels has significant effects on the enhancement of heat transfer. Husain and Kim [16] investigated the influence of a large aspect ratio on the heat transfer performance for microchannels using single-phase water as cooling medium, and obtained the optimal aspect ratio under specific operating conditions. The optimum aspect ratio obtained was in the range of 3.7–4.1 for the microchannel with the length of 10 mm. Raghuraman et al. [17] carried out experiments to investigate the heat transfer characteristics of the high aspect ratio microchannel heat sinks using TiO2-water nanofluids. The results showed using 0.3% TiO2-water nanofluids could achieve 18% lower thermal resistance. Raghuraman et al. [18] further studied the heat transfer enhancement of the single-phase flow for aspect ratios up to 46.66 of rectangular micro channel heat sinks. They reported that the excessive channel height caused a lower heat removal rate and higher pressure drop. Xie et al. [19] presented simulations of the single-phase laminar flow in minichannel heat sinks using water as a coolant. They found that a narrow and deep channel with relatively thin channel wall improved heat transfer.
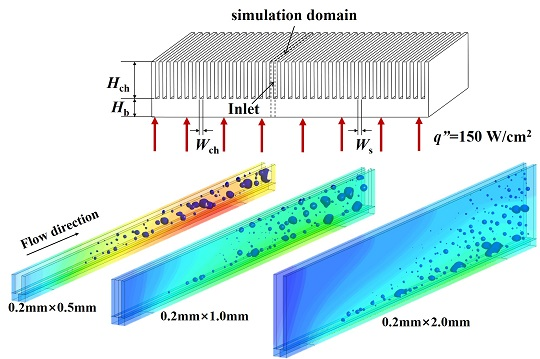
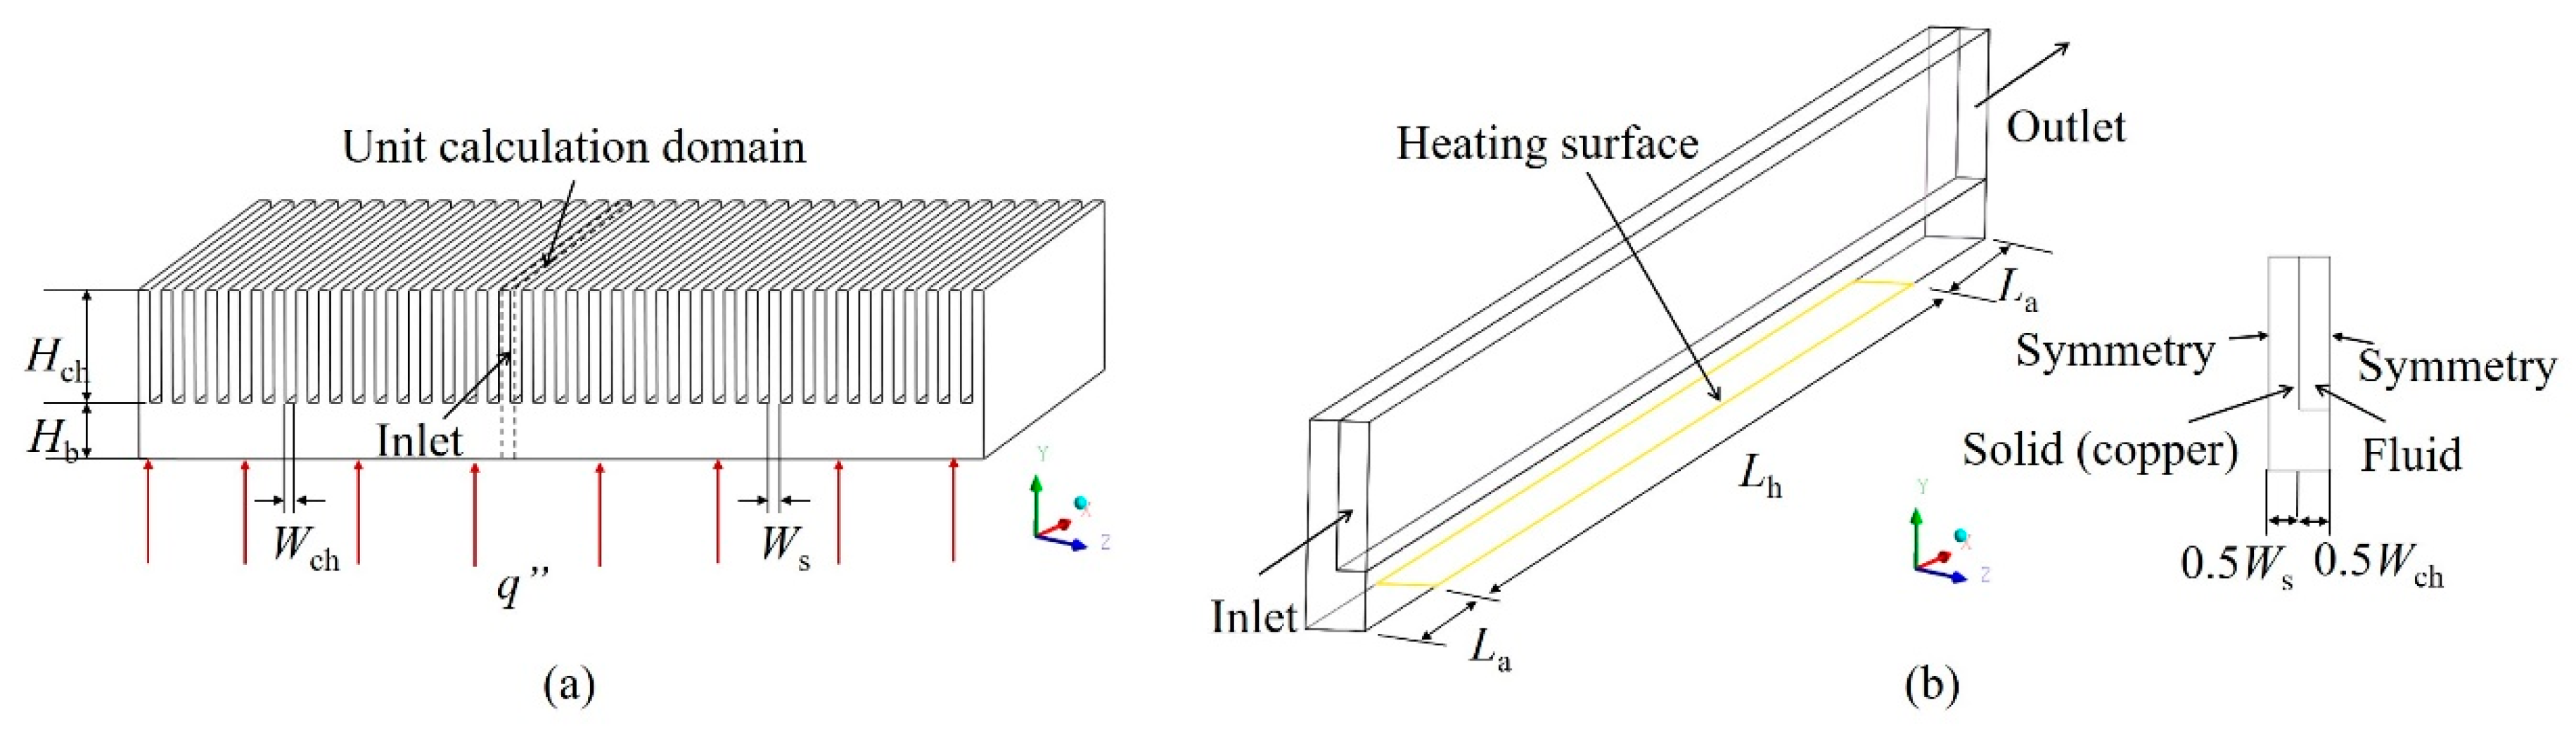
The previous works have been reported concerning the enhancement of heat transfer performance by structural optimization. It has been demonstrated that the dimensions play a vital role in heat transfer enhancement. However, the majority of previous studies on the microchannel heat sinks of large aspect ratio focus on the single-phase flow, and the heat transfer characteristics of two-phase flow in very-deep microchannels remain unclear. Meanwhile, the bubble behavior and heat transfer characteristics are rarely integrated to explain the mechanism of heat transfer enhancement in the literature. The nucleation and evolution of bubbles may depend on the aspect ratio of microchannel. The knowledge of bubble dynamics in large aspect ratio is still insufficient. In present study, numerical simulations are performed to illustrate the flow boiling and bubble behaviors in the very deep microchannel. The effects of channel height and width with depth-to-width ratio up to 10 on two-phase flow heat transfer characteristics are discussed. These results demonstrate the advantages of very deep microchannel heat sinks for applications of the thermal management of high-power electronics.

2. Numerical Methodology

2.1. Governing Equations

The CFD simulations of flow boiling in microchannels have been performed using a 3D volume of fluid (VOF) model coupled with Lee’s phase-change model. For each control volume of the computational domain, the sum of the volume fraction of all phases is unity. The properties and variables of each control volume are averaged by the volume fraction of each phase. For the two-phase flow in the microchannel, the continuity equations for the vapor phase and the liquid phase are as follows
δ δ t ( α v ρ v ) + ( α v ρ v v ) = S v
δ δ t ( α l ρ l ) + ( α l ρ l v ) = S l
where α v ,   α l , ρ v , and ρ l represent the volume fractions and densities of vapor and liquid phase respectively. S v and S l are the volume mass transfer rates due to condensation and evaporation, respectively.
The VOF model solves a set of momentum equations, for which the velocity field is shared by all phases within the domain.
δ δ t ( ρ v ) + ( ρ v v ) = P + [ μ ( v + v T ) ] + ρ g + F
The energy equation considers the phase change energy as follows
δ δ t ( ρ E ) + [ v ( ρ E + P ) ] = ( k T ) + S e
where the energy E is
E = α l ρ l E l + α v ρ v E v α l ρ l + α v ρ v
The effects of gravity and surface tension are also considered. Gravity is set as the volumetric force in the momentum equation. The continuous surface force model (CSF model) proposed by Brackbill et al. [20] is used. In the CSF model, the surface tension effect is implemented as the source term in the momentum equation to the VOF model, where the forces normal to the interface are considered. The pressure drop across the interface is dependent upon the surface tension coefficient and the surface curvature measured by the two radii in the orthogonal directions [21]
P 2 P 1 = σ ( 1 R 1 + 1 R 2 )
where P1 and P2 are the pressures in the two phases on either side of the interface and σ is the surface tension coefficient. The surface curvature in the CSF model is computed based on the local gradients in the surface normal, where the surface normal n v is defined as the gradient of the vapor volume fraction
n v = α v
The curvature κ v is determined in terms of the divergence of the interface unit normal
κ v = n ^ v
where
n ^ v = n v | n v | = α v | α v |
The surface tension force at the interface can be expressed as a volume force using the divergence theorem
F = σ ρ κ v α v ( ρ v + ρ l ) / 2
The surface wetting effect of water on copper is considered by incorporating the contact angle. The interface normal of the wall in adjacent cell is determined by
n ^ = n ^ w cos θ w + t ^ w sin θ w
where n ^ w and   t ^ w are the unit vectors normal and tangential to the wall, respectively. The interface tracking and construction are performed using the Geometric Reconstruction Scheme developed by Youngs [22], where the interface between the two phases is indicated as a linear slope in each control volume to calculate the advection of the fluid through the cell surfaces. This piecewise linear algorithm can reconstruct the interface more clearly and accurately.

2.2. Phase Change Model

The evaporation of coolant in the microchannel is determined by Lee’s model [23]. According to the kinetic theory of gases, the mass flux through the phase interface due to phase transition can be expressed by the Hertz–Knudsen equation
m v = β ( M 2 π R T sat ) 1 / 2 ( P v P sat )
where coefficient β is the accommodation coefficient, which represents the portion of vapor molecules reaching the surface of the liquid and adsorbed by the interface. P v represents the vapor partial pressure at the interface. The Clapeyron-Clausius equation is adopted to relate the pressure and temperature for the saturation condition during the phase change process
d P d T = h lv T ( 1 / ρ v 1 / ρ l )
The following expression can be obtained by integrating Equation (13) near the saturation condition.
( P v P sat ) = h lv T ( 1 / ρ v 1 / ρ l ) ( T v T sat )
Assuming that the flow pattern is bubbly flow with spherical bubbles, the interfacial area density is given by
A i = 6 α v α l d b
Combining Equations (12)–(15), the volumetric mass transfer rate due to phase change is obtained as
A i m v = 6 d b β M 2 π R T sat h lv ( α v ρ v ( ρ l ρ v ) ) ( α l ρ l ( T T sat ) T sat )
The source terms at the interface between two phases due to evaporation and condensation in Equations (1) and (2) is based on the saturation temperature
{ S v = λ l α l ρ l T l T sat T sat ,   S l = S v T l > T sat   ( Evaporation ) S l = λ v α v ρ v T sat T v T sat ,   S v = S l T v < T sat   ( Condensation )
where λ is the relaxation factor that controls the mass transfer rate between phases (also known as evaporation and condensation frequency).
λ l = 6 d b β M 2 π R T sat h lv ( α v ρ v ( ρ l ρ v ) )
A smaller value of λ requires a greater liquid superheat for the bubble nucleation and vice versa. The values of λ v = λ l = 0.1 used in the study by Schepper [24] were chosen for the present simulations. The source term S e in the energy equation can be determined by the latent heat of vaporization and the mass transfer rate.
S e = h lv S i

2.3. Geometric Model and Boundary Conditions

The schematic of rectangular microchannel heat sink is shown in Figure 1a. Considering the symmetry of channel structure and laminar flow, half of a single channel and its adjacent side wall are selected as the calculation domain. The boundary conditions of external wall are depicted in Figure 1b. A constant and uniform heat flux of q″ = 150 W/cm2 is applied on the bottom wall with length (Lh) of 10 mm, and the upstream and downstream bottom walls adjacent to the heating surface are set as adiabatic conditions with a length (La) of 1.5 mm to ensure the fully developed flow condition near the entrance and avoid the reversed flow at the outlet, respectively. The simulation domain has the symmetric boundary conditions on both sides. Adiabatic conditions are specified at the other external walls. Non-slip velocity condition is adopted at the internal wall between liquid and solid. Meanwhile, the heat flux conservation and temperature continuity conditions are specified at the two-phase interface to ensure energy conservation. The inlet has a boundary of uniform mass flow with Tin = 342.3 K. The outlet boundary condition is prescribed at the channel exit with a given saturation pressure.
The rectangular microchannels with three different channel widths (Wch = 0.1, 0.2, 0.5 mm) and three different channel heights (Hch = 0.5, 1.0, 2.0 mm) corresponding to five different geometric combinations are simulated. The base wall thickness (Hb) of 0.2 mm is used, and the width of the wall between the channel (Ws) is set to the channel width (Wch). A low evaporation pressure Psat = 30 kPa is used to study the flow boiling characteristics of water at saturation temperature Tsat = 342.3 K. Geometry dimensions and operating conditions are summarized in Table 1.
Due to the pressure change in microchannels during flow boiling process, the variations of saturation temperature should be considered. The sixth-order polynomial curve fitting is used to determine the saturation temperature data for pressure between 10 and 200 kPa [25]
T sat = a 0 + a 1 P + a 2 P 2 + a 3 P 3 + a 4 P 4 + a 5 P 5 + a 6 P 6 a 0 = 300.92 ;   a 1 = 2.2353 × 10 3 ;   a 2 = 3.9978 × 10 8 ;   a 3 = 4.6364 × 10 13 ; a 4 = 3.0609 × 10 18 ;   a 5 = 1.0512 × 10 23 ;   a 6 = 1.4551 × 10 29
where the temperature Tsat (K) is the saturation temperature at the absolute pressure P (Pa).
The pressure drop through the microchannel in the simulation is small, and its influence on the physical properties is negligible compared with the temperature. The density ρ , specific heat c p , thermal conductivity k and dynamic viscosity μ of liquid and vapor water at absolute pressure P = 30 kPa from NIST REFPROP database are fitted as a function of temperature. The thermophysical properties used for the simulations can be found in Supplementary Document S3.
The CFD code ANSYS Fluent is used to solve the governing equations. The coupling between pressure and velocity is handled using the PISO algorithm, and the Green-Gauss Node Based gradient solver and a second-order upwind discretization for momentum and energy are used. The explicit VOF equations are employed for the transient calculations, and the critical value of the Courant number is set to 0.25. According to the grid size and mass flow rate, the time step is set to 10−6 s to ensure a global Courant number lower than 1.0 for numerical stability. The convergence residual of the continuity equation is set to 10−4, the rest of the equations have a convergence residual of 10−5, and the energy equation residual is generally less than 10−6. The quasi-steady-state condition is reached when the area-weighted temperature of heating wall and the mass-weighted temperature of fluid domain become stable, and the heat transfer rates on the heating wall and the internal walls are balanced.

2.4. Mesh Generation and Independence Analysis

Since the simulation domain is an orthogonal rectangular structure as shown in Figure 2, the domain is discretized into rectangular elements to ensure good quality of meshes. Meshes are well refined in the fluid region adjacent to the wall to capture the thermal and hydraulic boundary layers and the growth of bubbles.
The microchannel with the structure of 0.2 × 0.5 mm is selected for the mesh independence analysis. The operating and boundary conditions used for analysis are as follows: mass flow rate G = 300 kg/(m2·s), uniform heat flux on bottom wall q″ = 150 W/cm2, Tsat = 342.3 K, wall contact angle θ = 52°. The hydrophilic condition is determined according to the experimental data by Yekta-fard et al. [26].
In order to examine the mesh independence, simulations are performed for five different mesh densities including 77,128, 147,820, 306,384, 564,300 and 1,052,352, respectively. The criteria | ( X i X i + 1 ) / X i | are used for mesh independence test, where X i is the calculated value of the variable to be compared for the current mesh density and X i + 1 is the same variable after the mesh density is doubled. Table 2 shows the results of the mesh independence test using the two-phase pressure drop and the average temperature of the heated wall; the mesh density of the mesh4 is chosen in the following simulations. Further refinement of the mesh may result in more accurate solutions and clearer liquid-vapor interface; this will also lead to a reduction in time step due to the limitation of convergence problem.

2.5. Model Validation

The rectangular microchannels with structures shown in Table 1 at the condition of q’’ = 150 W/cm2 are used for the model validation. The numerical results of heat transfer coefficient were compared with predictions by a composite correlation proposed by S Bertsch et al. [27]. This experimental correlation was developed based on 3899 data covering 12 different fluids, which considers the mechanisms of the nucleate boiling and the convective heat transfer, and the effects of bubble confinement in microchannels. The geometry and operating conditions of all cases in the present study are within the range of this correlation. The deviations between the results predicted by CFD model and the empirical correlation for heat transfer coefficient are within 15%, as shown in Table 3. It can be observed that the deviation of heat transfer coefficient for the cross-section of 0.2 × 0.5 mm is relatively larger. This is because bubble growth in microchannel with a cross-section of 0.2 × 0.5 mm is seriously confined, leading to an intermittent dryout of liquid and a large uncertainty in the heat transfer measurements as well as the fitted correlations. Since the heat transfer coefficients obtained by the numerical model show a reasonable agreement with the results predicted by the experimental correlation, this CFD model can be extended for the subsequent parametric and mechanistic studies.
The two-phase pressure drop predicted by the CFD model was compared with the result obtained by an empirical correlation using the concept of two-phase flow multiplier [28]. This correlation is based on the homogeneous mixture model which assumes the two phases remain well mixed and appears to be suitable for two-phase flow regime in mini channels. The two-phase pressure drop of homogeneous mixture can be developed via an analogy with the single-phase flow
( P z ) fr = Φ L 0 2 ( P z ) fr , L 0
where the pressure gradient term on the right-hand-side is based on the single-phase flow and the subscript L0 represents the pressure drop when the mixture is liquid. The two-phase pressure drop along the heated length for uniformly heated flow boiling microchannel with a uniform cross-section can be calculated using the two-phase multiplier Φ L 0 2 :
Δ P fr = 0 Z out ( P z ) fr d z = ( P z ) fr , L 0 L h x out 0 x out Φ L 0 2 ( x ) d x
The two-phase multiplier parameter Φ L 0 2 adopted in the present study was obtained from the correlation developed by Mulller Steinhagen and Heck [29], which has been validated against 9300 data for a variety of fluids and conditions covering the cases of the present study. As shown in Table 3, the values of the two-phase pressure drop determined by CFD simulations shows reasonable agreement with the predictions by the correlation.

3. Results

Different from conventional macro-scale channels, the flow boiling in the microchannel has a strong dependence on the surface tension, the inertial force, the viscous force and gravity. In order to study the effects of aspect ratio, the low-pressure flow boiling of water in parallel rectangular channels is conducted considering the effect of surface tension, viscous force, gravity and surface wettability. The effect of interface model, channel geometry and flow parameters on heat transfer and flow characteristics in microchannels are investigated. Meanwhile, the behavior of the bubble and its relationship with the aspect ratio have also been analyzed.

3.1. Effect of Interface Model on the Flow Boiling

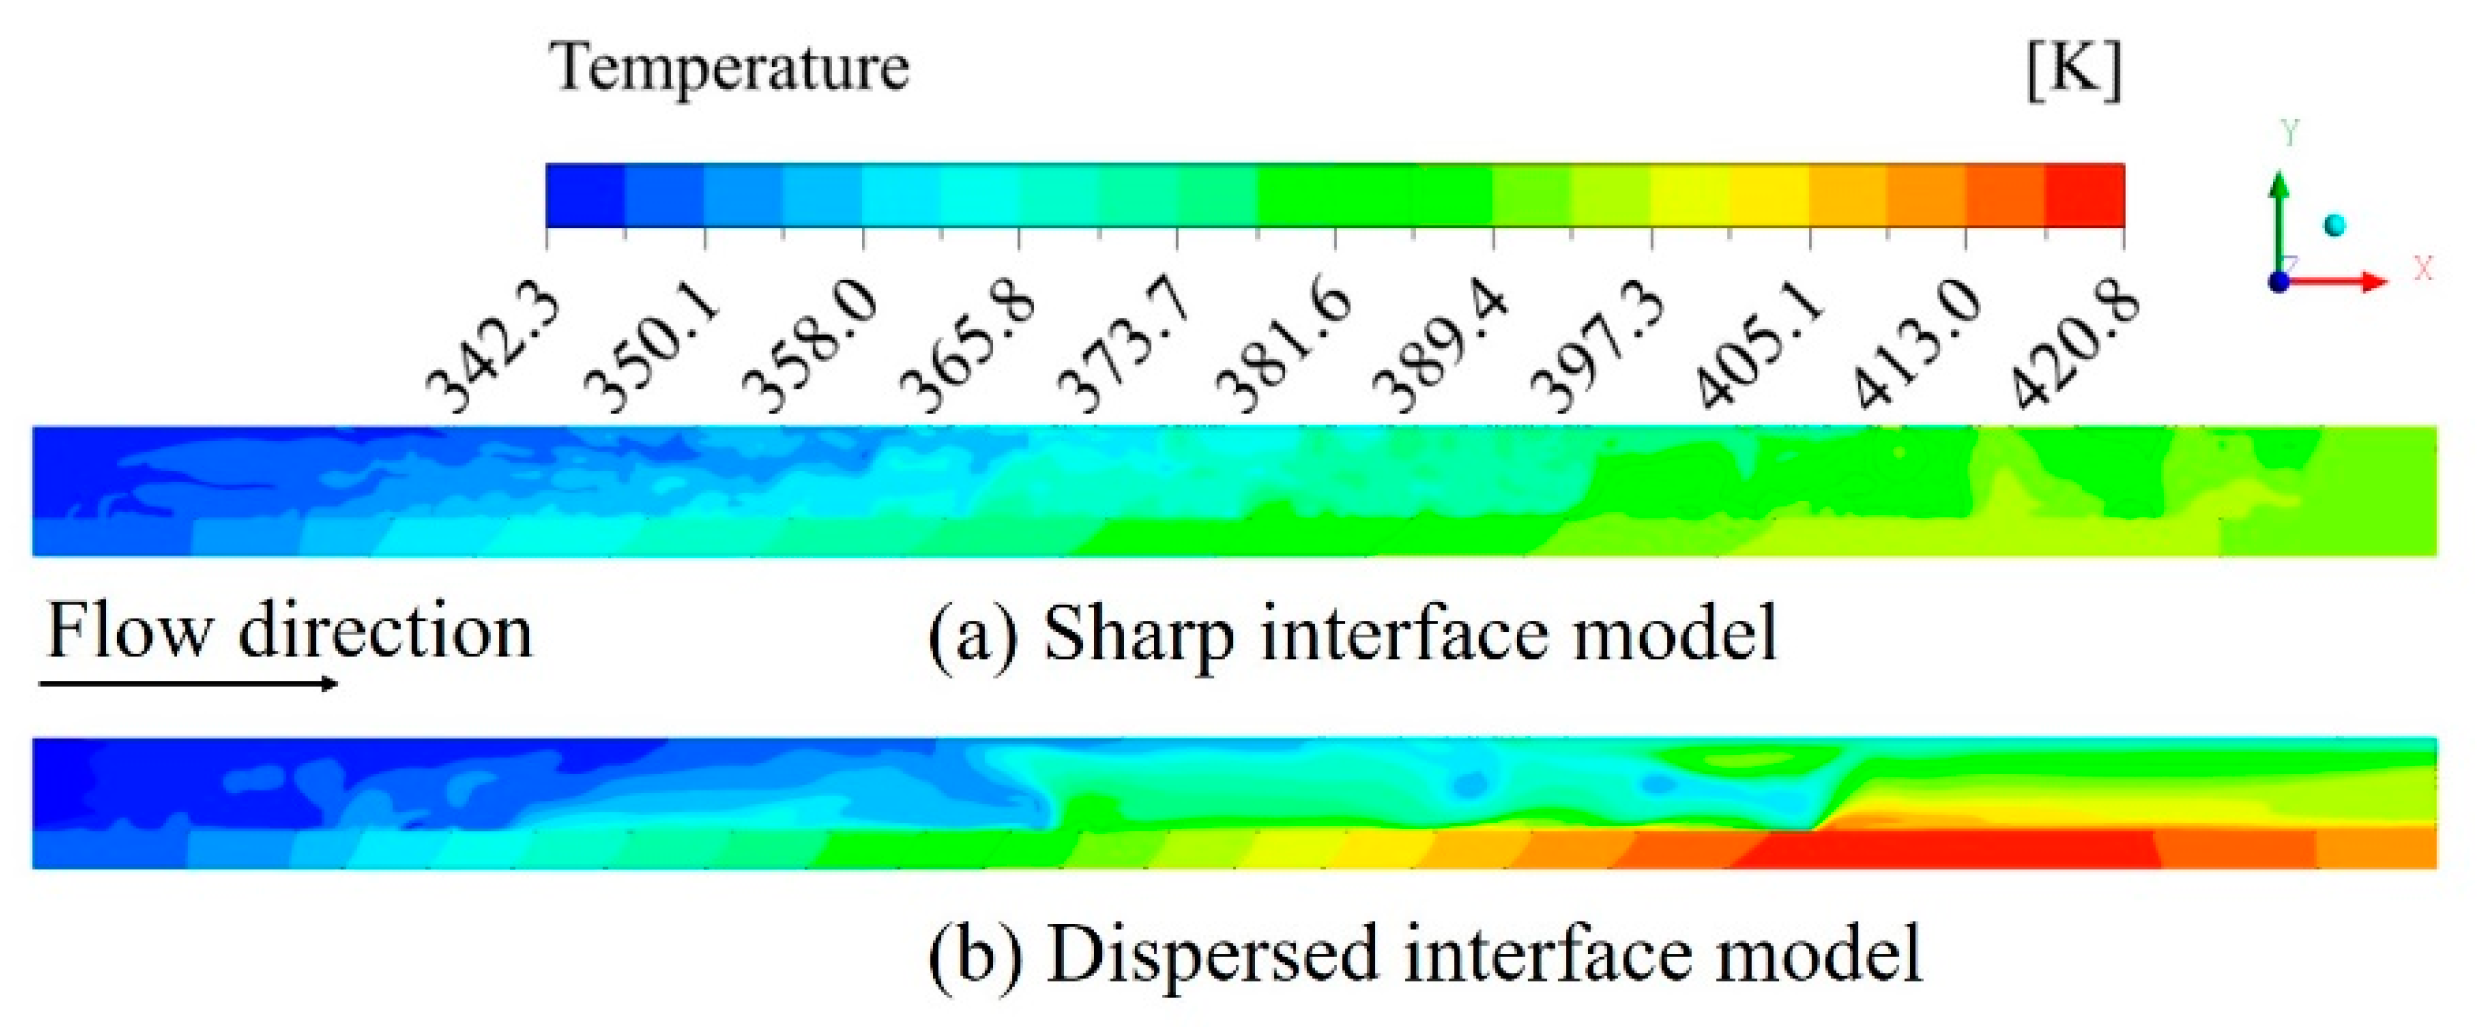
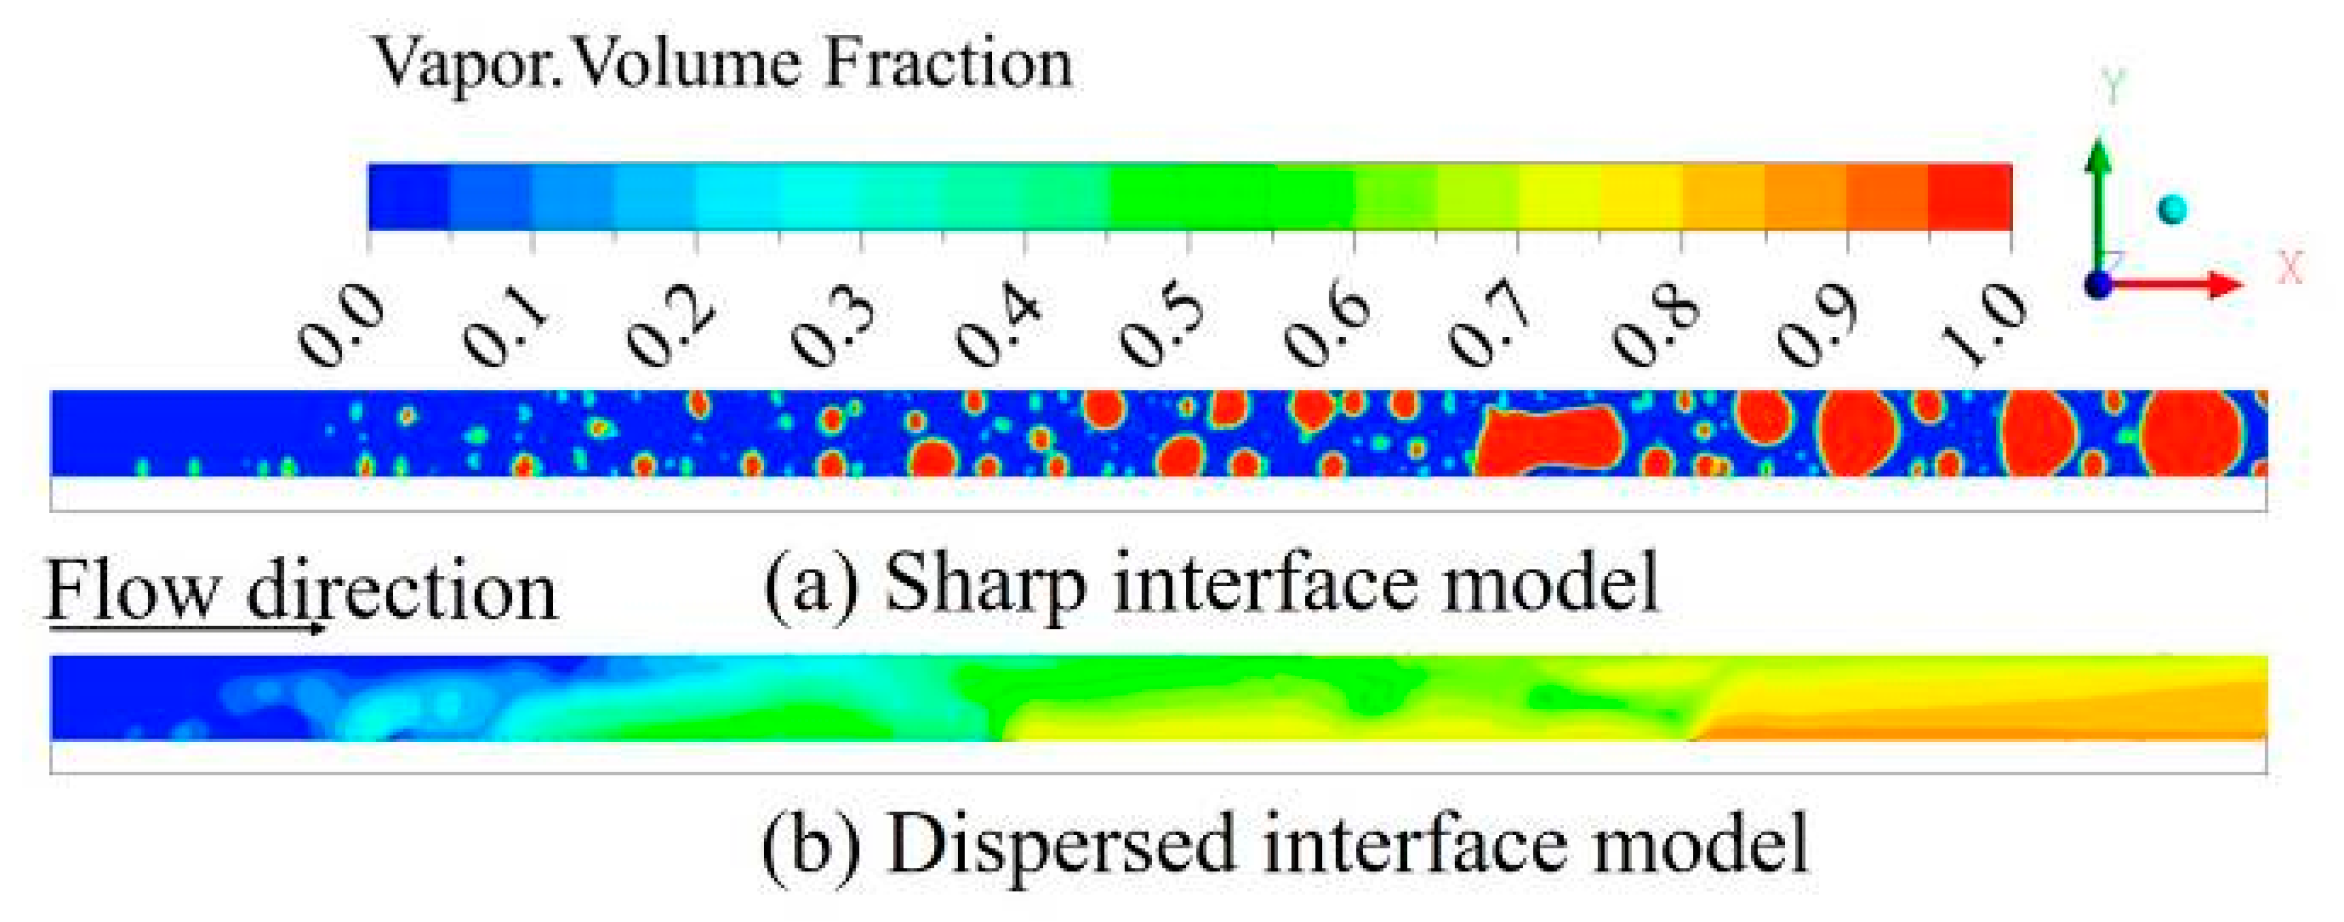
The VOF model is an interface capture method that introduces the concept of volume fraction to solve the flow of two or more fluids. Two interface modeling methods are tested for the VOF model: the sharp model and the dispersed model, which result in different volume fraction discretization schemes. The two interface models are employed to simulate the two-phase heat transfer characteristics at G = 300 kg/(m2·s) for the cross-section of 0.2 × 0.5 mm.
Figure 3 and 
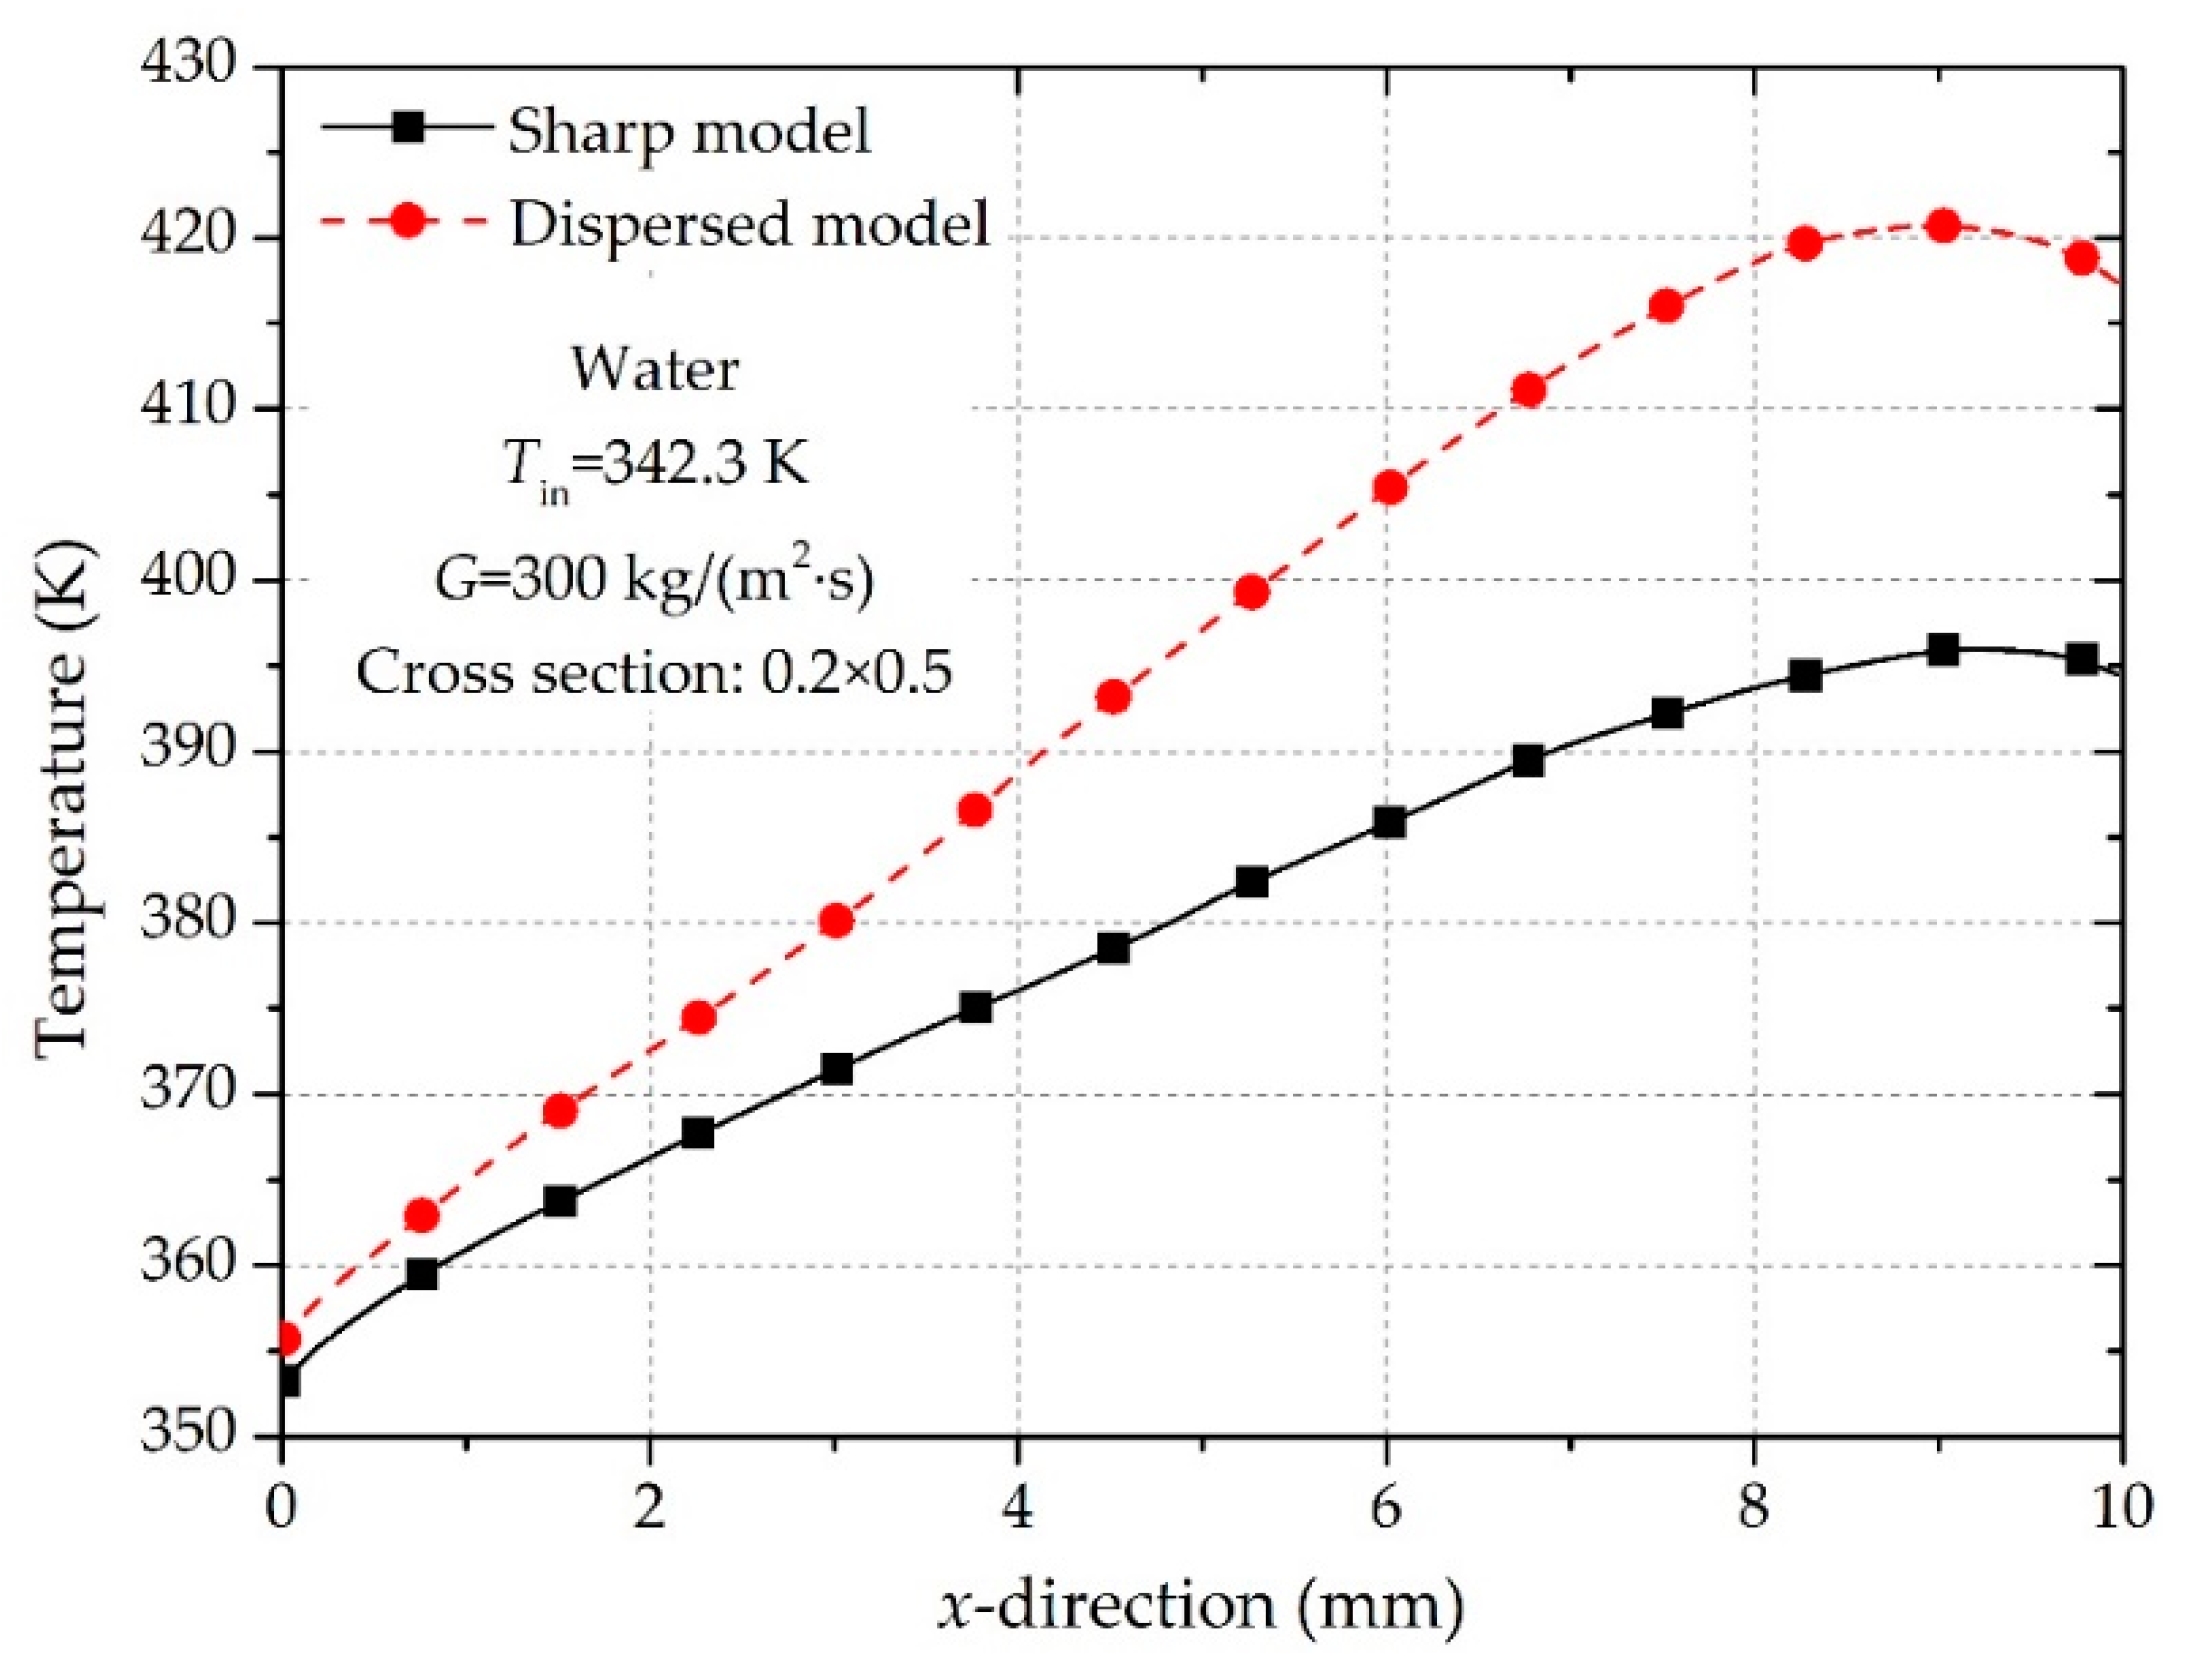
Figure 4 show the distribution of temperature and vapor volume fraction at the symmetrical section of the channel for the two interface models. The temperature distribution of the heating wall along the flow direction is shown in Figure 5. The temperature predicted by both models rises gradually to the highest value near the exit of the channel along the flow direction. This temperature can be used as one of the evaluation criteria for the design of microchannel structures. The overall temperature of the fluid and solid domains calculated by the sharp model is lower than that of the dispersed model, and the maximum temperature difference between the two models is 24.7 °C. By comparing the results of vapor volume fraction, it can be seen that the two interface models have significant differences in the interface reconstruction. For the dispersed model, the vapor and liquid phases are interpenetrating, and there is no obvious interface between the two phases; on the contrary, the sharp model can capture the vapor-liquid interface. The nucleation, growth and separation of the bubbles can be observed by comparing the results at different time steps, and there are several two-phase flow patterns such as dispersed bubble flow, bubbly flow, and confined bubble/plug flow.
The significant difference in the temperature distribution between the two models is mainly due to the difference in the distribution and morphology of the interface. The results of the sharp model show that the flow patterns are mainly bubble flow and slug flow, which is dominated by the nucleate boiling mechanism. The nucleation and coalescence of the bubbles cause the continuous disturbance to the flow in the channel, which enhances the convective heat transfer and leads to a relatively low wall superheat. However, the temperature of the heating wall downstream of the channel is still high. This is mainly because the small bubbles in the upstream continuously grow along the flow direction, and the accumulated bubbles can occupy the entire channel in the rear part of the channel due to small channel size, resulting in an increase in the temperature of the vapor phase. The results of dispersed model show that the vapor volume fraction increases along the flow stream of the channel, and the dominant heat transfer mode in downstream of the channel becomes forced convection. The average heat transfer coefficient is much lower than that of the sharp model, and this phenomenon is similar to dryout, which seriously hinders the heat dissipation and results in a sharp temperature rise on the heating wall. Therefore, the sharp model is used in the following simulations of the flow boiling in microchannels.

3.2. Effect of Mass Flux on the Flow Boiling

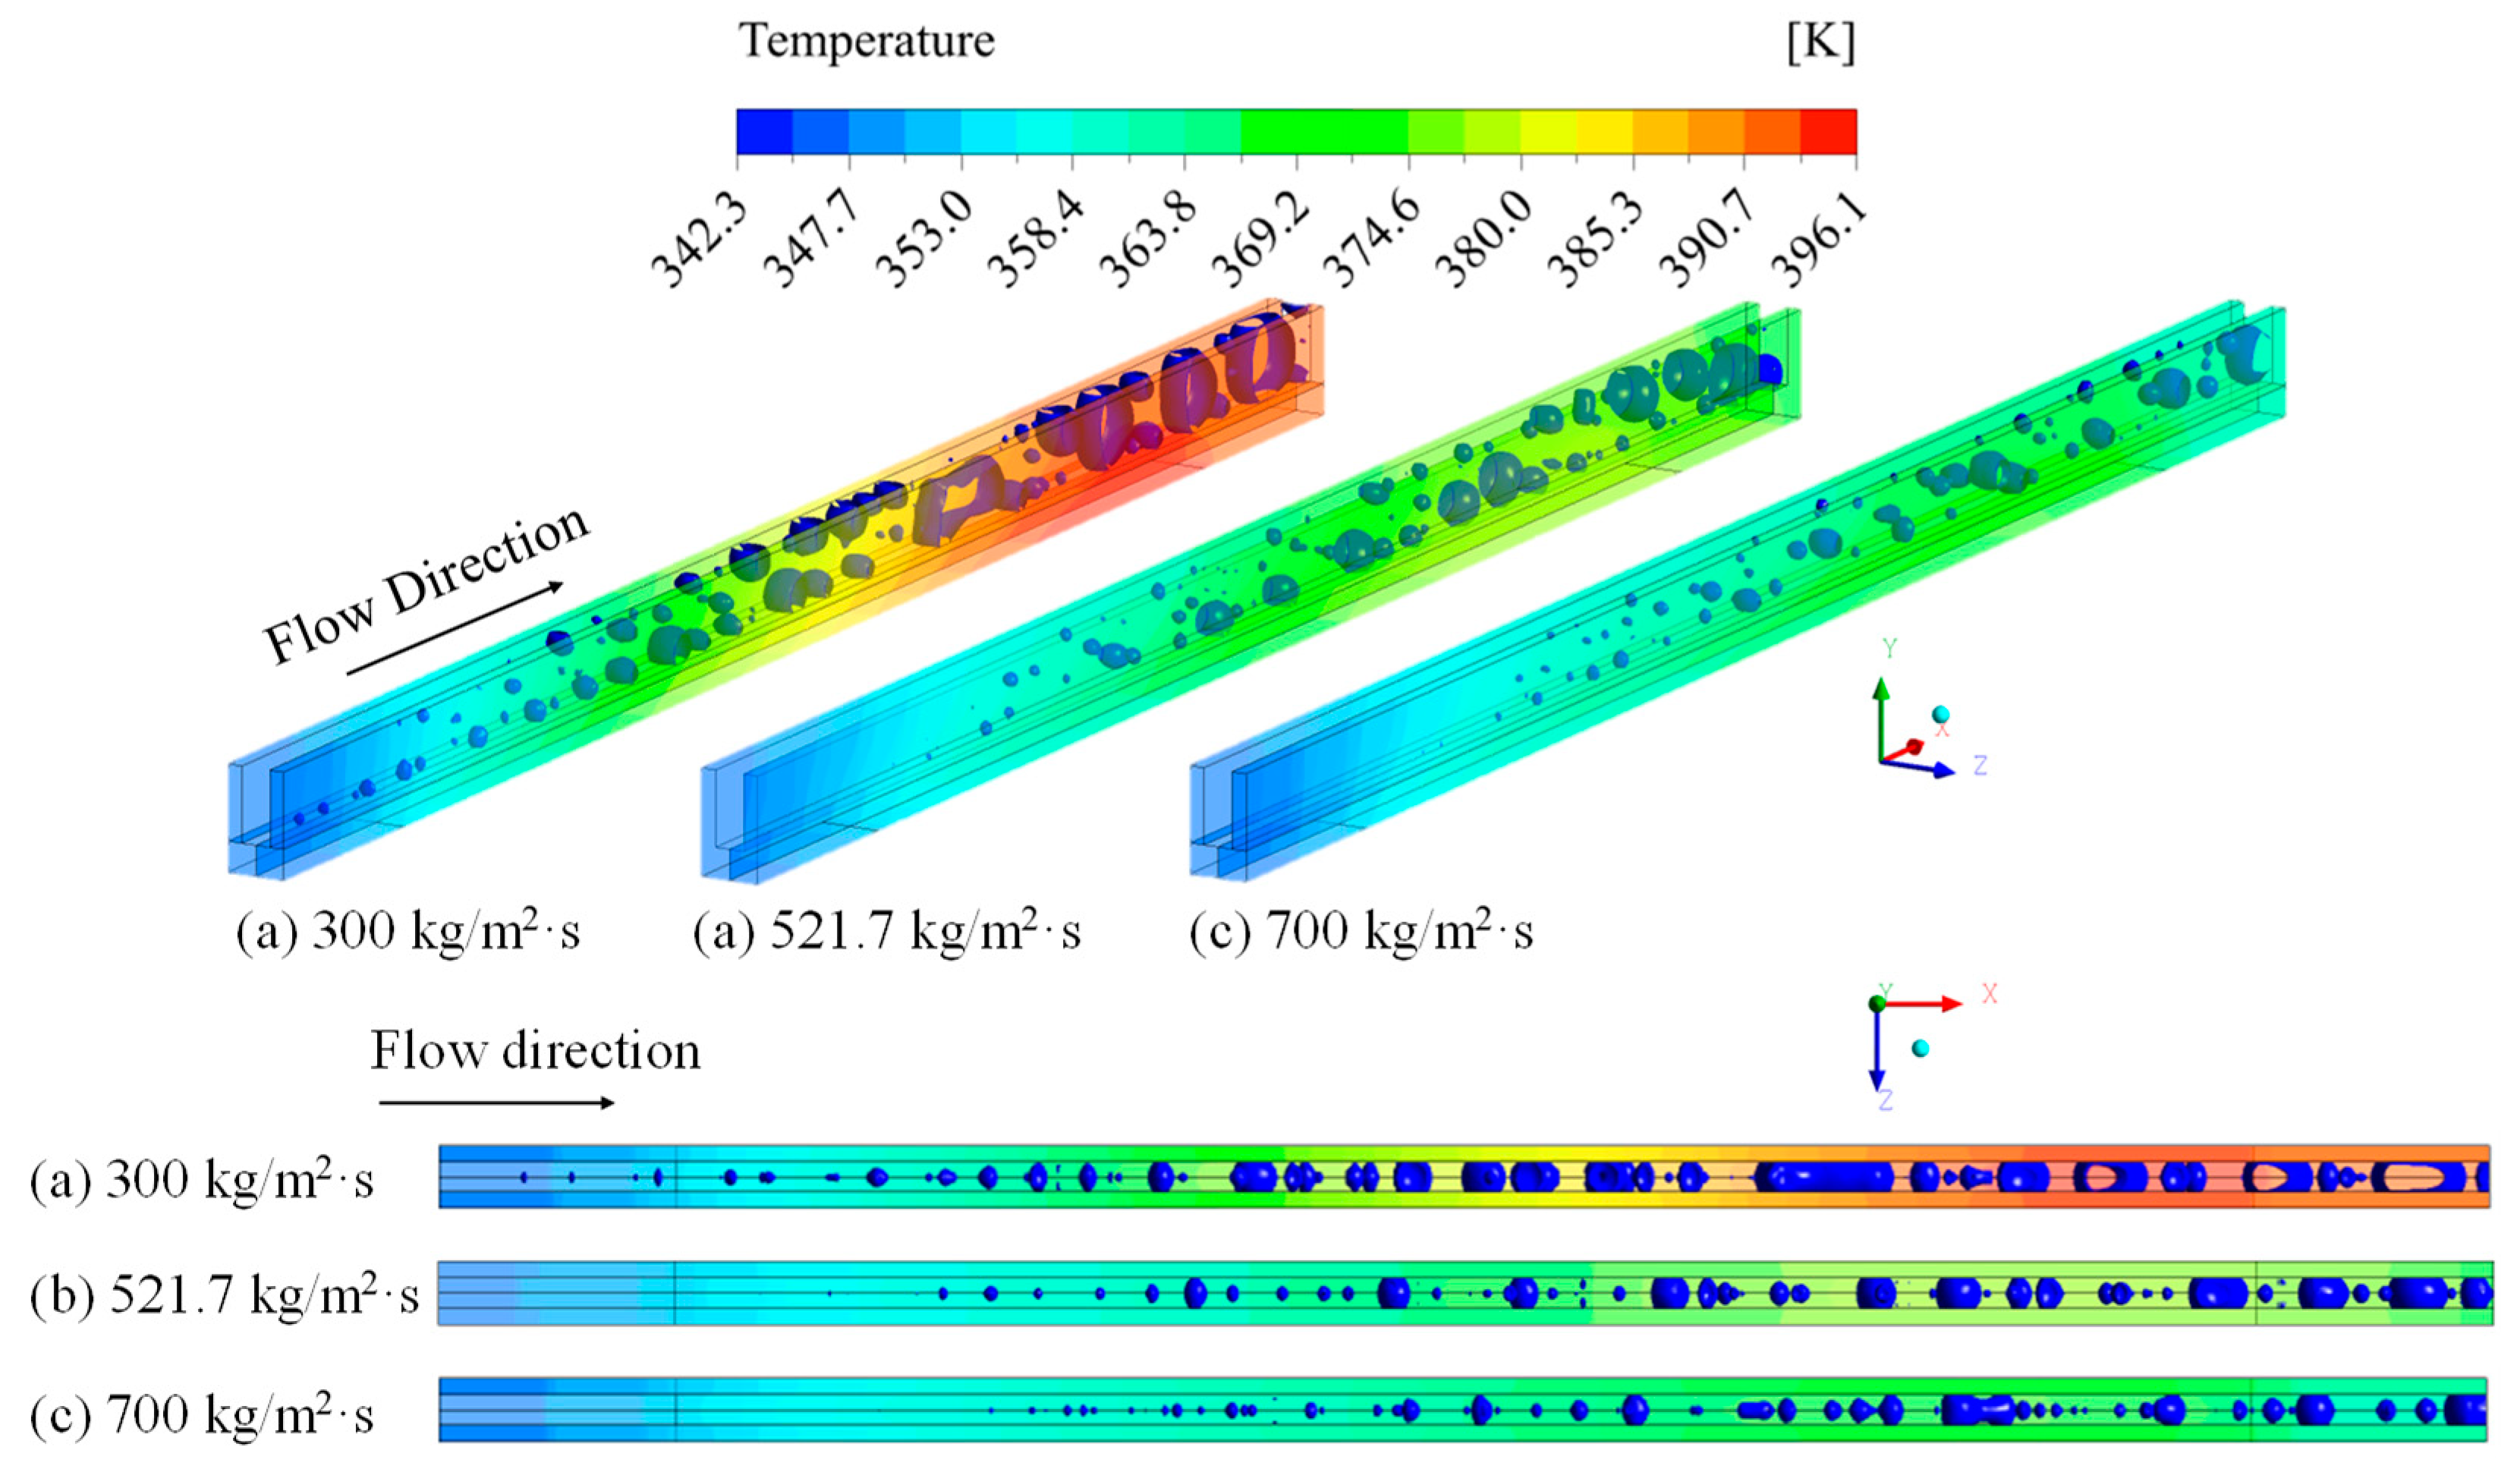
The results obtained for the microchannel with a cross-section of 0.2 × 0.5 mm were used to determine the dominant heat transfer mechanism in this study by changing the mass flux. It is well known that nucleate boiling and forced convection boiling are the two main heat transfer mechanisms for flow boiling in channels. The quasi-steady-state solutions for temperature field and two-phase flow regime for different mass fluxes are shown in 
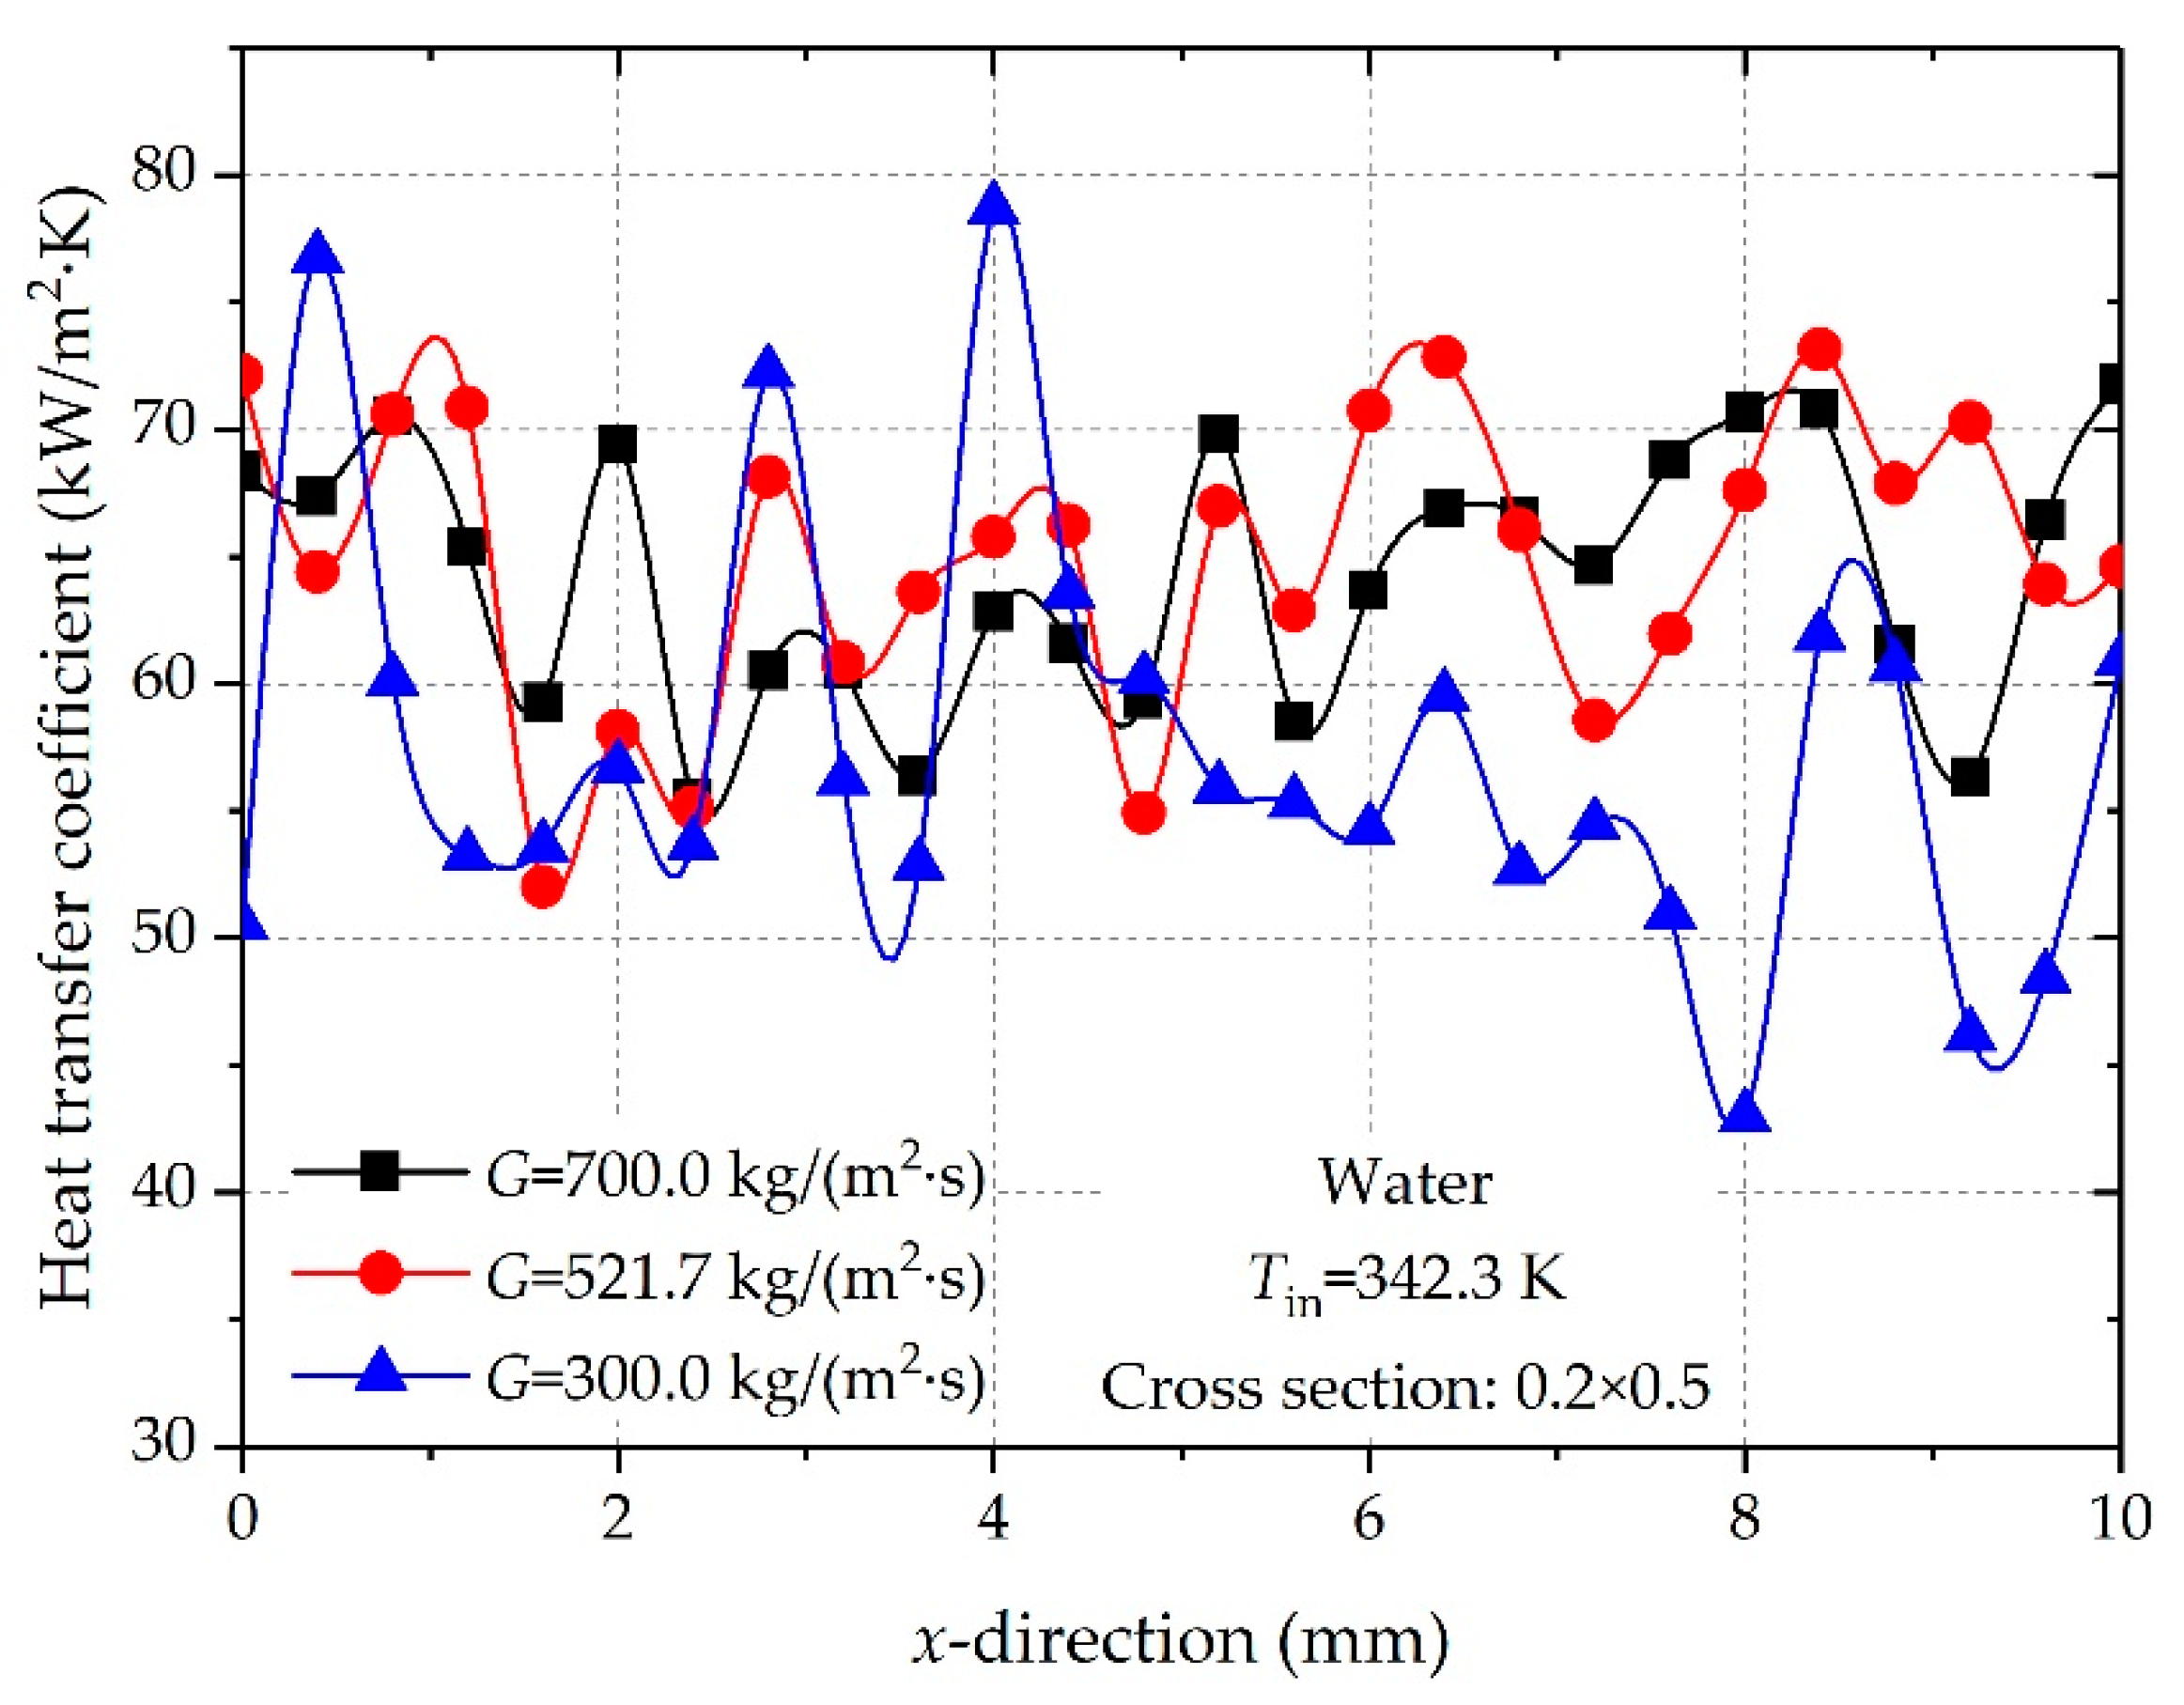
Figure 6. The variations in the local heat transfer coefficient along the microchannel for different mass fluxes are shown in Figure 7. The flow regimes of small mass flux G = 300 kg/(m2·s) are mainly confined bubble flow and slug flow, whereas only bubble flow was observed for the large mass flux G = 500–700 kg/(m2·s). The overall heat transfer coefficients are basically similar at the large mass flux, which means it is less sensitive to mass flux and vapor quality. These results indicate that the dominant heat transfer mechanism is nucleate boiling. With regard to the results at G = 300 kg/(m2·s), as the bubbles accumulate downstream, the flow regime is transformed into slug flow, which hinders the flow and heat transfer.

3.3. Effect of Channel Height on the Flow Boiling

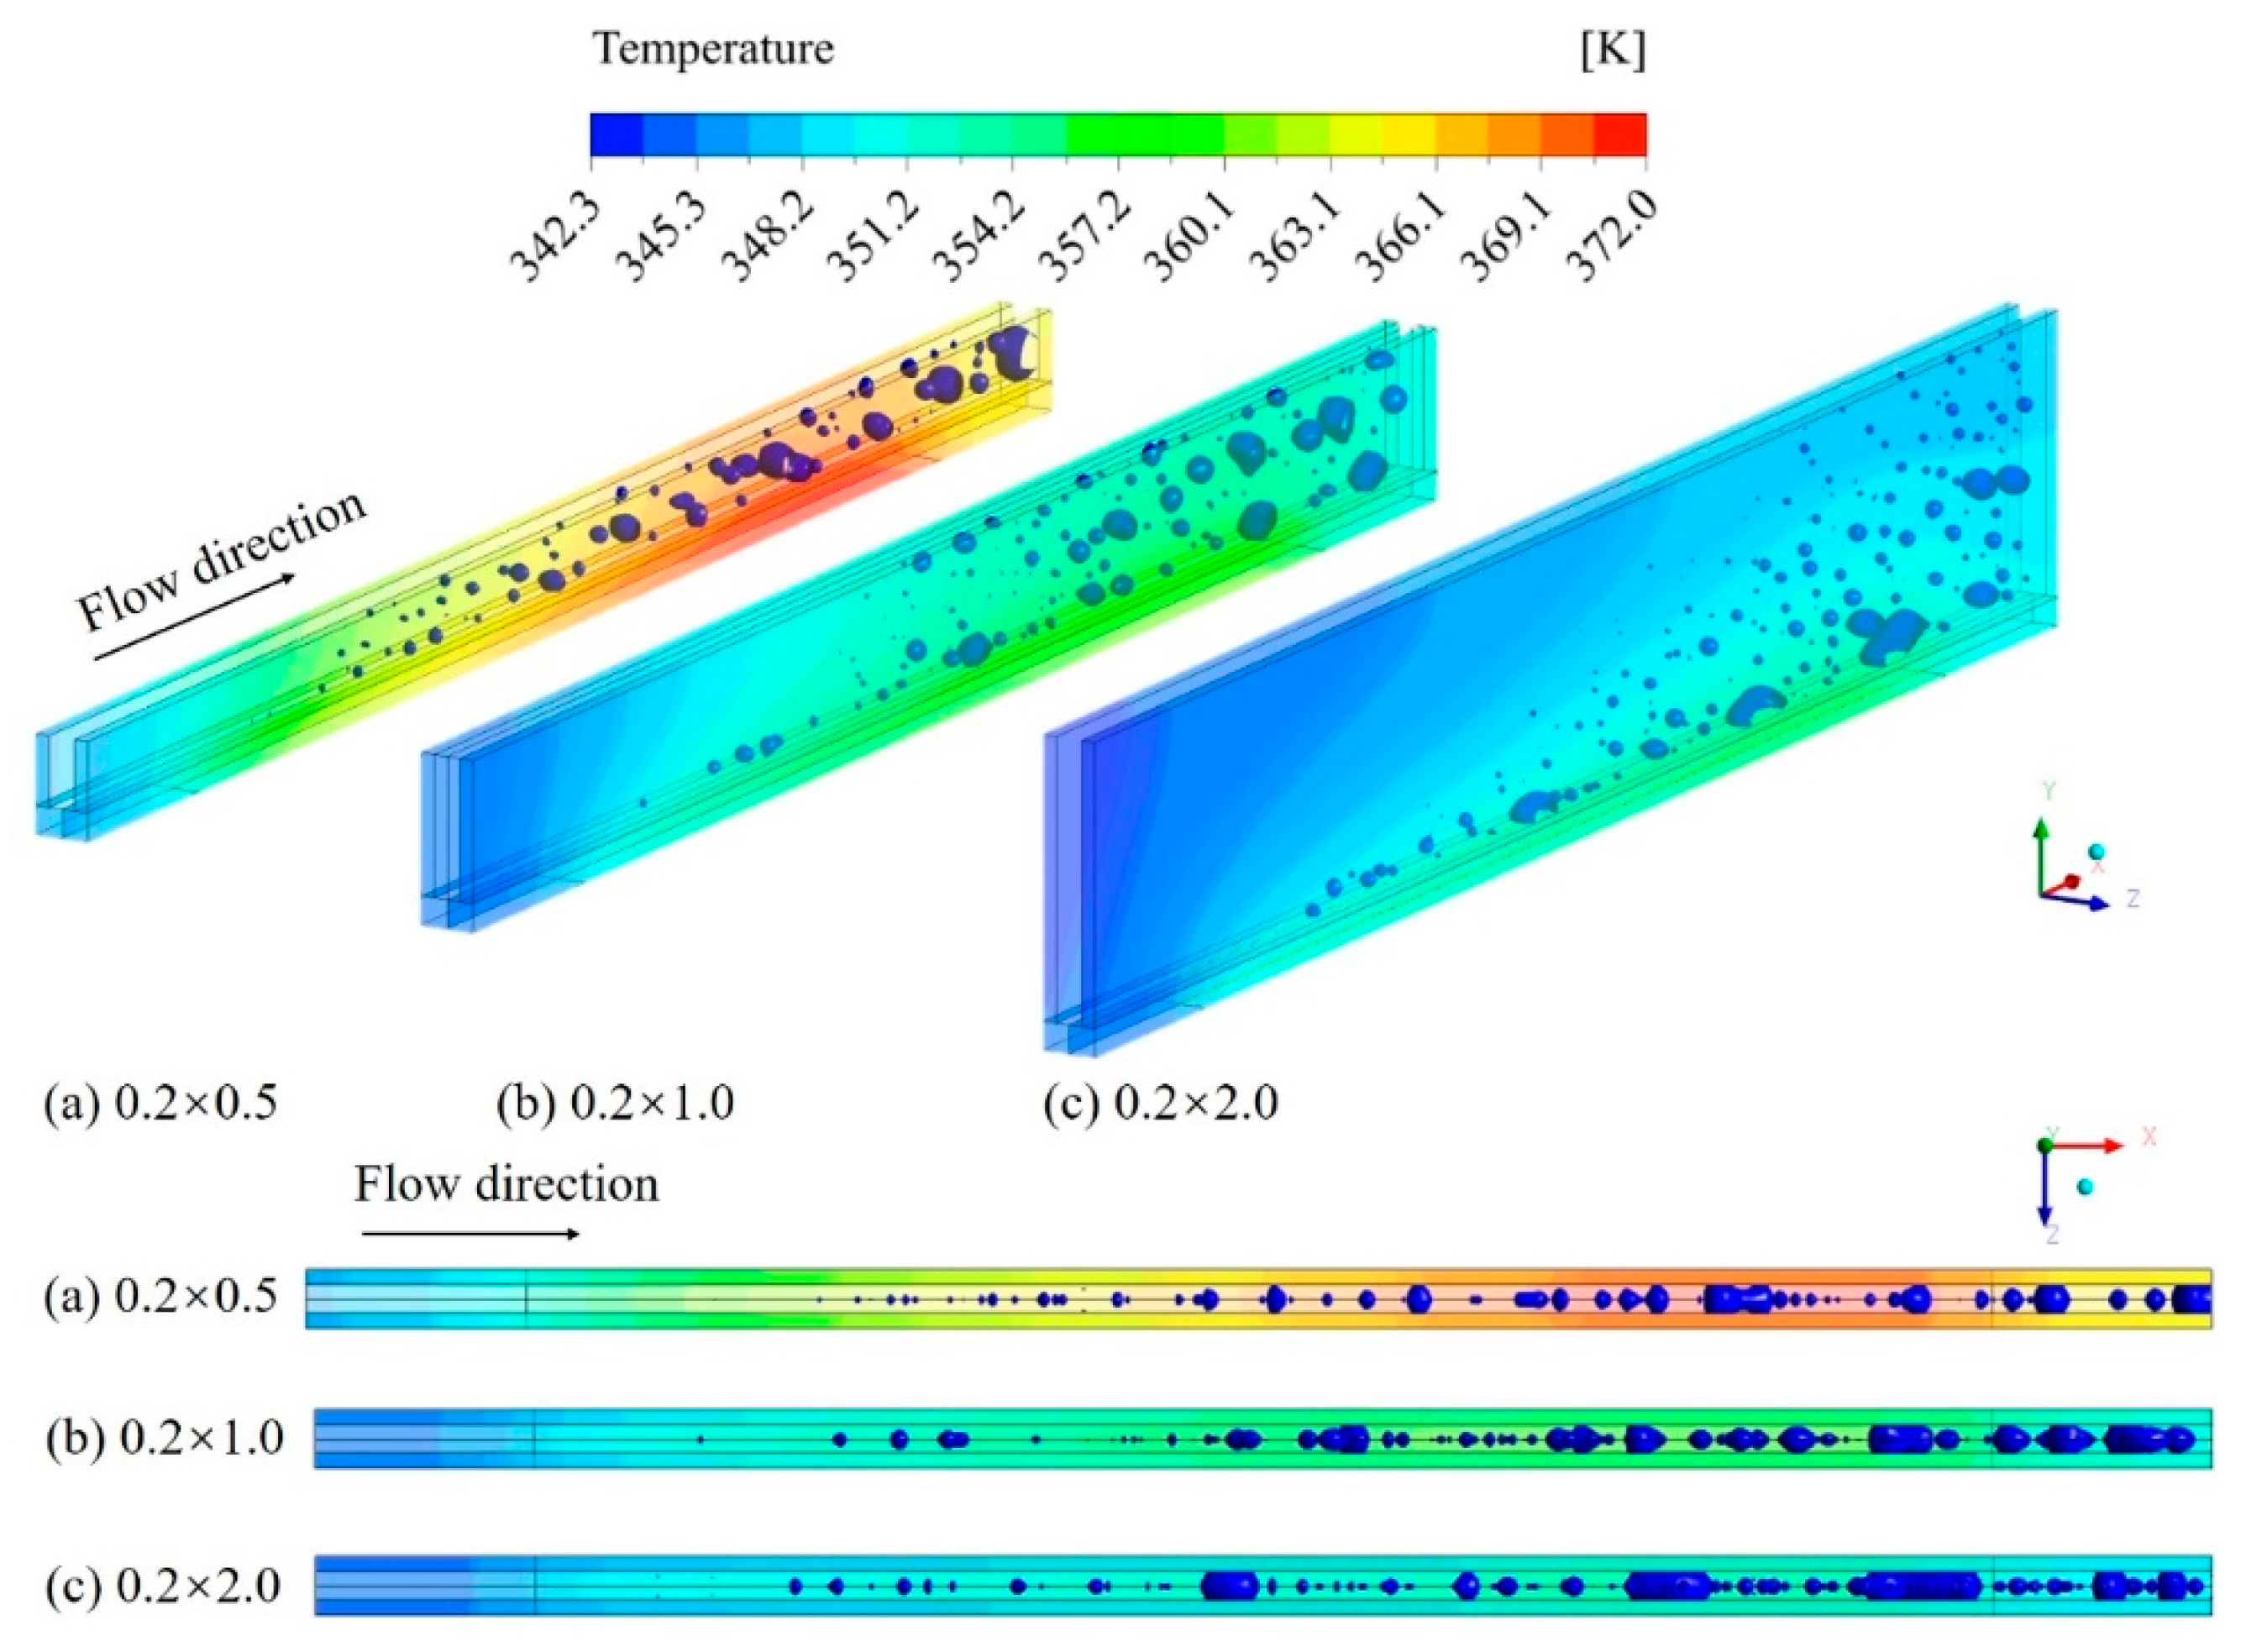
In microchannels, the accumulation and growth of bubbles downstream of the channel can seriously impede the flow boiling heat transfer. The channel dimension has a significant influence on the distribution of bubbles whereas changing the heat transfer area. The effects of channel height on flow boiling in microchannels at G = 700 kg/(m2·s) for the cross-section of 0.2 × 0.5 mm, 0.2 × 1.0 mm and 0.2 × 2.0 mm are investigated in the present study.
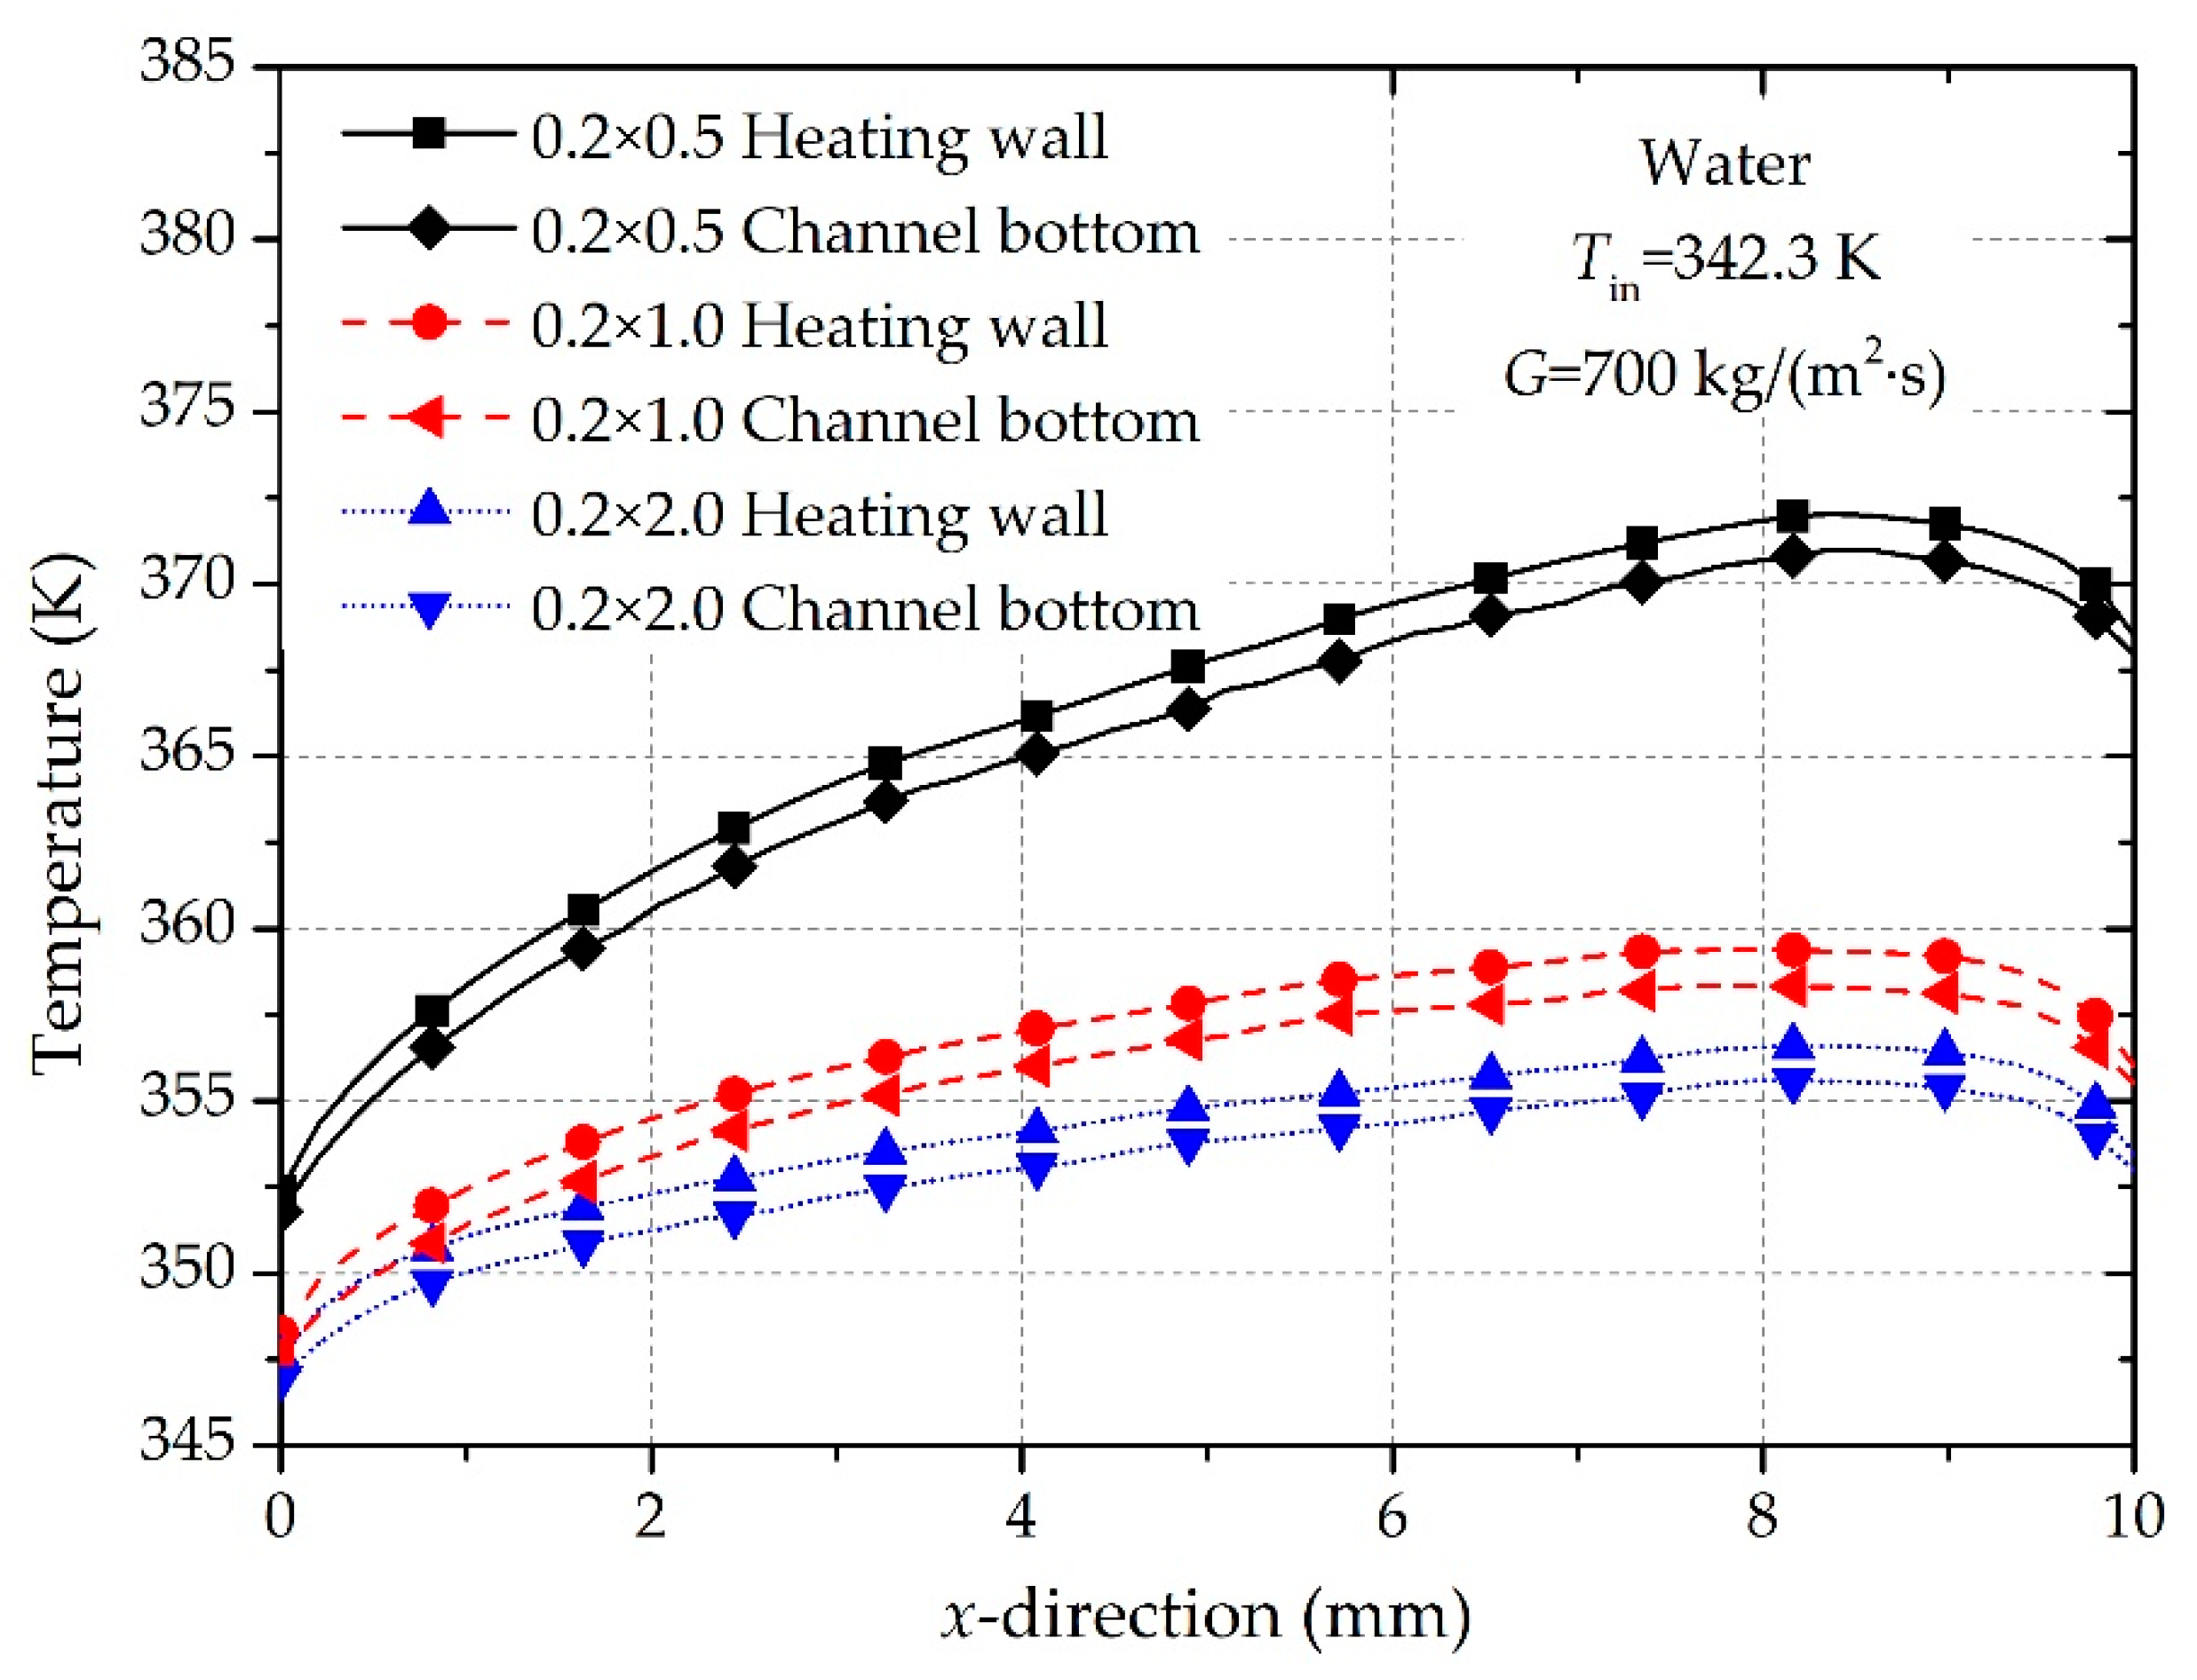
The quasi-steady-state solutions of the temperature field and two-phase flow regime for different channel heights are shown in Figure 8. The temperature distribution of the heating wall and channel bottom wall along the flow direction is shown in Figure 9. It can be found that the height of the channel has a great influence on the bubble growth and the temperature distribution. The temperature of the heating wall and the channel bottom wall gradually decreases with the increasing channel height, and the temperature distribution also becomes more uniform.
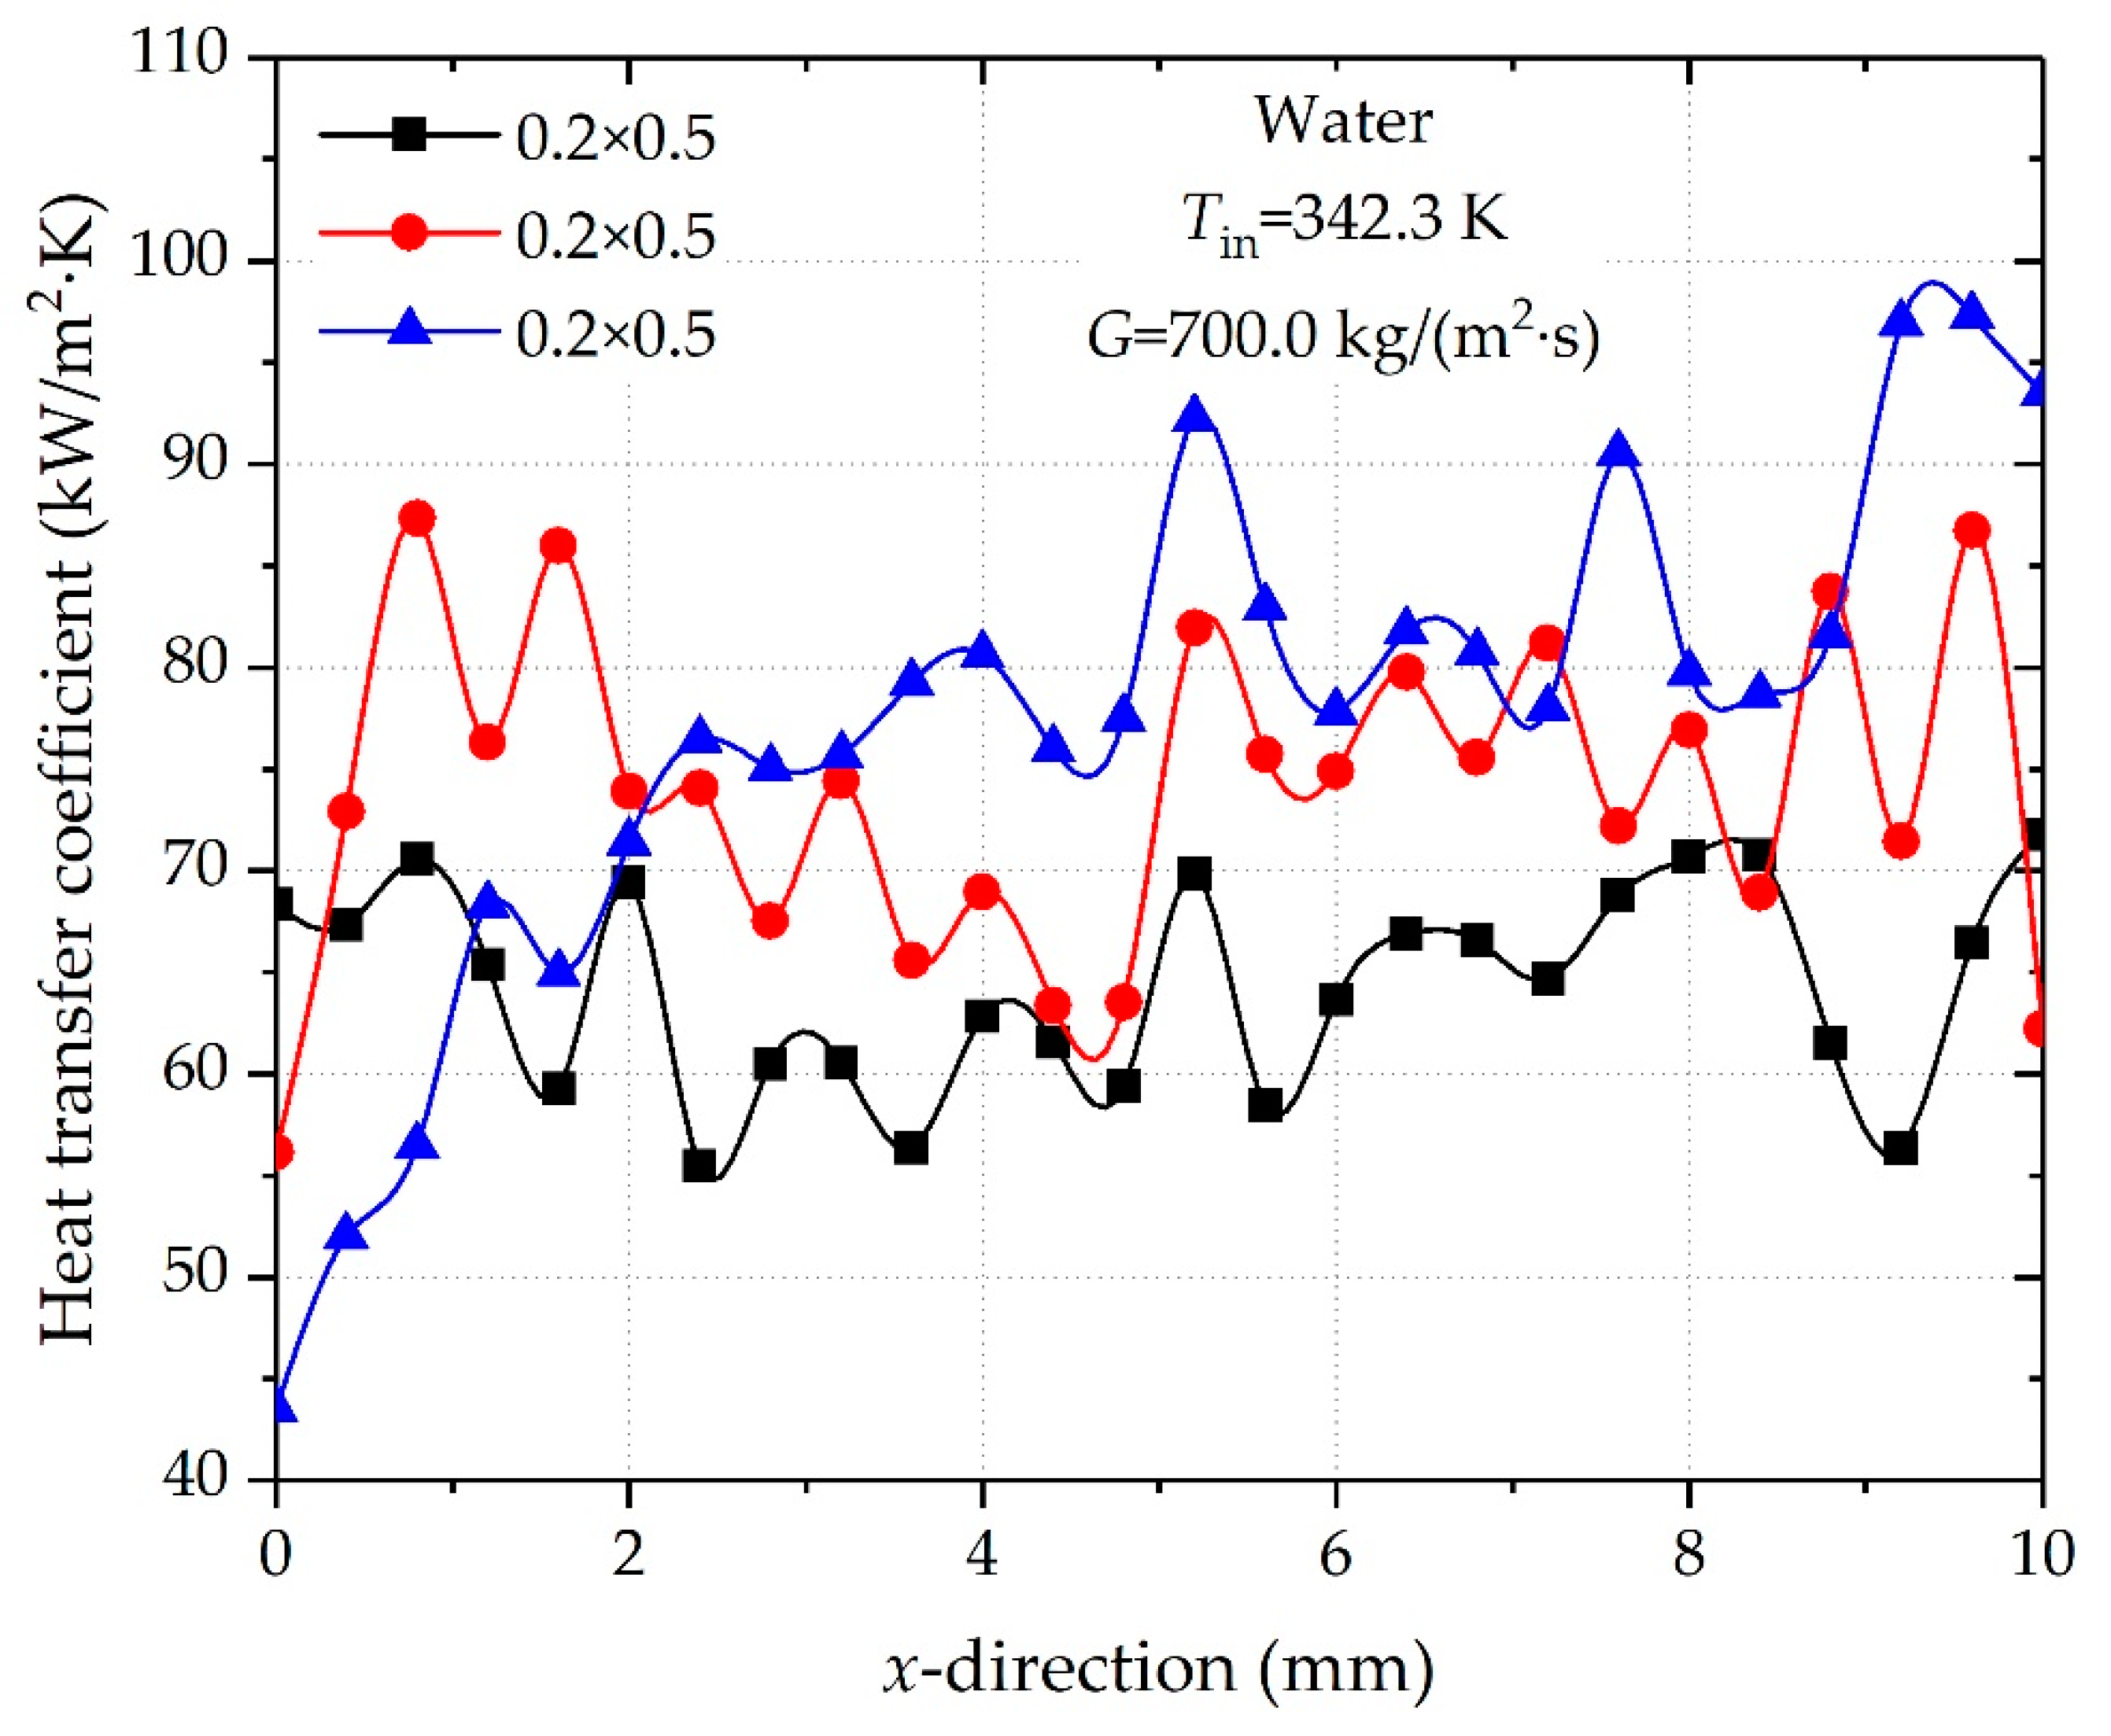
Figure 10 shows the variations of the local heat transfer coefficient along the microchannel for different channel heights. The fluctuations in the local heat transfer coefficients are due to the non-uniformity of the quasi-steady bubble flow. The local heat transfer coefficient at the entrance of the channel decreases as the depth of the channel increases. This is mainly due to the single-phase flow at the entrance of the microchannel with a larger height. In the two-phase region (X ≥ 2 mm), the overall local heat transfer coefficient increases with the increase in the channel height; because of the large heat transfer area, the wall heat flux of microchannel with a larger height is lower than that of the smaller microchannels, resulting in a relatively low wall superheat and bubble nucleation rate, and therefore a higher overall local heat transfer coefficient can be achieved.
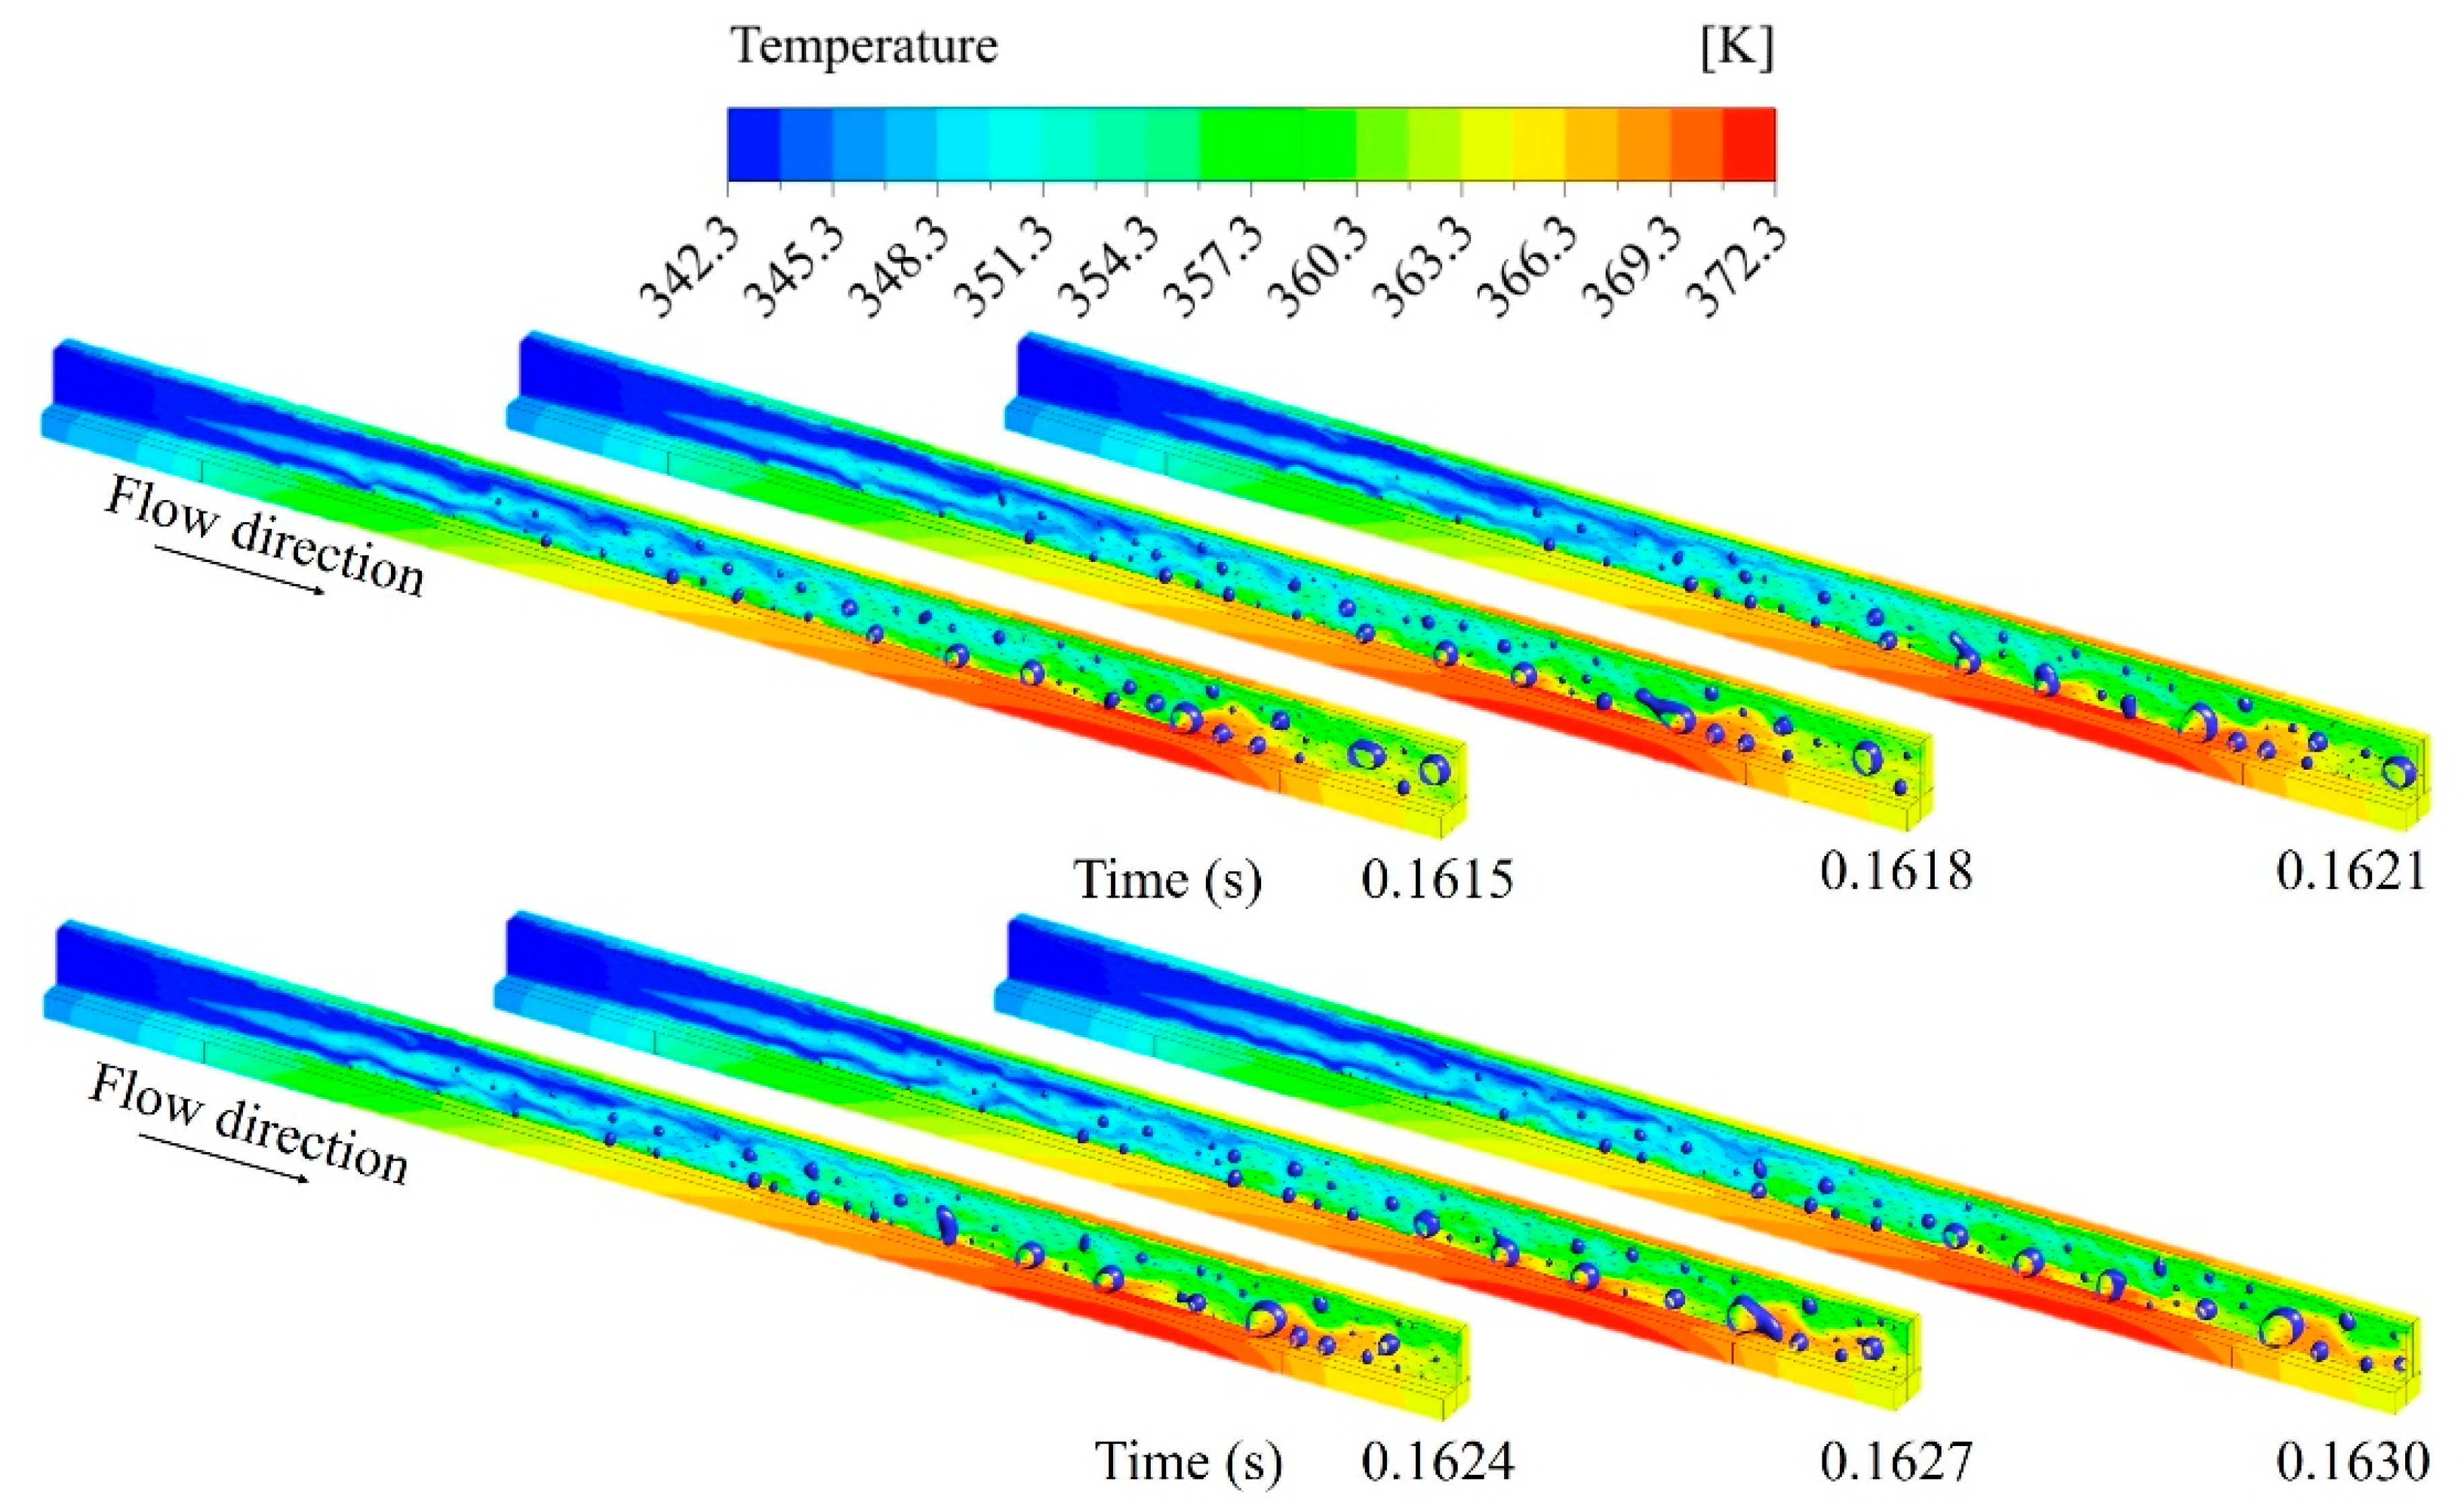
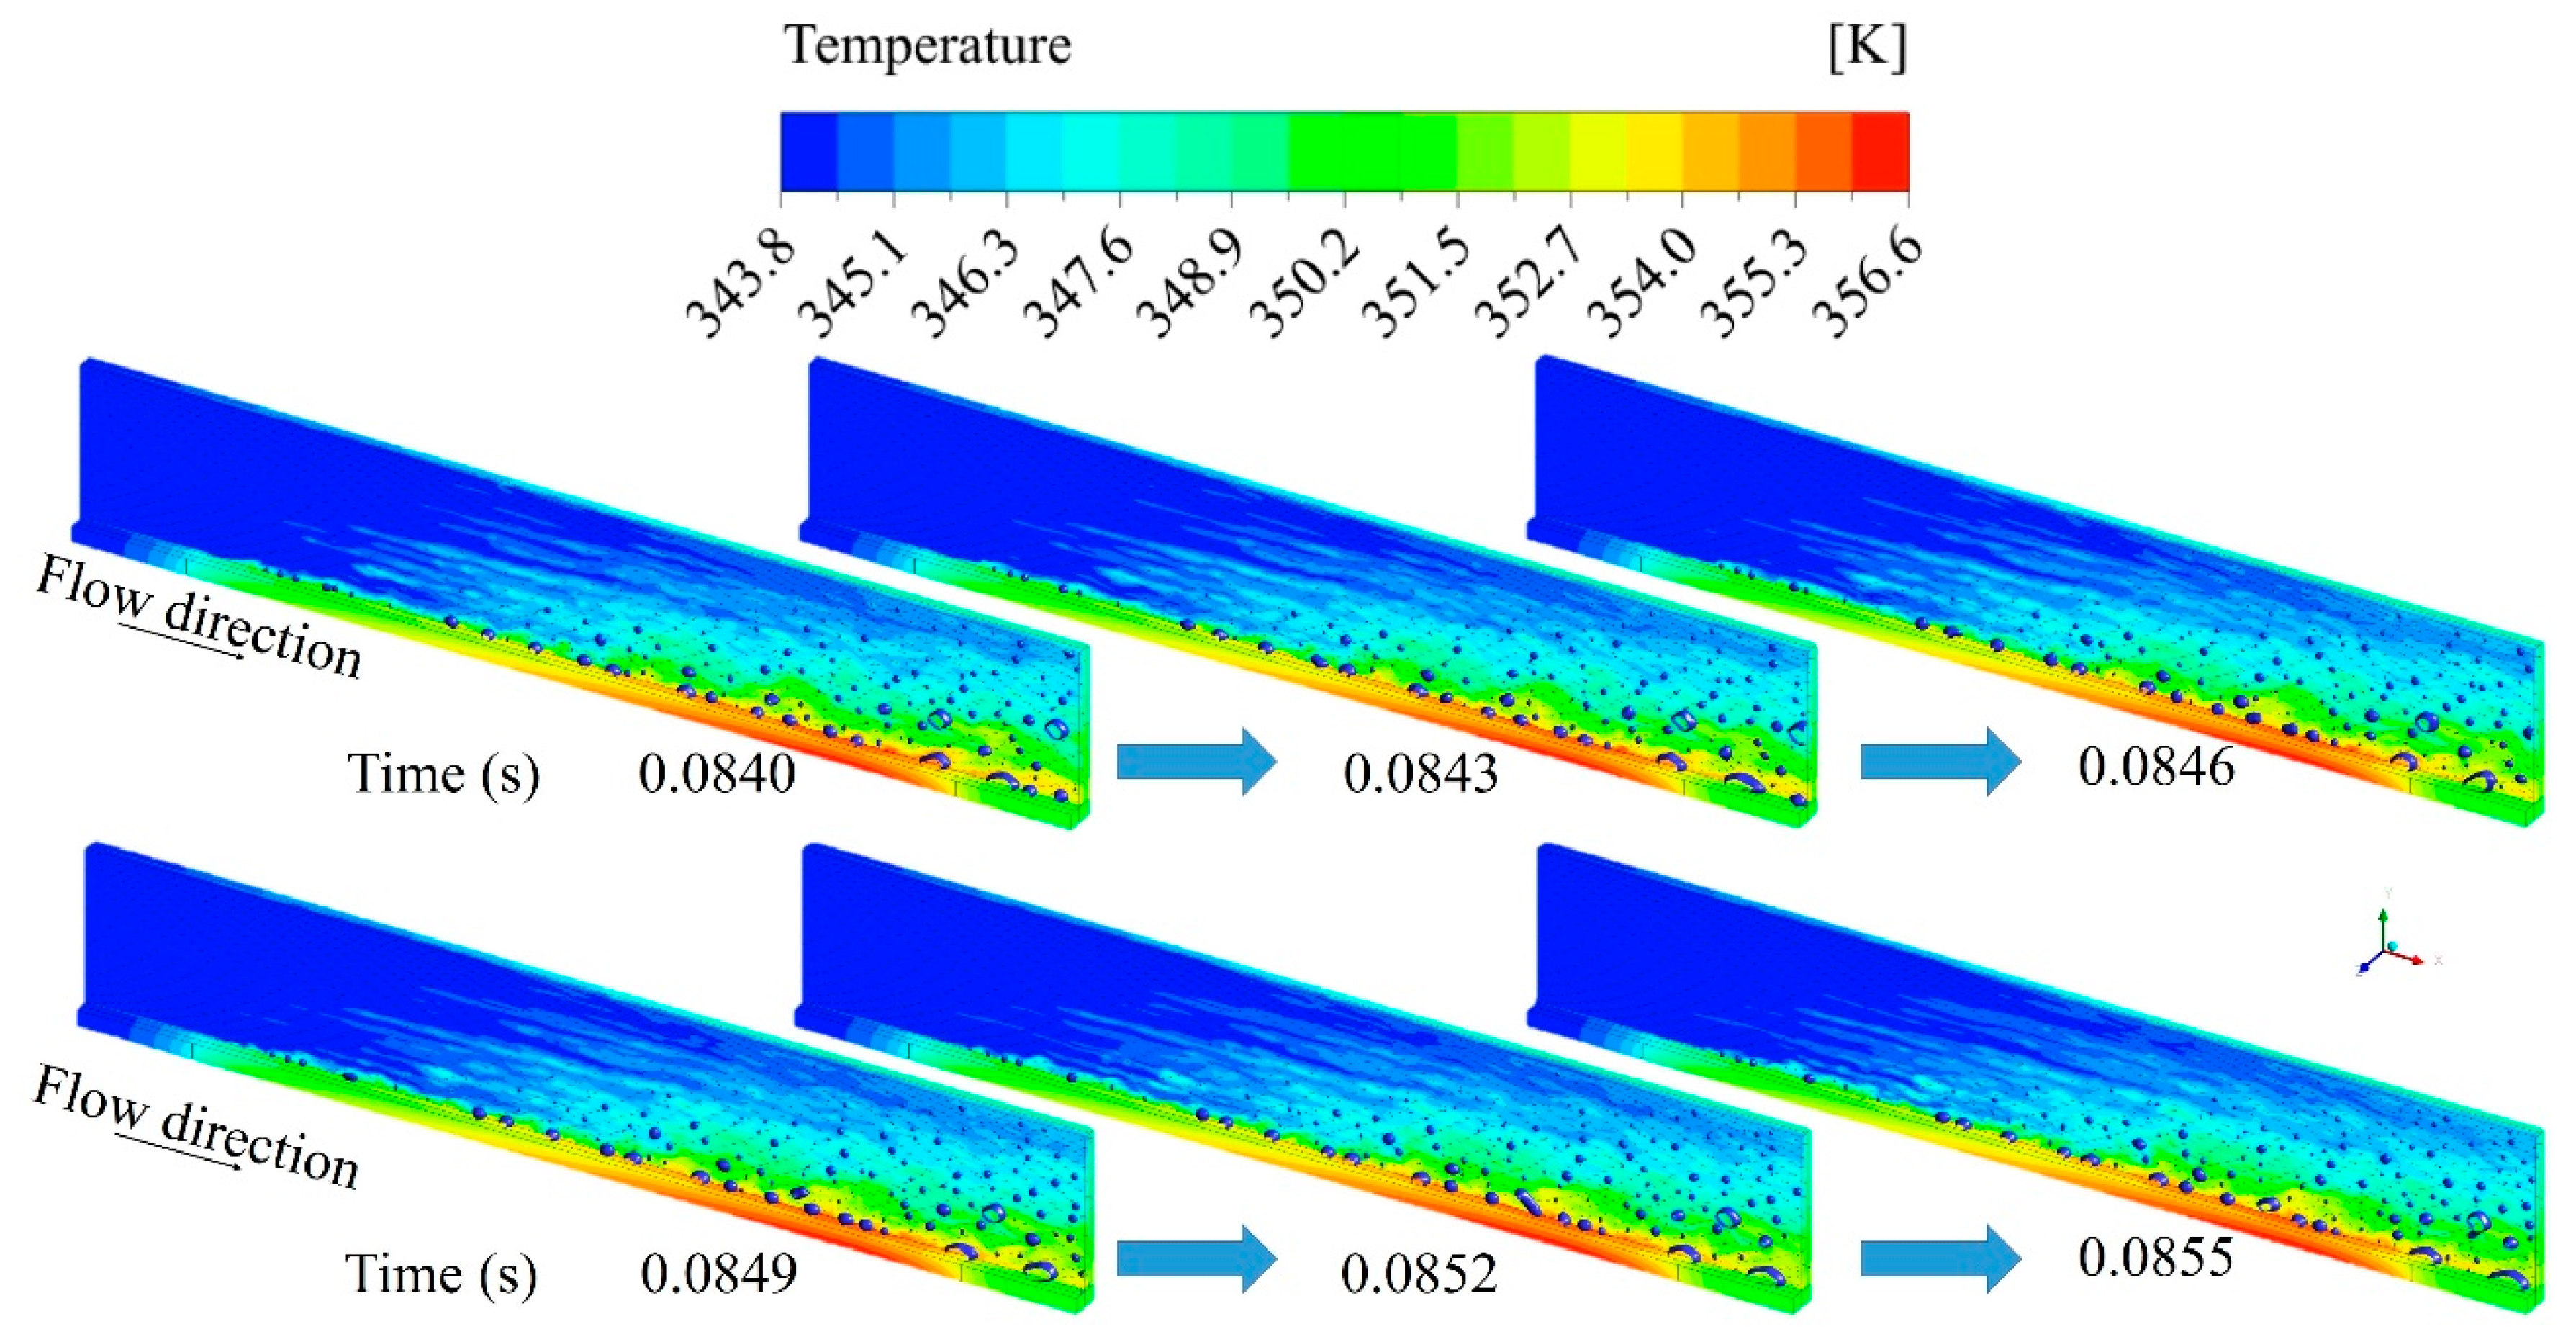
The transient temperature distribution and two-phase flow pattern at G = 700 kg/(m2·s) for the cross-section of 0.2 × 0.5 mm and 0.2 × 2.0 mm are depicted in Figure 11 and Figure 12, respectively. The 3D temperature fields are shown on the base wall, middle plane of the channel, and one side of the wall of microchannel in order to visualize the two-phase interface and bubble behavior, which is represented by the visible blue surface inside the microchannel. Visual inspection of transient velocity vector and bubble trajectory for all cases shows that almost all bubbles (regardless of size) will flow along the length direction (positive x-direction) of the channel at the nucleation height and there is only a small amplitude drift in the height direction (
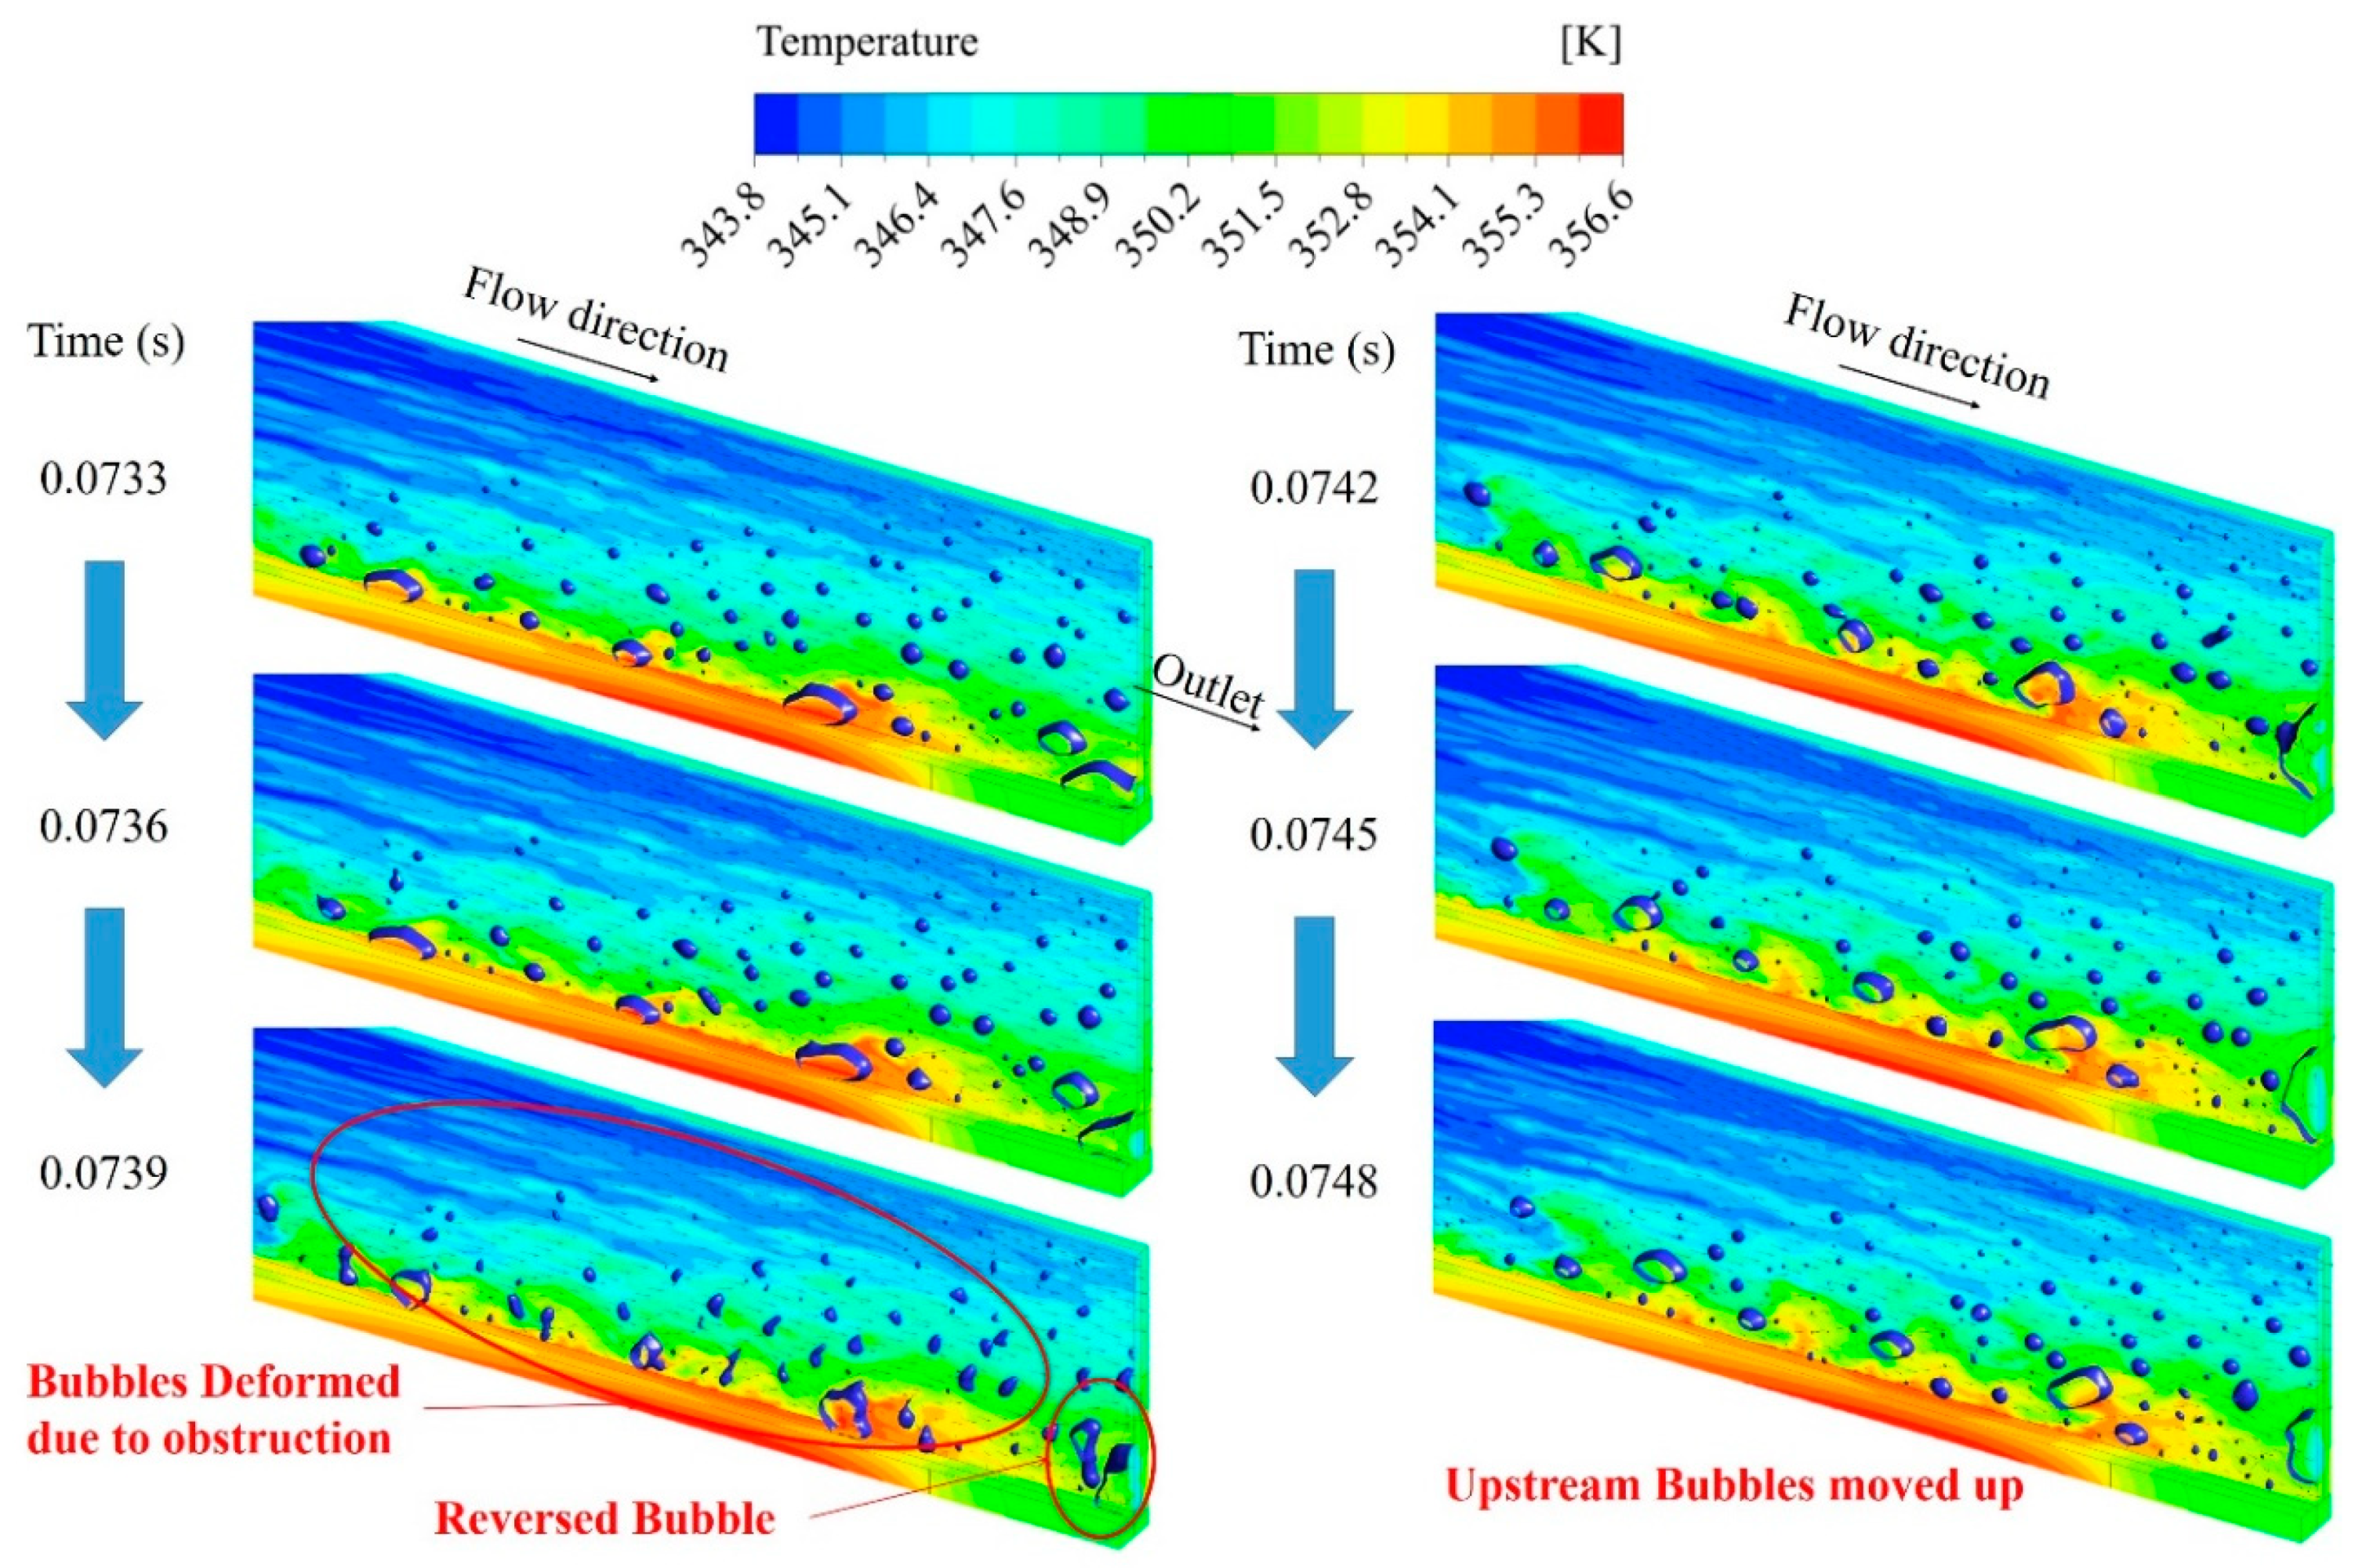
y-direction), which means that the bubbles would not flow to the top of the channel significantly. This confirms that gravity has little effect on microscale two-phase flow and so does buoyancy. However, two flow phenomena can considerably change the flow trajectory of bubbles: bubble coalescence and reversed flow. When two bubbles merge into a larger bubble, the smaller bubbles would be pulled towards the relatively larger bubbles, and the movement of the merged large bubbles would be shifted in the direction of the interaction forces of coalescence. The zoom-in regions in Figure 13 show the phenomenon of reversed flow at the outlet of the channel with the cross section of 0.2 × 2.0 mm at G = 700 kg/(m2·s). Before t = 0.0736 s, all the bubbles move to the outlet based on the aforementioned flow mode; at t = 0.0739 s, the confined large bubble attached to the bottom wall at the outlet shows a trend of backflow; in the following 0.001 s, it has remained basically at the location of the exit with a slight deformation due to the impact of upstream fluid and backflow pressure. Meanwhile, the upstream bubbles rise significantly due to the obstruction of outflow until the reversed flow disappears, and all the bubbles continue to flow to the outlet at the position of rising depth. It is worth noting that when the upstream bubbles move to the upper part of the channel, the temperature of the bottom wall shows a certain degree of temperature drop (a decrease of about 0.4 K) in this process. The main reason for this decrease in temperature is that the strong disturbance due to reversed flow causes the confined bubbles located at bottom wall to float and reduces the large wall superheat. The bottom channel is occupied by the single-phase flow, and the continuous bubble nucleation is achieved to reduce the wall temperature.
With regard to the effects of channel height on bubble behavior, the flow regime at the upper part of the downstream with the cross section of 0.2 × 2.0 mm is mainly dispersed bubble flow or bubble flow (as indicated in Figure 12 and Figure 13). Since the bubbles nucleated at lower part of the channel do not rise, the bubbles in the upper part of the channel can only be generated by nucleation in the upper channel due to the wall superheat. The temperature of the fluid and wall in the upper part of the downstream channel will rise to the temperature required for the phase change in the microchannel with cross section of 0.2 × 2.0 mm. As a result, the obvious nucleation of bubbles occurs only in the upper half of the downstream channel. Since the newly nucleated small bubbles are close to the outlet, they will flow out of the channel before they can be merged into large bubbles. It should be noted that bubble confinement is observed at the bottom of the channel in both cases, but the bubbles attached to the bottom wall in the deeper channel are slenderer. It is found that the flow of the nucleated bubble at the bottom of the channel with a depth of 2.0 mm is slower than the channel with a depth of 0.5 mm, and this phenomenon is particularly obvious upstream. The bubbles are attached to the bottom of the channel and rolled downstream until the size of bubbles is large enough to overcome the surface tension. The larger channel height will reduce the velocity gradient in viscous sublayer, leading to a relatively small inertia force. Bubbles are easier to grow up and gradually roll downstream along the flow direction under the effects of surface tension and viscous force. Although the heat flux and nucleation rate are small in microchannels with a large height, the viscous force is larger compared to the channel with a small height, leading to the appearance of bubble confinement and elongation.
Although the microchannel with a large height can yield a lower wall temperature and a better heat transfer performance, it can be seen from Figure 8 that the flow regime in the first half of the microchannel for the cross-section of 0.2 × 2.0 mm is mainly single-phase flow, and only a small amount of bubbles appear near the exit of the channel. By comparing the temperature distribution of the heating wall along the flow direction, increasing the height of the channel can reduce the temperature rise of the heating wall and improve the uniformity.

3.4. Effect of Channel Width on the Flow Boiling

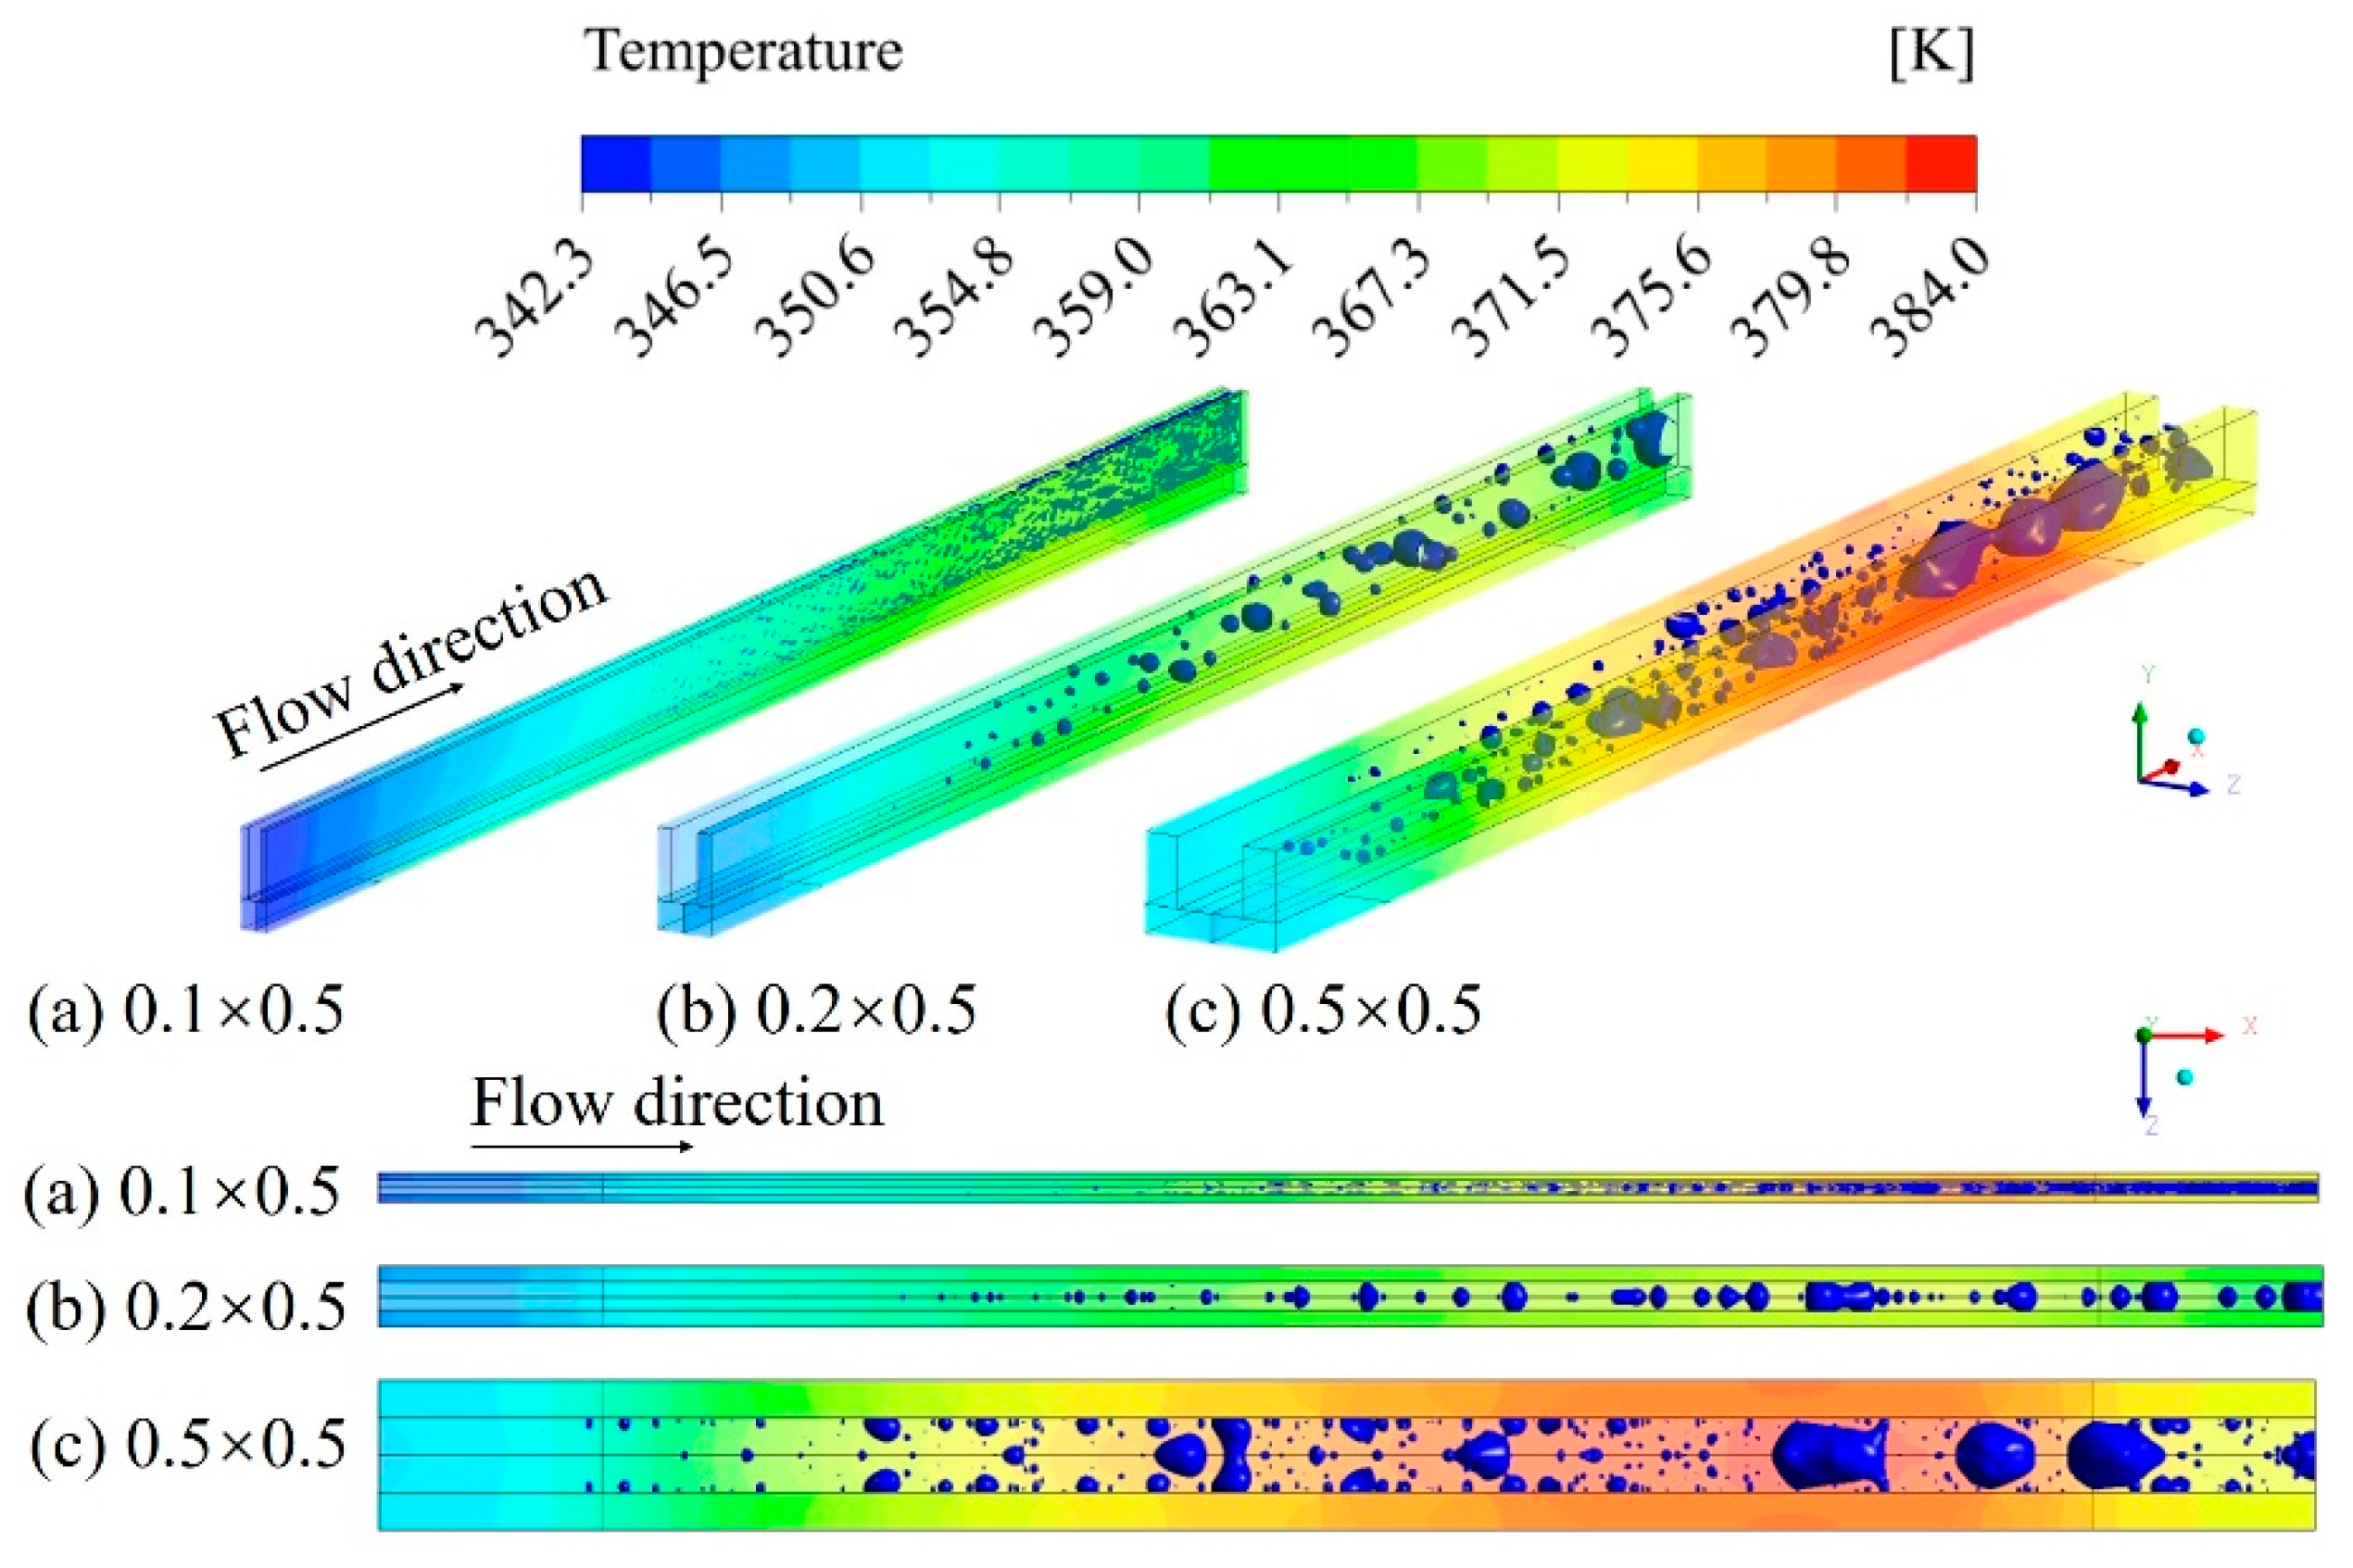
In order to investigate the effects of channel width on the flow boiling, simulations are performed on the flow boiling in microchannels at G = 700 kg/(m2·s) for the cross-section of 0.1 × 0.5 mm, 0.2 × 0.5 mm and 0.5 × 0.5mm, respectively.
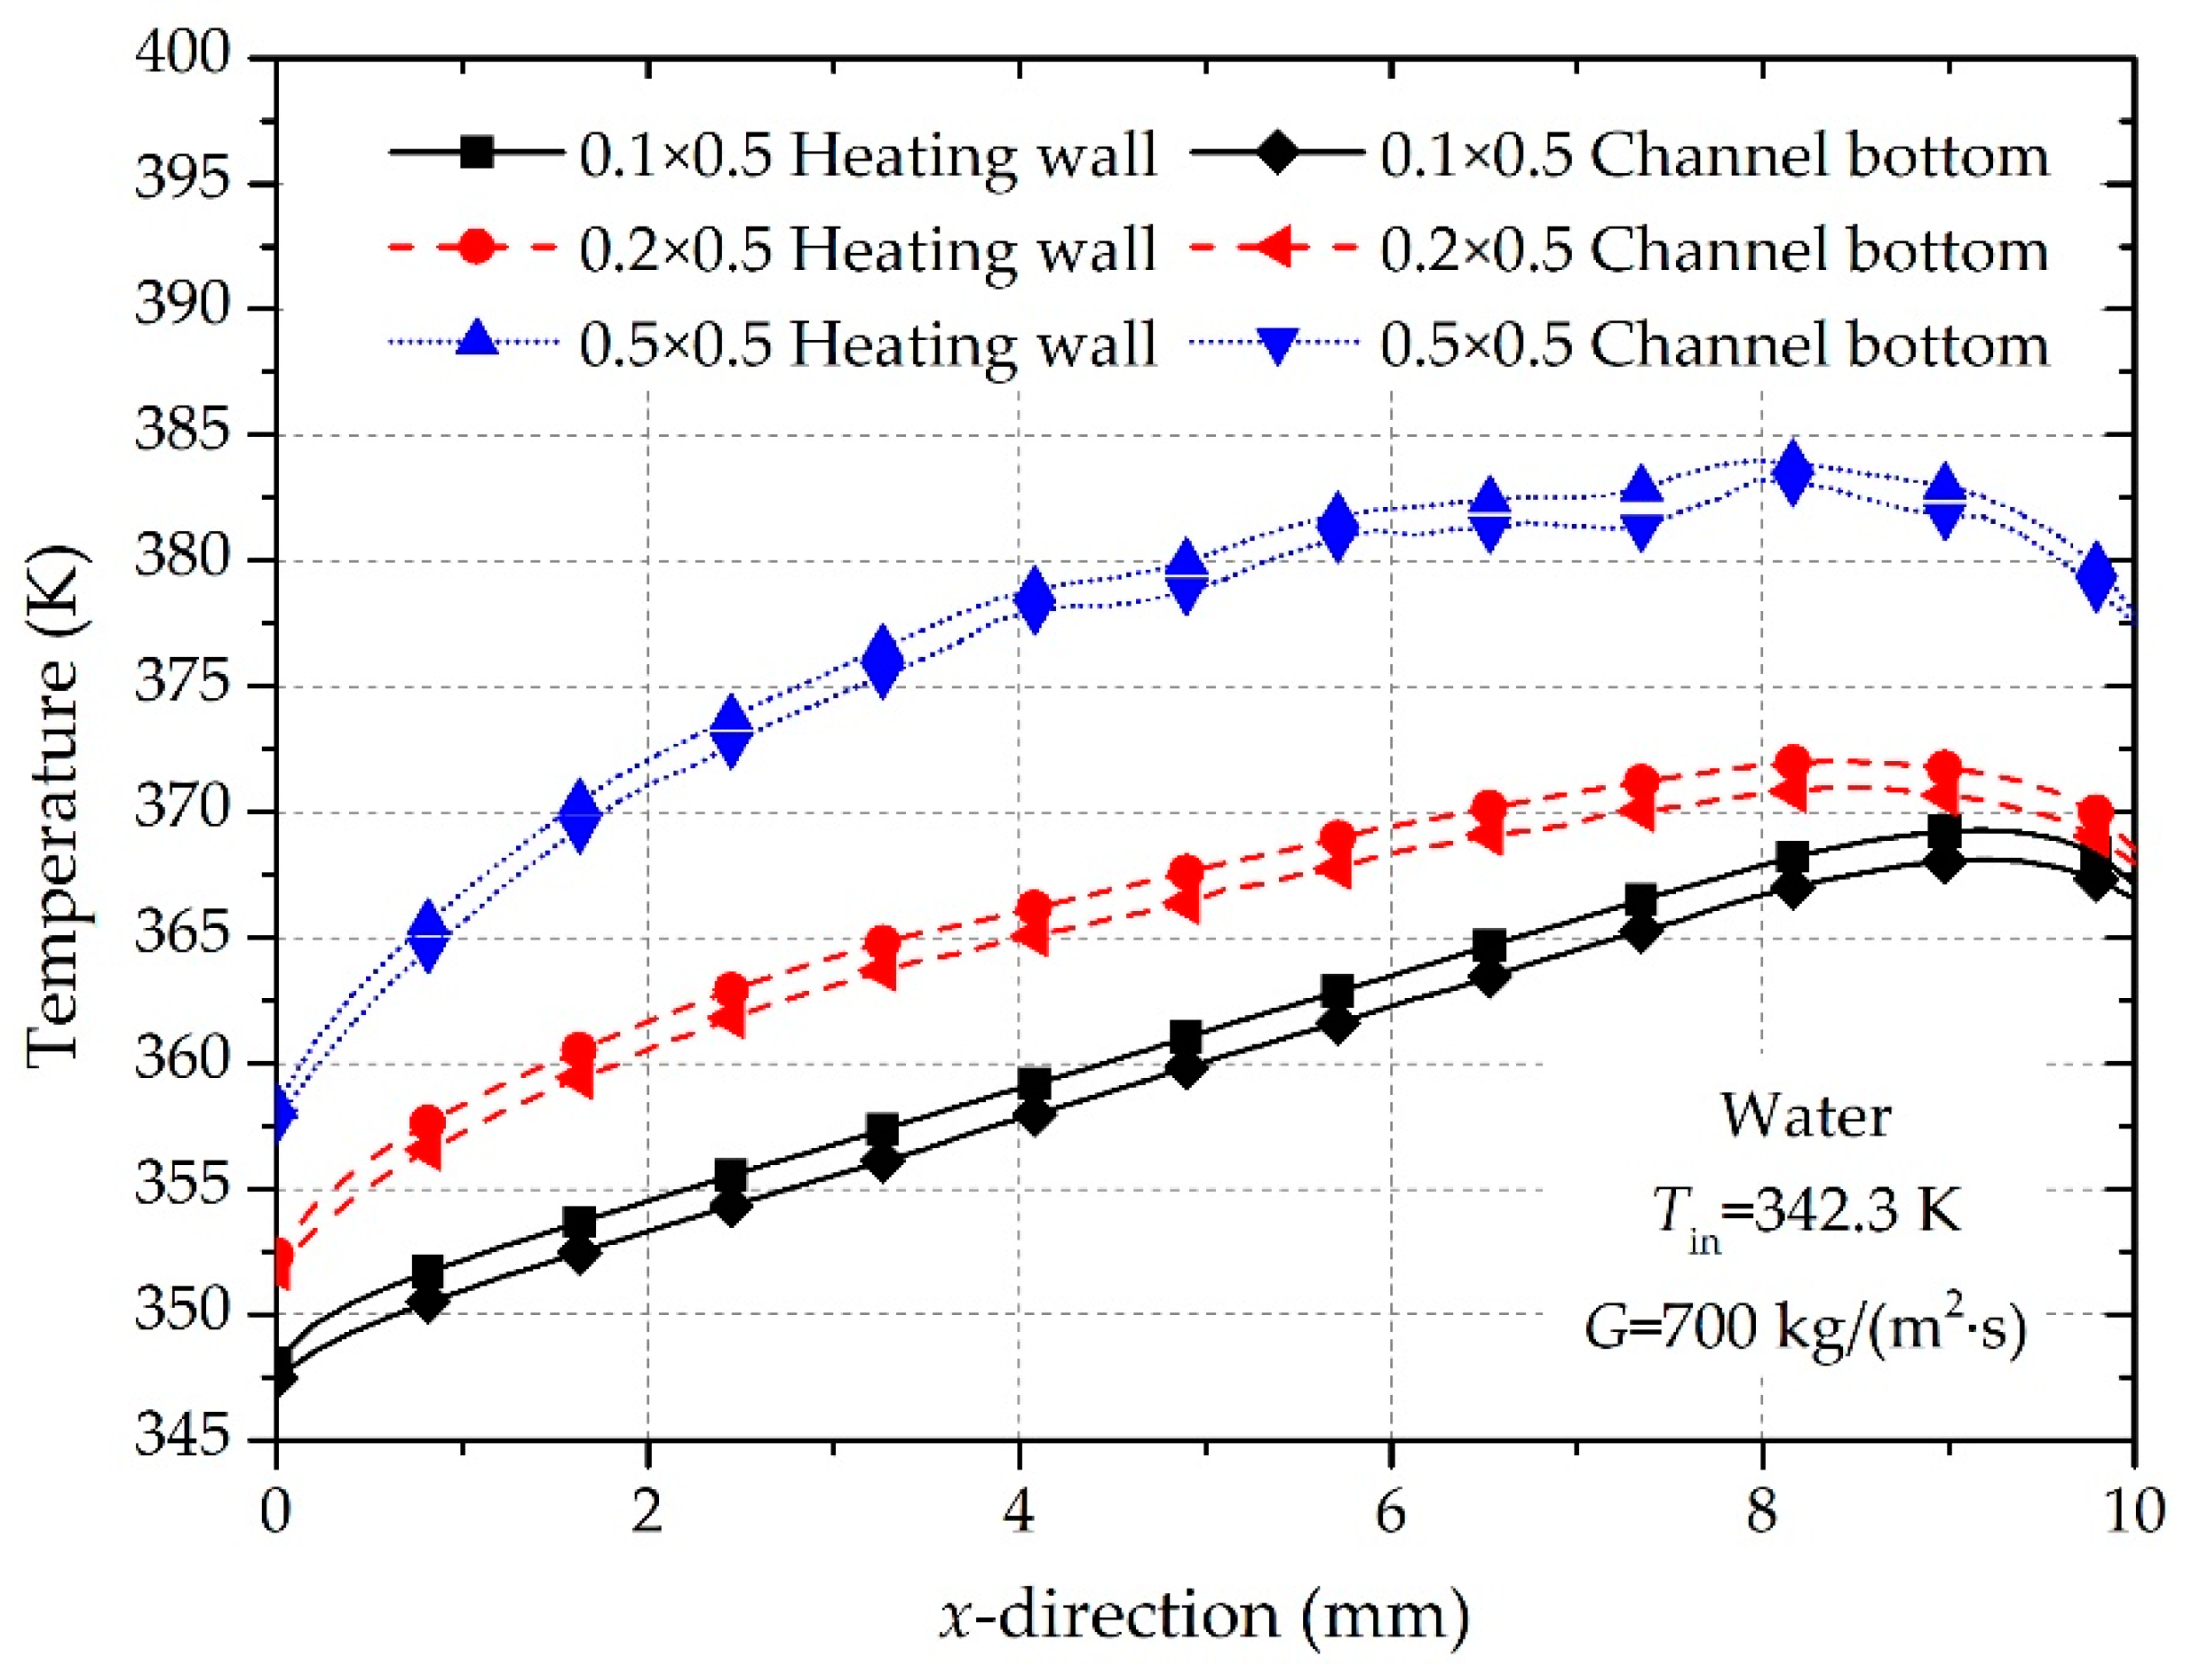
The quasi-steady-state solutions for temperature field and two-phase flow regime for different channel width are shown in Figure 14, and the temperature distribution of the heating wall and the channel bottom wall along the flow direction is shown in Figure 15. It is found that the temperature gradient increases as the channel width increases. The highest fluid temperature increases with the increase in channel width. There are two kinds of flow regimes in the microchannel of 0.1 × 0.5 mm (minimum width): the single-phase flow and the dispersed bubble flow. The flow regimes of micro-channels with the width of 0.2 mm are mainly the bubbly flow and the confined bubble flow. Due to the large width of the channel, the growth and coalescence of bubbles are unrestricted and the large bubble slug flow occurs downstream. The entire fluid domain is in a mixed flow regime in which the dispersed bubble flow and the bubbly flow coexist.
The small width can provide a lower wall superheat and a more uniform temperature distribution along flow stream. This phenomenon is caused by two factors: (2) although the bubble growth is very limited under the small channel width, the bubble becomes a slender gas segment under the action of the inertial force due to the relatively large space before developing into a confined bubble flow. It can be seen that the dispersed bubble flow has a higher heat transfer coefficient and heat dissipation ability. The Nusselt numbers for different cases are listed in Table 4. The case with cross section of 0.5 × 0.5 has the largest Nusselt number because it has a relatively larger hydraulic diameter and a smaller averaged thermal conductivity under similar heat transfer coefficients. Due to the higher wall heat flux and vapor volume fraction, the channel with cross section of 0.5 × 0.5 shows a poorer thermal performance, especially in the temperature distribution. It is also observed that the channel with a cross-section of 0.2 × 1.0 may be the optimal structure due to high Nu, indicating that larger aspect ratio (AR ≥ 10) will not achieve better thermal performance under the same boundary condition. The Nu number results of cases with cross-section of 0.2 × 0.5 for different mass fluxes show that Nu is less sensitive to mass flux because the nucleate boiling dominates the heat transfer.

4. Discussion

In order to provide a point of practical significance and comparison for the predicted heat transfer coefficient in this study, the experimental work about flow boiling of water in rectangular microchannel from the literature was selected. Since the experimental work by Lee and Garimella [30] considered flow boiling of water in parallel rectangular microchannels with different cross sections, the empirical correlation for saturated boiling heat transfer coefficient developed by them was used for comparison with the present CFD results. The width of parallel microchannels adopted in their study covered the range from 102 to 997 μm with channel depth keeping nominally 400 μm, resulting in basically the same hydraulic diameters of microchannels between their works and this study. Based on Chen’ work [31], this correlation was developed to predict laminar flow boiling heat transfer in rectangular microchannels, covering a wide range of heat flux (10–340 W/cm2) and mass flux (222–898 kg/m2·s). Predictions of saturated boiling heat transfer coefficient from this correlation are compared with CFD results as provided in Table 5. It is obvious that most of the CFD results agree to within ±30% of the prediction, with this correlation under-predicting the results of three cases with an aspect ratio greater than 5. This may be due to the aspect ratio of microchannel in the work by Lee and Garimella [30] ranging from 0.37–3.60, and the developed correlation is based on the hydraulic diameter without considering the effect of aspect ratio and confinement. From the previous analysis in Section 3, the aspect ratio can significantly affect the shape of bubble, flow pattern and bubble behavior, resulting in changing the heat transfer performance. At same hydraulic diameter, the large aspect ratio would lead to an increase in heat transfer area (the cross-sections used by Lee and Garimella [30] corresponding to the cases in this study are 0.102 × 0.367 mm, 0.242 × 0.365 mm, and 0.400 × 0.398 mm, with the hydraulic diameter being 0.159, 0.291, and 0.399 m, respectively) and different flow patterns for the present cases, which may explain the enhancement of heat transfer. The deviations of predictive heat transfer coefficient for microchannel with large aspect ratio indicate the need for new predictive tools that can consider the effect of aspect ratio and confinement. Meanwhile, compared with most of the experimental work based on flow boiling of atmospheric pressure water in the literature, flow boiling of low pressure water adopted in this study can achieve smaller wall temperature which can meet the requirement of cooling temperature in thermal management of electronic equipment.
The aspect ratio of rectangular microchannel is an important parameter to determine the flow patterns and heat transfer characteristics of flow boiling. The flow patterns including dispersed bubble flow, bubble flow, confined bubble flow and slug flow are observed as aspect ratio changed under same mass flux in this study, whereas the proportion of the vapor volume fraction increases significantly with the decrease in the mass flux. As the aspect ratio decreases, the bubble volume and regime increase, leading eventually to confined bubble flow and local overheating, which can result in significant non-uniform temperature distribution along the flow stream.
Gravity is another factor that should be considered for the two-phase flow. The gravity effects also have a strong dependence on the channel dimension. In the present study, we include the gravity force in the momentum equations. The trajectory of the bubble is maintained along the flow stream and there is no significant deviation in the height direction for all channel structures. This indicates the gravity effect is not significant compared to the viscous forces and the surface tensions. Moreover, the bubble coalescence and reversed flow can considerably change the flow trajectories of bubbles. Bubbles at the bottom of the channel with a large height flow more slowly and tend to accumulate due to a large viscous force under the same mass flux. An alternative method to reduce the wall temperature in microchannel is to set an obstruction at the bottom of the exit. The present results indicate that the CFD models adopted in this study provide a promising ability to predict the two-phase flow patterns and flow boiling characteristics. A better understanding of bubble behavior, especially flow trajectories for a rectangular microchannel with different aspect ratios, is achieved. The large aspect ratio and high mass flux show remarkable characteristics, including more uniform temperature distribution which provides improvements needed for the cooling system to meet the requirement of very high heat dissipation. The findings of this study can provide guidelines for the heat transfer enhancement and the thermal management design of high-power electronic equipment.

5. Conclusions

In this paper, a three-dimensional CFD model for the flow boiling in very-deep microchannels has been presented. The effects of interface models, channel geometries and working parameters on the flow boiling are analyzed and the following conclusions are obtained:
  • Compared with the dispersed model, the sharp interface model can give more reasonable prediction the two-phase characteristics and flow regimes of water in the microchannel, and dispersed bubble flow, bubble flow, confined bubble flow and slug flow were observed;
  • Nucleate boiling is the dominant mechanism for the cases in the present study. The evolution and transformation of the two-phase flow regime have a significant effect on the flow boiling heat transfer in microchannels. In the microchannel with a small aspect ratio, there is a considerable temperature gradient downstream of the channel, which is mainly related to the accumulation and coalescence of bubbles in the channel, resulting in a confined bubble in the channel and hindering the heat transfer. The main reason for the enhancement of heat transfer performance by reducing the channel width is the increase in heat transfer area;
  • The microchannel with small channel depth and width is liable to cause the dryout, whereas microchannels with large depth-to-width ratio can provide better cooling performance. However, an excessively large channel height can lead to a problem of low utilization of working fluid;
  • At same mass flux, higher channel aspect-ratios can enhance heat transfer performance due to the increase in heat transfer area under the same condition of forced convection. Meanwhile, due to the increase in the cross section, the accumulation of bubbles becomes weaker, resulting in avoiding the dryout on the surface of fins caused by the formation of large bubbles.

Supplementary Materials

The following are available online at https://www.mdpi.com/1996-1073/13/11/2689/s1, Video S1: flow boiling in 0.2 × 2 mm channel, Video S2: flow boiling in 0.2 × 0.5 mm channel, Document S3: fluid and solid properties.

Author Contributions

Conceptualization, L.C. and Y.H.; methodology, L.C. and X.L.; formal analysis, X.L. and K.L.; investigation, X.L. and R.X.; data curation, X.L.; writing—original draft preparation, L.C. and X.L.; writing—review and editing, L.C. and Y.H.; project administration, K.L. and X.Y.; funding acquisition, L.C. All authors have read and agreed to the published version of the manuscript.

Funding

This research was funded by the National Nature Science Foundation of China (51706169), the National key basic research program (613322), and the Open Fund of the Science and Technology on Solid State Laser Laboratory.

Conflicts of Interest

The authors declare no conflict of interest.

Nomenclature

ARaspect ratio
Aiinterfacial area density, m−1
cpspecific heat, J/(kg·K)
CFDcomputational fluid dynamics
CSFcontinuous surface force model
dBbubble diameter, m
Eenergy, J/kg
F volumetric surface tension force, N/m3
g gravitational acceleration, m/s2
Gmass flux, kg/(m2·s)
hheat transfer coefficient, W/(m2·K)
Hheight, m
hlvlatent heat of vaporization, J/kg
kthermal conductivity, W/(m·K)
Llength, m
Mmolar mass, kg/kmol
mvmass flux through the phase interface, kg/(m2·s)
NuNusselt number
n ^ w wall surface normal vector
Ppressure, Pa
qheat flux, W/cm2
Seenergy source term due to phase change, J/(m3·s)
Runiversal gas constant, J/(mol·K)
R1, R2curvature radii, m
Sl,vmass source term due to phase change, kg/(m3·s)
ttime, s
Ttemperature, K
t ^ w surface tangential vector
v velocity vector, m/s
VOFvolume of fluid
Wwidth, m
xcoordinate, m
Xvariable of comparison
ycoordinate, m
zcoordinate, m
Ppressure drop, Pa
Greek symbols
αvolume fraction
βaccommodation coefficient
θcontact angle, deg
κinterface curvature, m−1
λrelaxation time for mass transfer between phases, s−1
μdynamic viscosity, kg/(m·s)
ρdensity, kg/m3
σsurface tension coefficient, N/m
Φ L 0 2 two phase multiplier
Subscripts
aadiabatic surface
bbase wall
chchannel
frfriction
hheating surface
imesh
ininlet
lliquid phase
outoutlet
sside wall
satsaturation
tptwo-phase
vvapor phase
wwall

References

  1. Tuckerman, D.B.; Pease, R.F.W. High-performance heat sinking for VLSI. IEEE Electron Device Lett. 1981, 2, 126–129. [Google Scholar] [CrossRef]
  2. Khan, S.A.; Atieh, M.A.; Koç, M. Micro-Nano Scale Surface Coating for Nucleate Boiling Heat Transfer: A Critical Review. Energies 2018, 11, 3189. [Google Scholar] [CrossRef] [Green Version]
  3. Salimpour, M.R.; Morteza, S.; Ebrahim, S. Constructal Optimization of Microchannel Heat Sinks With Noncircular Cross Sections. Heat Transf. Eng. 2013, 34, 863–874. [Google Scholar] [CrossRef]
  4. Kalaivanan, R.; Rathnasamy, R. Experimental Investigation of Forced Convective Heat transfer in Rectangular Micro-Channels. J. Eng. Appl. Sci. 2010, 5, 383–387. [Google Scholar]
  5. Lorenzini, D.; Joshi, Y.K. Computational Fluid Dynamics Modeling of Flow Boiling in Microchannels With Nonuniform Heat Flux. J. Heat Transf. 2017, 140, 011501. [Google Scholar] [CrossRef]
  6. Dharaiya, V.V.; Kandlikar, S.G. Numerical Investigation of Heat Transfer in Rectangular Microchannels Under H2 Boundary Condition During Developing and Fully Developed Laminar Flow. J. Heat Transf. 2012, 134, 162–168. [Google Scholar] [CrossRef]
  7. Rui, Z.; Hodes, M.; Lower, N.; Wilcoxon, R. High heat flux, single-phase microchannel cooling. In Proceedings of the 2014 Semiconductor Thermal Measurement and Management Symposium (SEMI-THERM), San Jose, CA, USA, 9–13 March 2014; pp. 1–7. [Google Scholar]
  8. Lee, J.; Mudawar, I. Two-phase flow in high-heat-flux micro-channel heat sink for refrigeration cooling applications: Part II—Heat transfer characteristics. Int. J. Heat Mass Transf. 2016, 48, 941–955. [Google Scholar] [CrossRef]
  9. Deng, D.; Pi, G.; Zhang, W.; Wang, P.; Fu, T. Numerical Study of Double-Layered Microchannel Heat Sinks with Different Cross-Sectional Shapes. Entropy 2019, 21, 16. [Google Scholar] [CrossRef] [Green Version]
  10. Jing, D.; He, L. Thermal Characteristics of Staggered Double-Layer Microchannel Heat Sink. Entropy 2018, 20, 537. [Google Scholar] [CrossRef] [Green Version]
  11. Xie, G. Constructal design and thermal analysis of microchannel heat sinks with multistage bifurcations in single-phase liquid flow. Appl. Therm. Eng. 2014, 62, 791–802. [Google Scholar] [CrossRef]
  12. Xie, G.; Li, Y.; Zhang, F.; Sundén, B. Analysis of micro-channel heat sinks with rectangular-shaped flow obstructions. Numer. Heat Transf. 2016, 69, 335–351. [Google Scholar] [CrossRef]
  13. Hung, T.C.; Huang, Y.X.; Yan, W.M. Thermal performance analysis of porous-microchannel heat sinks with different configuration designs. Int. J. Heat Mass Transf. 2013, 66, 235–243. [Google Scholar] [CrossRef]
  14. Lin, L.; Chen, Y.Y.; Zhang, X.X.; Wang, X.D. Optimization of geometry and flow rate distribution for double-layer microchannel heat sink. Int. J. Therm. Sci. 2014, 78, 158–168. [Google Scholar] [CrossRef]
  15. Naphon, P.; Khonseur, O. Study on the convective heat transfer and pressure drop in the micro-channel heat sink. Int. Commun. Heat Mass Transf. 2009, 36, 39–44. [Google Scholar] [CrossRef]
  16. Husain, A.; Kim, K.Y. Shape Optimization of Micro-Channel Heat Sink for Micro-Electronic Cooling. IEEE Trans. Compon. Packag. Technol. 2008, 31, 322–330. [Google Scholar] [CrossRef]
  17. Raghuraman, D.R.; Nagarajan, P.K.; Suresh, S. Thermal performance of higher aspect ratio microchannels using TiO2-water nanofluids. J. Nanosci. Nanotechnol. 2013, 13, 2842–2846. [Google Scholar] [CrossRef] [PubMed]
  18. Raghuraman, D.R.S.; Raj, R.T.K.; Nagarajan, P.K.; Rao, B.V.A. Influence of aspect ratio on the thermal performance of rectangular shaped micro channel heat sink using CFD code. Alex. Eng. J. 2016, 56, 43–54. [Google Scholar] [CrossRef] [Green Version]
  19. Xie, X.L.; Liu, Z.J.; He, Y.L.; Tao, W.Q. Numerical study of laminar heat transfer and pressure drop characteristics in a water-cooled minichannel heat sink. Appl. Therm. Eng. 2009, 29, 64–74. [Google Scholar] [CrossRef]
  20. Brackbill, J.U.; Kothe, D.B.; Zemach, C. A continuum method for modeling surface tension. J. comp. phys. 1992, 100, 335–354. [Google Scholar] [CrossRef]
  21. Vachaparambil, K.J.; Einarsrud, K.E. Comparison of Surface Tension Models for the Volume of Fluid Method. Processes 2019, 7, 542. [Google Scholar] [CrossRef] [Green Version]
  22. Youngs, D. Time-Dependent Multi-material Flow with Large Fluid Distortion. In Numerical Methods in Fluid Dynamics; Morton, K.W., Baines, M.J., Eds.; Academic Press: New York, NY, USA, 1982; Volume 24, pp. 273–285. [Google Scholar]
  23. Lee, W.H. A Pressure Iteration Scheme for Two-Phase Flow Modeling. Multiph. Transp. Fundam. React. Saf. Appl. 1980, 1, 407–431. [Google Scholar]
  24. Schepper, S.C.K.D.; Heynderickx, G.J.; Marin, G.B. Modeling the evaporation of a hydrocarbon feedstock in the convection section of a steam cracker. Comput. Chem. Eng. 2009, 33, 122–132. [Google Scholar] [CrossRef]
  25. Wagner, W.; Cooper, J.R.; Dittmann, A.; Kijima, J.; Kretzschmar, H.J.; Kruse, A.; Mareš, R.; Oguchi, K.; Sato, H.; StoöCker, I. IAPWS Industrial Formulation 1997 for the Thermodynamic Properties of Water and Steam. Trans. ASME J. Eng. Gas Turbine Power 2000, 122, 150–184. [Google Scholar] [CrossRef]
  26. Yekta-fard, M.; Ponter, A.B. Surface Treatment and its Influence on Contact Angles of Water Drops Residing on Teflon and Copper. J. Adhes. 1985, 18, 197–205. [Google Scholar] [CrossRef]
  27. Bertsch, S.S.; Groll, E.A.; Garimella, S.V. A composite heat transfer correlation for saturated flow boiling in small channels. Int. J. Heat and Mass Transf. 2009, 52, 2110–2118. [Google Scholar] [CrossRef] [Green Version]
  28. Ghiaasiaan, S.M. Two-Phase Flow, Boiling, and Condensation in Conventional and Miniature Systems; Cambridge University Press: Cambridge, UK, 2017; pp. 207–227. [Google Scholar]
  29. Müller-Steinhagen, H.; Heck, K. A simple friction pressure drop correlation for two-phase flow in pipes. Chem. Eng. Process Process Intensif. 1986, 20, 297–308. [Google Scholar] [CrossRef]
  30. Lee, P.-S.; Garimella, S.V. Saturated flow boiling heat transfer and pressure drop in silicon microchannel arrays. Int. J. Heat Mass Transf. 2008, 51, 789–806. [Google Scholar] [CrossRef] [Green Version]
  31. Chen, J.C. Correlation for Boiling Heat Transfer to Saturated Fluids in Convective Flow. Ind. Eng. Chem. Process Des. Dev. 1966, 5, 322–329. [Google Scholar] [CrossRef] [Green Version]
Figure 1. (a) Schematic of rectangular microchannel heat sink (b) Simulation domain and boundary conditions.
Energies 13 02689 g001
Figure 2. The discretized hexahedral meshes of the simulation domain of both fluid and solid regions.
Energies 13 02689 g002
Figure 3. Transient temperature field at the symmetrical section of channel for different interface models.
Energies 13 02689 g003
Figure 4. Vapor volume fraction at the symmetrical section of channel for different interface models.
Energies 13 02689 g004
Figure 5. Temperature distribution of the heating wall along the flow stream from simulations using sharp model and dispersed model.
Energies 13 02689 g005
Figure 6. The quasi-steady-state solutions for temperature field and two-phase flow regime for different mass fluxes.
Energies 13 02689 g006
Figure 7. Variations in the local heat transfer coefficient along the flow stream for different mass fluxes.
Energies 13 02689 g007
Figure 8. The quasi-steady-state solutions of temperature field and two-phase flow regime for different channel heights.
Energies 13 02689 g008
Figure 9. Temperature distribution of the heating wall and channel bottom wall along the flow stream for different channel heights.
Energies 13 02689 g009
Figure 10. Variations in the local heat transfer coefficient along the flow stream for different channel heights.
Energies 13 02689 g010
Figure 11. Transient temperature distribution and two-phase flow pattern at G = 700 kg/(m2·s) for the cross-section of 0.2 × 0.5 mm.
Energies 13 02689 g011
Figure 12. Transient temperature distribution and two-phase flow pattern at G = 700 kg/(m2·s) for the cross-section of 0.2 × 2.0 mm.
Energies 13 02689 g012
Figure 13. Zoomed view of transient temperature distribution and two-phase flow pattern near the outlet at G = 700 kg/(m2·s) for the cross-section of 0.2 × 2.0 mm.
Energies 13 02689 g013
Figure 14. The quasi-steady-state solutions for temperature field and the two-phase flow regime for different channel widths.
Energies 13 02689 g014
Figure 15. Temperature distribution of the heating wall and the channel bottom wall along the flow direction for different channel widths.
Energies 13 02689 g015
Table 1. Details of computational geometry and operating conditions.
Channel Width Wch (mm)Channel Height Hch (mm)Mass Flux G (kg·m−2·s−1)
0.10.5700
0.20.5700, 521.7, 300
0.21.0700
0.22.0700
0.50.5700
Table 2. Results of the mesh independence analysis.
MeshNumber of Cells Δ P ( Pa ) | ( Δ P i Δ P i + 1 ) / Δ P i | T w | ( T w i T w i + 1 ) / T w i |
Mesh177,12817025.9 × 10−23985.1 × 10−3
Mesh2147,82018025.8 × 10−23969.8 × 10−4
Mesh3306,38419083.4 × 10−23961.6 × 10−3
Mesh4564,30019733.2 × 10−33953.0 × 10−3
Mesh51,052,3521979394
Table 3. Comparison of heat transfer coefficient and two-phase pressure drop determined by the numerical simulations and the correlation.
Channel Dimension Wch × Hch (G) (mm)hCFD (W·m−2·K−1)hcorrelation (W·m−2·K−1)Deviation (%)Ptp,CFD (Pa)Ptp,correlation (Pa)Deviation (%)
0.2 × 0.5 (700)49,41057,23513.7378637042.2
0.2 × 1.0 (700)57,69056,4502.23542317510.4
0.2 × 1.0 (782.6)57,88056,8201.9381839683.9
0.2 × 2.0 (700)51,23055,9158.4283029102.9
0.5 × 0.5 (700)54,39554,6500.52387211711.3
Table 4. Comparison of Nusselt number for different cases.
Channel Dimension Wch × Hch (mm)Massflux (kg·m−2·s−1)AR Hch/WchHydraulic Diameter (mm)have (W·m−2·K−1)Nusselt Number (Nu)
0.1 × 0.57005.00.16748,65012.8
0.2 × 0.57002.50.28649,41022.6
0.2 × 1.070050.33357,69030.3
0.2 × 2.0700100.36451,23028.9
0.5 × 0.570010.50054,39544.8
0.2 × 0.53002.50.28637,05520.3
0.2 × 0.5521.72.50.28647,73022.8
Table 5. Comparison of the saturated flow boiling heat transfer results with predictions from the correlation proposed by Lee and Garimella.
Channel Dimension Wch × Hch (mm)Massflux (kg·m−2·s−1)Hydraulic Diameter (mm)hCFD (W·m−2·K−1)hcorrelation (W·m−2·K−1)Deviation (%)
0.1 × 0.57000.16748,65039,72018.4
0.2 × 0.57000.28649,41046,6705.5
0.2 × 1.07000.33357,69040,25030.2
0.2 × 2.07000.36451,23036,51028.7
0.5 × 0.57000.50054,39558,3157.2
0.2 × 0.53000.28637,05541,98013.3
0.2 × 0.5521.70.28647,73044,6406.5

