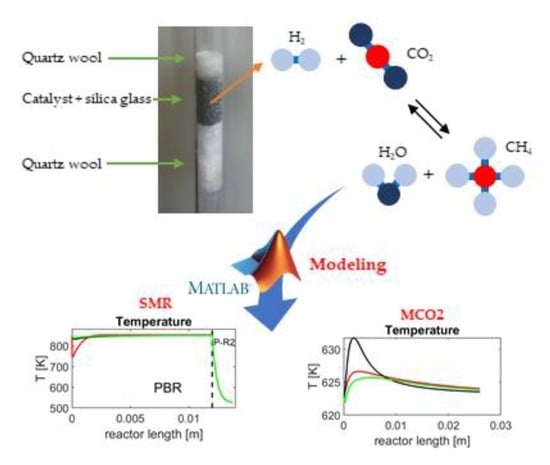
Modeling of Laboratory Steam Methane Reforming and CO2 Methanation Reactors

 ,
,  ,
, 
Abstract
:
1. Introduction
2. Experimental
2.1. Materials
2.2. Homemade Catalyst Preparation
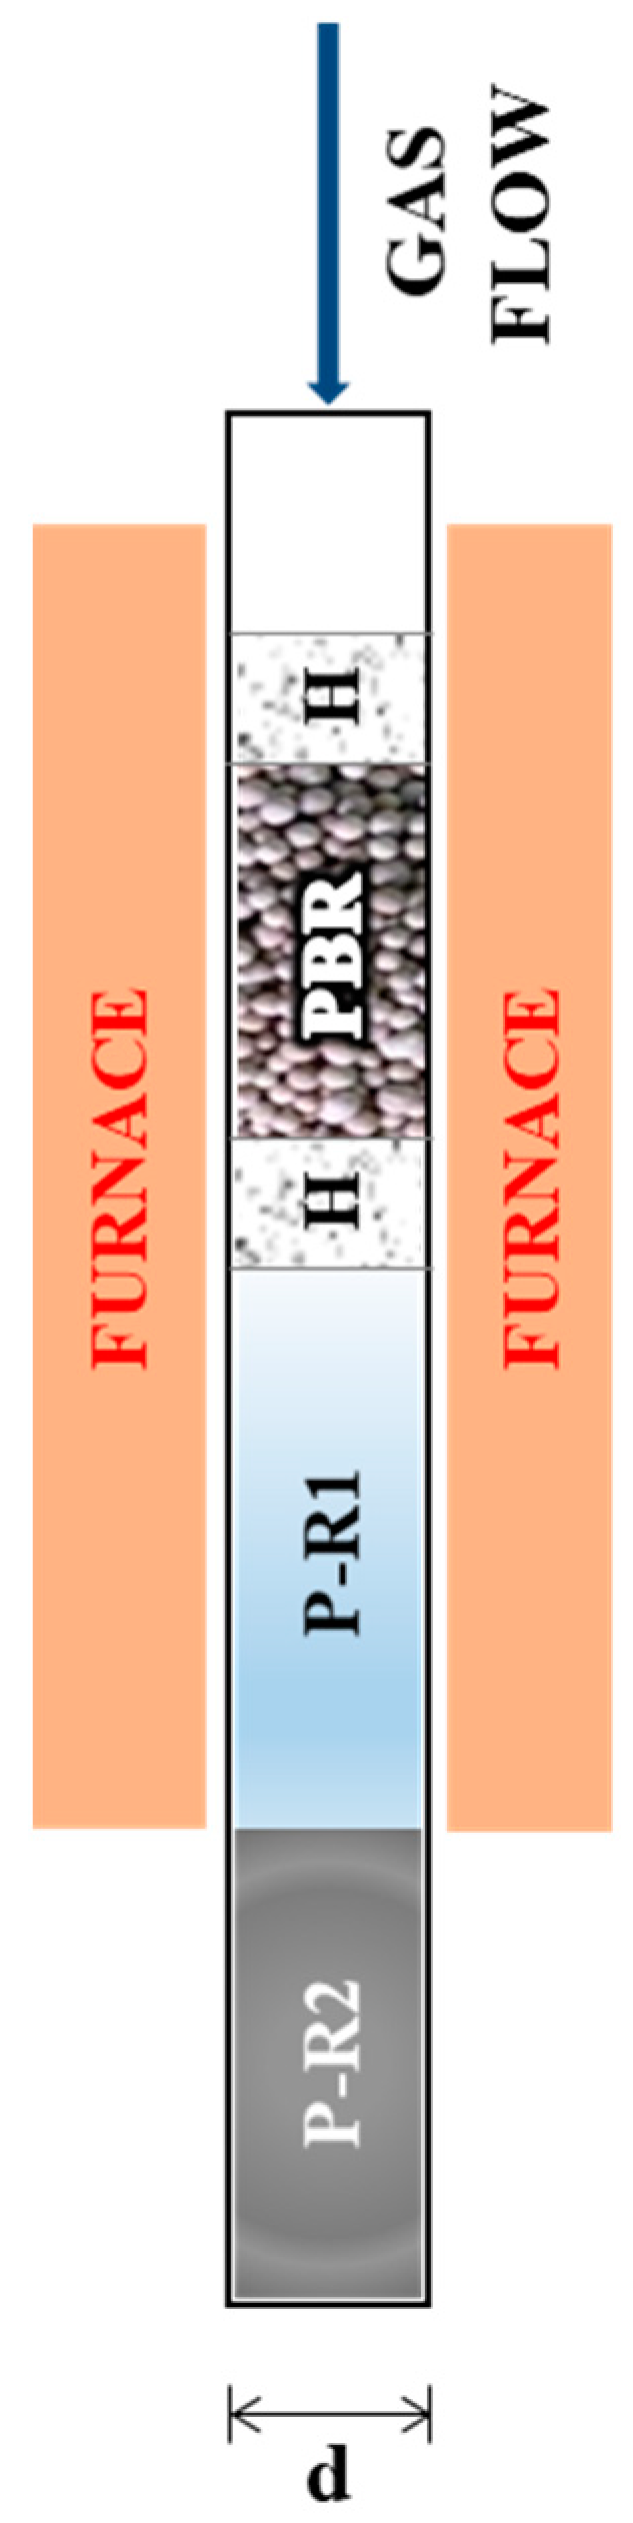
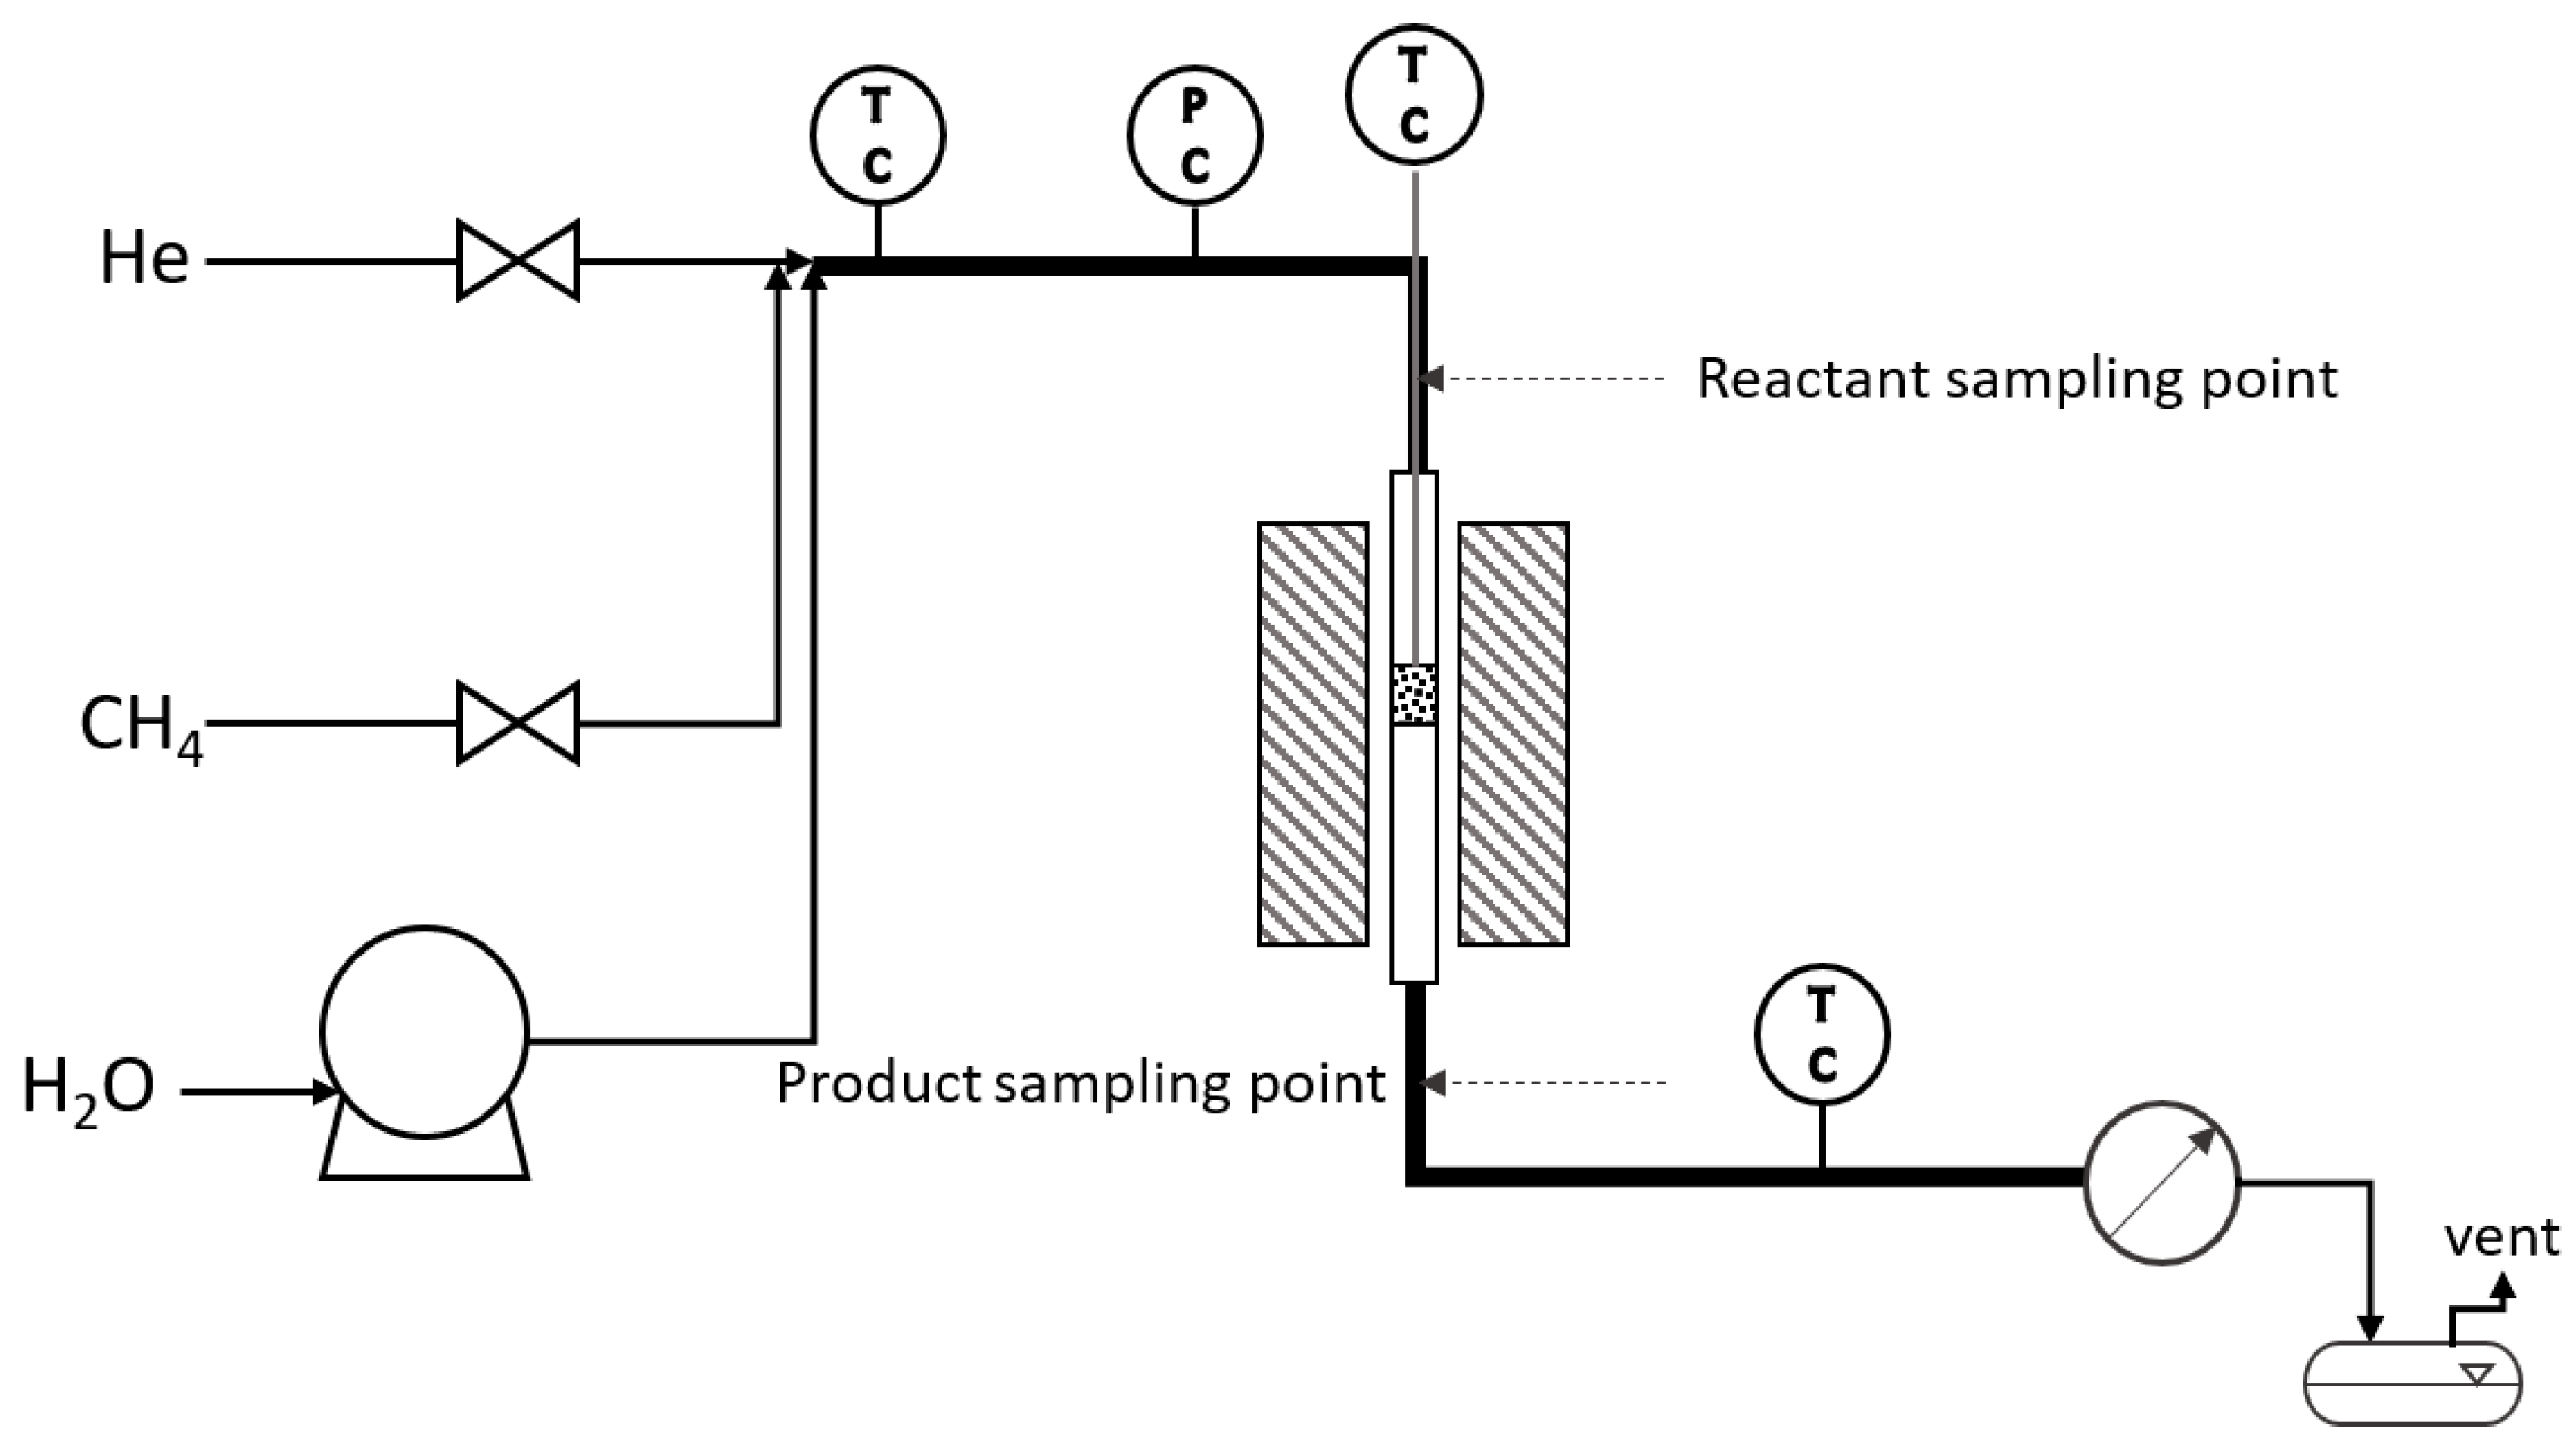
2.3. Laboratory Reactors
2.4. Catalytic Experiments
3. Modeling
3.1. PBR Model
3.1.1. Local Balance Equation
3.1.2. Heat Transport Properties
3.1.3. Evaluation of Pe
3.1.4. Ni-Based Catalyst Kinetics
3.2. P-R1 and P-R2 Model
3.2.1. Gas Phase WGS Kinetics
3.2.2. Metal Tube WGS Kinetics
3.3. Kinetic Parameters
3.4. Thermodynamic Equilibrium
3.5. Numerical Integration
4. Results and Discussion
4.1. MCO2 Laboratory Reactor
4.2. SMR Laboratory Reactor
5. Conclusions
- A steady-state, pseudo-homogeneous 1D non-isothermal model was proposed, which was specifically developed for the laboratory experimental reactors, and was intended to guide the development of small size SMR and MCO2 reactors in the context of P2X studies.
- The model was based on local mass and energy balances, written in the typical form adopted for PBRs, coupled to a local kinetics. The Xu and Froment local kinetics model [5] was applied.
- Simulated results of composition and temperature profiles along the reactors show that non-uniformities were significant in the laboratory experimental reactors.
- Progress of the WGS reaction in the discharge piping was studied, which is more easily included in the simulation model rather than prevented in the experimental apparatus [17,18,19]. The WGS reaction occurring in the metal piping downstream of the reactor was well simulated through the corresponding kinetic equation proposed by Xu and Froment [5].
Author Contributions
Funding
Acknowledgments
Conflicts of Interest
Abbreviations
| GHSV | Gas Hourly Space Velocity | |
| GRR | Global Reforming Reaction | |
| HMMC | Homemade Methanation Catalyst | |
| JM | Johnson Matthey | |
| MCO | Methanation of CO | |
| MCO2 | Methanation of CO2 | |
| ODE | Ordinary Differential Equation | |
| PBR | Packed Bed Reactor | |
| P-R | Post Reactor | |
| P2X | Power-to-X | |
| revGRR | reverse of Global Reforming Reaction | |
| revSMR | reverse of Steam Methane Reforming | |
| revWGS | reverse of Water Gas Shift | |
| RTP | Reference temperature and pressure (273.15 K and 101.325 kPa) | |
| SMR | Steam Methane Reforming | |
| SR | Steam Reforming | |
| WGS | Water Gas Shift | |
| Symbols used | ||
| A | pre-exponential factor in Equation (32) | (-) for WGS—(atm2) for SMR |
| a | surface to volume ratio | (m−1) |
| B | parameter in Equation (15) | (-) |
| Ci | molar concentration of the ith component | (mol m−3) |
| cpi | specific heat for the ith component | (kJ mol−1 K−1) |
| D | mass diffusivity | (m2 s−1) |
| d | tube diameter | (m) |
| dP | particle diameter | (m) |
| , , | activation energies | (kJ mol−1) |
| EK | energy parameter in Equation (32) | (kJ mol−1) |
| Fi | ith component molar flowrate | (mol s−1) |
| h | convective heat exchange coefficient | (W m−2 K−1) |
| ΔH°298K | standard reaction enthalpy | (kJ mol−1) |
| ΔHi | adsorption enthalpy of component i (Equation (27)) | (kJ mol−1) |
| , , | adsorption constants in Equation (27) | (bar−1) |
| adsorption constant for H2O in Equation (27) | (-) | |
| , | equilibrium constants of GRR and SMR | (Pa2) |
| equilibrium constant of WGS | (-) | |
| , | kinetic rates of GRR and SMR | (kmol bar0.5 kgcat−1 h−1) |
| kinetic rate of WGS | (kmol bar−1 kgcat−1 h−1) | |
| kinetic rate of WGS in Equation (28) | (m1.5 mol–0.5 s−1) | |
| kinetic rate of WGS in Equation (30) | (m2 s−1) | |
| k | thermal conductivity | (W m−1 K−1) |
| L | characteristic dimension | (m) |
| l | length | (m) |
| Nu | Nusselt number | (-) |
| pi | partial pressure of the ith component | (bar) |
| Pem | mass transfer Péclet number | (-) |
| Peth | thermal Péclet number | (-) |
| Pr | Prandtl number | (-) |
| rj | reaction rate of the jth reaction | (mol m−3 s−1) |
| R | ideal gas constant | (J mol−1 K−1) |
| Re | Reynolds number | (-) |
| s | tube wall thickness | (m) |
| Si | selectivity to product i | (-) |
| T | temperature | (K) |
| U | overall heat transfer coefficient | (W m−2 K−1) |
| us | superficial velocity | (m s−1) |
| V | volume | (m3) |
| XCH4, XCO2 | methane and carbon dioxide conversion | (-) |
| Yi | yield in product i | (-) |
| Greek letters | ||
| ε | catalyst bed void fraction | (-) |
| ζi | parameters in Table 3 | (-) |
| ηj | effectiveness factor for the jth reaction | (-) |
| κ | ratio between solid and gas thermal conductivities | (-) |
| ρ | density | (kg m−3) |
| νij | stoichiometric coefficient of the ith component in the jth reaction | (-) |
| τ | tortuosity | (-) |
| Subscripts | ||
| ax | axial | |
| f | fluid | |
| i | component index | |
| in | inlet | |
| j | reaction index | |
| out | outlet | |
| r | radial | |
| s | solid | |
| w | wall | |
References
- Rostrup-Nielsen, J.R.; Sehested, J.; Nørskov, J.K. Hydrogen and Synthesis Gas by Steam and CO2 Reforming. Adv. Catal. 2002, 47, 65–139. [Google Scholar] [CrossRef]
- Aasberg-Petersen, K.; Dybkjær, I.; Ovesen, C.V.; Schjødt, N.C.; Sehested, J.; Thomsen, S.G. Natural gas to synthesis gas—Catalysts and catalytic processes. J. Nat. Gas Sci. Eng. 2011, 3, 423–459. [Google Scholar] [CrossRef]
- Chen, B.; Hajimolana, Y.S.; Venkataraman, V.; Ni, M.; Aravind, P.V. Integration of reversible solid oxide cells with methane synthesis (ReSOC-MS) in grid stabilization: A dynamic investigation. Appl. Energy 2019, 250, 558–567. [Google Scholar] [CrossRef]
- Greco, A.; Sorce, A.; Littwin, R.; Costamagna, P.; Magistri, L. Reformer faults in SOFC systems: Experimental and modeling analysis, and simulated fault maps. Int. J. Hydrog. Energy 2014, 39, 21700–21713. [Google Scholar] [CrossRef]
- Xu, J.; Froment, G.F. Methane Steam Reforming, Methanation and Water-Gas Shift: I. Intrinsic Kinetics. AIChE J. 1989, 35, 88–96. [Google Scholar] [CrossRef]
- Rönsch, S.; Schneider, J.; Matthischke, S.; Schlüter, M.; Götz, M.; Lefebvre, J.; Prabhakaran, P.; Bajohr, S. Review on methanation - From fundamentals to current projects. Fuel 2016, 166, 276–296. [Google Scholar] [CrossRef]
- Zeppieri, M.; Villa, P.L.; Verdone, N.; Scarsella, M.; De Filippis, P. Kinetic of methane steam reforming reaction over nickel- and rhodium-based catalysts. Appl. Catal. A Gen. 2010, 387, 147–154. [Google Scholar] [CrossRef]
- Delgado, K.; Maier, L.; Tischer, S.; Zellner, A.; Stotz, H.; Deutschmann, O. Surface Reaction Kinetics of Steam- and CO2-Reforming as Well as Oxidation of Methane over Nickel-Based Catalysts. Catalysts 2015, 5, 871–904. [Google Scholar] [CrossRef] [Green Version]
- Khzouz, M.; Gkanas, E.I. Experimental and Numerical Study of Low Temperature Methane Steam Reforming for Hydrogen Production. Catalysts 2017, 8, 5. [Google Scholar] [CrossRef] [Green Version]
- Parlikkad, N.R.; Chambrey, S.; Fongarland, P.; Fatah, N.; Khodakov, A.; Capela, S.; Guerrini, O. Modeling of fixed bed methanation reactor for syngas production: Operating window and performance characteristics. Fuel 2013, 107, 254–260. [Google Scholar] [CrossRef]
- Schlereth, D.; Hinrichsen, O. Chemical Engineering Research and Design A fixed-bed reactor modeling study on the methanation of CO2. Chem. Eng. Res. Des. 2013, 92, 702–712. [Google Scholar] [CrossRef]
- Mokheimer, E.M.A.; Ibrar Hussain, M.; Ahmed, S.; Habib, M.A.; Al-Qutub, A.A. On the Modeling of Steam Methane Reforming. J. Energy Resour. Technol. 2014, 137, 012001. [Google Scholar] [CrossRef]
- Pantoleontos, G.; Skevis, G.; Karagiannakis, G.; Konstandopoulos, A.G. A Heterogeneous Multiscale Dynamic Model for Simulation of Catalytic Reforming Reactors. Int. J. Chem. Kinet. 2016, 48, 239–252. [Google Scholar] [CrossRef]
- Pugliese, F.; Trucco, A.; Moser, G.; Costamagna, P. Diagnostics and Prognostics-Oriented Modeling of an NGSR Fuel Processor for Application in SOFC Systems. Fuel Cells 2017, 17, 517–534. [Google Scholar] [CrossRef] [Green Version]
- Abbas, S.Z.; Dupont, V.; Mahmud, T. Modelling of high purity H2 production via sorption enhanced chemical looping steam reforming of methane in a packed bed reactor. Fuel 2017, 202, 271–286. [Google Scholar] [CrossRef]
- Pashchenko, D. Numerical study of steam methane reforming over a pre-heated Ni-based catalyst with detailed fluid dynamics. Fuel 2019, 236, 686–694. [Google Scholar] [CrossRef]
- Ahmed, K.; Föger, K. Approach to equilibrium of the water-gas shift reaction on a Ni/zirconia anode under solid oxide fuel-cell conditions. J. Power Sources 2001, 103, 150–153. [Google Scholar] [CrossRef]
- Bustamante, F.; Enick, R.M.; Cugini, A.V.; Killmeyer, R.P.; Howard, B.H.; Rothenberger, K.S.; Ciocco, M.V.; Morreale, B.D.; Chattopadhyay, S.; Shi, S. High-temperature kinetics of the homogeneous reverse water-gas shift reaction. AIChE J. 2004, 50, 1028–1041. [Google Scholar] [CrossRef]
- Bustamante, F.; Enick, R.M.; Killmeyer, R.P.; Howard, B.H.; Rothenberger, K.S.; Cugini, A.V.; Morreale, B.D.; Ciocco, M.V. Uncatalyzed and wall-catalyzed forward water-gas shift reaction kinetics. AIChE J. 2005, 51, 1440–1454. [Google Scholar] [CrossRef]
- Bartholomew, C.H.; Farrauto, R.J. Fundamentals of Industrial Catalytic Process, 2nd ed.; Wiley Interscience: Hoboken, NJ, USA, 2005; ISBN 9780471457138. [Google Scholar]
- Carlsson, M. Carbon Formation in Steam Reforming and Effect of Potassium Promotion. Johns. Matthey Technol. Rev. 2015, 59, 313–318. [Google Scholar] [CrossRef]
- Adrados, A.; Lopez-Urionabarrenechea, A.; Acha, E.; Solar, J.; Caballero, B.M.; de Marco, I. Hydrogen rich reducing gases generation in the production of charcoal from woody biomass carbonization. Energy Convers. Manag. 2017, 148, 352–359. [Google Scholar] [CrossRef]
- Forrest, S.J.K.; Oliver, J.G.; French, S.A.; Carlsson, M.P.U. Catalyst Preparation Method. U.S. Patent 9,463,441, 11 October 2016. [Google Scholar]
- Cross, J.; Jones, G.; Kent, M.A. An introduction to pre-reforming catalysis. In Nitrogen+Syngas 341; 2016; pp. 40–48. [Google Scholar]
- Garbarino, G.; Chitsazan, S.; Phung, T.K.; Riani, P.; Busca, G. Preparation of supported catalysts: A study of the effect of small amounts of silica on Ni/Al2O3 catalysts. Appl. Catal. A Gen. 2015, 505, 86–97. [Google Scholar] [CrossRef]
- Fogler, H.S. Elements of Chemical Reaction Engineering, 4th ed.; Prentice Hall: Upper Saddle River, NJ, USA, 2005; ISBN 9780130473944. [Google Scholar]
- Lemcoff, N.O.; Pereira Duarte, S.I.; Martinez, O.M. Heat transfer in packed beds. Rev. Chem. Eng. 1990, 6, 229–292. [Google Scholar]
- Koning, G.W. Heat and Mass Transport in Tubular Packed Bed Reactors at Reacting and Non-Reacting Conditions: Experiments and Models; University of Twente: Enschede, The Netherlands, 2002. [Google Scholar]
- Froment, G.F.; Bischoff, K.B.; De Wilde, J. Chemical Reactor Analysis and Design, 3rd ed.; John Wiley & Sons: New York, NY, USA, 2011; ISBN 9780470565414. [Google Scholar]
- Rout, K.R.; Jakobsen, H.A. A numerical study of fixed bed reactor modelling for steam methane reforming process. Can. J. Chem. Eng. 2015, 93, 1222–1238. [Google Scholar] [CrossRef]
- Oliveira, E.L.G.; Grande, C.A.; Rodrigues, A.E. Steam Methane Reforming in a Ni/Al2O3 Catalyst: Kinetics and Diffusional Limitations in Extrudates. Can. J. Chem. Eng. 2009, 87, 945–956. [Google Scholar] [CrossRef]
- Schädel, B.T.; Duisberg, M.; Deutschmann, O. Steam reforming of methane, ethane, propane, butane, and natural gas over a rhodium-based catalyst. Catal. Today 2009, 142, 42–51. [Google Scholar] [CrossRef]
- Abbas, S.Z.; Dupont, V.; Mahmud, T. Kinetics study and modelling of steam methane reforming process over a NiO/Al2O3 catalyst in an adiabatic packed bed reactor. Int. J. Hydrogen Energy 2017, 42, 2889–2903. [Google Scholar] [CrossRef]
- Champon, I.; Bengaouer, A.; Chaise, A.; Thomas, S.; Roger, A.-C. Carbon dioxide methanation kinetic model on a commercial Ni/Al2O3 catalyst. J. CO2 Util. 2019, 34, 256–265. [Google Scholar] [CrossRef]
- Koning, G.W.; Kronberg, A.E.; Van Swaaij, W.P.M. Improved one-dimensional model of a tubular packed bed reactor. Chem. Eng. Sci. 2006, 61, 3167–3175. [Google Scholar] [CrossRef]
- Dixon, A.G. Thermal resistance models of packed-bed effective heat transfer parameters. AIChE J. 1985, 31, 826–834. [Google Scholar] [CrossRef]
- Cengel, Y.A. Heat Transfer, 2nd ed.; McGraw-Hill: New York, NY, USA, 2003; ISBN 9780072456733. [Google Scholar]
- Dwivedi, P.N.; Upadhyay, S.N. Particle-Fluid Mass Transfer in Fixed and Fluidized Beds. Ind. Eng. Chem. Process Des. Dev. 1977, 16, 157–165. [Google Scholar] [CrossRef]
- Perry, R.H.; Green, D.W. Perry’s Chemical Engineers’ Handbook, 8th ed.; McGraw-Hill: New York, NY, USA, 2008. [Google Scholar]
- Zehner, P.; Schlünder, E.U. Warmeleitfahigkeit von Schuttungen bei mässigen Temperaturen. Chem. Ing. Tech. 1970, 42, 933–941. [Google Scholar] [CrossRef]
- Van Antwerpen, W.; Du Toit, C.G.; Rousseau, P.G. A review of correlations to model the packing structure and effective thermal conductivity in packed beds of mono-sized spherical particles. Nucl. Eng. Des. 2010, 240, 1803–1818. [Google Scholar] [CrossRef]
- Cheng, P.; Hsu, C.T. Fully-developed, forced convective flow through an annular packed-sphere bed with wall effects. Int. J. Heat Mass Transf. 1986, 29, 1843–1853. [Google Scholar] [CrossRef]
- Bansal, N.P.; Doremus, R.H. Handbook of Glass Properties; Academic Press Inc.: Orlando, FL, USA, 1986; ISBN 9780080523767. [Google Scholar]
- Gupta, S.N.; Chaube, R.B.; Upadhyay, S.N. Fluid-particle heat transfer in fixed and fluidized beds. Chem. Eng. Sci. 1974, 29, 839–843. [Google Scholar] [CrossRef]
- Wakao, N.; Kaguei, S.; Funazkri, T. Effect of fluid dispersion coefficients on particle-to-fluid heat transfer coefficients in packed beds. Correlation of nusselt numbers. Chem. Eng. Sci. 1979, 34, 325–336. [Google Scholar] [CrossRef]
- Gunn, D.J. Transfer of heat or mass to particles in fixed and fluidised beds. Int. J. Heat Mass Transf. 1978, 21, 467–476. [Google Scholar] [CrossRef]
- Deen, N.G.; Peters, E.A.J.F.; Padding, J.T.; Kuipers, J.A.M. Review of direct numerical simulation of fluid-particle mass, momentum and heat transfer in dense gas-solid flows. Chem. Eng. Sci. 2014, 116, 710–724. [Google Scholar] [CrossRef]
- Deen, N.G.; Kriebitzsch, S.H.L.; van der Hoef, M.A.; Kuipers, J.A.M. Direct numerical simulation of flow and heat transfer in dense fluid-particle systems. Chem. Eng. Sci. 2012, 81, 329–344. [Google Scholar] [CrossRef]
- Sun, B.; Tenneti, S.; Subramaniam, S. Modeling average gas-solid heat transfer using particle-resolved direct numerical simulation. Int. J. Heat Mass Transf. 2015, 86, 898–913. [Google Scholar] [CrossRef] [Green Version]
- Tenneti, S.; Sun, B.; Garg, R.; Subramaniam, S. Role of fluid heating in dense gas-solid flow as revealed by particle-resolved direct numerical simulation. Int. J. Heat Mass Transf. 2013, 58, 471–479. [Google Scholar] [CrossRef]
- Singhal, A.; Cloete, S.; Radl, S.; Quinta-Ferreira, R.; Amini, S. Heat transfer to a gas from densely packed beds of monodisperse spherical particles. Chem. Eng. J. 2016, 314, 27–37. [Google Scholar] [CrossRef]
- Jourak, A.; Frishfelds, V.; Hellström, J.G.I.; Lundström, T.S.; Herrmann, I.; Hedström, A. Longitudinal Dispersion Coefficient: Effects of Particle-Size Distribution. Transp. Porous Media 2013, 99, 1–16. [Google Scholar] [CrossRef]
- Levenspiel, O. Chemical Reaction Engineering, 3rd ed.; John Wiley & Sons: New York, NY, USA, 1999; ISBN 047125424X. [Google Scholar]
- Gunn, D.J. Axial and radial dispersion in fixed beds. Chem. Eng. Sci. 1987, 42, 363–373. [Google Scholar] [CrossRef]
- Lanfrey, P.Y.; Kuzeljevic, Z.V.; Dudukovic, M.P. Tortuosity model for fixed beds randomly packed with identical particles. Chem. Eng. Sci. 2010, 65, 1891–1896. [Google Scholar] [CrossRef]
- Young, L.C.; Finlayson, B.A. Axial Dispersion in Nonisothermal Packed Bed Chemical Reactors. Ind. Eng. Chem. Fundam. 1973, 12, 412–422. [Google Scholar] [CrossRef]
- Khanna, R.; Seinfeld, J.H. Mathematical modeling of packed bed reactors: Numerical solutions and control model development. Adv. Chem. Eng. 1987, 13, 113–191. [Google Scholar]
- Yagi, S.; Kunii, D.; Wakao, N. Studies on axial effective thermal conductivities in packed beds. AIChE J. 1960, 6, 543–546. [Google Scholar] [CrossRef]
- Bischoff, K.B. Axial thermal conductivities in packed beds. Can. J. Chem. Eng. 1962, 40, 161–163. [Google Scholar] [CrossRef]
- Krupiczka, R. Analysis of thermal conductivity in granular materials. Int. Chem. Eng. 1967, 7, 122–144. [Google Scholar]
- Votruba, J.; Hlaváček, V.; Marek, M. Packed bed axial thermal conductivity. Chem. Eng. Sci. 1972, 27, 1845–1851. [Google Scholar] [CrossRef]
- Keiski, R.L.; Desponds, O.; Chang, Y.F.; Somorjai, G.A. Kinetics of the water-gas shift reaction over several alkane activation and water-gas shift catalysts. Appl. Catal. A Gen. 1993, 101, 317–338. [Google Scholar] [CrossRef]
- Garbarino, G.; Pugliese, F.; Cavattoni, T.; Riani, P.; Busca, G.; Costamagna, P. A study of CO2 methanation and steam methane reforming over commercial Ni/Ca Al2O3 catalysts. Energies. Submitted.
- Fernandes, F.A.N.; Soares, A.B. Modeling of methane steam reforming in a palladium membrane reactor. Fuel 2006, 85, 569–573. [Google Scholar] [CrossRef]
- Rostrup-Nielsen, J.R. Catalytic Steam Reforming. In Catalysis—Science and Technology; Springer: Berlin, Germany, 1984; ISBN 9783540126651. [Google Scholar]
 ,
,  HMMC;
HMMC;  ,
,  57-4Q;
  ,
,  25-4Q.
, HMMC; , 57-4Q; , 25-4Q.
25-4Q.
, HMMC; , 57-4Q; , 25-4Q.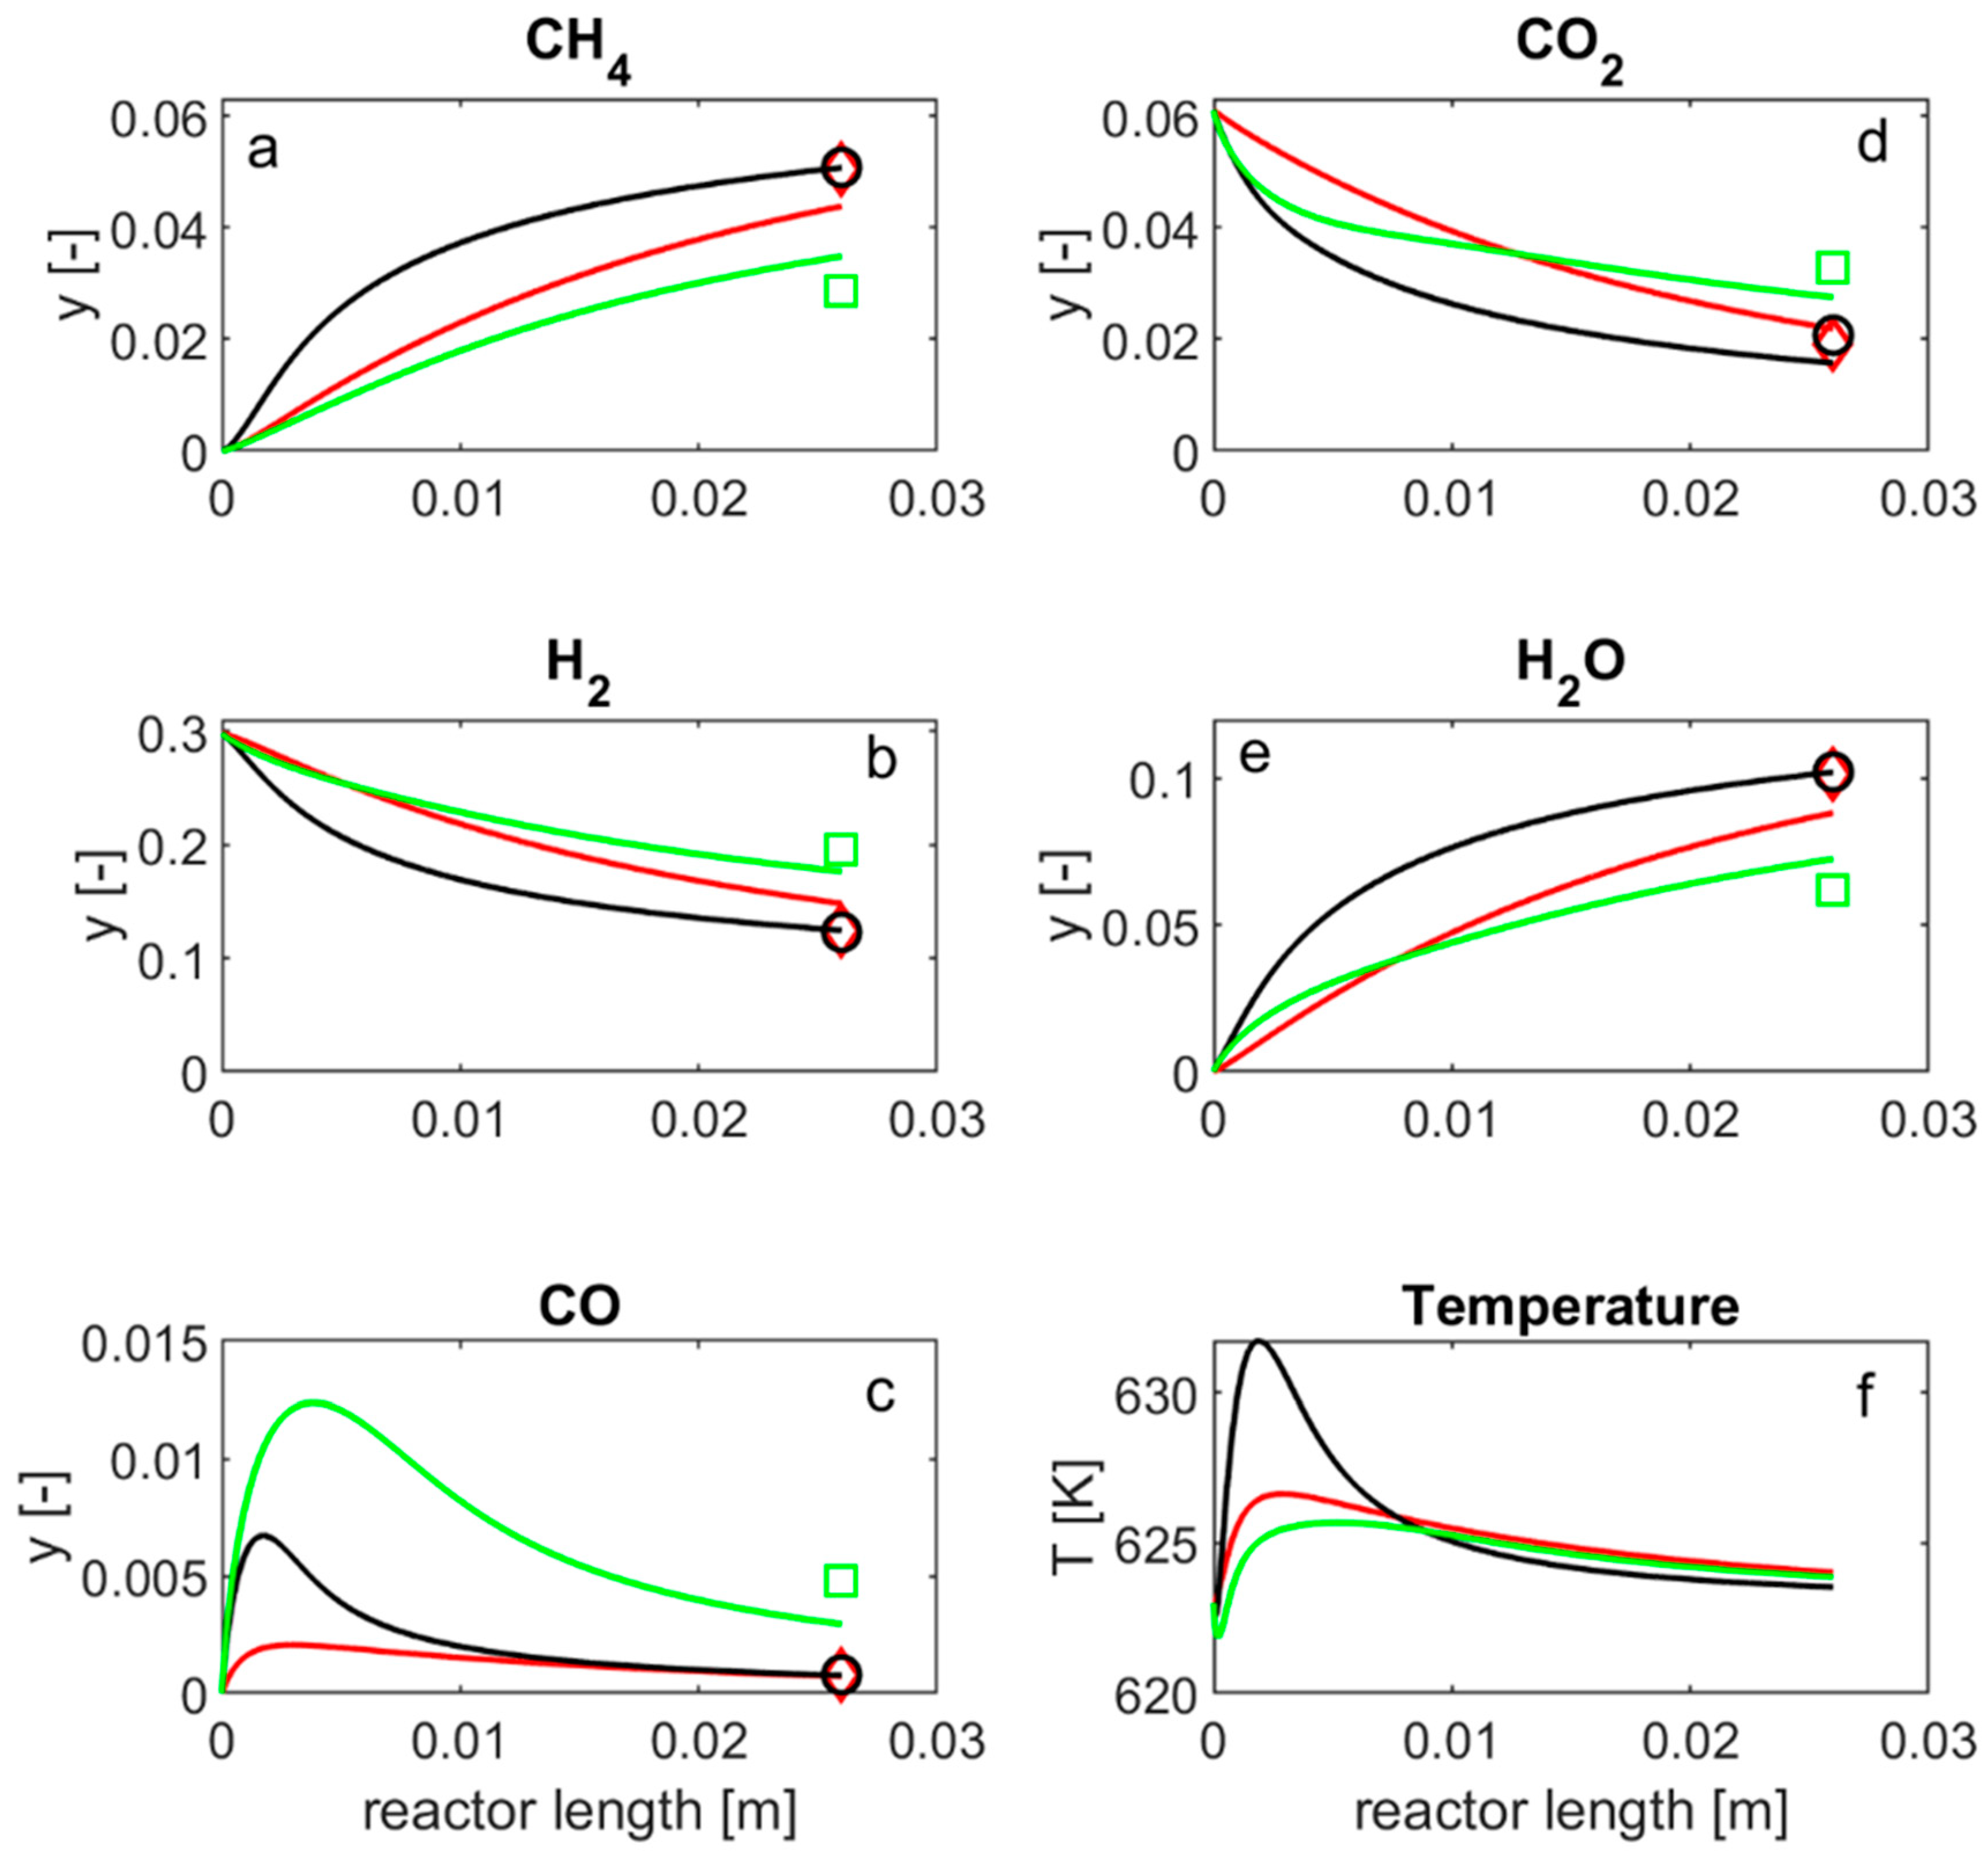 , HMMC; , 57-4Q; , 25-4Q.
, HMMC; , 57-4Q; , 25-4Q.
, HMMC; , 57-4Q; , 25-4Q.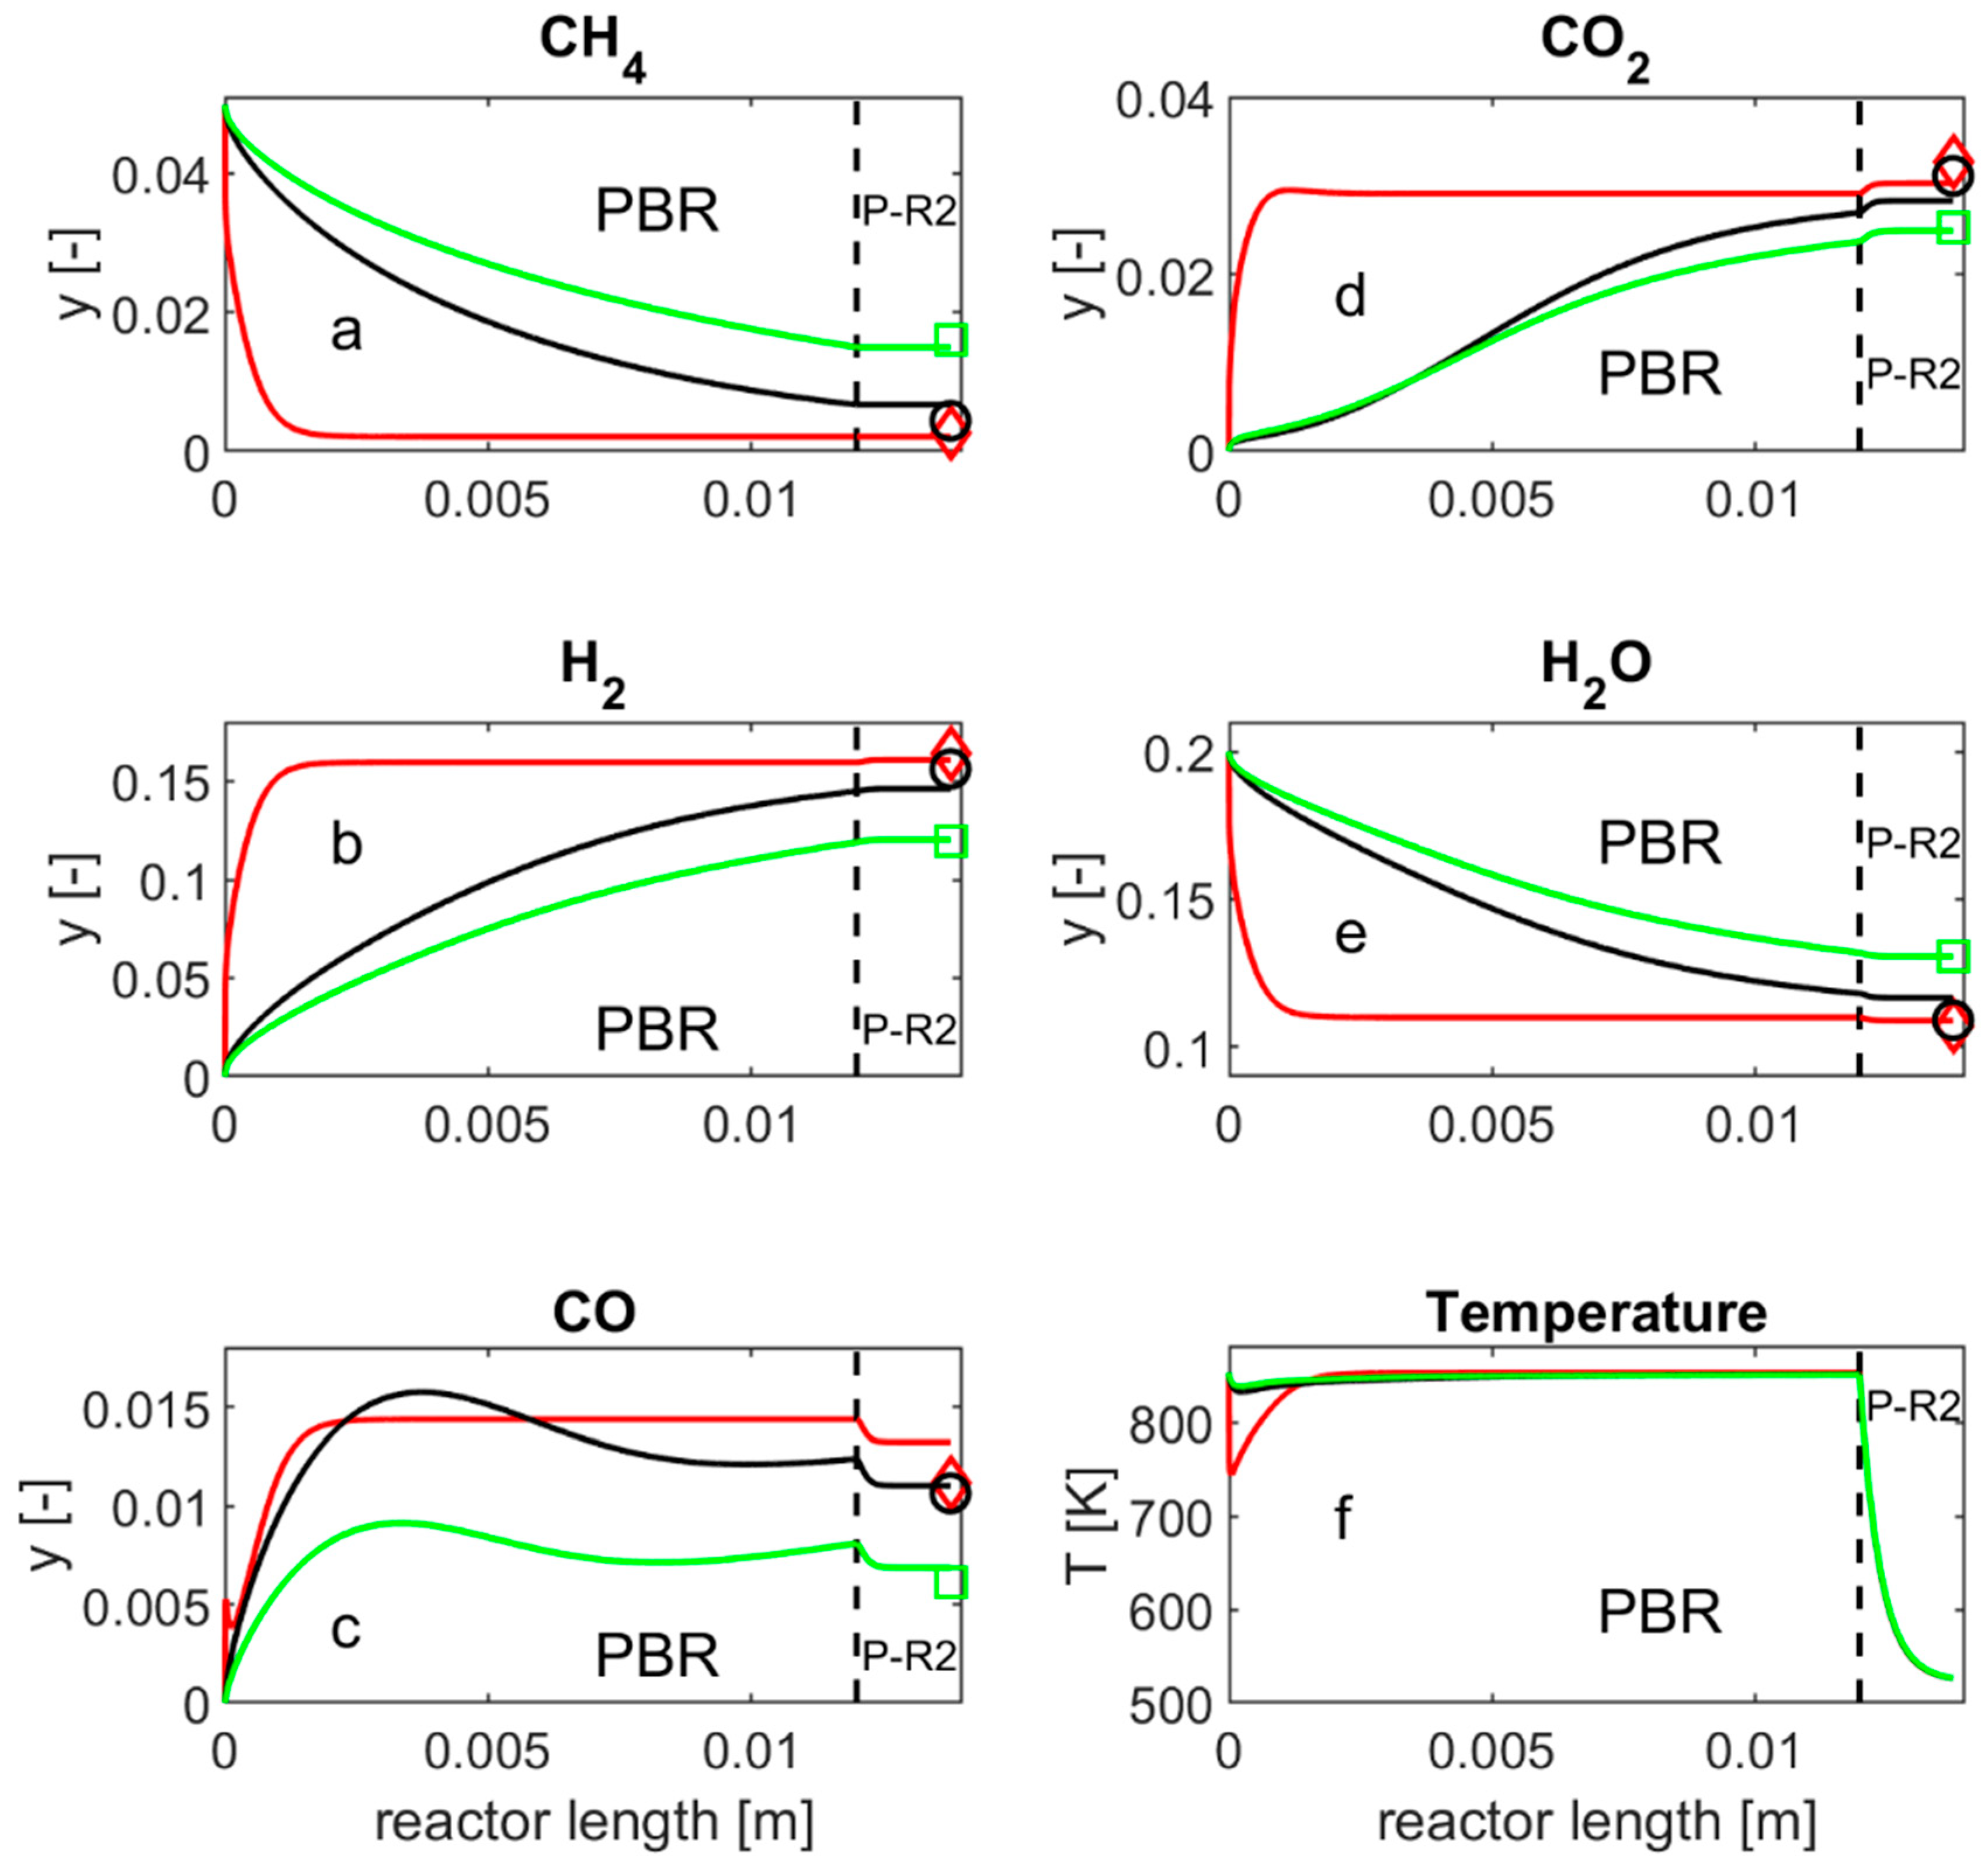

| Dimensions (10−3 m) | MCO2 Reactor | SMR Reactor |
|---|---|---|
| H length | 5 | 5 |
| PBR length | 26 | 12 |
| P-R1 length | 150 | 50 |
| P-R2 length | 300 | 40 |
| d | 6 | 6 |
| s | 1 | 1 |
| Parameter | Value | Notes |
|---|---|---|
| kSMR,Tr | 1.842 × 10⁻⁴ (kmol bar0.5 kgcat−1 h−1) | Tr = 648 K |
| kWGS,Tr | 7.558 (kmol bar−1 kgcat−1 h−1) | Tr = 648 K |
| kGRR,Tr | 2.193 × 10⁻⁵ (kmol bar0.5 kgcat−1 h−1) | Tr = 648 K |
| ESMR | 240.1 (kJ mol−1) | |
| EWGS | 67.13 (kJ mol−1) | |
| EGRR | 243.9 (kJ mol−1) | |
| KCH4,Tr | 0.1791 (bar−1) | Tr = 823 K |
| KCO,Tr | 40.91 (bar−1) | Tr = 648 K |
| KH2,Tr | 0.02960 (bar−1) | Tr = 648 K |
| KH2O,Tr | 0.4152 (-) | Tr = 823 K |
| ΔHCH4 | −38.28 (kJ mol−1) | |
| ΔHCO | −70.65 (kJ mol−1) | |
| ΔHH2 | −82.90 (kJ mol−1) | |
| ΔHH2O | 88.68 (kJ mol−1) |
| HMMC | 57-4Q | 25-4Q | ||
|---|---|---|---|---|
| ζ1⋅kSMR | ζ1= | 15 | 25 | 8 |
| ζ2⋅kWGS | ζ2= | 15 | 100 | 130 |
| ζ3⋅kGRR | ζ3= | 15 | 10 | 10 |
| ζ4⋅ESMR | ζ4= | 1 | 1.17 | 1.22 |
| ζ5⋅EWGS | ζ5= | 1 | 1.5 | 1.7 |
| ζ6⋅KH2O | ζ6= | 1 | 90 | 95 |
| WGS | SMR | |
|---|---|---|
| A | 1.412 × 10⁻² (-) | 7.846 × 10¹² (atm2) |
| EK | 220.2 (kJ mol−1) | −37.72 (kJ mol−1) |
| Variable | MCO2 | SMR | Units | ||
|---|---|---|---|---|---|
| T = 473 K | T = 773 K | T = 773 K | T = 1173 K | ||
| GHSV @ RTP | 6.7 × 10³ | 2.4 × 10⁴ | h−1 | ||
| uS | 0.082 | 0.133 | 0.200 | 0.459 | m s−1 |
| μ | 2.03 × 10⁻⁵ | 2.85 × 10⁻⁵ | 3.56×10⁻⁵ | 6.49 × 10⁻⁵ | kg m−1 s−1 |
| cp | 5.06 | 5.16 | 4.52 | 4.71 | kJ kg−1 K−1 |
| ρ | 0.305 | 0.187 | 4.74 × 10⁻² | 2.06 × 10⁻² | kg m−3 |
| kf | 9.89 × 10⁻² | 1.42 × 10⁻¹ | 2.42 × 10⁻¹ | 0.464 | W m−1 K−1 |
| ks | 1.57 | 1.99 | 1.99 | 3.39 | W m−1 K−1 |
| kax | 0.945 | 1.25 | 1.46 | 2.57 | W m−1 K−1 |
| Re = ρ uS d/μ | 7.36 | 5.243 | 1.600 | 0.878 | - |
| Pr = μ cp/kf | 1.04 | 1.03 | 0.665 | 0.659 | - |
| Nu | 3.43 | 2.28 | 2.91 | 2.83 | - |
| U | 380 | 503 | 584 | 1019 | W m−2 K−1 |
© 2020 by the authors. Licensee MDPI, Basel, Switzerland. This article is an open access article distributed under the terms and conditions of the Creative Commons Attribution (CC BY) license (http://creativecommons.org/licenses/by/4.0/).
Share and Cite
Costamagna, P.; Pugliese, F.; Cavattoni, T.; Busca, G.; Garbarino, G. Modeling of Laboratory Steam Methane Reforming and CO2 Methanation Reactors. Energies 2020, 13, 2624. https://doi.org/10.3390/en13102624
Costamagna P, Pugliese F, Cavattoni T, Busca G, Garbarino G. Modeling of Laboratory Steam Methane Reforming and CO2 Methanation Reactors. Energies. 2020; 13(10):2624. https://doi.org/10.3390/en13102624
Chicago/Turabian StyleCostamagna, Paola, Federico Pugliese, Tullio Cavattoni, Guido Busca, and Gabriella Garbarino. 2020. "Modeling of Laboratory Steam Methane Reforming and CO2 Methanation Reactors" Energies 13, no. 10: 2624. https://doi.org/10.3390/en13102624
APA StyleCostamagna, P., Pugliese, F., Cavattoni, T., Busca, G., & Garbarino, G. (2020). Modeling of Laboratory Steam Methane Reforming and CO2 Methanation Reactors. Energies, 13(10), 2624. https://doi.org/10.3390/en13102624