Article

Effect of the DC-Link Capacitor Size on the Wireless Inductive-Coupled Opportunity-Charging of a Drone Battery

Dipartimento Ingegneria dell’Informazione, University of Pisa, Via Caruso 16, 56122 Pisa, Italy
*
Author to whom correspondence should be addressed.
Energies 2020, 13(10), 2621; https://doi.org/10.3390/en13102621
Submission received: 13 April 2020 / Revised: 12 May 2020 / Accepted: 18 May 2020 / Published: 21 May 2020

Abstract

:
Wireless inductive-coupled power transfer and opportunity battery charging are very appealing techniques in drone applications. Weight and size are very critical constraints in drones, so the battery and the on-board electronics must be as light and small as possible. The on-board components involved in the resonant inductive-coupled wireless power transfer usually consist of the secondary coil, the compensation capacitor, the bridge rectifier, the LC-filter and the battery. This paper suggests a sizing of the LC-filter capacitor that improves the charging power of the battery. In addition, further on-board space and size is saved by using the stray inductance of the battery as filtering inductor. LTSpice simulations and experimental tests carried out on the prototype of a wireless power transfer circuit shows the dependency of the power delivered to the battery on the filter capacitor size. Finally, it is found that the power transfer to the battery is maximized by choosing the capacitor value that sets the LC-filter resonant frequency close to the double of the excitation frequency of the wireless charging. The drawback is a large current and voltage ripple in the battery.

1. Introduction

Wireless circuits based on resonant inductive-coupled power transfer (ICPT) are very appealing for application to flying devices such as drones [1,2], to implement opportunity and fast charging of the battery. The basic ICPT circuit consists of two magnetically coupled resonant circuits, i.e., the primary and secondary circuits [3]. Four different ICPT configurations with specific behavior and performance are obtained according to the position of the compensation capacitors with respect to the coils [4]. In particular, the series–series (SS) architecture behaves like a current generator applied to the load as demonstrated in [5], and its resonant frequency depends neither on the power level to the load nor on the coil coupling coefficient [6], differently from the other configurations. These reasons make the SS architecture suited to charging Li-ion batteries in applications where the coil alignment is particularly difficult, such as in drones [7,8]. The design of the primary circuit is straightforward, as the charger is usually positioned on the ground, and it is not limited by weight and volume constraints. It is powered by an external energy source and often employs a full-bridge inverter [9], a simple solution to obtain good efficiency. On the contrary, the secondary circuit design is very critical as it is located on board, and weight is a major issue in drones [10]. Generally, the secondary circuit consists of a bridge rectifier [6,11], a DC–DC converter and/or a filter, all of which are used to rectify the transmitted AC power and to control the charge of the battery. However, the presence of these circuits increases the drone weight and size and thus depends on the requirements of the application, such as the quality of the ICPT system and the charging power required. Zhong and Hui reach and track the maximum charging efficiency of the ICPT circuit using a DC–DC converter with variable duty-cycle in [12]. However, the proposed architecture might not be affordable for drones where the overall dimensions and weight are important constraints. Therefore, a simpler solution based on an LC-filter may be preferable. The DC-link LC-filter architecture used in [13] is designed by choosing the filter capacitor value C 0 large enough to obtain a constant DC output voltage on it. However, this assumption may lead to overestimate the capacitor value and to add useless volume and weight to the drone. The capacitor and inductor sizes are related to the maximum current and voltage values that they withstand, so these factors can be critical when the power requirement of the wireless battery charger becomes large. Moreover, as ICPT systems usually work with resonant frequencies in the range from tens of kilohertz to megahertz [1], the available commercial capacitors and inductors are very few with respect to those available for lower frequencies, because the requirements are harder to achieve. In addition, many literature works about this topic consider the battery as an ideal voltage generator [9,14]. Instead, a generic Li-ion battery shows non-negligible stray inductance and series-resistance in the ICPT frequency range as represented in [15].
The first basic idea of this work was to use the battery inductance alone as component of the secondary LC-filter to save size and weight onboard. Thus, a time-domain simulation campaign was performed with the LTSpice simulator as described in [16], in order to suggest possible guidelines to size the LC-filter capacitor. The simulation results showed the dependency on the capacitor size of the power transferred for battery charging and of the efficiency of the transfer. It was found that the SS-ICPT system reaches a maximum in the power transfer by choosing a value of C 0 that fixes the LC-filter resonance frequency near to the double of the excitation frequency. However, the work described in [16] was exclusively based on time-domain simulations. Thus, the aim of this paper is to extend and to give experimental validation to the previous investigation, specifically focusing on the charging power. An SS-ICPT prototype for drone opportunity charging was designed to achieve the goal. Then, the results coming from the experiments carried out on the prototype and the simulations were analyzed and compared. It is worth to clarify that both approaches were based on the exploration of a finite set of C 0 values, among which the maximum power transfer was determined. The good agreement between the two approaches demonstrates the conclusions reported in [16], i.e., there is an LC-filter capacitor value which maximizes the battery charging power, and the battery inductance can be used as LC-filter inductor.
The rest of the paper is organized as follows. Section 2 gives some theoretical background about the frequency response of the DC-link circuit, describes the SS-ICPT architecture used for the experiments, the LTSpice simulator settings and three experimental set-ups. In particular, the first two experiments were adopted to extract the battery stray inductance and resistance to be used in the LTSpice simulations. The results of the experiments are shown in Section 3 and compared to the outcomes of the simulations in Section 4. Finally, Section 5 draws the conclusions.

2. Materials and Methods

Figure 1 shows the schematic representation of the SS compensated ICPT system investigated in this paper. The primary circuit consists of an inverter based on the H-bridge properly driven by the waveform generator. The secondary circuit mainly consists of the diode rectifier bridge and the LC-filter. However, only the passive component C 0 is physically present in the circuit, as mentioned above. Besides, R B and L B are the battery stray resistance and inductance, respectively, according to the Randal’s model evaluated at the frequency of interest [15]. The frequency response of the LC-filter consisting of C 0 in parallel with the parasitic impedance of the battery can be determined.

2.1. LC-Filter Frequency Response

The SS architecture showed in Figure 1 behaves like a sinusoidal current generator applied to the secondary rectifying bridge, as described in [5]. Therefore, the LC-filter frequency response was computed by considering the current i I N ( t ) coming from the rectifier bridge as input, and the current i O U T ( t ) that flows in the Li-ion battery as output. The circuit is a current divider, the Laplace domain response of which is well known and shown in Equation (1), together with the discriminant Δ of the polynomial [16].
I O U T ( s ) I I N ( s ) = 1 s 2 L B C 0 + s R B C 0 + 1 Δ = C 0 ( R B 2 C 0 4 L B )
The value of Δ determines the position of the poles of the filter. The value of C 0 that makes Δ = 0 , i.e., C * shown in Equation (2), sets the limit between real and complex-conjugate poles.
C * = 4 L B R B 2
If C 0 is lower than C * , the filter has complex-conjugates poles. By defining f 0 the filter cut-off frequency and ξ the filter damping factor as expressed in Equation (3), Equation (1) is finally written as in Equation (4).
f 0 = 1 2 π L B C 0 ξ = R B 2 C 0 L B
I O U T ( s ) I I N ( s ) = 1 s 2 4 π 2 f 0 2 + ξ π f 0 s + 1
The same approach can be applied to determine the frequency response of the bridge rectifier output voltage v O U T ( t ) , as indicated in Equation (5). It is worth noting that v O U T ( t ) and i O U T ( t ) show larger oscillations at frequency f 0 when the damping factor reduces itself.
V O U T ( s ) I I N ( s ) = R B ( 1 + L B R B s ) s 2 4 π 2 f 0 2 + ξ π f 0 s + 1
Finally, a periodic steady-state is assumed to study the secondary circuits, as the bridge rectifier is a non linear device. Under this assumption, the power transfer P to the bridge rectifier follows the Budeanu definition indicated in [17] and reported in Equation (6)
P = 1 2 n = 1 V S S n I S S n cos ( φ n )
where V S S n and I S S n are the amplitudes of the voltage and current n-th harmonic components of the bridge rectifier input signals, and φ n is their phase-shift. The lower the phase-shift, the higher the power transfer. As the input current i S S ( t ) is a sine wave in this case, I S S n = 0 with n 1 , so the power transfer to the battery is only due to the fundamental component of the voltage. The higher this component, the higher the power transfer to the battery.

2.2. Time-Domain Simulation Analysis

The time-domain response of the secondary circuit in Figure 1 was evaluated as a function of the circuit parameters by means of the LTSpice electrical simulator [16]. As indicated in [5], an ICPT resonant circuit is very selective near its resonance frequency, so only the fundamental component of the primary circuit output signal is considered to study the electrical circuit. For this reason, the H-bridge based inverter output is assumed to be represented by a sine wave with frequency f w = 150 kHz . This value is in the range adopted in the wireless power transfer to drones [9,18]. The circuit electrical parameters adopted in the simulations to compare the simulation results with a real case were extracted from the experiments, which will be described afterwards. Furthermore, the Spice model of the bridge rectifier diodes provided by the manufacturer was used in the analysis, as will be specified in Section 2.3.3. Specifically, the diode model considers a 0.39 V junction voltage drop, a 3.764 mΩ series resistance and a zero-bias junction capacity of 292.8 pF [19]. Finally, the battery was modeled with a fixed voltage generator V B and the L B and R B components. It is worth to note that the LTSpice simulation analysis consisted of a parametric simulation, where the value of C 0 was logarithmically swept between 220 nF and 9.4 μF, taking 20 points per decade. Finally, the power P B transferred to the battery was evaluated for each value of C 0 [16]. It should be noted that P B is the active power transferred to the battery, defined as the product between the battery electromotive force V B and the the average of the battery current i O U T ( t ) in Figure 1.

2.3. Experimental Analysis

The battery used in the experiments is described first of all. The TA-15C-16000-6S1P-EC5 is an ultra high-power Li-Po battery specific for drone applications [20]. It is composed of 6 series cells of 16 Ah for 22.2 V nominal voltage and total weight of 1.932 kg; it can sustain a maximum discharge rate of 20 C and a maximum charge rate of 5 C, where C is the value of the nominal capacity. For the sake of clarity, the experiments were divided in three separate tests with different scopes and set-ups. The first two tests were aimed at the measurement of the L B and R B components of the Li-Po battery. These extracted values were used as battery parameters in the simulated circuit. Finally, a prototype of the SS-ICPT architecture was developed in our laboratory and measured to compare its output to the time-domain simulations.

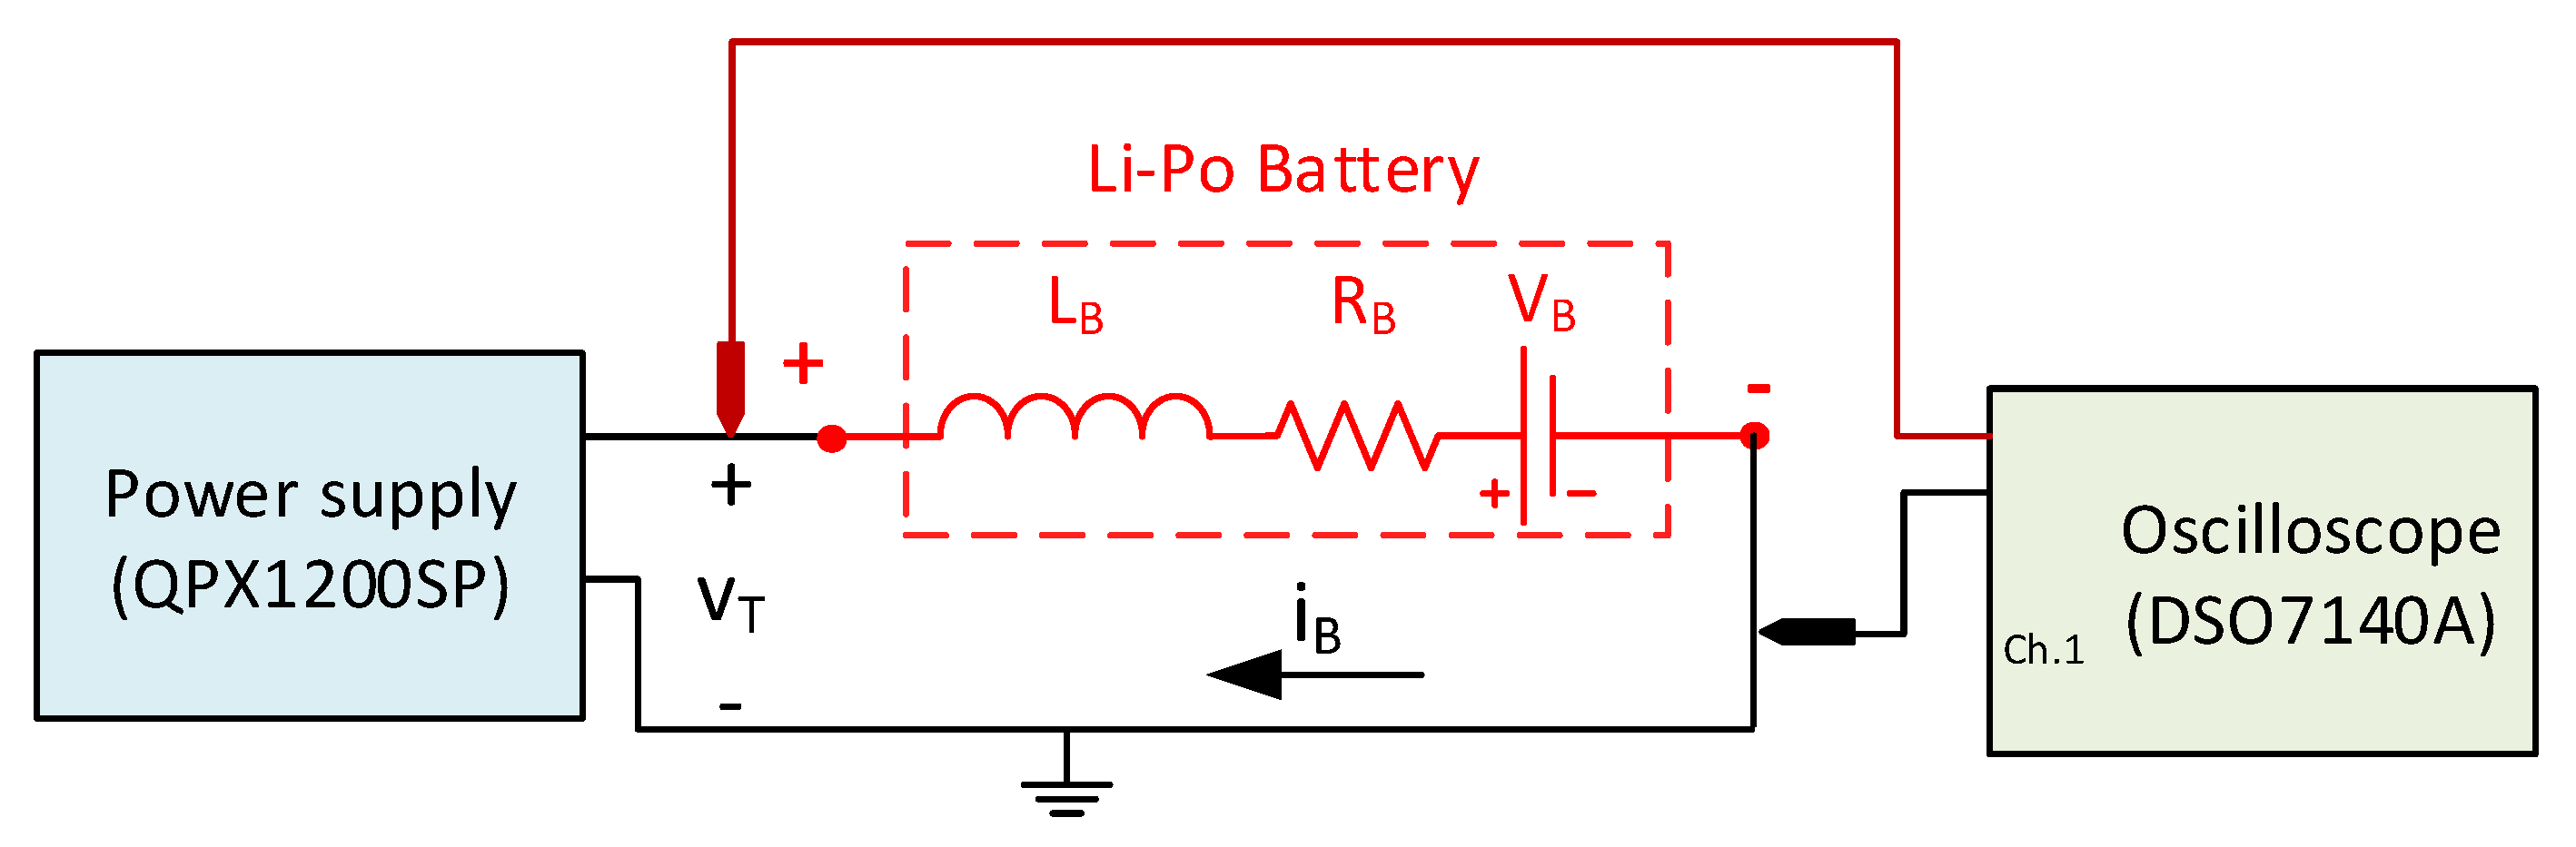
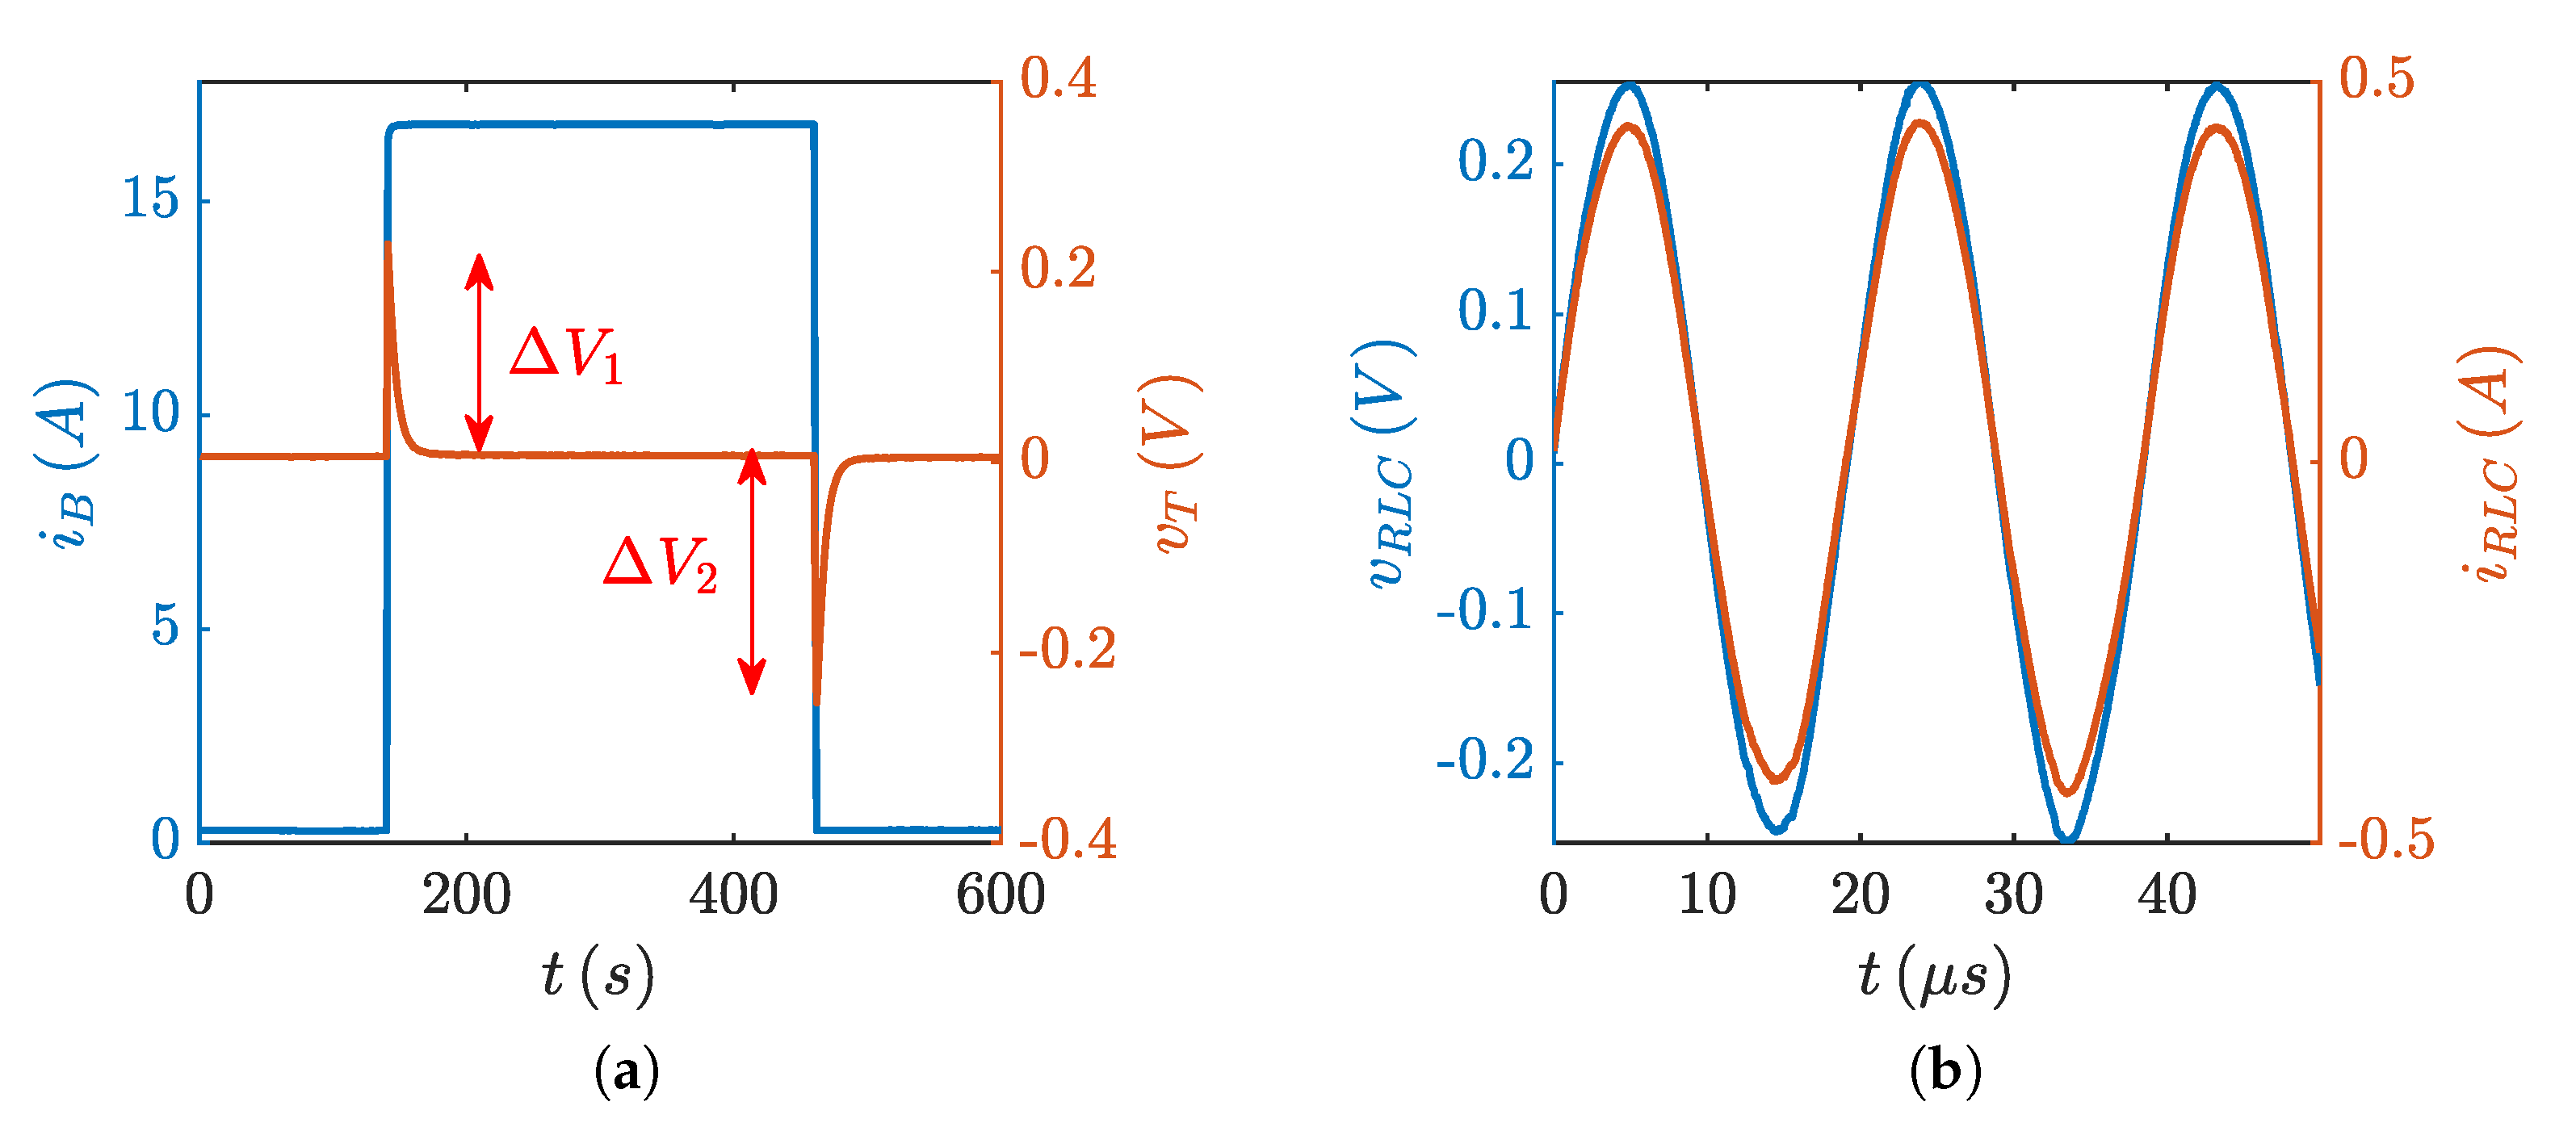
2.3.1. Battery Resistance Extraction

Figure 2 shows the experimental set-up used to measure the battery series resistance. The two terminals of the Li-ion battery were connected to the QPX1200SP power supply configured as current generator and to the DSO7140A oscilloscope. The battery was subjected to a pulsed current test (PCT). This test is usually adopted to extract the characteristic parameters of a Li-ion battery [21,22]. It consists in applying to the battery a current pulse for a given time, followed by a rest period. The current pulses and the rest periods are usually repeated at specific state of charge (SoC) values. R B is calculated by measuring the amplitude of the battery voltage drop due to the current pulse and dividing it by the current pulse amplitude. The PCT was limited to only one current pulse in our case. One value of R B is only needed, so the long time relaxations and the R B variations with SoC are neglected. The QPX1200SP delivers the current pulse to the battery, and the oscilloscope captures its voltage response. The voltage drops for both the rising and falling edges of the current pulse were measured, and the battery series resistance was evaluated averaging the two resulting values. The procedure is indicated in Equation (7), where Δ V a v g and Δ I B are the average of the voltage drops and the current pulse amplitude, respectively.
R B = Δ V a v g Δ I B

2.3.2. Battery Inductance Extraction

Figure 3 shows the experimental set-up adopted to extract the battery inductance. A capacitor C T was connected in series to the positive terminal of the battery to form a series RLC-network together with the battery inductance L B and resistance R B . The instruments used in the test were: the two-channels power supply QL355TP, the power operational amplifier MP111FD used as buffer, the waveform generator AFG3252 and the DSO7140A oscilloscope. Specifically, the QL355TP supplied the operational amplifier at ±12 V; the buffer was inserted before the capacitor C T to avoid loading the AFG3252 generator; the oscilloscope acquired the voltage and current responses of the RLC-network. The resistor R T was connected as shunt between the battery negative terminal and ground to measure the current. R T also set a current limit when the RLC-network was resonant. In particular, C T was composed of two 10 µF ± 5% and two 4.7 μF ± 5% capacitors in parallel to obtain 29.4 μF. Besides, R T was a 0.56 Ω ±10% resistor.
The test consists of two steps. First, a sine wave with fixed amplitude and frequency is generated by the waveform generator, and the current response of the RLC-network is read by the oscilloscope. Then, the sine wave frequency is varied until the resonance is found, i.e., the measured voltage and current are in phase. The resonance frequency f R , together with the capacitor value C T , allows the calculation of the stray inductance L B as indicated in Equation (8).
L B = 1 ( 2 π f R ) 2 · C T

2.3.3. Experimental Set-Up to Determine the Power Transfer

A prototype of the ICPT system represented in Figure 1 was designed and realized to validate the time-domain simulation analysis. A photograph of the prototype utilized for the validation of the simulation results is shown in Figure 4.
The ICPT prototype parameter values are reported in Table 1, where k is the coil coupling coefficient. The detailed hardware design of the prototype is out of the scope of this paper, so the schematic of the secondary circuit is only shown in Figure 5. In particular, the first PCB contained the secondary capacitor and the bridge rectifier, whereas the second PCB board was developed to facilitate the connection in parallel of several commercial capacitors with different footprints that were changed from one test to the other. The shunt resistors (two 10 W 33 mΩ ±1% commercial resistors) were inserted in the circuit to measure the input current of the bridge rectifier [see R 1 , R 3 in Figure 5a] and the battery current [see R 2 , R 4 in Figure 5b] by means of the oscilloscope DSO7140A. The bridge rectifier consists of four STTH3002PI ultra-fast recovery diodes, which sustain an average current of 30 A for a maximum voltage drop of 0.85 V [19]. The ICPT prototype was supplied by the QPX1200SP power supply, and the H-Bridge was controlled by the driver HIP4081A and the AFG3252 waveform generator, as shown in Figure 1.
The power transfer measurement was carried out as follows. First, the power supply voltage was set to 33 V and the waveform generator was set to produce a square waveform at 150 kHz on the H-bridge inverter. Thus, the H-bridge output signal v p ( t ) is a bipolar square wave of 66 V peak-to-peak, with a fundamental component of 42 V. This voltage amplitude leaded to recharge the battery with an average current rate of about C/2. The oscilloscope acquired the voltage and the current at the bridge rectifier input and the battery terminals in the secondary circuit. The test was carried out with several discrete values of C 0 that span from 220 nF to 9.4 μF, as reported in Table 2. The capacitors were single-film components with polypropylene dielectric, suitable for high frequency applications. Finally, the average power to the battery terminal was calculated by means of MATLAB scripts run on the data acquired and downloaded from the oscilloscope, for each value of C 0 . In more detail, the effective battery charging power was calculated by subtracting the power dissipated on the battery internal resistance to the power measured at the battery terminals.

3. Experimental Results

3.1. Battery Parameter Measurements

Figure 6a,b show the results of the experiments described in Section 2.3.1 and Section 2.3.2 to evaluate R B and L B of the battery, respectively. The first diagram shows the voltage v T ( t ) acquired by the oscilloscope when a 16 A current pulse i B ( t ) was applied to the battery. The data values were downloaded from the instrument and presented with a data visualization software. It should be noted that the oscilloscope was AC coupled to increase its measurement accuracy on the pulse current edges. The voltage drops Δ V 1 = 229 mV and Δ V 2 = 253 mV were measured, and the average Δ V a v g = 241 mV was computed. The resistance value calculated according to Equation (7) is around 15 mΩ. For the sake of clarity, this result refers to a brand-new fully-charged battery and the 100% SoC point was only evaluated.
Instead, the second diagram shows the voltage and current measured on the circuit shown in Figure 3 when it was resonant. The RLC-network resonant frequency f R was 51 kHz, so that the battery inductance L B calculated according to Equation (8) was 340 nH. Finally, the value C * that separates the complex-conjugate and real poles zones was 6 mF. It was calculated according to Equation (2) and the battery parameters extracted above.

3.2. Wireless Power Transfer Circuit

The experimental results obtained from the prototype of the wireless ICPT circuit described above are illustrated in this section. First of all, the waveforms of the voltage v S S ( t ) and the current i S S ( t ) measured at the bridge rectifier input are introduced. They are shown in Figure 7 and are superimposed to the simulation outputs. The measurements and the simulations fit quite well one to the other, even if the measurements are affected by some noise, particularly on the current signal. In any case, the results confirm the validity of the approach and the simulation analysis first introduced in [16]. The experiment refers to a secondary circuit configured with C 0 = 807 nF to obtain the maximum power transfer, as will be described afterwards.
The power P B transferred to the battery in the circuit prototype is shown in Figure 8. The output capacitance C 0 was the dependent variable parameter in this case. The dots show the discrete values of C 0 in which the power was calculated in the diagrams of both the simulation and experimental analysis. The horizontal bars indicate the tolerance of the commercial capacitor used in the experiments (red line).
The power profile can be divided in three different regions:
  • A rather constant power transfer region for C 0 larger than 1.5 µF;
  • A region with a peak in the power transfer for C 0 from 1.5 µF to 660 nF;
  • Another rather constant power transfer region for C 0 lower than 660 nF.
A peak in the power transfer was obtained in both the analysis, confirming the dependence of P B on the LC-filter capacitor as predicted in [16]. The maximum values of P B were obtained for 807 nF and 835.8 nF in the experiment and the simulation, respectively. It is worth to note that the percentage error between the two values is 3.5%. The result is less than the 5% tolerance of the capacitors used in the prototype, confirming the good agreement of the results obtained. The results suggest to design a wireless power transfer system with the proper value of C 0 that maximizes the power transfer to the battery. This value sets f 0 around the double of f w . The power transfer gain obtained is a feature that would particularly be appreciated in applications like drone opportunity charging.

4. Discussion

The experimental results shown in Section 3 demonstrated the simulation results anticipated in [16], i.e., the power transferred to the battery in an SS-ICPT resonant circuit strongly depends on the resonant frequency f 0 of the output LC-filter. A peak in the power transfer was found for a particular value of C 0 . Now, some other data acquired from the experiments performed on the prototype are shown before continuing the discussion about the results achieved. Figure 9 shows six waveforms acquired on the prototype. In particular, the first row shows the voltage v S S ( t ) and the current i S S ( t ) at the bridge rectifier input. The second row describes the voltage v O U T ( t ) and the current i O U T ( t ) at the battery terminals. Moreover, each column reports the data associated with the first, second and third power zone described above. In particular, C 0 was 9.4 μF, 807 nF and 220 nF, from left to right respectively.
Figure 9a–c highlight two important considerations. First, they confirm that the SS-ICPT circuit behaved as a current generator [5]. Indeed, the measured i S S ( t ) is affected by significant measurement noise but it resembles a sinusoidal wave with the same amplitude in the three zones. Therefore, the i S S ( t ) fundamental component can be considered dominant with respect to the harmonics. Thus, the battery charging power mainly depends on the v S S ( t ) fundamental component and less on the other harmonics, as indicated in Equation (6). Second, the shape of v S S ( t ) changes in the three zones. It resembles as a square wave in Figure 9a; it is like a sine wave in Figure 9b, and it looks like a sinusoidal waveform with harmonics superimposed in Figure 9c. Indeed, changing C 0 changes the values of f 0 and ξ of the LC-filter as indicated in Table 2, and it also changes the shape of v S S ( t ) accordingly. This is the reason why the power transfer to the battery depends on C 0 .
The second-order LC-filter works in the complex-conjugate poles zone for every C 0 shown in Table 2, because the value C * calculated according to Equation (2) is rather high. The power transfer profile of the SS-ICPT circuit can be divided in three zones, as anticipated in [16] and demonstrated in the previous section. Considering that the primary circuit was excited with a voltage square wave of 150 kHz (see Table 1), the frequency f B 1 of the fundamental component of i I N ( t ) is 300 kHz. The three different zones pointed out in Figure 8 are strongly correlated to this value.
The LC-filter resonance frequency f 0 is lower than f B 1 (see Table 2) in the first zone for C 0 higher than 1.5 µF. This means that the fundamental component and all the harmonics of i I N ( t ) are filtered, and the low-pass filtering effect on the bridge rectifier output signals is dominant, as visible in Figure 9d. Indeed, v O U T ( t ) can be considered constant to V B and v S S ( t ) resembles a square wave, as shown in Figure 9a. The battery charging power is the lowest, as the fundamental component of v S S ( t ) is lower than in the other cases. In this case, the bridge output voltage never falls to zero in the oscillation period, so the diodes D3, D4 and D1, D2 work as rectifying couples. The bridge rectifier always operates in continuous mode [23].
The power delivered to the battery is the highest with respect the other regions for C 0 from 1.5 µF to 660 nF, i.e., in the second region. This range of C 0 fixes f 0 very close to f B 1 , the damping factor ξ is around 0.01 and the filter is extremely selective around f 0 . The fundamental component of i I N ( t ) at frequency f B 1 passes to the battery, as expected from Equations (4) and (5). The battery current and terminal voltage became to oscillate with significant amplitudes due to the small value of ξ , as visible in Figure 9e. The battery was cyclically crossed by a current reaching peaks of 60 A and 30 A, and the voltage was between 45 V and 2 V γ , where V γ is the diode forward voltage. When v O U T ( t ) reached 2 V γ in each period, all the four diodes conducted simultaneously; v S S ( t ) went to 2 V γ , as shown in Figure 9b, and the bridge rectifier worked in discontinuous mode [23]. Furthermore, the oscillations in v O U T ( t ) produced beneficial effect on the shape of v S S ( t ) , which is more similar to a sine wave than before. Its fundamental component is thus higher than in the other regions, so the power transfer to the battery is higher as well. The peak in the battery charging power appears when f 0 coincides with f B 1 , as shown in Table 2 and in Figure 8. The power transfer to the battery in the peak is 25% higher than in the previous region, a very significant and useful consequence for the drone application we are dealing with.
The filter cut-off frequency f 0 is higher than f B 1 in the last region for C 0 lower than 660 nF. The lower C 0 , the higher is f 0 and the lower is ξ . This means that also the harmonic components start to appear at the battery terminals and at the bridge rectifier input, as visible in Figure 9f and Figure 9c, respectively. The net effect is less power transferred to the battery than before. v O U T ( t ) never falls to zero, so the bridge rectifier works in continuous mode again. This zone should be avoided to maintain the maximum power transfer.
Furthermore, the experimental results described in Section 3 show the feasibility of using the stray inductance typically shown by the battery at these frequencies as element of the LC-filter and demonstrate that the adoption of an external inductor as in [13] is not strictly necessary. Therefore, this work can be considered very appealing for wireless battery charging in drone applications.
The investigation showed a large ripple in the battery voltage and current that could be considered detrimental for the health of the Li-ion battery, as it could accelerate its aging. Nevertheless, several scientific works rule out this conclusion. The authors in [24] find that exciting a Li-ion cell with a square-wave current with zero average value and oscillation frequency higher than 10 Hz does not increment the aging of the cell. According to [24], the high-frequency components are buffered by the double layer capacitor; the current correlated with the transport of the ion in the electrodes is negligible, and the aging of the cell is not accelerated with respect to the same cell in floating charge state. Another work demonstrates that high frequency pulse charging reduces the formation of the SEI in the graphite anode, prolonging the cycle-life of the battery, if compared to the classical constant current-constant voltage (CC-CV) charging protocol [25]. Finally, recent works show that pulse charging a battery reduces the charging time and shows higher coulombic efficiency with respect to the classical CC-CV method [15,26,27]. Further work is needed to confirm the above conclusions. Aging tests with the specific current profile found in this work should be performed on the battery.
Finally, it is worth to discuss the effects of the possible variation of the battery parameters. Here, the parameters for a brand-new fully-charged battery at 100% SoC were identified. Instead, the battery parameters may vary with SoC and aging. However, Osswald et al. in [28] demonstrated that L B mainly depends on the length of the battery electrodes and how they are winded inside the battery case. L B is a geometry dependent parameter and is thus rather invariant with aging and SoC. As a consequence, a significant variation of the frequency f 0 is not expected because L B can be considered rather constant. Variations of R B do not change the filter cut-off frequency f 0 , but they modify the damping factor ξ . R B depends on the battery SoC and increases with the aging [29]. The higher R B , the higher is ξ . A larger damping-factor determines a reduction of the amplitude of the resonance peak in Equation (5) and a reduction of the voltage oscillation. The power transfer increase found in the paper could be less significant. The power transfer gain could disappear in the worst case when ξ gets close to the critical damping ratio. The approach proposed here would reduce itself to the classical approach based on low-pass filtering.

5. Conclusions

The investigation on a series-series wireless transfer charging circuit carried out by simulations and validated in this work with experimental measurements on a prototype introduces an important innovation for the opportunity charging of the battery of a drone. First of all, this work demonstrates that the battery parasitic inductance can be used as inductor in the LC-filter of the charging circuit, saving space and size on board the drone. Then, this work provides a suggestion to maximize the power transfer to the battery. In particular, choosing a filter capacitor value that fixes the LC-filter resonance frequency as two times the SS-ICPT excitation frequency makes it possible to achieve the maximum power transfer to the battery. The experiments described here show an improvement of 25% of the power transferred to the battery with respect to conventional low-pass filtering. The drawback is the oscillating current that is not constant as in conventional charging. Concerns raise about the influence of the current oscillations on battery aging. However, the absence of additional aging effects are demonstrated by literature studies performed in circuits that work in a similar way, like the pulse charger devices.

Author Contributions

All authors contributed equally to this work. All authors have read and agreed to the published version of the manuscript.

Funding

This research was partially funded by PAR FAS Toscana 2007–2013 (Bando FAR FAS 2014), under agreement n. 4421.02102014.072000022 Project SUMA, agreement n. 4421.02102014.072000099 Project PROT-ONE, and supported by CrossLab project, University of Pisa, funded by MIUR “Department of Excellence” program.

Acknowledgments

The authors wish to thank Nicola Vincenti and Antonio Colicelli for their technical and administrative support, respectively.

Conflicts of Interest

The authors declare no conflict of interest.

References

  1. Lu, M.; Bagheri, M.; James, A.P.; Phung, T. Wireless Charging Techniques for UAVs: A Review, Reconceptualization, and Extension. IEEE Access 2018, 6, 29865–29884. [Google Scholar] [CrossRef]
  2. Campi, T.; Cruciani, S.; Maradei, F.; Feliziani, M. Innovative Design of Drone Landing Gear Used as a Receiving Coil in Wireless Charging Application. Energies 2019, 12, 3483. [Google Scholar] [CrossRef] [Green Version]
  3. Barman, S.D.; Reza, A.W.; Kumar, N.; Karim, M.E.; Munir, A.B. Wireless powering by magnetic resonant coupling: Recent trends in wireless power transfer system and its applications. Renew. Sustain. Energy Rev. 2015, 51, 1525–1552. [Google Scholar] [CrossRef]
  4. Wang, C.S.; Covic, G.; Stielau, O. Power transfer capability and bifurcation phenomena of loosely coupled inductive power transfer systems. IEEE Trans. Ind. Electron. 2004, 51, 148–157. [Google Scholar] [CrossRef]
  5. Zhang, W.; Mi, C.C. Compensation Topologies of High-Power Wireless Power Transfer Systems. IEEE Trans. Veh. Technol. 2016, 65, 4768–4778. [Google Scholar] [CrossRef]
  6. Zhang, Z.; Pang, H.; Georgiadis, A.; Cecati, C. Wireless Power Transfer—An Overview. IEEE Trans. Ind. Electron. 2019, 66, 1044–1058. [Google Scholar] [CrossRef]
  7. Zhou, J.; Zhang, B.; Xiao, W.; Qiu, D.; Chen, Y. Nonlinear Parity-Time-Symmetric Model for Constant Efficiency Wireless Power Transfer: Application to a Drone-in-Flight Wireless Charging Platform. IEEE Trans. Ind. Electron. 2019, 66, 4097–4107. [Google Scholar] [CrossRef]
  8. Raciti, A.; Rizzo, S.A.; Susinni, G. Drone Charging Stations over the Buildings based on a Wireless Power Transfer System. In Proceedings of the 2018 IEEE/IAS 54th Industrial and Commercial Power Systems Technical Conference (I&CPS), Niagara Falls, ON, Canada, 7–10 May 2018. [Google Scholar]
  9. Campi, T.; Cruciani, S.; Feliziani, M. Wireless power transfer technology applied to an autonomous electric UAV with a small secondary coil. Energies 2018, 11, 352. [Google Scholar] [CrossRef] [Green Version]
  10. Jawad, A.M.; Jawad, H.M.; Nordin, R.; Gharghan, S.K.; Abdullah, N.F.; Abu-Alshaeer, M.J. Wireless Power Transfer With Magnetic Resonator Coupling and Sleep/Active Strategy for a Drone Charging Station in Smart Agriculture. IEEE Access 2019, 7, 139839–139851. [Google Scholar] [CrossRef]
  11. González-Santini, N.S.; Ozpineci, B.; Chinthavali, M.; Peng, F.Z. The Effects of the Resonant Network and Control Variables on the DC-link Capacitor of a Wireless Charging System. In Proceedings of the 2017 IEEE Transportation Electrification Conference and Expo (ITEC), Chicago, IL, USA, 26–28 June 2017; pp. 626–631. [Google Scholar]
  12. Zhong, W.X.; Hui, S.Y.R. Maximum Energy Efficiency Tracking for Wireless Power Transfer Systems. IEEE Trans. Power Electron. 2015, 30, 4025–4034. [Google Scholar] [CrossRef] [Green Version]
  13. Liu, X.; Wang, T.; Yang, X.; Jin, N.; Tang, H. Analysis and design of a wireless power transfer system with dual active bridges. Energies 2017, 10, 1588. [Google Scholar] [CrossRef] [Green Version]
  14. Song, C.; Kim, H.; Kim, Y.; Kim, D.; Jeong, S.; Cho, Y.; Lee, S.; Ahn, S.; Kim, J. EMI Reduction Methods in Wireless Power Transfer System for Drone Electrical Charger Using Tightly Coupled Three-Phase Resonant Magnetic Field. IEEE Trans. Ind. Electron. 2018, 65, 6839–6849. [Google Scholar] [CrossRef]
  15. Amanor-Boadu, J.M.; Abouzied, M.A.; Sanchez-Sinencio, E. An Efficient and Fast Li-Ion Battery Charging System Using Energy Harvesting or Conventional Sources. IEEE Trans. Ind. Electron. 2018, 65, 7383–7394. [Google Scholar] [CrossRef]
  16. Carloni, A.; Baronti, F.; Di Rienzo, R.; Roncella, R.; Saletti, R. DC-Link Capacitor Sizing Method for a Wireless Power Transfer Circuit to Be Used in Drone Opportunity Charging. In Lecture Notes in Electrical Engineering; Springer: Cham, Switzerland, 2020; pp. 397–403. [Google Scholar]
  17. Akagi, H.; Watanabe, E.H.; Aredes, M. Electric Power Definitions: Background. In Instantaneous Power Theory and Applications to Power Conditioning; John Wiley & Sons, Inc.: Hoboken, NJ, USA, 2007; pp. 19–40. [Google Scholar]
  18. Campi, T.; Dionisi, F.; Cruciani, S.; Santis, V.D.; Feliziani, M.; Maradei, F. Magnetic Field Levels in Drones Equipped with Wireless Power Transfer Technology. In Proceedings of the 2016 Asia-Pacific International Symposium on Electromagnetic Compatibility (APEMC), Shenzhen, China, 18–21 May 2016. [Google Scholar]
  19. STMicroelectronics. STTH3002PI Spice Model. Available online: https://www.st.com/en/diodes-and-rectifiers/stth3002.html#resource (accessed on 28 February 2020).
  20. TA-15C-16000-6S1P-EC5. Available online: https://www.bizmodel.it/tattu-16000mah-22-2v-15-30c-6s1p-ta-15c-16000-6s1p.html (accessed on 8 March 2020).
  21. Somakettarin, N.; Pichetjamroen, A. Characterization of a Practical-Based Ohmic Series Resistance Model under Life-Cycle Changes for a Lithium-Ion Battery. Energies 2019, 12, 3888. [Google Scholar] [CrossRef] [Green Version]
  22. Baronti, F.; Fantechi, G.; Leonardi, E.; Roncella, R.; Saletti, R. Enhanced Model for Lithium-Polymer Cells Including Temperature Effects. In Proceedings of the IECON 2010—36th Annual Conference on IEEE Industrial Electronics Society, Glendale, AZ, USA, 7–10 November 2010. [Google Scholar]
  23. Dewan, S.B. Optimum Input and Output Filters for a Single-Phase Rectifier Power Supply. IEEE Trans. Ind. Appl. 1981, IA-17, 282–288. [Google Scholar] [CrossRef]
  24. Uno, M.; Tanaka, K. Influence of High-Frequency Charge–Discharge Cycling Induced by Cell Voltage Equalizers on the Life Performance of Lithium-Ion Cells. IEEE Trans. Veh. Technol. 2011, 60, 1505–1515. [Google Scholar] [CrossRef]
  25. Li, J.; Murphy, E.; Winnick, J.; Kohl, P.A. The effects of pulse charging on cycling characteristics of commercial lithium-ion batteries. J. Power Sources 2001, 102, 302–309. [Google Scholar] [CrossRef]
  26. Amanor-Boadu, J.; Guiseppi-Elie, A.; Sánchez-Sinencio, E. The Impact of Pulse Charging Parameters on the Life Cycle of Lithium-Ion Polymer Batteries. Energies 2018, 11, 2162. [Google Scholar] [CrossRef] [Green Version]
  27. Chen, L.R.; Wu, S.L.; Shieh, D.T.; Chen, T.R. Sinusoidal-Ripple-Current Charging Strategy and Optimal Charging Frequency Study for Li-Ion Batteries. IEEE Trans. Ind. Electron. 2013, 60, 88–97. [Google Scholar] [CrossRef]
  28. Osswald, P.; Erhard, S.; Noel, A.; Keil, P.; Kindermann, F.; Hoster, H.; Jossen, A. Current density distribution in cylindrical Li-Ion cells during impedance measurements. J. Power Sources 2016, 314, 93–101. [Google Scholar] [CrossRef] [Green Version]
  29. Mingant, R.; Bernard, J.; Moynot, V.S.; Delaille, A.; Mailley, S.; Hognon, J.L.; Huet, F. EIS Measurements for Determining the SoC and SoH of Li-Ion Batteries. ECS Trans. 2011, 33, 41. [Google Scholar] [CrossRef]
Figure 1. Schematic representation of the SS-ICPT architecture investigated in this paper.
Energies 13 02621 g001
Figure 2. Experimental set-up to measure the battery series-resistance.
Energies 13 02621 g002
Figure 3. Experimental set-up to measure the battery stray inductance.
Energies 13 02621 g003
Figure 4. Photograph of the prototype developed to validate the simulations.
Energies 13 02621 g004
Figure 5. Schematic of the ICPT secondary circuit: (a) compensation capacitor and bridge rectifier; (b) C 0 expansion board.
Energies 13 02621 g005
Figure 6. Terminal voltage v T and current i B of the battery during the pulsed current test used to extract the series-resistance, as acquired by the oscilloscope. The voltage probe was AC coupled to improve the accuracy of the voltage drop measurement (a). Voltage and current waveforms of the circuit used to measure the battery stray inductance when in resonance (b).
Energies 13 02621 g006
Figure 7. Waveforms of the voltage v S S ( t ) and the current i S S ( t ) measured at the bridge rectifier input and compared to the relevant simulation results. The waveforms show a good fit even if the current signal is rather noisy.
Energies 13 02621 g007
Figure 8. Total power transferred to the battery as a function of the filtering capacitor.
Energies 13 02621 g008
Figure 9. Waveforms of the voltage v S S ( t ) and current i S S ( t ) measured at the input of the bridge rectifier, with C 0 = 9 . 4 μ F (a), C 0 = 807 nF (b) and C 0 = 220 nF (c). Battery current i O U T ( t ) and voltage v O U T ( t ) for C 0 = 9 . 4 μ F (d), C 0 = 807 nF (e) and C 0 = 220 nF (f).
Energies 13 02621 g009
Table 1. Characteristic parameter values of the SS-ICPT prototype developed in this work.
V P (V) f w (kHz) C 1 (nF) C 2 (nF) L 1 (µH) L 2 (µH)k
42 1 15080700141.60.5 2
1 : Amplitude of the fundamental component of the H-bridge output square wave. 2 : The coupling factor was measured considering the two coils L 1 , L 2 centered and strictly faced one to the other.
Table 2. Values of the capacitor C 0 used in the experiments that sets f 0 and ξ .
C 0 (μF)0.220.320.660.760.8070.9270.97424.79.4
f 0 ( kHz ) 581.93482.51335.98313.09303.84283.49276.57193.00125.9089.03
ξ ( × 10 3 ) 6.037.2810.4511.2111.5512.3812.6918.1927.8939.44

