Article

Non-Contact Degradation Evaluation for IGBT Modules Using Eddy Current Pulsed Thermography Approach

1
College of Electrical Engineering, Zhejiang University, Hangzhou 310027, China
2
College of Electrical and Electronic Engineering, Newcastle University, Newcastle upon Tyne NE1 7RU, UK
*
Author to whom correspondence should be addressed.
Energies 2020, 13(10), 2613; https://doi.org/10.3390/en13102613
Submission received: 10 April 2020 / Revised: 13 May 2020 / Accepted: 19 May 2020 / Published: 21 May 2020

Abstract

:
In this paper, a non-contact degradation evaluation method for insulated gate bipolar transistor (IGBT) modules is proposed based on eddy current pulsed thermography approach. In non-contact heat excitation procedures, a high-power induction heater is introduced to generate heat excitation in IGBT modules. The thermographs of the whole temperature mapping are recorded non-invasively by an IR camera. As a result, the joint degradation of IGBT modules can be evaluated by the transient thermal response curves derived from the recorded thermographs. Firstly, the non-destructive evaluation principle of the eddy current pulsed thermography (ECPT) system for an IGBT module with a heat sink is introduced. A 3D simulation module is built with physical parameters in ANSYS simulations, and then thermal propagation behavior considering the degradation impact is investigated. An experimental ECPT system is set up to verify the effectiveness of the proposed method. The experimental results show that the delay time to peak temperature can be extracted and treated as an effective indicative feature of joint degradation.

Graphical Abstract

1. Introduction

With continuous innovation and development of power semiconductor techniques, the insulated gate bipolar transistors (IGBTs) are representative of a fully controlled electronic device, which is widely used in motor drives, renewable energy generation systems, etc. [1,2]. The main trends of modern IGBT modules are higher switching frequency, smaller chip footprint, and higher operating temperature [3]. These trends challenge the reliability design of IGBT modules.
Based on the classic bathtub curve of failure rate of power devices over their lifetime, the failure period consists of three main stages: early failure, middle random failure, and the wear-out failure period [4]. In the first two stages, the failure factors are mainly concerned with manufacturing (e.g., edge emitter design) and unexpected excessive stress (e.g., short circuit current). Owing to the features of slowing propagation and aging regularity, wear-out failure is most likely to be monitored and predicted during long term service [5].
Since joint degradation failures are affected by the internal thermal stress (due to power loss) and external temperature changes, these failures are of academic and industrial interests. In terms of power conversion systems, typical joint degradation failures include delamination and random voids, particularly in the solder and thermal grease layer [6,7]. Generally, the main reasons for joint degradation failures are mismatched coefficients of thermal expansion (CTE) and dry-out of the thermal grease [8,9]. Joint degradation failure is a significant long-term failure mode and negatively impacts the effective connection area between layers and the thermal emission path. As a result, the maximum operating temperature and peak output power decline after a long-running period [10].
Traditional detection methods for joint degradation are mainly based on monitoring the degradation of sensitive electrical parameters (DSEPs) and junction temperature (Tj). Parameter variation caused by degradation can be reflected and extracted from external electrical parameters. An inspected IGBT module in a power circuit can be taken as a resistor-inductor-capacitor (RLC) network during switching transitions, where the equivalent RLC network is dependent on the joint conditions of the multilayer structure. It has been reported that collector voltage vce,on under small current [11,12,13] and low order harmonics of the output voltage [14] are effective DSEPs for RLC degradation detection. However, additional auxiliary and sampling circuits for DSEPs measurement are needed during testing.
The surface Tj measurement is a more direct way of degradation detection. Degradation failures like delamination, cracks and voids can worsen heat emission ability. The measured Tj increases with degradation under the same test conditions. In general, the accurate Tj measurement methods are mainly divided into the temperature sensitive electrical parameter (TSEP) methods [15,16] and optical methods [17,18]. For the TSEP method, high accuracy Tj can be extracted non-invasively. However, every TSEP needs a delicate calibration procedure and relevant calibration circuits. Furthermore, inside the package, parasitic parameter changes caused by the aging effects, introduce measurement errors. The advantage of an IR camera is the possibility to obtain the global temperature of the power device. Nevertheless, the accuracy of an IR camera is affected by the emissivity of the chip surface. In order to get more accurate results, the silica gel within the inspected IGBT module should be removed, and thermal black paint needs to be deposited on the chip surface [19].
As mentioned, the two critical steps in degradation detection are the excitation process and the measurement process. However, the excitation and measuring processes are mostly physical contact methods. These physical contact methods are limited by field-environment and maintenance time. The ideal defect identification method should ensure the normal operation is not interrupted.
Recently, the idea of non-destructive and non-contact evaluation test methods for field application has been reported [20,21]. This paper proposes a non-contact test method for joint degradation detection, based on an eddy current pulsed thermography (ECPT) technique. Because of the high conductivity of the metal elements in the heat-sink, copper, and solder, the inspected IGBT module can be non-contact heated by using an inductor heater. Then, the global thermography can be recorded by an IR camera and analyzed by pulsed thermography (PT) technique. As a result, the degradation process characteristics can be extracted and evaluated from pulse thermal transient response curves.
This paper is organized as follows. In Section 2, the thermal resistor-capacitor (RC) network degradation in IGBT modules is analyzed. In Section 3, the ECPT system operational principle and defect identification method is proposed to evaluate the thermal RC network defect. In Section 4, an ECPT platform is built for simulation and experimental verification. The last section summarizes the conclusions drawn from the investigation.

2. Thermal RC Network Degradation and Detection

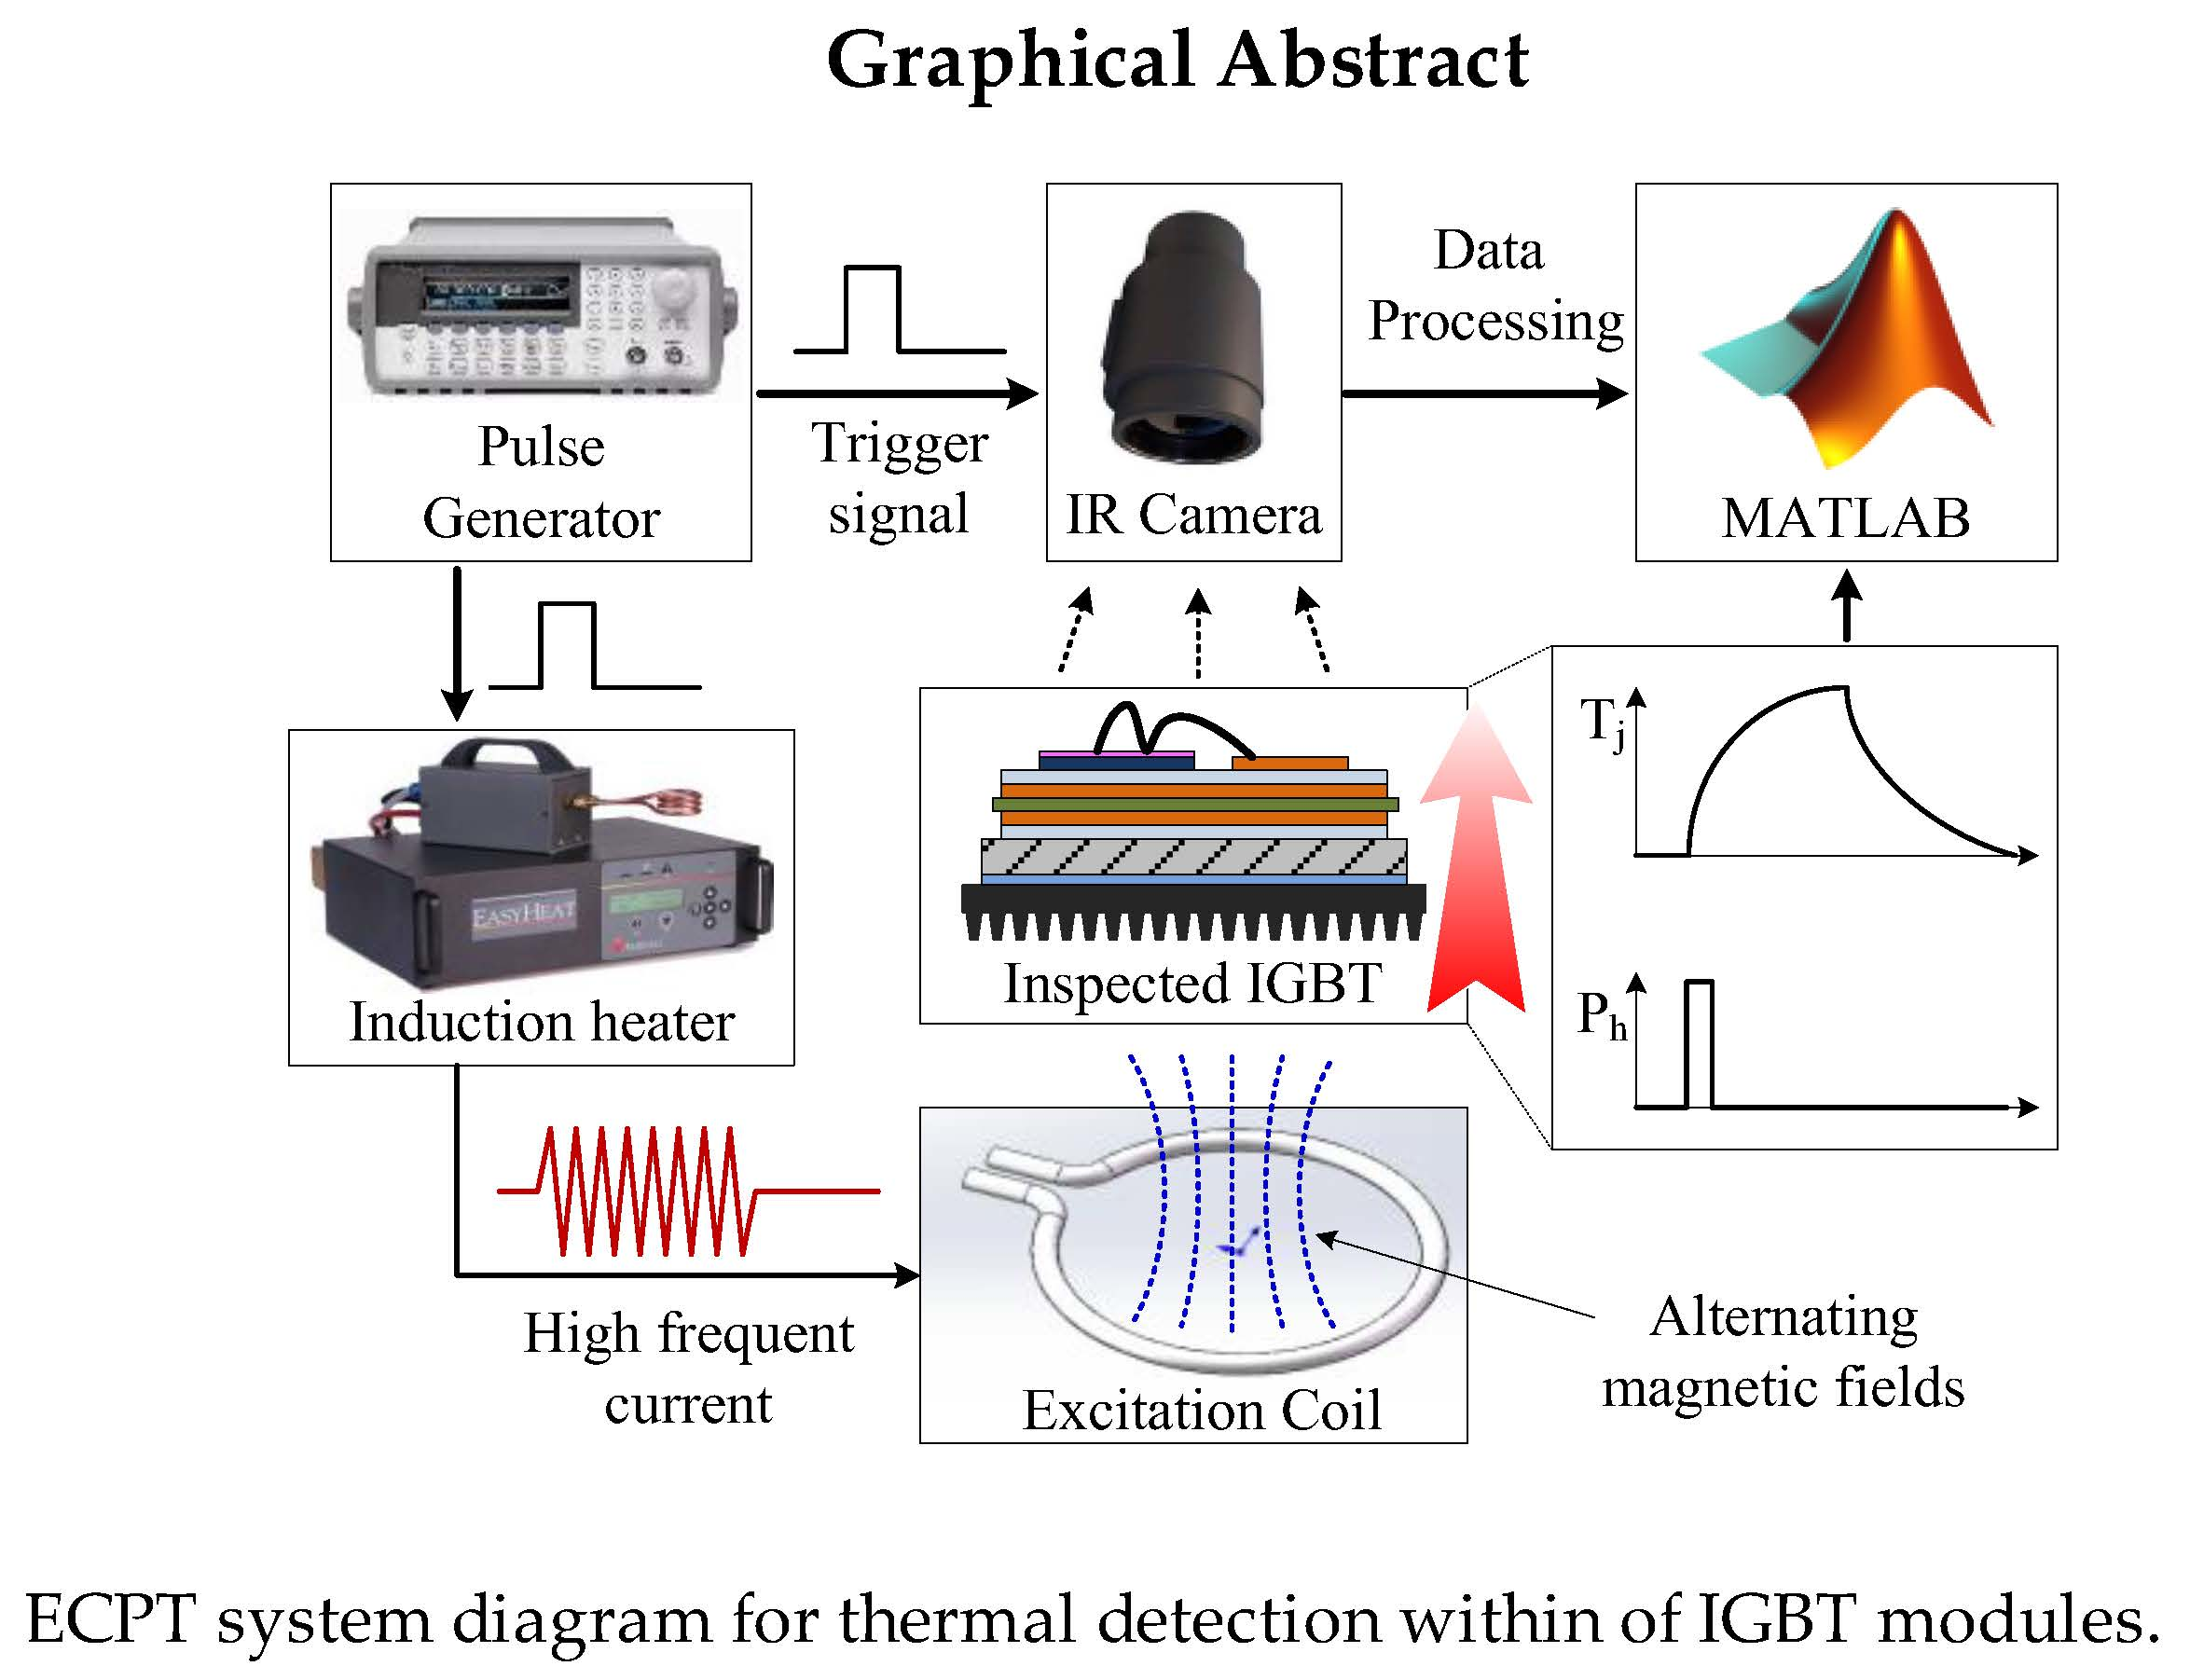
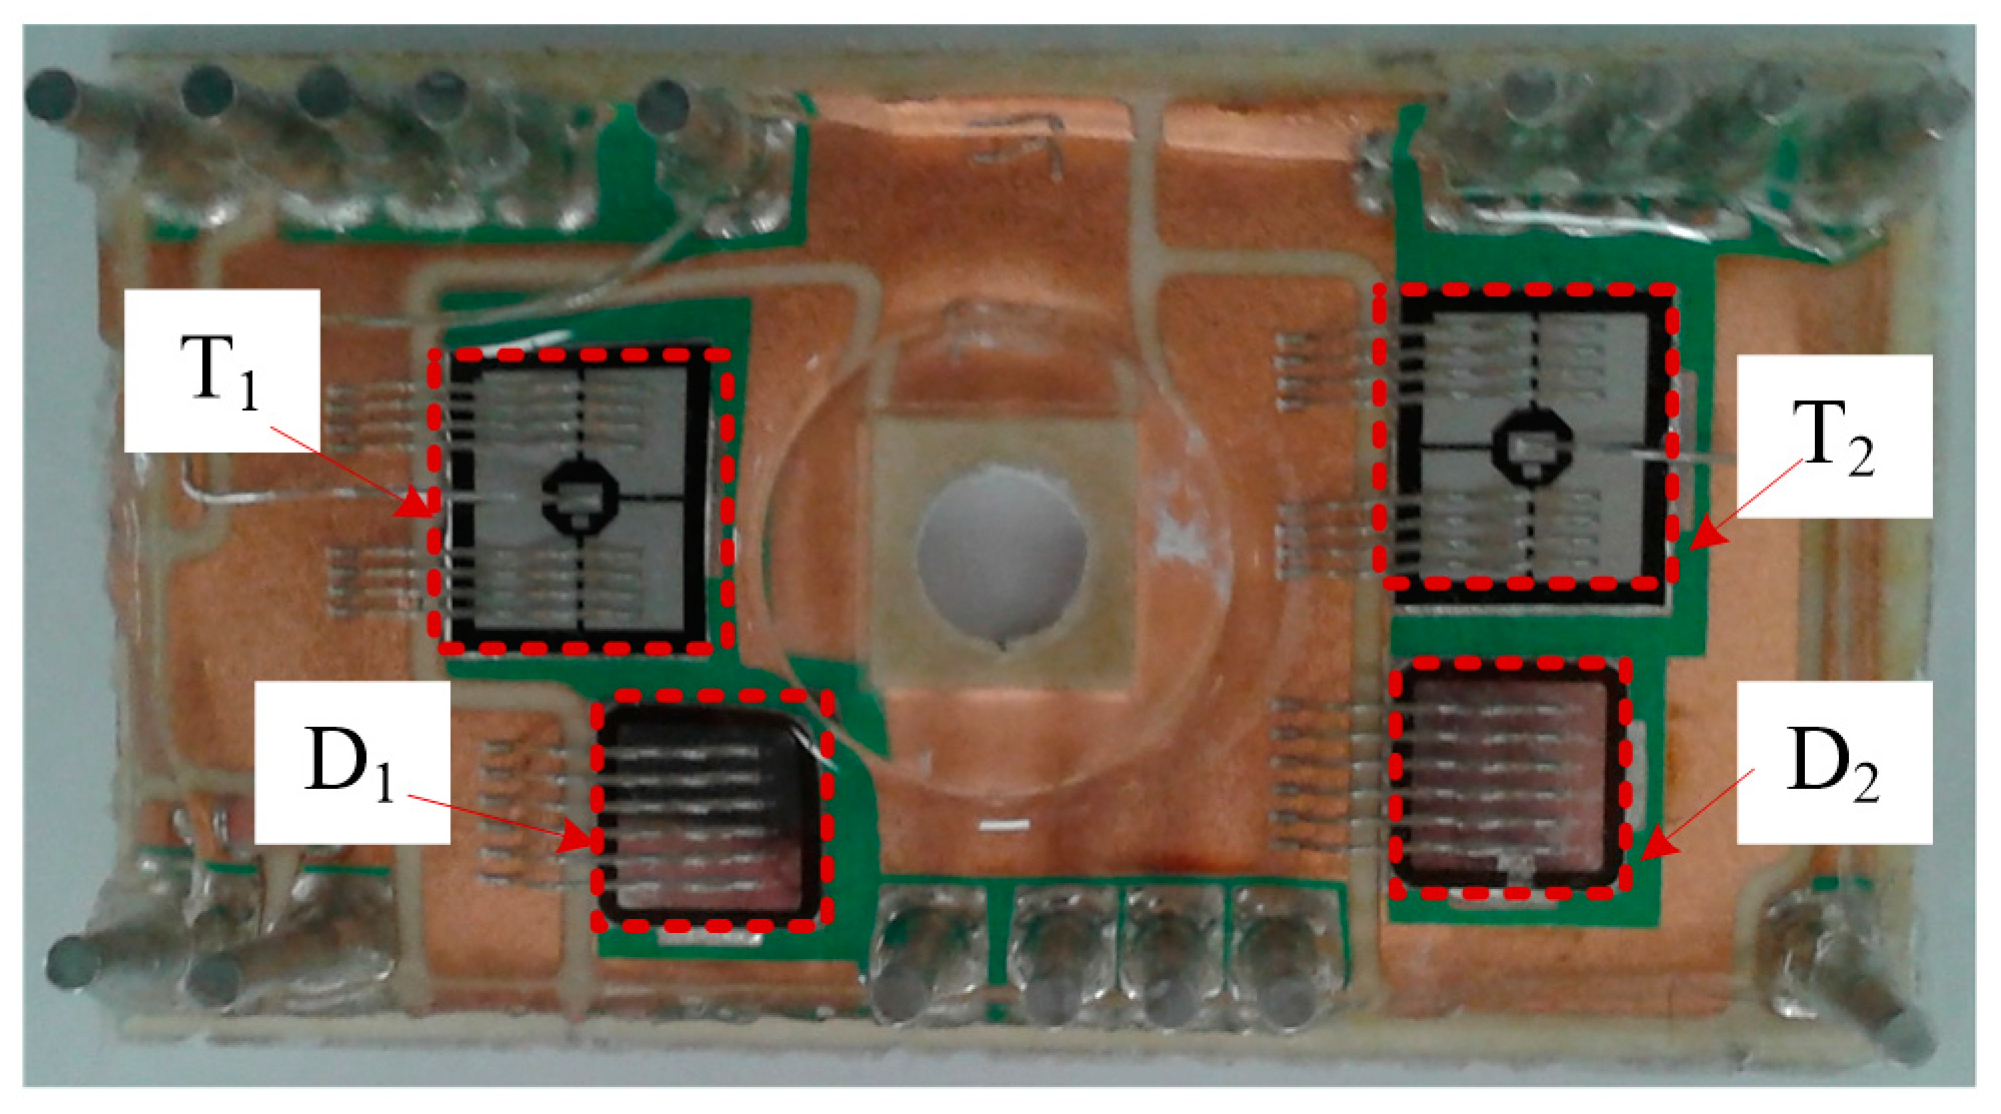
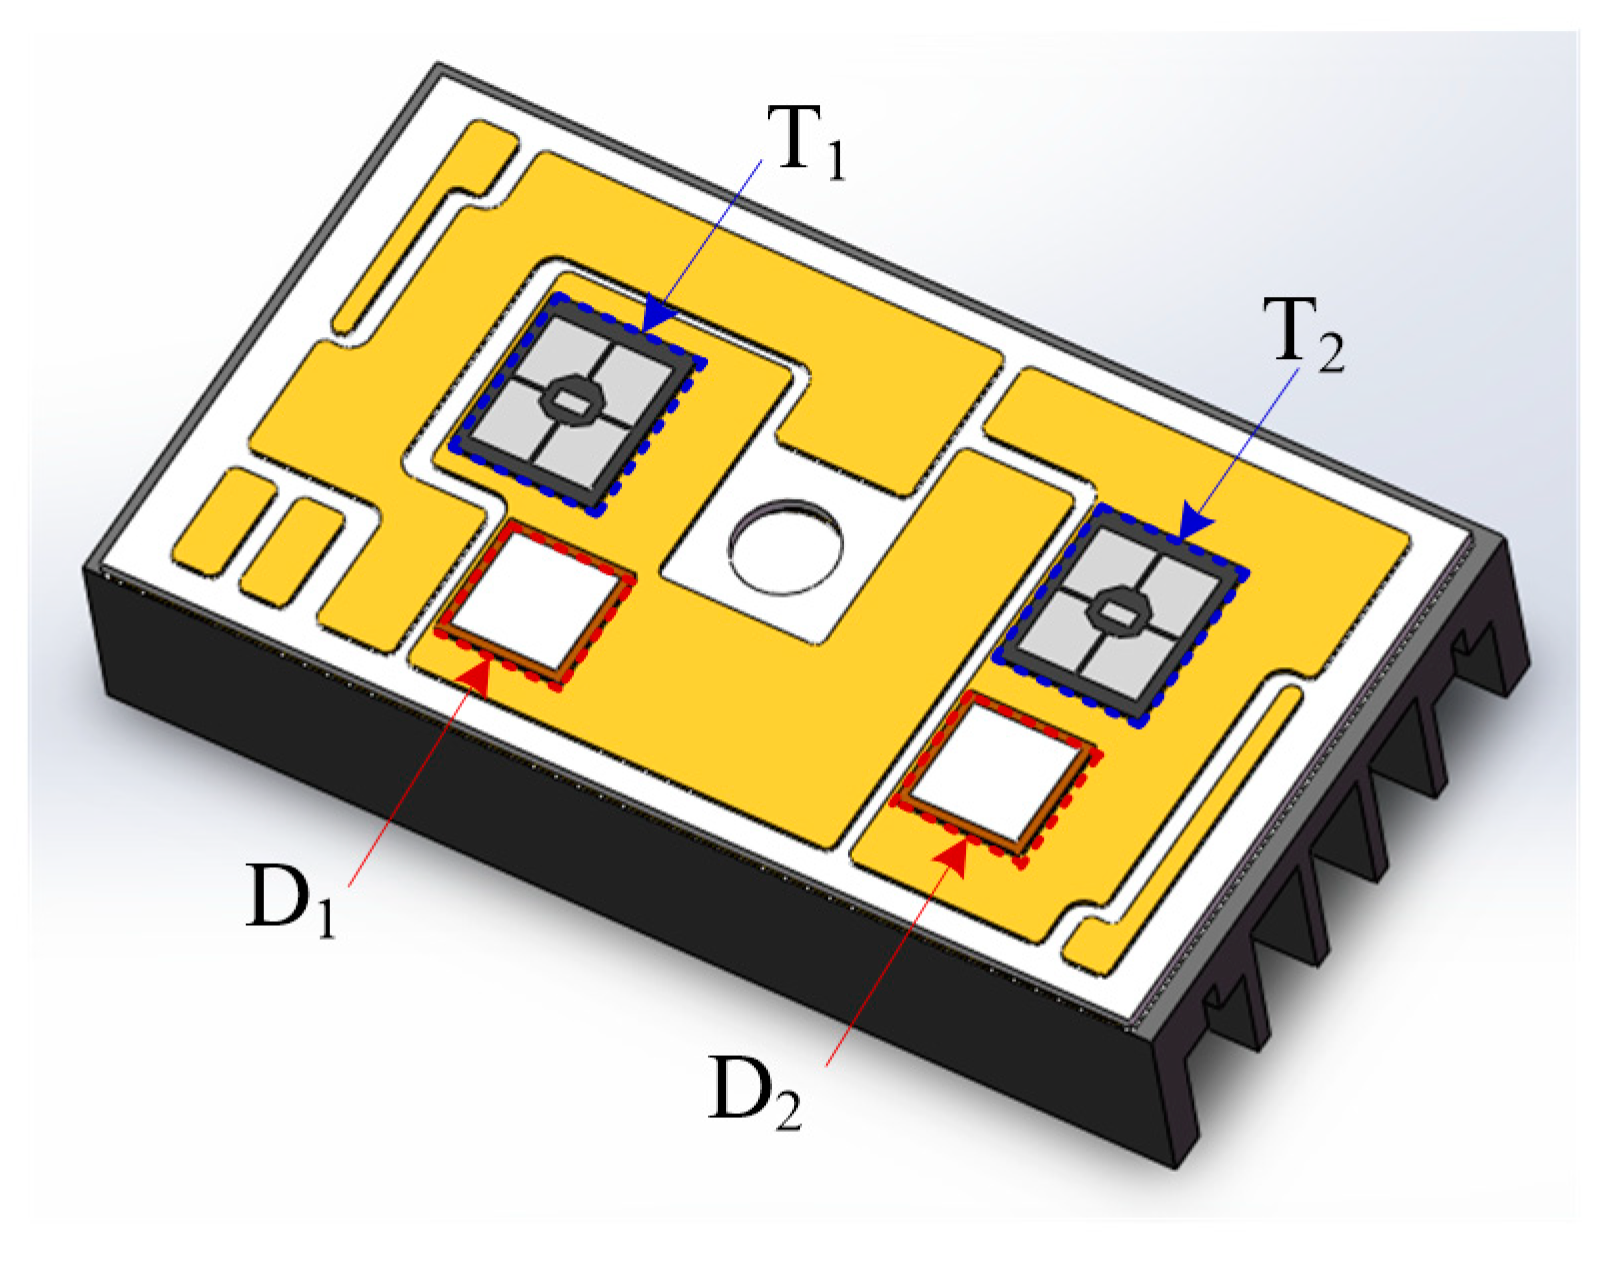
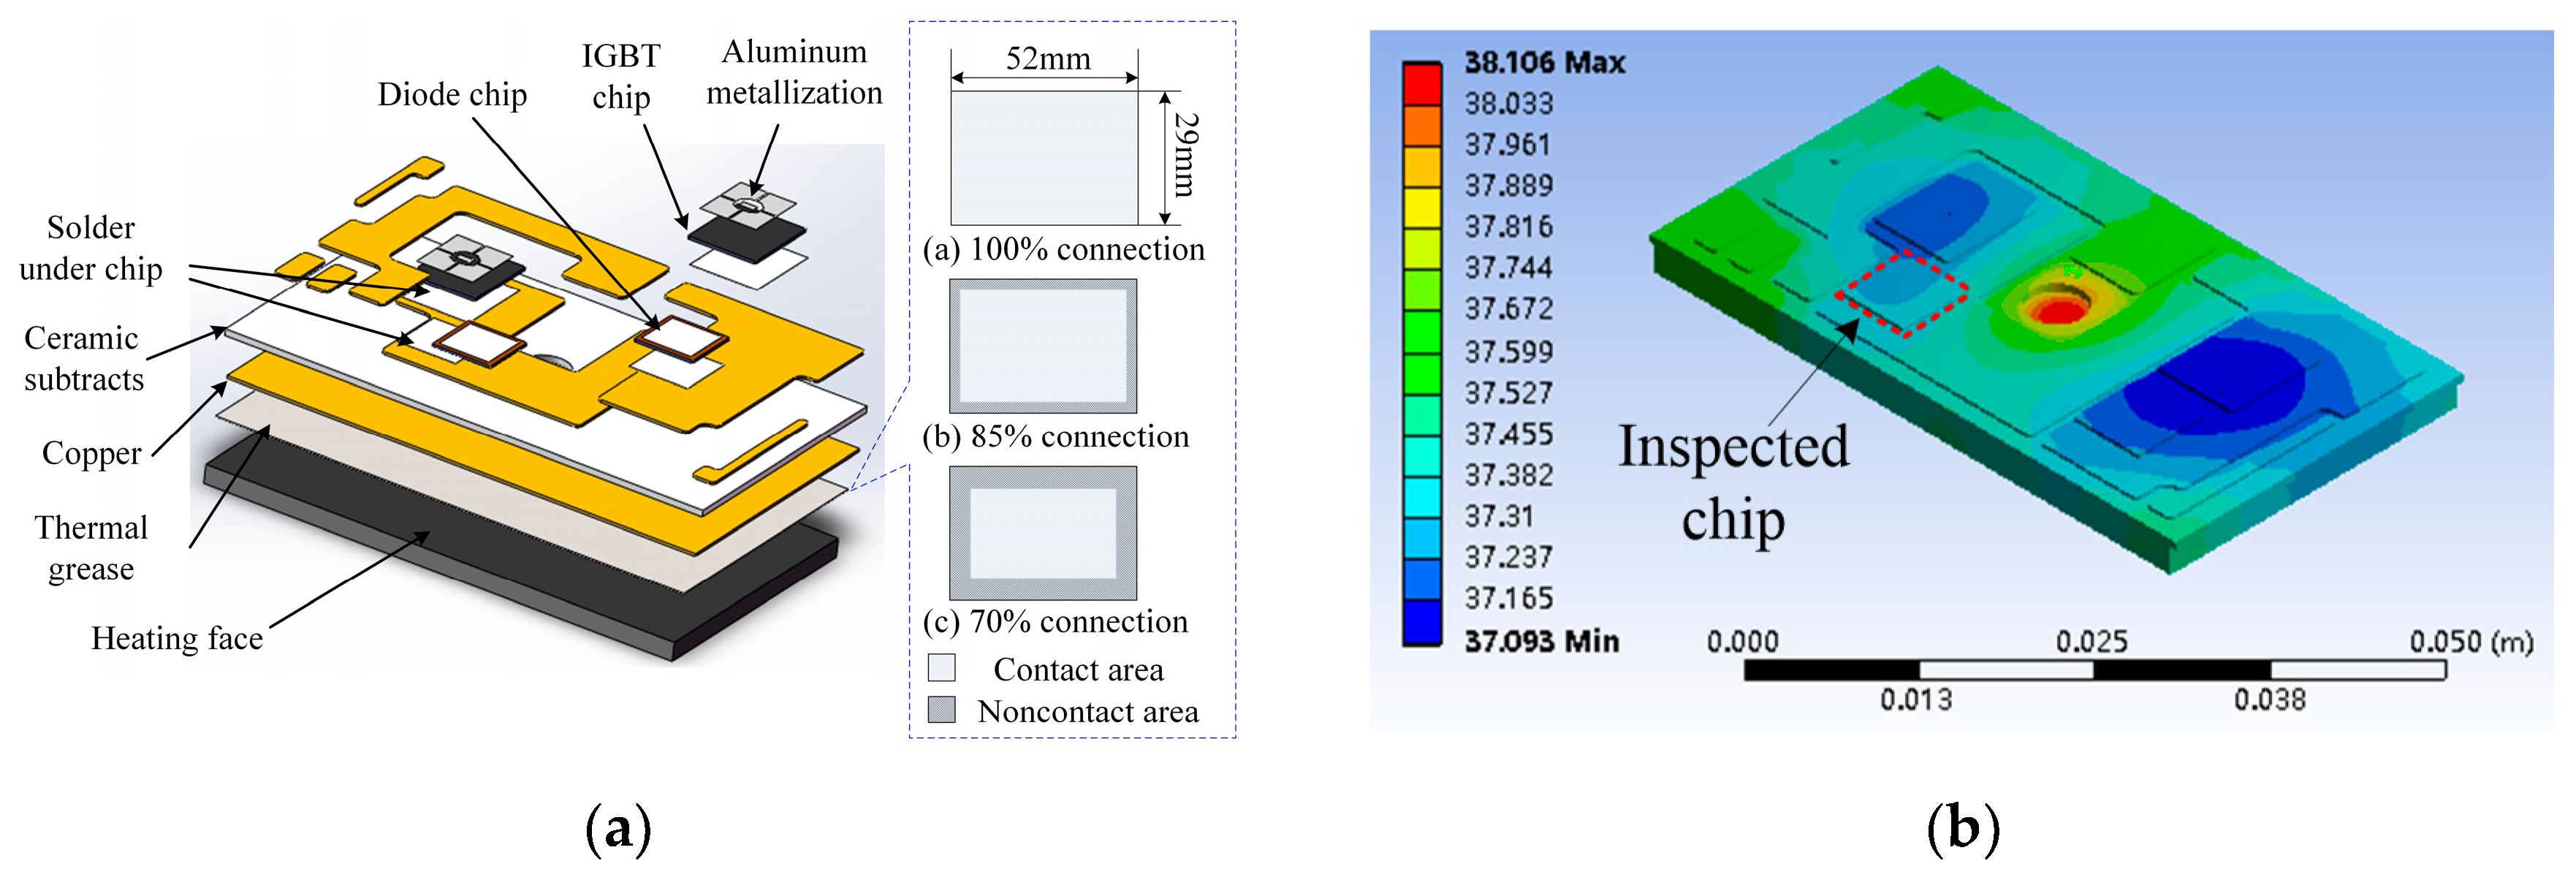
2.1. Characteristic of Degradation in an IGBT Module

The emerging base-plate free module is studied in this section. Because it is free from base plate, it can save cost and reduce the thermal resistance. In Figure 1, the cross-section of a base-plate free module with heat-sink is shown. The IGBT module consists of several layers of different materials, and the silicon chip and baseplate are soldered together by the so-called direct bonded copper (DBC) method. In order to obtain better heat conduction, it is necessary to add a thin and even layer of thermal grease between the IGBT module and the heat sink.
Operational IGBT modules suffer from various thermal stresses, not only internal power losses but also external temperature cycling. The identified lifetime limiting degradation failures are associated with the solder joints. Also, dry-out failure mechanisms are associated with the thermal grease layer [22]. The most common characteristic degradations with delamination are internal random voids in the multi-layer structure, as illustrated in Figure 2.
Owing to the accumulative thermo-mechanical stresses of power and thermal cycling, the outmost corner is the most stressed region [23]. The identified lifetime limiting delamination is expected to start at the corners and then spread along the entire boundary. More seriously, they will continue to enlarge with continued operation cycling. In general, this degradation reduces the effective connection area between two layers and can be represented by lumped thermal RC network parameters [24].

2.2. Degradation Thermal Modeling

IGBT model thermal behavior can be determined by geometrical and physical approaches as follow:
{ R t h = d H / ( λ t h S A ) C t h = c ρ d H S A τ t h = R t h C t h
in which Rth and Cth are the associated thermal resistance and thermal capacitance of each layer. dH and SA are the thickness and cross-section area of each layer. In order to obtain the values of Rth and Cth, the material property of each layer, like thermal conductivity λth, specific heat c, and material density ρ, are necessary. τth is the thermal time constant of a layer.
The studied module is SK75GB12T4T from Semikron, where the layout of the unpackaged IGBT module is seen in Figure 3. There are four 75 A silicon chips (T1, T2 are IGBT dies and D1, D2 are diode dies) soldered onto two copper plates with different areas. The transparent encapsulation (silicone gel) on top of the chips can protect from moisture, powder, and besmirch in the operation and it also provides electrical insulation. Because of its position in the outermost layer and the relatively small thermal conductivity of silicone gel (0.2 W/m·K), the encapsulation is not considered in the following simulations. As a result, the thermal network degradation caused by the encapsulation layer is ignored, and almost all the temperature mapping changes can be attributed to the solder layer degradation in this work.
The properties and thickness of each module layer and the thermal grease are listed in Table 1, which mainly refer to the manual [25] obtained from the official website of Semikron.
The RC thermal network values can be calculated by the lumped RC thermal method. Hence, since most of the heat flows to the heat-sink, the studied module can be built as a one-dimensional model. The thermal RC network values are altered after long term service. The variable valued thermal RC network, considering the delamination degradation factors, is plotted in Figure 4, where the major degradation parts are considered to be the Die-DBC solder and the thermal grease layer. The RC networks are corresponding to the definitions shown in Figure 1 and the values are extracted from the material properties. The effective interface area decreases with increased fatigue damage accumulation. The thermal capacitance is related to material volume, whilst thermal resistance is related to the interface area between layers. For joint degradation like delamination and random voids, the change in thermal capacitance is significantly less than the thermal resistance change.
In Figure 5, the thermal time constant under different connection area of the thermal grease layer and die-attach solder layer, are plotted. The thermal time constant increases with the reduction in the connection area. The thermal time constant of thermal grease is higher than that of the die-attach solder layer.
As a result, the thermal time constant of the complete thermal RC network increases with joint degradation. Accordingly, the transient thermal response curves of the inspected die are varied with the different degradation stages. As long as the temperature propagation of inspected die can be extracted and compared with the intact die, the aging degree of thermal RC networks can be detected.

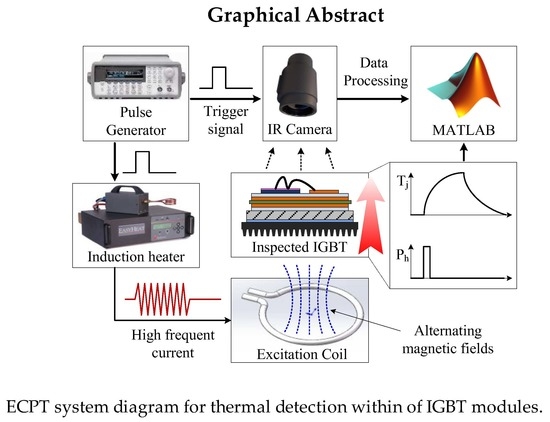
3. ECPT Based Non-Contact Detection of Thermal RC Network Degradation

3.1. Thermography Technologies

The thermal propagation rate is changed by the deformation and metamorphism in the multi-layer structure. Thermography technology has been gradually applied in electronics devices in recent years. Pulse thermography (PT), lock-in thermography (LIT), and the pulse-phase thermography (PPT) are proposed as the effective algorithms for the analysis of transient thermal response [26,27,28]. A comprehensive comparison of these techniques has been analyzed in terms of transient thermal response in [29]. The thermography analysis methods have been applied to the failure detection in electronics packaging like the printed circuit boards (PCBs), cracks in the coppers and random voids in soldered metal-oxide-semiconductor field effect transistors (MOSFETs) [29,30,31]. In this work, a fast degradation detection method based on the combination of inductive eddy current heating and the PT technique is studied.

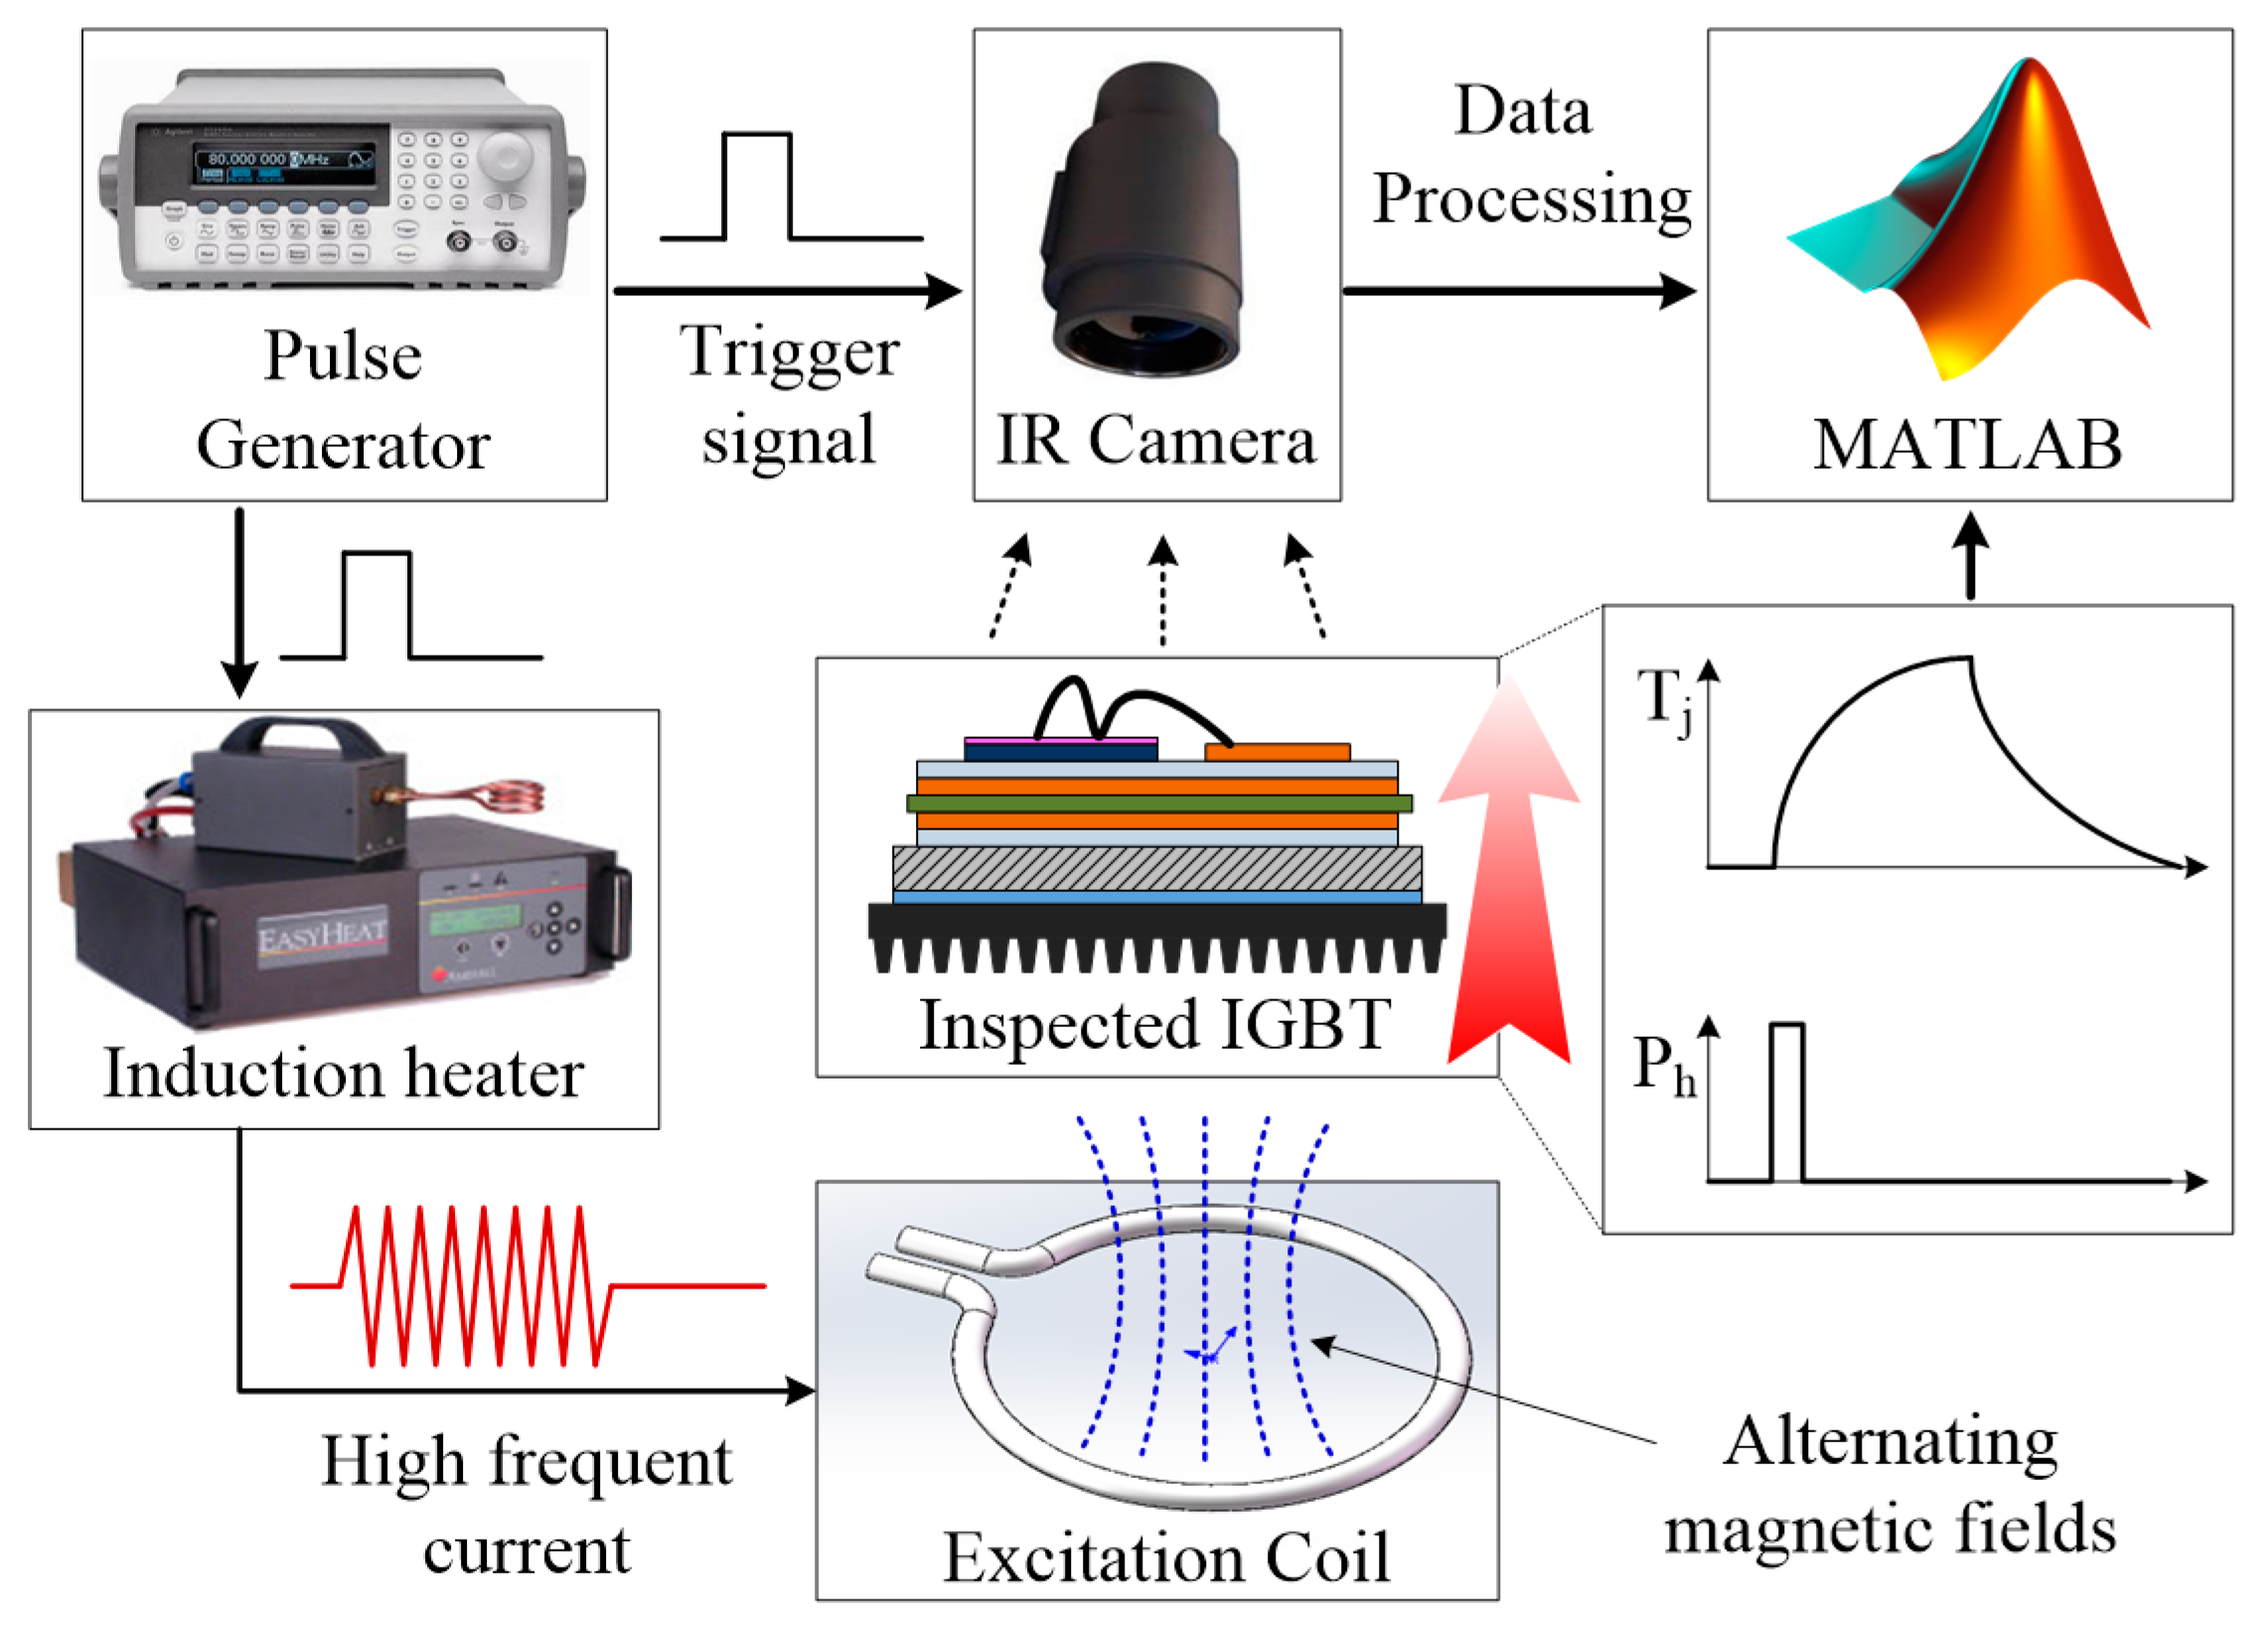
3.2. Operation Principle of ECPT System

The eddy current pulsed thermography (ECPT) system is shown in Figure 6, where the four main parts are: non-contact inductive excitation source, IGBT based power converter, infrared camera for temperature map measurement, and data processing.
In power converter systems, the heat-sink material is mainly aluminum alloy. The heat sink volume is significantly more than the volume of the metal layers (copper and solder layers) in an IGBT module. When the inspected IGBT sample is placed above the excitation coil, most induced heat power (Ph) comes from beneath the module assembly. In practice, Ph is related to material property and induction heater parameters and is governed by:
P h I e 2 μ f σ ,   σ = σ 0 1 + α ( T T 0 )
where Ie is the high-frequency coil excitation current, f is the alternating current (AC) frequency, µ is the permeability of material under test, electrical conductivity σ is the temperature-dependent parameter, and σ0 is the conductivity of material at temperature T0 and α is the temperature coefficient of resistivity [27]. The applied AC frequency is related to the heating power and the material property of the sample.
The excitation power generated by the induction heater is a series of high, fixed frequency AC pulses and is controlled by adjusting the frequency and duration of AC. The duration of high-frequency AC and the recording time are both controlled and triggered synchronously by the pulse generator. The induced eddy currents and corresponding resistive heat Q are induced into the conductive material of the inspected sample. Finally, the whole thermography is captured and the transient temperature response of the key area is extracted by the relevant software and MATLAB. The recorded thermal videos are then processed for visualization and post-processing, including defect identification, and electrical/thermal feature parameters extraction.

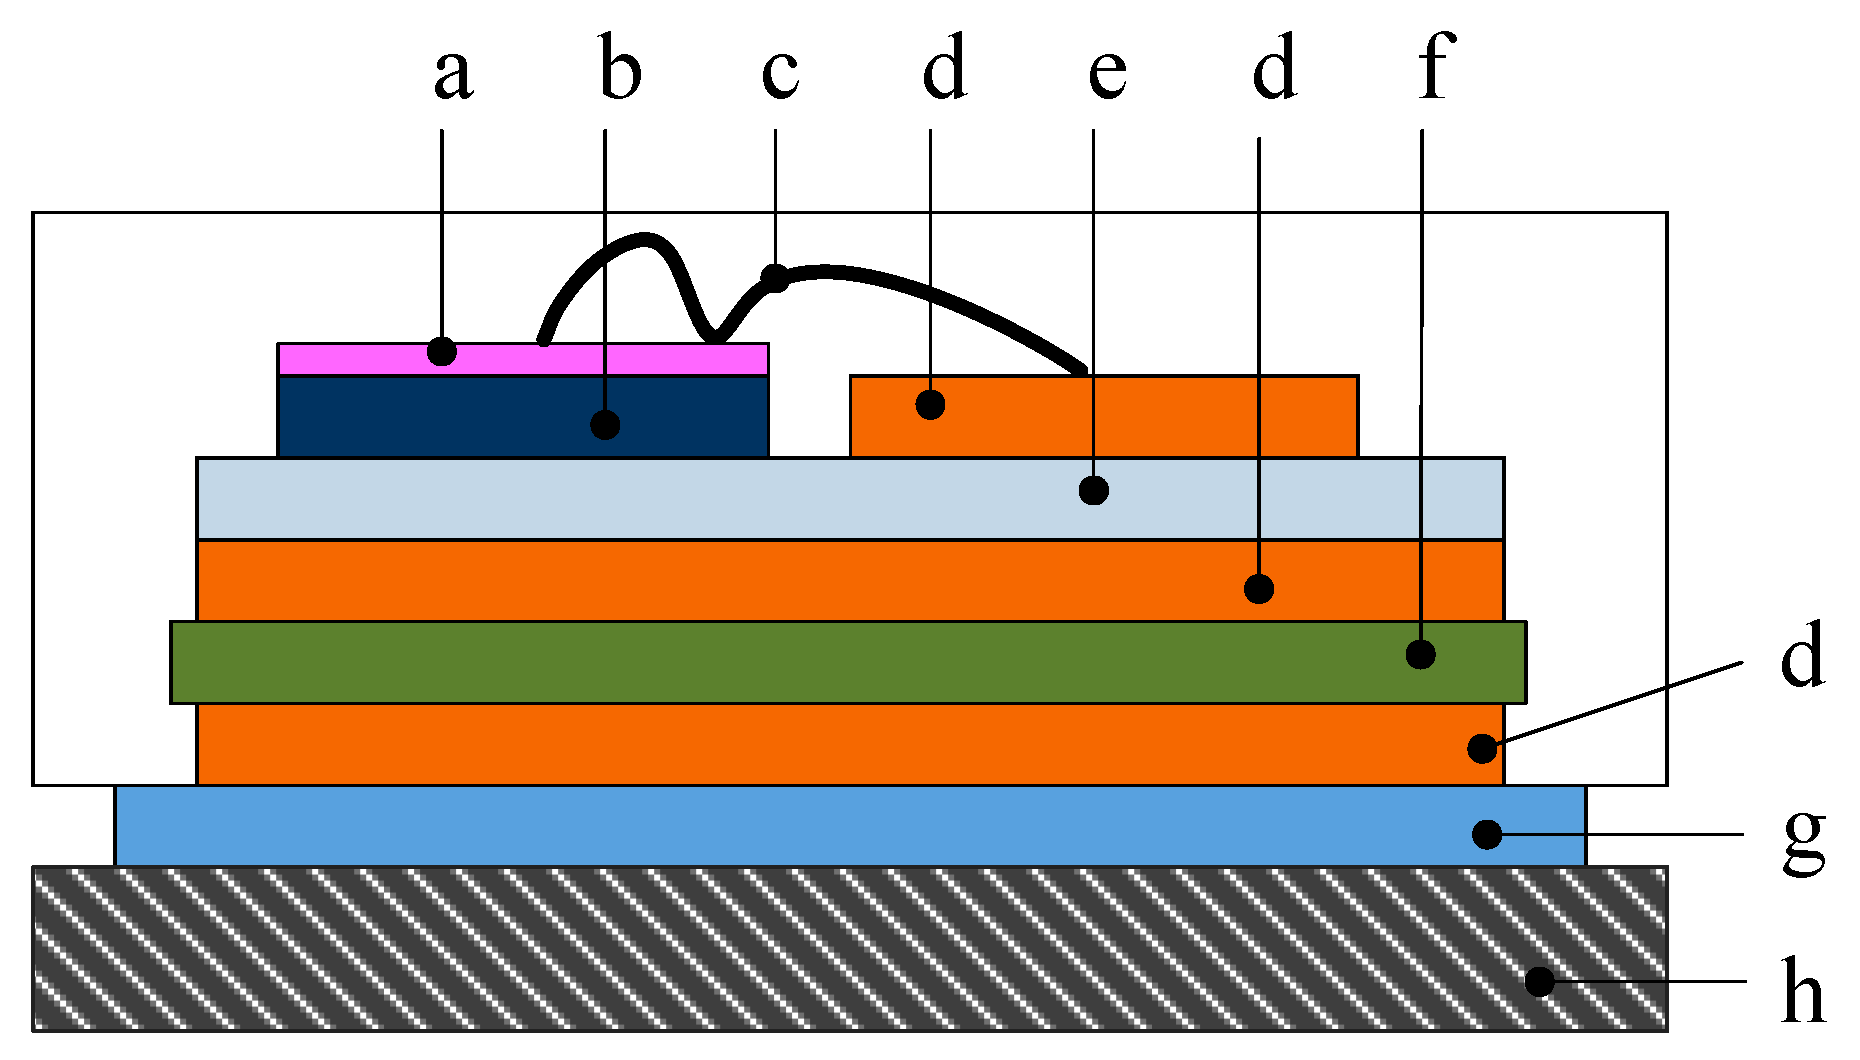
3.3. Heat Conduction Analysis

During the AC excitation period, the Joule heating and heat diffusion progress simultaneously. When the AC excitation finishes, the heat diffusion process dominates the transient temperature response. In general, the heat flow in each layer, considering the Joule heating and heat diffusion processes, are given by:
T t = λ t h ρ c ( 2 T x 2 + 2 T y 2 + 2 T z 2 ) + λ t h ρ c q ( x , y , z , t )
where T = T (x, y, z, t) is the temperature distribution, and q (x, y, z, t) is the internal heat generation per unit volume. As a result of joint degradation, the thermography of transient thermal response curves would be distorted compared with the intact inspected sample.

4. Finite Element Simulation and Experimental Results

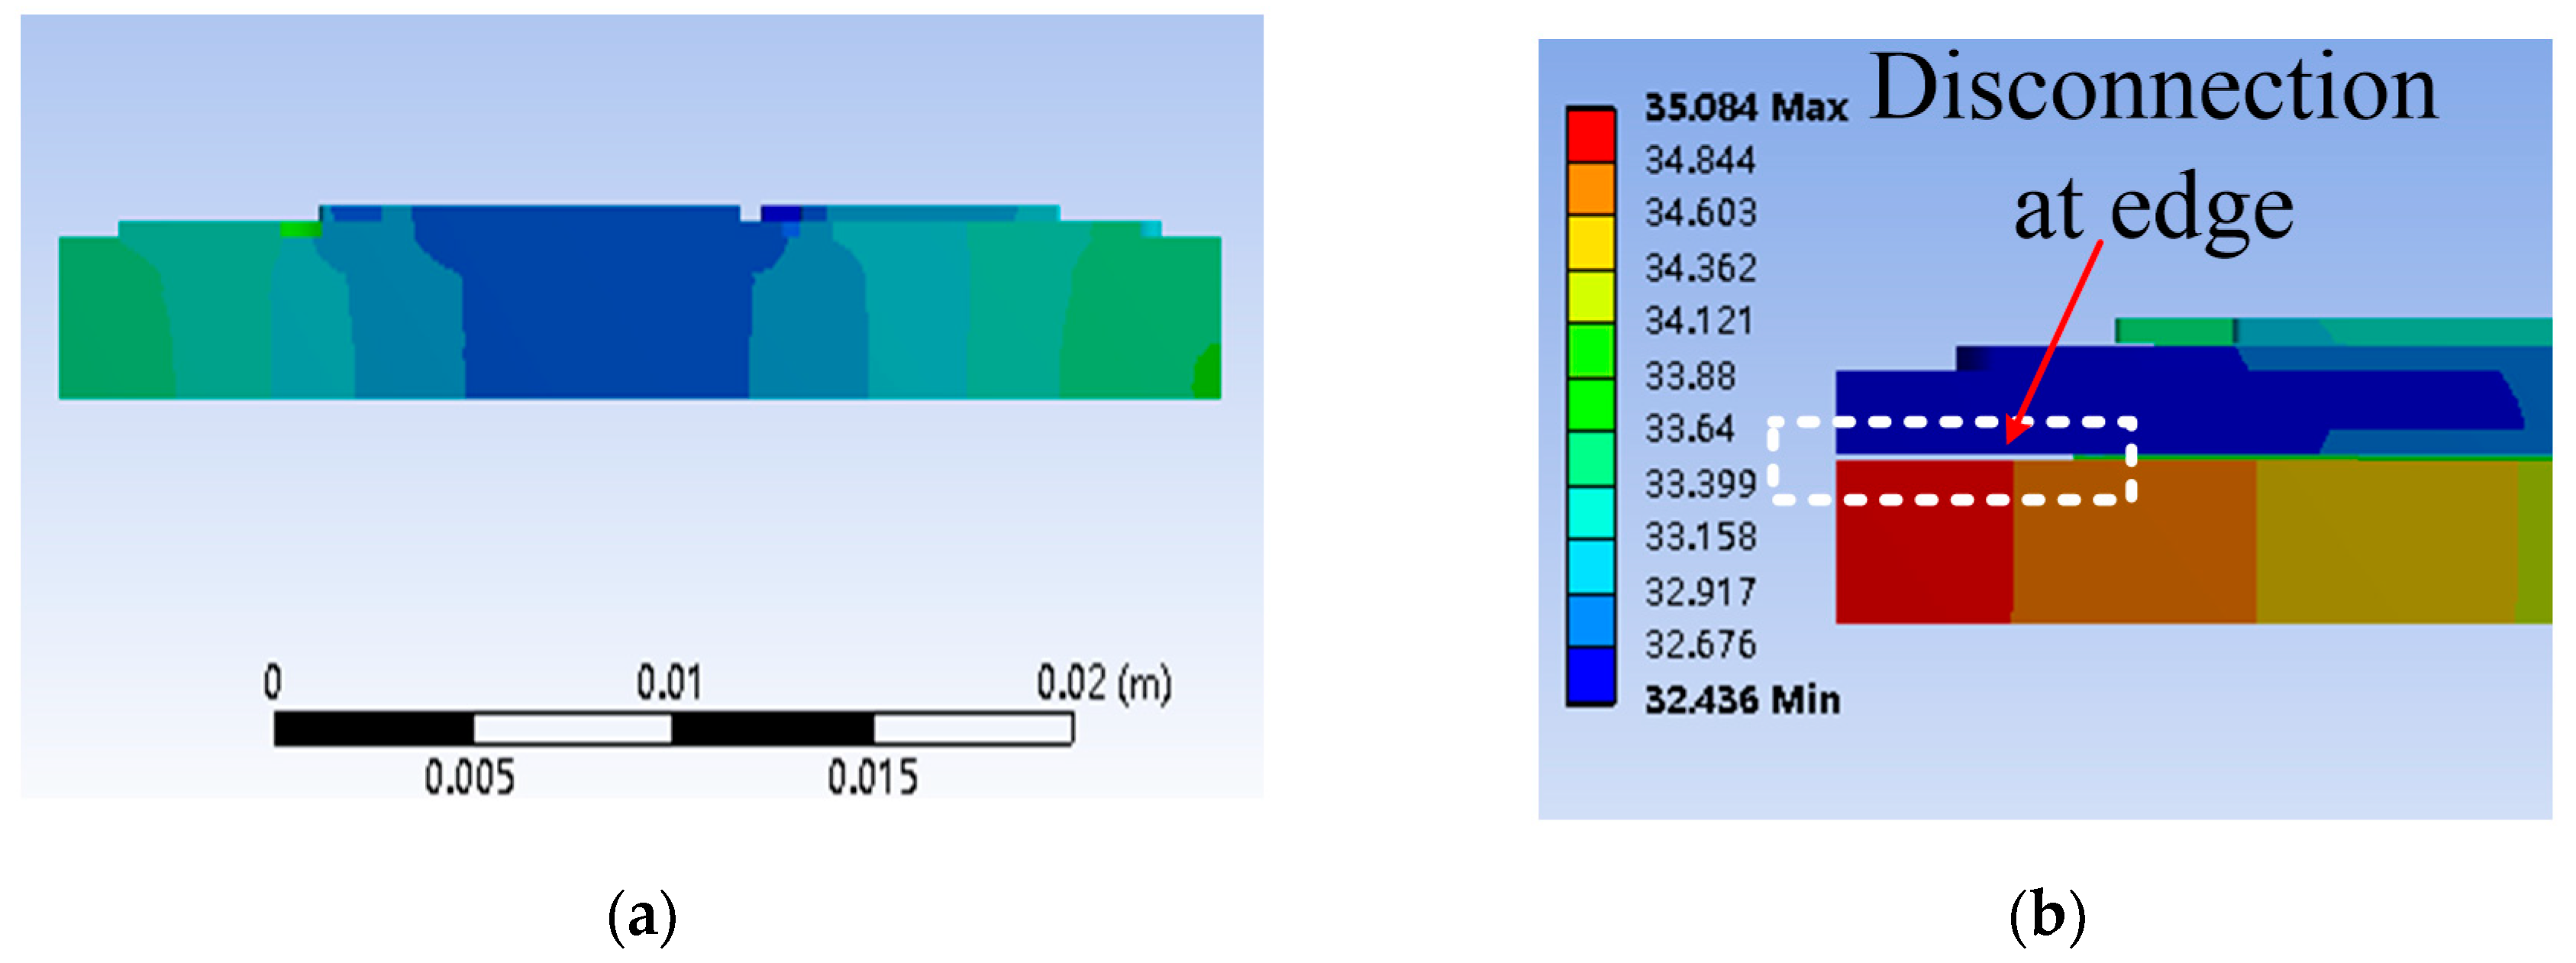
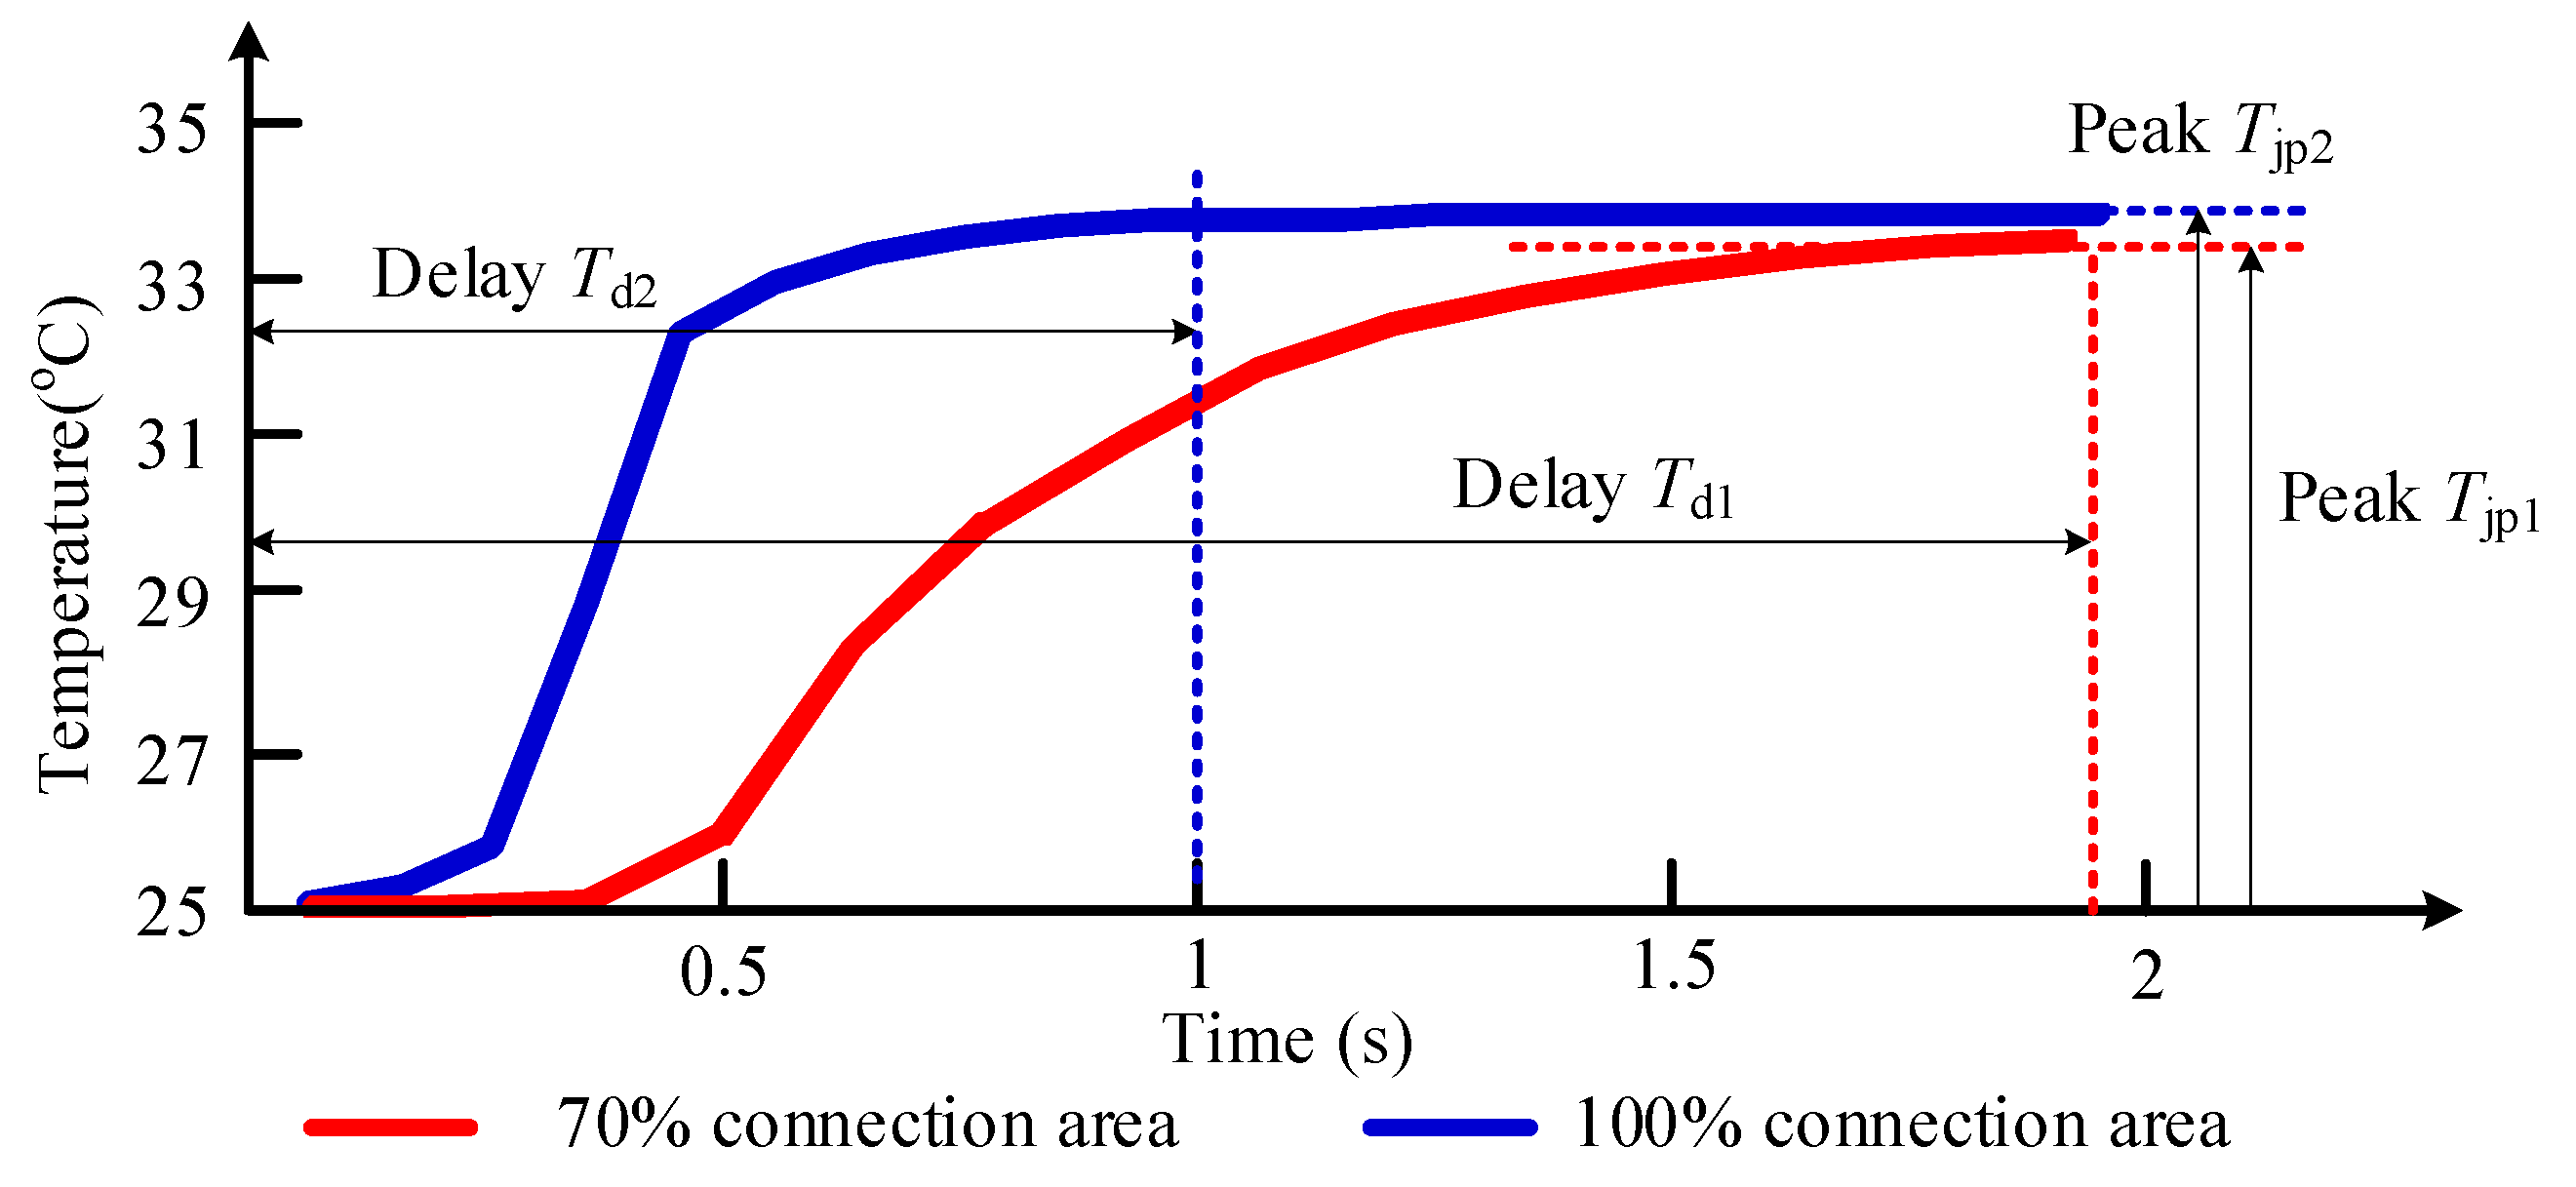
4.1. Simulation Models and Analysis

The corresponding 3D model of the studied IGBT with heat-sink, in the Solid Works environment, is shown in Figure 7. The physical parameters and thickness of each layer in the ANSYS simulation module are listed in Table 1. The ANSYS simulation environment is usually used to evaluate the electrothermal effects and safe operating temperatures for power modules, providing critical design guidelines.
In the proposed ECPT method, the eddy current heat induced is mainly accumulated at the bottom of the module, then transferred to the top surface. Therefore, because of its large thermal mass, the heat sink is assigned to be a heat source, imposed by the pulsed internal heat, in simulations. Then, the related simulation parameters and boundary conditions of the ANSYS program are set as follows: initial ambient temperature is 25 °C, convection coefficient (baseplate downside face) is 5 × 10⁻⁶ W/mm2∙°C, the internal heat generation is set to 5 × 10⁸ W/m3, and the pulse heat flux is a square wave for 200 ms.
In this simulation, the degradation change is modeled by decreasing the area of thermal grease (effectively increasing the resistance associated with grease drying). By this means, the thermal path between the top die and heat-sink becomes worse as the thermal grease area decreases. The average junction temperature of diode D1 (TjD1) is observed. The transient thermal response of TjD1 can be extracted for degradation detection. Figure 8a, shows three varying degrees of thermal grease layer area, and the related temperature distribution at 1 s with a 100% connection condition is shown in Figure 8b.
The temperature map of the cross-sectional IGBT module, considering a 70% thermal grease area, is shown in Figure 9. Since there is an edge disconnection between the heat-sink and the bottom of the IGBT module, the thermal path at this edge region is the worst path across the cross-sectional. Accordingly, the highest temperature appears at the edges of the bottom.
In Figure 10, the transient response curve of Tj for different connection areas is plotted. The peak junction temperature at 70% connection, Tjp1 is 33.6 °C, which is slightly lower than at 100% connection, Tjp2 34.4 °C. However, the delay time to the peak temperature Td1 with a 70% connection is about 1.9 s longer than with 100% connection Td2. The peak die temperature is mainly determined by the specific heat capacity and density of the materials. In the simulation, the thermal grease volume decreases with the connection area. So, this reducing substance part can be ignored compared with the IGBT module volume. Hence, the peak Tjp1 is slightly lower than Tjp2 at the end of the thermal transient pulse. Although reducing substance can be ignored during the aging process, the thermal path is significantly changed.
Consequently, the delay time to the peak temperature under pulsed heat power is a better indicator than peak temperature, to evaluate thermal network degradation.

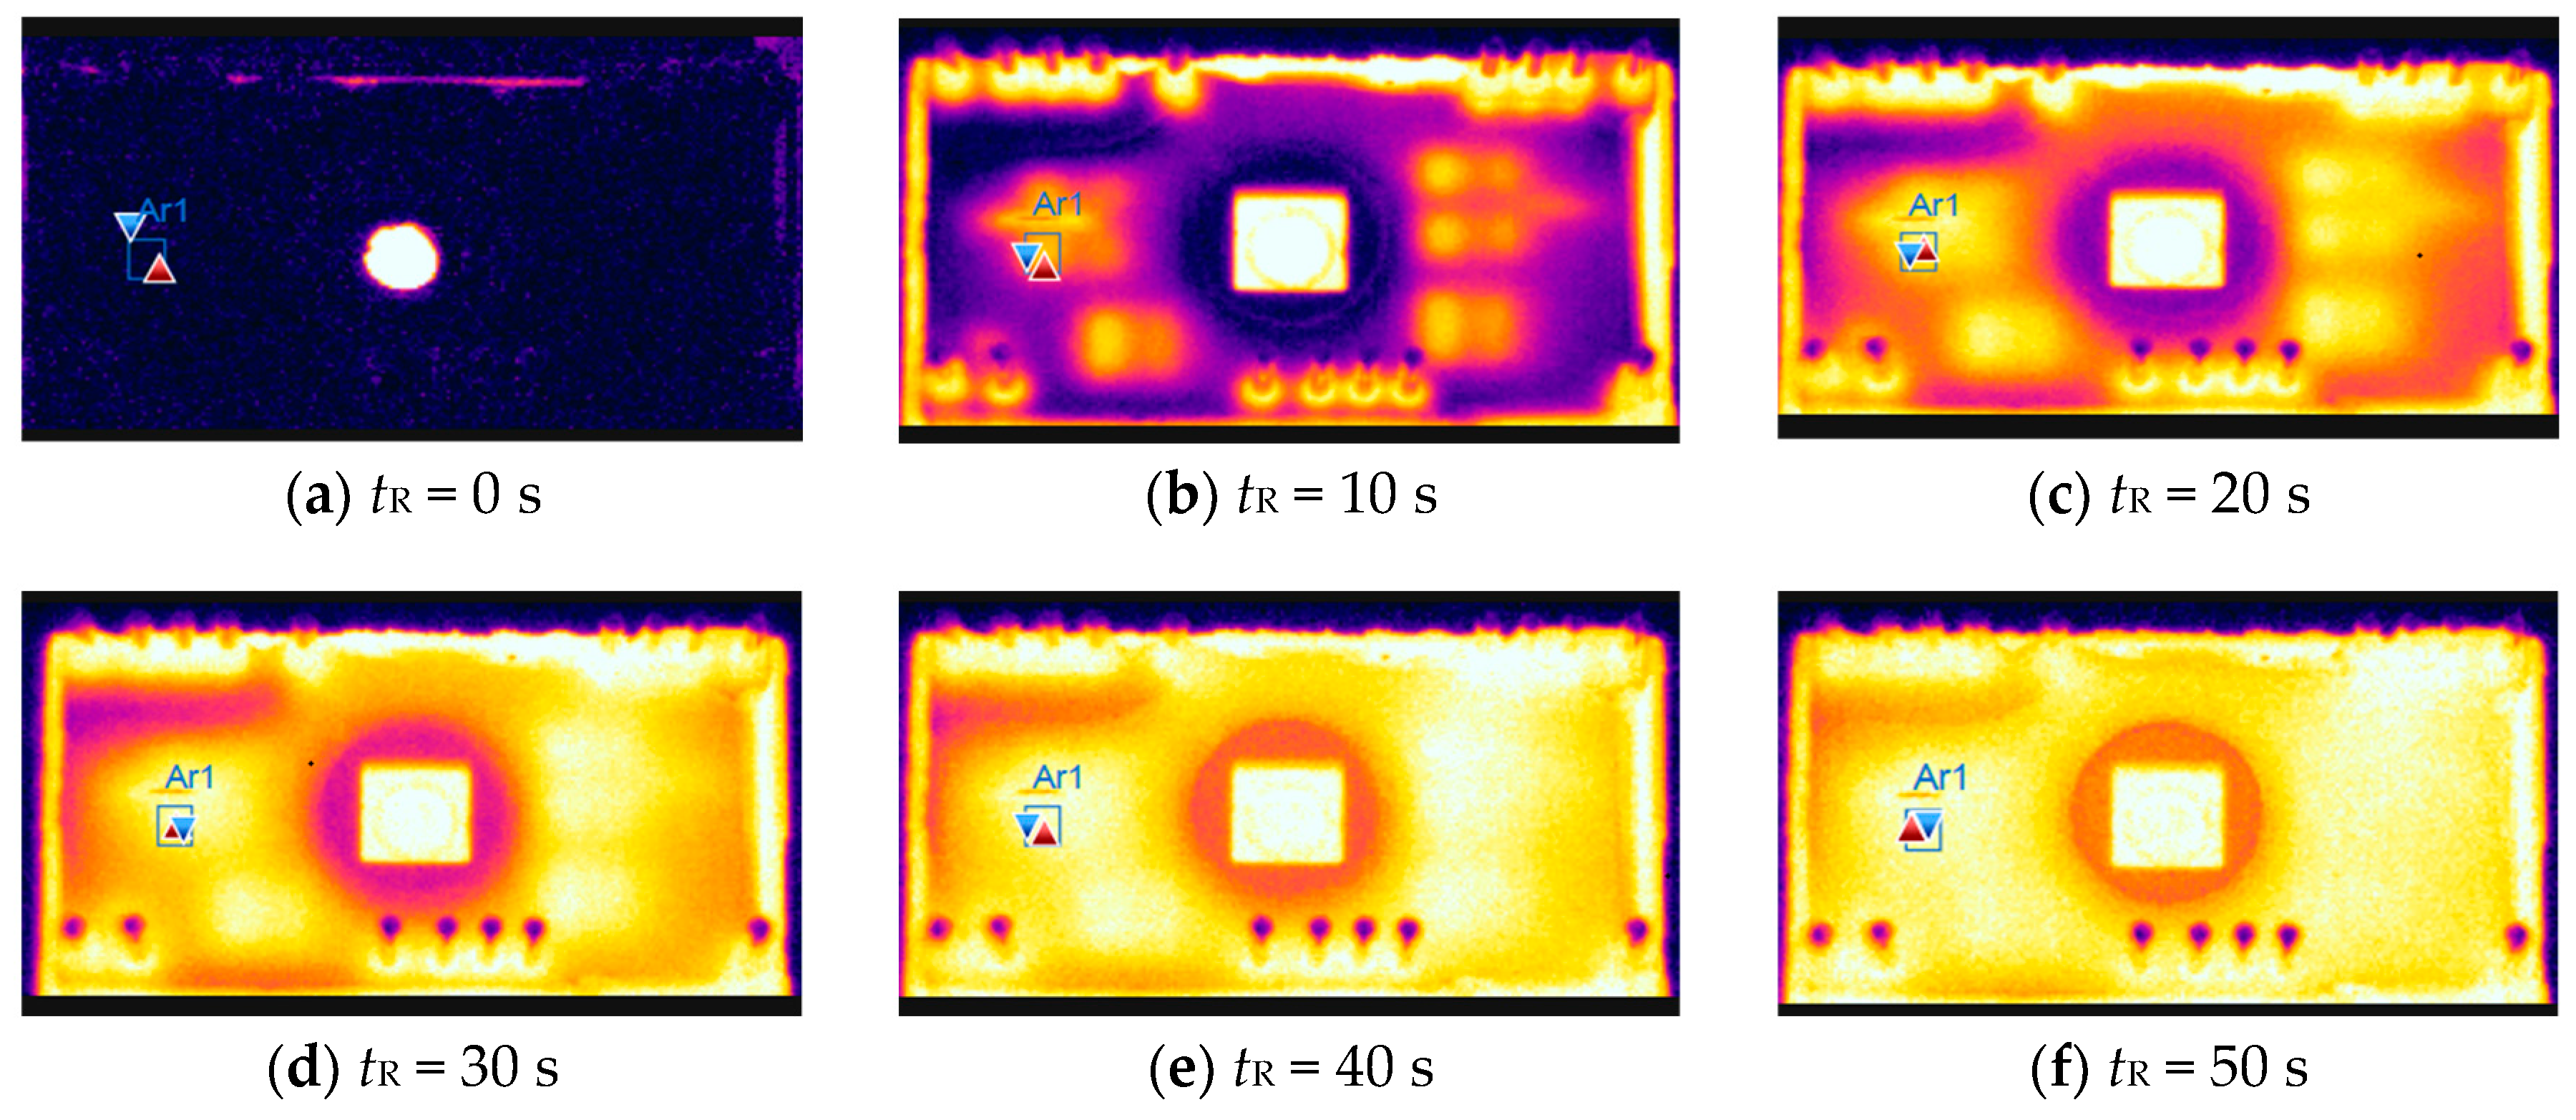
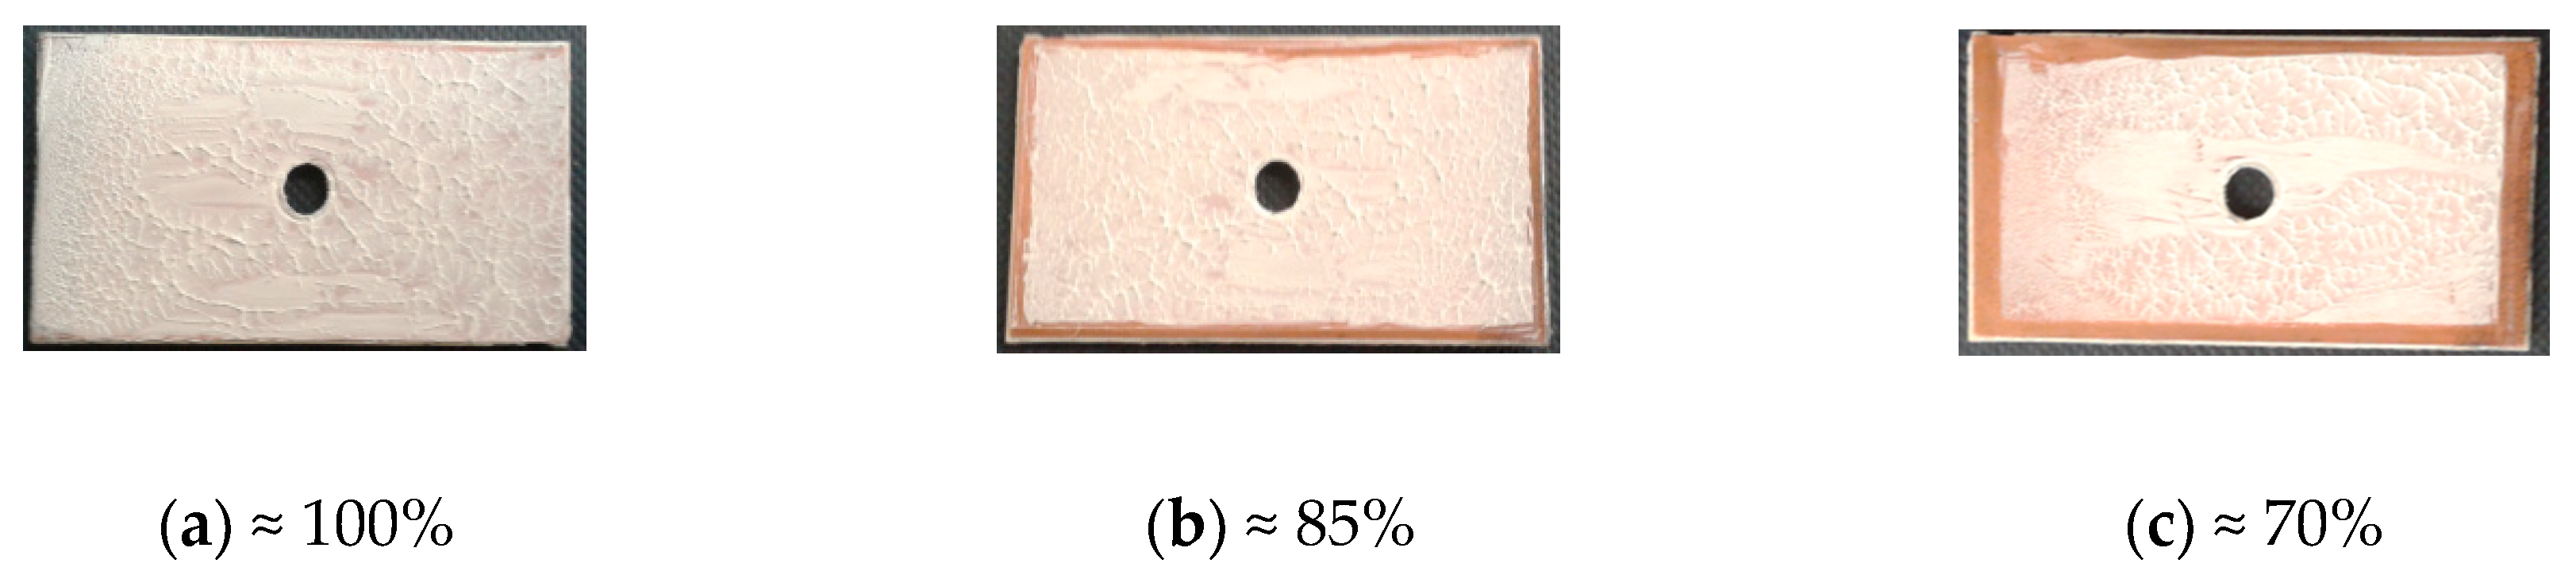
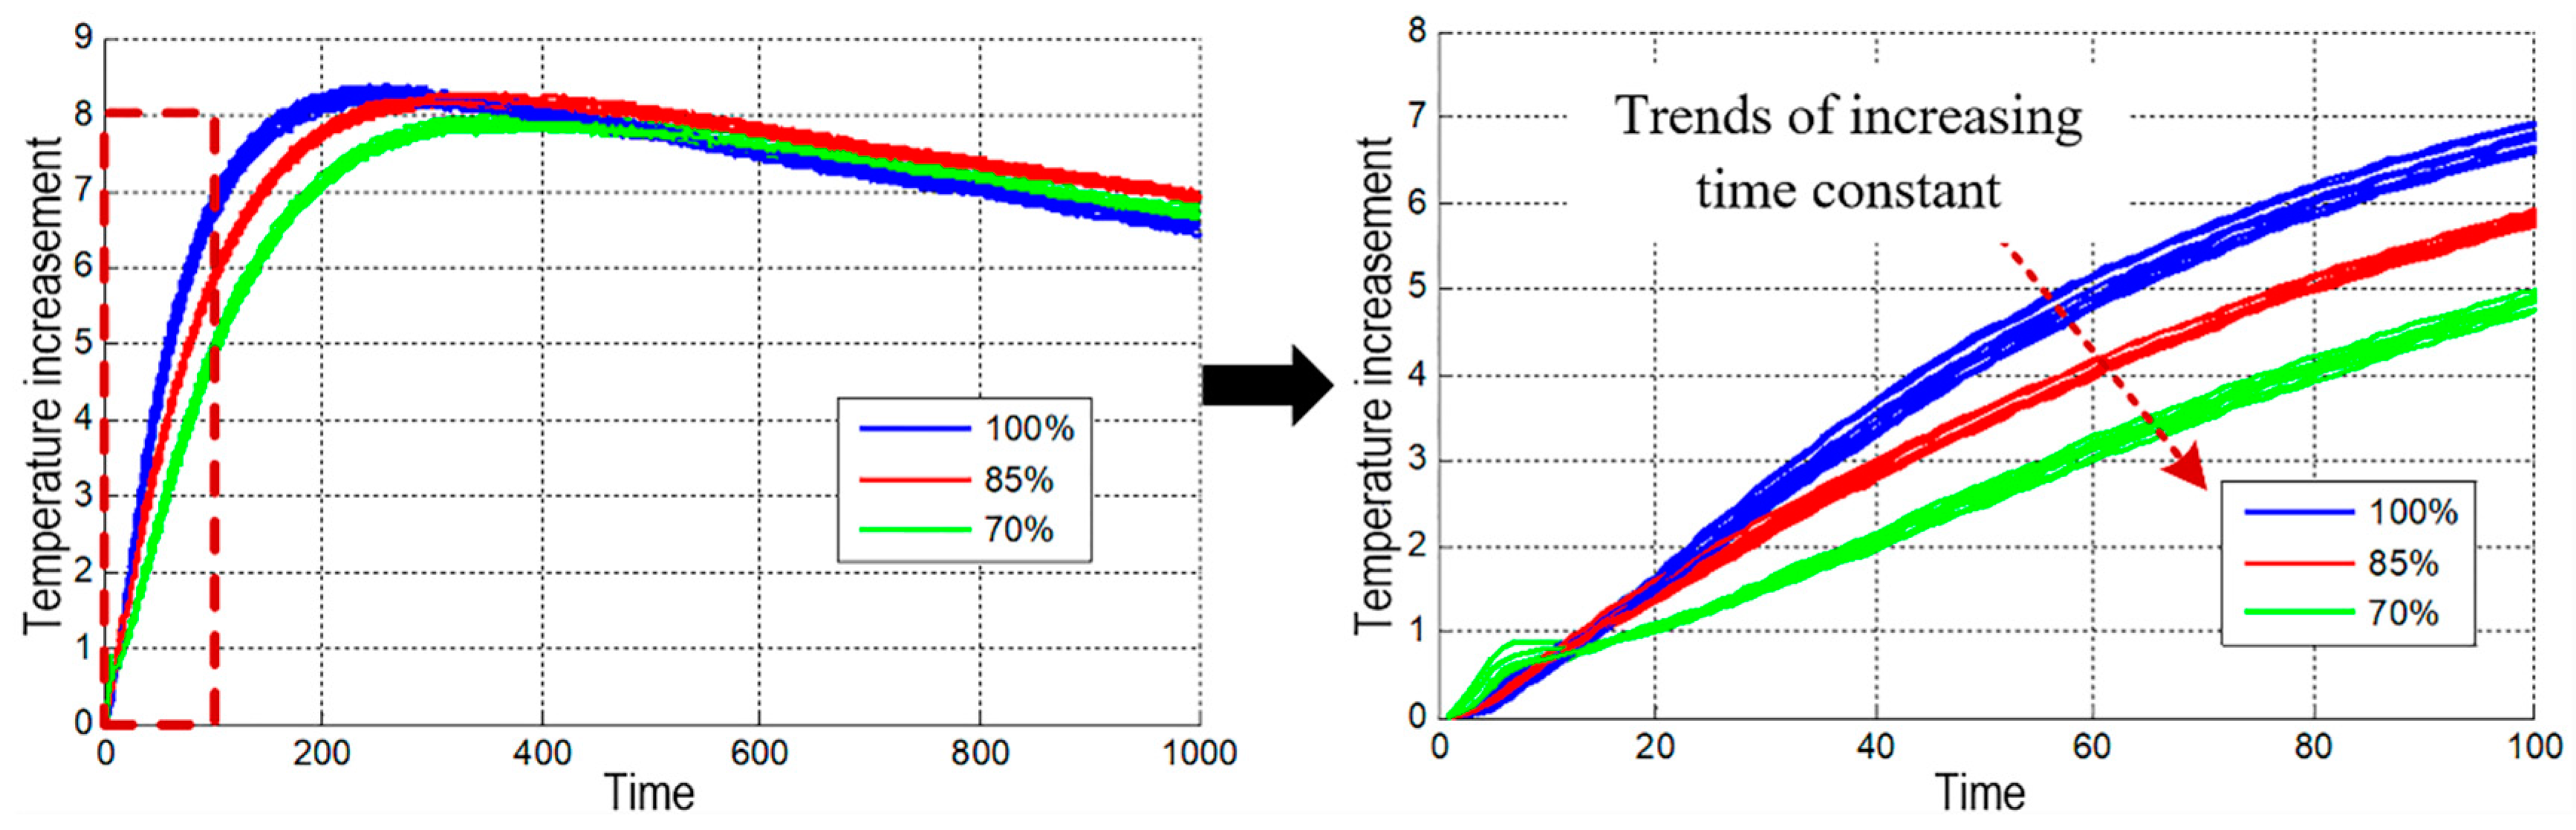
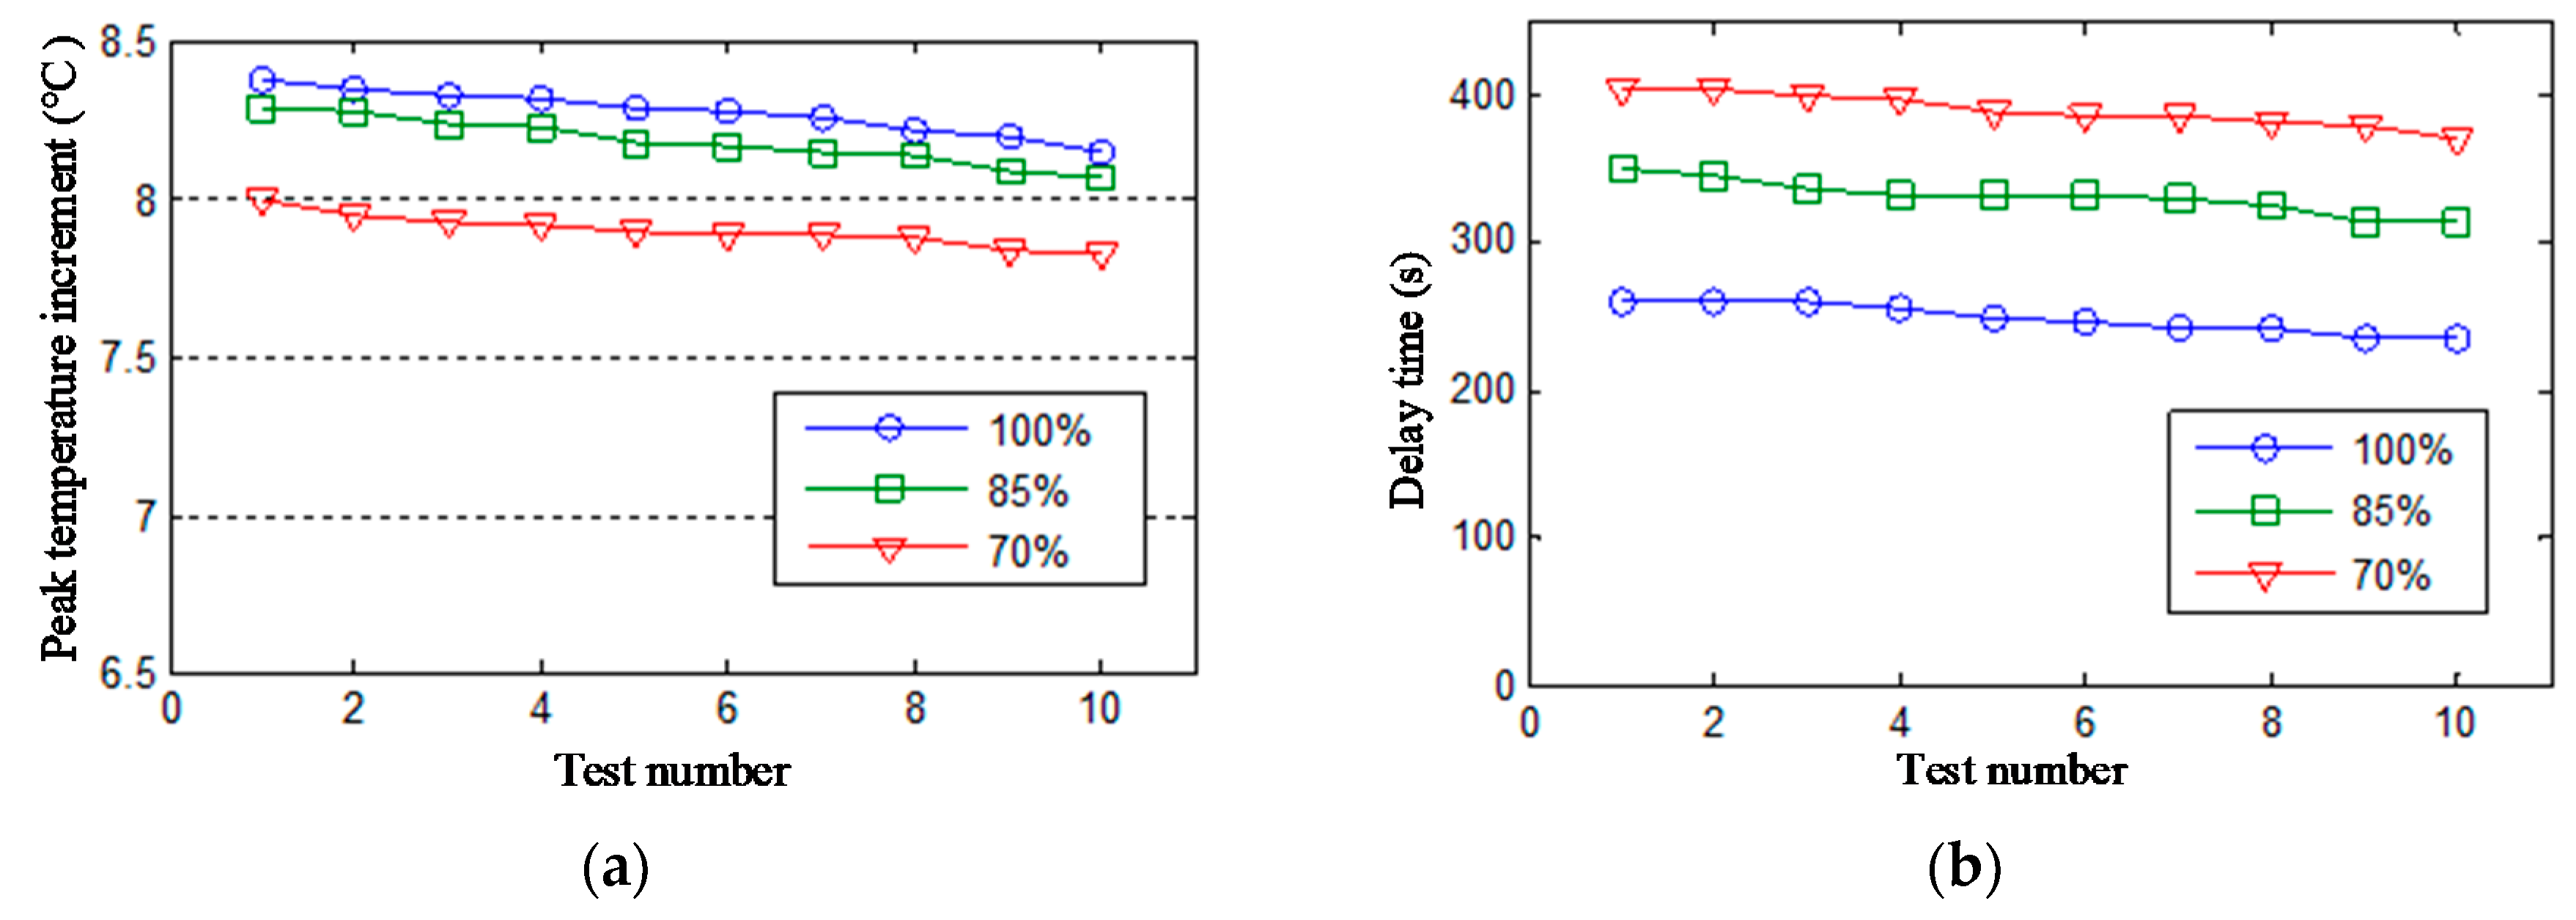
4.2. Experimental Result and Discussion

The theoretical analysis of the proposed detection method is assessed by the ECPT system shown in Figure 11.
The specifications of the proposed ECPT system are shown in Table 2. The induction heating source is Easyheat 224 from Cheltenham Induction Heating, Ltd., Cheltenham, UK, which provides a maximum excitation power of 2.4 kW with an excitation frequency range of 140–400 kHz. The AC excitation frequency chosen in the experiment is 145 kHz. A FLIR SC655 IR camera is used for recording thermal videos with a maximum IR resolution of 640 × 480 on a 7.5–14.0 μm InSb detector and transmits them to PC. Then, the temperature information can be easily extracted through the FLIR ResearchIR software provided by FLIR Systems, Inc. (Wilsonville, OR, USA).
The thermal propagation within the IGBT module, with the 50 s of recording time tR, is plotted in Figure 12. After short term heat excitation (200 ms), the heat begins to transfer from the bottom to the surface of the die. Then, the surface temperature stabilizes. Once the average temperature of the observed surface reaches its maximum temperature, the inspected average Tj starts to decline exponentially.
In order to simulate thermal resistance degradation between die and heat-sink, the thermal grease area between the heat sink and IGBT bottom is spread as in Figure 13. The thermal grease area is reduced from 100% to 70% as the effective connection area shrinks from the edge toward the center (drying starts from the edges). The volume of thermal grease is about 0.12 cm3, and the whole bottom area is about 15.0 cm2. Therefore, the thickness of thermal grease is approximately 80 µm when the grease is evenly wiped on the bottom for a 100% connection.
Because of lift-off impact and an unfixed location under the coil, the test results under the same conditions are similar, but not identical [27]. Therefore, each test result is repeated 10 times. The resulting thermal transient response curves with three connection areas in 100 s recording time are demonstrated in Figure 14. It is demonstrated that the measured Tj rises more slowly than the simulations shown in Figure 10. The difference is likely to come from the thickness and ruggedness of the practical thermal grease, which could increase the thermal resistance and make heat conduction worse.
The peak temperature of the inspected area declines slightly with decreasing connection area. The delay time to the peak temperature also extends with area reduction. In Figure 14, the trends of an increasing time constant are plotted in 4 s sampling (100 frames).
The maximum temperature increment ΔTj and the corresponding delay time to the peak temperature Tjp with different connection area are plotted in Figure 15. According to the previous analysis, there is a corresponding relationship between the effective connection area and the joint degradation degree. Thus, it is studied that Figure 15a,b illustrates the relationships between ΔTj and the degradation degree and between Tjp and the degradation degree, respectively.
Since different connection areas distort the thermal conduction path differently, the peak temperature increment and delay time corresponding to different connection areas in Figure 15 show obvious differences. This means the peak temperature increment and the delay time can be extracted as two indicators for thermal degradation detection. However, due to good linearity and sensitivity, the peak temperature delay time is a better indicator. Of course, a calibration test between the temperature measurement and the sample module with given aging degrees is required. Then, the multidimensional database for the studied IGBT module can be built for the following aging evaluation.

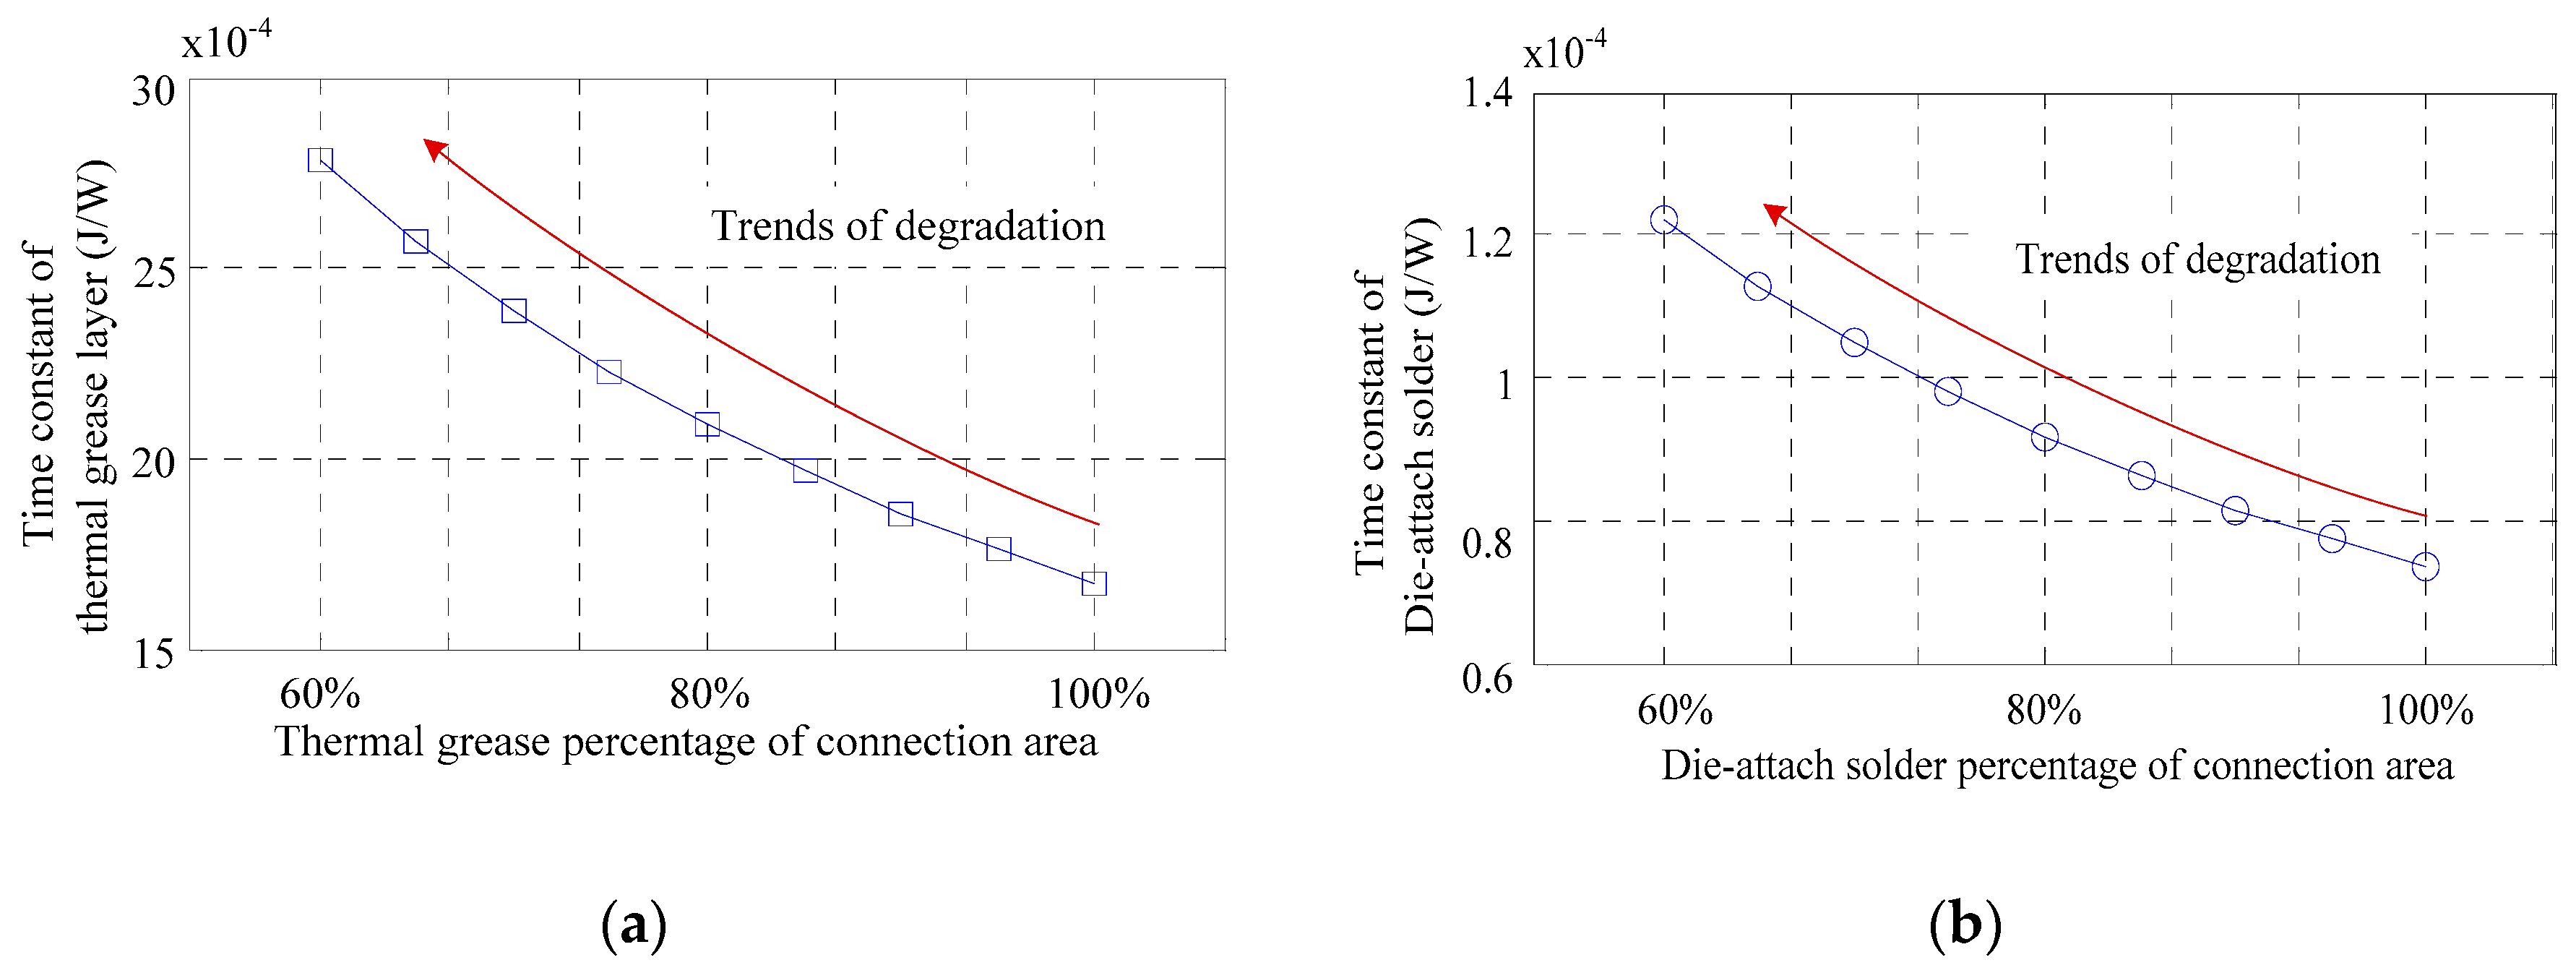
4.3. Comparison and Analysis

The detailed comparison between the degradation of sensitive electrical parameters based method and the ECPT method is presented in Table 3. The proposed ECTP method offers a non-contact heating approach, by using an induction heater. Compared with conventional heating methods, heat energy could not be accurately controlled like with a direct current (DC) power supply. In terms of a TSEP detection method, the measured die temperature is an average of the whole inspected power device. However, overall temperature mapping can be captured by an IR camera, but the sample rate is lower than for the TSEP method. Therefore, the thermal propagation time of the inspected module should be determined appropriately.
During field operation, the prognostic procedure should be as simple as possible to avoid dismantling of the converter system. As a result, being a non-contact heating and temperature measurement approach, the proposed ECPT system is an efficient degradation detection method for power converter systems.

5. Conclusions

In this paper, an eddy current pulsed thermography system has been used for IGBT degradation detection. ECPT offers a non-contact heating approach by exciting the eddy current within the metals of the inspected IGBT module. An IR camera is used for overall temperature measurement.
The degradation defect induced by accumulative thermal-mechanical stresses was discussed. The most common degradation characteristic is decreased effective connection area between two layers. As a result, the thermal emission path of IGBT based power converter deteriorates with joint degradation. The thermal time constant of the power converter increases with effective connection area reduction. This joint degradation can be reflected by the changes in the transient thermal response curves.
A 3-D IGBT module was established in the ANSYS simulation environment. Accumulative degradation is fulfilled by decreasing the effective connection area of the thermal grease from 100% to 70%.
Maximum temperature increment and delay rise time can be extracted as two effective indicators for degradation detection. The peak temperature increment of the inspected chip declines with decreasing connection area. However, the delay time to peak temperature is prolonged with decreasing connection area. The results can be used for IGBT module defect detection, and further quantitative experiments and analysis are to be carried out.

Author Contributions

Conceptualization, G.T. and W.L.; methodology, H.L.; software, X.L. and H.L.; validation, X.L., J.Z. and H.L.; formal analysis, J.Z.; investigation, Y.C.; resources, G.T.; data curation, Y.C.; writing—original draft preparation, X.L.; writing—review and editing, G.T., W.L. and H.L.; visualization, H.L.; supervision, G.T.; project administration, G.T.; funding acquisition, G.T. All authors have read and agreed to the published version of the manuscript.

Funding

This work was supported in part by European Commission project HEMOW and in part by the Natural Science Foundation of China under Grant 61960206010. This work was also supported by the Fundamental Research Funds for the Central Universities.

Conflicts of Interest

The authors declare no conflict of interest.

References

  1. Agustin, C.A.; Yu, J.; Lin, C.; Fu, X. A Modulated Model Predictive Current Controller for Interior Permanent-Magnet Synchronous Motors. Energies 2019, 12, 2885. [Google Scholar] [CrossRef] [Green Version]
  2. Ryndzionek, R.; Sienkiewicz, Ł. Evolution of the HVDC Link Connecting Offshore Wind Farms to Onshore Power Systems. Energies 2020, 13, 1914. [Google Scholar] [CrossRef] [Green Version]
  3. Schulze, H.-J.; Niedernostheide, F.-J.; Pfirsch, F.; Baburske, R. Limiting Factors of the Safe Operating Area for Power Devices. IEEE Trans. Electron Devices 2013, 60, 551–562. [Google Scholar] [CrossRef]
  4. Ji, B.; Song, X.; Cao, W.; Pickert, V.; Hu, Y.; Mackersie, J.W.; Pierce, G. In Situ Diagnostics and Prognostics of Solder Fatigue in IGBT Modules for Electric Vehicle Drives. IEEE Trans. Power Electron. 2015, 30, 1535–1543. [Google Scholar]
  5. Ji, B.; Pickert, V.; Cao, W.; Zahawi, B. In Situ Diagnostics and Prognostics of Wire Bonding Faults in IGBT Modules for Electric Vehicle Drives. IEEE Trans. Power Electron. 2013, 28, 5568–5577. [Google Scholar] [CrossRef] [Green Version]
  6. Ciappa, M. Selected failure mechanisms of modern power modules. Microelectron. Reliab. 2002, 42, 653–667. [Google Scholar] [CrossRef]
  7. Bahman, A.S.; Iannuzzo, F.; Uhrenfeldt, C.; Blaabjerg, F.; Munk-Nielsen, S. Modeling of Short-Circuit-Related Thermal Stress in Aged IGBT Modules. IEEE Trans. Ind. Appl. 2017, 53, 4788–4795. [Google Scholar] [CrossRef] [Green Version]
  8. Oh, H.; Han, B.; McCluskey, P.; Han, C.; Youn, B.D. Physics-of-Failure, Condition Monitoring, and Prognostics of Insulated Gate Bipolar Transistor Modules: A Review. IEEE Trans. Power Electron. 2015, 30, 2413–2426. [Google Scholar] [CrossRef]
  9. Katsis, D.C.; van Wyk, J.D. Void-induced thermal impedance in power semiconductor modules: Some transient temperature effects. IEEE Trans. Ind. Appl. 2003, 39, 1239–1246. [Google Scholar] [CrossRef]
  10. Ma, K.; Bahman, A.S.; Beczkowski, S.; Blaabjerg, F. Complete Loss and Thermal Model of Power Semiconductors Including Device Rating Information. IEEE Trans. Power Electron. 2015, 30, 2556–2569. [Google Scholar] [CrossRef]
  11. Smet, V.; Forest, F.; Huselstein, J.; RASHED, A.; Richardeau, F. Evaluation of Vce Monitoring as a Real-Time Method to Estimate Aging of Bond Wire-IGBT Modules Stressed by Power Cycling. IEEE Trans. Ind. Electron. 2013, 60, 2760–2770. [Google Scholar] [CrossRef]
  12. Zhang, J.; Du, X.; Yu, Y.; Zheng, S.; Sun, P.; Tai, H. Thermal Parameter Monitoring of IGBT Module Using Junction Temperature Cooling Curves. IEEE Trans. Ind. Electron. 2019, 66, 8148–8160. [Google Scholar] [CrossRef]
  13. Kong, Q.; Du, M.; Ouyang, Z.; Wei, K.; Hurley, W.G. A Method to Monitor IGBT Module Bond Wire Failure Using On-State Voltage Separation Strategy. Energies 2019, 12, 1791. [Google Scholar] [CrossRef] [Green Version]
  14. Xiang, D.; Ran, L.; Tavner, P.; Yang, S.; Bryant, A.; Mawby, P. Condition Monitoring Power Module Solder Fatigue Using Inverter Harmonic Identification. IEEE Trans. Power Electron. 2012, 27, 235–247. [Google Scholar] [CrossRef] [Green Version]
  15. Avenas, Y.; Dupont, L.; Khatir, Z. Temperature Measurement of Power Semiconductor Devices by Thermo-Sensitive Electrical Parameters—A Review. IEEE Trans. Power Electron. 2012, 27, 3081–3092. [Google Scholar] [CrossRef] [Green Version]
  16. Zhang, J.; Du, M.; Jing, L.; Wei, K.; Hurley, W.G. IGBT Junction Temperature Measurements: Inclusive of Dynamic Thermal Parameters. IEEE Trans. Device Mater. Relib. 2019, 19, 333–340. [Google Scholar] [CrossRef]
  17. Dupont, L.; Avenas, Y.; Jeannin, P. Comparison of Junction Temperature Evaluations in a Power IGBT Module Using an IR Camera and Three Thermosensitive Electrical Parameters. IEEE Trans. Ind. Appl. 2013, 49, 1599–1608. [Google Scholar] [CrossRef] [Green Version]
  18. Hu, Z.; Du, M.; Wei, K.; Hurley, W.G. An Adaptive Thermal Equivalent Circuit Model for Estimating the Junction Temperature of IGBTs. IEEE Trans. Emerg. Sel. Top. Power Electron. 2019, 7, 392–403. [Google Scholar] [CrossRef]
  19. Li, K.; Tian, G.Y.; Cheng, L.; Yin, A.; Cao, W.; Crichton, S. State Detection of Bond Wires in IGBT Modules Using Eddy Current Pulsed Thermography. IEEE Trans. Power Electron. 2014, 29, 5000–5009. [Google Scholar] [CrossRef]
  20. Cheng, L.; Tian, G.Y. Transient Thermal Behavior of Eddy-Current Pulsed Thermography for Nondestructive Evaluation of Composites. IEEE Trans. Instrum. Meas. 2013, 62, 1215–1222. [Google Scholar] [CrossRef]
  21. Bui, H.K.; Wasselynck, G.; Trichet, D.; Ramdane, B.; Berthiau, G.; Fouladgar, J. 3-D Modeling of Thermo Inductive Non Destructive Testing Method Applied to Multilayer Composite. IEEE Trans. Magn. 2013, 49, 1949–1952. [Google Scholar] [CrossRef]
  22. Nnebe, I.M.; Feger, C. Drainage-Induced Dry-Out of Thermal Greases. IEEE Trans. Adv. Packag. 2008, 31, 512–518. [Google Scholar] [CrossRef]
  23. Shammas, N.Y.A.; Rodriguez, M.P.; Plumpton, A.T.; Newcombe, D. Finite element modelling of thermal fatigue effects in IGBT modules. IEE Proc. Circ. Devices Syst. 2001, 148, 95–100. [Google Scholar] [CrossRef]
  24. Batard, C.; Ginot, N.; Antonios, J. Lumped Dynamic Electrothermal Model of IGBT Module of Inverters. IEEE Trans. Compon. Pack. Manuf. Technol. 2015, 5, 355–364. [Google Scholar] [CrossRef]
  25. Wintrich, A.; Nicolai, U.; Tursky, W.; Reimann, T. Application Manual Power Semiconductors, 2nd ed.; SEMIKRON International GmbH: Ilmenau, Germany, 2015. [Google Scholar]
  26. Bohm, J.; Wolter, K.J. Inductive excited lock-in thermography for electronic packages and modules. In Proceedings of the 33rd International Spring Seminar Electronics Technology (ISSE), Warsaw, Poland, 12–16 May 2010; pp. 190–195. [Google Scholar]
  27. Yin, A.; Gao, B.; Yun Tian, G.; Woo, W.L.; Li, K. Physical interpretation and separation of eddy current pulsed thermography. J. Appl. Phys. 2013, 113, 64101. [Google Scholar] [CrossRef]
  28. Alamin, M.; Tian, G.Y.; Andrews, A.; Jackson, P. Principal Component Analysis of Pulsed Eddy Current Response from Corrosion in Mild Steel. IEEE Sens. J. 2012, 12, 2548–2553. [Google Scholar] [CrossRef]
  29. May, D.; Wunderle, B.; Schacht, R.; Michel, B. Transient thermal response as failure analytical tool—A comparison of different techniques. In Proceedings of the 14th International Thermal, Mechanical and Multi-Physics Simulation and Experiments in Microelectronics and Microsystems (EuroSimE), Wroclaw, Poland, 14–17 April 2013; pp. 1–5. [Google Scholar]
  30. Riccio, M.; Irace, A.; Breglio, G. Lock-in thermography for the localization of prebreakdown leakage current on power diodes. In Proceedings of the Ph.D. Research in Microelectronics and Electronics (PRIME), Cork, Ireland, 12–17 July 2009; pp. 208–211. [Google Scholar]
  31. Gershman, I.; Bernstein, J.B. Nondestructive Quantitative Analysis of Crack Propagation in Solder Joints. IEEE Trans. Compon. Pack. Manuf. Technol. 2013, 3, 1263–1270. [Google Scholar] [CrossRef]
Figure 1. Cross-sectional view of base-plate free insulated gate bipolar transistor (IGBT) module with a heat-sink: (a) Aluminum metallization, (b) Chip, (c) Bond wire, (d) Copper pad, (e) Solder, (f) Ceramic subtracts, (g) Thermal grease, and (h) Heat-sink.
Energies 13 02613 g001
Figure 2. Joint characteristic degradation in multi-layer structure: (a) defect free connection; (b) rough surfaces with gradation defect.
Energies 13 02613 g002
Figure 3. Image of the IGBT module under study.
Energies 13 02613 g003
Figure 4. Equivalent non-constant thermal resistor-capacitor (RC) network considering the degradation effect.
Energies 13 02613 g004
Figure 5. Thermal time constant under different connection area: (a) reduction of thermal grease area and (b) reduction of die-attach connection area.
Energies 13 02613 g005
Figure 6. Eddy current pulsed thermography (ECPT) system diagram for thermal detection within of IGBT modules.
Energies 13 02613 g006
Figure 7. 3D simulation module of inspected IGBT with heat-sink.
Energies 13 02613 g007
Figure 8. (a) Three varying degrees of thermal grease layer with different connection area and (b) the temperature distribution at 1 s with 100% connection area.
Energies 13 02613 g008
Figure 9. Temperature map of cross-sectional IGBT module based on simulation: (a) 100% connection and (b) 70% connection area.
Energies 13 02613 g009
Figure 10. Comparison of Tj response curves with varying thermal grease area.
Energies 13 02613 g010
Figure 11. Configuration of the experimental ECPT system.
Energies 13 02613 g011
Figure 12. Thermal propagation of the inspected IGBT module with an IR camera.
Energies 13 02613 g012
Figure 13. Configuration of thermal grease with different area.
Energies 13 02613 g013
Figure 14. Comparison of thermal transient response curves with varying thermal grease area in the same test area.
Energies 13 02613 g014
Figure 15. 10 times test results vary with three connection areas: (a) peak temperature increment; (b) delay time to peak temperature.
Energies 13 02613 g015
Table 1. Layer thickness and material properties of IGBT in simulation.
Designation and MaterialThickness (µm)Density (kg/m3)Thermal Conductivity (W/m·K)Specific Heat Capacity (J/kg·K)
Silicon chip3002330148712
Die attach solder50740057226
Up copper layer3008960390390
Ceramic-Al2O3700378024830
Down copper layer3008960390390
Thermal grease5020000.67300
Table 2. ECPT system specifications.
ParametersValueParametersValue
Inspected IGBT moduleSK75GB12T4TRecording duration60 s
Induction heating source2.4 kWInfrared (IR) cameraFLIR SC655
Heating duration200 msFrame rate of IR camera25
Excitation current frequency140–400 kHzAmbient temperature22 °C
Table 3. Comparison between electrical parameters based method and ECPT method.
ParametersElectrical Parameters Based MethodProposed ECPT Method
Heat incentiveThe heat energy is supplied by power source, and it is an active heat method.The heat energy is induced by the eddy current in the metal. It is a positive heat method.
Temperature measurementThe chip and module temperature are measured by some temperature sensitive electrical parameters (TSEP) or thermal couples.The chip and module temperature can be captured by an infrared camera at one time.
CalibrationIt is necessary to calibrate the relationships between electrical parameters and temperature.Automatic calibration in IR camera system.
OperationThe heat excitation and temperature measurement process should be in contact with inspected objects.The heat excitation and temperature measurement process are carried out by a non-contact method.

