Abstract
Floating offshore wind turbines (FOWTs) experience fluctuations in their platforms, owing to the various wave and wind conditions. These fluctuations not only decrease the output of the wind power generation system, but also increase the fatigue load of the structure and various equipment mounted on it. Therefore, when designing FOWTs, efficient performance with respect to waves and other external conditions must be ensured. In this study, a model test was performed with a 10 MW floating offshore wind turbine. The model test was performed by scaling down a 10 MW FOWT model that was designed with reference to a 5 MW wind turbine and a semisubmersible platform by the National Renewable Energy Laboratory and the DeepCwind project. A scale ratio of 1:90 was used for the model test. The depth of the East Sea was considered as 144 m and, to match the water depth with the geometric similarity of mooring lines, mooring tables were installed. The load cases used in the model test are combined environmental conditions, which are combined uniform wind, regular waves and uniform current. Especially, Model tests with regular waves are especially necessary, because irregular waves are superpositions of regular waves with various periods. Therefore, this study aimed to understand the characteristics of the FOWTs caused by regular waves of various periods. Furthermore, in this model test, the effect of current was investigated using the current data of the East Sea. The results obtained through the model tests were the response amplitude operator (RAO) and the effective RAO for a six degrees-of-freedom motion. The results obtained from the model tests were compared with those obtained using the numerical simulation. The purpose of this paper is to predict the response of the entire system observed in model tests through simulation.
1. Introduction
In recent decades, rising oil prices, climate change, air pollution, and water shortages have resulted in increased energy concerns. Consequently, countries worldwide are focusing on harnessing energy using natural resources, such as wind, water, and solar heat, which do not harm the environment. Wind power has been used for developing pioneering renewable technologies for decades. With the development of wind power technology, research on large-scale wind turbines and offshore wind turbines is becoming more active. A representative example is the installation of a 12-MW Haliade-X offshore wind turbine prototype at the port of Rotterdam, the Netherlands this year by GE Renewable Energy. It is the largest and most powerful offshore wind turbine in the world, with a 220-m rotor and a 107-m blade. In addition, many studies are underway to reduce the mass of the tophead as the wind turbine becomes larger, such as by the use of superconducting generators [1,2], the use of CFRP blades [3], and optimization of the rotor design [4,5].
Similarly, Korea is actively studying large-scale and offshore wind turbines. The wind turbine industry is continuously improving turbine designs to reduce the overall cost of wind energy. One approach for reducing costs is to increase the power generated by each wind turbine by upscaling. Larger wind turbines can accommodate larger blades and can operate at higher wind speeds at higher altitudes. Therefore, studies on the upscaling of wind turbines are currently in progress. Meanwhile, the University of Ulsan (UOU) designed a 10 MW floating offshore wind turbine (FOWT) and performed a model test. In Korea, wind farms will install in the East Sea, where wind resources are abundant. Therefore, a good understanding of the characteristics of large wind turbines through model tests is important in the design of wind farms.
The National Renewable Energy Laboratory (NREL) developed a 5 MW reference wind turbine [6]. The model has been and will likely continue to be used as a reference by research teams worldwide to standardize baseline offshore wind turbine specifications, and to quantify the benefits of advanced land- and sea-based wind energy technologies. Many researchers have investigated FOWTs, and two representative concepts exist in deep-sea environments. The floating concept used for OC3 was the OC3-Hywind system [7,8], which is a spar concept, whereas for OC4, the OC4 DeepCwind project was used [9], which is a semisubmersible concept. The purpose of this paper is similar, and the most recent work is OC6 project. The Offshore Code Comparison Collaboration, Continued, with Correlation, and unCertainty (OC6) project is focused on validating offshore wind modeling tools through the comparison of simulated responses of select offshore wind systems to physical test data. A large wind turbine generating 10 MW or more has been investigated and a scaling method proposed [10,11,12,13]. Hence, the wind turbine can be made larger, and when designing a platform for a large FOWT, excellent performances must be ensured even in waves. Therefore, a technique is necessitated to interpret the forces that the platform receives by waves and the motion of the platform generated by those forces. This is the main purpose of model tests. Müller, K [14] gathered issues from the previous tank test campaigns of scaled FOWTs, compared the different scaling methodologies, indicated critical aspects, and demonstrated alternatives and recommendations for future tests based on specific objectives. The UOU performed model tests on various types of platforms. Spar model tests were performed with a scale ratio of 1:128 [15,16,17], whereas the model tests of OC4 semisubmersible types were performed with a scale ratio of 1:80 [18]. In addition, we completed a model test of a 750 kW FOWT that was performed as a demonstration project in the East Sea to construct a wind farm. The 750 kW FOWT comprised Model I [19] and Model II [20], and both were of a 1:40 scale ratio. We experienced the slamming phenomenon during the model test of Model I, and redesigned the platform based on the result of the model test. Model tests of FOWTs in ocean engineering wide tanks are performed not only for research purposes, but also for practical commercial projects. As a result of the model test, the response of the actual wind turbine system can be analyzed and compared with numerical analysis to predict the limits of the model test.
In this study, model tests of a 10 MW FOWT were performed, with a model scale ratio of 1:90. The response amplitude operators (RAOs) of surge, heave, and pitch motions among the regular waves were calculated. In addition, the effective RAOs were calculated by adding the conditions of the rated wind speed, and the aerodynamic damping phenomenon was confirmed by comparing with the effective RAOs. In addition, a current-imitating device was used to compare the platform performance with and without current. The results of these model tests were compared and analyzed using the FAST [21], which is a numerical analysis tool for wind turbines.
This paper is organized as follows. Section 2 introduces the model test procedure, model description, experimental setup, and equipment used the model test. Section 3 introduces the FAST and UOU in-house code used the numerical simulation. Section 4 introduces the load cases of the model test such as wave, wind, rotor speed, and current. Section 5 introduces the free-decaying test and RAO results of the model test. Section 6 concludes this paper.
2. Model Test
2.1. Model Test Procedure
The model test procedure is as follows. First, the scale ratio is determined in consideration of the size of the rotor, the size of the mooring system, and the experiment space. The second is the inspection of the produced model. In the case of the platform, the center of mass and the mass moment of inertial are checked through KG test. Since these values greatly contribute to the 6-DOF motion of the platform, it is desirable to have a minimum error rate. In the case of the blades, it is necessary to find the wind speed and rotor rotational speed that match the target thrust through the wind tunnel test. Both Froude similitude and Reynolds similitude cannot be satisfied simultaneously in the small scaled model tests of offshore structures, so a redesigned blade is used in the model test to achieve sufficient thrust. In the case of the mooring system, the initial tension of the mooring system is checked using the tension excursion curve. In addition, a mooring table may be used to set a target depth. In this case, the kinematic characteristics of the regular wave at infinite depth and finite depth should be considered. When the same regular wave of a specific wavelength is generated in an infinite depth and finite depth, it is necessary to check how much of a difference there is in the hydrodynamic force. The third is the inspection of equipment for model test. The wave probe to measure the waves, the motion-capture cameras to measure the motion of the model, and tension-meter to measure the tension of the mooring system should be checked and calibrated. We need to calibrate the equipment to reduce the uncertainty of the data and increase reliability. After all models and equipment is inspected, the model is installed. The model is connected to the pre-installed mooring system, and the initial position and draft of the model is checked. After the model is installed, a model test is conducted. Free-decaying test which is a process to check the natural period of the total system, is performed, so that stiffness and damping values of the floater used in numerical simulation can also be found. Next, model tests are performed on regular or irregular waves. The real sea environment is irregular. However, the reason for experimenting with regular waves is that irregular waves can be viewed as the superposition of a number of regular waves with different frequencies and amplitudes. Therefore, experimenting with both waves is more helpful in understanding performance characteristics of total system. The values obtained through model tests are mainly waves, motions, and tensions. Finally, after the model test, numerical simulation is performed using the conditions of the model tests, and verification of the model test is performed through a comparison with the numerical simulation. The reason why the comparison between the model test and the numerical simulation result is important is that the verification and validation of the experiment are possible through this process. That is, if the uncertainty between the model test and the numerical analysis is minimized, the characteristics of the actual floating offshore wind turbine can be predicted by numerical simulation. Figure 1 shows the model test procedure described above.
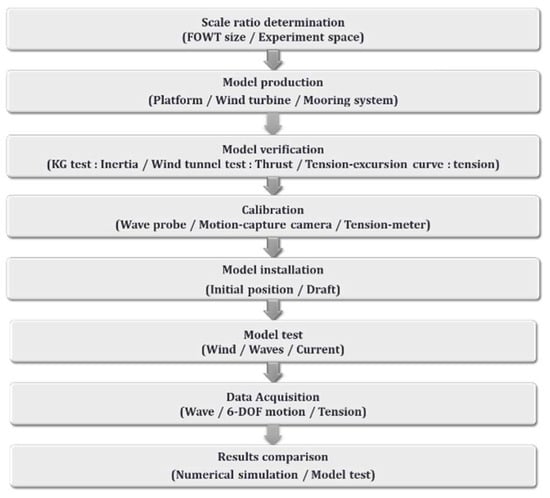
Figure 1.
Model test procedure of the University of Ulsan (UOU) 10 MW floating offshore wind turbine (FOWT).
2.2. Model Test Procedure.
Korean government plans to install a 200 MW floating offshore wind farm in East Sea, Korea by 2025. Since a large wind turbine was required for the installation of an offshore wind farm, a new 10 MW floating offshore wind turbine was designed considering the marine environment conditions in the East Sea, Korea. NREL 5 MW wind turbine and OC4-DeepCwind semisubmersible type were expanded to 10 MW floating offshore wind turbine by reflecting the characteristics of each component of the total system.
The scale ratio of the rotor was calculated by the power ratio and was used to determine the rotor diameter. In blade design, the numerical simulation was performed to get the CP-TSR curve, and it was used to find maximum power coefficient. The scale ratio of the tower was calculated by the deflection ratio of the tower and used to determine the diameter and thickness of the tower. In tower design, the tower clearance, which means the distance between the blade tip and the tower, confirmed that it has sufficient distance under extreme environmental conditions. Also, the resonance avoidance design was performed through the tower Campbell diagram. The tower was 18.7 m above sea level, which was determined considering the extreme peaking of the 50-year cycle in the East Sea, and the air gap and margin were specified by IEC61400-3 [22]. Therefore, the rotor diameter of the 10 MW FOWT was 178.2 m, and the height from the sea level to the hub was 120.0 m. The mass of the nacelle and hub is an estimate based on the latest trends in wind turbine, and the blade is assumed to used carbon fiber-reinforced plastic for mass reduction. Finally, this wind turbine generated 10-MW of rated power at a nominal wind speed of 11.2 m/s. The gross properties of the 10 MW wind turbine are shown in Table 1.

Table 1.
UOU 10 MW Wind Turbine Specifications.
The platform of the 10 MW FOWT was expanded from the OC4-DeepCwind semisubmersible. The tower was connected to one main column, and three side columns were connected. The scale ratio of the platform was calculated by the weight ratio of the wind turbine, which was then used to determine the diameter and height of each column. In platform design, the GZ curve of the platform was used to confirm the stability. The water depth of the East Sea was approximately 144 m. The gross properties of the 10 MW platform are listed in Table 2.

Table 2.
UOU 10-MW Platform Specifications.
NREL FAST simulation was used to analyze the static and dynamic responses, and confirmed the performance of 10 MW floating offshore wind turbine.
Figure 2 shows the full-scale layout of the 10 MW FOWT.
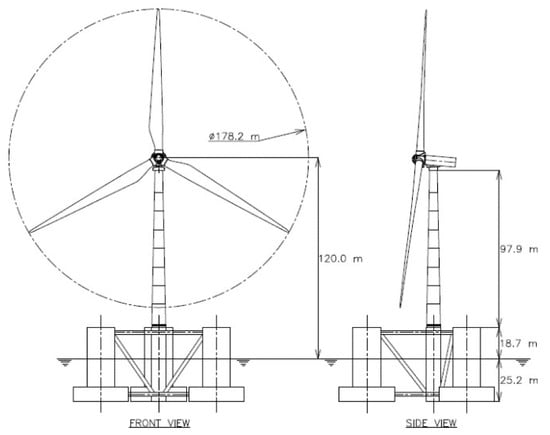
Figure 2.
Full-scale layout of the UOU 10 MW FOWT.
2.3. Experimental Setup
The model of the 10 MW FOWT system was designed using Froude’s law of similarity. The geometric model scale ratio was 1:90. The model tests could not satisfy both the Froude and Reynolds numbers. Therefore, a model was designed based on Froude’s scaling parameter and a model test was performed. Table 3 compares the parameters of the actual and target models [23].

Table 3.
Difference between the actual and target model.
The blades used in the model test were redesigned to achieve sufficient thrust. The actual blade and the blade in the model test have different aerodynamic characteristics, because the properties and foil used were different. Therefore, we used to find the actual rated thrust at the desire wind speed using the FAST simulation, and this thrust was reduced using Froude’s scaling. The wind speed and rotor rotational speed that could implement this thrust was obtained from the model test. The rotor rotational speed was targeted using Froude’s scaling, and the wind speed could be adjusted to satisfy the rated thrust. Table 4 compares the actual and target conditions of the model test.

Table 4.
Difference between the actual and target conditions.
The ratio of the model scale was determined considering the size and water depth of the ocean engineering wide tank at the UOU, which measured 30 m wide, 20 m long, and 2.5 m deep. The mooring was three catenaries and connected to the bottom of three side columns at 120° intervals. Two mooring lines were installed in the direction of wind and waves. The model test arrangement is presented in Figure 3. The full-scale mooring radius is 659.34 m from the platform center line to the anchor. Based on this value, the mooring radius of the model test is 7.33 m.
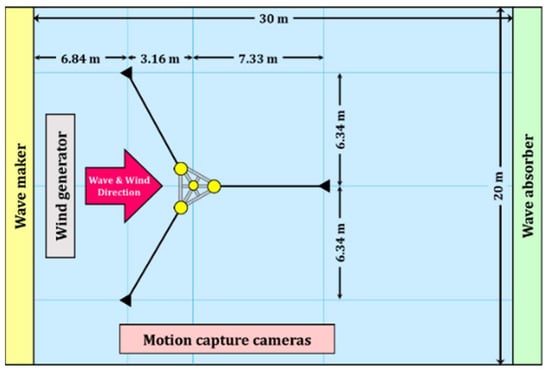
Figure 3.
Model test arrangement.
2.4. Effect of the Mooring Tables
In the East Sea, where the actual FOWT will be installed, the water depth is 144 m, which is reduced to the model scale of 1.6 m. The water depth of the ocean engineering wide tank of the UOU is 2.5 m, so the target water depth can be adjusted using the mooring tables of height 0.9 m. To match the geometric similarity of the mooring lines, the mooring tables were installed in the vicinity of the mooring lines [24]. However, this may cause hydrodynamic problems and should be verified in advance, i.e., the hydrodynamic forces may differ depending on whether the regular wave of a specific wavelength is in deep water or finite depth water. Table 5 shows the wave period and wavelength used in this model test, which can be either deep water or finite depth water. Therefore, using the FAST simulation, the surge, heave, and pitch motions were calculated at 1.6 m and 2.5 m water depths at a period from wave 7 to wave 10. We selected these waves because the hydrodynamic properties changed from deep water to finite depth water in these wave periods. Figure 4 shows the surge, heave, and pitch motions for two water depths from wave 7 to wave 10. The numerical simulation was performed with a real scale model. The water depths of 1.6 m and 2.5 m in the model test are represented 144 m and 225 m on the full scale.

Table 5.
Determining the water depths.
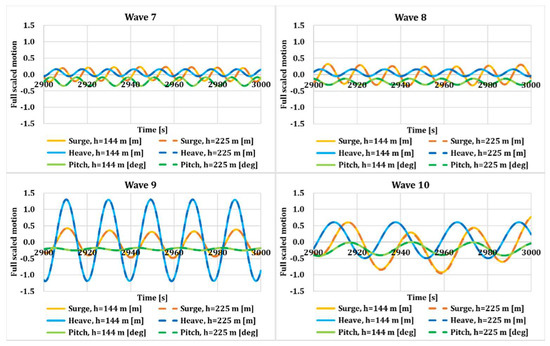
Figure 4.
Surge, heave, and pitch motions for two water depths.
The motion between the two water depths differed little. In fact, the difference in motion between the two water depths was within 1%, which confirmed the insignificant effect on mooring table installation.
2.5. Current-Imitating Device
In this model test, the results were compared with or without the effect of a current system. The ocean engineering wide tank of the UOU could not generate a current, so the hydrodynamic load generated by a current was calculated, and the current was simulated by pulling the load in the x-direction to a constant load. The difference between the tides of the East Sea was small and monotonous, resulting in no clear tidal currents. Consequently, the current of the model test was applied to the East Sea at the surface extreme current. Figure 5a shows the normal and extreme current speeds by the water depth. The surface extreme current speed of the East Sea was 1.63 m/s. First, we calculated the hydrodynamic load caused by the current using only FAST simulation. Currents were induced by steady hydrodynamic loads through the viscous-drag terms of strip theory members. Figure 5b shows the hydrodynamic load when only current was present.
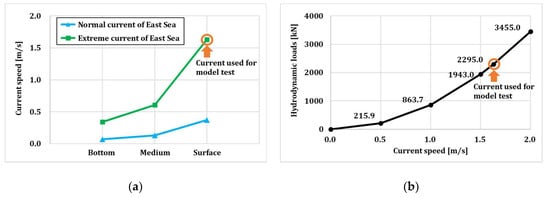
Figure 5.
Current speed by depth (a) and hydrodynamic load by current (b).
When a current of 1.63 m/s occurred, the hydrodynamic load in the x-direction was 2295 kN, which was reduced to a model scale of approximately 3.15 N. Therefore, by pulling at a weight of approximately 320 g, we can simulate the force of the desired current. Figure 6 shows the current-imitating device. The tension of the tension balancer was set at 800 g, and the weight was 480 g. The pulley was used to pull a 320 g load, which could produce the desired current.
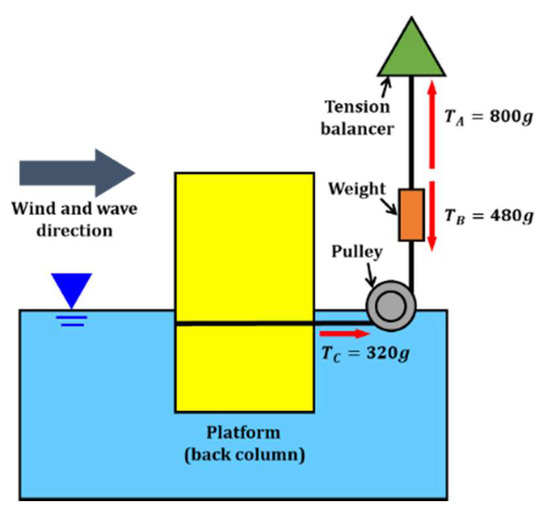
Figure 6.
Current-imitating device.
2.6. Other Equipment
The other equipment except the mooring tables and current-imitating device used in the model test are described. Wave maker (a), a wave-generating device, produces waves with 40 moving pedals. Irregular waves, such as PM Spectrum and JONSWAP Spectrum, as well as regular waves, can be implemented with various periods. The wave created can be represented by the wave height and wave period using a wave probe (b). A wind generator (c) comprising 18 fans may generate a steady wind of up to 20 m/s in a single direction. Motion-capture cameras (d) captured the motion, and we measured the six degrees-of-freedom of the platform. In addition, a load cell was placed at the top of the tower to measure the shear force, and the tension of the mooring line was connected to the load cell through a roller (e) installed in the fairlead. Figure 7 shows the equipment described. The target water depth of the model test can be adjusted using the mooring tables (f) of height 0.9 m.
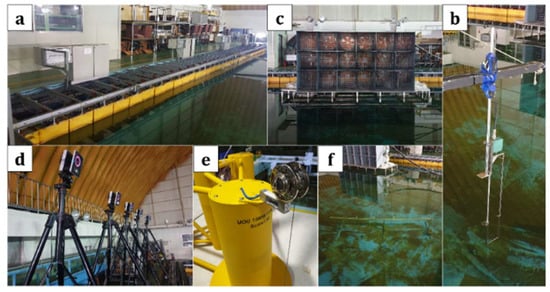
Figure 7.
Experimental equipment—(a) Wave maker, (b) Wave probe, (c) Wind generator, (d) Motion-capture cameras, (e) Load cell through a roller, (f) Mooring table.
3. Numerical Simulation
Numerical analysis was performed using the FAST code developed by NREL. FAST is NREL’s primary CAE tool for simulating the coupled dynamic response of wind turbines. FAST combines aerodynamics models, hydrodynamics models for offshore structures, control and electrical system (servo) dynamics models, and structural (elastic) dynamics models to enable coupled nonlinear aero–hydro–servo–elastic simulations in the time domain. FAST is a simulation that has been verified through comparison with model tests in OC5 and OC6 projects. Figure 8 shows the FAST and UOU in-house code structures.
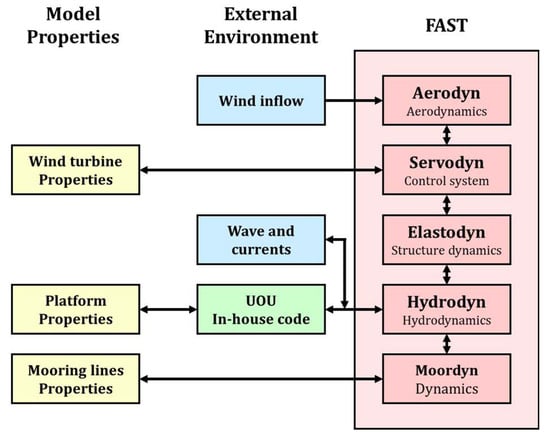
Figure 8.
Modeling for the hydrodynamic analysis.
The UOU in-house codes can yield the hydrodynamic coefficients and mooring line forces, which we use for the numerical analysis of the FOWT. The platform was modeled in three dimensions, with elements under the sea water level, as shown in Figure 9. The UOU in-house codes include a radiation and diffraction solver. Hence, it was used to calculate the added mass, radiation damping, and wave exciting forces, which we then used as input data for FAST. The radiation and diffraction solvers calculate radiation potential and diffraction potential using a 3-dimensional panel method. These potentials are obtained using the method of Green’s function, which is a boundary integral technique. The radiation solver generated hydrodynamic added mass and damping coefficients. The added mass matrix Aij (ω) in the frequency domain and the radiation damping coefficients Bij (ω) are shown in Figure 10, and the magnitude and phase of the hydrodynamic wave excitation, Fwi (ω, β) are shown in Figure 11. The wave heading angle is 0°, which means that these waves move along the positive X-direction. Therefore, loads in the directions of the surge (Mode 1), heave (Mode 3), and pitch (Mode 5) are dominant, whereas loads in the directions of the sway, roll, and yaw are zero, which are not shown in Figure 11.
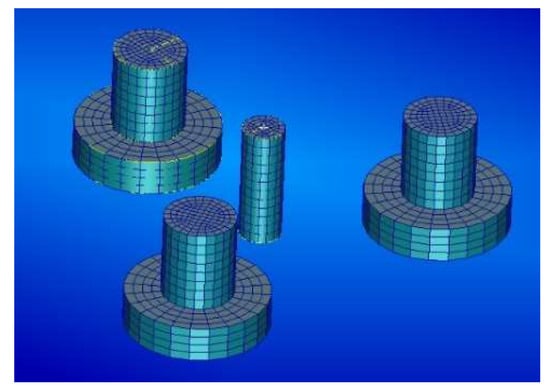
Figure 9.
Platform modeling for the hydrodynamic analysis.
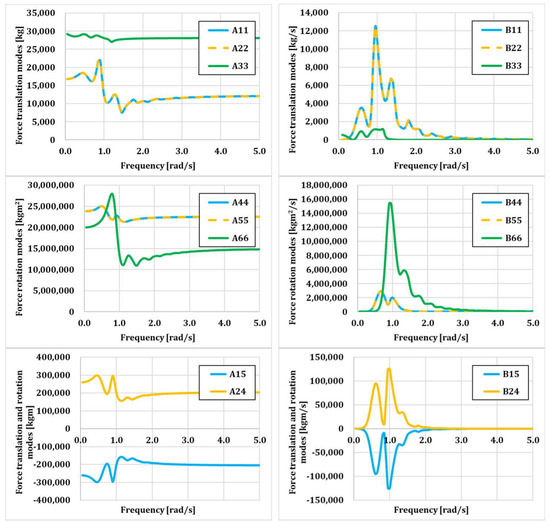
Figure 10.
Added mass and damping coefficients.

Figure 11.
Wave excitation force and moments.
4. Load Cases
The model test of the 10 MW FOWT comprises combined environmental conditions, which are combined uniform wind, regular waves and uniform current. A total of 12 regular waves were analyzed, different wave periods, wind speeds, rotor rotations, and currents for the maximum thrust. The results obtained are as follows. In LC1, the RAO can be calculated using only regular waves, whereas in LC2, the effective RAO can be calculated by adding the effects of the rated wind speed and rotor rotation. In addition, the effect of current was added to compare the RAO and effective RAO, according to cases with or without current. The regular wave height and current speed used were analyzed by analyzing the marine environment data of the East Sea. The wave period was calculated by subdividing the minimum and the maximum wave periods that can be produced in the ocean engineering wide tank of the UOU. In addition, wave 8.5 was added between wave 8 and wave 9, and wave 9.5 was inserted between wave 9 and wave 10. Because wave 9 is similar to the heave natural frequency region, we added two waves to analyze the on the heave natural frequency region. Shown below are all cases of the 10 MW model test. Table 6 shows the full- and model-scale values for all cases in the 10 MW FOWT model test, and Table 7 shows the information of 12 regular waves.

Table 6.
Model test load cases.

Table 7.
Regular waves for model test.
- LC1_NC: Regular waves, No wind, No current
- LC1_WC: Regular waves, No wind, With current
- LC2_NC: Regular waves, Rated wind, No current
- LC2_WC: Regular waves, Rated wind, With current
5. Results and Discussion
5.1. Free-Decaying Test
Prior to the model test, a free-decaying test for surge, heave, and pitch were performed. The free-decaying tests were performed to obtain the natural period and damping coefficients of the structure, and to check that the motion of the model test is the same as motion of the simulation. The wind and wave directions in this model test were unidirectional; therefore, the results of surge, heave, and pitch except sway, roll, and yaw were shown. The tests were performed by pushing down the structure from a nearby carriage, and a tuning process was performed in the numerical simulation, such as minor adjustments of stiffness and damping of the floater [25]. Figure 12 shows the time series values of surge, heave, and pitch motions for the free-decaying test. The natural period of the surge was 142.7 s, the natural period of the heave was 19.5 s, and the natural period of the pitch was 35.8 s. Except for the natural period of the heave, those of the others were out of range between 5 s and 20 s, which was the wave period occurring on the real sea. The wave period of the model test was from 5.5 s to 28.46 s, so the kinetic characteristics of the platform could be confirmed in the heave natural period.
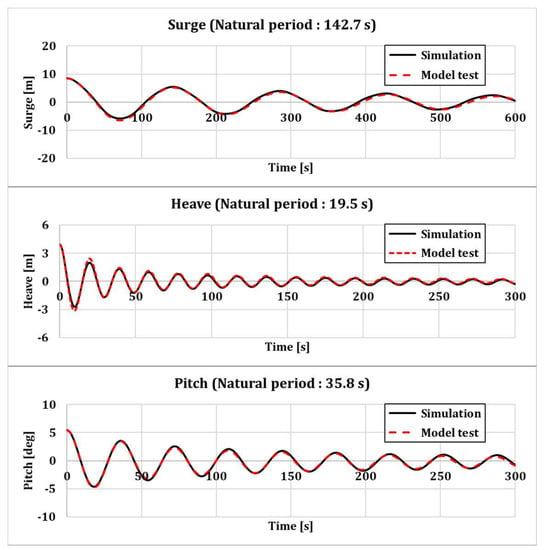
Figure 12.
Free decay results of model test and simulation.
5.2. RAO
To predict and evaluate the movement of the 10 MW FOWT, model tests were performed on regular waves and numerical analyses were performed. Many researchers performed motion analysis by calculating the RAO values of floating offshore wind turbine system, as well as ships or offshore structures [26,27,28]. The RAO for the surge, heave, and pitch motions of a platform without current is shown in Figure 13. Numerical analyses of low-frequency ranges, which cannot be performed in the model test, can be used to identify phenomena that occur in each platform natural period. First, contents that can be confirmed through the numerical analysis results are as follows. It was confirmed that the largest peak occurred in the natural periods of surge, heave, and pitch. Furthermore, the calculated RAO of the surge was extremely large. In addition, LC2 was significantly reduced compared to LC1 in the RAO of the pitch. This depicts an aerodynamic damping [29], which occurs in the presence of wind and rotor rotations; therefore, most RAOs of LC2 are smaller than those of LC1. In addition, one more peak appeared in the surge natural frequency, not the natural frequency in the pitch RAO, which is a surge–pitch coupling phenomenon [30]. The results of the model test are as follows. First, it was confirmed that most model tests fit the numerical analysis. Especially in the heave case, the model test in the natural frequency could be performed, and the model test result confirmed that the largest peak occurred in wave 9, closest to the natural frequency of the heave. However, a slight difference was exhibited in the model test, indicating the large heave damping in the model test. The motion was not related to the aerodynamic damping, so the graphs of LC1 and LC2 were similar. Next, we discuss the heave natural frequency in the pitch RAO graph. When the wind was blowing, some peaks were observed at the natural frequency of the heave. This phenomenon did not occur in the absence of wind. This can be called the heave–pitch coupling phenomenon.
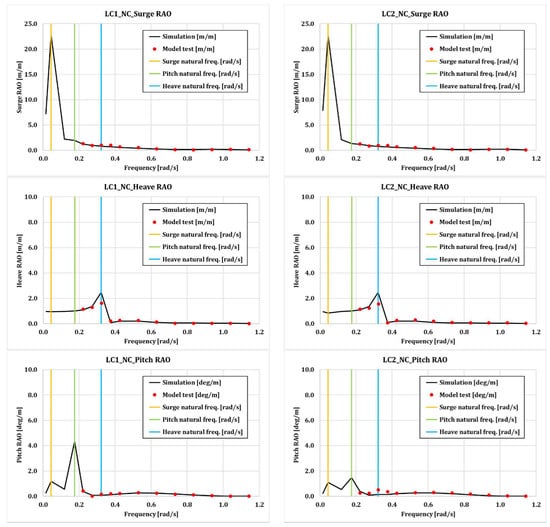
Figure 13.
Response amplitude operator (RAO) for the surge, heave, and pitch motions of a platform without current.
Figure 14 shows the RAO calculations for LC1 and LC2 when the current effect was applied. The RAOs for the three movements were smaller to those without current. This would further reduce the motion, because the current-imitating device had already provided an initial force to the platform. In the presence of current, the surge RAO was approximately a quarter less than in the absence of current. Therefore, when no current was present, one more peak appeared in the surge natural period in the pitch graph, but the peak in the surge natural period could not be confirmed by the graph, because the motion was reduced significantly. Additionally, the simulation difference was large because the heave damping of the model test was large, and the pitch peak occurred in the natural frequency of the heave owing to heave–pitch coupling. These results were confirmed to be the same as those when no current was present.
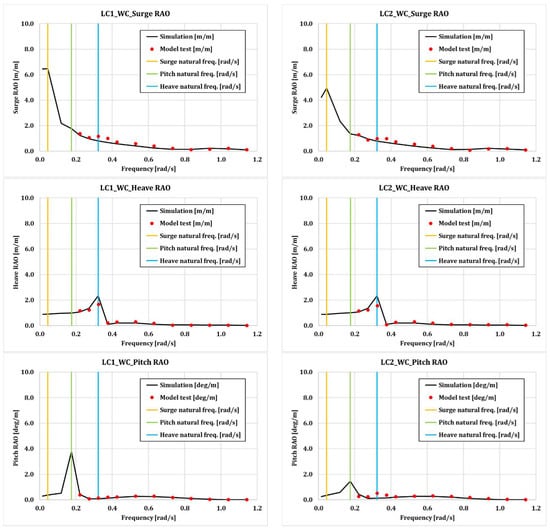
Figure 14.
RAO for the surge, heave, and pitch motions of a platform with current.
6. Conclusions
A model test of a 10 MW FOWT was performed in this study, and the results of the model test were verified by comparing them to the numerical results. The 10 MW FOWT expanded based on the NREL 5 MW wind turbine and the OC4 semisubmersible platform. For the expanded method, we obtained the suitable scale ratio for the properties of the blades, towers, and platform. The ratio of the model test of the 10 MW FOWT was 1:90, which was set to the specifications of the ocean engineering wide tank of the UOU. Mooring tables were installed to match the water depth, and numerical simulations of deep water and finite depth water were performed to ensure the reliability of using these mooring tables. Numerical analyses were performed using NREL’s FAST and UOU’s in-house codes, which yielded the hydrodynamic coefficient, damping forces including wave radiations, and additional damping. Prior to the model test, a free-decaying test was conducted, and the natural period of the model was as follows. The natural periods of the surge, heave, and pitch were 142.7 s, 19.5 s, and 35.8 s, respectively. In particular, the natural period of the heave motion was a period within the experimental range; therefore, the characteristics of the model test were confirmed. The model test involved four conditions. The RAOs and effective RAOs could be calculated in both the absence and presence of current. The ocean engineering wide tank of the UOU did not contain a current generation system. Therefore, we calculated the force when current existed using the FAST, and provided the hydrodynamic force to the platform using a current-imitating device. The marine environmental conditions used in the model test were those of the East sea. In most cases, the results of the numerical analysis and model tests matched well. First, aerodynamic damping and heave-pitch coupling could be confirmed in the presence of wind. Furthermore, it was confirmed that the RAO and effective RAO in the presence of current were small. This appeared to have reduced the motion, because the current-imitating device was already exerting a constant force in the x-direction.
In the future, model test will be conducted using actual sea environment conditions, including irregular waves.
Author Contributions
Formal analysis, H.A.; Methodology, H.S.; Software, H.A.; Supervision, H.S.; Writing—original draft, H.A.; Writing—review & editing, H.S. All authors have read and agreed to the published version of the manuscript.
Funding
This research was funded by the Korea Institute of Energy Technology Evaluation and Planning (KETEP), the Ministry of Trade, Industry & Energy (MOTIE) of the Republic of Korea (No.20184030202280), and the Korea Electric Power Corporation (No:R18XA03).
Conflicts of Interest
The authors declare no conflict of interest.
Abbreviations
| CAE | Computer-Aided Engineering |
| CM | Center of Mass |
| DOF | Degrees Of Freedom |
| FAST | Fatigue, Aerodynamics, Structures, and Turbulence |
| FOWT | Floating Offshore Wind Turbine |
| JONSWAP | JOint North Sea WAve observation Project |
| LC | Load Case |
| NC | No Current condition |
| NREL | National Renewable Energy Laboratory |
| PM | Pierson-Moskowitz |
| RAO | Response Amplitude Operator |
| SWL | Still-Water Level |
| UOU | University Of Ulsan |
| WC | With Current condition |
References
- Song, X.; Bührer, C.; Mølgaard, A.; Andersen, R.; Brutsaert, P.; Bauer, M.; Hansen, J.; Rebsdorf, A.V.; Kellers, J.; Winkler, T.; et al. Commissioning of the World’s First Full-scale MW-class Superconducting Generator on a Direct Drive Wind Turbine. IEEE Trans. Energy Convers. 2020. [Google Scholar] [CrossRef]
- Miura, S.; Iwakuma, M.; Izumi, T. Lightweight Design of Tens-MW Fully-Superconducting Wind Turbine Generators with High-performance REBa2Cu3Oy Wires. IEEE Trans. Appl. Supercond. 2020, 30, 1–6. [Google Scholar] [CrossRef]
- Ennis, B.L.; Kelley, C.L.; Naughton, B.T.; Norris, R.E.; Das, S.; Lee, D.; Miller, D.A. Optimized Carbon Fiber Composites in Wind Turbine Blade Design; Report No. SAND2019-14173; Sandia National Laboratories: Albuquerque, New Mexico, 2019. [Google Scholar]
- Sessarego, M.; Ramos-García, N.; Yang, H.; Shen, W.Z. Aerodynamic wind-turbine rotor design using surrogate modeling and three-dimensional viscous–inviscid interaction technique. Renew. Energy 2016, 93, 620–635. [Google Scholar]
- Satkauskas, I.; Gaertner, E.; Bortolotti, P.; Barter, G.; Graf, P.A. Wind Turbine Rotor Design Optimization Using Importance Sampling. In Proceedings of the AIAA Scitech 2020 Forum, Orlando, FL, USA, 6–10 January 2020; p. 1953. [Google Scholar]
- Jonkman, J.; Butterfield, S.; Musial, W.; Scott, G. Definition of a 5-MW Reference Wind Turbine for Offshore System Development (No. NREL/TP-500-38060); National Renewable Energy Lab. (NREL): Golden, CO, USA, 2009. [Google Scholar]
- Jonkman, J. Definition of the Floating System for Phase IV of OC3 (No. NREL/TP-500-47535); National Renewable Energy Lab. (NREL): Golden, CO, USA, 2010. [Google Scholar]
- Jonkman, J.; Musial, W. Offshore Code Comparison Collaboration (OC3) for IEA Wind Task 23 Offshore Wind Technology and Deployment; National Renewable Energy Lab. (NREL): Golden, CO, USA, 2010. [Google Scholar]
- Robertson, A.; Jonkman, J.; Masciola, M.; Song, H.; Goupee, A.; Coulling, A.; Luan, C. Definition of the Semisubmersible Floating System for Phase II of OC4; (No. NREL/TP-5000-60601); National Renewable Energy Lab. (NREL): Golden, CO, USA, 2014. [Google Scholar]
- Azcona, J.; Vittori, F.; Schmidt, U.; Svanije, F.; Kapogiannis, G.; Karvelas, X.; Manolas, D.; Voutsinas, S.; Amann, F.; Faerron-Guzman, R.; et al. Design Solutions for 10 MW Floating Offshore Wind Turbines. INNWIND. EU, Deliverable D 2017, 4, 37. [Google Scholar]
- Bak, C.; Zahle, F.; Bitsche, R.; Kim, T.; Yde, A.; Henriksen, L.C.; Hansen, M.H.; Blasques, J.P.A.A.; Gaunaa, M.; Natarajan, A. The DTU 10-MW reference wind turbine. In Danish Wind Power Research; National Renewable Energy Laboratory: Lyngby, Denmark, 2013. [Google Scholar]
- NN UpWind. Design Limits and Solutions for Very Large wind Turbines; EWEA: Brussels, Belgium, 2011. [Google Scholar]
- Griffith, D.T.; Ashwill, T.D. The Sandia 100-Meter All-Glass Baseline wind Turbine Blade: SNL100-00; Report No. SAND2011-3779; Sandia National Laboratories: Albuquerque, New Mexico, 2011. [Google Scholar]
- Müller, K.; Sandner, F.; Bredmose, H.; Azcona, J.; Manjock, A.; Pereira, R. Improved Tank Test Procedures for Scaled Floating Offshore Wind Turbines. In Proceedings of the International Wind Engineering Conference IWEC, Hannover, Germany, 3–5 September 2014. [Google Scholar]
- Ahn, H.-J.; Shin, H. Model test and numerical simulation of OC3 spar type floating offshore wind turbine. Int. J. Nav. Arch. Ocean Eng. 2019, 11, 1–10. [Google Scholar] [CrossRef]
- Shin, H.; Dam, P.T.; Jung, K.J.; Rim, C.; Chung, T. Model test of new floating offshore wind turbine platforms. Int. J. Nav. Arch. Ocean Eng. 2013, 5, 199–209. [Google Scholar] [CrossRef]
- Shin, H. Model test of the OC3-Hywind floating offshore wind turbine. In Proceedings of the Twenty-First International Offshore and Polar Engineering Conference, Maui, HI, USA, 19–24 June 2011. [Google Scholar]
- Shin, H.; Kim, B.; Dam, P.T.; Jung, K. Motion of OC4 5MW Semi-submersible Offshore Wind Turbine in irregular waves. In Proceedings of the 32nd International Conference on Ocean Offshore & Arctic Engineering, Nantes, France, 9–14 June 2013. [Google Scholar]
- Pham, T.D.; Shin, H. Validation of a 750 kW semi-submersible floating offshore wind turbine numerical model with model test data, part I: Model-I. Int. J. Nav. Arch. Ocean Eng. 2019, 11, 980–992. [Google Scholar] [CrossRef]
- Kim, J.; Shin, H.; Pham, T.D. Validation of a 750 kW semi-submersible floating offshore wind turbine numerical model with model test data, part II: Model-II. Int. J. Nav. Arch. Ocean Eng. 2020, 12, 213–225. [Google Scholar] [CrossRef]
- Jonkman, J.M.; Buhl, M.L., Jr. FAST User’s Guide. National Renewable Energy Laboratory; Technical Report No. NREL/EL-500-38230; National Renewable Energy Lab. (NREL): Golden, CO, USA, 2005. [Google Scholar]
- IEC. 61400-3, Wind Turbines-Part 3: Design Requirements for Offshore Wind Turbines; International Electrotechnical Commission: Geneva, Switzerland, 2009. [Google Scholar]
- Rojas Castro, I. Design of a 10MW Wind Turbine Rotor Blade for Testing of a Scaled-Down Floating Offshore Support Structure; Delft University of Technology: Lyngby, Denmark, 2017. [Google Scholar]
- Kim, K.-H.; Hong, J.P.; Park, S.; Lee, K.; Hong, K. An Experimental Study on Dynamic Performance of Large Floating Wave-Offshore Hybrid Power Generation Platform in Extreme Conditions. J. Korean Soc. Mar. Environ. Energy 2016, 19, 7–17. [Google Scholar] [CrossRef]
- Stewart, G.; Lackner, M.; Robertson, A.; Jonkman, J.; Goupee, A. Calibration and Validation of a FAST Floating Wind Turbine Model of the DeepCwind Scaled Tension-Leg Platform; No. NREL/CP-5000-54822; National Renewable Energy Lab. (NREL): Golden, CO, USA, 2012. [Google Scholar]
- Lamei, A.; Hayatdavoodi, M. On motion analysis and elastic response of floating offshore wind turbines. J. Ocean Eng. Mar. Energy 2020, 6, 71–90. [Google Scholar] [CrossRef]
- Xu, L.; Guo, T. The Comparison and Analysis of Classic Deep-Sea Floating Platforms’ Hydrodynamic. In Proceedings of the International Conference on Information Technology and Electrical Engineering, Guangzhou, China, 7–9 December 2018; pp. 1–4. [Google Scholar]
- Ibinabo, I.; Tamunodukobipi, D.T. Determination of the Response Amplitude Operator(s) of an FPSO. Engineering 2019, 11, 541–556. [Google Scholar] [CrossRef]
- Salzmann, D.C.; Van der Tempel, J. Aerodynamic damping in the design of support structures for offshore wind turbines. In Proceedings of the Paper of the Copenhagen Offshore Conference, Copenhagen, Denmark, 26–28 October 2005. [Google Scholar]
- Ramachandran, G.K.V.; Robertson, A.; Jonkman, J.M.; Masciola, M.D. Investigation of Response Amplitude Operators for Floating Offshore Wind Turbines; No. NREL/CP-5000-58098; National Renewable Energy Lab. (NREL): Golden, CO, USA, 2013. [Google Scholar]
© 2020 by the authors. Licensee MDPI, Basel, Switzerland. This article is an open access article distributed under the terms and conditions of the Creative Commons Attribution (CC BY) license (http://creativecommons.org/licenses/by/4.0/).