Study on the CO Formation Mechanism during Coal Ambient Temperature Oxidation


Abstract
:
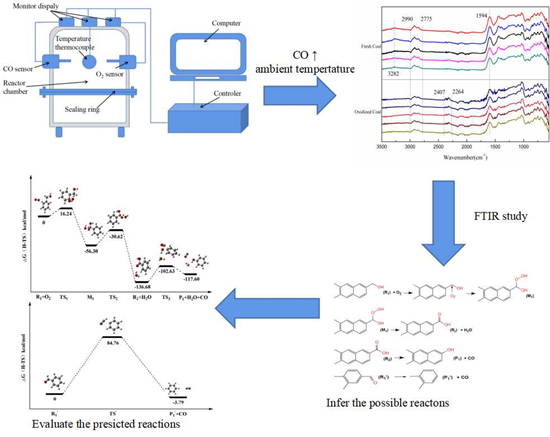
1. Introduction
2. Materials and Methods
2.1. Coal Samples
2.2. Ambient Temperature Oxidation
2.3. FTIR Study
2.4. DFT Calculation
3. Results and Discussion
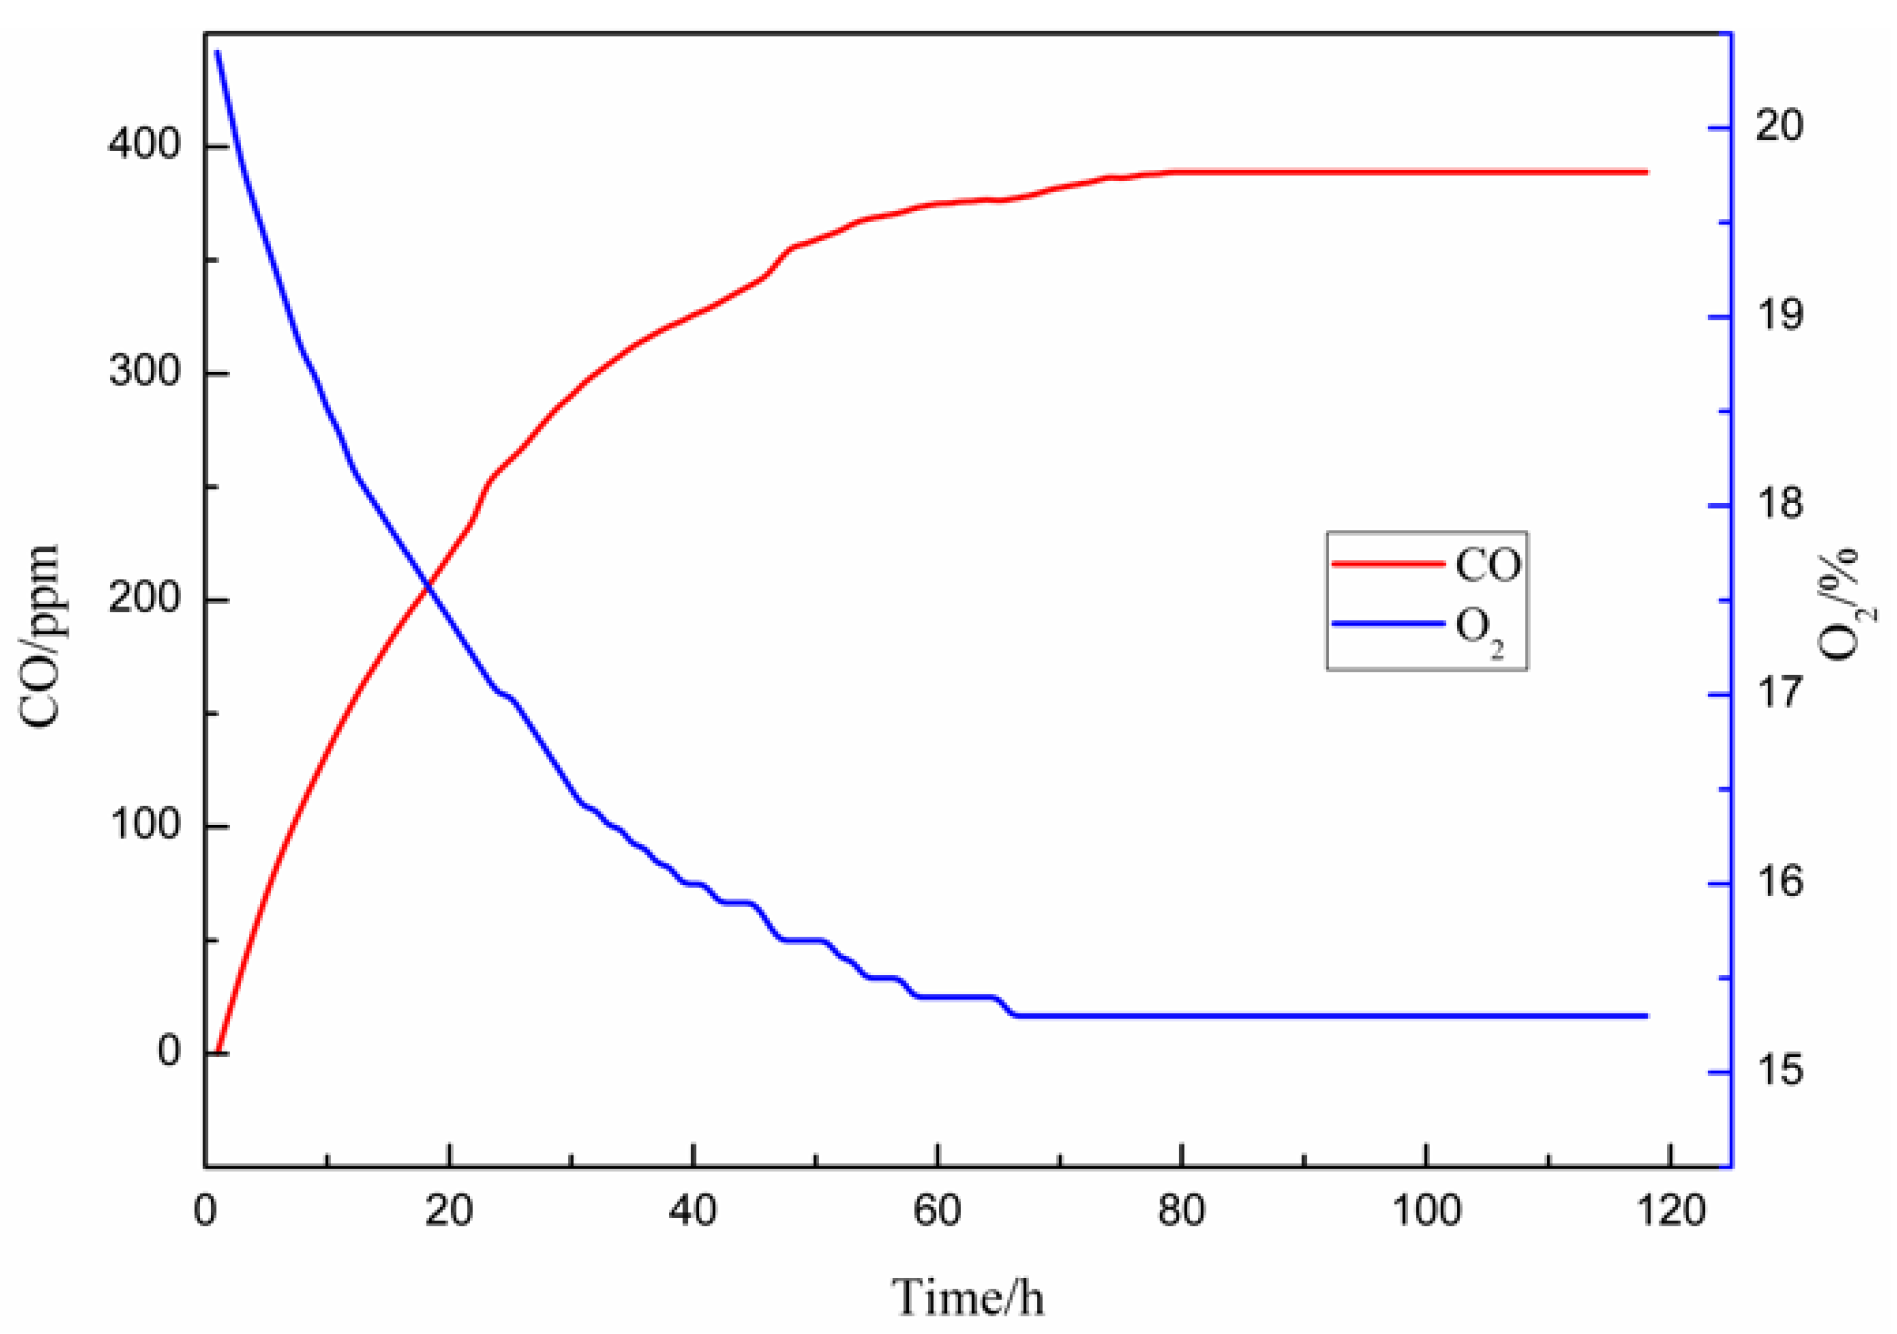
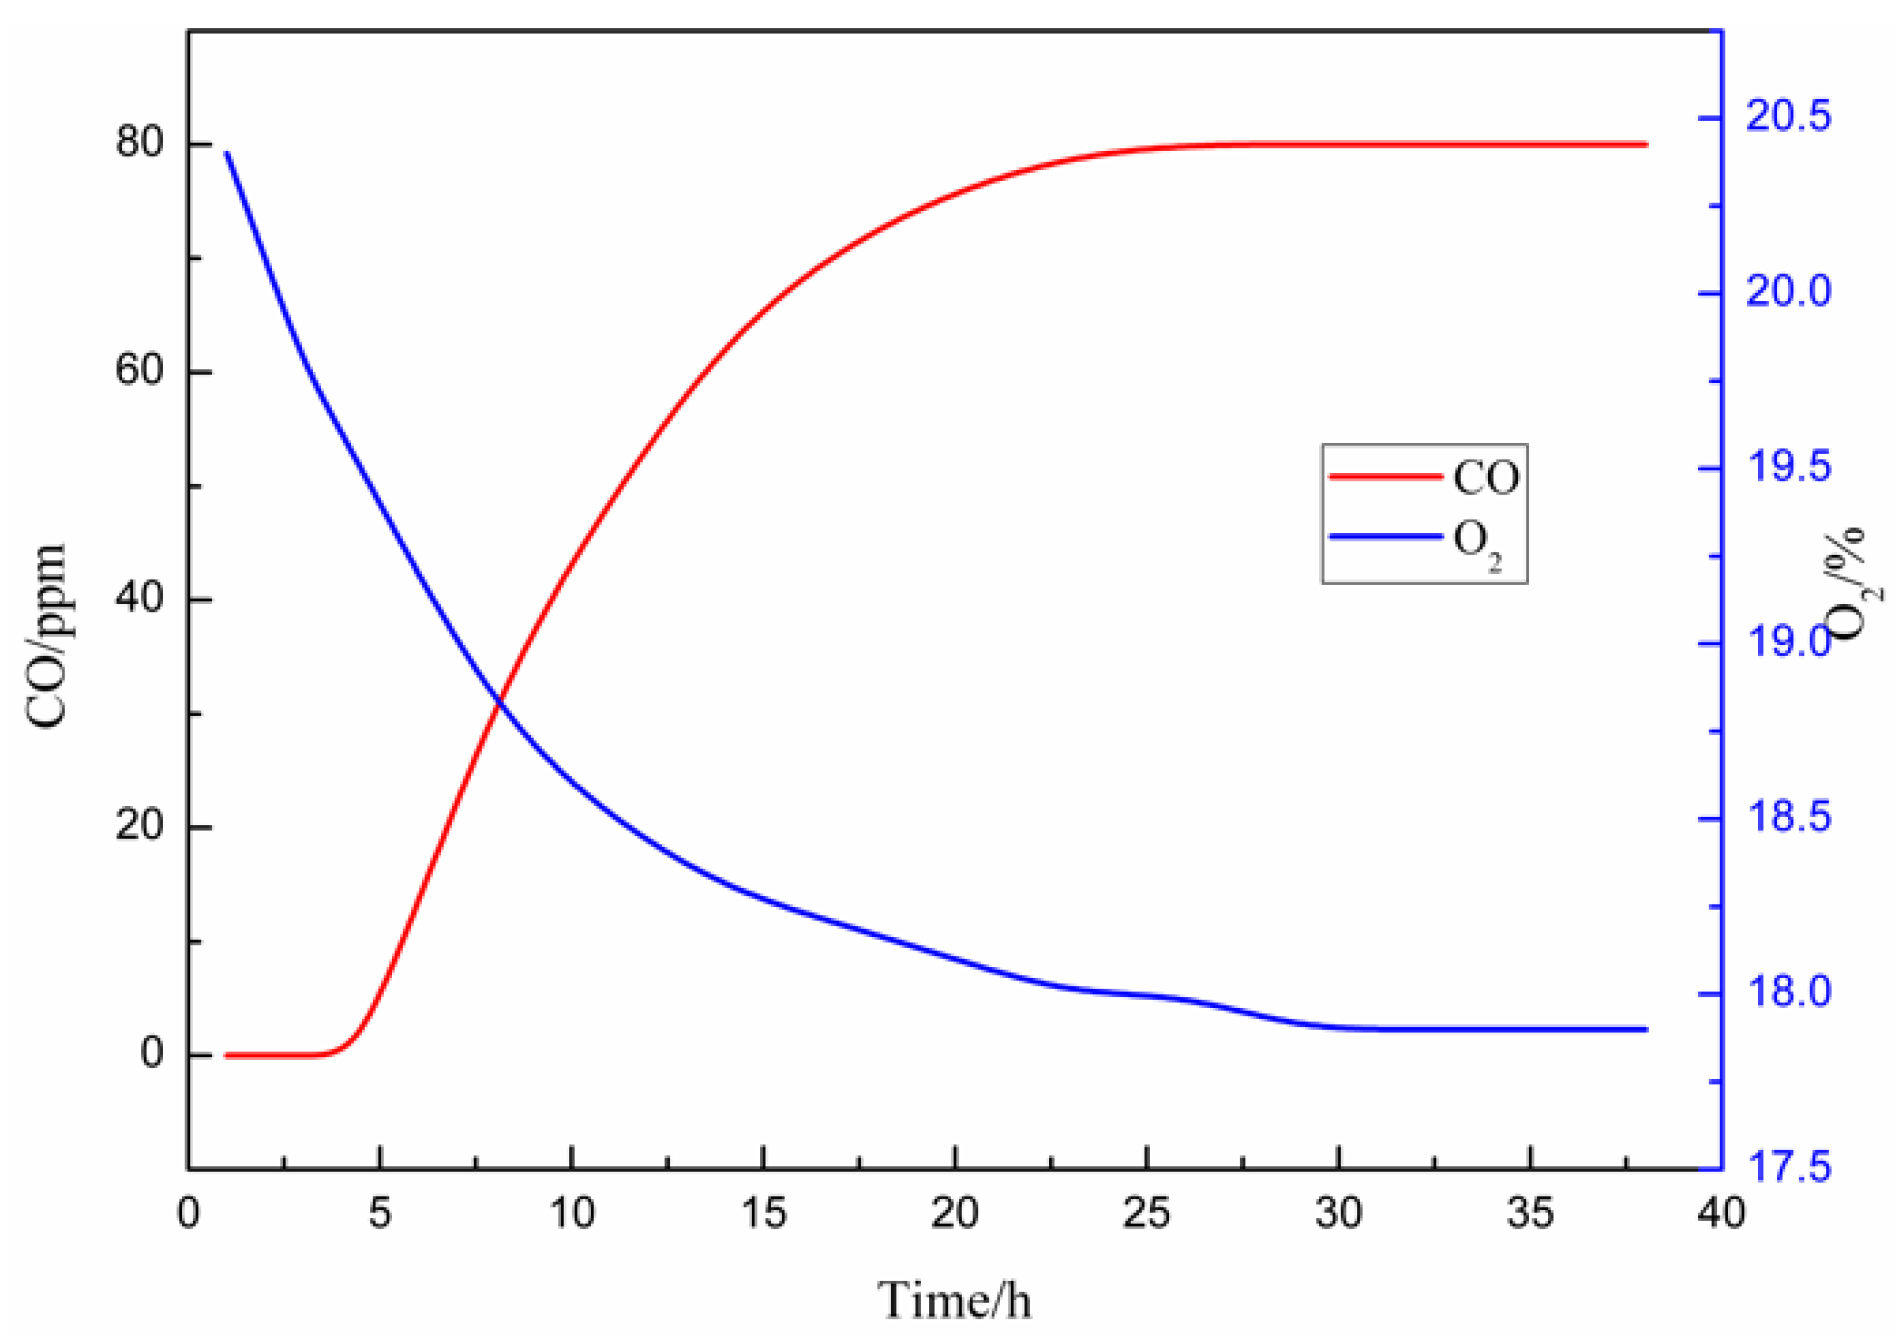
3.1. Ambient Temperature Oxidation Results
3.2. FTIR Analysis


3.3. DFT Calculation Results
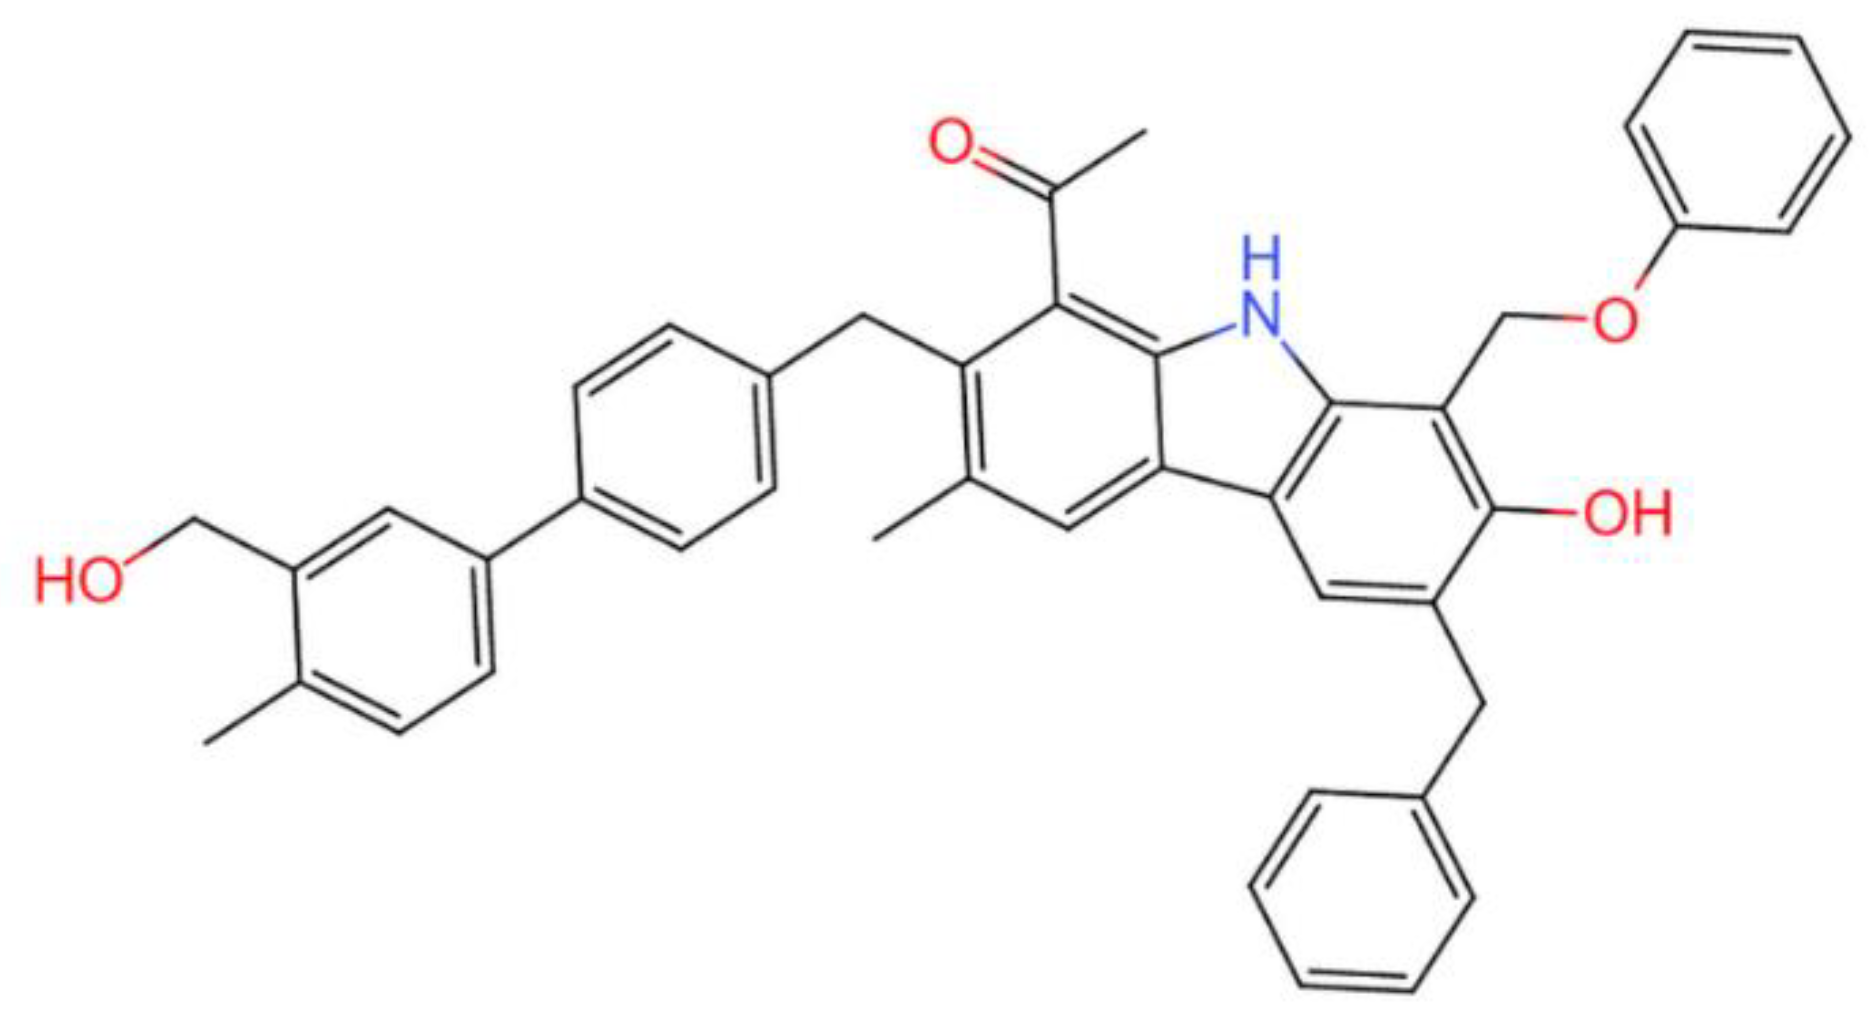
3.3.1. Calculation Model
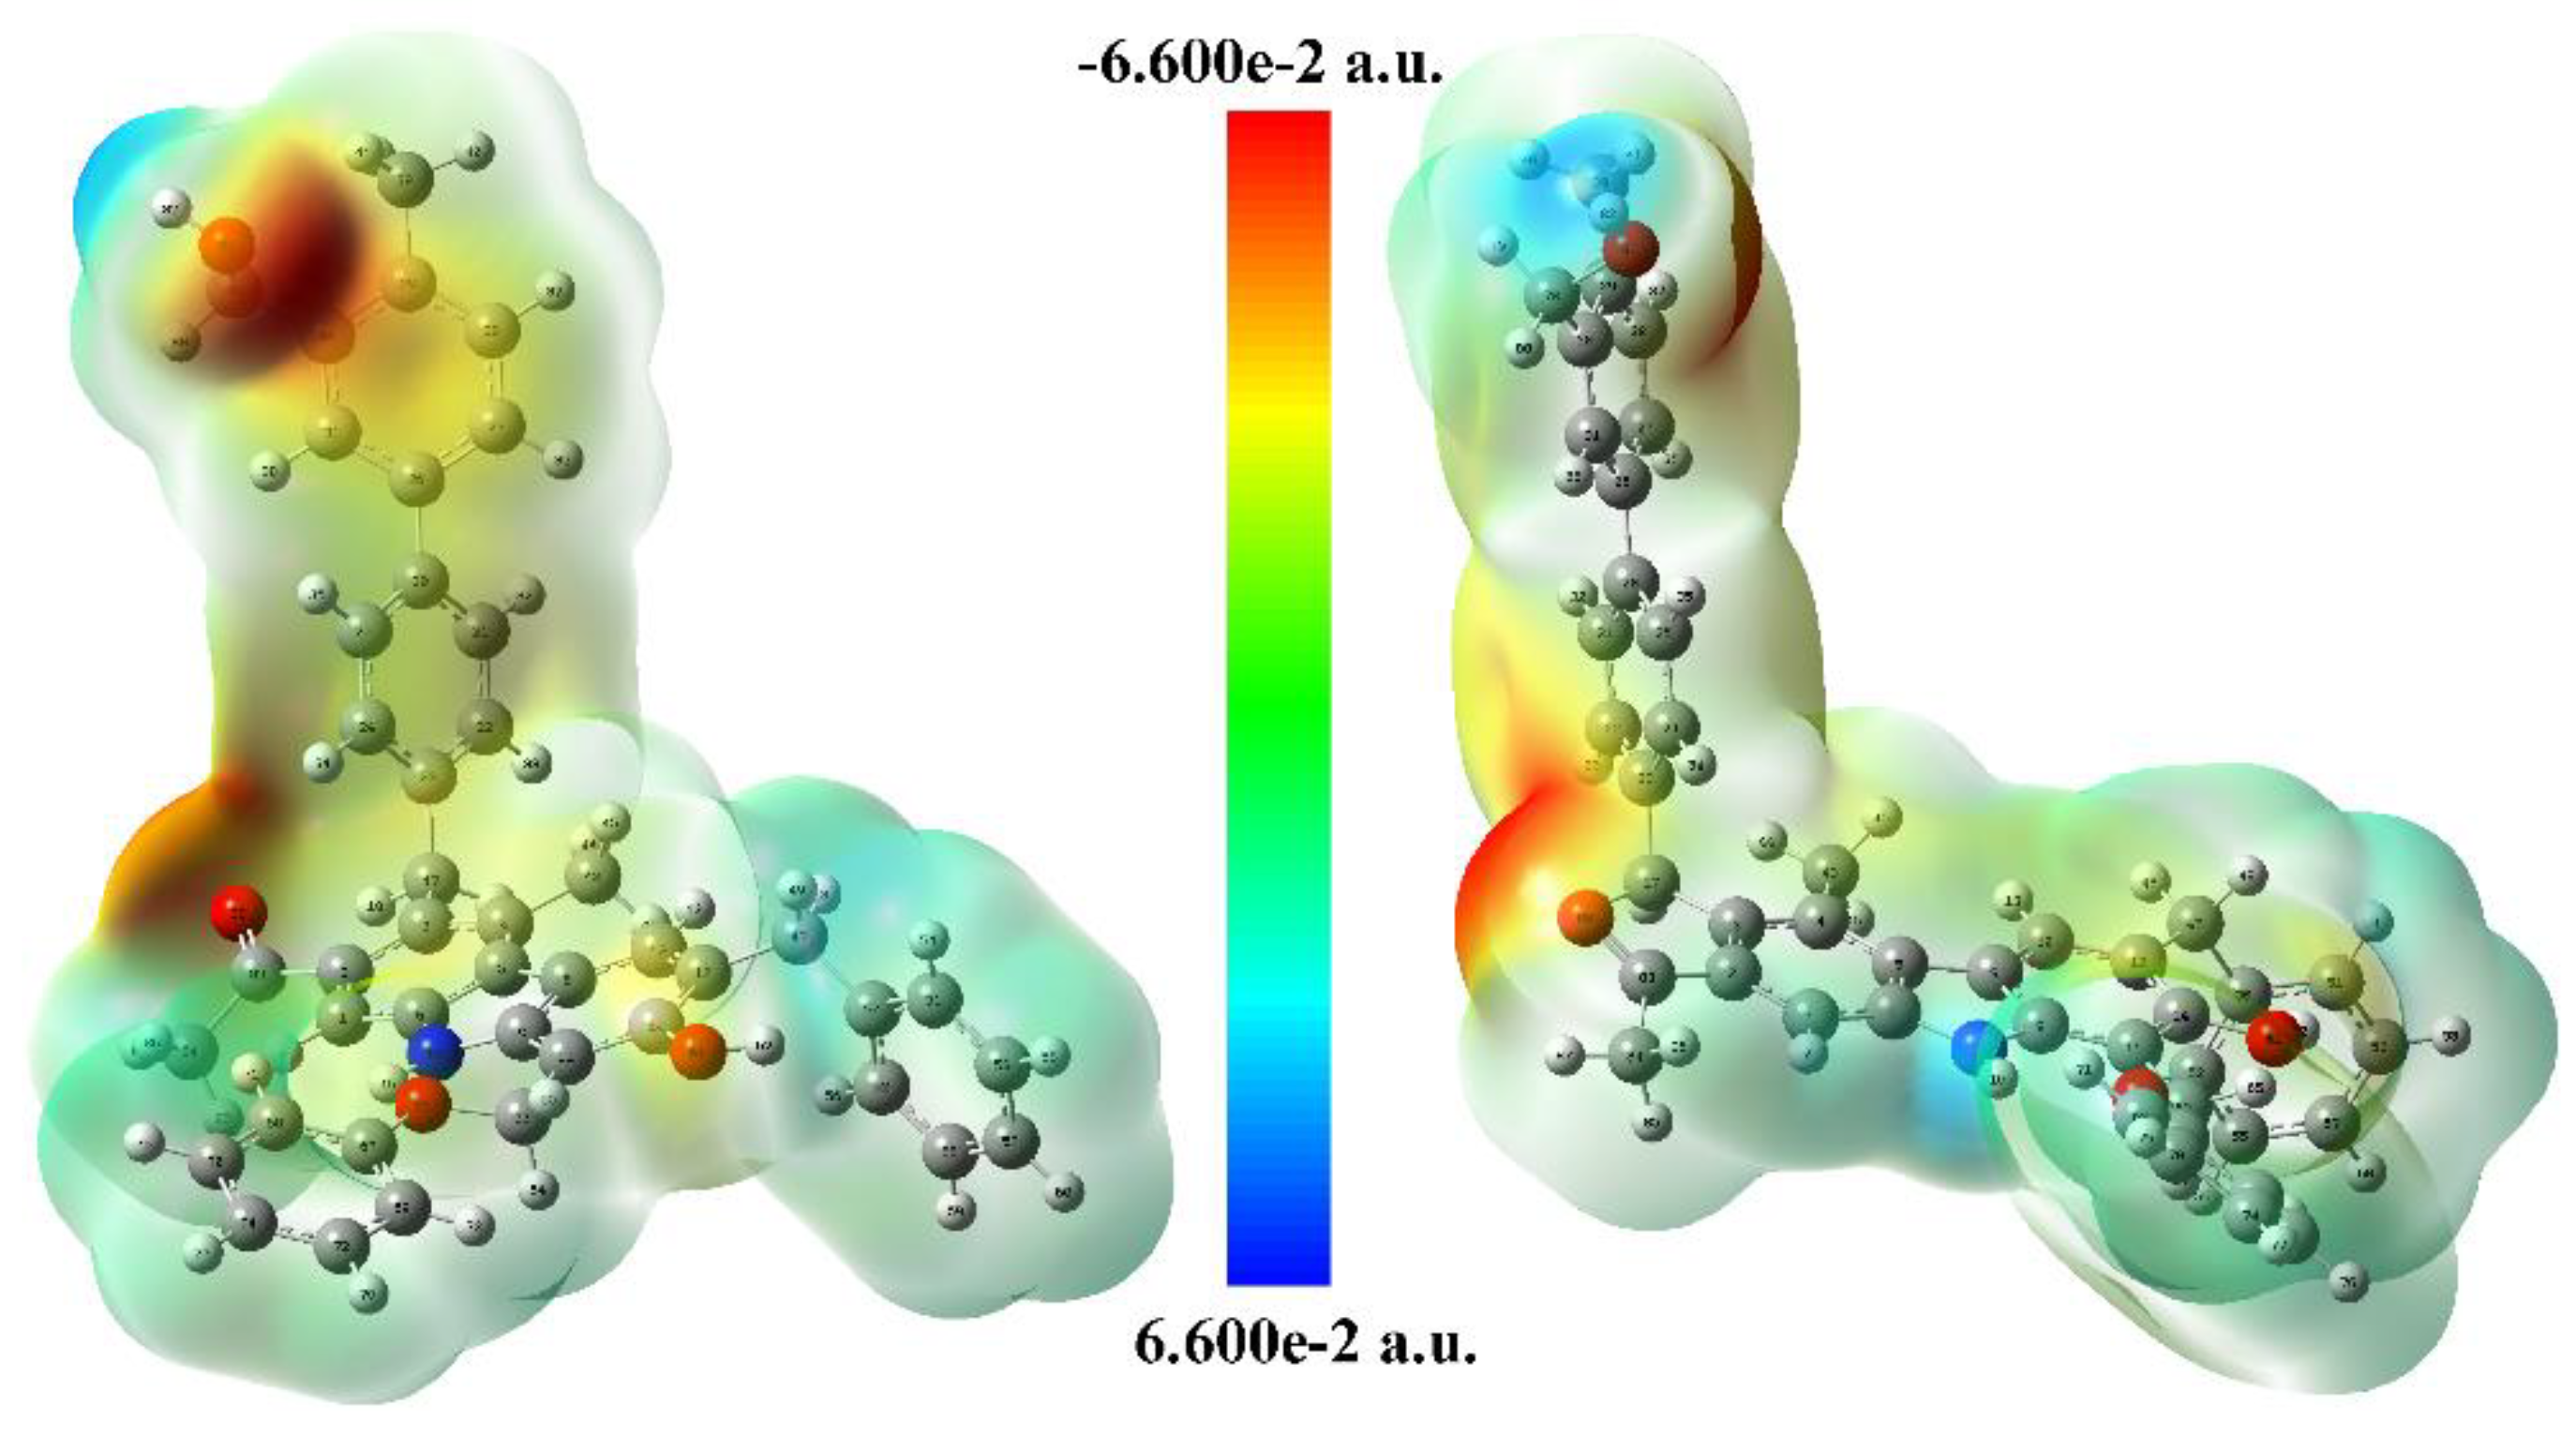
3.3.2. ESP Analysis
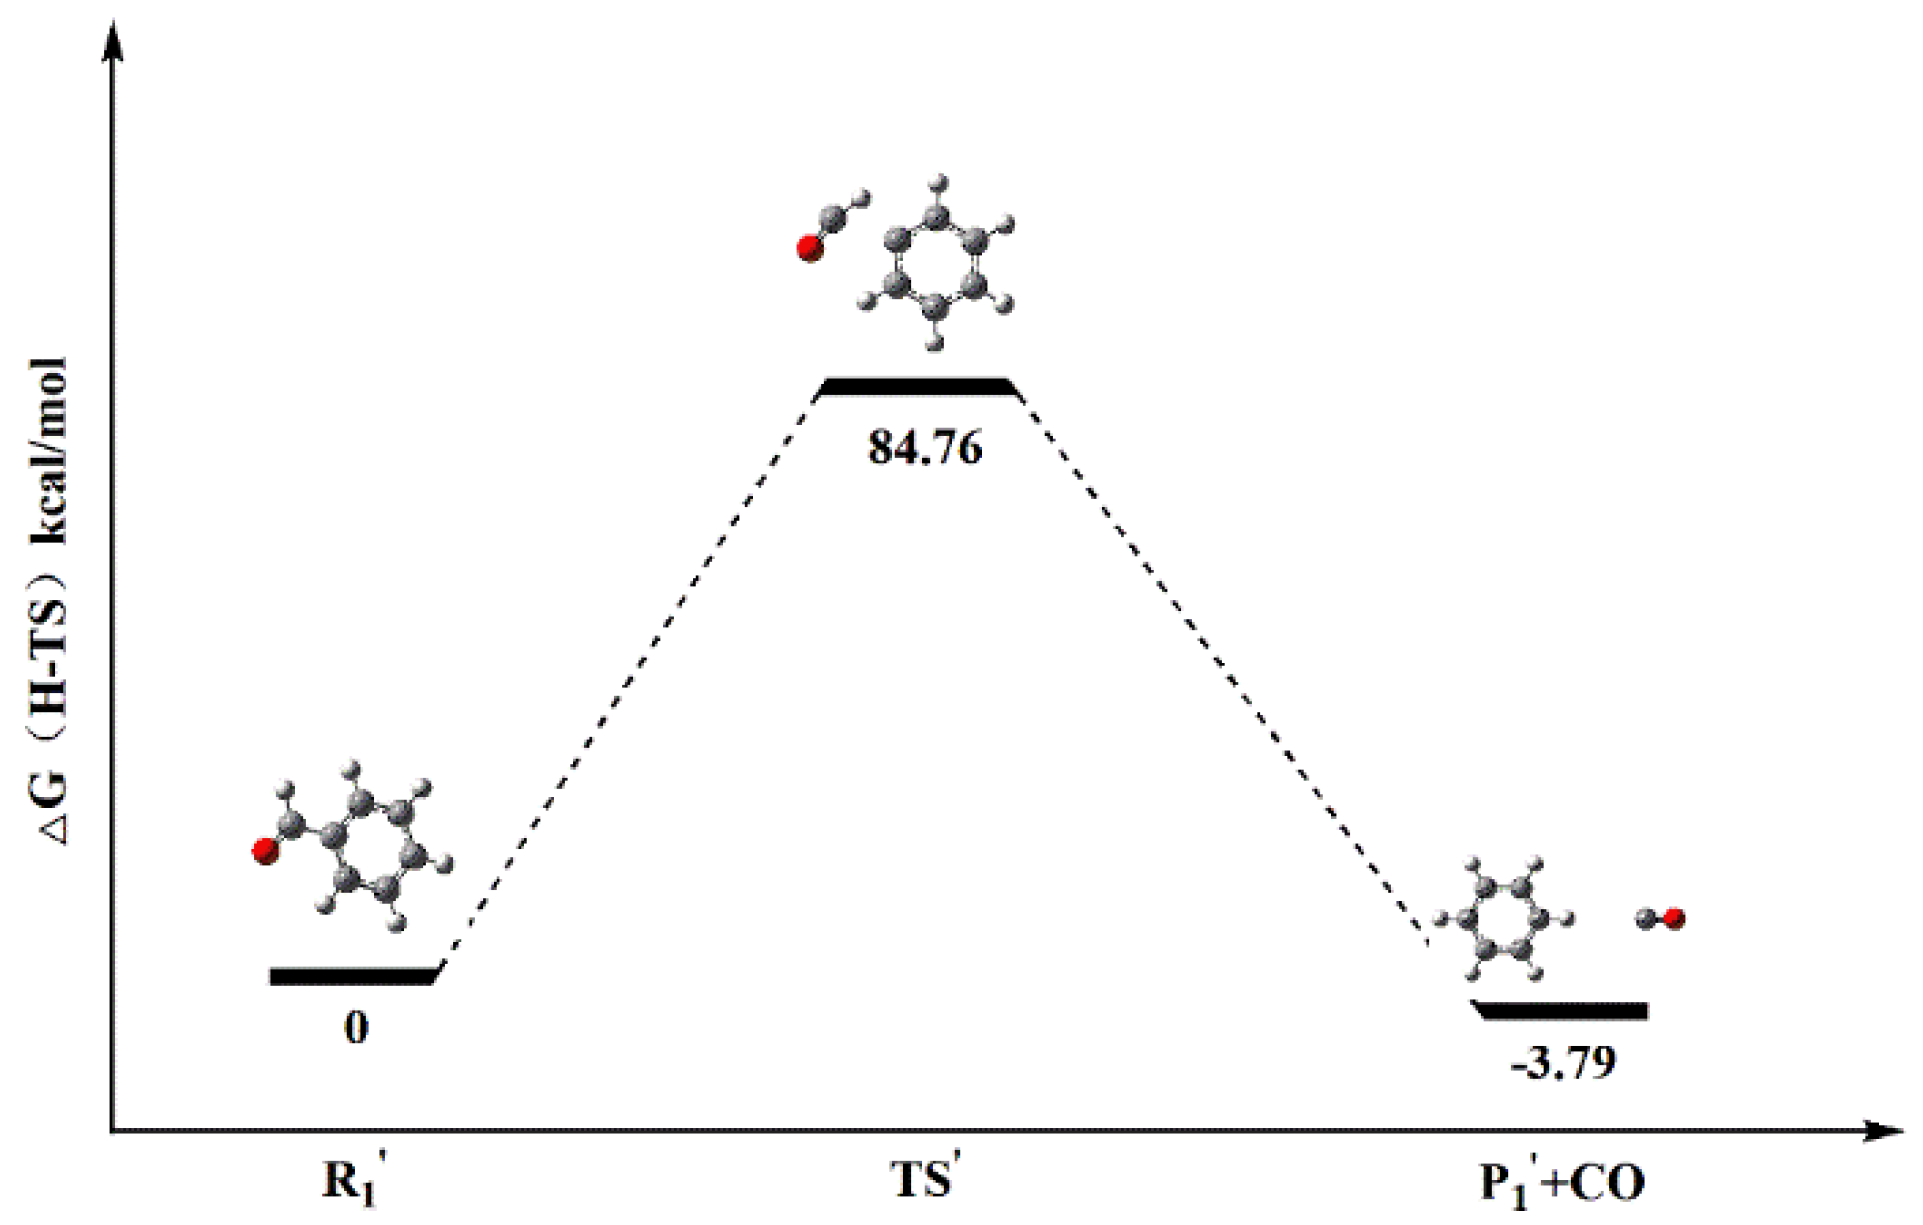
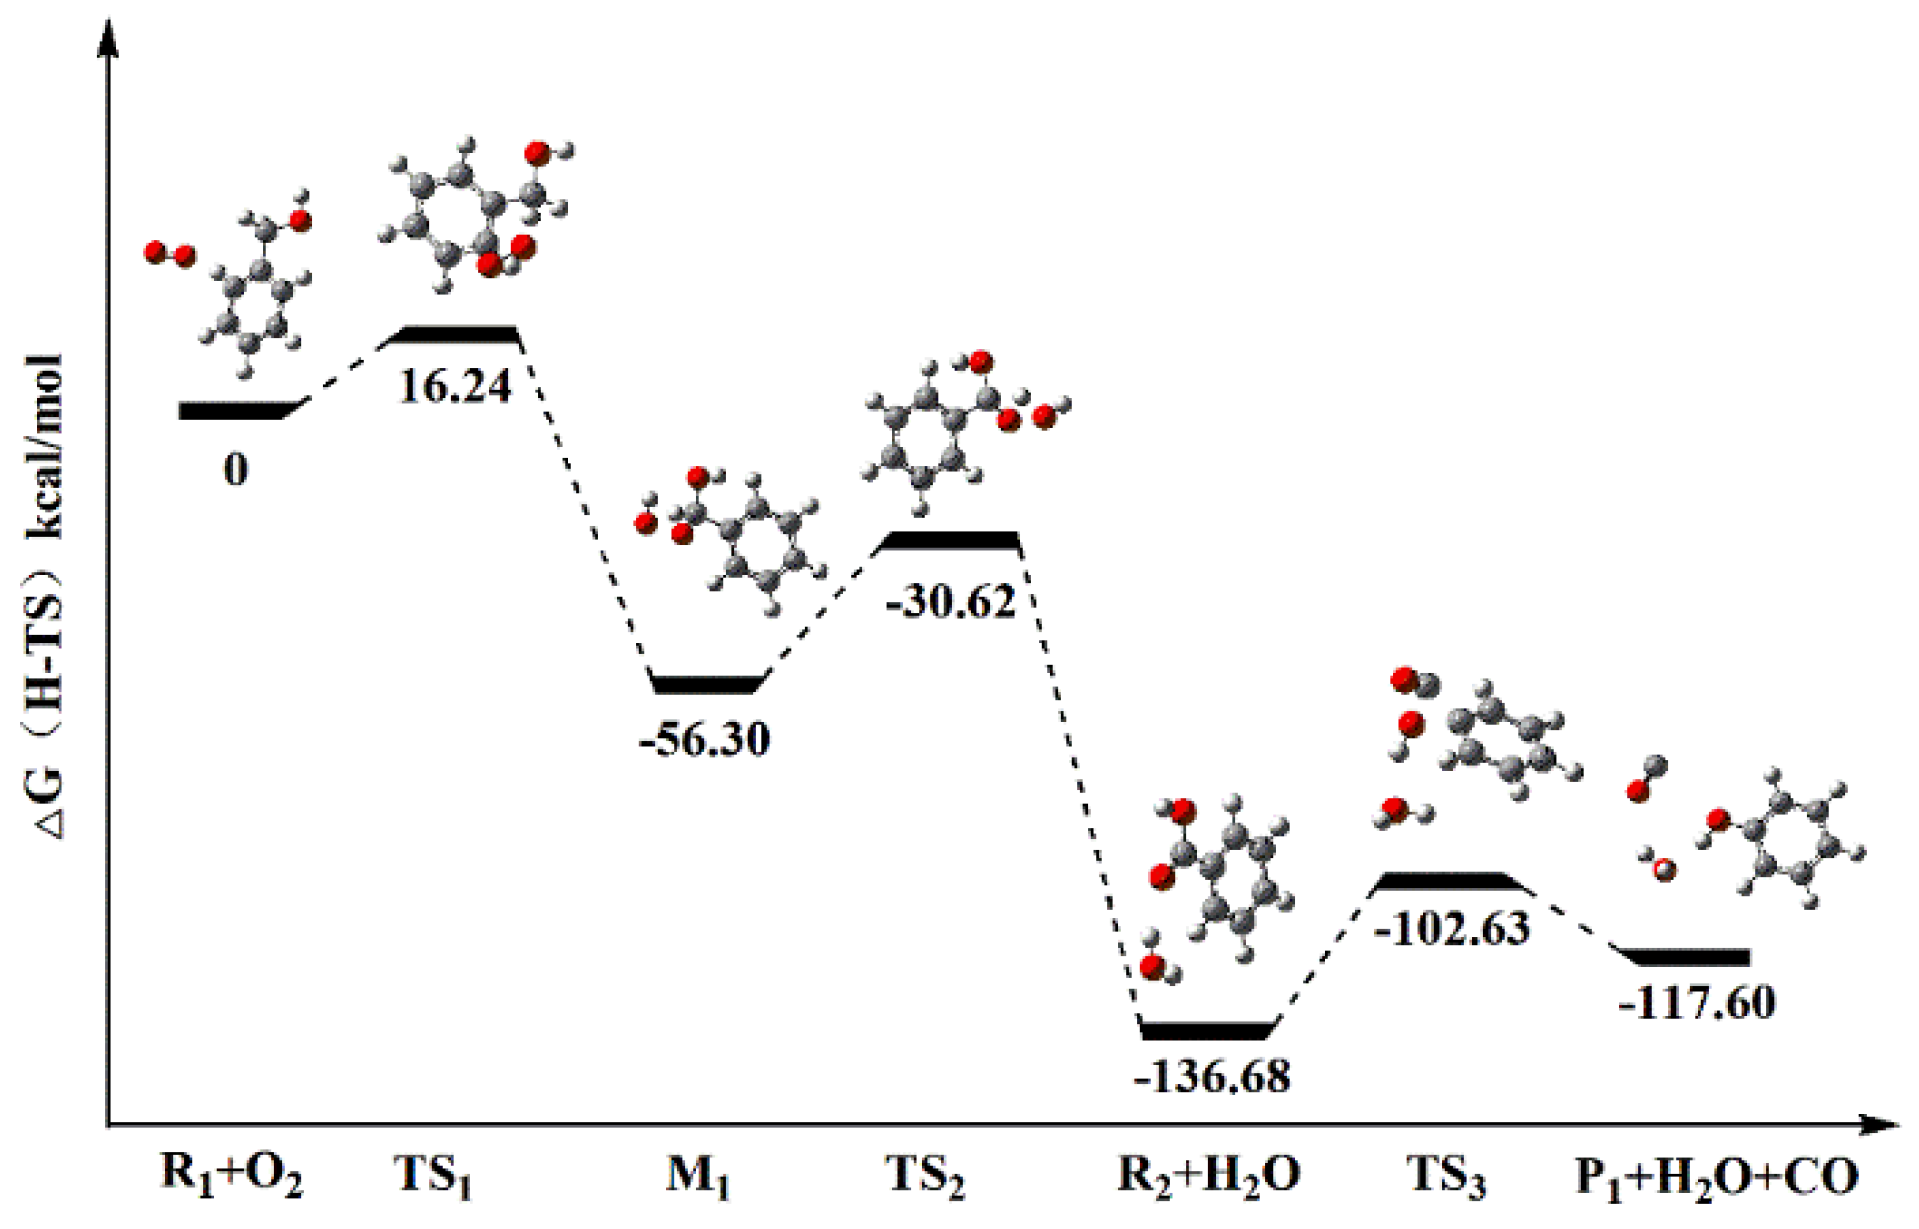
3.3.3. Energy Analysis
4. Conclusions
Author Contributions
Funding
Acknowledgments
Conflicts of Interest
References
- Song, Z.; Kuenzer, C. Coal fires in China over the last decade: A comprehensive review. Int. J. Coal Geol. 2014, 133, 72–99. [Google Scholar] [CrossRef]
- Xie, J.; Xue, S.; Cheng, W.; Wang, G. Early detection of spontaneous combustion of coal in underground coal mines with development of an ethylene enriching system. Int. J. Coal Geol. 2011, 85, 123–127. [Google Scholar] [CrossRef]
- Xu, Q.; Yang, S.; Tang, Z.; Cai, J.; Zhong, Y.; Zhou, B. Free Radical and Functional Group Reaction and Index Gas CO Emission during Coal Spontaneous Combustion. Combust. Sci. Technol. 2017, 190, 834–848. [Google Scholar] [CrossRef]
- Yuan, L.; Smith, A.C. CO and CO2 emissions from spontaneous heating of coal under different ventilation rates. Int. J. Coal Geol. 2011, 88, 24–30. [Google Scholar] [CrossRef]
- Gu, H.-L.; Yu, M.-G.; Xu, Y.-L. Analysis on the genetic type and mechanism identification of carbon monoxide in the coalmine. J. China Coal Soc. 2013, 38, 1812–1818. [Google Scholar]
- Wang, H.-H.; Dlugogorski, B.; Kennedy, E. Analysis of the mechanism of the low-temperature oxidation of coal. Combust. Flame 2003, 134, 107–117. [Google Scholar] [CrossRef]
- Yanni, Z.; Long, C.; Deng, J.; Zhao, J. Study on Thermal Effect of Coal Oxidation at Low-Temperature. In Proceedings of the 11th International Mine Ventilation Congress; Chang, X., Ed.; Springer: Berlin/Heidelberg, Germany, 2019; pp. 552–559. [Google Scholar]
- Zhang, Y.; Wu, J.; Chang, L.; Wang, J.; Xue, S.; Li, Z. Kinetic and thermodynamic studies on the mechanism of low-temperature oxidation of coal: A case study of Shendong coal (China). Int. J. Coal Geol. 2013, 120, 41–49. [Google Scholar] [CrossRef]
- Wang, J.R.; Deng, C.B.; Deng, H.Z.; Lu, W.D. Coal Surface Physical Adsorption to Oxygen Molecules Mechanism. Coal Convers. 2007, 30, 18–21. [Google Scholar]
- Wang, D.-M.; Xin, H.-H.; Qi, X.-Y.; Dou, G.; Qi, G.-S.; Ma, L.-Y. Reaction pathway of coal oxidation at low temperatures: A model of cyclic chain reactions and kinetic characteristics. Combust. Flame 2015, 163, 447–460. [Google Scholar] [CrossRef]
- Deng, J.; Zhao, J.; Zhang, Y.; Huang, A.; Liu, X.; Zhai, X.; Wang, C. Thermal analysis of spontaneous combustion behavior of partially oxidized coal. Process Saf. Environ. Prot. 2016, 104, 218–224. [Google Scholar] [CrossRef]
- Wu, Y.; Zhang, Y.; Zhou, C.; Wang, J.; Wu, J.; Ren, T. Study of CO Sources and Early-warning Concentration of Spontaneous Combustion at Air Return Corner in Fully Mechanized Mining Faces. Combust. Sci. Technol. 2019, 1–18. [Google Scholar] [CrossRef]
- Niu, Z.; Liu, G.; Yin, H.; Zhou, C.; Wu, D.; Yousaf, B. In-situ FTIR study of reaction mechanism and chemical kinetics of a Xundian lignite during non-isothermal low temperature pyrolysis. Energy Convers. Manag. 2016, 124, 180–188. [Google Scholar] [CrossRef]
- Truhlar, D.; Hase, W.; Hynes, J. Current status of transition-state theory. J. Phys. Chem. 1983, 87, 2664–2682. [Google Scholar] [CrossRef]
- Anning, Z.; Lingmei, G.; Shucai, G. In The study of the structure and characteristic of coal-based functional material, United States, 1997-12-31. In Proceedings of the Pittsburgh Coal Conference, Pittsburgh, PA, USA, 23–27 September 1997. [Google Scholar]
- Swaine, D.J. The organic association of elements in coals. Org. Geochem. 1992, 18, 259–261. [Google Scholar] [CrossRef]
- Jurkiewicz, A. Spatial system of the Wiser model of coal structure according to the second moment of the nuclear magnetic resonance line. J. Appl. Phys. 1987, 62, 3892–3897. [Google Scholar] [CrossRef]
- Ades, H.; Subbaswamy, K. Theoretical modeling of coliquefaction reactions of coal and polymers. Fuel Process. Technol. 1996, 49, 207–218. [Google Scholar] [CrossRef]
- Sato, Y.; Inaba, A.; Uemasu, I.; Kushiyama, S. Fundamental study of the effect of hydrogen donor solvent on coal liquefaction. Fuel Process. Technol. 1986, 14, 67–78. [Google Scholar] [CrossRef]
- Ke-Chang, X.; Wen-Ying, L.; Jie, F. Sulfur capture behaviour of calcia for steam or carbon dioxide gasification of coal macerals. Fuel 1993, 72, 725–726. [Google Scholar] [CrossRef]
- Murray, J.; Abu-Awwad, F.; Politzer, P. Prediction of Aqueous Solvation Free Energies from Properties of Solute Molecular Surface Electrostatic Potentials. J. Phys. Chem. A 1999, 103, 1853–1856. [Google Scholar] [CrossRef]
- Murray, J.; Brinck, T.; Politzer, P. Relationships of Molecular Surface Electrostatic Potentials to Some Macroscopic Properties. Chem. Phys. 1996, 204, 289–299. [Google Scholar] [CrossRef]
- Dano, M.; Viglašová, E.; Galamboš, M.; Rajec, P.; Novák, I. Sorption behaviour of pertechnetate on oxidized and reduced surface of activated carbon. J. Radioanal. Nuclear Chem. 2017, 314, 2219–2227. [Google Scholar] [CrossRef]
- Liu, G.; Hei, E. Definition of activation energy of chemical reaction and its relationship with the potential barrier. Univ. Chem. 2013, 5, 73–76. [Google Scholar]


| R0max (%) | Proximate Analysis (w%) | Elemental Analysis (wdaf%) | ||||||
|---|---|---|---|---|---|---|---|---|
| Mad | Aad | Vdaf | C | H | O* | N | S | |
| 3.86 | 0.94 | 10.86 | 12.6 | 87.22 | 3.51 | 6.61 | 1.1 | 1.56 |
| No. | Site | Potential (a.u.) |
|---|---|---|
| 1# | O81 | −0.06726 |
| 2# | O88 | −0.06628 |
| 3# | C26-31 | −0.03474 |
| 4# | C20-25 | −0.03262 |
| 5# | O66 | −0.03066 |
| 6# | O61 | −0.03013 |
| Reaction Path | Species | H (Hartree) | G (Hartree) | ΔH (kcal/mol) | ΔG (kcal/mol) | Ea (kcal/mol) | k (s−1) | |
|---|---|---|---|---|---|---|---|---|
| Reaction Path a | Step 1 | R1 + O2 | 496.8948 | 496.9468 | −61.16 | −56.30 | 16.24 | 1.455 × 10⁻⁹ |
| TS1 | 496.8684 | 496.9209 | ||||||
| M1 | 496.9923 | 497.0365 | ||||||
| Step 2 | M1 | 496.9923 | 497.0365 | −78.03 | −80.38 | 25.68 | 3.223 × 10⁻¹¹ | |
| TS2 | 496.9462 | 496.9956 | ||||||
| R2 + H2O | 497.1166 | 497.1646 | ||||||
| Step 3 | R2 + H2O | 497.1166 | 497.1646 | 24.02 | 19.08 | 34.55 | 8.984 × 10⁻¹³ | |
| TS3 | 497.0585 | 497.1096 | ||||||
| P1 + H2O + CO | 497.0784 | 497.1342 | ||||||
| Reaction Path b | R1′ | 345.5462 | 345.5839 | 3.87 | −3.79 | 84.76 | 1.421 × 10⁻²¹ | |
| TS’ | 345.4085 | 345.4489 | ||||||
| P1′ | 345.5400 | 345.5900 | ||||||
© 2020 by the authors. Licensee MDPI, Basel, Switzerland. This article is an open access article distributed under the terms and conditions of the Creative Commons Attribution (CC BY) license (http://creativecommons.org/licenses/by/4.0/).
Share and Cite
Liu, S.; Wu, Y.; Zhou, C.; Wu, J.; Zhang, Y. Study on the CO Formation Mechanism during Coal Ambient Temperature Oxidation. Energies 2020, 13, 2587. https://doi.org/10.3390/en13102587
Liu S, Wu Y, Zhou C, Wu J, Zhang Y. Study on the CO Formation Mechanism during Coal Ambient Temperature Oxidation. Energies. 2020; 13(10):2587. https://doi.org/10.3390/en13102587
Chicago/Turabian StyleLiu, Shuo, Yuguo Wu, Chunshan Zhou, Jianming Wu, and Yulong Zhang. 2020. "Study on the CO Formation Mechanism during Coal Ambient Temperature Oxidation" Energies 13, no. 10: 2587. https://doi.org/10.3390/en13102587
APA StyleLiu, S., Wu, Y., Zhou, C., Wu, J., & Zhang, Y. (2020). Study on the CO Formation Mechanism during Coal Ambient Temperature Oxidation. Energies, 13(10), 2587. https://doi.org/10.3390/en13102587