Abstract
Due to the increasing use of Electric Vehicles (EVs), the effect of the EV charging power demand on the reliability of the power system infrastructure needs to be addressed. In apartment complexes, which have emerged as a common residential type in metropolitan areas and highly populated districts, high charging demand could result in substantial stress to distribution networks. In this work, the effect of EV charging power demand in an apartment complex on the aging of the Distribution Transformer (DT) is studied. A methodology based on the stochastic characterization of vehicle usage profiles and user charging patterns is developed to obtain realistic EV charging demand profiles. Based on the modeled EV charging profile and the transformer thermal model, the effect of different EV penetration ratios on DT aging for an apartment complex in the Republic of Korea is studied. Results for an EV penetration ratio of up to 30% indicated that DT aging could be accelerated by up to 40%, compared to the case without EV charging. To mitigate this accelerated DT aging caused by EV charging, the effectiveness of two integration approaches of Photovoltaic (PV) sources was studied. Based on a case study that included a realistic PV generation profile, it was demonstrated that a significant contribution to DT reliability could be achieved via the operation of PV sources. A more apparent contribution of PV integration was observed with an energy storage installation at higher EV penetration ratios. At an EV penetration ratio of 30%, a maximum decrease of 41.8% in the loss-of-life probability of the DT was achieved. The effects of different PV integration approaches and power management details on DT aging were also studied. The results demonstrate that the EV charging demand could introduce a significant level of stress to DTs and that this impact can be effectively mitigated by installing PV sources. These observations are expected to contribute toward the effective planning of power system infrastructures that support the design of sustainable cities with the widespread use of EVs.
1. Introduction
This work evaluates the effect of the Electric Vehicle (EV) charging power demand in an apartment complex on the aging of the Distribution Transformer (DT). The adoption of various technologies has resulted in the development of advanced vehicles [1]. The application of an electrified propulsion system enabled the advent of EVs [2], and the emergence of connected cars and autonomous vehicles is based on the progress of technologies in relevant fields such as the Internet of Things (IoT), intelligent controls, and sensors [3,4]. Owing to such emerging vehicular platforms, it is possible to expect the realization of advanced functions such as high efficiency, self-driving, and intelligent vehicle management. In addition to such improvements in vehicle performance and user convenience, social problems that originate from the operation of automobiles (e.g., traffic congestion, vehicle accidents, and environment pollution) could also be mitigated. Thanks to their unmanned operation capability, the application of vehicles could be further expanded to additional roles such as relief operations during disasters [5]. Based on such promising functions, vehicles are expected to perform a major role in the realization of smart cities and even provide opportunities for new business models [3,6]. Despite such potentials, it is necessary to highlight that concerns and barriers regarding the application of the emerging vehicles also exist. Representative examples of concerns include system safety, information privacy, and cost of technology [3,6,7]. Hence, research on emerging vehicles should not be limited to the vehicular platform itself but also include the policies, regulations, and infrastructures that support their widespread deployment.
With the increased use of conventional internal combustion engine vehicles, global issues such as environmental pollution, fossil fuel dependence and greenhouse gas emission have emerged. While both energy consumption and carbon emissions caused by the transportation sector have shown a continuous increase [8], a 90% increase in greenhouse gas emission, compared to that in 2000, could occur by 2030 [9]. Considering the continuous increase in urban populations [6] and the importance of urban transport for sustainable city development [10,11], various measures from different perspectives have been proposed for an effective contribution toward transportation sustainability. Representative examples of such approaches include the operation of convenient public transportation systems (e.g., bus rapid transit and intelligent light rail), introduction of government regulation policies [10], and usage of EVs. The use of EVs is expected to increase continuously due to the growing interest in sustainable transportation. For instance, it has been predicted that EVs would account for more than 20% of the annual sales in the overall U.S. vehicle market by 2030 [12]. In the case of the Republic of Korea, Jeju Island has established a plan to replace all conventional vehicles with EVs by 2030 as part of its policy to realize a Carbon Free Island (CFI) [13,14]. To maximize the benefits of EVs, it is necessary that users have complete access to EV charging stations without experiencing difficulties in charging. Hence, it is obvious that the EV charging facility would become a critical social infrastructure for sustainable cities.
In this study, a quantitative assessment and proposal of solutions for DT aging issues caused by the EV charging demand are performed. In particular, this research focused on EV charging demand in an apartment complex with a relatively large population density. To accommodate the additional power demand introduced by EV charging, it is necessary to predict and mitigate the impact of EV charging on distribution infrastructures for the reliable operation of EVs and the power system. It is evident that EV operation requires charging and the DT serves as one of the primary interfaces at the power distribution network. Failure or deterioration of such critical infrastructure would cause interruption of service not only to EV users but also to residents of the apartment complex. Considering the non-negligible cost of procuring and replacing a DT [15], DT aging also needs to be addressed from an economic perspective [16]. Compared to previous studies on EV charging prediction and the effect of EV charging demand on transformer aging, the contributions of this work can be summarized as follows:
First, a methodology for predicting the EV charging demand of an apartment complex is developed. Apartments have emerged as a representative housing type in metropolitan areas [17,18] or newly developed residential districts with high population density [19]. Considering that the usage of EVs will increase continuously and a substantial amount of additional load demand will be observed in highly populated apartment buildings, research on prediction approaches and engineering solutions to address the issues caused by EV charging in apartment complexes are needed. While studies on other sites, such as a residential complex that consists of several houses [20], the business district of a metropolitan city [21], public parking of a commercial building [22], or a factory [23] have been performed, such results have limitations for being applied to studies on apartment complexes.
Second, the EV charging demand was modeled using a stochastic framework supported by realistic field data, such as an actual survey and a national database. Compared to deterministic or scenario-based approaches, the use of stochastic models that characterize the pattern of realistic data would provide more practical results. Although the present study considered data of the Republic of Korea, the developed approach could be applied to similar apartment complexes in other regions by simply reflecting their parameter values in the proposed prediction framework.
Third, Photovoltaic (PV) integration approaches that not only contribute to sustainability but also address DT aging issues have been studied, and their effectiveness was verified using a DT aging model. Examples of solutions that have been studied in the past include the optimized design of transformers [24] and application of coordinated charging of EVs [25,26,27]. Considering the expected increase in EVs, the economic effectiveness of performing continuous retrofits of transformers would be rather limited. Although the effectiveness of coordinated charging has been demonstrated [27], the full-scale realization of such approaches would require an extensive amount of resources and efforts [28,29]. For example, sensors, real-time optimization software, and communication infrastructure would be required for data acquisition, computation, and transmission for EV scheduling. Instead, the present research studied the effectiveness of PV source integration approaches at the scale of an apartment complex. In fact, the installation of PV panels in apartment buildings has become an emerging trend for realizing sustainable cities [17,18,30]. The results of this research demonstrated that the PV source, whose best-known advantages is renewable generation, could be applied as an effective approach to mitigate DT aging issues that would occur in sustainable smart cities with highly populated EV operation. Considering the large number of residents, it would be necessary to develop approaches other than coordinated EV charging to effectively address infrastructure aging issues caused by the massive EV charging demand in sustainable apartment buildings. Two approaches for PV integration have been considered in this research, and the main difference between the two is when the generated PV power output contributes to the reduction of DT loading. The approaches could be easily implemented with minimal needs of communication resources, and the verification results showed that the DT Loss of Life (LOL) could be decreased by more than 40% with PV source integration.
The contributions of this research compared to those of previous works were previously discussed. Furthermore, this manuscript is prepared to provide technical answers to the following research questions:
- What are the major steps required for modeling the EV charging demand of an apartment complex with a large population density?
- What is the effect of different EV penetration ratios on the overall power demand and transformer aging in an apartment complex?
- How effective are PV integration approaches to address transformer aging issues in a sustainable apartment complex?
The remainder of this paper is organized as follows. Section 2 reviews previous works related to the effect of EV charging demand on power system operation and infrastructure aging. In Section 3, the details of the proposed EV charging power demand prediction model are introduced. Section 4 discusses in detail the transformer aging model, and Section 5 introduces two approaches for PV source integration that could be considered for mitigating transformer aging. In Section 6, results of the effect of EV charging demand on transformer aging and the effectiveness of the proposed solutions for addressing DT aging issues are presented. The last section concludes the manuscript.
2. Review of Previous Works
With the rapid increase in EVs and charging stations, the impact of EV charging demand should not be overlooked [21,31]. While the increased use of EVs would contribute to sustainability, it has been reported that EV charging could introduce challenges, such as power quality degradation and increased power losses. It was shown that the nonlinearity of various power conversion stages in EV charging stations could cause harmonic distortion and introduce additional losses [32]. To mitigate such issues, the application of power filters and active power conversion interfaces were considered [32]. The effect of EV charging demand on the voltage profile of distribution networks has also been studied [33]. While it was shown that the hosting capacity of EVs could be determined by the voltage drop level, controlled charging of EVs was proposed as a solution [33]. To minimize the impact of EV charging on distribution networks, control approaches that perform optimized EV charging have also been explored [34,35,36].
As power demand for EV charging would increase the overall stress level of the power system infrastructure, the effect of EV charging demand on infrastructure aging has also been studied. Based on detailed data analysis of two U.S. cities with different climate conditions, it was demonstrated that uncontrolled EV charging introduces accelerated aging of transformers, and the aging rate highly depends on the charging power level [15]. A noticeable impact of EV charging on transformer stress has also been reported based on a case study in Southern California [37]. The effects of different charging patterns on the aging of a 25-kVA transformer that serviced 10 houses were also studied [38]. It was shown that the aging process was considerably influenced by various factors, such as whether all EVs start charging at the same instant or when the battery charging of EVs has been resumed. Using a probabilistic simulation, the aging trend of a 160-kVA transformer in a typical French distribution power network was studied with various EV penetration ratios [39]. It was concluded that the aging rate increases in a quadratic manner with the number of EVs. Based on the prediction results of EV charging demand using stochastic modeling, it was shown that transformer aging is also affected by the drive range, transformer ratings, and seasonal characteristics [40]. The problem of transformer aging caused by EV charging has been investigated not only for residential areas but also for industrial plants [23] and commercial districts [22].
To mitigate the accelerated transformer aging caused by EV charging demand, approaches such as optimized transformer sizing and scheduling of EV charging have been proposed. Instead of simply increasing the transformer rating, an optimization study on transformer design was conducted with the objective to minimize both power loss and transformer aging [24]. Considering that the aging rate of a transformer highly depends on loading, scheduling strategies for EV charging have also been developed. While shifting the EV charging load to off-peak periods could be considered, research results based on field data have shown that such a simple scheduling strategy would not be sufficient. For areas where the base load demand is relatively constant at a high level [41], for instance, the challenges caused by EV charging could not be handled by simply shifting the charging period. An approach that performs EV scheduling based on a preset limit of the power demand has also been proposed [25]. In such an approach, part of the EV charging demand is shifted to later periods depending on whether the power demand exceeds the predefined threshold value. A charging control strategy that performs optimization between transformer aging and customer satisfaction was also studied [42]. As economic loss caused by damages of a DT could be significant [43], the approach of installing Home Energy Management Systems (HEMS) would also be effective. The effectiveness of using price incentives for managing transformer aging issues has been studied. It was found that the application of HEMS could enable EV charging with minimized user cost; however, this increased thermal stress [26]. The effective use of Vehicle-to-Grid (V2G) function for alleviating the stress levels of transformers has also been studied [26,44].
3. EV Charging Power Demand Model
3.1. Methodology
To study the effect of EV charging power demand, the power demand profile for an apartment complex is obtained by modeling the specific factors that determine the EV charging demand. In particular, it is necessary to determine the amount of power required and the variations in the demand during a 24 h period. In this research, the approach depicted in Figure 1 was considered. As shown in Figure 1, data that characterizes the vehicle usage, user charging pattern, and specifications related to EV charging are used. Considering that the vehicle usage profile is highly related to the vehicle usage pattern of residents, the stochastic behavior of daily drive distance, arrival time, and departure time was characterized by well-known distribution functions. To achieve realistic results, the specific parameter values of each distribution function were determined using observed field data or previous studies. The user charging pattern was characterized by two different probabilities, which are dependent on the vehicle status. The details of this modeling approach are as follows.
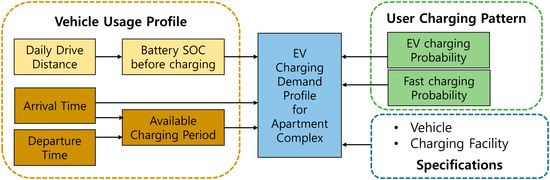
Figure 1.
Diagram of Electric Vehicle (EV) charging demand estimation.
3.2. Vehicle Usage Profile
As the required power demand for EV charging is closely related to the EV battery State-of-Charge (SOC), the charging demand could be predicted using the battery SOC profile. It is expected that more charging energy would be required for EVs that arrive with lower SOC. In this study, the remaining SOC before charging (i.e., the SOC level of an EV that just returned to the apartment complex) of an EV is modeled as:
where is the maximum drive distance of the EV, d is the daily drive distance, and is the number of days since the last charging event [40]. While most previous studies considered SOC models that use only the information of the daily drive distance (d) and the maximum drive distance () [25,45], was included to model the possibility that the EVs in the apartment complex could be not charged after every return. As shown in Equation (1), the daily drive distance is a critical factor that affects the EV charging demand. According to statistical data of the Korea Transportation Safety Authority (TS) [46], the average drive distance in South Korea is 35.8 km. In this study, the daily drive distance was modeled to have a lognormal distribution with the following Probability Density Function (PDF) [47]:
where d is the daily drive distance (d > 0), is the average daily drive distance, and is the standard deviation of the daily drive distance. Figure 2a shows the PDF of the daily drive distance with parameter values of and .
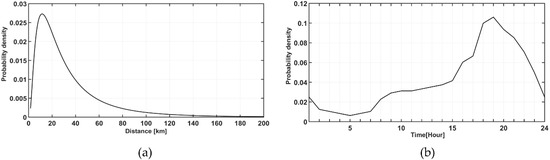
Figure 2.
Probability Density Function (PDF) of variables: (a) daily drive distance; (b) vehicle arrival time.
In addition to the power demand level, a characterization of how the power demand varies during a 24 h period is also necessary. In this study, the profile of the vehicle arrival time to the apartment complex was modeled using data of an actual survey performed at an apartment complex located in Gyeonggi-Do Province, South Korea [48]. The vehicle arrival time and vehicle departure time were modeled to have, respectively, a normal distribution with the following PDF:
where is the PDF of vehicle arrival time, fDT is the PDF of vehicle departure time, and are the average value and standard deviation of the vehicle arrival time, and and are the average value and standard deviation of the vehicle departure time, respectively. The PDF of the vehicle arrival time with parameter values that closely match the data of an actual survey [48] (i.e., , , , and ) is shown in Figure 2b. It can be observed that the number of arriving vehicles shows a sharp increase starting at 3 p.m. and reaches its maximum at 7 p.m. Between 11 p.m. and 7 a.m., there appears to be a limited number of vehicles that arrive. This arrival trend could be explained by the fact that most of the vehicle traffic in a typical apartment complex would closely correspond to the commuting traffic pattern of residents.
3.3. User Charging Pattern
To achieve realistic prediction results, the charging behavior of EV users should also be considered. Depending on the available battery SOC or urgency, for example, it is possible that the user would not perform charging after a trip or perform fast charging instead of slow charging. In this research, the effect of such differences caused by the user charging habit was included in the EV charging demand model by defining two different probabilities. In particular, the probability that an arrived EV is charged and the probability that fast charging is performed are considered as follows.
The effect of an EV user not performing EV charging after arrival was represented by the probability that an EV is charged, pCH. In this research, pCH was modeled to be dependent on the remaining SOC before charging, SOCBC, as follows:
where SOClimit is the minimum threshold SOC value at which the driver would perform charging and A is a coefficient. As an example, values of pCH with different SOC values are shown in Figure A1 of the Appendix A when the parameter values SOClimit = 0.2 and A = 1.25 are considered. It was assumed that the driver would always charge the EV whenever the available SOC value is lower than the SOClimit value. Such constraint on the minimum SOC value was considered as it would be more likely that a typical driver would perform charging when the SOC level is relatively low. In addition, most batteries have a minimum SOC threshold value that should be met to prevent performance degradation caused by excessive discharge [22]. Meanwhile, pCH was modeled to show a continuous decrease as the available SOC level increases. This model characteristic was considered because it is more probable for an EV owner to perform EV charging when less energy is available in the EV battery. Although such a model was considered to characterize the charging behavior of a typical EV user in a simple and straightforward manner, different parameter values or alternative models could also be used.
The remaining SOC level and the available time period for EV charging were assumed to be factors that determine the probability that fast charging is performed, , as follows:
where and are defined as:
where is the available period for EV charging and , , and are the threshold values. Figure 3 shows how pF changes for different values of and with parameter values selected as = 0.5 [h], = 3.5 [h], SOCF = 0.2, B = 0.33, and C = 1.25.
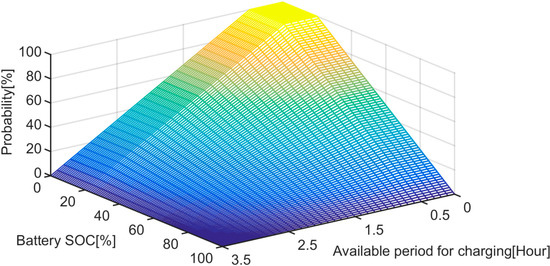
Figure 3.
Probability that fast charging is performed ().
It can be seen that has the highest value when only limited time is available for charging and the remaining SOC before charging is relatively low. That is, fast charging is less likely to occur when the remaining SOC before charging is high and there is sufficient time for charging. As shown in Figure 3, different values are defined even for the same value depending on the available period for charging. While both probabilities that characterize the charging patterns of users, and , could be defined to have different values, such change could be easily adopted in the power demand prediction approach by simply changing the parameter values.
Based on the previously discussed models that characterize the vehicle usage profile and the user charging pattern, the profile of the charging demand for EVs in the apartment complex could be obtained. The overall power demand for EV charging can be computed as
where N is the total number of EVs of the considered apartment complex and Pi(t) is the charging power of the ith EV.
4. Transformer Aging Model
The transformer aging process is affected by various factors, such as electrical loading, temperature, and humidity. While several approaches have been proposed for characterizing DT aging such as Degree of Polymerization (DP) [49,50] and Dissolved Gas Analysis (DGA) [51], this research applied the aging model of the IEEE Standard C57.91 [52]. Considering the effect of temperature to insulation life, the Hottest Spot Temperature (HST) profile is used to obtain the percent LOL based on the aging model of [52] as follows.
Based on the HST information, the aging acceleration factor, FAA, that characterizes the level of DT aging is calculated as
where is the HST. The HST can be expressed as a sum of three terms [52]:
where is the ambient temperature (with the transformer being off), is the temperature rise of top-oil, and is the rise of the hot spot temperature over top-oil. The dynamics of terms that characterize the temperature rise (i.e., and ) are written as
where is the ultimate top-oil rise over ambient temperature, is the initial top-oil rise over ambient temperature, is the oil time constant, is the ultimate winding hottest-spot rise over top-oil temperature, is the initial winding hottest-spot rise over top-oil temperature, is the winding time constant at the hot spot location, and is the time period of load. The ultimate top-oil rise, , and the ultimate winding hottest-spot rise, , are expressed as
where is the top-oil rise over ambient temperature at the rated load, n is an exponent, is the winding hottest-spot rise over top-oil temperature at the rated load, m is an exponent, R is the ratio of load loss at the rated condition to no-load loss, and kt is the ratio of ultimate load to rated load.
As the HST profile depends on the instantaneous load level during the overall operation period, the equivalent aging factor, , for the overall operation period is defined as
where is the aging acceleration factor for the temperature that exists during time interval , and N is the total number of time periods. The transformer LOL is calculated as
where t is the overall time period and Ln is the normal insulation life. The typical value of Ln is considered to be 180,000 h [52].
5. PV Integration for Mitigation of Transformer Aging
5.1. Characteristics of DT Aging
Considering that DT aging is affected by the operational stress profile, the DT loading level would have a strong impact on aging. In particular, the effect of additional power demand introduced by EV charging on DT aging could be discussed based on an illustrative example as follows.
In Figure 4, the effect of different loading levels to both HST and LOL for a sample DT is illustrated. The specific parameter values of the DT were selected based on data from previous studies on DT [53,54] such as n = 0.9, m = 0.8, , , , R = 5, , , , and min. For the same DT, three different electrical loading conditions (i.e., points A, B, and C of Figure 4) were considered. By comparing HST and LOL for the considered conditions, it is obvious that the DT experiences faster aging at higher electrical loading. In the case of an apartment complex with significant EV penetration, both the base load (i.e., load demand without EV charging demand) and the additional demand for EV charging would introduce a noticeable aging effect to the DT. As the DT serves as the main electrical interface between the power grid and the apartment complex, it is obvious that the DT would experience higher operational stress with massive EV charging. Considering that the level of loading for the DT is determined by the electrical load demand, installation of additional energy sources (e.g., PV panels installed at the building roof or energy storage installed at the apartment complex) would contribute to the reduction in electrical stress. This effect can be achieved because the local demand of both the base load and the EV charging demand could also be handled by the output of additional power sources instead of only the DT. In addition, it is necessary to highlight that a nonlinear relationship between the DT LOL and the DT loading exists, as shown in Figure 4. While the same 20% increment in DT loading is introduced during the transitions from Point C to Point B (C→B) and from Point B to Point A (B→A), a significant difference in the LOL value change between the two transitions could be observed. That is, the contribution of a reduced loading level to DT reliability seems to be more apparent when the DT is heavily loaded. Such a difference in the effectiveness of loading adjustment to DT reliability could be explained by the exponential relationship between the aging acceleration factor and the HST.
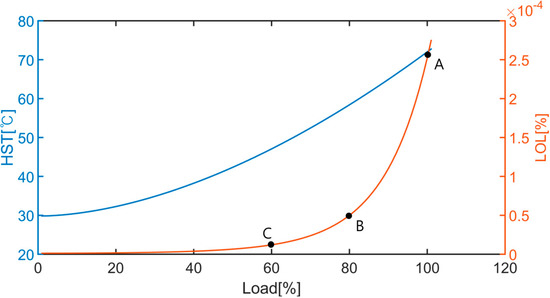
Figure 4.
Hottest Spot Temperature (HST) and Loss of Life (LOL) of an example Distribution Transformer (DT) for different loading conditions.
5.2. Approaches for PV Integration
To mitigate the DT aging caused by EV charging demand in an apartment complex, this research considers the installation of PV sources in the apartment complex. In fact, the integration of PV sources has been recently considered for sustainable residential buildings in highly populated districts [17,30] or net zero energy buildings [55]. In particular, this study considers two approaches of PV integration for apartment complexes as shown in Figure 5. While both approaches use PV sources to achieve decreased DT loading, the main difference is whether the power support from PV sources is performed instantaneously or with an intentional delay through power management. The details of each approach are explained as follows.
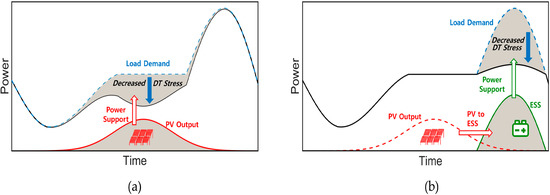
Figure 5.
Photovoltaic (PV) integration approaches: (a) Passive Integration (PPI); (b) Active Integration (API).
The operation principle of the Passive PV Integration (PPI) approach is shown in Figure 5a. In this approach, the power generated from PV sources is directly used to reduce the instantaneous DT loading level. In such cases, the electrical power handled by the DT could be expressed as
where Pbase is the base electrical load, PEV is the power demand required for EV charging, PPV is the PV source output power and Pload is the overall load demand power. Owing to the PV integration, the level of DT loading could be decreased from Pload to Pload -PPV (i.e., the difference between the load power and the PV output power). Such a reduced loading level would contribute to lowering the DT aging acceleration factor, FAA, as a result of HST decrease. It is worth noting that when the condition of PPV > Pload (i.e., the PV output is larger than the demand load power) occurs, it could be necessary to perform curtailment of PV output to prevent potential overvoltage issues [56,57].
An alternative approach for PV integration could be considered as follows. With the Active PV Integration (API) approach, the power generated from the PV sources is first used to charge the Energy Storage System (ESS) instead of being immediately used as illustrated in Figure 5b. Once predefined conditions are satisfied, the ESS operates in discharging mode so that the DT loading is reduced by the support from the discharged ESS power. While the ESS discharging conditions could be defined depending on various factors, this research considered an approach where the ESS starts to discharge at a fixed instant. In such cases, the power handled by the DT with the API approach could be written as
where PESS is the ESS output power when the ESS operates in discharging mode. In this case, the level of DT loading would decrease from the overall load level (Pload) to the value of Pload-PESS. Similar to the PPI approach, as the loading decreases, DT aging can be decelerated. In addition, a relationship linked to the effectiveness for achieving reduced DT loading with the considered API approach could be written as
where tds is the start time of ESS discharging, tde is the end time of ESS discharging, QO is the initial SOC, CO is the battery capacity in kWh, tcs is the start time of ESS charging, and tce is the end time of ESS charging. That is, it is possible to expect effective support by the ESS for DT loading reduction provided the ESS could discharge. Assuming that the battery is discharged at a constant power level and that the ESS is charged while the PV output is available, the effectiveness of the API approach would be determined by the start time of ESS discharge (tds) and the solar irradiation profile. Although the installation and management of the ESS are required, the API approach was considered in this research based on the observation from Figure 4 that the DT would experience accelerated aging when the DT loading is high. As the residential load power typically reaches its peak value when only limited solar irradiation is available, a more effective use of PV power could be realized using the API approach.
6. Verification Results
6.1. System Configuration and Methodology
To study the effect of EV charging demand on DT aging, an apartment complex with 1000 households was considered as shown in Figure A2 of the Appendix A. The apartment complex consists of 15 apartments, thus representing a typical collective housing complex in South Korea. The local map of the considered apartment complex, the Samsung Raemian Pore Apartment Complex in Jagok-Dong, is shown in Figure 6 and it was assumed that an area of 10,300 m2 is available for PV panel installation. Regarding the simulation of EV charging, data of Hyundai IONIQ with a 28-kWh battery was used. In this study, three different EV penetration ratios (i.e., 10%, 20%, and 30%) were assumed, considering that various countries have established national policies to increase the market share of EVs to 30% by 2030 [58]. Considering the specification of EV charging stations in the Republic of Korea, charging powers of 7.7 kW and 50 kW were assumed for slow charging and fast charging, respectively. As ESS installation is required for the API approach, it was assumed that a Battery Energy Storage System (BESS) with a capacity of 2 MWh is installed.
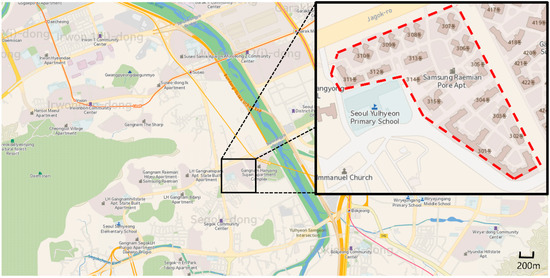
Figure 6.
Local map of the considered apartment complex.
While MATLAB was used for performing the simulation, the effects of EV charging demand, and different PV integration approaches on DT aging were studied as follows. As DT aging is determined by the thermal stress, the DT loading profile was obtained based on profiles of the base load demand, EV charging demand, and PV output. The EV charging demand profile for the considered penetration ratios was obtained using the approach of Section 3. The effects of different EV penetration ratios and PV integration approaches on DT aging were studied by comparing the DT LOL based on the transformer aging model of Section 4.
The PV output profile considered in this research is shown in Figure 7. The profile of Figure 7 is based on the monitored data of a PV generation source on 27 August, 2017, retrieved from a public data portal of the Republic of Korea [59]. The base load profile is also shown in Figure 7. The load profile was obtained from publicly available realistic data (i.e., the average load demand of an actual apartment complex [48] and the load pattern of statistical data for residential loads [60]). In Figure 7, it can be observed that the PV output power reaches its maximum value, 310 kW, at 1 p.m. The load demand reaches its maximum and minimum levels at approximately 9 p.m. and 3 a.m., respectively, as shown in Figure 7. While the PV output power is affected by solar irradiation, the load demand would be closely related to the daily activity of residents. It is worth noting that only a limited level of PV power is available for the period when the load demand reaches its maximum. In addition, the maximum PV output power is only 35% of the maximum load power demand. It is noteworthy that such an analysis of the PV output profile is based on monitored data for the considered date in the Republic of Korea. Although the PV output characteristics could differ depending on various factors, such as seasonal variations [61], cloud movement [62], ambient conditions [63], and PV cell characteristics [64], the effects of such specific factors were not further considered. In the case of research for other areas, it might be necessary to consider in detail the effect of these factors, depending on the availability of PV output power data.
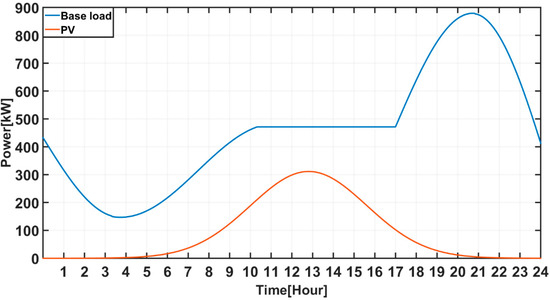
Figure 7.
Simulated PV production profile.
6.2. Impact of EV Charging Demand
The effect of different EV penetration ratios on the overall power demand of the apartment complex is shown in Figure A3 of the Appendix A. To visualize the effect of EV charging demand, the base load profile is also shown in Figure A3. The specific parameter values considered for simulating the EV charging profile were selected as and , , , , , SOClimit = 0.2, A = 1.25, = 0.5 [h], = 3.5 [h], SOCF = 0.2, B = 0.33, and C = 1.25.
From Figure A3, a noticeable increase in the load demand with EV charging compared to the base load case has occurred during the period of 2–11 p.m. In the case of the maximum power demand level, the load demand of the 30% EV penetration ratio case is 39.7% larger than that of the base load case. While the daily average load demand of the 30% EV penetration ratio case is 33.5% larger than the base load case, the impact of EV charging on the overall load demand is rather limited during the period of 0–8 a.m. The minimal difference during this period could be explained by the negligible demand for EV charging. The fact that most of the EVs would return to the apartment complex and resume EV charging between 5 p.m. and 10 p.m., as shown in the realistic vehicle arrival data presented in Figure 2b, could also explain the different level of impacts during a 24 h period.
Based on the predicted power demand profile, the corresponding HST profile for the DT was obtained, as shown in Figure A4 of the Appendix A. Similar to the power demand pattern, the maximum HST of the 30% EV penetration ratio case is more than 10° higher than that of the base load case. As the effect of EV charging to the power demand was negligible during the period of 0–8 a.m., the HST profile for all cases seem to be nearly identical during this period. The LOL profile with different EV penetration ratios was computed as shown in Figure 8. As can be observed in Figure 8, EV charging introduced a noticeable effect on DT aging. With only a 10% EV penetration ratio, the LOL increased to a level that is 1.6 times larger than that of the base load case. Furthermore, the LOL increased to a value that is nearly 2.4 times larger than the base load case for the 30% EV penetration case. Because of the exponential relationship between the HST and the LOL, a rather limited level of EV utilization caused a noticeable effect on DT aging. Such impacts caused by EV charging should be highlighted for infrastructure management and power system operation in residential districts that consist of apartment buildings with considerable EV utilization.
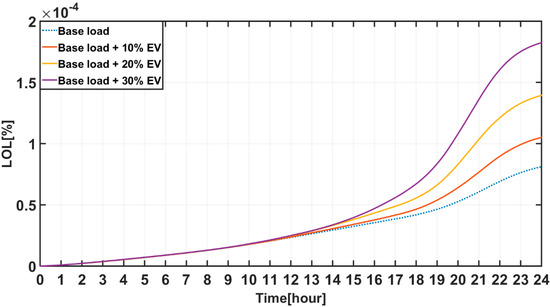
Figure 8.
LOL profile with different EV penetration ratio.
For comparison purposes, profiles of both the PV output and the overall load demand are also shown in Figure A3 of the Appendix A. Although the load demand cannot be completely covered only by the PV output, the PV output power could be used to reduce the burden of the DT for handling the power flow from the grid to the apartment complex. In addition, a time difference exists between the instants when the PV output is maximum and when the load demand is maximum. For example, the PV output is maximum at 1 p.m. and the base load level reaches its maximum value at 9 p.m. Even when EV charging demand is included, it is evident that the time difference between the two maximum instants still exists. When the PPI approach is considered for DT aging mitigation, the operational stress level of the DT is directly affected by the instantaneous power difference between PV output and load demand. In the case of the API approach, the installation of energy storage was considered based on the observation that such a time difference between the PV output maximum instant and the load maximum instant exists under realistic conditions. The energy storage enables the effective use of solar energy by discharging the stored energy when the load demand is actually high. Compared to the PPI approach, such flexibility in power management contributes to further mitigation of DT aging when the API approach is applied.
6.3. Effectiveness of PV Integration
The effect of different PV integration approaches to DT loading is shown in Figure 9. For Figure 9, the profile of Figure 7 was assumed for PV output power and a 20% EV penetration ratio was considered. As DT loading is determined by the load demand and the instantaneous PV output with the PPI approach, a decrease in the DT loading level compared to the original DT loading level was observed as long as the PV output exists. Such a decrease in loading would contribute to increased DT reliability by reducing the aging rate. The DT loading with the API approach being applied to an identical system is also shown. For the API approach of Figure 9, it was assumed that the BESS started its discharge at 4 p.m. As shown in Figure 9, the main difference between the PPI approach and the API approach is the period when the decrease in DT loading occurs. While the PPI approach contributes to DT stress alleviation according to the solar irradiation profile, the API approach enabled a shift in stress reduction to later periods.
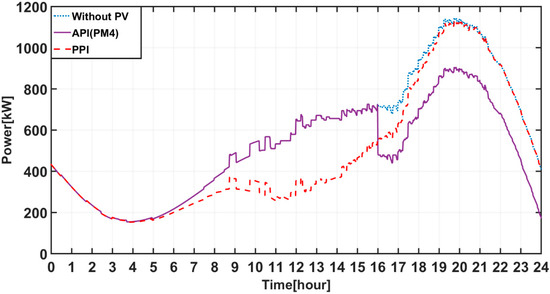
Figure 9.
DT loading with different PV integration approaches (EV penetration ratio: 20%).
As the DT loading would vary depending on when the BESS discharge is initiated, three different discharge start times (i.e., 3 p.m., 4 p.m., and 5 p.m.) were considered, as shown in Figure 10. As the amount of power that should be handled by the DT is reduced during the BESS discharge, a decrease in the DT loading is observed when the BESS starts to discharge. As shown in Figure 9 and Figure 10, the reduction in the DT loading level occurred at different time periods depending on the PV integration approach. A decrease in DT loading was achieved from 5 a.m. to 7 p.m. using the PPI approach, and the API approach was able to decrease DT loading when the load demand was relatively high (i.e., 5 p.m. to 11 p.m.). Although the PPI approach could be implemented in a simpler manner than the API approach, it fails to lower the DT loading when the load demand reaches its peak. Such a limitation could be explained by the time difference between the instants when the maximum PV output is generated and when the load demand reached its maximum.
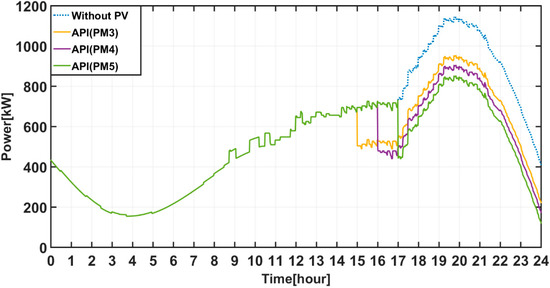
Figure 10.
Effect of different discharging time to DT loading (EV penetration ratio: 20%).
The DT LOL in the considered apartment complex with different PV integration approaches is shown in Figure 11. It was assumed that the EV penetration ratio was 20%. As shown in Figure 11, the DT LOL without any PV integration showed a rapid increase starting at 5 p.m., where both the base load and the EV charging demand increased. As illustrated in Figure 11, it can be seen that the integration of PV sources contributes to increased DT reliability in both the PPI and API approaches. For the considered 24 h period, the LOL with the API approach was the lowest among the considered scenarios. While the PPI approach realized a 17% decrease in LOL, a decrease between 33% and 38% was achieved with the API approach compared to the case without any PV integration. While the LOL with the PPI approach was lower than the LOL with the API approach until 8 p.m., the effectiveness of the API approach for realizing decreased DT aging was confirmed after 8 p.m. Thus, it can be seen that the effectiveness of PV integration to DT reliability is highly affected by the PV operation strategy.
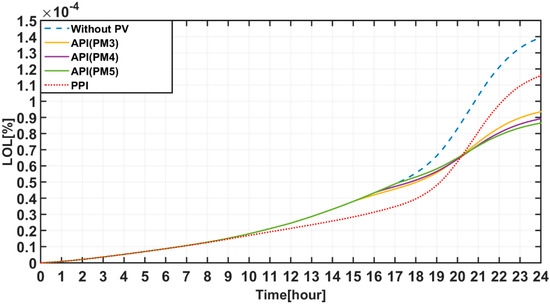
Figure 11.
LOL profile with different PV integration approaches (EV penetration ratio: 20%).
Depending on the PV operation approach, different levels of improvement in DT LOL were achieved due to the nonlinear relationship between DT loading and DT LOL. As shown in Figure 4, the effect of reduced DT stress on increased lifetime becomes noticeable at higher DT loading levels. With the PPI approach, the power assist provided by the PV output would reach its maximum when the PV output is the highest, instead of when the load demand is at its peak. As shown in Figure A3, however, the power demand of an apartment complex reaches its maximum between 7 p.m. and 9 p.m. For the PPI approach, it appears that the PV power is used to reduce DT loading when the DT does not operate at its maximum loading. It is worth noting that the effectiveness of reducing the DT loading for achieving lower DT LOL is limited when the DT loading is low. On the contrary, the API approach realizes the effective use of PV output power by shifting the period of PV power assistance through the use of BESS. Instead of simply supporting the DT when the DT loading is relatively low, the BESS enabled effective use of the same PV power by discharging the stored PV generated energy when the DT loading reaches a noticeable level. As a result, the same PV power could be used in a more effective manner from the perspective of DT aging.
The effectiveness of different PV integration approaches to DT reliability are presented in Table 1 and Table 2. Table 1 shows how the DT LOL for a 24 h period is affected by different PV operation strategies with various EV penetration ratios. In Table 2, the decrease rate of LOL values compared to the case without PV integration is presented. For both the PPI and the API approaches, it can be observed that a lower LOL could be achieved by integrating PV sources. For instance, for an EV penetration ratio of 30%, decrease rates of 18.4% and 41.8% were achieved in the LOL as a result of applying the PPI and the API (when BESS discharge was started at 5 p.m.) approaches, respectively, compared to the approach without PV source integration. Additionally, both PPI and API approaches exhibited higher effectiveness in achieving reduced DT aging as the EV penetration ratio increased, as presented in Table 2. Although the amount of contribution differs depending on the details of the PV integration approach, a noticeable increase in the decrease rate could be observed as the EV penetration ratio increased from 10% to 30%. This could be explained as follows: Higher EV penetration ratio results in increased power demand, and the DT LOL increases exponentially with the DT loading level. A more apparent contribution of power support by the PV sources to DT stress reduction would be achieved at heavier load conditions. In this study, such a heavy load condition was introduced by larger EV charging demand and higher EV penetration ratio.

Table 1.
Comparison of DT LOL (10−4 %) for a 24 h period.
Table 2.
Decrease rate of DT LOL (%) for the cases of Table 1.
7. Conclusions
Due to the increasing use of EVs, concerns relevant to the impact of EV charging power demand on the power grid should be addressed appropriately. Considering that the aging of power infrastructure is considerably affected by operational stress, the effect of EV charging on DT aging in an apartment complex was studied. An EV charging power demand model for an apartment complex was presented. The EV charging demand was predicted based on stochastic models of specific factors that characterize the vehicle usage and driver charging patterns. In addition, two PV integration approaches that contribute to DT reliability were studied. The effect of different EV penetration ratios and PV integration approaches to DT aging were studied using the developed EV charging demand model and the IEEE C57.91 aging model.
The maximum power demand of the considered apartment complex increased by 15%, 30%, and 40% compared to the base load case for EV penetration ratios of 10%, 20%, and 30%. As a result of this increased load demand, there was a 40% increase in the DT LOL for the EV penetration ratio of 30%, compared to the case without EV charging. These results demonstrate that a continuous increase in EV charging demand could result in accelerated DT aging. With the power support provided by the PV source, a decrease in the LOL was achieved regardless of the PV integration approach. With the PPI approach, a decrease of approximately 20% in the LOL was observed as the EV penetration ratio increased to 30% This decrease can be attributed to the reduced DT loading facilitated via the power assist of PV sources. It was shown that a more effective use of PV power could be realized by the API approach, which requires the installation of energy storage. Instead of being directly affected by the instantaneous irradiation level, the API approach realized a larger decrease in the DT LOL compared to the PPI approach, by discharging stored energy when the load demand reached its peak level. Although the level of effectiveness differs depending on specific parameter values, the verification results showed that DT aging could be reduced by 41.8% using the API approach. It is also necessary to highlight that the effectiveness of PV integration for achieving reduced transformer aging becomes more apparent at higher EV penetration ratios.
The results of this study demonstrate the significant effect of EV charging demand on both the overall power demand and transformer aging. Although the operation of EVs would contribute to transportation sustainability, necessary actions should be carried out to ensure that the infrastructures could accommodate the increased charging power demand. In addition, the integration of PV sources in an apartment complex not only contributes to sustainability but could also play an essential role in the economic operation of power system infrastructures in highly populated residential buildings with noticeable EV charging. Considering the increasing interest in sustainable and smart city development, it is recommended to consider the effect of both EV charging demand and intelligent PV integration approaches during the planning stage of power networks, construction of apartment complexes, and formulation of government policies.
In the future, research on mitigation of the effects of higher EV penetration ratios will be performed. For cases with a larger EV penetration, the issues caused by EV charging could require an integrated approach involving various technologies such as EV scheduling, V2G, effective price incentive mechanisms, and multiobjective optimization. Further research on the effect of different factors that affect the output of PV sources, such as the solar cell type, seasonal effect, and power conversion efficiency, would also need to be included for a detailed analysis. Based on the analysis results, further work on optimized system designs (e.g., sizing of the PV sources and energy storage) would also be performed.
Author Contributions
Conceptualization, S.G.L. and M.K.; Methodology, S.-K.H.; Analysis, M.K. and S.-K.H.; Writing—Original Draft Preparation, S.-K.H. and M.K.; Writing—Review and Editing, S.G.L.; Visualization, S.-K.H.; Supervision, M.K. All authors have read and agreed to the published version of the manuscript.
Funding
This research was supported by the Basic Research Program through the National Research Foundation of Korea (NRF), funded by the Ministry of Education (Grant Number: 2017R1D1A1B03031723). In addition, this research was supported by the National Research Foundation of Korea (NRF) grant funded by the Korea government (MIST: Ministry of Science and ICT, No: NRF-2020R1C1C1011572).
Conflicts of Interest
The authors declare no conflicts of interest.
Abbreviations
| EV | Electric Vehicle |
| DT | Distribution Transformer |
| PV | Photovoltaic |
| LOL | Loss of Life |
| CFI | Carbon Free Island |
| HEMS | Home Energy Management System |
| V2G | Vehicle-to-Grid |
| SOC | State-of-Charge |
| TS | Transportation Safety Authority |
| Probability Density Function | |
| DP | Degree of Polymerization |
| DGA | Dissolved Gas Analysis |
| HST | Hottest Spot Temperature |
| PPI | Passive PV Integration |
| API | Active PV Integration |
| ESS | Energy Storage System |
| BESS | Battery Energy Storage System |
Nomenclature
| SOCBC | Remaining SOC before charging |
| SOC | Battery state-of-charge |
| Number of days since the last charging event | |
| d | Daily drive distance |
| Maximum drive distance | |
| Average daily drive distance | |
| Standard deviation of the daily drive distance | |
| PDF of vehicle arrival time | |
| PDF of vehicle departure time | |
| Average value of the vehicle arrival time | |
| Standard deviation of the vehicle arrival time | |
| Average value of the vehicle departure time | |
| Standard deviation of the vehicle departure time | |
| Probability of battery charging | |
| SOClimit | Minimum threshold SOC value |
| A | Coefficient used for probability |
| Probability of fast charging | |
| Time part of Probability for fast charging | |
| SOC part of Probability for fast charging | |
| Available period for EV charging | |
| Minimum threshold value of | |
| Maximum threshold value of | |
| Threshold value of battery SOC | |
| C | Coefficient used for probability |
| Overall power demand for EV charging | |
| Pi(t) | Charging power of the ith EV |
| FAA | Aging acceleration factor |
| Hot spot temperature | |
| Ambient temperature | |
| Temperature rise of top-oil | |
| Rise of the hot spot temperature over top-oil | |
| Ultimate top-oil rise over ambient temperature | |
| Initial top-oil rise over ambient temperature | |
| Time period of load | |
| Oil time constant | |
| Ultimate winding hottest-spot rise over top-oil temperature | |
| Initial winding hottest-spot rise over top-oil temperature | |
| Winding time constant | |
| Top-oil rise over ambient temperature at rated load | |
| Winding hottest-spot rise over top-oil temperature at rated load | |
| n | Exponent used for |
| m | Exponent used for |
| R | Ratio of load loss at rated condition to no-load loss |
| kt | Ratio of ultimate load to rated load |
| Equivalent aging factor | |
| Aging acceleration factor for the temperature that exists during time interval | |
| Time interval | |
| Loss of Life | |
| Ln | Normal insulation life |
| Distribution transformer load | |
| Base load demand | |
| Power demand required for EV charging | |
| PV source output power | |
| Overall load demand power | |
| ESS output power | |
| QO | Initial SOC |
| CO | Battery capacity in kWh |
| tds | Start time of ESS discharging |
| tde | End time of ESS discharging |
| tcs | Start time of ESS charging |
| tce | End time of ESS charging |
Appendix A

Figure A1.
Probability that an EV is charged (pCH) with SOClimit = 0.2 and A = 1.25.

Figure A2.
Configuration of apartment complex.

Figure A3.
Load demand with different EV penetration ratios.

Figure A4.
HST profile with different EV penetration ratios.
References
- Bila, C.; Sivrikaya, F.; Khan, M.A.; Albayrak, S. Vehicles of the Future: A Survey of Research on Safety Issues. IEEE Trans. Intell. Transp. Syst. 2017, 18, 1046–1065. [Google Scholar] [CrossRef]
- Rajashekara, K. Present Status and Future Trends in Electric Vehicle Propulsion Technologies. IEEE J. Emerg. Sel. Top. Power Electron. 2013, 1, 3–10. [Google Scholar] [CrossRef]
- Wintersberger, S.; Azmat, M.; Kummer, S. Are We Ready to Ride Autonomous Vehicles? A Pilot Study on Austrian Consumers’ Perspective. Logistics 2019, 3, 20. [Google Scholar] [CrossRef]
- Zhou, H.; Xu, W.; Chen, J.; Wang, W. Evolutionary V2X Technologies Toward the Internet of Vehicles: Challenges and Opportunities. Proc. IEEE 2020, 18, 308–323. [Google Scholar] [CrossRef]
- Azmat, M.; Kummer, S. Potential applications of unmanned ground and aerial vehicles to mitigate challenges of transport and logistics-related critical success factors in the humanitarian supply chain. Asian J. Sustain. Soc. Responsib. 2020, 5, 1–22. [Google Scholar] [CrossRef]
- Vaidian, I.; Azmat, M.; Kummer, S. Impact of Internet of Things on Urban Mobility. In Proceedings of the Innovation Arabia 12, Dubai, UAE, 24–27 February 2019. [Google Scholar]
- Hagman, J.; Ritzén, S.; Stier, J.J.; Susilo, Y. Total cost of ownership and its potential implications for battery electric vehicle diffusion. Res. Transp. Bus. Manag. 2016, 18, 11–17. [Google Scholar] [CrossRef]
- Chang, D.-S.; Chen, S.-H.; Hsu, C.-W.; Hu, A.H.; Tzeng, G.-H. Evaluation Framework for Alternative Fuel Vehicles: Sustainable Development Perspective. Sustainability 2015, 7, 11570–11594. [Google Scholar] [CrossRef]
- Lu, X.; Ota, K.; Dong, M.; Yu, C.; Jin, H. Predicting Transportation Carbon Emission with Urban Big Data. IEEE Trans. Sustain. Comput. 2017, 2, 333–344. [Google Scholar] [CrossRef]
- Pojani, D.; Stead, D. Policy design for sustainable urban transport in the global south. Policy Des. Pract. 2018, 1, 90–102. [Google Scholar] [CrossRef]
- Muñoz-Villamizar, A.; Montoya-Torres, J.R.; Faulin, J. Impact of the use of electric vehicles in collaborative urban transport networks: A case study. Transp. Res. Part D Transp. Environ. 2017, 50, 40–54. [Google Scholar] [CrossRef]
- Electric Autonomy Canada. Electric Vehicle Sales Forecast and the Charging Infrastructure Required Through 2030. Available online: https://electricautonomy.ca/2019/03/05/electric-vehicle-sales-forecast-and-the-charging-infrastructure-required-through-2030/ (accessed on 15 January 2020).
- Yang, H.-J.; Jung, J.-W.; Baatarbileg, A.; Kim, T.-H.; Park, K.-H.; Lee, G.-M. Study on EV charging infrastructure in Jeju Island. In Proceedings of the 2018 5th International Conference on Renewable Energy: Generation and Applications (ICREGA), Al Ain, UAE, 25–28 February 2018. [Google Scholar]
- Park, E.; Kim, K.J.; Kwon, S.J.; Han, T.; Na, W.S.; Del Pobil, A.P. Economic Feasibility of Renewable Electricity Generation Systems for Local Government Office: Evaluation of the Jeju Special Self-Governing Province in South Korea. Sustainability 2017, 9, 82. [Google Scholar] [CrossRef]
- Hilshey, A.D.; Hines, P.D.H.; Rezaei, P.; Dowds, J.R. Estimating the Impact of Electric Vehicle Smart Charging on Distribution Transformer Aging. IEEE Trans. Smart Grid 2013, 4, 905–913. [Google Scholar] [CrossRef]
- Dubey, A.; Santoso, S. Electric Vehicle Charging on Residential Distribution Systems: Impacts and Mitigations. IEEE Access 2015, 3, 1871–1893. [Google Scholar] [CrossRef]
- Roberts, M.B.; Bruce, A.; Macgill, I. PV in Australian Apartment Buildings—Opportunities and Barriers. In Proceedings of the Asia Pacific Solar Research Conference, Brisbane, Australia, 8–9 December 2015. [Google Scholar]
- Shijun, Y.; Hongxing, Y. The potential electricity generating capacity of BIPV in Hong Kong. In Proceedings of the Conference Record of the Twenty Sixth IEEE Photovoltaic Specialists Conference—1997, Anaheim, CA, USA, 29 September–3 October 1997. [Google Scholar]
- Ham, S.; Lee, H. Topological Transitions in Collective Housing Units of South Korea. Sustainability 2017, 9, 31. [Google Scholar] [CrossRef]
- Affonso, C.M.; Kezunovic, M. Probabilistic Assessment of Electric Vehicle Charging Demand Impact on Residential Distribution Transformer Aging. In Proceedings of the 2018 IEEE International Conference on Probabilistic Methods Applied to Power Systems (PMAPS), Boise, ID, USA, 24–28 June 2018. [Google Scholar]
- Arias, M.B.; Kim, M.; Bae, S. Prediction of electric vehicle charging-power demand in realistic urban traffic networks. Appl. Energy 2017, 195, 738–753. [Google Scholar] [CrossRef]
- Affonso, C.D.M.; Kezunovic, M. Technical and Economic Impact of PV-BESS Charging Station on Transformer Life: A Case Study. IEEE Trans. Smart Grid 2019, 10, 4683–4692. [Google Scholar] [CrossRef]
- Santo, J.P.A.E.; Godina, R.; Rodrigues, E.M.G.; Pouresmaeil, E.; Catalão, J.P.S. EV charging effect on a distribution transformer supplying a factory with local PV generation. In Proceedings of the 2017 IEEE Manchester PowerTech, Manchester, UK, 18–22 June 2017. [Google Scholar]
- Aravinthan, V.; Argade, S. Optimal transformer sizing with the presence of electric vehicle charging. In Proceedings of the 2014 IEEE PES T&D Conference and Exposition, Chicago, IL, USA, 14–17 April 2014. [Google Scholar]
- Godina, R.; Rodrigues, E.M.G.; Matias, J.C.O.; Catalão, J.P.S. Smart electric vehicle charging scheduler for overloading prevention of an industry client power distribution transformer. Appl. Energy 2016, 178, 29–42. [Google Scholar] [CrossRef]
- Paterakis, N.G.; Pappi, I.N.; Erdinç, O.; Godina, R.; Rodrigues, E.M.G.; Catalão, J.P.S. Consideration of the Impacts of a Smart Neighborhood Load on Transformer Aging. IEEE Trans. Smart Grid 2016, 7, 2793–2802. [Google Scholar] [CrossRef]
- Quirós-Tortós, J.; Ochoa, L.F.; Alnaser, S.W.; Butler, T. Control of EV Charging Points for Thermal and Voltage Management of LV Networks. IEEE Trans. Power Syst. 2016, 31, 3028–3039. [Google Scholar] [CrossRef]
- Van Roy, J.; Leemput, N.; Geth, F.; Salenbien, R.; Büscher, J.; Driesen, J. Apartment Building Electricity System Impact of Operational Electric Vehicle Charging Strategies. IEEE Trans. Sustain. Energy 2014, 5, 264–272. [Google Scholar] [CrossRef]
- Mobarak, M.H.; Bauman, J. Vehicle-Directed Smart Charging Strategies to Mitigate the Effect of Long-Range EV Charging on Distribution Transformer Aging. IEEE Trans. Transp. Electrif. 2019, 5, 1097–1111. [Google Scholar] [CrossRef]
- Elinwa, U.K.; Radmehr, M.; Ogbeba, J.E. Alternative Energy Solutions Using BIPV in Apartment Buildings of Developing Countries: A Case Study of North Cyprus. Sustainability 2017, 9, 1414. [Google Scholar] [CrossRef]
- Deb, S.; Tammi, K.; Kalita, K.; Mahanta, P. Impact of Electric Vehicle Charging Station Load on Distribution Network. Energies 2018, 11, 178. [Google Scholar] [CrossRef]
- Moses, P.S.; Masoum, M.A.S.; Smedley, K.M. Harmonic losses and stresses of nonlinear three-phase distribution transformers serving Plug-In Electric Vehicle charging stations. In Proceedings of the ISGT 2011, Anaheim, CA, USA, 17–19 January 2011. [Google Scholar]
- Pillai, J.R.; Bak-Jensen, B. Impacts of electric vehicle loads on power distribution systems. In Proceedings of the 2010 IEEE Vehicle Power and Propulsion Conference, Lille, France, 1–3 September 2010. [Google Scholar]
- Zhang, S.; Ai, X.; Liang, W.; Dong, R. The influence of the electric vehicle charging on the distribution network and the solution. In Proceedings of the 2014 IEEE Conference and Expo Transportation Electrification Asia-Pacific (ITEC Asia-Pacific), Beijing, China, 31 August–3 September 2014. [Google Scholar]
- Luo, X.; Chan, K.W. Real-time scheduling of electric vehicles charging in low-voltage residential distribution systems to minimise power losses and improve voltage profile. IET Gener. Transm. Distrib. 2014, 8, 516–529. [Google Scholar] [CrossRef]
- Leou, R.; Su, C.; Lu, C. Stochastic Analyses of Electric Vehicle Charging Impacts on Distribution Network. IEEE Trans. Power Syst. 2014, 29, 1055–1063. [Google Scholar] [CrossRef]
- Razeghi, G.; Zhang, L.; Brown, T.; Samuelsen, S. Impacts of plug-in hybrid electric vehicles on a residential transformer using stochastic and empirical analysis. J. Power Sources 2014, 252, 277–285. [Google Scholar] [CrossRef]
- Rutherford, M.J.; Yousefzadeh, V. The impact of Electric Vehicle battery charging on distribution transformers. In Proceedings of the 2011 Twenty-Sixth Annual IEEE Applied Power Electronics Conference and Exposition (APEC), Fort Worth, TX, USA, 6–11 March 2011. [Google Scholar]
- Turker, H.; Bacha, S.; Chatroux, D.; Hably, A. Low-Voltage Transformer Loss-of-Life Assessments for a High Penetration of Plug-In Hybrid Electric Vehicles (PHEVs). IEEE Trans. Power Deliv. 2012, 27, 1323–1331. [Google Scholar] [CrossRef]
- Qian, K.; Zhou, C.; Yuan, Y. Impacts of high penetration level of fully electric vehicles charging loads on the thermal ageing of power transformers. Int. J. Electr. Power Energy Syst. 2015, 65, 102–112. [Google Scholar] [CrossRef]
- Vicini, R.; Micheloud, O.; Kumar, H.; Kwasinski, A. Transformer and home energy management systems to lessen electrical vehicle impact on the grid. IET Gener. Transm. Distrib. 2012, 6, 1202–1208. [Google Scholar] [CrossRef]
- Gong, Q.; Midlam-Mohler, S.; Serra, E.; Marano, V.; Rizzoni, G. PEV Charging Control Considering Transformer Life and Experimental Validation of a 25 kVA Distribution Transformer. IEEE Trans. Smart Grid 2015, 6, 648–656. [Google Scholar] [CrossRef]
- Olsen, D.J.; Sarker, M.R.; Ortega-Vazquez, M.A. Optimal Penetration of Home Energy Management Systems in Distribution Networks Considering Transformer Aging. IEEE Trans. Smart Grid 2018, 9, 3330–3340. [Google Scholar] [CrossRef]
- Shokrzadeh, S.; Ribberink, H.; Rishmawi, I.; Entchev, E. A simplified control algorithm for utilities to utilize plug-in electric vehicles to reduce distribution transformer overloading. Energy 2017, 133, 1121–1131. [Google Scholar] [CrossRef]
- Godina, R.; Rodrigues, E.M.G.; Paterakis, N.G.; Erdinc, O.; Catalão, J.P.S. Innovative impact assessment of electric vehicles charging loads on distribution transformers using real data. Energy Convers. Manag. 2016, 120, 206–216. [Google Scholar] [CrossRef]
- Korean Statistical Information Service. Driving Distance Statistics. Available online: http://kosis.kr/statHtml/statHtml.do?orgId=426&tblId=DT_426001_N004 (accessed on 15 January 2020).
- Yang, Z.; Liao, Q.; Tang, F.; Peng, S.; Fang, F.; Xu, Y. Dispatch of EV loads in active distribution network considering energy storage characteristic. In Proceedings of the 2017 IEEE Conference on Energy Internet and Energy System Integration (EI2), Beijing, China, 26–28 November 2017. [Google Scholar]
- Choi, J.; Kim, S.-J.; Lee, J. A Study on the Transformer Spare Capacity in the Existing Apartments for the Future Growth of Electric Vehicles. Trans. Korean Inst. Electr. Eng. 2016, 65, 1949–1957. [Google Scholar] [CrossRef]
- Leibfried, T.; Jaya, M.; Majer, N.; Schafer, M.; Stach, M.; Voss, S. Postmortem Investigation of Power Transformers—Profile of Degree of Polymerization and Correlation with Furan Concentration in the Oil. IEEE Trans. Power Deliv. 2013, 28, 886–893. [Google Scholar] [CrossRef]
- Martin, D.; Cui, Y.; Ekanayake, C.; Ma, H.; Saha, T. An Updated Model to Determine the Life Remaining of Transformer Insulation. IEEE Trans. Power Deliv. 2015, 30, 395–402. [Google Scholar] [CrossRef]
- Kweon, D.; Kim, Y.; Park, T.; Kwak, N.; Hur, Y. DGA Gases related to the Aging of Power Transformers for Asset Management. J. Electr. Eng. Technol. 2018, 13, 372–378. [Google Scholar]
- IEEE Power & Energy Society. Guide for Loading Mineral-Oil-Immersed Transformers and Step-Voltage Regulators; IEEE Standard C57.91-2011 (Revision of IEEE Standard C57.91-1995); IEEE Standards Association: New York, NY, USA, 2012. [Google Scholar]
- Gouda, O.E.; Amer, G.M.; Salem, W.A.A. Predicting transformer temperature rise and loss of life in the presence of harmonic load currents. Ain Shams Eng. J. 2012, 3, 113–121. [Google Scholar] [CrossRef]
- Sarker, M.R.; Olsen, D.J.; Ortega-Vazquez, M.A. Co-Optimization of Distribution Transformer Aging and Energy Arbitrage Using Electric Vehicles. IEEE Trans. Smart Grid 2017, 8, 2712–2722. [Google Scholar] [CrossRef]
- Kim, J.-H.; Kim, H.-R.; Kim, J.-T. Analysis of Photovoltaic Applications in Zero Energy Building Cases of IEA SHC/EBC Task 40/Annex 52. Sustainability 2015, 7, 8782–8800. [Google Scholar] [CrossRef]
- Latif, A.; Gawlik, W.; Palensky, P. Quantification and Mitigation of Unfairness in Active Power Curtailment of Rooftop Photovoltaic Systems Using Sensitivity Based Coordinated Control. Energies 2016, 9, 43. [Google Scholar] [CrossRef]
- Mansouri, N.; Lashab, A.; Sera, D.; Guerrero, J.M.; Cherif, A. Large Photovoltaic Power Plants Integration: A Review of Challenges and Solutions. Energies 2019, 12, 3798. [Google Scholar] [CrossRef]
- IEA. Global EV Outlook. 2018. Available online: https://webstore.iea.org/global-ev-outlook-2018 (accessed on 12 May 2020).
- Open Data Portal. The Power Plant Generated Energy Present Condition. Available online: https://www.data.go.kr/dataset/15005796/fileData.do?lang=en (accessed on 15 January 2020).
- Statistics Korea. Power Demand Pattern Analysis. 2018. Available online: http://kostat.go.kr/portal/korea/kor_pi/8/6/2/index.board?bmode=read&aSeq=372701 (accessed on 15 January 2020).
- Magare, D.B.; Sastry, O.S.; Gupta, R.; Betts, T.R.; Gottschalg, R.; Kumar, A.; Bora, B.; Singh, Y.K. Effect of seasonal spectral variations on performance of three different photovoltaic technologies in India. Int. J. Energy Environ. Eng. 2016, 7, 93–103. [Google Scholar] [CrossRef]
- Järvelä, M.; Lappalainen, K.; Valkealahti, S. Characteristics of the cloud enhancement phenomenon and PV power plants. Sol. Energy 2020, 196, 137–145. [Google Scholar] [CrossRef]
- Dubey, S.; Sarvaiya, J.N.; Seshadri, B. Temperature Dependent Photovoltaic (PV) Efficiency and Its Effect on PV Production in the World—A Review. Energy Procedia 2013, 33, 311–321. [Google Scholar] [CrossRef]
- Kumar, M.; Kumar, A. Performance Assessment of Different Photovoltaic Technologies for Canal-Top and Reservoir Applications in Subtropical Humid Climate. IEEE J. Photovolt. 2019, 9, 722–732. [Google Scholar] [CrossRef]
© 2020 by the authors. Licensee MDPI, Basel, Switzerland. This article is an open access article distributed under the terms and conditions of the Creative Commons Attribution (CC BY) license (http://creativecommons.org/licenses/by/4.0/).