Article

A Publicly Available Simulation of Battery Electric, Hybrid Electric, and Gas-Powered Vehicles

Department of Health Administration, Texas State University, San Marcos, TX 78666, USA
Energies 2020, 13(10), 2569; https://doi.org/10.3390/en13102569
Submission received: 3 April 2020 / Revised: 5 May 2020 / Accepted: 12 May 2020 / Published: 19 May 2020
(This article belongs to the Special Issue Electric Systems for Transportation)

Abstract

:
Volatility in energy markets has made the purchase of battery electric vehicles (BEV) or hybrid vehicles (HEVs) attractive versus internal combustion engine vehicles (ICEVs). However, the total cost of ownership (TCO) and true environmental effects, are difficult to assess. This study provides a publicly available, user-driven simulation that estimates the consumer and environmental costs for various vehicle purchase options, supporting policymaker, producer, and consumer information requirements. It appears to be the first to provide a publicly available, user interactive simulation that compares two purchase options simultaneously. It is likely that the first paper to simulate the effects of solar recharging of electric vehicles (EV) on both cost-benefit for the consumer and environmental benefit (e.g., carbon dioxide, oxides of nitrogen, non-methane organic gasses, particulate matter, and formaldehyde) simultaneously, demonstrating how, as an example, solar-based charging of BEVs and HEVs reduces carbon emissions over grid-based charging. Two specific scenarios are explicated, and the results of show early break-even for both BEV and Plug-in HEV (PHEV) options over ICEV (13 months, and 12 months, respectively) with CO2 emissions about ½ that of the gasoline option (including production emissions.) The results of these simulations are congruent with previous research that identified quick break-even for HEVs versus ICEV.

1. Introduction

This study provides an analysis of both, environmental and total cost of ownership (TCO) estimates for vehicle capabilities identified by user input in a publicly available simulation (available in Supplementary materials). The simulation focuses on capability, not necessarily an existing vehicle type. Located here https://rminator.shinyapps.io/Vehicles/, the simulation was built to address the necessity for publicly-available TCO tools that compare different vehicle types, as well as environmental conditions. The next sections highlight the necessity for this analysis, environmental motivations for vehicle purchases, previous TCO analyses of EVs, consumer decision-making regarding EVs, modeling considerations, and this study’s significance, as well as location in the literature.

1.1. Necessity for Total Cost of Ownership Analysis

With the volatility of gasoline and electrical prices [1], the purchase of battery electric vehicles (BEV) or hybrid vehicles has become an attractive option to some [2], but understanding the actual total costs of ownership (TCO) associated with such a purchase, as well as environmental concerns requires analysis The metrics “miles per gallon” or “kilometers per liter” are not appropriate for electric vehicles (EVs), which underscores that the consumer understanding of EVs and energy costs is often incomplete [3]. When conducting a cost-benefit analysis of potential options, the analysis of EVs must include both cost to the consumer and cost to the environment, as well as performance and re-charging [4]. The automobile industry must evaluate and compare the costs and the demand trade-offs from a consumer perspective to ensure that the engineering of sustainable products meets consumer requirements [5,6]. The bottom line is that there is a necessity for consumers to understand the TCO as well as environmental considerations.

1.2. Environmental Considerations

EVs may provide a partial solution to the growing efforts to reduce carbon emissions and improve the environment [7]. One study suggested that they could reduce Global Warming Potential (GWP) by 15%, carbon monoxide (CO) by 37%, and carbon dioxide by 14% [8]. As part of any energy efficiency analysis, emissions, costs, and demand trade-offs [9] and geographic location need to be evaluated, because the efficacy of energy-efficient technology varies across regions [10], just as emissions vary with economic growth, population density, urbanization, fixed capital investment, and technological adoption [11]. The adoption of a BEV powered by photovoltaic systems (PVS) may be cost-effective and would reduce greenhouse gas (GHG) emissions [12]. Of course, TCO is just as important to consumers as environmental impact.

1.3. TCO of EVs

Most ownership and total cost of ownership (TCO) studies of BEV and hybrids are relatively recent, due to the emergence of the relevant technology [7]. One study developed a model of the performance, energy use, manufacturing cost, retail cost, and lifecycle cost of BEVs versus comparable gasoline-powered vehicles [13]. This study found that BEVs were cost-competitive, but the battery life and manufacturing costs were concerns. In another study, a vehicle cost simulation was used to analyze the manufacturing costs, retail prices, and lifecycle costs of hybrid gasoline-electric vehicles, conventional vehicles, electric-drive vehicles, and other alternative-fuel vehicles [14]. However, the research is dated. This study uses methods like the previous studies but updates the analysis with newer data in a publicly available format. Another study indicated that hybrid vehicles were better than gas-powered vehicles in terms of life-cycle costs and high travel miles [15]. Palmer et al. used panel regression to compare life-cycle costs for four geographic location. The authors did not forecast energy costs or consider seasonality. The vehicle data were also dated [16].
One study focused on the battery performance impact on TCO. This study found that TCO for EVs and PHEVs was 24 to 36% higher than HEVs [17]. Another study found that HEVs were associated with lower TCO in comparison with other EVs [18]. The purchase of hybrids is correlated with their TCO, and cost parity is reached relatively quickly (e.g., 16 months in the United Kingdom) [16]. Further, consumers prefer PHEVs to HEVs, with only a few percent opting for pure EVs [19].
A 2018 study demonstrated that, with proper policy incentives, TCO was better for EVs than than HEVs [20]. This study suggests that even without subsidies, EVs will gain market share by 2025 [20]. EVs are cost competitive without incentives now. However, incentives for purchase should be tailored based on battery development [21,22]. Further, grid-powered EVs (and PHEVs) may have deleterious effects on the grid [23,24] and produce unwanted pollution due to the reliance on grid power [25]. A solution for handling this problem is the use of solar charging for EVs [26]. Such a solution has been used in both industry [26] and in residences [27]. Fulton [28] compared specific BEV and non-plugin hybrids via simulation estimating that both were reasonable options. None of these studies provided a publicly available simulation with flexible parameters that compared break-even costs for gasoline vehicles, BEV, and non-plug hybrid vehicles.
Another, somewhat dated German study comparing ownership cost of BEV versus gas vehicles concluded a break-even cost of six years with 4 kW vehicles [29]. However, studies all depend on geography and climate assessments, as BEVs and HEVs experience different decay rates for the lithium ion batteries, based on climatology and driving experience [30]. Based on this discussion, the evidence for BEVs versus PHEVs is mixed. What motivates consumers to buy either is another concern altogether.

1.4. Consumer Decision Making in Vehicle Purchasing

Marketing studies have investigated consumer preferences and BEV viability [31]. Shin et al. evaluated how consumers would change habits based on the adoption of a BEV and how heterogeneity of vehicles might affect the market [32]. He, Chen and Conzelmann evaluated vehicle usage and consumer profile attributes, in order to assess vehicle usage versus consumer choices of hybrid vehicles [33]. Another study indicated how utility prices versus replacement costs are factors in consumer decision making [34]. All these studies provide evidence that given proper capabilities and price, EVs may be acceptable to consumers.

1.5. Modeling Considerations

From their unique perspective, Ozdemir and Hartmann estimated the optimal electric driving range for different oil price levels [35]. Some researchers have helped refine calculation of fuel consumption and emission factors based on driving styles [36]. This type of work provides a good framework for cost estimation. Focusing on driving range and gasoline costs, one study compared the lifecycle costs of electric cars to similar gasoline-powered vehicles [37]. In their study, the authors concluded that electric cars with 150 km range are viable and meet most consumer needs. The effects of charging behaviors (i.e., time of day and location) on electricity demand was studied by Weiller [38]. The study estimated a consumption of 1.5–2.0 kWh per day with home electric chargers. These studies provide the framework for simulation analysis.

1.6. Study Research Question and Significance

This study provides a user-interactive simulation to estimate the consumer costs and environmental costs for various vehicle configurations. The research question for this study is straightforward: What consumer trade-off considerations make purchasing a BEV/HEV versus a gasoline-powered vehicle reasonable in terms of acquisition costs, operations and maintenance costs, disposal/residual costs, and environmental costs? The study addresses these questions through a freely available and online simulation located here: https://rminator.shinyapps.io/Vehicles/. This simulation that compares two vehicle options simultaneously.
Unlike much of the other work in this field, this study does not focus on a particular vehicle or vehicle set. Instead, the focus is on a capability set that is customizable based on current and emerging technology (e.g., the improvement of miles per kWh in emerging vehicle lines). This differentiates the work from other simulations which are based on fixed capability values.
This study appears to be the first to provide a publicly available simulation accessible by any interested party that compares two purchase options simultaneously. It is likely the first paper to simulate the effects of solar recharging of EV vehicles on both cost-benefit for the consumer and environmental benefit (e.g., CO2, NOx + NMOG, PM, and HCHO) simultaneously, demonstrating how solar-based charging of electrical vehicles reduces CO2 emissions (as an example). No other study appears to estimate acquisition costs for solar panels necessary to support a residential EV that is to be charged by such means. This work appears to provide the only user-available sensitivity analysis for various options of natural gas, electricity, or solar residential power options coupled with solar power generation capability estimates that vary by state and Error, Trend, and Seasonality (ETS) forecasts of utility costs based on Energy Information Administration data. The study is novel in that it combines user-based input with time series forecasting and simulation to generate interesting TCO and environmental assessments. The study also addresses the primary theme of the journal’s special issue: Energy savings and reduced environmental impact associated with solar versus natural gas versus coal-powered grid systems.

2. Materials and Methods

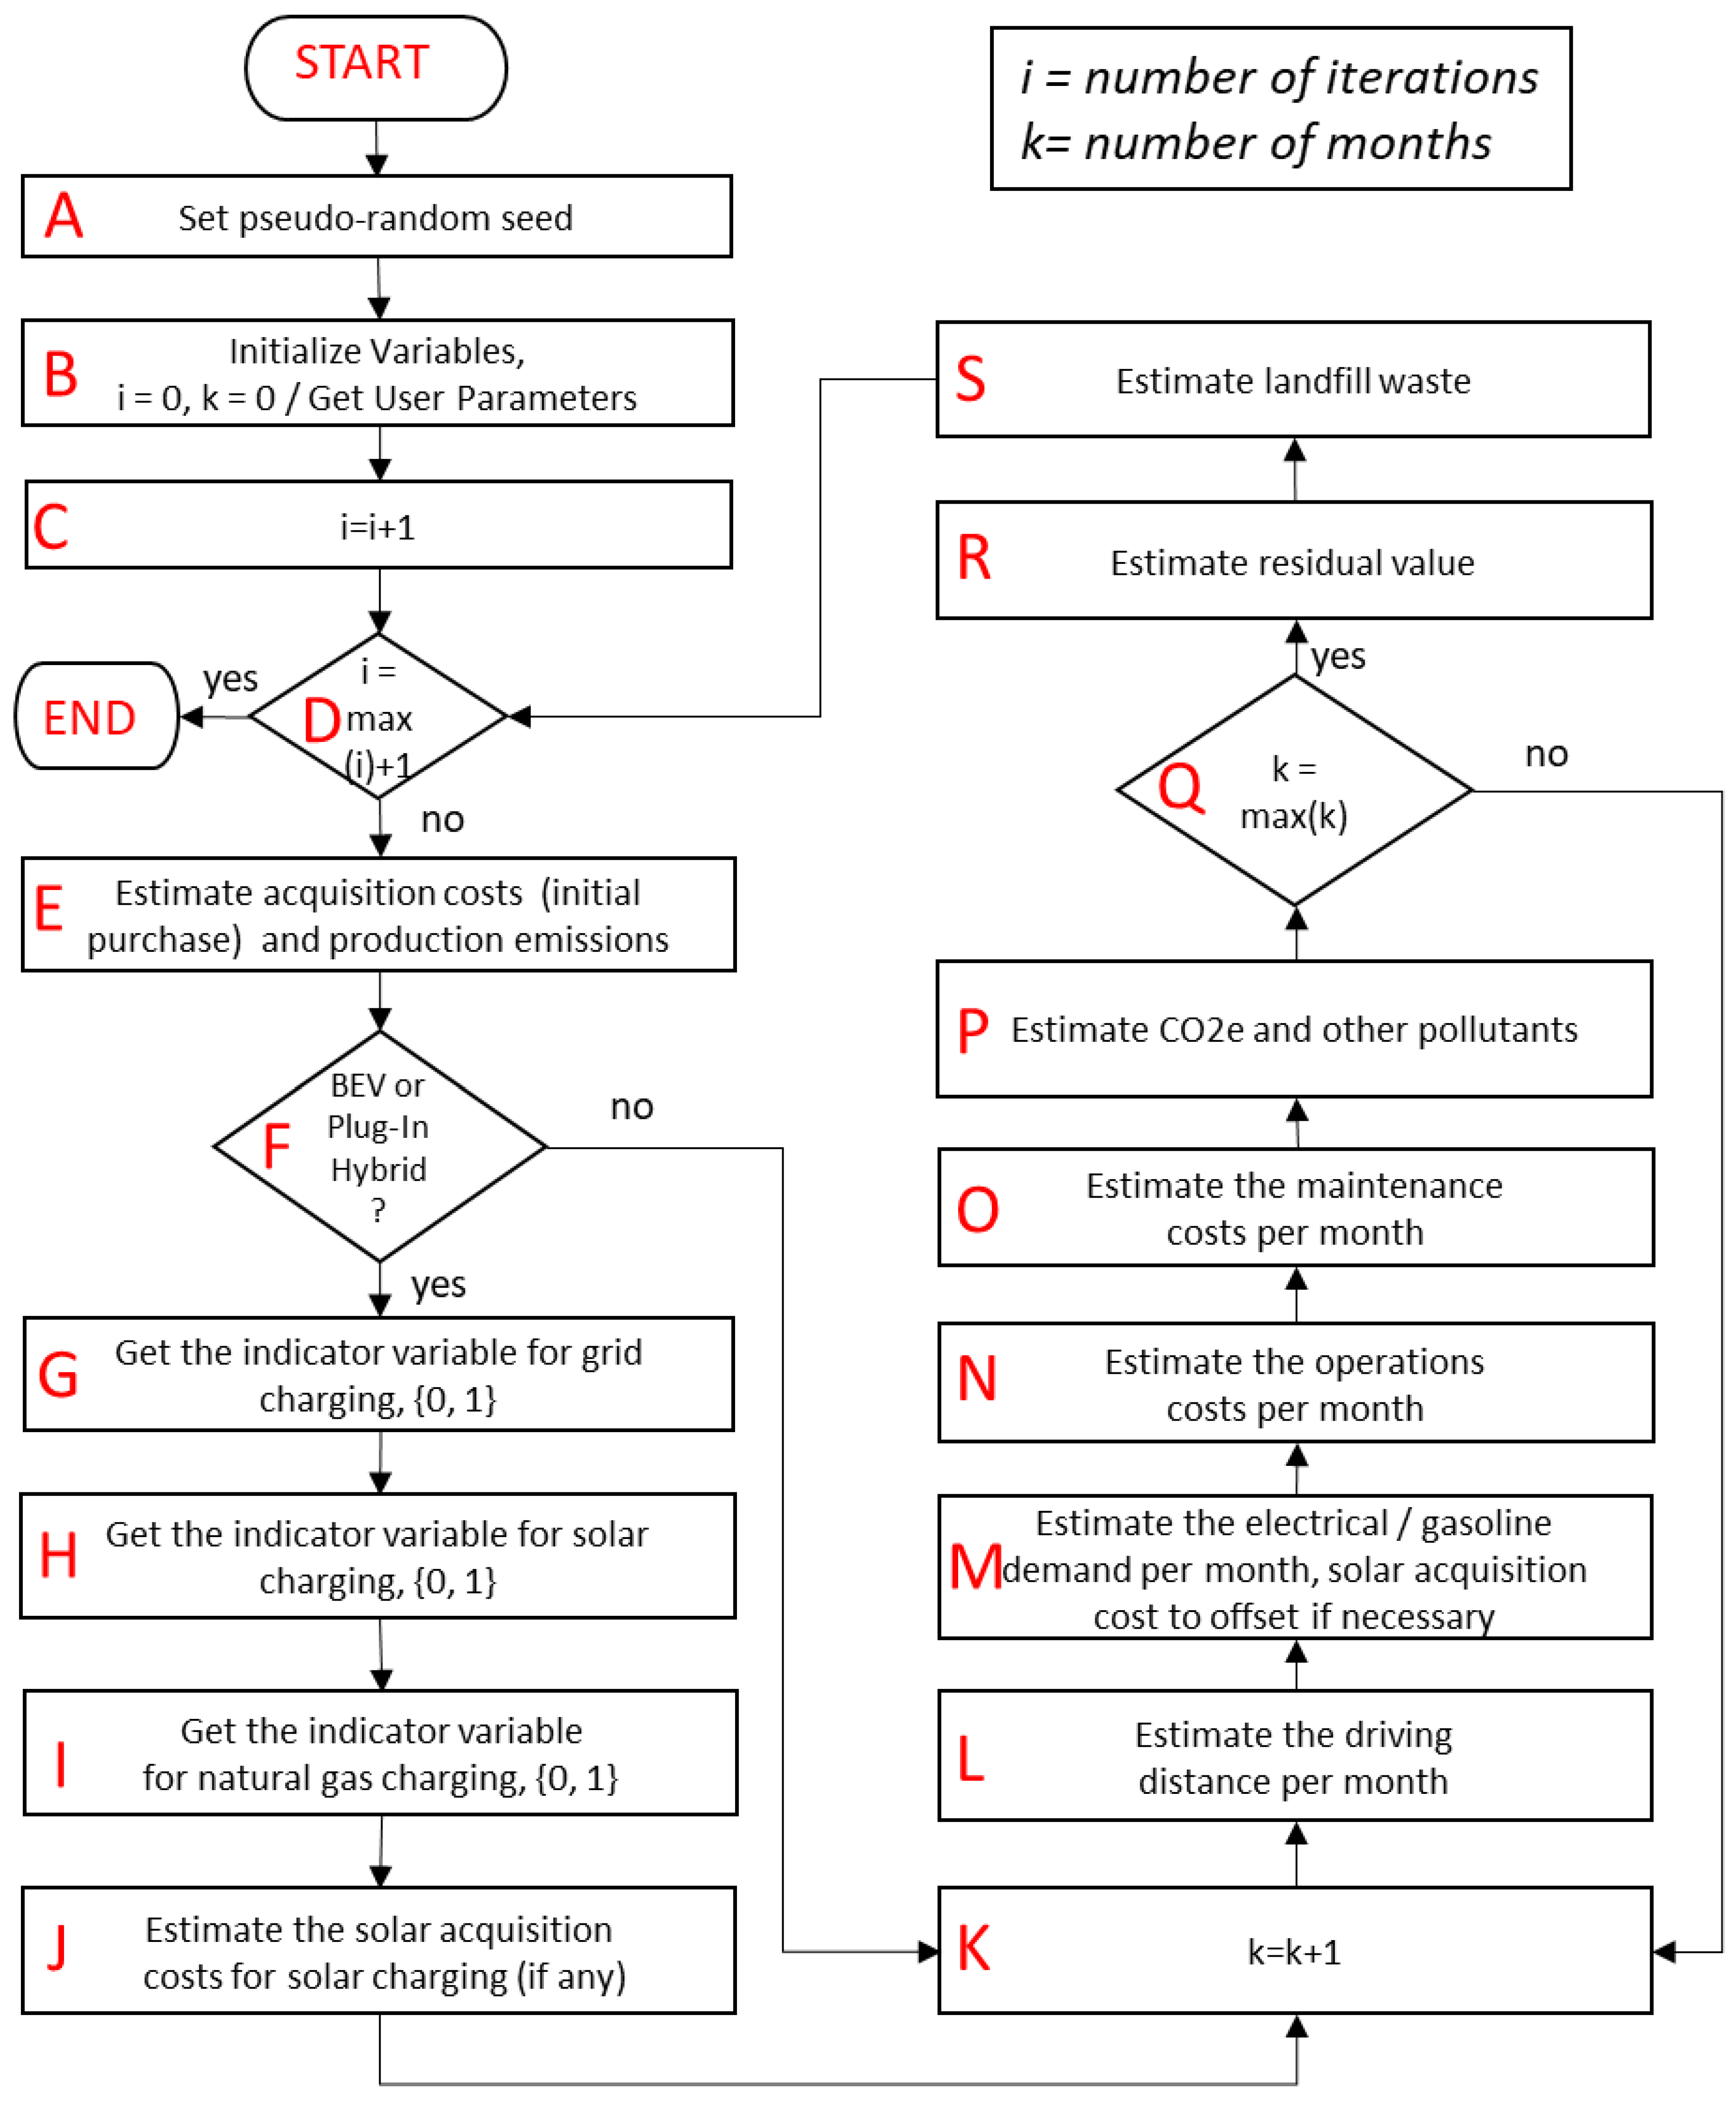
2.1. Method, Software, and Flowchart

This study leverages Monte Carlo simulation [39] in R Statistical Software [40] and an R Shiny web application [41]. The simulation follows the flowchart in Figure 1. Each step A through S is now discussed in different sections. Feasible ranges of user-based, simulation parameters along with their default values are shown in Table 1, while variable distributions are discussed in subsequent sections.

2.2. Simulation Initialization

The simulation starts by setting a pseudo-random number seed for replicability (step A). This seed ensures that statistical differences are not due to the selection of random numbers, as they are identical between models. Step B initializes the indices and variables (e.g., the indices for iterations, i, and months, k, are set equal to zero) and gathers the input parameters from the user interface for use in future steps (e.g., user estimated lifespan or retention of vehicle). The iterations then increase by 1 (step C).

2.3. Acquisition Costs, Environmental Effects, and Additional Simulation Parameters

If the user selected number of iterations is not met (step D), then the vehicle acquisition costs from the user interface including, tax credits and home charging station costs are estimated. These are user-entered parameters for the simulation. In addition, production emissions, a value derived from a previous study [42], are calculated based on vehicle selection type, a user parameter (step E, Table 2).
Step F evaluates whether the vehicle is a BEV or PHEV. Residential grid electric charging (step G), residential solar charging (step H), and the residential natural gas charging (step I) are pulled from the user interface. Solar charging is used to estimate solar acquisition costs for the panels necessary to charge the vehicle. Step J estimates the associated solar acquisition cost per panel watt required for the percent solar charging specified in the user interface. Cost per solar panel watt was user parameter with values between $2 and $5, representative of the range $3.10 and $4.50 found in [43] with the possibility of growth and shrinkage provided. Total cost of solar acquisition to charge a BEV or PHEV is then calculated by Equation (1) (author-proposed). In this equation, solar acquisition cost is estimated based on and indicator variable for a BEV or PHEV (EV) times an indicator variable for solar charging (Solar) times a state-based geographic system-sizing multiplier [44] times the miles driven (Miles) times the BEV kWh per mile (kWh/Mile) (from the user interface, defaulted to 0.34 based on a Nissan Leaf [28]) times the dollars per kWh ($/kWh) times the percentage of power provided by the battery (% Battery, which is 100% for BEV but less than 100% for PHEVs). Tax credits, if any, are assigned 12 months after vehicle acquisition:
Solar Acquisition Cost = EV × Solar × Geographic Photovoltaic Size ×
Miles × kWh/Mile × $/kWh × % Battery.
After estimating the acquisition costs in steps E through J, the month of the simulation is then incremented (step K). Driving distance per month is based on user interface (step L), with a default value of the average monthly driving distance of 1123 miles based on the United States Department of Transportation [45].

2.4. Operations and Maintenance Costs/Solar Acquisition Costs (If Needed)

2.4.1. Miles Driven

Electrical, natural gas, and gasoline monthly demands are estimated based on average monthly driving distance (per user specifications) and user input parameters for vehicle mpg and mpkWh. Step M leverages forecasts from publicly available information of the Energy Information Administration [46] to assign costs based on miles driven, mpg, and mpkWh (see author-proposed Equation (2):
Variable Fuel Costs = Grid × % Battery × ($/kWh Electricity) × (kWh/mile) × miles +
(1-GRID) % Natural Gas × % Battery × ($/kWh Natural Gas) × (kWh/mile) × miles +
% Solar x 0 + (1 − % Battery) × ($/gl) × (gl/mile) × miles.
In Equation (2), GRID is an indicator variable identifying that the residence relies on an electrical grid for recharging the vehicle rather than natural gas. % Battery is the percent of vehicle power generated by the battery for PHEVs and BEVs. % Natural Gas is the percentage residential battery recharge from natural gas. Electric car costs are then calculated by taking the estimated cost per kWh, multiplying by kWh per mile and the distance driven in miles. Solar charging assumes away gray power, power produced when solar is not active, and is set to zero. This is an artificial simplification. Cars that are not fully electric generate costs based on dollars per gallon times gallons per mile and distance in miles for the percentage, not powered by batteries.

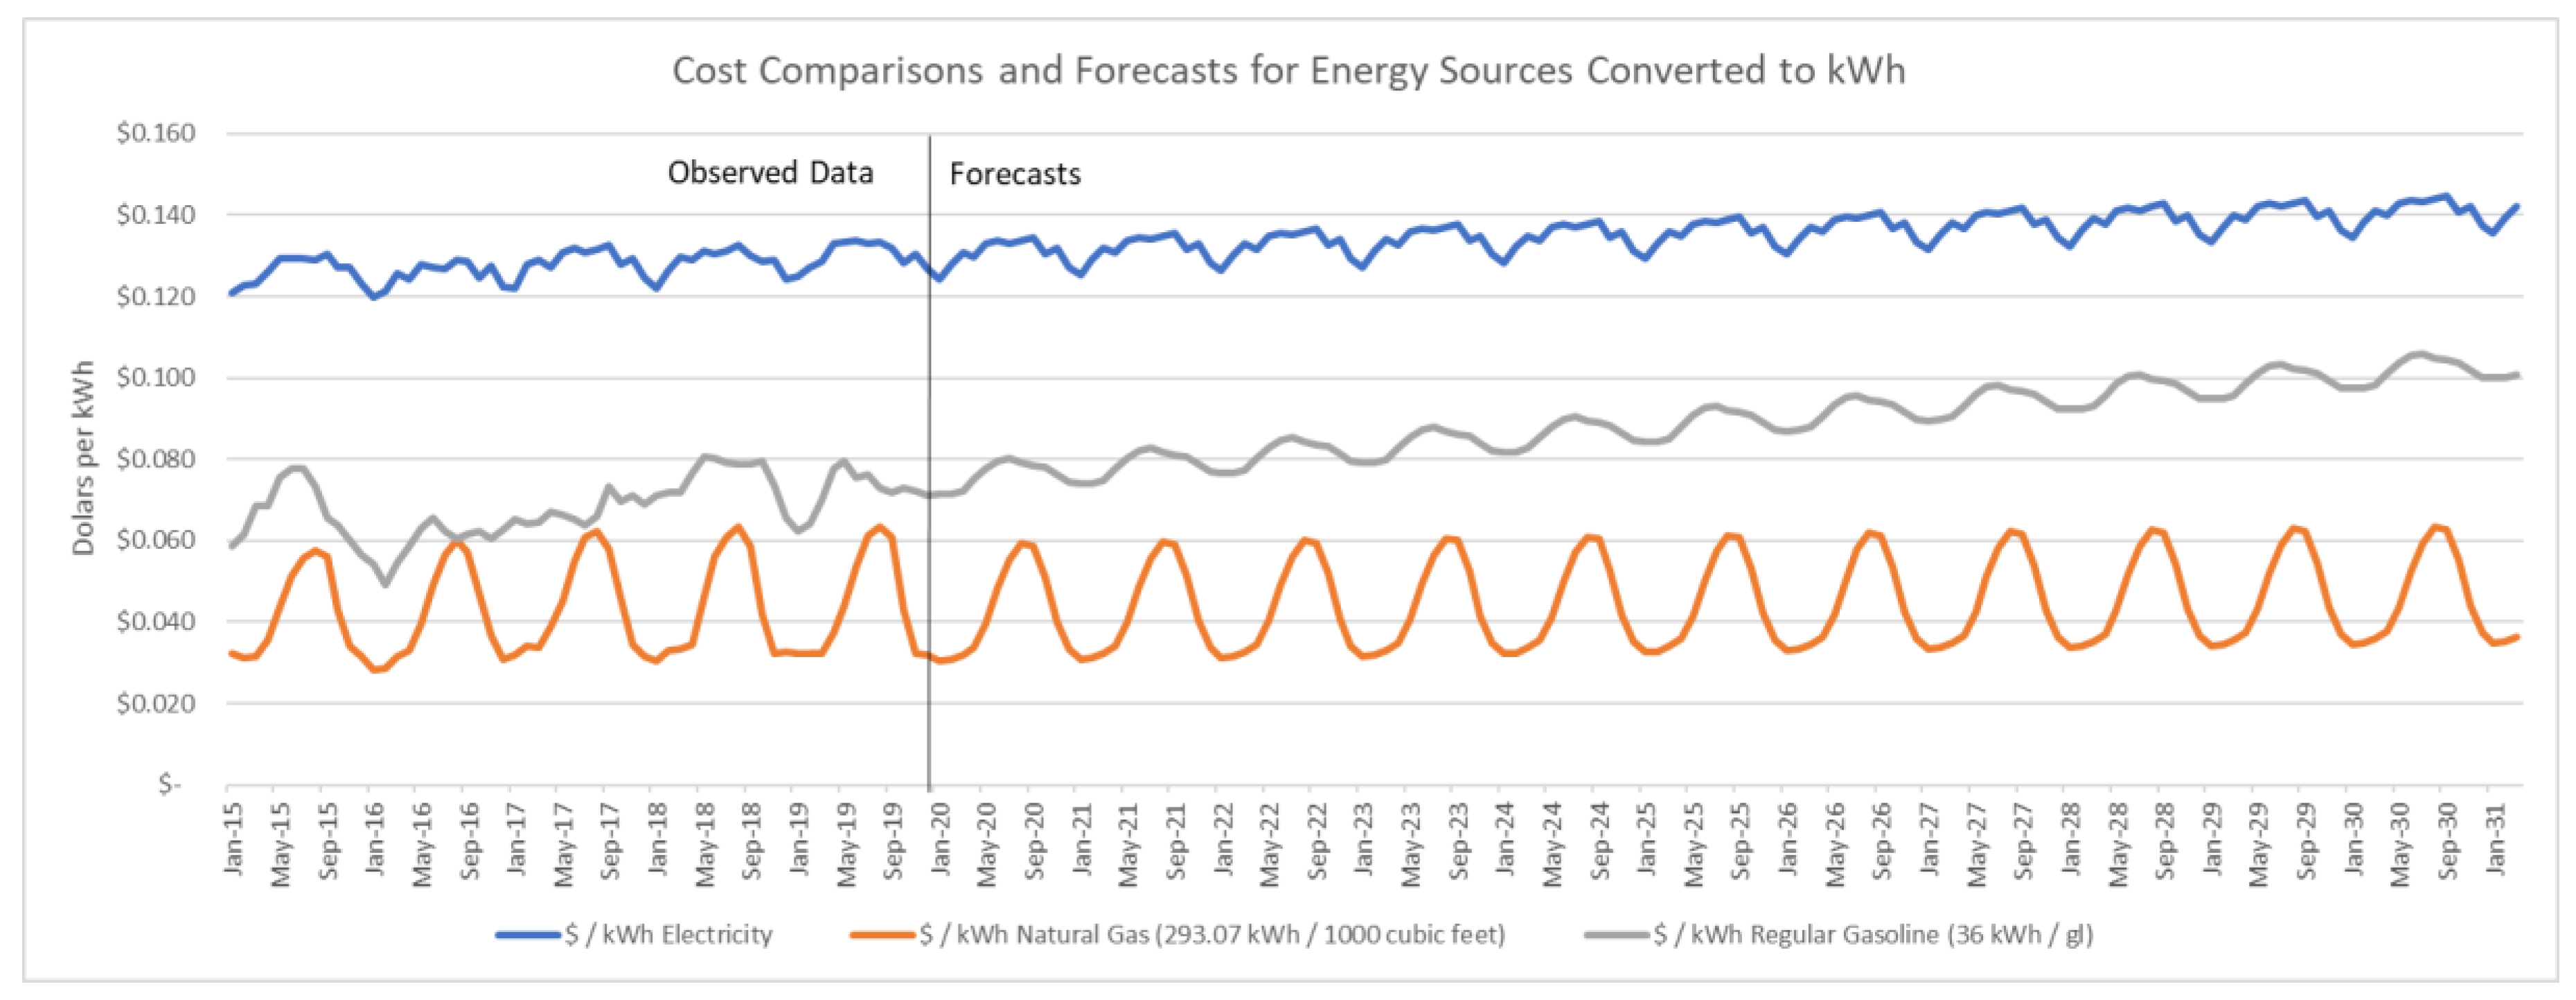
2.4.2. Natural Gas, Electricity, and Regular Gasoline Prices

Monthly natural gas residential price data from the Energy Information Administration (EIA) in dollars per 1000 cubic feet (converted to dollars per kWh) were used to estimate costs for BEV and PHEV re-charging from residences using. The data were state-dependent with Hawaii being an obvious outlier. To account for seasonality in natural gas costs, simple error, trend, seasonality (ETS) models implemented using the fpp2 library in R were used [47]. These models proved reasonable versus ARIMA (auto-regressive, integrated, moving average models), as well as random walks for this data in previous research [5].
Grid electricity costs from the EIA in dollars per kWh have trended slowly upwards since 2001 and vary largely by state, with Hawaii having the most expensive residential costs [46]. Due to the large cost variability, ETS models by state were used to forecast costs over the vehicles’ lifespans. A previous study also found that ARIMA and ETS models performed nearly identically for this variable [5].
The EIA does not publish gasoline prices for each of the states but rather only U.S. averages, U.S. petroleum regions, and data for nine selected states and cities. All states in petroleum production regions were then assigned the regional cost for regular gasoline, unless the state had its own estimates from the EIA.
Figure 2 compares the costs of natural gas, electricity, and regular gasoline per kWh for the United States based on the publicly available EIA data discussed and shows the values used for forecasting from ETS modeling. About 1000 cubic feet of natural gas is 293.07 kWh, and 1 gallon of regular gasoline is equivalent to about 36 kWh, so for comparison, the y-axis is shown in dollars per kWh. The data exhibit significant seasonality and illustrate that natural gas is the cheapest alternative of the three.

2.4.3. Insurance and Maintenance Costs

Insurance costs depend on vehicle type and selection, so a fixed cost of 5% of the initial vehicle price was initially assigned as in [5]. However, a recent study concluded that insurance rates for EVs are generally 21% higher, due to the higher repair costs [27], congruent with previous research [48]. To account for this factor, insurance rates for BEVs and PHEVs were inflated to 6% of the initial vehicle cost and assigned monthly.
In step O, maintenance costs for BEV, hybrid, and gasoline vehicles are estimated. The consensus from the literatures is that EVs are cheaper to maintain than ICEVs [21]. From [28,49], EVs average about 3.5 cents per mile for maintenance compared to 6 cents per mile for hybrids. As PHEVs include both traditional gasoline engines, as well as BEV components, they may experience the maintenance profile of ICEVs, although some less conservative studies have argued that maintenance is less expensive [50]. Given the paucity of data, PHEV and EV’s are assigned maintenance costs of an average of 3.5 cents per mile while NPHEVs and ICEVs are assumed to experience an average of 6 cents per mile. These values are used as the center for triangular distributions with minimum and maximum set at ±2 cents from the center values.

2.4.4. Environmental Costs and Residual Values

Environmental costs are estimated in step P, and these include carbon dioxide emissions (CO2e) [51] as well as estimates of nitrogen oxides (NOx)/non-methane organic gases (NMOG), carbon monoxide (CO), and particulate matter (PM). Formaldehyde (HCHO) is a constant, based on Tier 3 standards of the Environmental Protection Agency (EPA) [52]. BEV cars are non-emissive (although there is carbon emission in the production phase). Other vehicles are assigned emission standards based on estimates from [53]. Table 3 illustrates the estimates by vehicle type.
In step Q, the simulation evaluates whether the vehicles have reached their usable lifespan. If not, steps K through P are repeated until that lifespan has been reached. Then, in step R, residual value for the selected vehicles is estimated based on Moody’s Analytics Electric Vehicle Residual Value Outlook [54]. Gasoline cars retained on average 45% of their value over 4 years. Electric vehicles retained barely more than 25% of their value after adjustment for tax credits [54]. The geometric residual rate per year for gasoline and non-gasoline cars is then 82%, and 71%, respectively. In other words, 0.824 = 0.45 and 0.714 = 0.25. These geometric values are applied to the user-selected life span (not to exceed 10 years). PHEVs are estimated to be 0.75 (closer to BEV), while non-plug-in hybrids are estimated at 0.78 (closer to gasoline vehicles).
Finally, landfill lithium ion battery (LIB) waste is estimated in step S [55,56]. The concern for LIB waste is that; (1) it is highly toxic to humans, (2) it requires cobalt, which is often extracted irresponsibly with child labor, and (3) it may be recycled [55]. Waste in pounds is estimated by a uniform distribution between 100 and 544 pounds, the minimum and maximum specified in Figure 1 of [56].

2.5. Verification, Validation, and Iterations

R’s native debugging ensured proper coding, while a comparison of a priori and posterior distributions, through hypothesis testing, ensured distributional integrity. To be valid for model comparison, pseudo-random number streams were identical across experimental. To do so, the function “set.seed” was used in R, a function which randomly generates a series of numbers so that the differences in simulation results are not to selection of random values.

3. Results

There are an infinite number of scenarios for break-even analysis based on the simulation user inputs. For analysis, this study analyzes two basic scenarios, the purchase of a BEV versus ICEV and the purchase of a PHEV versus an ICEV. All scenarios leverage the mean monthly driving distance from [45], which is about 1100 miles, and the state selected for all scenarios is Texas. Miles per gallon for gasoline vehicles is set to 30. All other variables were left at the initialization default unless specified.

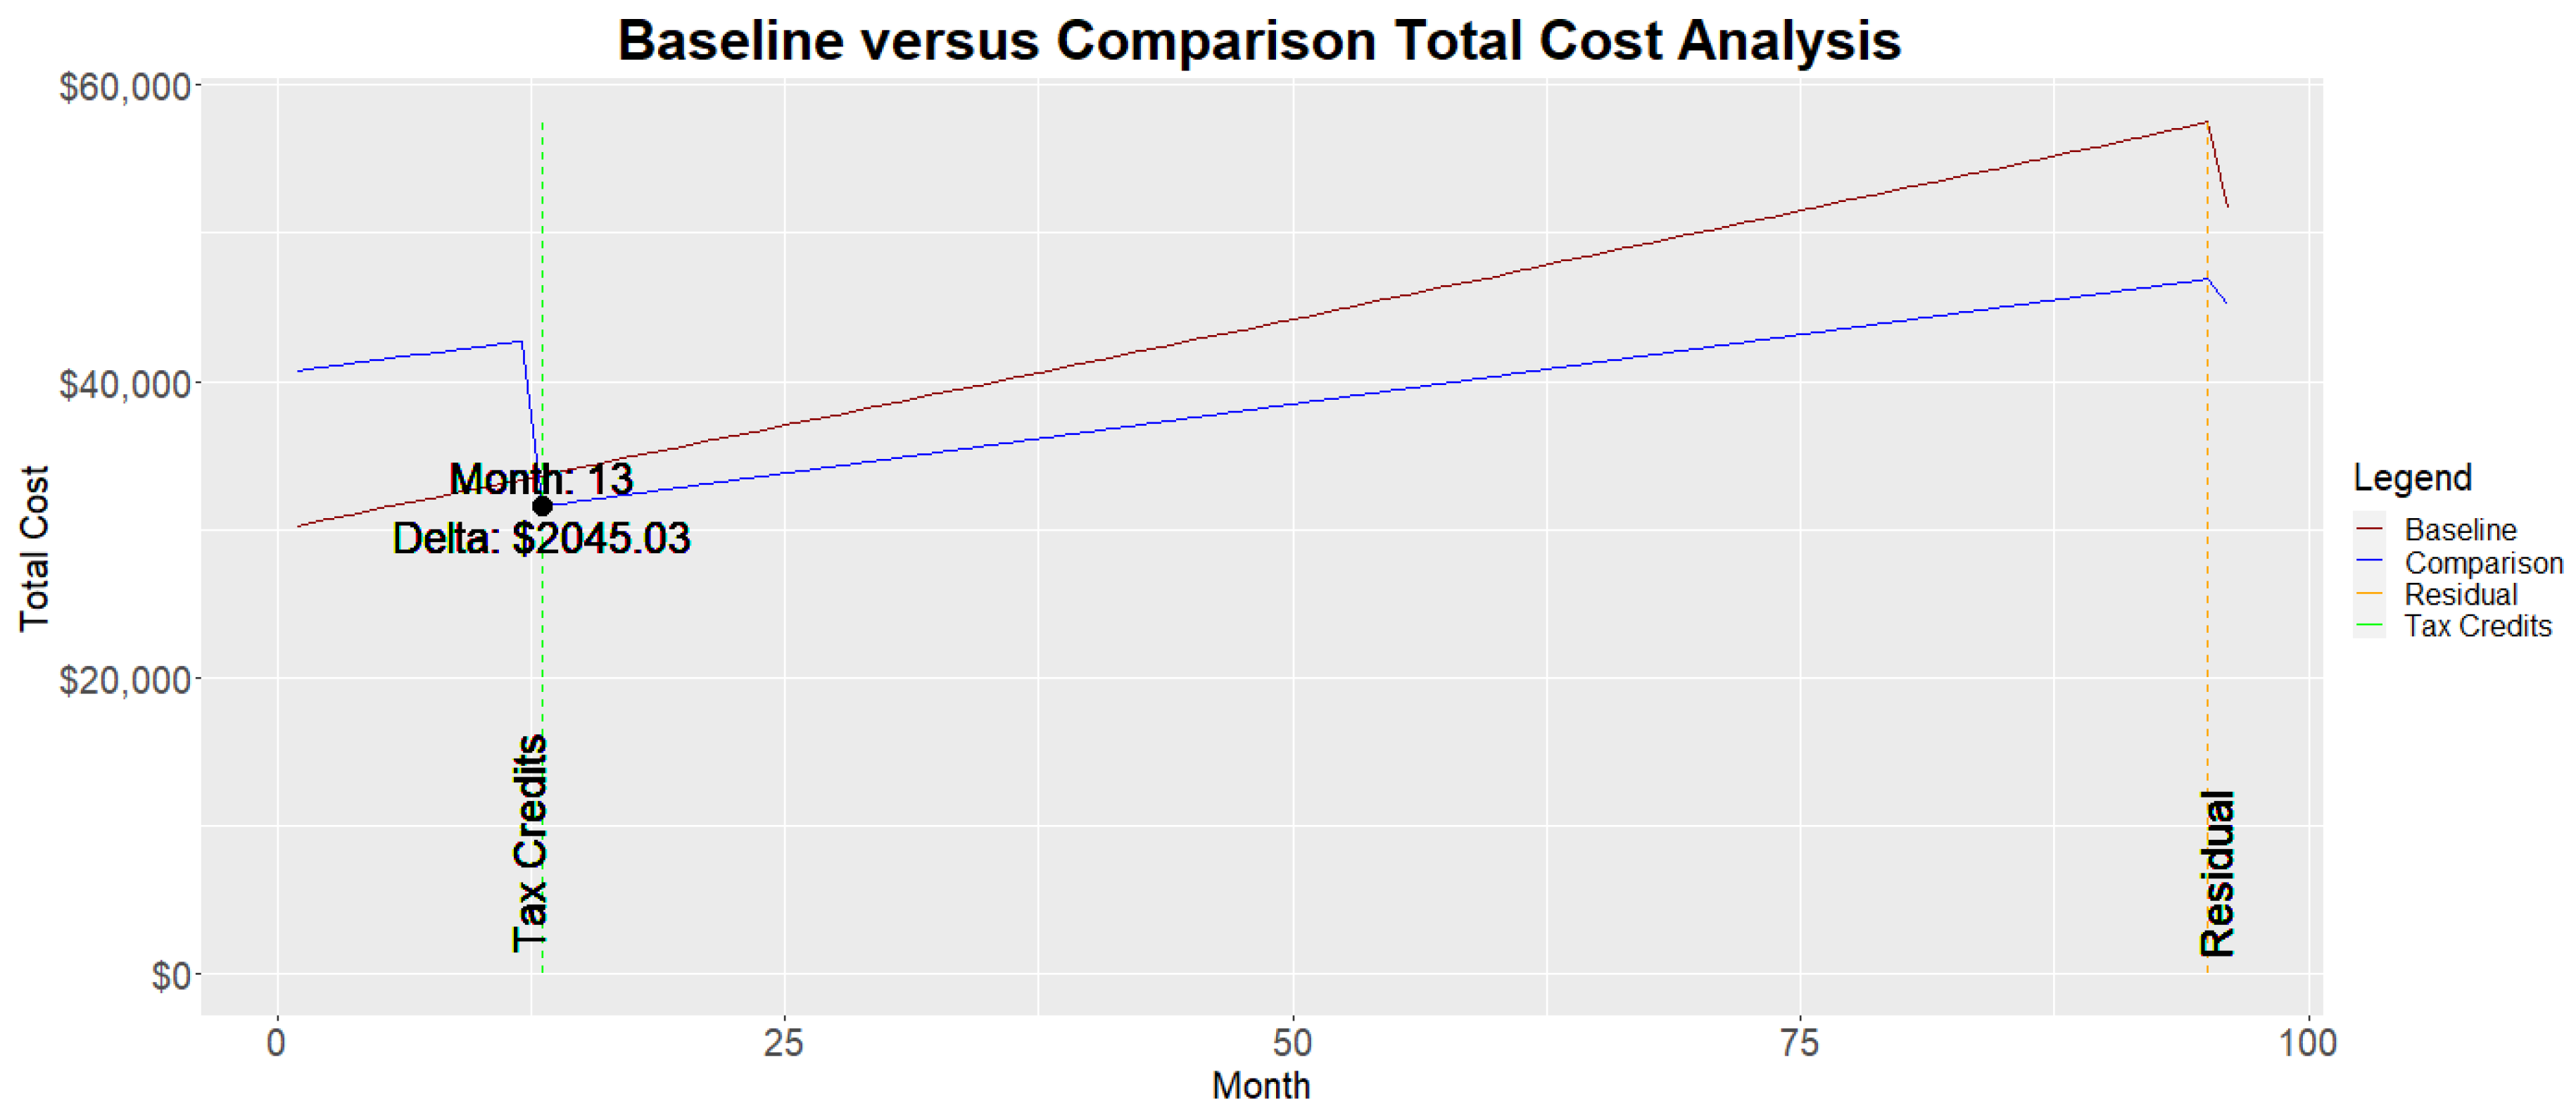
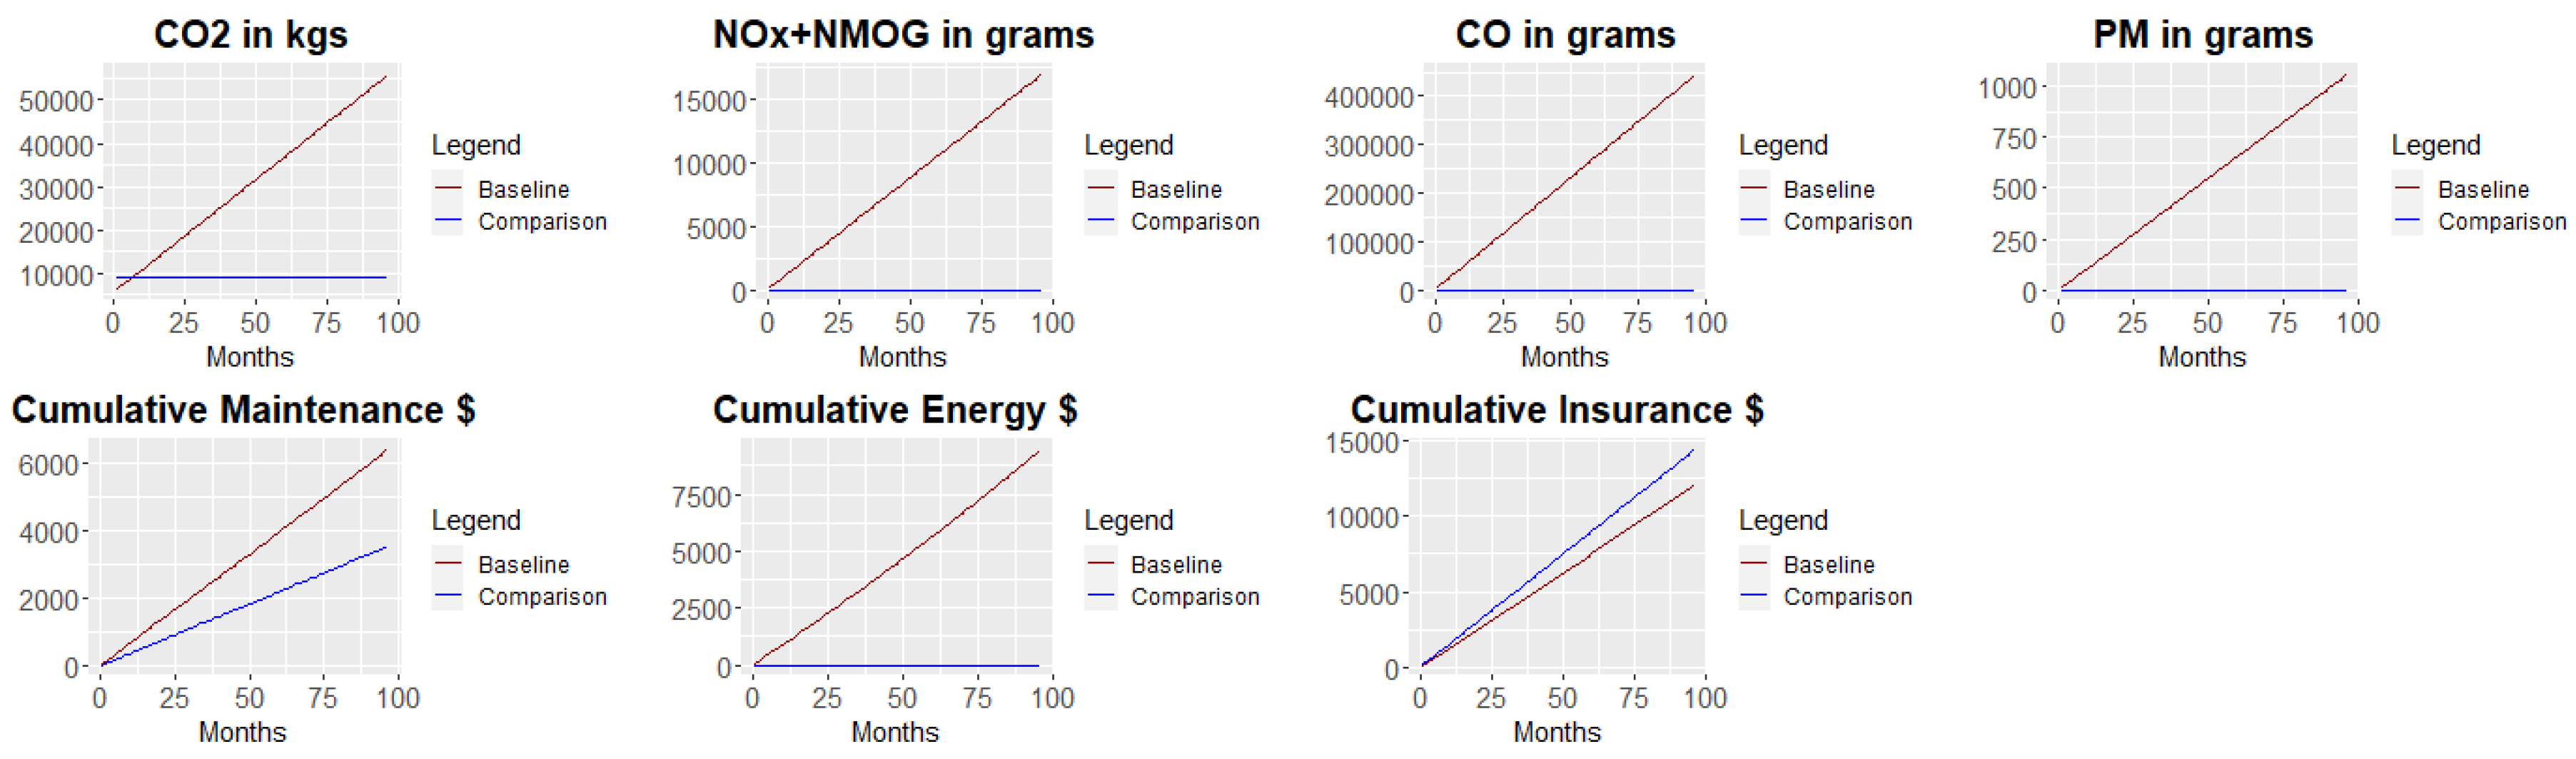
3.1. Scenario 1: Gasoline versus Electrical Vehicle Charged via Solar

Scenario 1 evaluated the default values for a gasoline vehicle (termed the “baseline” simulation) against a BEV priced at the same value that receives a 30% tax credit and is completely charged by solar panels (termed the “comparison” simulation). An additional $1000 is also charged for a home-charging station.
The break-even is on month 13, after the 30% tax credit is assigned (Figure 3), despite the assigned PVS acquisition costs in month 1. The simulation demonstrates the slower growth of total expenditures, but an initial increase in expenses associated with solar panel acquisition required to charge the BEV. Figure 4 provides cost breakouts for maintenance, energy, and insurance. While lifetime insurance costs are more expensive for the BEV, lifetime maintenance costs are less expensive and energy costs are nominal, as the BEV recharges through a PVS in this simulation.
The environmental analysis (also depicted in Figure 4) shows the value of the BEV most clearly. The BEV CO2 emission is largely in the production process and less than 1/6 of the ICEV emissions over its lifecycle. CO, PM, and NOx/NMOG emissions are negligible for the BEV option, whereas they continuously increase over the lifecycle of the ICEV. There is a clear advantage to the BEV in terms of the environment.

3.2. Scenario 2: Gasoline vs. PHEV

In Scenario 2, the baseline simulation is again the traditional, gasoline-based vehicle priced at $30,000 with all default simulation values. The comparison option is an equally-priced PHEV (no tax credit) recharged through the electrical grid and obtaining 110 mpg (both electric and gas) with a battery offsetting 30% of vehicle power consumption. Again, a home charging station cost of $1000 is included.
The break-even analysis (Figure 5) demonstrates that the PHEV and ICEV are approximately equal at month 16. Since the up-front cost differences was the home charging station, the analysis suggests about $1000 savings every year for the adoption of a PHEV (not including residual analysis). The residual is smaller for the PHEV option. However, the TCO is lower (although not strikingly). Once again, insurance costs are clearly higher over the vehicle life cycle, maintenance and energy costs are lower (see Figure 6).
Figure 6 also depicts, the PHEV CO2 emissions are much lower than gasoline vehicles. Comparing Figure 6 to Figure 4 demonstrates that BHEV is superior in this category, as well as in all other emissions categories. PM is tied for PHEV and ICEV but zero post-production for BEVs.

4. Discussion

4.1. Findings and Relationships to Previous Studies

This study provides a comparative simulation for various vehicle options, based on real-world data. The results of the two scenarios provided demonstrate that BEV and PHEV options may be both green for the pocketbook and the environment. BEVs have a much lower GHG emission profile, as found in previous studies [57]. BEVs rely on tax credits for an earlier break-even point as in Scenario 1, and these tax credits are likely to incentivize purchases [58] and allow for lower TCO [48]. Any initial up-front costs may be offset by savings depending on geographic considerations and other factors.
In Scenario 1, the results show an initial upfront cost increase for the BEV due to the purchase of requisite solar panels capable of powering the vehicle and the purchase of a home charging station. BEV lifecycle costs of maintenance are about half of that experienced by ICEV ($3.5 K versus $6.5 K), while energy costs are near zero after solar panel acquisition versus $10 K for the ICEV. Insurance costs are higher for the BEV ($14 K versus $12.5 K ICEV), which is congruent with simulation input and previous research [48]. By eliminating grid use, the upfront cost reduces GHG emissions as in [12]. The production phase produces the majority of the lifecycle waste for BEVs.
In Scenario 2, the unincentivized purchase of a PHEV resulted in a 16-month break-even point congruent with previous research [28]. The higher initial cost due to the home installation of a charger was offset quickly due to lower maintenance costs similar to the BEV (arising from reduced wear on the gasoline engine) and lower energy costs ($10 K versus $3.5 K ICEV), although insurance costs were higher. The GHG emissions are higher than the solar-charged BEV option in Scenario 1, as the scenario involves use of an electrical grid. This finding is also congruent with previous research [59]. Both scenarios reinforce previous research showing that EVs can reduce GHGs [60] and have a lower TCO [7].
A significant concern of the consumer might be the residual value of the vehicle upon resell. Both scenarios illustrate that residual values are lower for BEV and PHEV. ICEV appear to retain their value much better. High-end BEVs have seen some improvement in this area with Tesla Model S holding its value better than any vehicle regardless of type [61].
Utility market changes are also consideration for purchasing of a vehicle, as they effect fuel-cost savings and thus the TCO [3]. By including forecasting models for various energy options, the simulation models these effects for inclusion in the analysis.

4.2. Energy Savings and Reduced Environmental Impact of Electrical Power Systems for Transportation

One of the findings of this study is that GHGs for solar-powered BEVs are nominal. Battery-electric power systems powered by PVS produce an environmental impact that is almost negligible. When electrical grid power is used for charging EVs under the conditions of Scenario 2, the simulation depicts reductions in CO2, NOx + NMOG, and CO. For CO2, that lifecycle reduction is from about 60,000 kg (ICEV) to 25,000 g (PHEV). For NOx + NMOG, lifecycle reductions are estimated to be from 17.5 kg (ICEV) to 10 kg (PHEV). CO estimates were 450 kg for ICEV versus 225 kg for PHEV. Under both scenarios, EV adoption resulted in a reduced environmental impact.
The verdict on true GHGs, however, may be mixed. A recent study has proposed a more robust method for capturing grid energy CO2 emissions in the electricity production phase [62]. The results suggest that under some conditions, ICEVs might be preferred. This result is surprising and underscores the value in PVS offsets for electrical charging requirements [23].
The total kWh for the BEV operating at 0.34 kWh/mile for 1100 miles × 12 months × 8 years is 35,904 lifecycle kWh, about 4408 kWh monthly. (The 0.34 kWh/mile is a variable parameter in the simulation.) With approximately 1 million BEVs on the road today [63], the additional monthly kWh demand is 4408 GW at the rate of consumption. EV loads are now placing pressure on power grids [64]. Using PVS for recharging these vehicles could offset that increased demand. Given that EVs may increase global consumption of electricity between 11–20% by the year 2040 [65], this type of solution along with smart grid and others may prove vital.

4.3. Implications

This simulation has policy implications for both the government and the manufacturers. First, the use of tax credits visibly accelerates break-even analysis in the online simulation. Tax credits for hybrid and BEV should be considered an investment in the environment [58]. Second, the expansion of EVs is likely to result in an 11–20% increase in grid demand by 2040 [65]. The solutions to this problem might include smart grid development acceleration or incentives for renewable recharging.

4.4. Limitations

One of the limitations of this study is that it focuses on the break-even costs and environmental effects. Consumer vehicle type selection (e.g., gasoline versus hybrid versus fully electric) is often based on other criteria such as driving range, charging time, and performance [66]. A BEV may not be pragmatic for exceedingly long trips.
Another limitation of this simulation is that it assumes zero gray-power costs for solar charging of BEVs. This simplification belies the fact that many solar power systems do not have battery back-up. This is an important limitation when considering environmental effects.
A third limitation is that the simulation is based on data and distributions generated from the United States. There are valid reasons to assume that future costs of gasoline, electricity, and natural gas are unlikely to be the same among countries. Further, other factors are likely to be different, including driving range, availability of recharging stations, and energy policy.

4.5. Future Improvements

This is the first publicly available simulation for this type of analysis. Future work will include modeling of solar gray-power considerations and include additional parameters for user input. Updated data distributions will be included as available, and additional variables will be added.

5. Conclusions

The research question in this study addressed the consumer trade-off considerations for purchasing a BEV, a hybrid, or a gasoline-powered car using a publicly available simulation, the first of its type. The findings of the paper show early break-even points for the two alternative scenarios: A BEV re-charged by PVS and a PHEV re-charged through the grid. In both cases, the break-even was about a year (13, and 12 months, respectively). However, the BEV benefited from tax credits to achieve that early break-even. Due to other considerations that affect buying a BEV, such as a driving range [66], the continuation of tax credits should be a policy focus.
The environmental impacts associated with the PVS-BEV scenario are nominal. Further, such a scenario avoids the 11–20% increase in demand on the grid that may occur by 2040 [65]. Good policy would consider incentivizing the use of the PVS-BEV relationship, while developing smart grid capability. For the PHEV, the GHG are estimated to be much less than for the ICEV; however, the true impact is possibility underestimated [23].
This study provides a foundation for sensitivity analysis in relation to both cost and environmental effects associated with car purchasing decisions. It also highlights the differences in terms of GHG and time. It illustrates how tax credits and residuals values affect TCO and how the choice of re-charging sources affects total costs. Further, the use of ETS forecasts for utility costs provides a reasonable method for estimating energy costs. Finally, it highlights an issue that may require a policy solution: Grid demand increases based on increased EV demand. The solution might include PVS-BEV incentives.

Supplementary Materials

The following are available online at https://rminator.shinyapps.io/Vehicles/.

Author Contributions

Conceptualization through writing, L.F. The author has read and agreed to the published version of the manuscript.

Funding

This research received no external funding.

Conflicts of Interest

The author declares no conflict of interest.

References

  1. Baruník, J.; Křehlík, T. Combining high frequency data with non-linear models for forecasting energy market volatility. Expert Syst. Appl. 2016, 55, 222–242. [Google Scholar] [CrossRef]
  2. Sheldon, T.L.; DeShazo, J.R.; Carson, R.T. Electric and plug-in hybrid vehicle demand: Lessons for an emerging market. Econ. Inq. 2017, 55, 695–713. [Google Scholar] [CrossRef]
  3. Coffman, M.; Bernstein, P.; Wee, S. Electric vehicles revisited: A review of factors that affect adoption. Transp. Rev. 2017, 37, 79–93. [Google Scholar] [CrossRef]
  4. DeLuchi, M.; Wang, Q.; Sperling, D. Electric vehicles: Performance, life-cycle costs, emissions, and recharging requirements. Transp. Res. Part A Gen. 1989, 23, 255–278. [Google Scholar] [CrossRef] [Green Version]
  5. Fulton, L.; Bastian, N. A Fuel Cost Comparison of Electric and Gas-Powered Vehicles. In Proceedings of the 2012 AutumnSim Conference on Energy, Climate and Environmental Modeling & Simulation, San Diego, CA, USA, 28–31 October 2012. [Google Scholar]
  6. Beggs, S.; Cardell, S.; Hausman, J. Assessing the potential demand for electric cars. J. Econom. 1981, 17, 1–19. [Google Scholar] [CrossRef]
  7. Hagman, J.; Ritzén, S.; Stier, J.J.; Susilo, Y. Total cost of ownership and its potential implications for battery electric vehicle diffusion. Res. Transp. Bus. Manag. 2016, 18, 11–17. [Google Scholar] [CrossRef] [Green Version]
  8. Yu, A.; Wei, Y.; Chen, W.; Peng, N.; Peng, L. Life cycle environmental impacts and carbon emissions: A case study of electric and gasoline vehicles in China. Transp. Res. Part D Transp. Environ. 2018, 65, 409–420. [Google Scholar] [CrossRef]
  9. Hackney, J.; De Neufville, R. Life cycle model of alternative fuel vehicles: Emissions, energy, and cost trade-offs. Transp. Res. Part A Policy Pract. 2001, 35, 243–266. [Google Scholar] [CrossRef]
  10. Park, C.; Xing, R.; Hanaoka, T.; Kanamori, Y.; Masui, T. Impact of Energy Efficient Technologies on Residential CO2 Emissions: A Comparison of Korea and China. Energy Procedia 2017, 111, 689–698. [Google Scholar] [CrossRef]
  11. Xu, B.; Lin, B. Regional differences of pollution emissions in China: Contributing factors and mitigation strategies. J. Clean. Prod. 2016, 112, 1454–1463. [Google Scholar] [CrossRef]
  12. Coffman, M.; Bernstein, P.; Wee, S. Integrating electric vehicles and residential solar PV. Transp. Policy 2017, 53, 30–38. [Google Scholar] [CrossRef]
  13. Delucchi, M.A.; Lipman, T.E. An analysis of the retail and lifecycle cost of battery-powered electric vehicles. Transp. Res. Part D Transp. Environ. 2001, 6, 371–404. [Google Scholar] [CrossRef] [Green Version]
  14. Lipman, T.E.; Delucchi, M.A. A retail and lifecycle cost analysis of hybrid electric vehicles. Transp. Res. Part D 2006, 11, 115–132. [Google Scholar] [CrossRef]
  15. Ahmadi, P.; Cai, X.M.; Khanna, M. Multicriterion optimal electric drive vehicle selection based on lifecycle emission and lifecycle cost. Int. J. Energy Res. 2018, 42, 1496–1510. [Google Scholar] [CrossRef]
  16. Palmer, K.; James, E.T.; John, N.; Zia, W. Total cost of ownership and market share for hybrid and electric vehicles in the UK, US and Japan. Appl. Energy 2018, 209, 108–119. [Google Scholar] [CrossRef]
  17. Prevedouros, P.; Mitropoulos, L. Impact of Battery Performance on Total Cost of Ownership for Electric Drive Vehicle. In Proceedings of the 2018 21st International Conference on Intelligent Transportation Systems (ITSC), Maui, HI, USA, 4–7 November 2018; pp. 1155–1160. [Google Scholar]
  18. Mitropoulos, L.K.; Prevedouros, P.D.; Kopelias, P. Total cost of ownership and externalities of conventional, hybrid and electric vehicle. Transp. Res. Procedia 2017, 24, 267–274. [Google Scholar] [CrossRef]
  19. Axsen, J.; Kurani, K.S. Hybrid, plug-in hybrid, or electric—What do car buyers want? Energy Policy 2013, 61, 532–543. [Google Scholar] [CrossRef]
  20. Danielis, R.; Giansoldati, M.; Rotaris, L. A probabilistic total cost of ownership model to evaluate the current and future prospects of electric cars uptake in Italy. Energy Policy 2018, 119, 268–281. [Google Scholar] [CrossRef]
  21. Weldon, P.; Morrissey, P.; O’Mahony, M. Long-term cost of ownership comparative analysis between electric vehicles and internal combustion engine vehicles. Sustain. Cities Soc. 2018, 39, 578–591. [Google Scholar] [CrossRef]
  22. Moon, S.; Lee, D.-J. An optimal electric vehicle investment model for consumers using total cost of ownership: A real option approach. Appl. Energy 2019, 253, 113494. [Google Scholar] [CrossRef]
  23. Khan, S.; Ahmad, A.; Ahmad, F.; Shafaati Shemami, M.; Saad Alam, M.; Khateeb, S. A Comprehensive Review on Solar Powered Electric Vehicle Charging System. Smart Sci. 2018, 6, 54–79. [Google Scholar] [CrossRef]
  24. Kelly, J.C.; MacDonald, J.S.; Keoleian, G.A. Time-dependent plug-in hybrid electric vehicle charging based on national driving patterns and demographics. Appl. Energy 2012, 94, 395–405. [Google Scholar] [CrossRef]
  25. Das, H.S.; Rahman, M.M.; Li, S.; Tan, C.W. Electric vehicles standards, charging infrastructure, and impact on grid integration: A technological review. Renew. Sustain. Energy Rev. 2020, 120, 109618. [Google Scholar] [CrossRef]
  26. Chandra Mouli, G.R.; Bauer, P.; Zeman, M. System design for a solar powered electric vehicle charging station for workplaces. Appl. Energy 2016, 168, 434–443. [Google Scholar] [CrossRef] [Green Version]
  27. Fulton, L.; Beauvais, B.; Brooks, M.; Kruse, C.S.; Lee, K. Green for the Environment and Green for the Pocketbook: A Decade of Living Sustainably. Preprints 2020. [Google Scholar] [CrossRef] [Green Version]
  28. Fulton, L. Ownership Cost Comparison of Battery Electric and Non-Plugin Hybrid Vehicles: A Consumer Perspective. Appl. Sci. 2018, 8, 1487. [Google Scholar] [CrossRef]
  29. Ernst, C.-S.; Hackbarth, A.; Madlener, R.; Lunz, B.; Uwe Sauer, D.; Eckstein, L. Battery sizing for serial plug-in hybrid electric vehicles: A model-based economic analysis for Germany. Energy Policy 2011, 39, 5871–5882. [Google Scholar] [CrossRef]
  30. Jaguemont, J.; Boulon, L.; Dubé, Y. A comprehensive review of lithium-ion batteries used in hybrid and electric vehicles at cold temperatures. Appl. Energy 2016, 164, 99–114. [Google Scholar] [CrossRef]
  31. Lieven, T.; Mühlmeier, S.; Henkel, S.; Waller, J.F. Who will buy electric cars? An empirical study in Germany. Transp. Res. Part D 2011, 16, 236–243. [Google Scholar] [CrossRef]
  32. Shin, J.; Hong, J.; Jeong, G.; Lee, J. Impact of electric vehicles on existing car usage: A mixed multiple discrete–continuous extreme value model approach. Transp. Res. Part D 2012, 17, 138–144. [Google Scholar] [CrossRef]
  33. He, L.; Chen, W.; Conzelmann, G. Impact of vehicle usage on consumer choice of hybrid electric vehicles. Transp. Res. Part D 2012, 17, 208–214. [Google Scholar] [CrossRef]
  34. He, H.; Fan, J.; Li, Y.; Li, J. When to switch to a hybrid electric vehicle: A replacement optimisation decision. J. Clean. Prod. 2017, 148, 295–303. [Google Scholar] [CrossRef]
  35. Özdemir, E.D.; Hartmann, N. Impact of electric range and fossil fuel price level on the economics of plug-in hybrid vehicles and greenhouse gas abatement costs. Energy Policy 2012, 46, 185–192. [Google Scholar] [CrossRef]
  36. Silva, C.; Farias, T.; Ross, M. Evaluation of energy consumption, emissions and cost of plug-in hybrid vehicles. Energy Convers. Manag. 2009, 50, 1635–1643. [Google Scholar] [CrossRef]
  37. Werber, M.; Fischer, M.; Schwartz, P.V. Batteries: Lower cost than gasoline? Energy Policy 2009, 37, 2465–2468. [Google Scholar] [CrossRef]
  38. Weiller, C. Plug-in hybrid electric vehicle impacts on hourly electricity demand in the United States. Energy Policy 2011, 39, 3766–3778. [Google Scholar] [CrossRef]
  39. Fulton, L.; McMurry, L.T.C.P.; Kerr, C.O.L.B. A Monte Carlo Simulation of Air Ambulance Requirements During Major Combat Operations. Mil. Med. 2009, 174, 610–614. [Google Scholar] [CrossRef] [Green Version]
  40. R Core Team. R: A Language and Environment for Statistical Computing; R Core Team: Vienna, Austria, 2018. [Google Scholar]
  41. Chang, W.; Cheng, J.; Allaire, J.J.; Xie, Y.; McPherson, J. Shiny: Web Application Framework for R. 2019. Available online: https://shiny.rstudio.com/reference/shiny/1.4.0/shiny-package.html (accessed on 1 May 2020).
  42. LowCVP. LowCVP Study Demonstrates the Increasing Importance of Measuring Whole Life Carbon Emissions to Compare Vehicle Performance. Available online: https://d1v9sz08rbysvx.cloudfront.net/ricardo/media/media/news%20assets/lowcvp%20study%20demonstrates%20importance%20of%20whole%20life%20co2%20emissions.pdf (accessed on 27 April 2020).
  43. Barbose, G.; Darghouth, N. Tracking the Sun|Electricity Markets and Policy Group. 2019. Available online: https://emp.lbl.gov/tracking-the-sun (accessed on 27 April 2020).
  44. Fulton, L.; Bradley, B.; Matthew, B.; Clemens Scott, K.; Lee, K. A Publicly Available Cost Simulation of Sustainable Construction Options for Residential Houses. Sustainability 2020, 12, 2873. [Google Scholar] [CrossRef] [Green Version]
  45. Average Annual Miles per Driver by Age Group. Available online: https://www.fhwa.dot.gov/ohim/onh00/bar8.htm (accessed on 27 April 2020).
  46. U.S. Energy Information Administration (EIA). Available online: https://www.eia.gov/ (accessed on 27 April 2020).
  47. Hyndman, R.A.G. Forecasting: Principles and Practice; OTexts: Melbourne, Australia, 2019. [Google Scholar]
  48. Breetz, H.L.; Salon, D. Do electric vehicles need subsidies? Ownership costs for conventional, hybrid, and electric vehicles in 14 U.S. cities. Energy Policy 2018, 120, 238–249. [Google Scholar] [CrossRef]
  49. Total Cost of Ownership of an Electric Car|PluginCars.com. Available online: https://www.plugincars.com/eight-factors-determining-total-cost-ownership-electric-car-127528.html (accessed on 21 April 2020).
  50. Xia, Y.; Yang, J.; Liu, Z.; Dong, J. Cost-Effectiveness Analysis of Plug-In Hybrid Electric Vehicles using Vehicle Usage Data Collected in Shanghai, China. Transp. Res. Rec. 2019, 2673, 251–261. [Google Scholar] [CrossRef]
  51. Alternative Fuels Data Center: Emissions from Hybrid and Plug-In Electric Vehicles. Available online: https://afdc.energy.gov/vehicles/electric_emissions.html#wheel (accessed on 21 April 2020).
  52. E.P.A. Federal and California Light-Duty Vehicle Emissions Standards for Air Pollution, EPA-420-B-19-043. 2019. Available online: https://nepis.epa.gov/Exe/ZyPDF.cgi?Dockey=P100XCIV.pdf (accessed on 21 April 2020).
  53. Randolph, J.; Masters, G.M. Transportation Energy and Efficient Vehicles. In Energy for Sustainability: Foundations for Technology, Planning, and Policy; Randolph, J., Masters, G.M., Eds.; Island Press/Center for Resource Economics: Washington, DC, USA, 2018; pp. 389–428. [Google Scholar] [CrossRef]
  54. Moody’s. Electric Vehicle Residual Value Outlook. Available online: https://www.moodysanalytics.com/-/media/presentation/2017/electric-vehicle-residual-value-outlook.pdf (accessed on 28 April 2020).
  55. Harper, G.; Sommerville, R.; Kendrick, E.; Driscoll, L.; Slater, P.; Stolkin, R.; Walton, A.; Christensen, P.; Heidrich, O.; Lambert, S.; et al. Recycling lithium-ion batteries from electric vehicles. Nature 2019, 575, 75–86. [Google Scholar] [CrossRef] [PubMed] [Green Version]
  56. Berjoz, D.J.I. Influence of batteries weight on electric automobile performance. Eng. Rural Dev. 2017, 24, 1388–1394. [Google Scholar]
  57. Ma, S.X.; Junping, J.; Xiao, M. Comparative Life Cycle Energy and GHG Emission Analysis for BEVs and PhEVs: A Case Study in China. Energies 2019, 12, 834. [Google Scholar] [CrossRef] [Green Version]
  58. Narassimhan, E.; Johnson, C. The role of demand-side incentives and charging infrastructure on plug-in electric vehicle adoption: Analysis of US States. Environ. Res. Lett. 2018, 13, 074032. [Google Scholar] [CrossRef] [Green Version]
  59. Falahati, B.; Shahverdi, M.; Mohajeryami, S.; Fajri, P. Examining the impact of PHEVs on GHG emissions based on various objectives. In Proceedings of the 2017 IEEE Conference on Technologies for Sustainability (SusTech), Phoenix, AZ, USA, 12–14 November 2017; pp. 1–5. [Google Scholar]
  60. Li, J.; Yang, B. Analysis of greenhouse gas emissions from electric vehicle considering electric energy structure, climate and power economy of ev: A China case. Atmos. Pollut. Res. 2020. [Google Scholar] [CrossRef]
  61. Guo, Z.; Zhou, Y. Residual value analysis of plug-in vehicles in the United States. Energy Policy 2019, 125, 445–455. [Google Scholar] [CrossRef]
  62. Manjunath, A.; Gross, G. Towards a meaningful metric for the quantification of GHG emissions of electric vehicles (EVs). Energy Policy 2017, 102, 423–429. [Google Scholar] [CrossRef]
  63. EEI Celebrates 1 Million Electric Vehicles on U.S. Roads. Available online: https://www.eei.org/resourcesandmedia/newsroom/Pages/Press%20Releases/EEI%20Celebrates%201%20Million%20Electric%20Vehicles%20on%20U-S-%20Roads.aspx (accessed on 30 April 2020).
  64. Falahati, S.; Taher, S.A.; Shahidehpour, M. A new smart charging method for EVs for frequency control of smart grid. Int. J. Electr. Power Energy Syst. 2016, 83, 458–469. [Google Scholar] [CrossRef]
  65. Kapustin, N.O.; Grushevenko, D.A. Long-term electric vehicles outlook and their potential impact on electric grid. Energy Policy 2020, 137, 111103. [Google Scholar] [CrossRef]
  66. Hidrue, M.K.; Parsons, G.R.; Kempton, W.; Gardner, M.P. Willingness to pay for electric vehicles and their attributes. Resour. Energy Econ. 2011, 33, 686–705. [Google Scholar] [CrossRef] [Green Version]
Figure 1. Simulation flowchart.
Energies 13 02569 g001
Figure 2. Actual energy costs and Error, Trend, Seasonality forecasts by source.
Energies 13 02569 g002
Figure 3. Break-even for Scenario 1 (curved line is a smoothed error curve estimate). Cost and environmental metrics for Scenario 1.
Energies 13 02569 g003
Figure 4. Cost and environmental metrics for Scenario 1.
Energies 13 02569 g004
Figure 5. Break-even for Scenario 2.
Energies 13 02569 g005
Figure 6. Cost and environmental metrics from Scenario 2.
Energies 13 02569 g006
Table 1. Parameter Options in the Simulation.
Parameter/VariableOptionsDefault
Month of purchaseJanuary, February,…DecemberApril
Year of purchase2020, 2021, 20222020
State of use50 statesTexas
Vehicle TypeGas, NPHEV, PHEV, BEVGas
Residential Power for EVElectric, Natural Gas, SolarElectric
Monthly Driving Distance100 to 20,000 miles1100 miles
Years of Ownership1 to 108 years
% of Vehicle Power by Battery0 to 1000%
Vehicle Purchase Cost$10,000 to $20,000$30,000
Miles Per Gallon (Gas)0 to 12030 MPG
Tax Credit0 to 30%0%
EV kWh/mile0.2 to 0.50.34 EV kWh/mile
Charging Station Cost for Home$0 to $3000$0
Cost of Solar Panels: $/Watt$2 to $5$3.3
Table 2. Vehicle Emissions Analysis from Previous Study.
Vehicle TypeEstimated Lifecycle Emissions (Tonnes CO2e)Proportion of Emissions from ProductionEstimated Emissions in Production (Tonnes CO2e)
ICEV2423%5.6
NPHEV2131%6.5
PHEV1935%6.7
BEV1946%8.8
2015 vehicle after 150 k KM with 10% ethanol blend and 500 g/kWh grid electricity.
Table 3. Simulation emissions estimates by selected vehicle type.
Vehicle TypeNOx + NMOG, mg/mileCO2, g/mileCO, g/milePM, mg/mile
ICEV1604754.210
NPHEV *1283233.010
PHEV951702.110
BEV0.0700.00
* imputed as mean of ICEV and PHEV.

