Article

Erosion Characteristics and the Corresponding Self-Resonating Oscillations of Cavitating Jet on Oblique Surfaces

School of Mechanical Engineering, University of Science & Technology Beijing, Beijing 100083, China
*
Author to whom correspondence should be addressed.
Energies 2020, 13(10), 2563; https://doi.org/10.3390/en13102563
Submission received: 25 April 2020 / Revised: 11 May 2020 / Accepted: 13 May 2020 / Published: 18 May 2020

Abstract

:
The erosion and the corresponding self-resonating oscillations of the cavitating jet were experimentally investigated on the oblique surfaces. To evaluate the intensities of erosion and self-resonating oscillations of the jet, mass loss, surface morphology of the eroded specimens, upstream fluctuating pressure and unsteady cavitation noise were obtained at a series of stand-off distance ratios l d / d t in the cases where the oblique angles are α = 0°, 5°, 15° and 30°. In the low l d / d t range, with the increase of α , the erosion gradually transforms from two isolated circular erosion rings at α = 0° into irregular oval shaped rings at α = 5° and separated horseshoe shaped rings at α = 15°. The self-resonating oscillations and cavitation were weak in this range because the dominating frequency f 0 is away from the design frequency of the organ-pipe nozzle, resulting in the depressed aggressive ability in the low l d / d t range. With increasing l d / d t , the cavitation is enhanced before the self-resonating oscillations achieving more energy. The spectral decomposition reveals the existence of an intermediate state at the optimum standoff distance, where the energy of self-resonating oscillations and the cavitation reach a balance to realize the severest erosion damage.

1. Introduction

The aggressive ability of a self-resonating cavitating jet has been the subject of extensive research due to its relevance with many engineering applications including underground drilling [1,2] and ocean mining [3]. It has been well demonstrated that the cavitating water jet generates ring-like cavitation clouds, which periodically shedding from the nozzle and impinging on the target surface [4]. Unsteady pressure impacts caused by the bubble collapse near the rigid boundary can cause plastic deformation pits and erosion damage on the target surface [5,6,7].
To describe the cavitation erosion of the jet in detail, mass loss and surface morphology serve as two distinctive features to exhibit the aggressive ability. Previous studies have placed attention on normal cavitating jet impingement and their erosion properties. Lichtarowicz [8] experimentally investigated variation of the erosion patterns and indicated that the ringlike erosion region radially expands with the increasing exposure time. As a function of the standoff distance under low ambient pressure conditions, two peaks of the mass loss were observed by Yamaguchi and Shimizu [9], Momma and Lichtarowicz [10] and Soyama [11], where the first peak is close to the nozzle bottom and the second peak exists at a longer standoff distance. The behaviors of the impinging flow were characterized into various regions by Yamauchi et al. [12], where the impinging ringlike vortex cavitation was observed around the standoff distance of the second peak, which results in a ring-shaped erosion area.
Attention has also been placed on the self-resonating oscillations of the cavitating jet and its utilization to assess the evolution of cavitation clouds. The self-excited resonances in the organ-pipe nozzle of a cavitating jet is generated through a feed-back mechanism at the nozzle exit, where the unsteady pipe pressure and acoustical characters were investigated as feasible approaches of sensing the intensity of cavitation [13,14,15,16]. The pressure oscillations in the nozzle tube were measured acoustically by Chahine et al. [17]. They indicted that the frequencies of these oscillations correlate well with that of the pressure fluctuations on the impinging target. Sato et al. [18] conducted the high-speed photography visualization to investigate the bubble clouds motions of the cavitating jet, where the radial spreading process of the cavitation clouds was observed during the impingement. Soyama [5] suggested that the dominating frequency of the fluctuating pressure impingement corresponds to the cloud shedding frequency or its sub-harmonics. As a consequence, the erosion behaviors and the flow characteristics of the normal impinging cavitating jet have been widely explored; however, the erosion characteristics under the effects of the oblique target is still unclear.
This paper focuses on the erosion and the corresponding self-resonating oscillations of the cavitating jet at a series of oblique surfaces. Systematic cavitating jet erosion tests were performed to address the role of these parameters in the erosion pattens and the self-resonating oscillations. The cavitating jet was generated by the organ-pipe nozzle under ambient pressure conditions. Experimental details are elaborated in Section 2, important results are analyzed and discussed in Section 3, and conclusions are given in Section 4.

2. Experimental Setup

2.1. Cavitating Jet Apparatus

In this study, as illustrated in Figure 1, experiments were conducted in a high pressure water jet erosion testing system. The cavitation number adopted in this study is defined as follows:
σ = p v p w p u p v ,
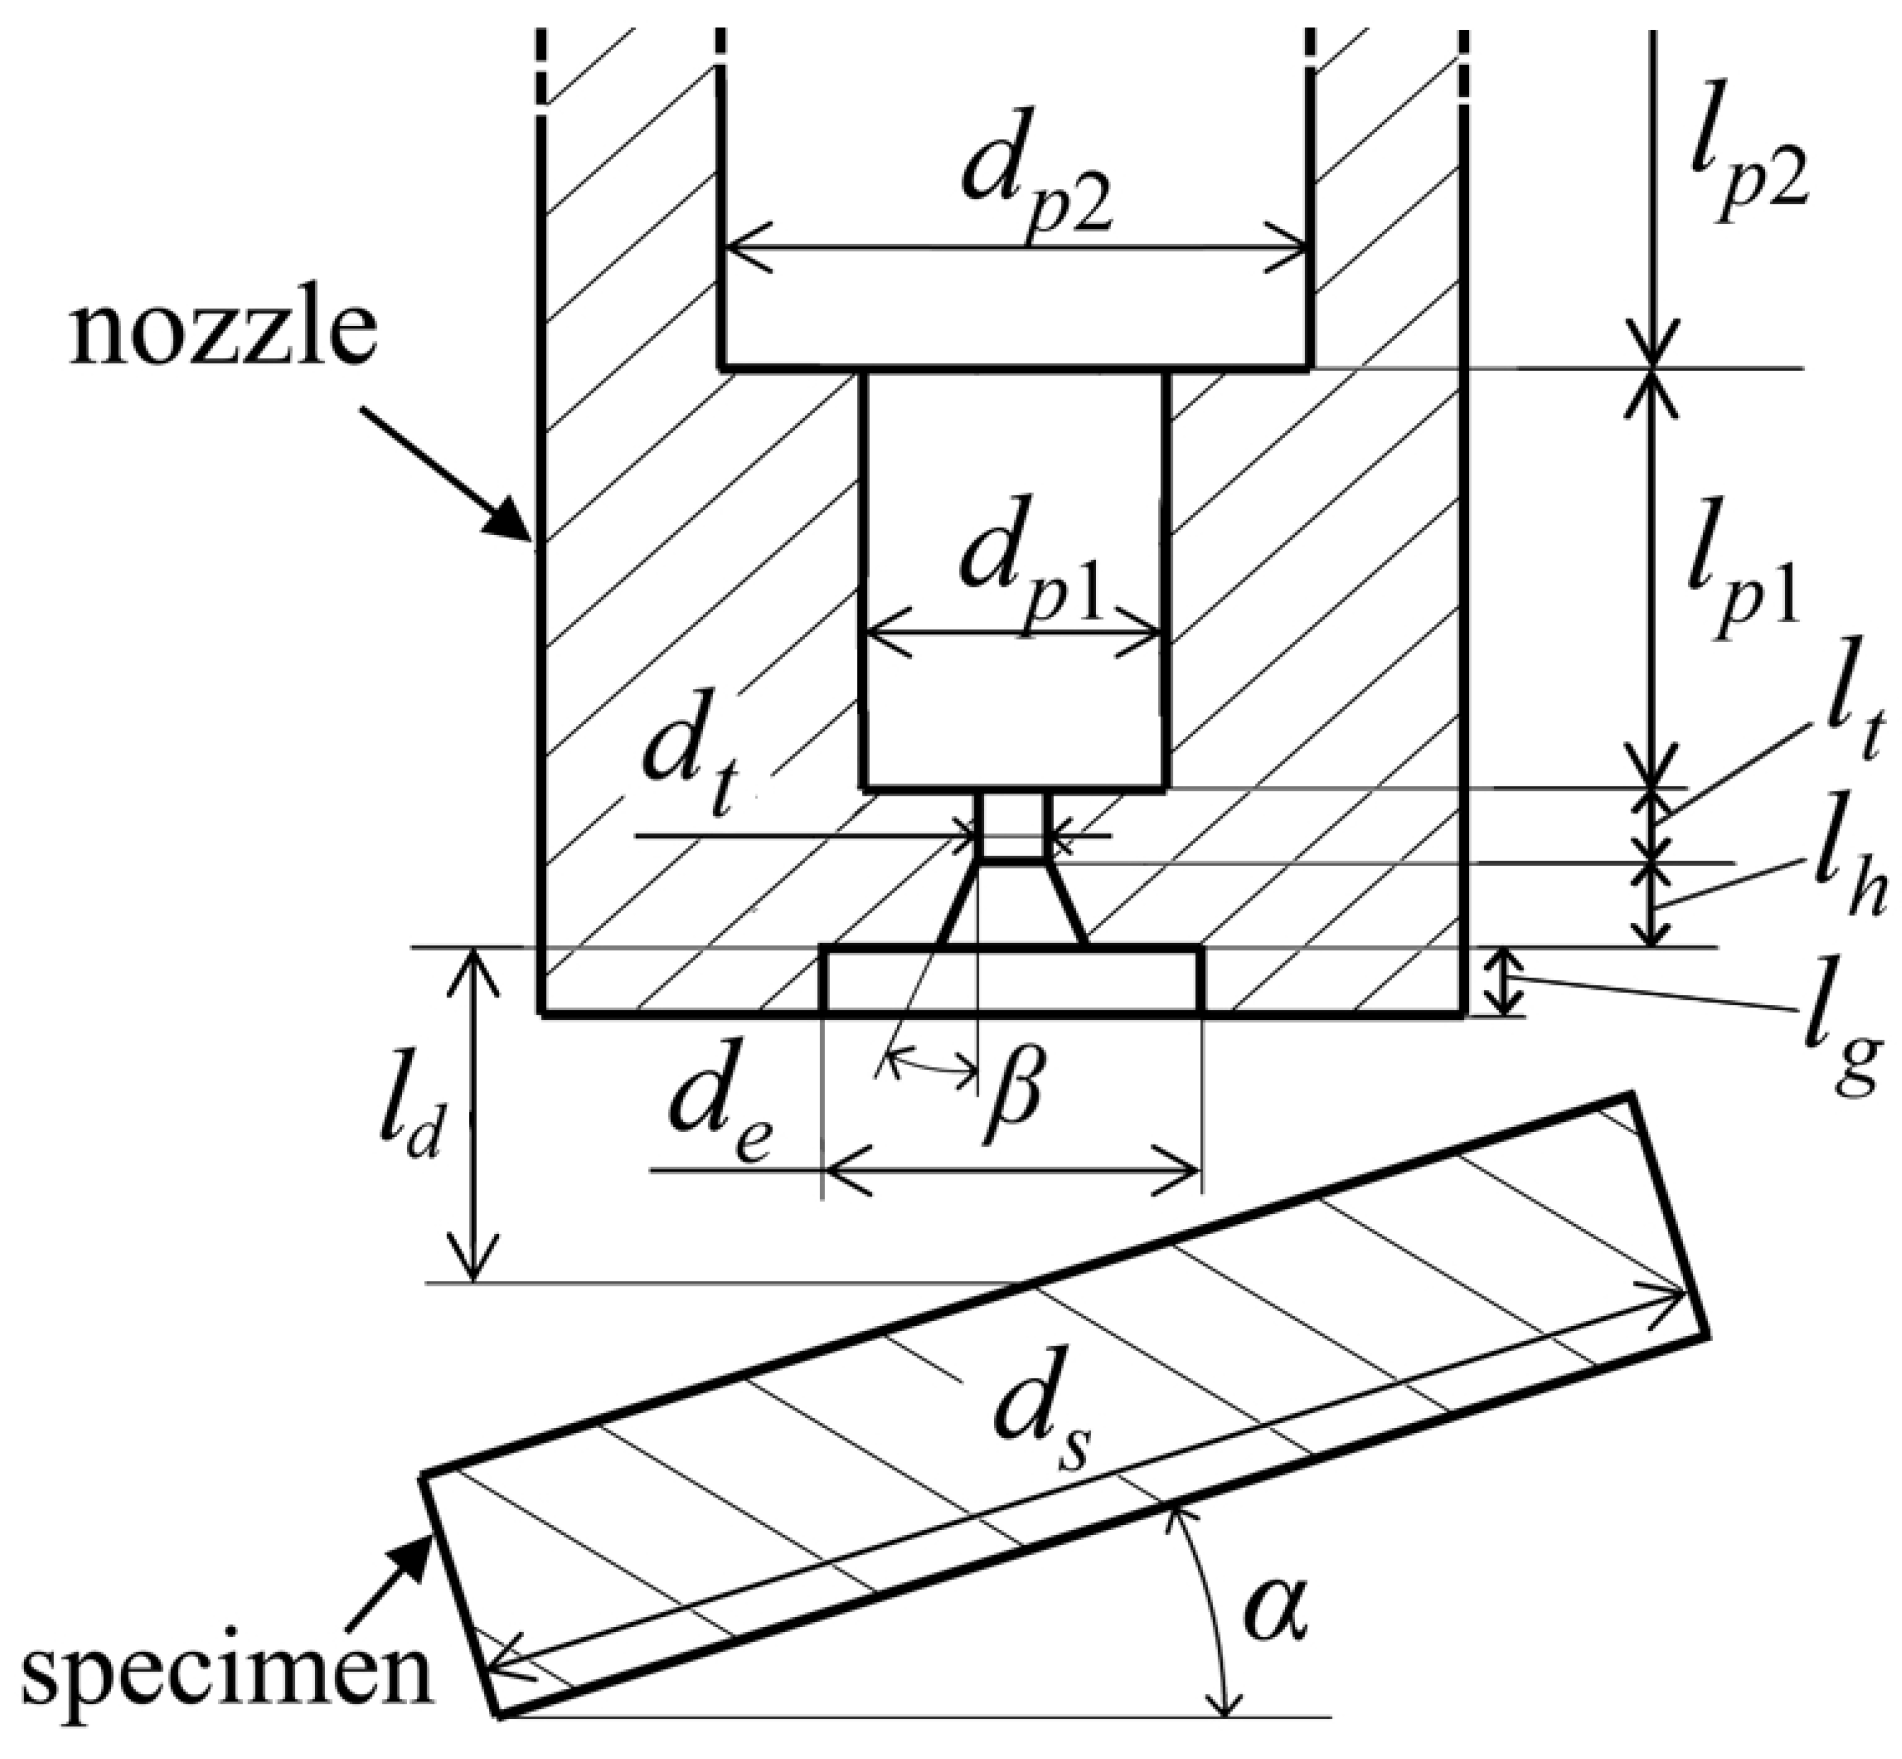
where p v is the ambient pressure in the vessel, p w is the vapor pressure of water and p u is the upstream injection pressure. The jet driving pressure was set at Δ p = p u p v = 12 MPa. The cavitation number was fixed at σ = 0.05 in all the cases. The schematic of the organ-pipe nozzle used in this study is presented in Figure 2 and the specific nozzle dimensions are listed in Table 1. A downstream guide pipe with short length at the nozzle exit was attached to achieve stronger aggressive ability [5,19,20].
The self-excited resonance induced pressure oscillations in the organ-pipe were monitored by a pressure transducer located at 70 d t upstream the nozzle bottom with 0.25% uncertainty. Similar monitor position was adopted by Chahine and Courbière [21], Sato et al. [22] and Testud et al. [23]. The serial tests were performed with the temperature of feeding water at 25 ± 1 °C. An electromagnetic relief valve was used to adjust the ambient pressure. To assess the intensity of the cavitation in the jet produced by the organ-pipe nozzle, the acoustical feedback of cavitation noise was obtained by a piezoelectric hydrophone (RHS-10), which has a sensitivity of −210 (±2.5) dB re 1 V/ μ Pa over a detectable frequency range of 1 to 200 kHz. The hydrophone located at 25 d t away from the nozzle axis parallel with the nozzle bottom [15,21,23,24]. The tests were conducted at a total exposure period T e = 300 s, where the erosion damage was in the acceleration stage. Starting at the exposure time T e = 240 s, each process of data acquisition took 10 seconds. The output signals of all the transducers were acquired by the LMS SCADAS SCM05 with a sampling frequency of 102.4 kHz.

2.2. Erosion Measurement

The testing cases with specific inclination angles α and the corresponding standoff distance ratios l d / d t are summarized in Table 2. The erosion tests at shorter l d under oblique angle α = 30° is difficult to be performed due to the restricted geometrical space between the nozzle and the oblique target. The specimens for all the tests were circular discs with a constant diameter d s = 40 mm. In this study, the pure aluminum 1070 A (Chinese standard) was selected as the specimen due to its moderate hardness and acceptable homogeneity [25]. The initial arithmetic average deviation of profile roughness of each testing specimen surface was polished to the value below 5 μ m. The nozzle was made of high-strength stainless tungsten steel YG15 to withstand the erosion damage from the high-frequency cavitation cloud collapse. The jet flow was separated from the specimen by a shutter during the process of the cavitation being built up.
The mass loss and the profiles of eroded surface are two representative characteristics to efficiently assess the cavitation erosion ability [9,26,27,28]. An electronic balance with the accuracy of 0.1 mg was used to measure the mass loss Δ m of air-dried specimens. The Marsurf M 300C roughness measuring instrument was used to obtain the profiles of the erosion area with resolution to 32 nm.

3. Results and Discussion

3.1. Mass Loss

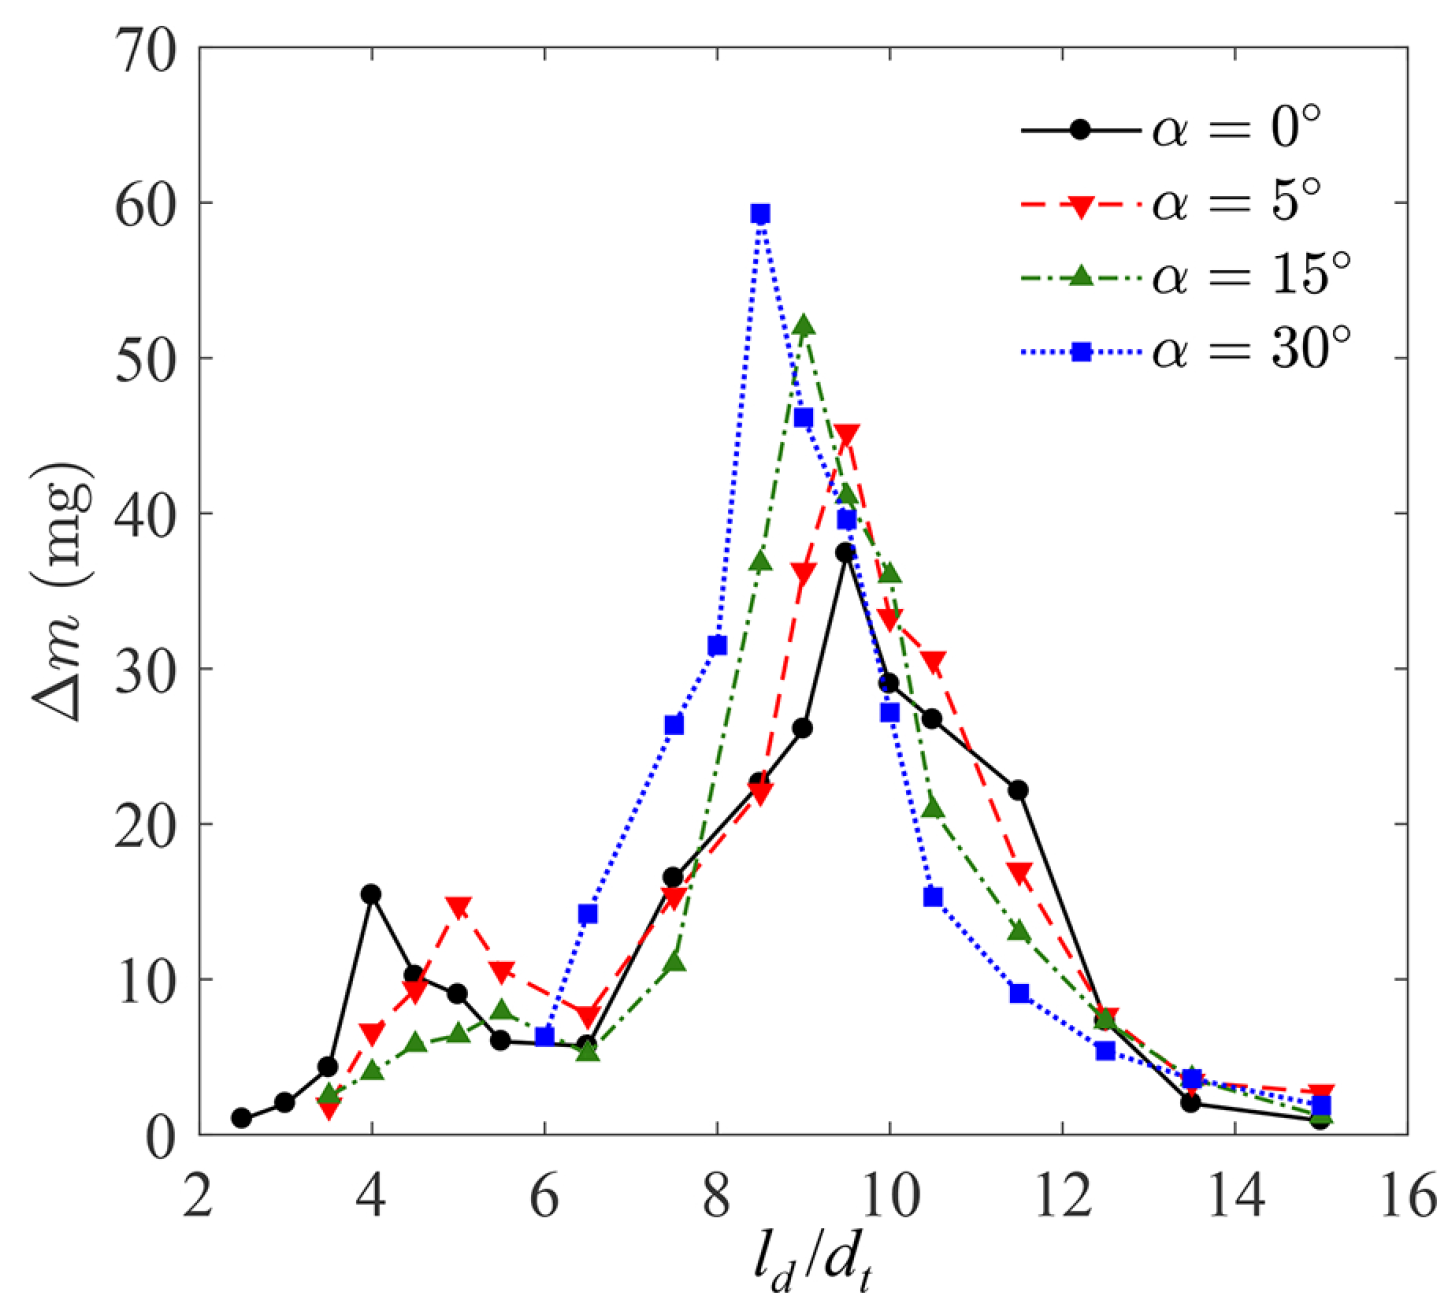
The total mass loss was measured to indicate the damage induced by cavitation erosion at various oblique angles, as shown in Figure 3. The mass loss Δ m exhibits two distinctive peaks with increasing standoff distance l d at the oblique angles α = 0°, 5° and 15°, respectively. Similar results were obtained by Momma [20], Soyama [29] and Yamaguchi and Shimizu [9] for the horizontal target with α = 0°. It is worth pointing that the valley of the mass loss at standoff distance ratio l d / d t = 6.5 is approximately independent of the increasing angle in α ∈ [0°, 15°].
The increase of oblique angle induces lower amplitude of mass loss and longer standoff distance of the first peak. However, the second peak of mass loss moves closer to the nozzle bottom, which causes severe cavitation erosion damage at larger oblique angles. The variation of mass loss suggests that the increasing α weakens the erosion ability of the cavitating jet when the target surface is located at lower standoff ratios, nevertheless, which promotes the occurrence of the maximum mass loss at a closer optimum standoff distance ratio and enhances the erosion damage. The decreasing mass loss is observed with larger l d / d t and finally the l d / d t is out of the effective range of erosion.

3.2. Erosion Characteristics

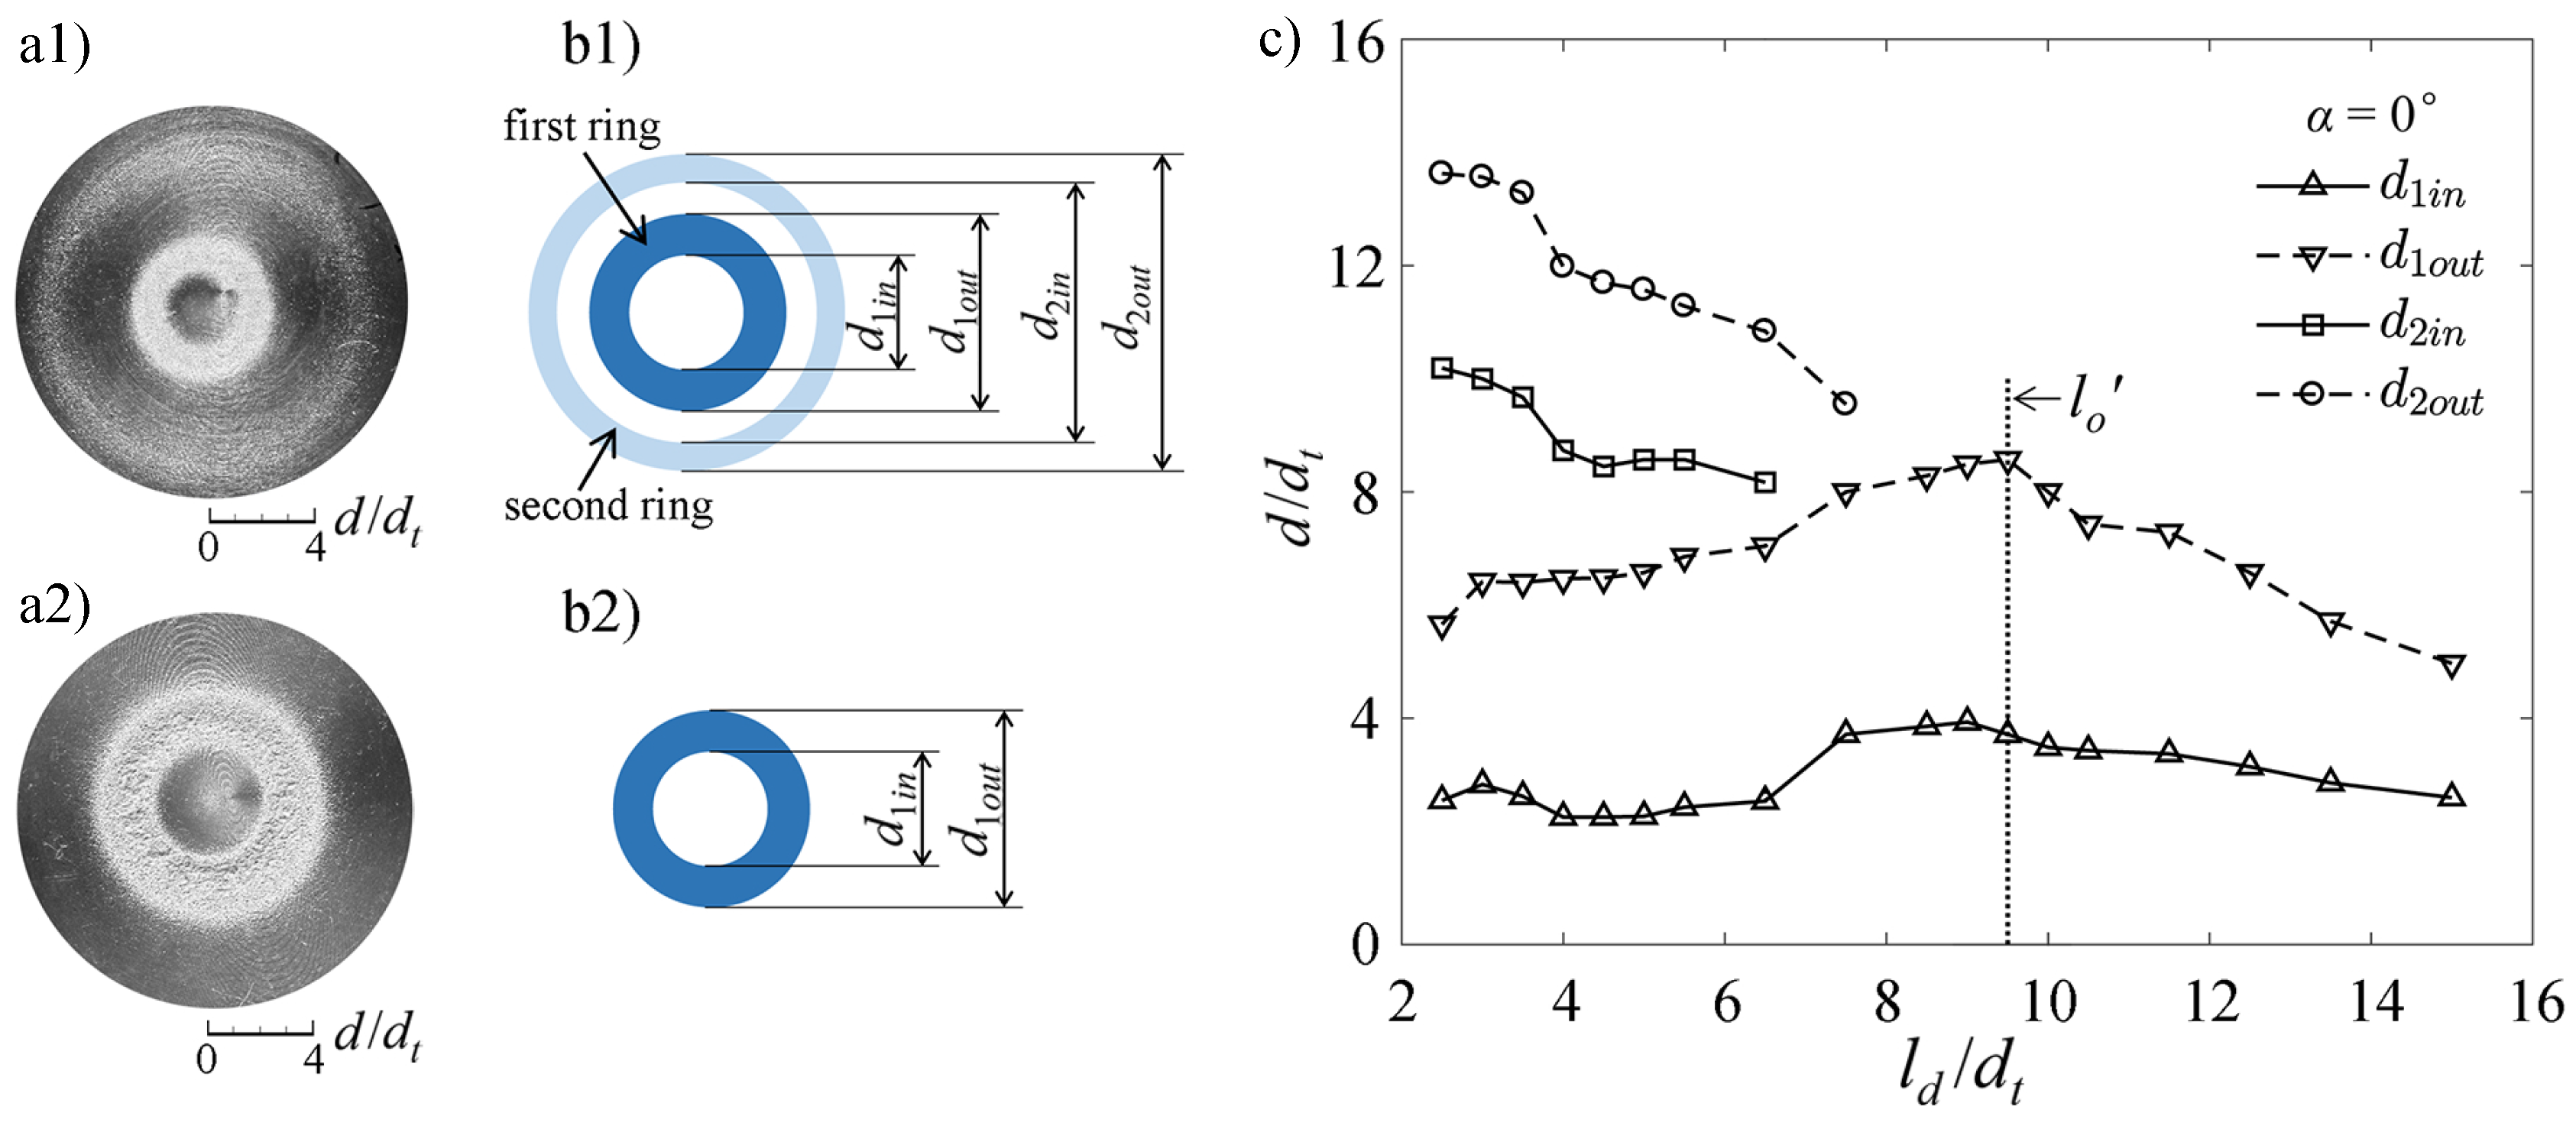
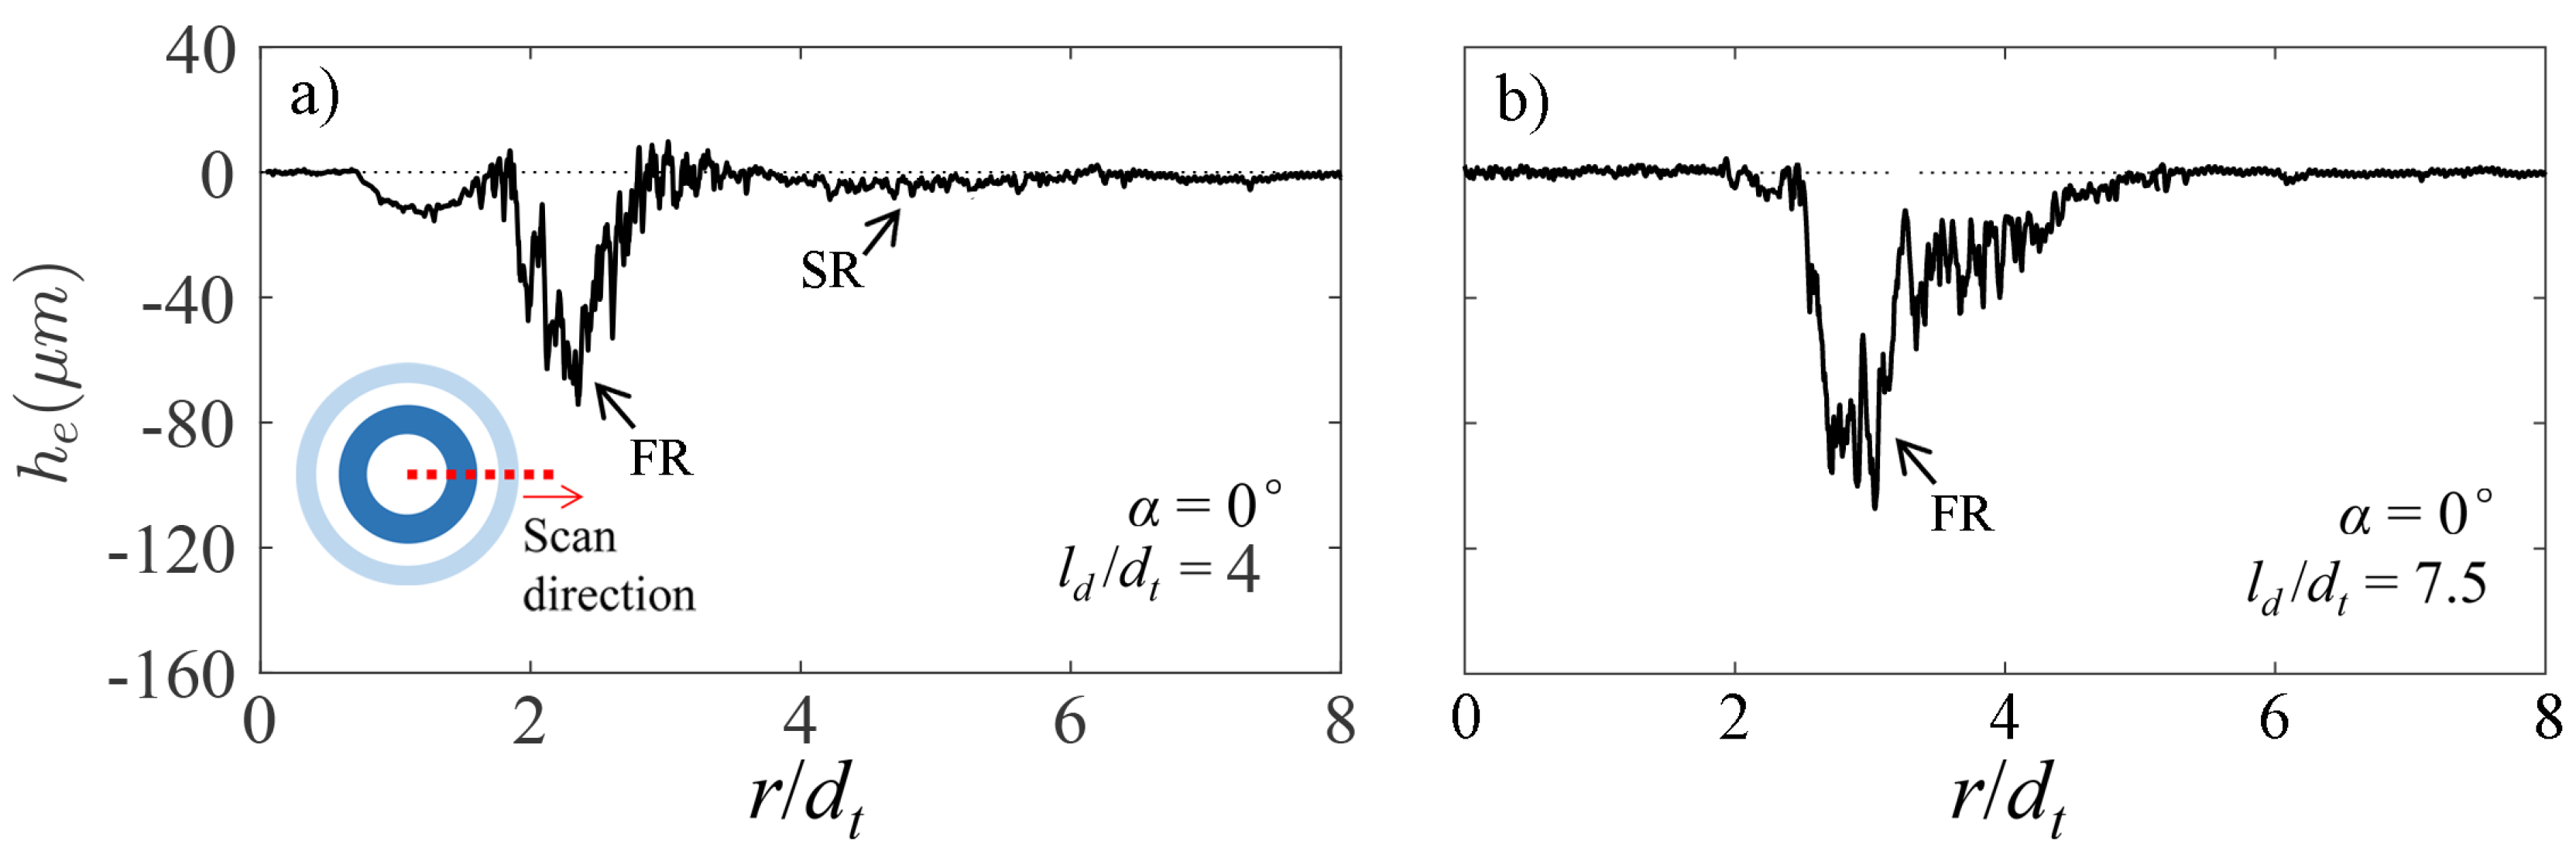
The effects of the standoff distance on the radial distribution of erosion area at α = 0° are presented in Figure 4. In the standoff range l d / d t ∈ [2.5 6.5], the radial distribution of erosion exhibits two annular regions on the target surface, as shown in Figure 4a1), where the diameter ratio is defined as d / d t . The flow is diverted to spread radially outward due to the stagnation region at the jet impinging center, with the collapse of cavitation clouds producing the first ring-like erosion areas on the target surface [20,29,30]. The shallow second erosion ring is mainly generated by the collapse of peripheral clouds [6,9,18,30]. The sectional profiles of the eroded area at l d / d t = 4 and l d / d t = 7.5 are presented in Figure 5a,b, respectively, where the radius ratio is defined as r / d t . Here, the erosion area with smaller diameter is labeled as the first ring (FR) and the other one with larger diameter as the second ring (SR).
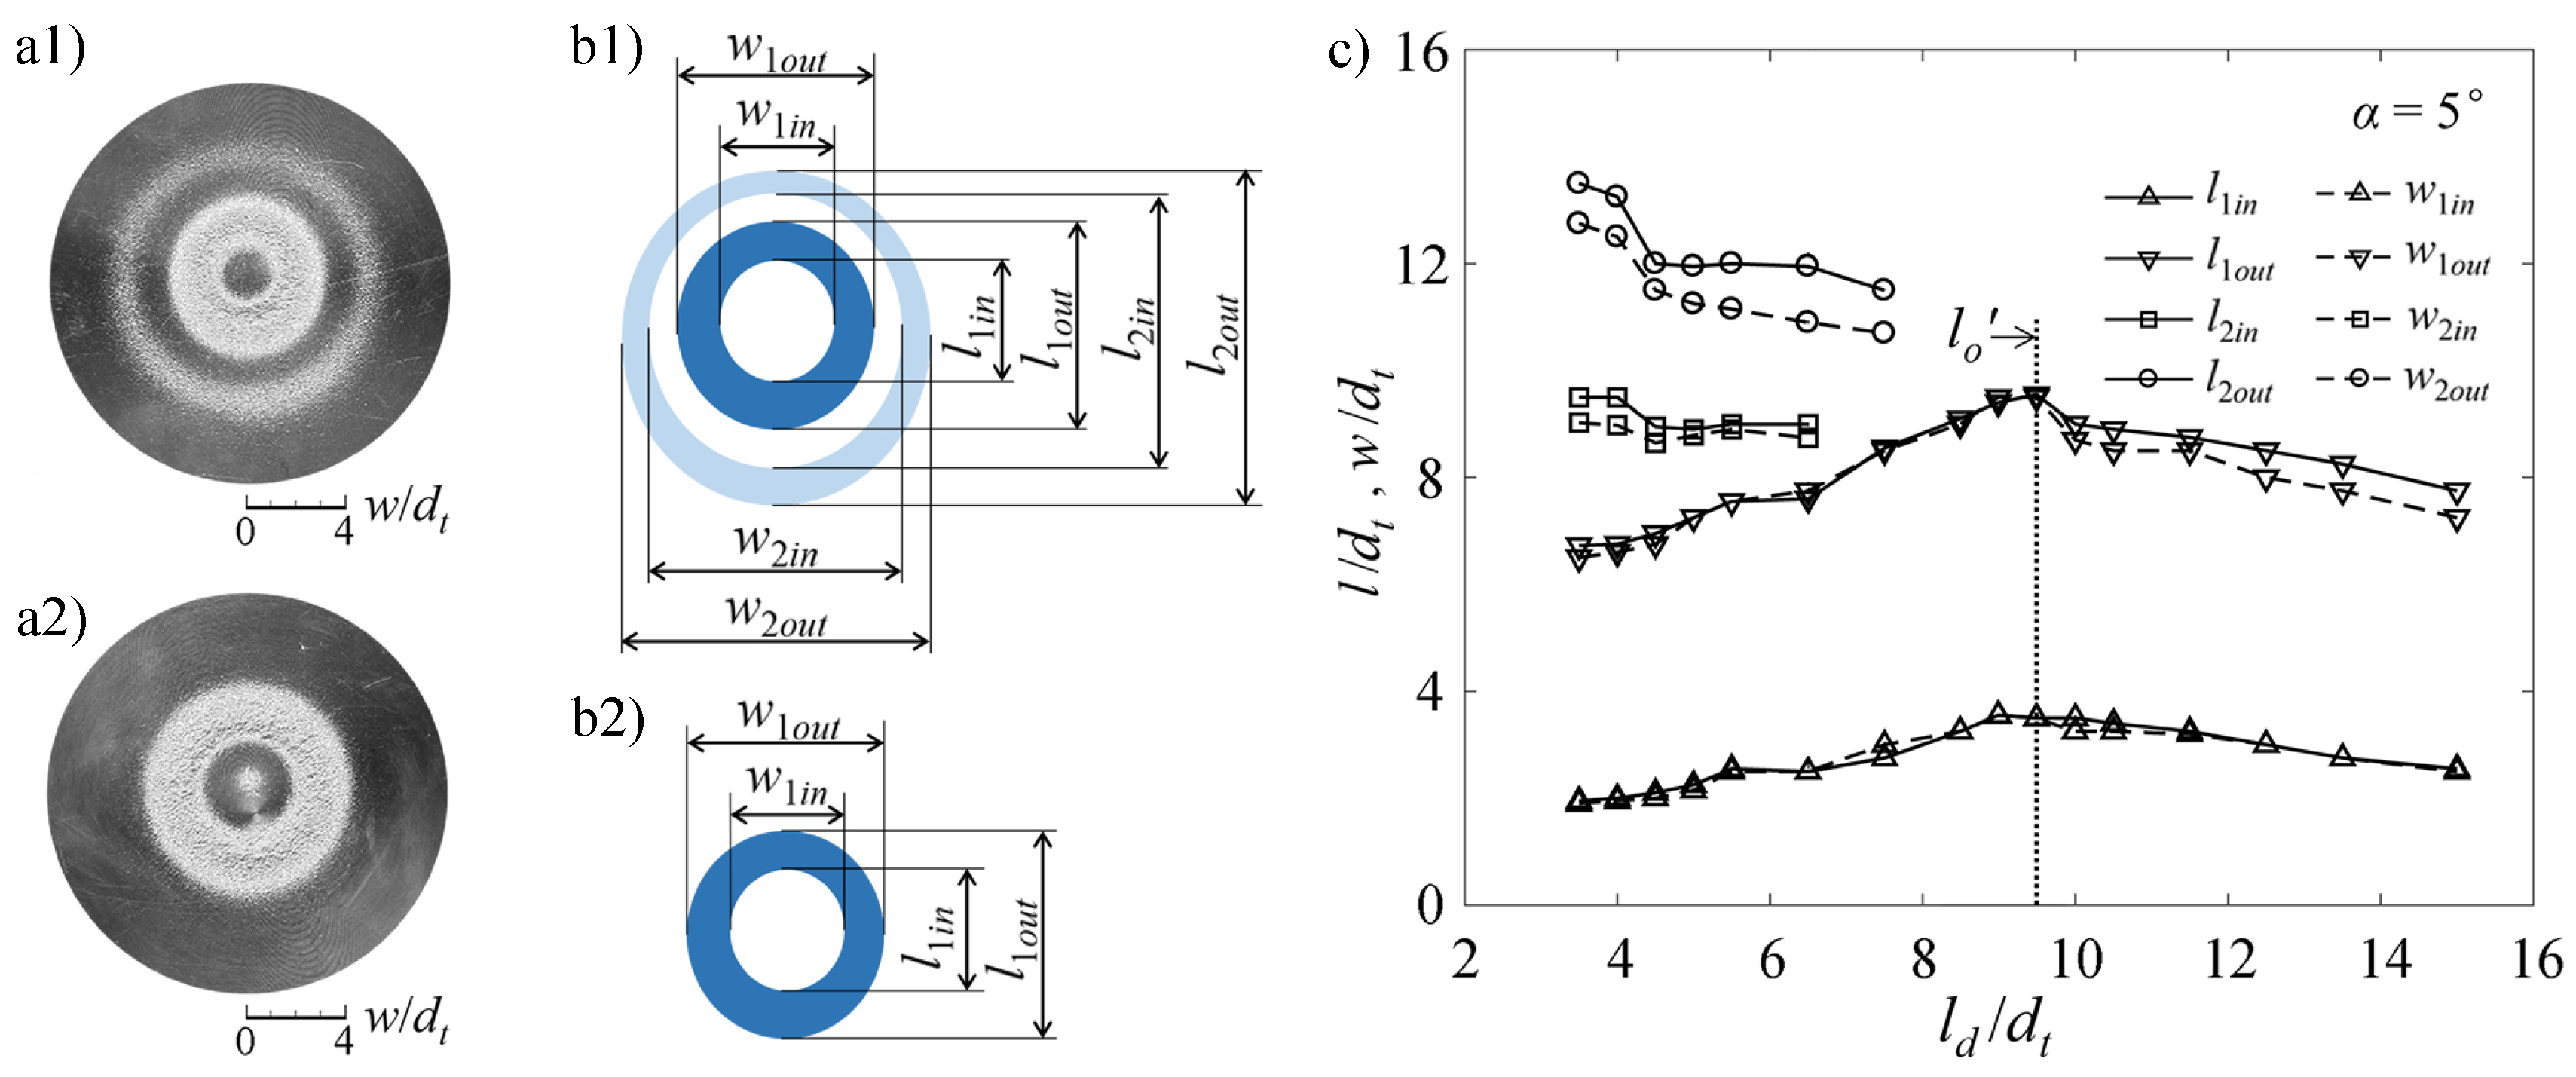
Erosion rings with irregular oval shape are caused by the oblique jet impingement at α = 5°, different from which in circular shape at α = 0°. The normal views of the eroded surface at the oblique angle α = 5° are presented in Figure 6a1,a2 for l d / d t = 5 and l d / d t = 10, respectively, where the top of the specimens are located closely to the nozzle bottom. The ratios of length and width of the erosion area are defined as l / d t and w / d t , respectively. The schematics of the erosion are illustrated in Figure 6b1,b2, where w 1 i n and w 1 o u t are the interior and exterior width of the first ring; l 1 i n and l 1 o u t are the interior and exterior vertical length of the first ring, receptively. The same characteristic width and length of the second ring are defined as w 2 i n , w 2 o u t , l 2 i n and l 2 o u t .
As shown in Figure 6c, the second erosion ring at α = 5° appears in an obvious oval-shape with the larger lengths of erosion area in the low l d / d t range. Similar to which at α = 0°, with the increasing l d / d t , the erosion area of the second ring shrinks and merges into the expanding first ring at the transition point. The respective erosion profiles in the longitudinal and transverse sections at l d / d t = 4 are presented in Figure 7a1,a2. The upper and lower parts of the second ring are labeled as SR1 and SR2, respectively, the same as FR1 and FR2 of the first ring. The erosion area at SR1 is narrower than that at SR2 and the erosion depth h e at FR1 is much larger than that at FR2. With further increase the standoff distance ratio l d / d t , as shown in Figure 6c, the erosion area of the first ring reaches the maximum at l o = 9.5, corresponding to the largest mass loss Δ m. The erosion depth at the upper side of the first ring FR1 is still larger than the one at FR2. The erosion sectional profiles suggest that, due to the jet impingement redirection induced by the oblique surface, the enhanced lower side wall flow disperses the cavitation clouds, which spread over a wider area; the upper side wall flow is spatially restricted while the clouds are concentrated and enhance the erosion.
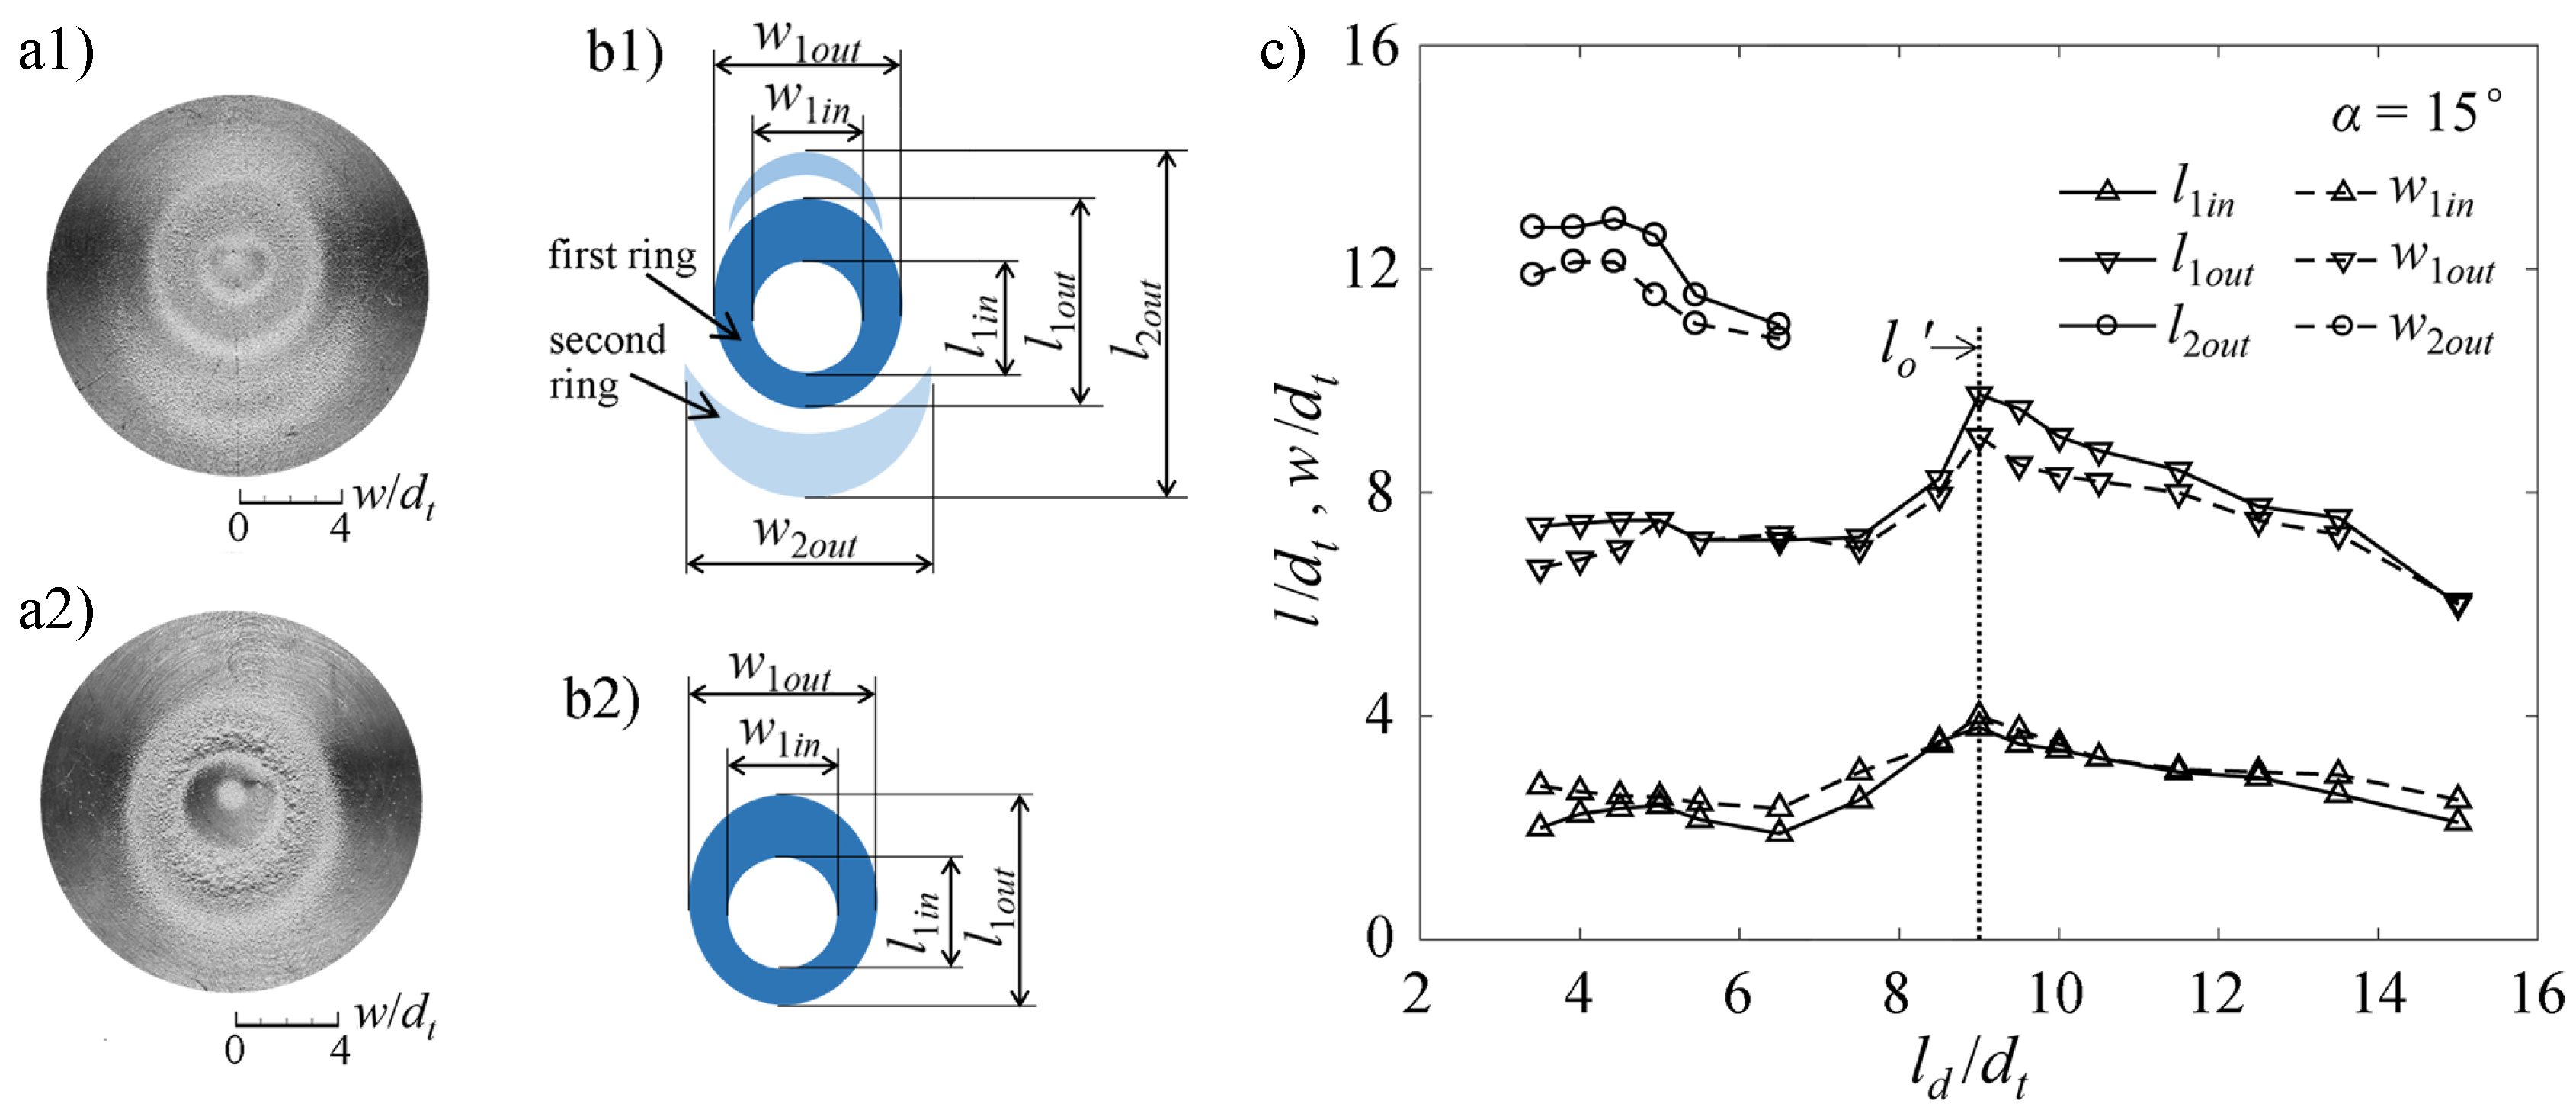
The erosion characteristics at α = 15° are illustrated in Figure 8. As shown in Figure 8a1 and Figure 9, the horseshoe-shaped erosion rings observed consist of the first ring with an entire oval-shape and the separated second ring including the upper part SR1 and the lower part SR2. Under the structure effect of the oblique surface at α = 15°, the collapse of the peripheral clouds at further radial locations is not enough to generate the entire second ring like that on the horizontal surface. With increase of l d / d t , the two isolated parts SR1 and SR2 sequentially merge into the first ring at l d / d t = 5.5 and 6.5. In the high l d / d t range, the variation of the erosion area, as a function of standoff distance ratio, is similar to which at α = 0° and α = 5°. It is worth noting that the optimum standoff distance ratio is shortened to l o = 9, corresponding to the maximum mass loss and the largest outer edge of the first ring.
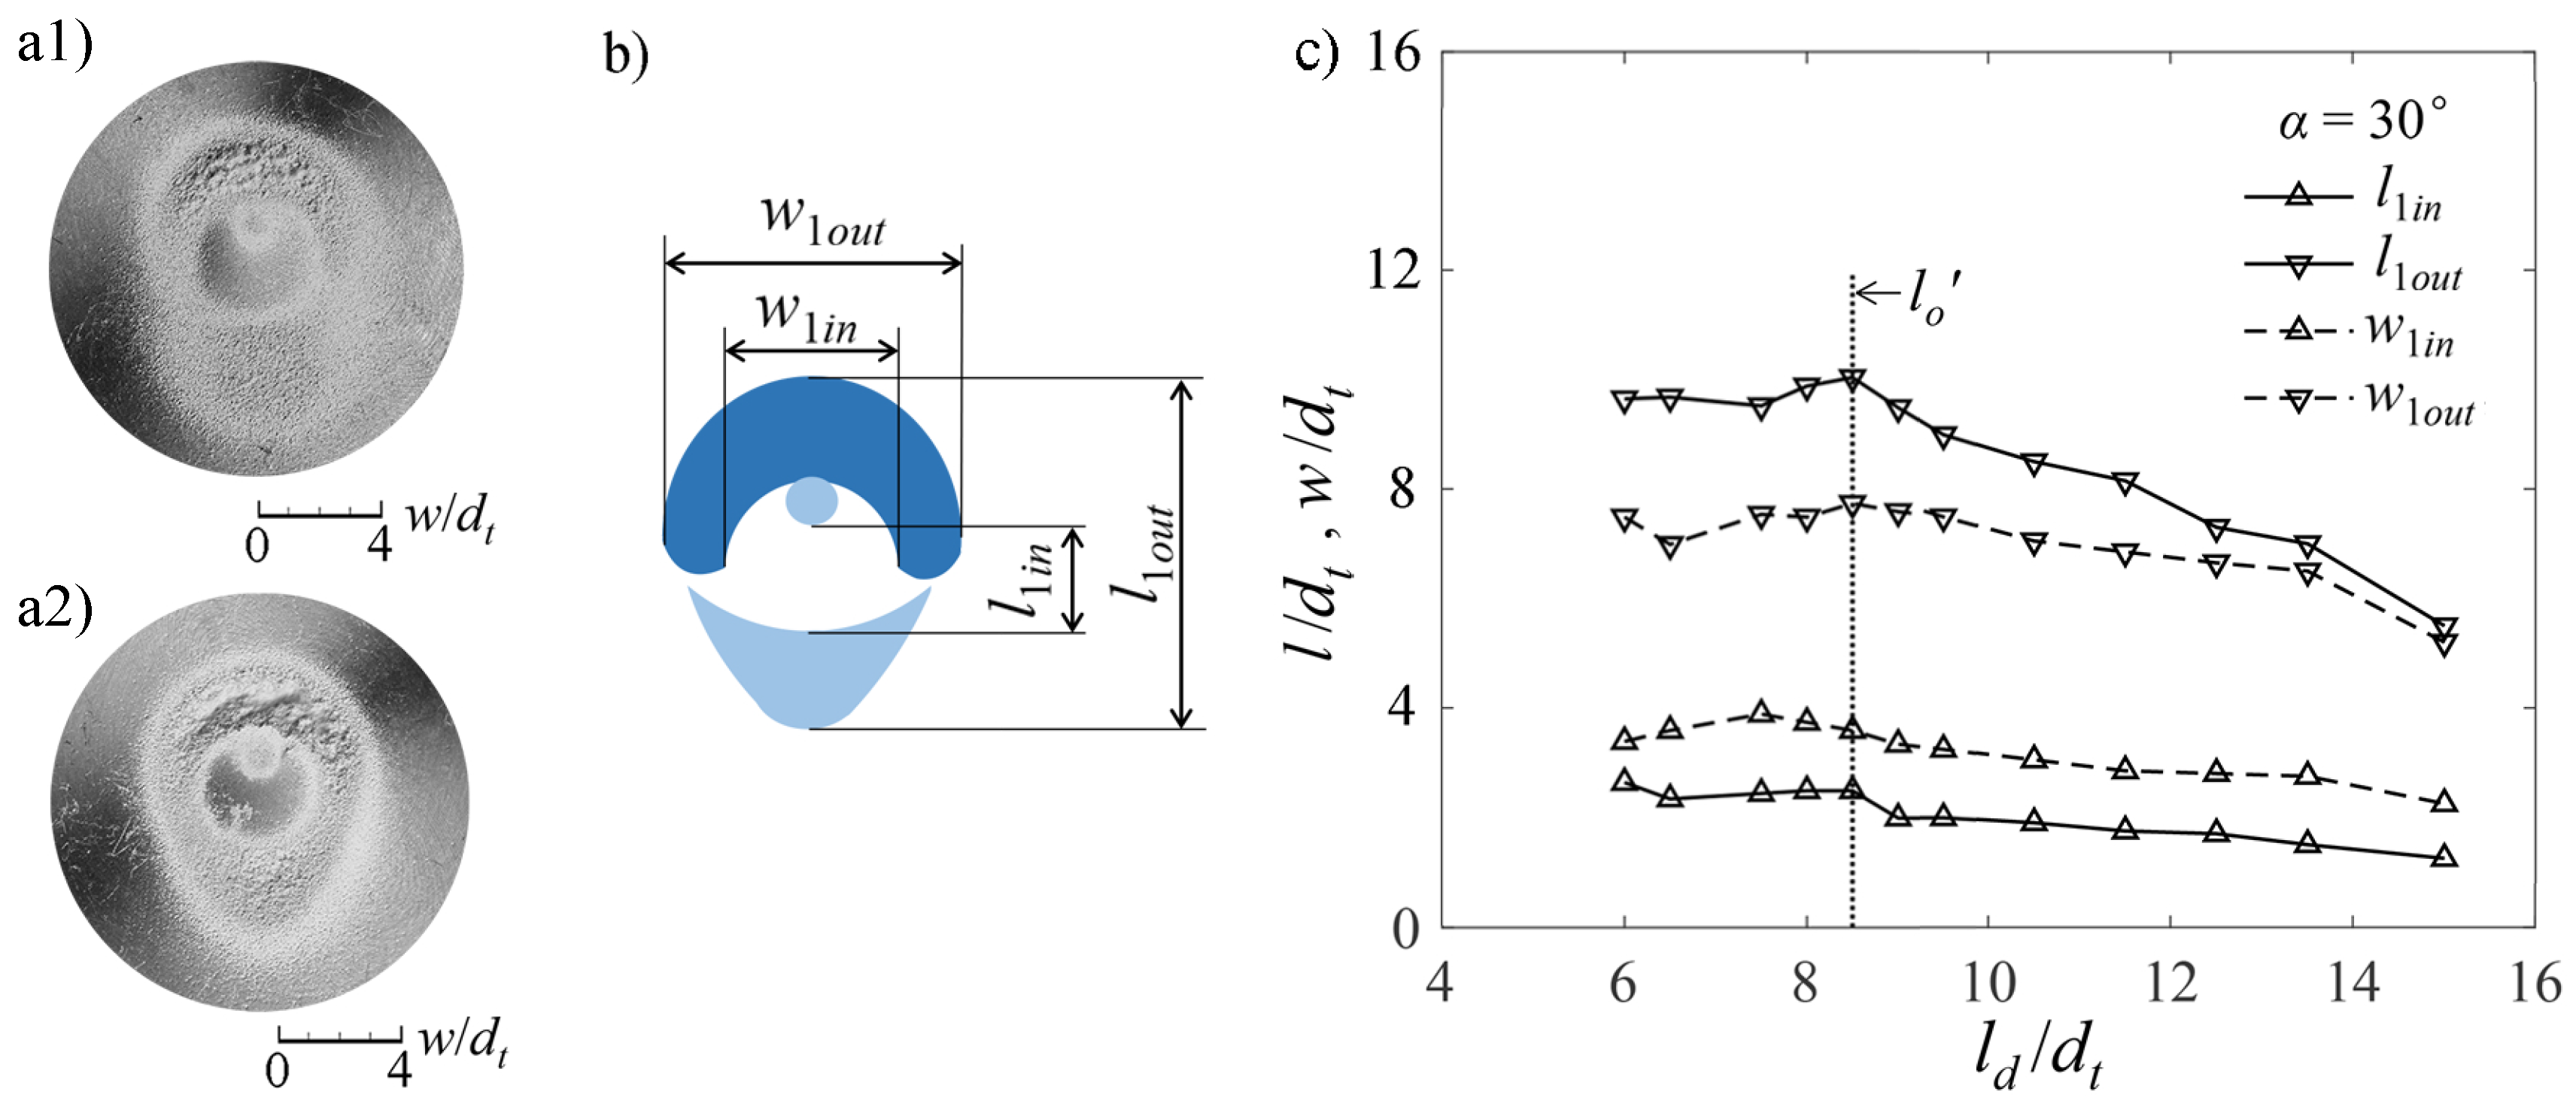
The erosion on the oblique surface at α = 30° is shown in Figure 10. The distribution of erosion area exhibits significant differences compared to that at α = 0°, 5°, 15°. In the range of tested standoff distance ratio l d / d t ∈ [6, 15], the outward second ring with shallow erosion depth is indiscernible due to the oblique surface modulation on the jet impingement and the cavitation clouds movement. The first ring with two separated erosion areas is observed at low standoff distance ratio, as shown in Figure 10a1 at l d / d t = 6.5. The two isolated parts merge into a single teardrop shape erosion ring with further increase of standoff distance, as shown in Figure 10a2 at l d / d t = 10.

3.3. Self-Resonating Oscillations

The correlation between the nozzle dimensions and the self-resonating characteristics were proposed by Chahine and Johnson [31] as follows:
l p d t = K n M a S t ( 1 + γ ) ,
where l p is the total length of the nozzle, M a is the local Mach number, γ is the correction factor. The Strouhal number is given by S t = f c d t / U m , where f c is the designed resonating frequency of the organ-pipe nozzle and U m is the mean axial velocity of the cavitating jet at the nozzle exit [22,23]. The parameter of the resonating mode K n is given by the relations:
K n = 2 n 1 4 f o r d p 1 d t > 1 M a n 2 f o r d p 1 d t < 1 M a ( n = 1 , 2 , 3 )
The design principle was further simplified as follows [17,28]:
l p 2 d t = K n ( l p 0.86 d t ) M a S t ,
According to Equation (4), the designed resonating frequency f c can be estimated as:
f c = K n ( l p 0.86 d t ) C l p 2 ,
where C is the sound speed in water. Previous studies have shown that the resonance in the organ-pipe is enhanced when the dominating frequency of self-resonating oscillations is close to the designed frequency f c [17,28,32]. For the organ-pipe nozzle used in this work, the first and second designed frequencies were approximately obtained at f c 1 = 11.971 kHz (n = 1) and f c 2 = 23.941 kHz (n = 2).
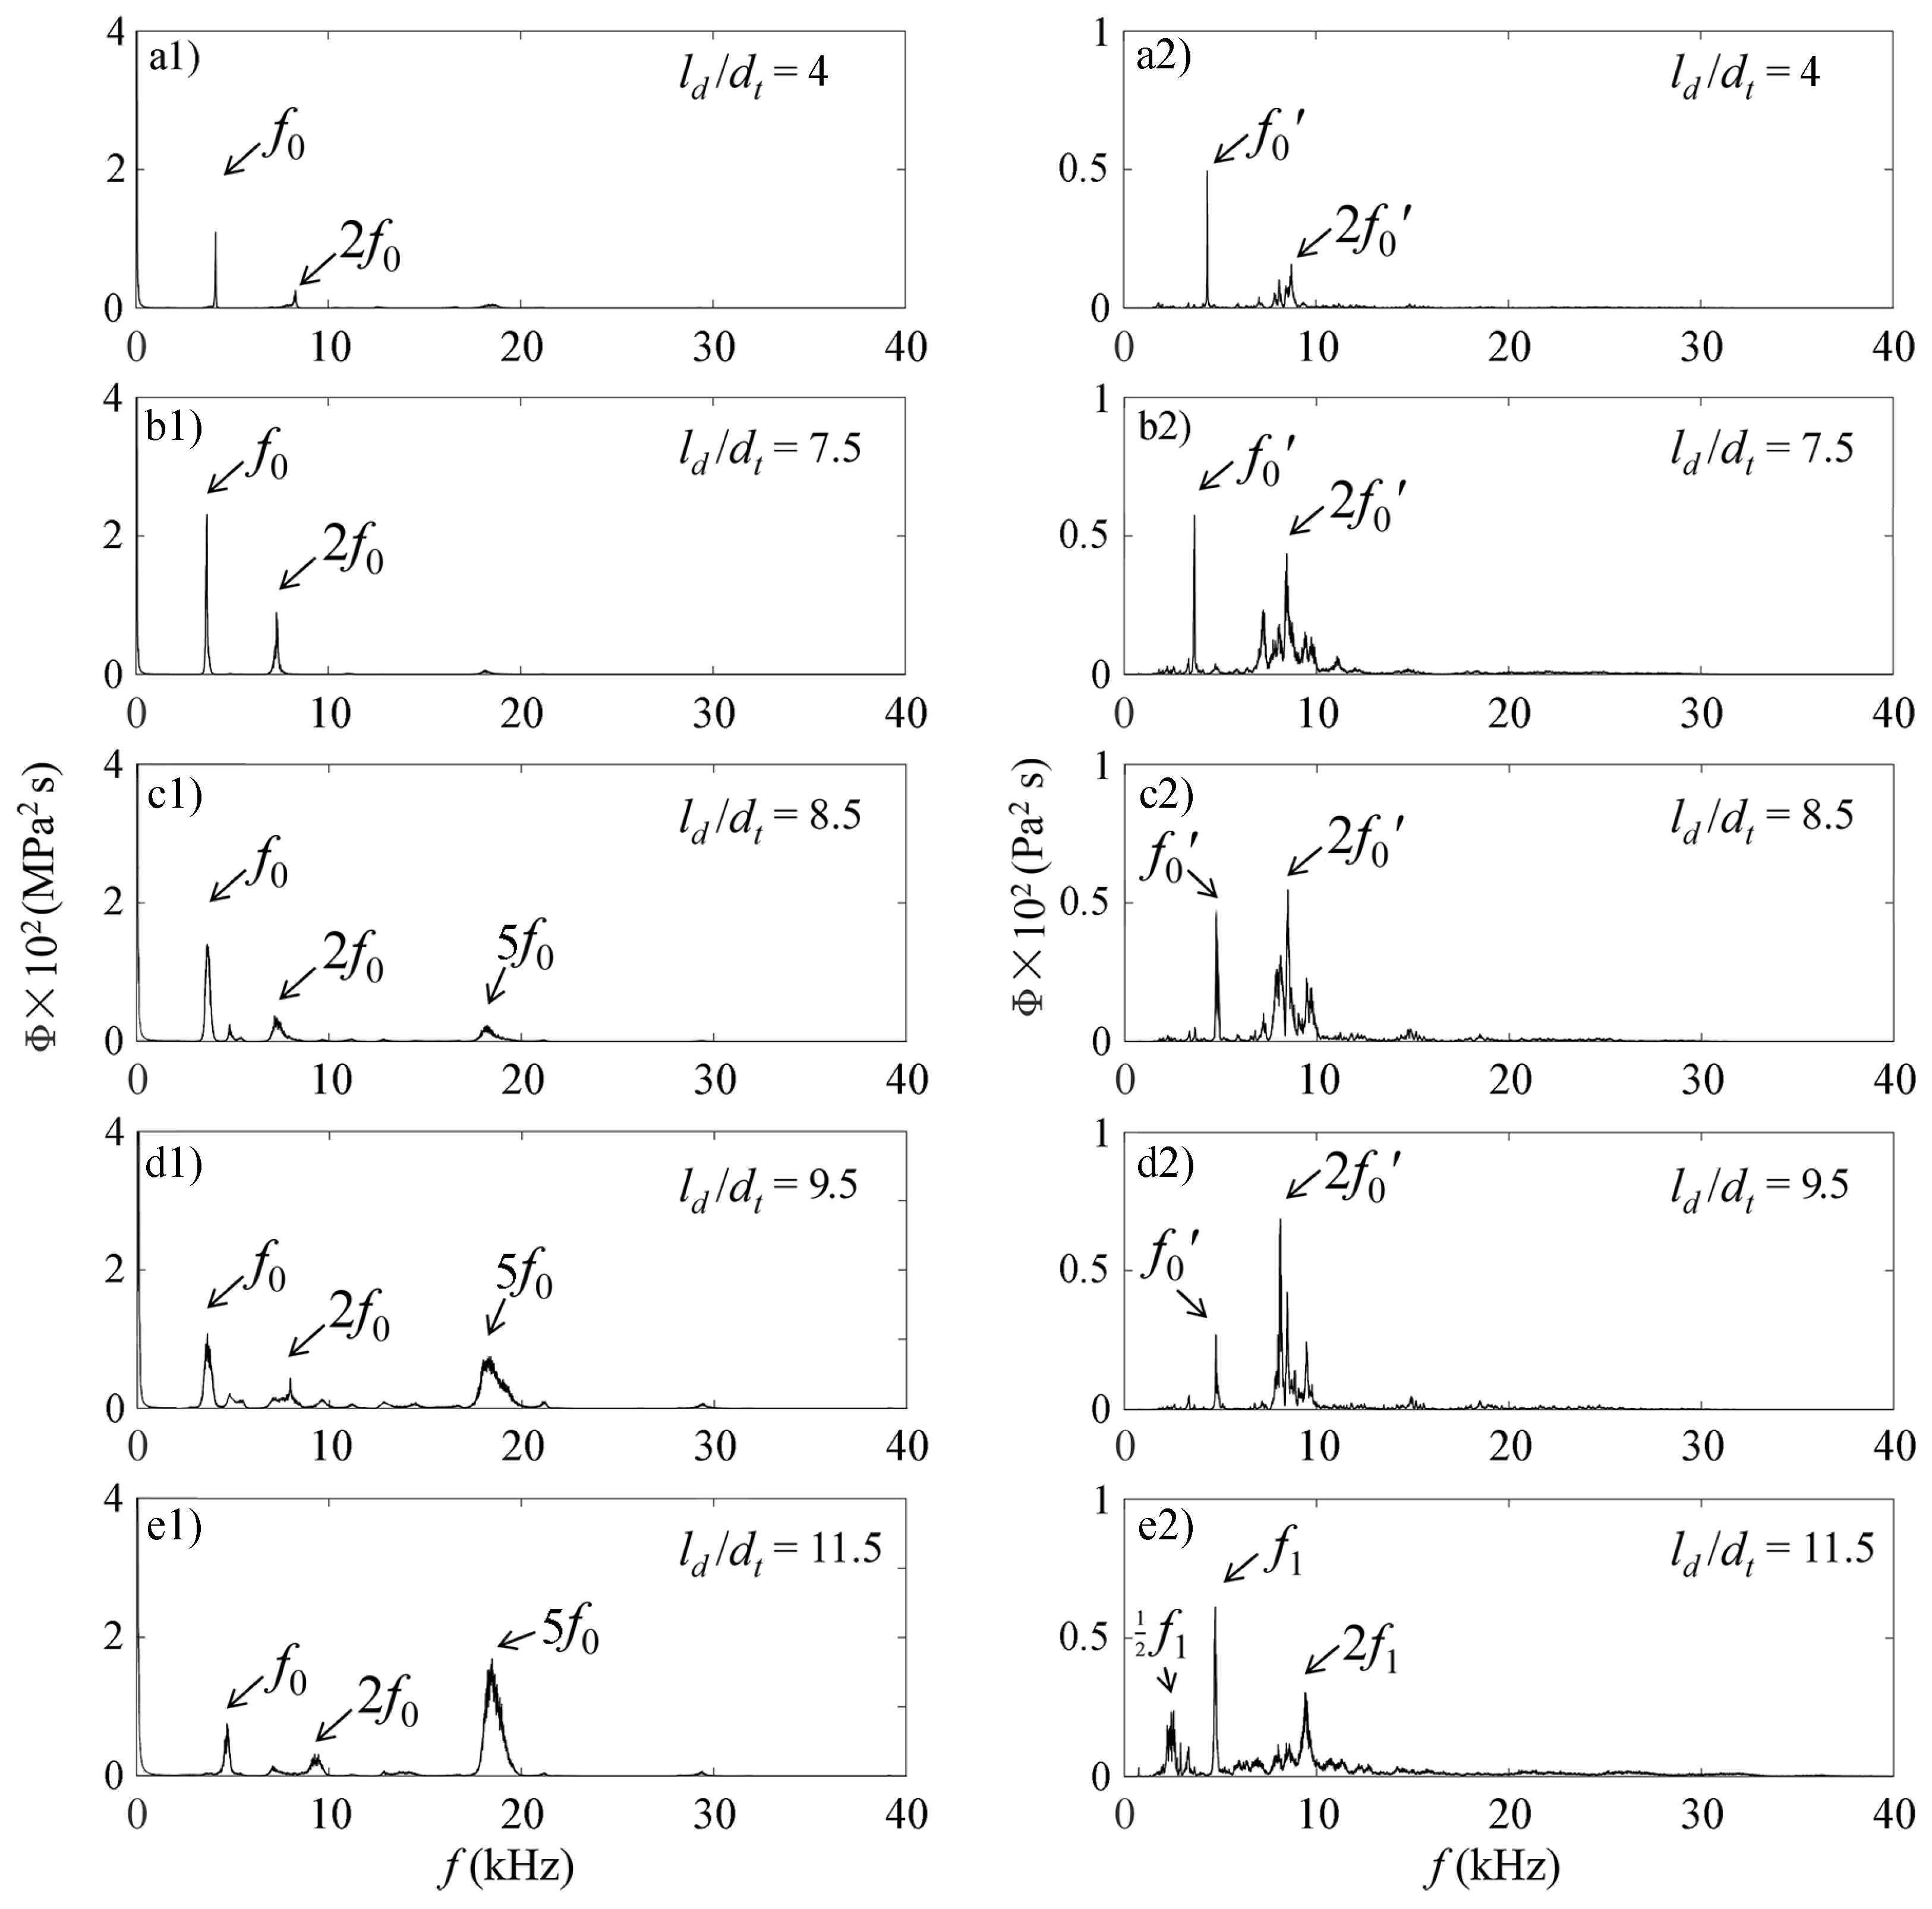
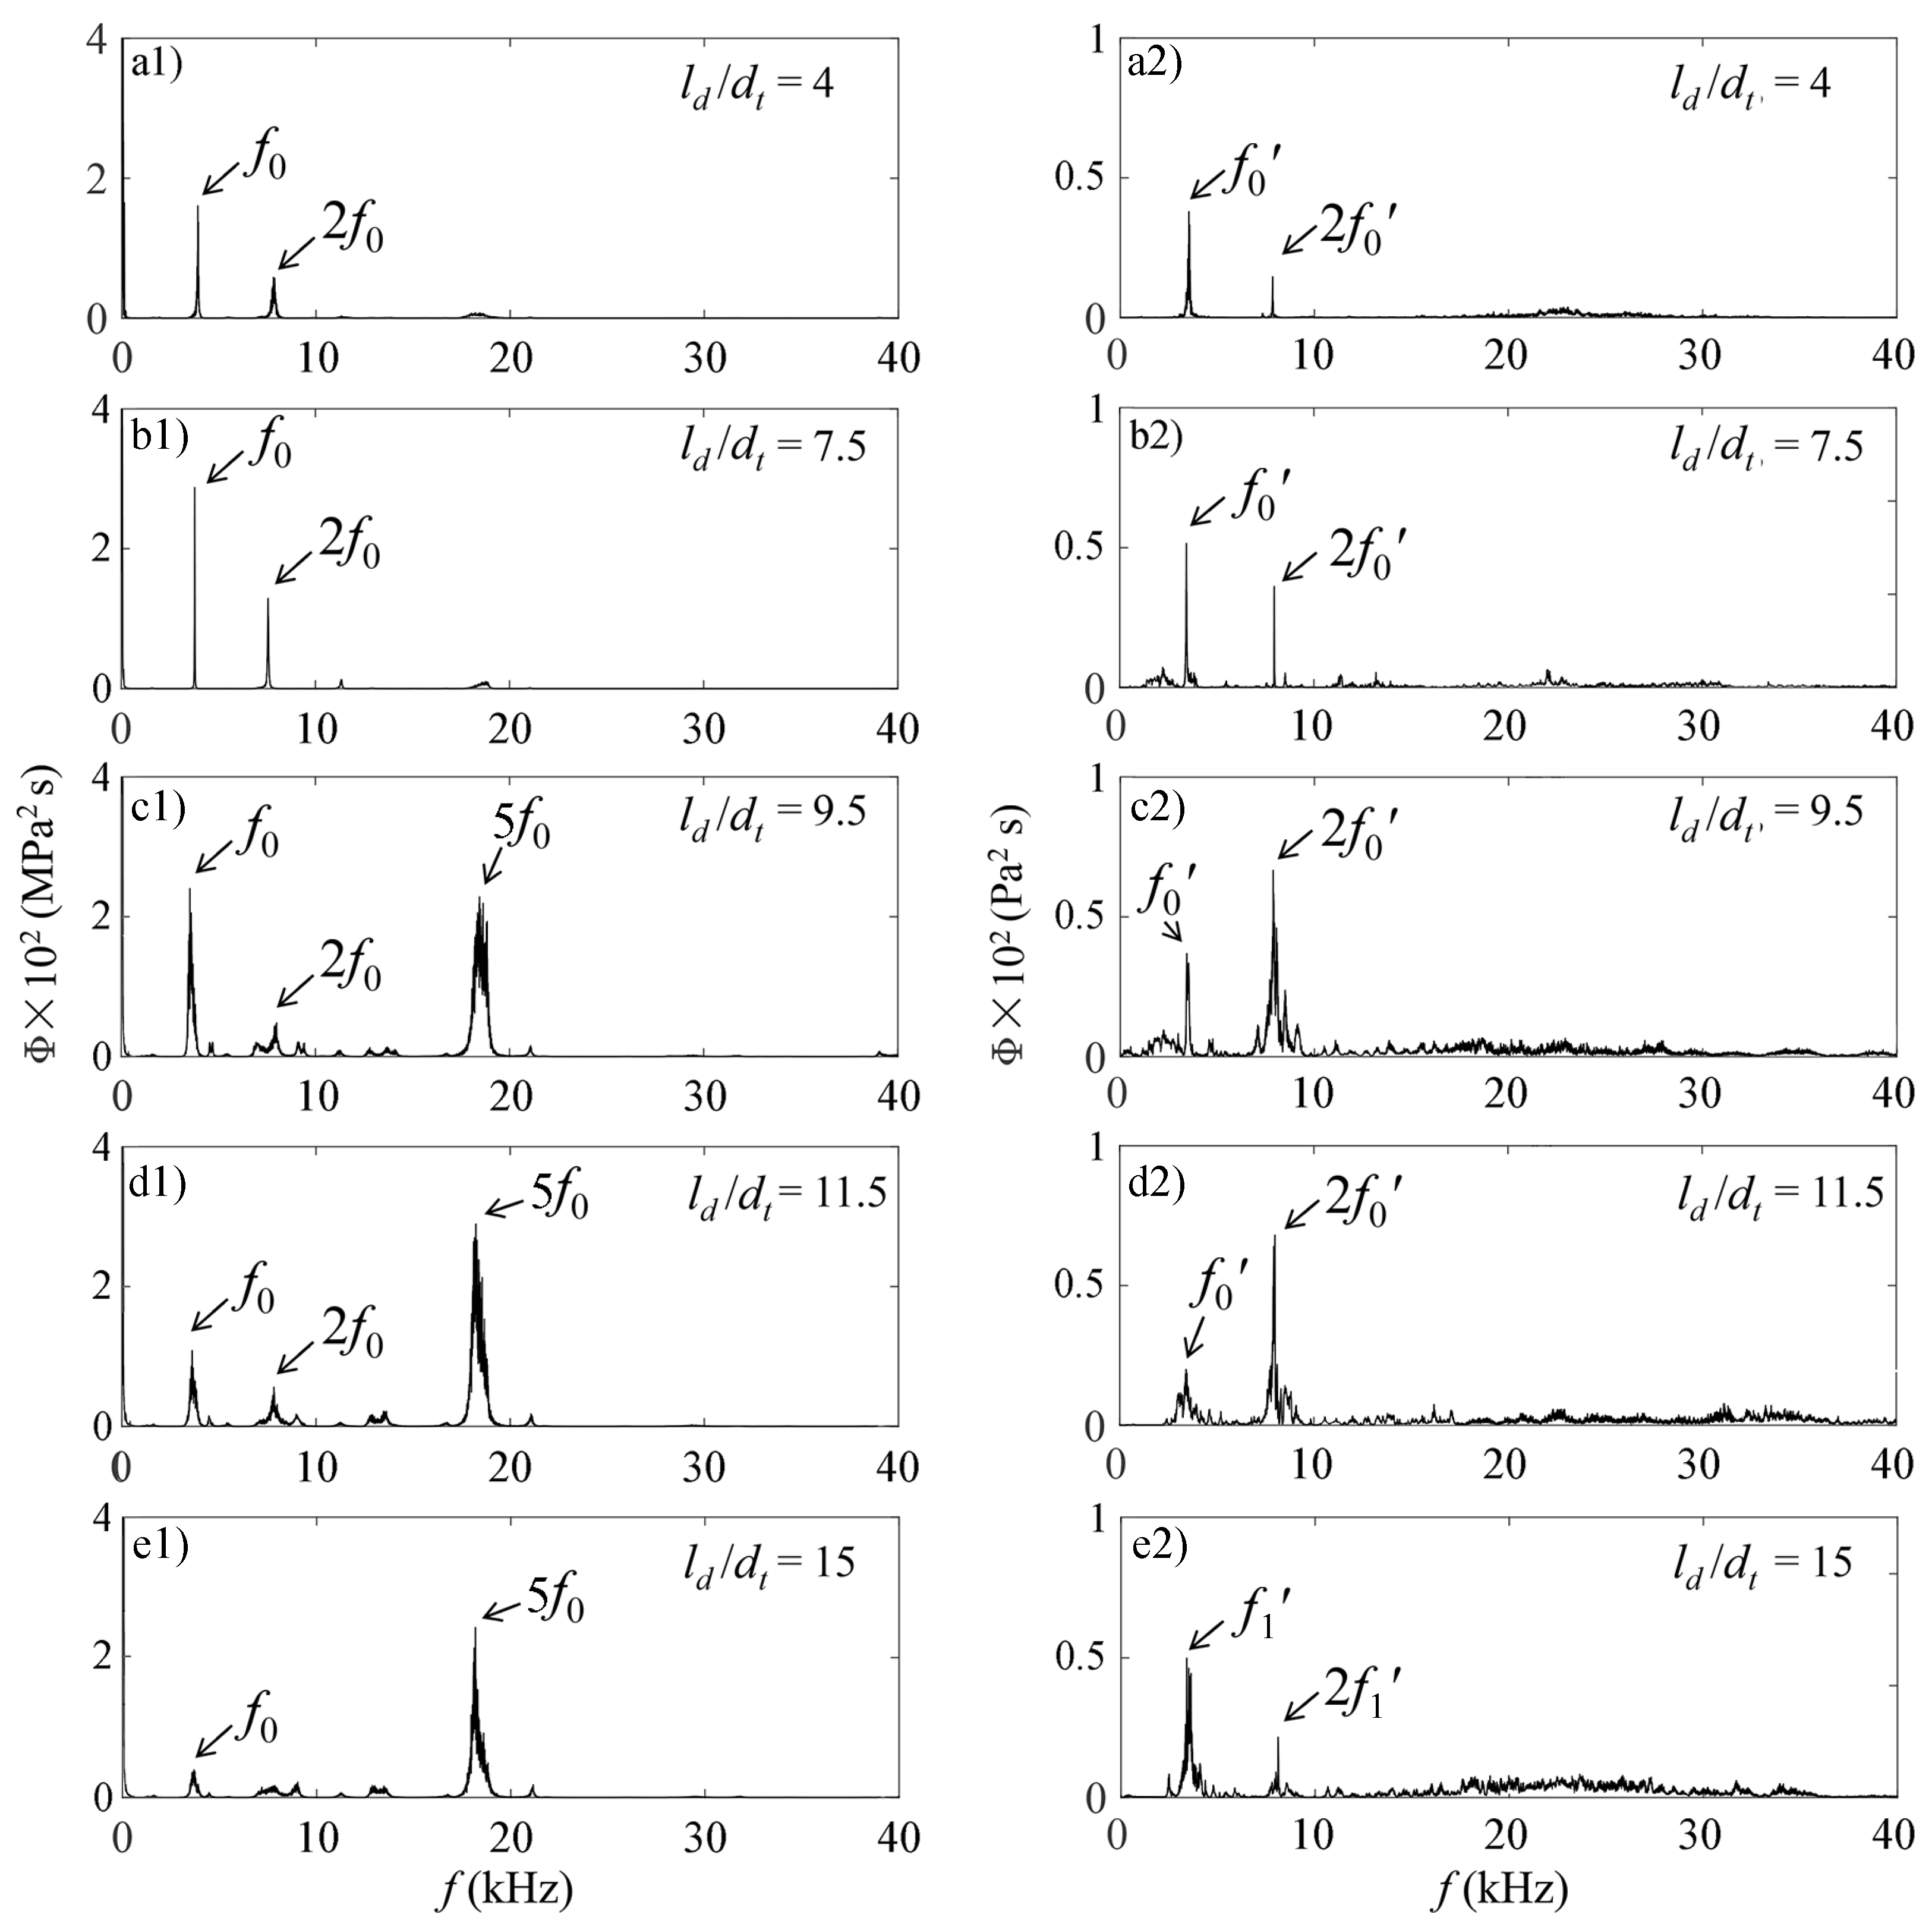
To gain further insight into the self-resonating oscillations of the cavitating jet, the dominating frequencies of the fluctuating feedback pressure in the upstream pipe f d and the cavitation noise near the nozzle exit f d were obtained via the spectral analysis [33,34,35]. The spectrum of pressure oscillations for the case at α = 0°, l d / d t = 4 is shown in Figure 11a1. Here, the fundamental frequency f 0 is the dominant frequency of the flow pressure oscillations (i.e., f d = f 0 ). Because the dominating frequency f d is far from the first design frequency f c 1 , the self-resonating oscillations in the organ-pipe is weak in the low l d / d t range. The main indication of the depressed aggressive ability is also reflected by the low dominating frequency of cavitation noise, f d = f 0 = f 0 , as shown in Figure 11a2. At l d / d t = 8.5, presented in Figure 11c1,c2), the fifth harmonic 5 f 0 is produced close to f c 2 and f 0 still dominates the upstream pressure oscillations. However, for the cavitation noise, the 2 f 0 becomes the dominating frequency instead of f 0 , indicating that the cavitation cloud formation is promoted. This result reflects that a part of the energy of jet self-resonating oscillations is transferred to cavitation [27].
At the optimum standoff distance ratio l o = l d / d t = 9.5, shown in Figure 11d1,d2), the harmonics 5 f 0 and the fundamental frequency f 0 gain more spectral energy, indicating that the jet oscillations absorb part of the cavitation energy. In l d / d t ∈ [10, 12.5], the self-resonating oscillations are dramatically enhanced in that the fifth harmonic 5 f 0 generally becomes the dominant frequency (Figure 11e1), which is roughly close to the second designed frequency f c 2 . However, as shown in Figure 11e2, the cavitation noise primarily oscillates at a low level frequency f 1 (up to 16% higher than f 0 ), corresponding to the reduced strength of the cavitation clouds shedding. The spectral peak of pressure oscillations approximate to 5 Hz is the rotating frequency of pump plunger, which is neglected in this study.
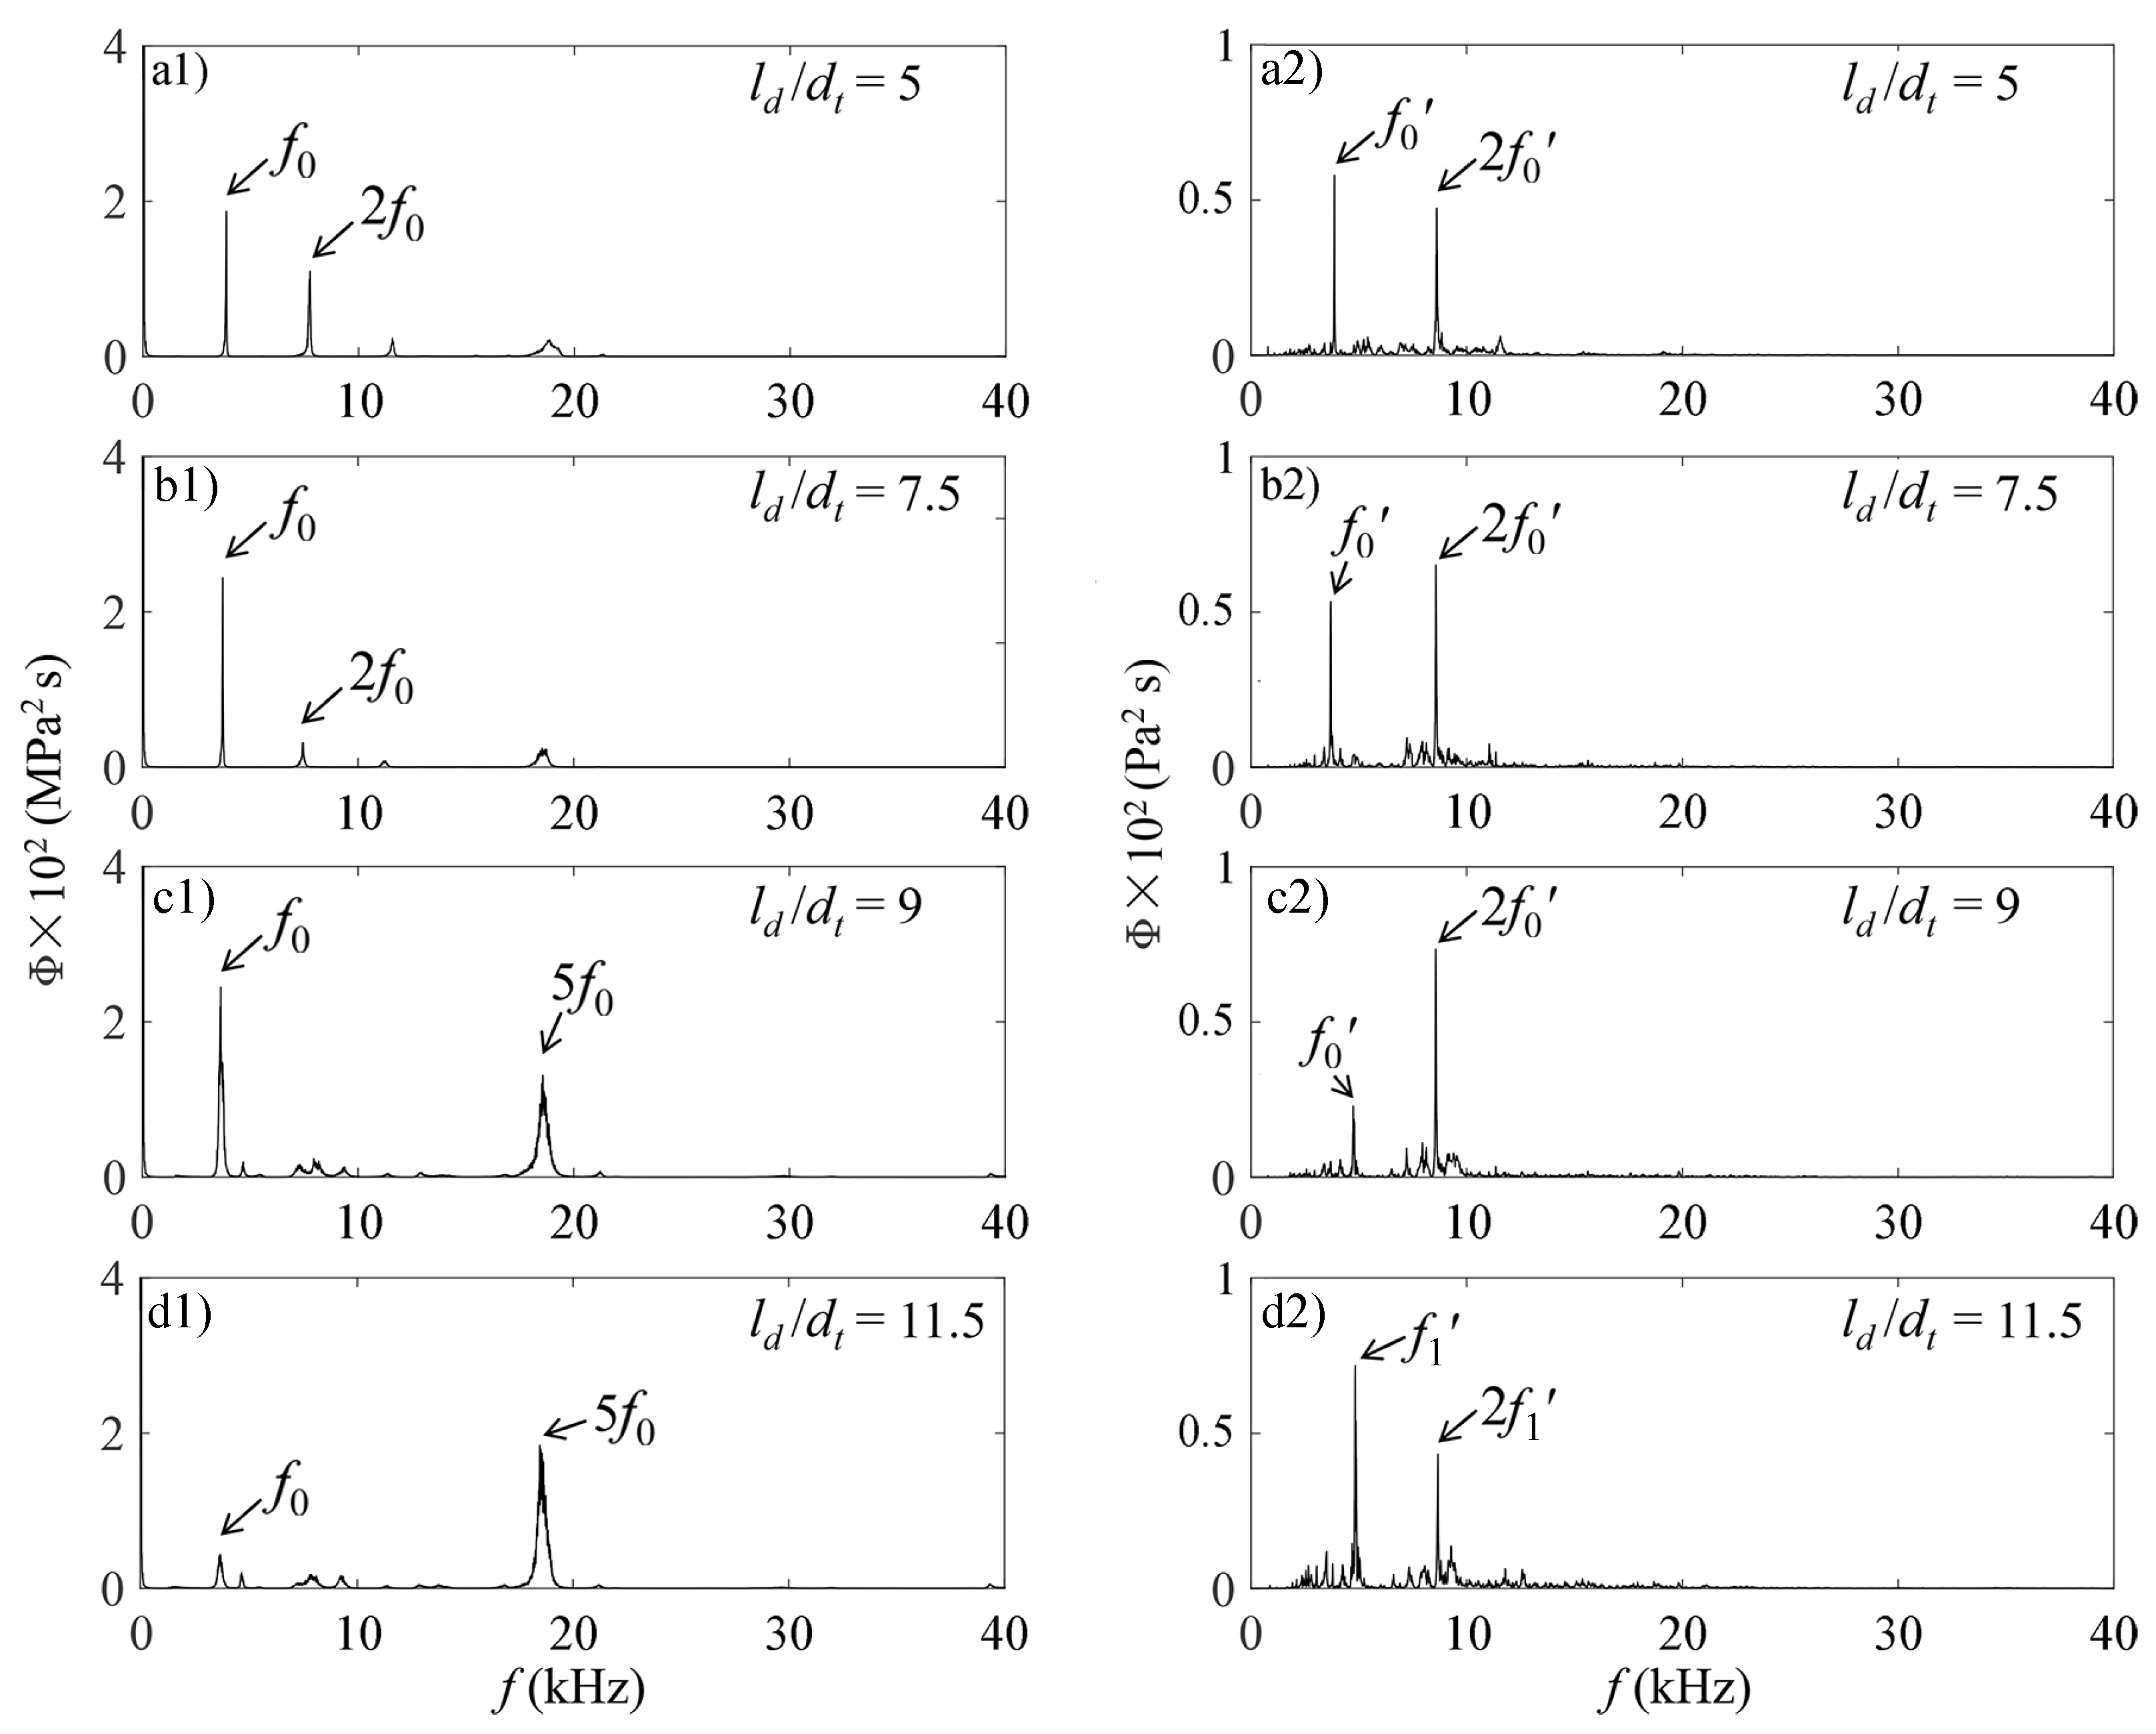
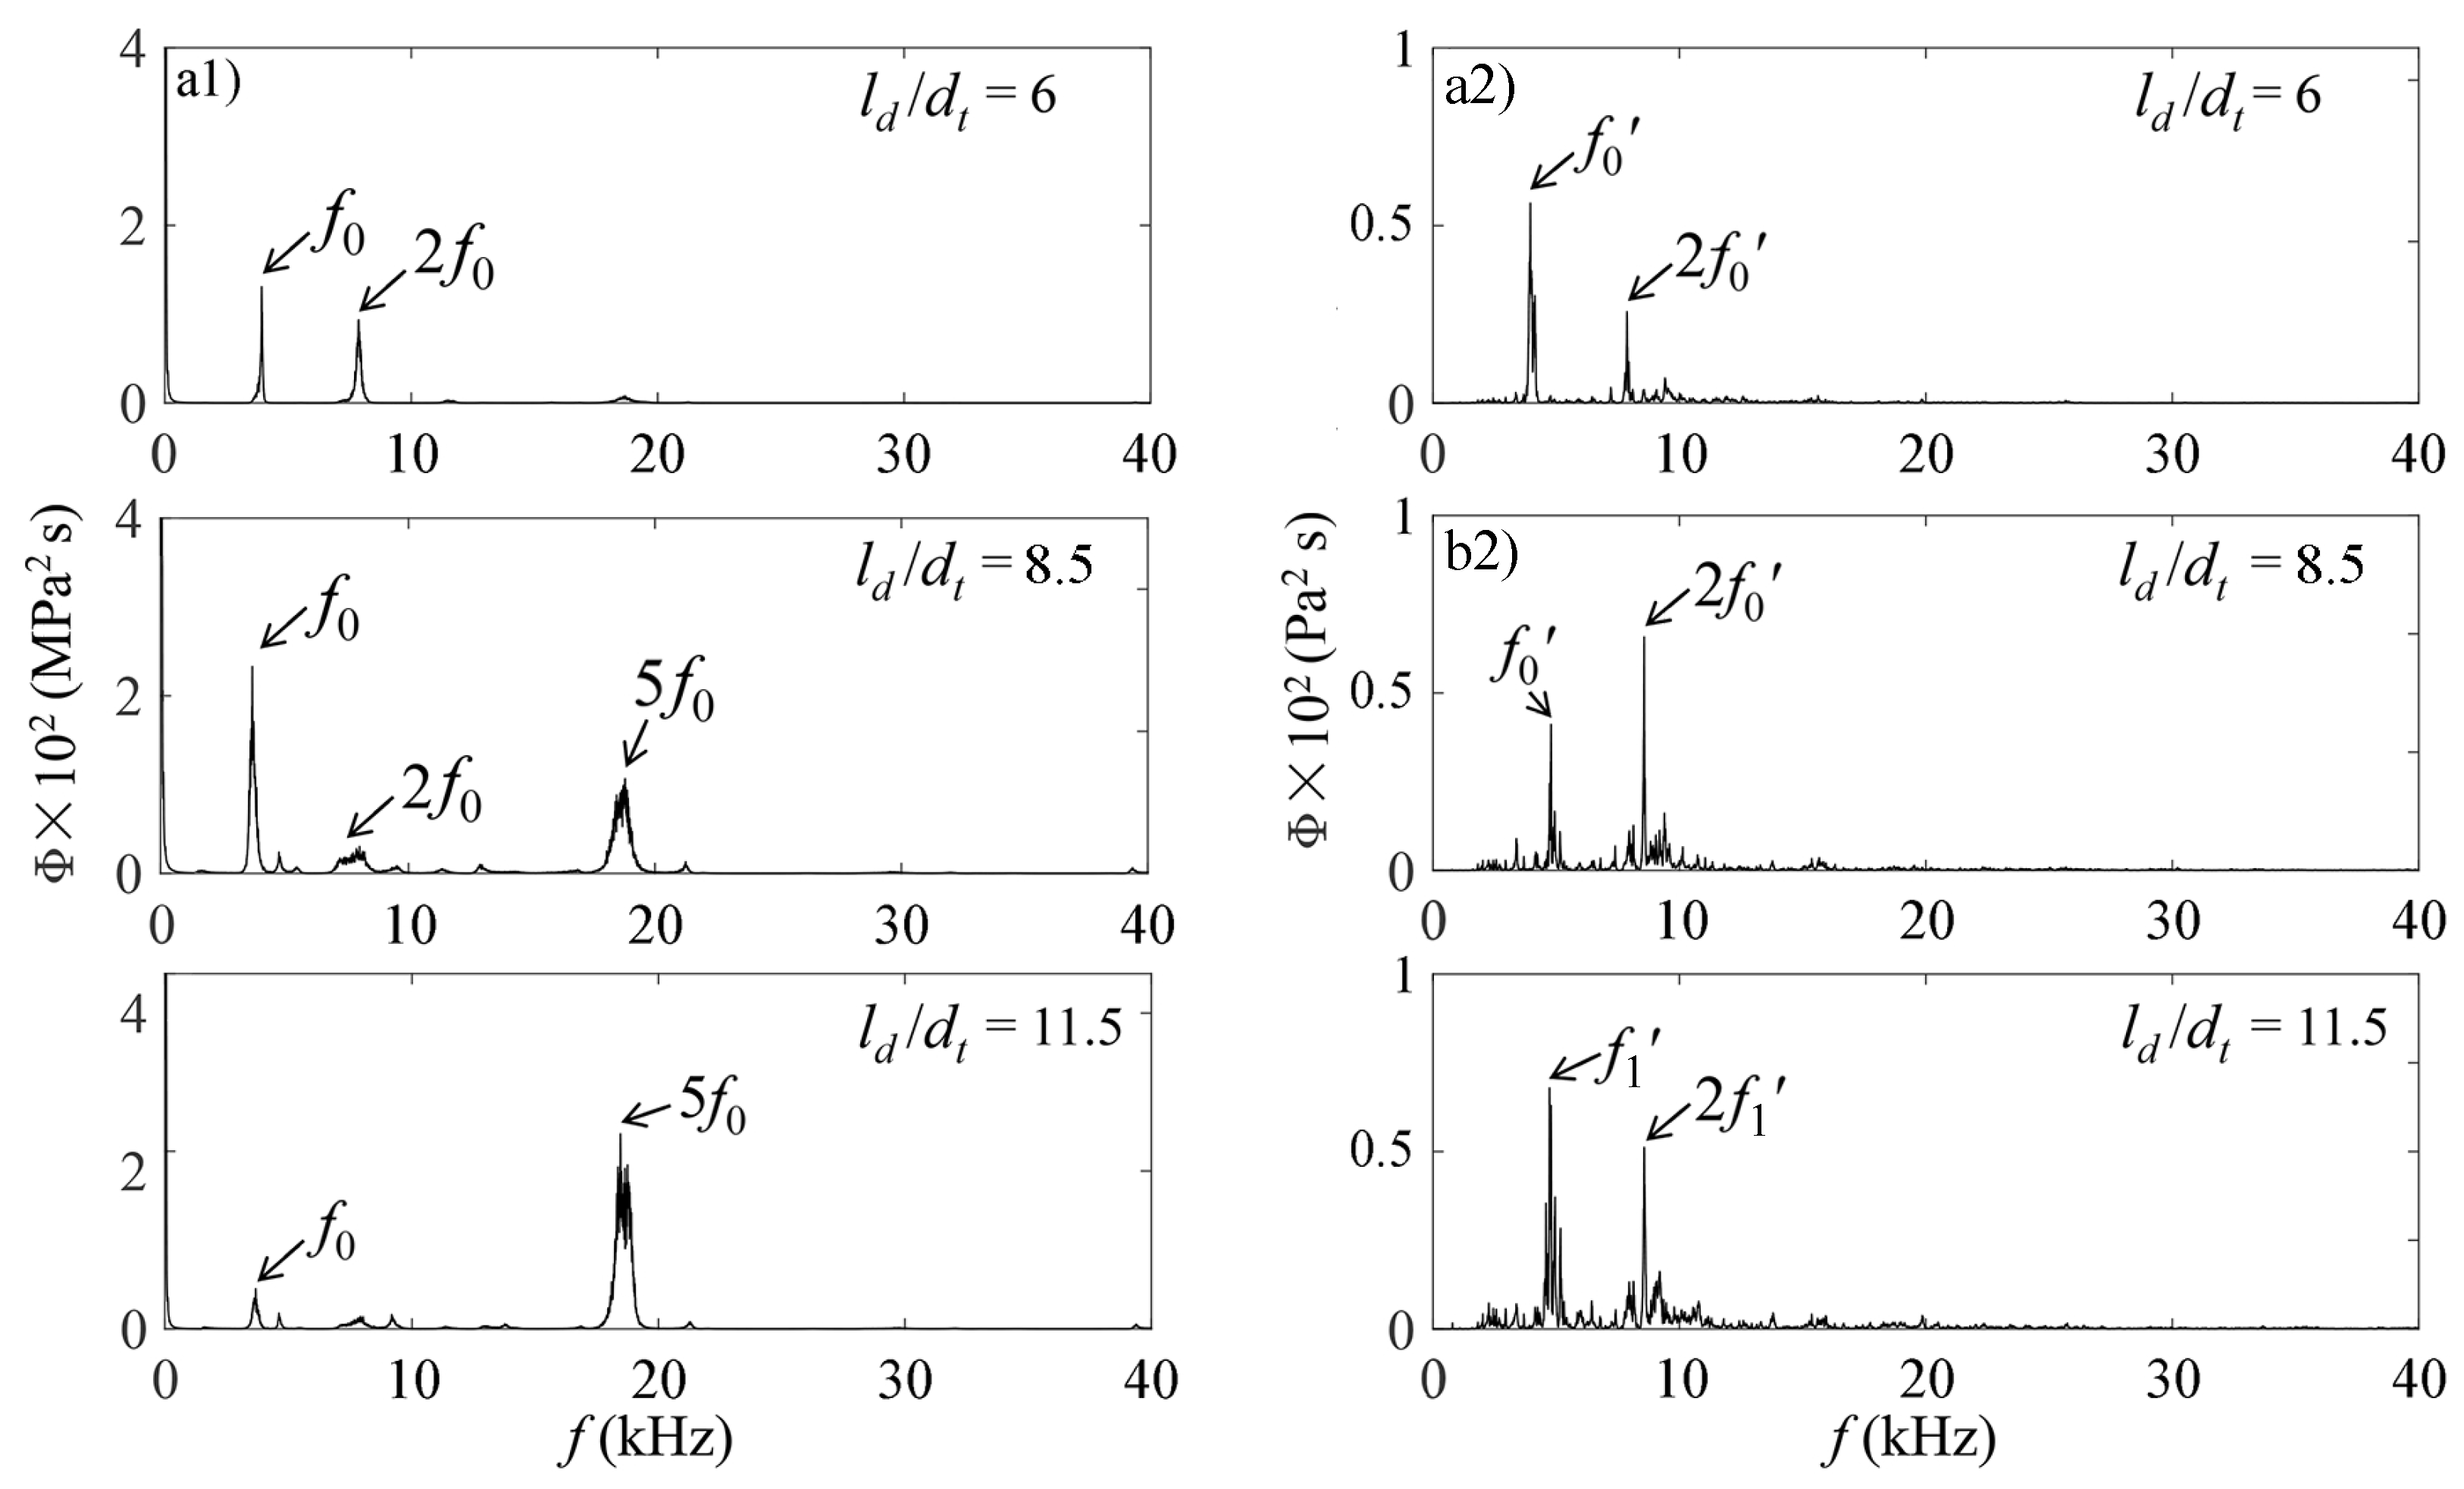
The spectral features of pressure and cavitation noise were further investigated for the oblique specimens at α = 5°, α = 15° and α = 30°, as shown in Figure 12, Figure 13 and Figure 14, respectively. The similar spectra of other standoff distances are not shown for brevity. Similar to α = 0°, the dominating frequencies f 0 and f 0 , and their second harmonics 2 f 0 and 2 f 0 , are observed in the respective range of low standoff distance ratio. Compared to f d , the delay of f d , transition into the high oscillations level is also observed before reaching l o . Furthermore, at the optimum standoff distance l o of each oblique case, the pressure oscillations are observed at the point of f d shifting from f 0 to the higher harmonic frequency 5 f 0 and f d = 2 f 0 . This observation indicates that the cavitation is substantially advocated right before the oscillations intensity in the organ-pipe was enhanced [13,27,36]. It is obvious that in all the cases, the maximum erosion damage occurred at a standoff distance where a balance between the oscillations in the organ-pipe and the cavitation is achieved.
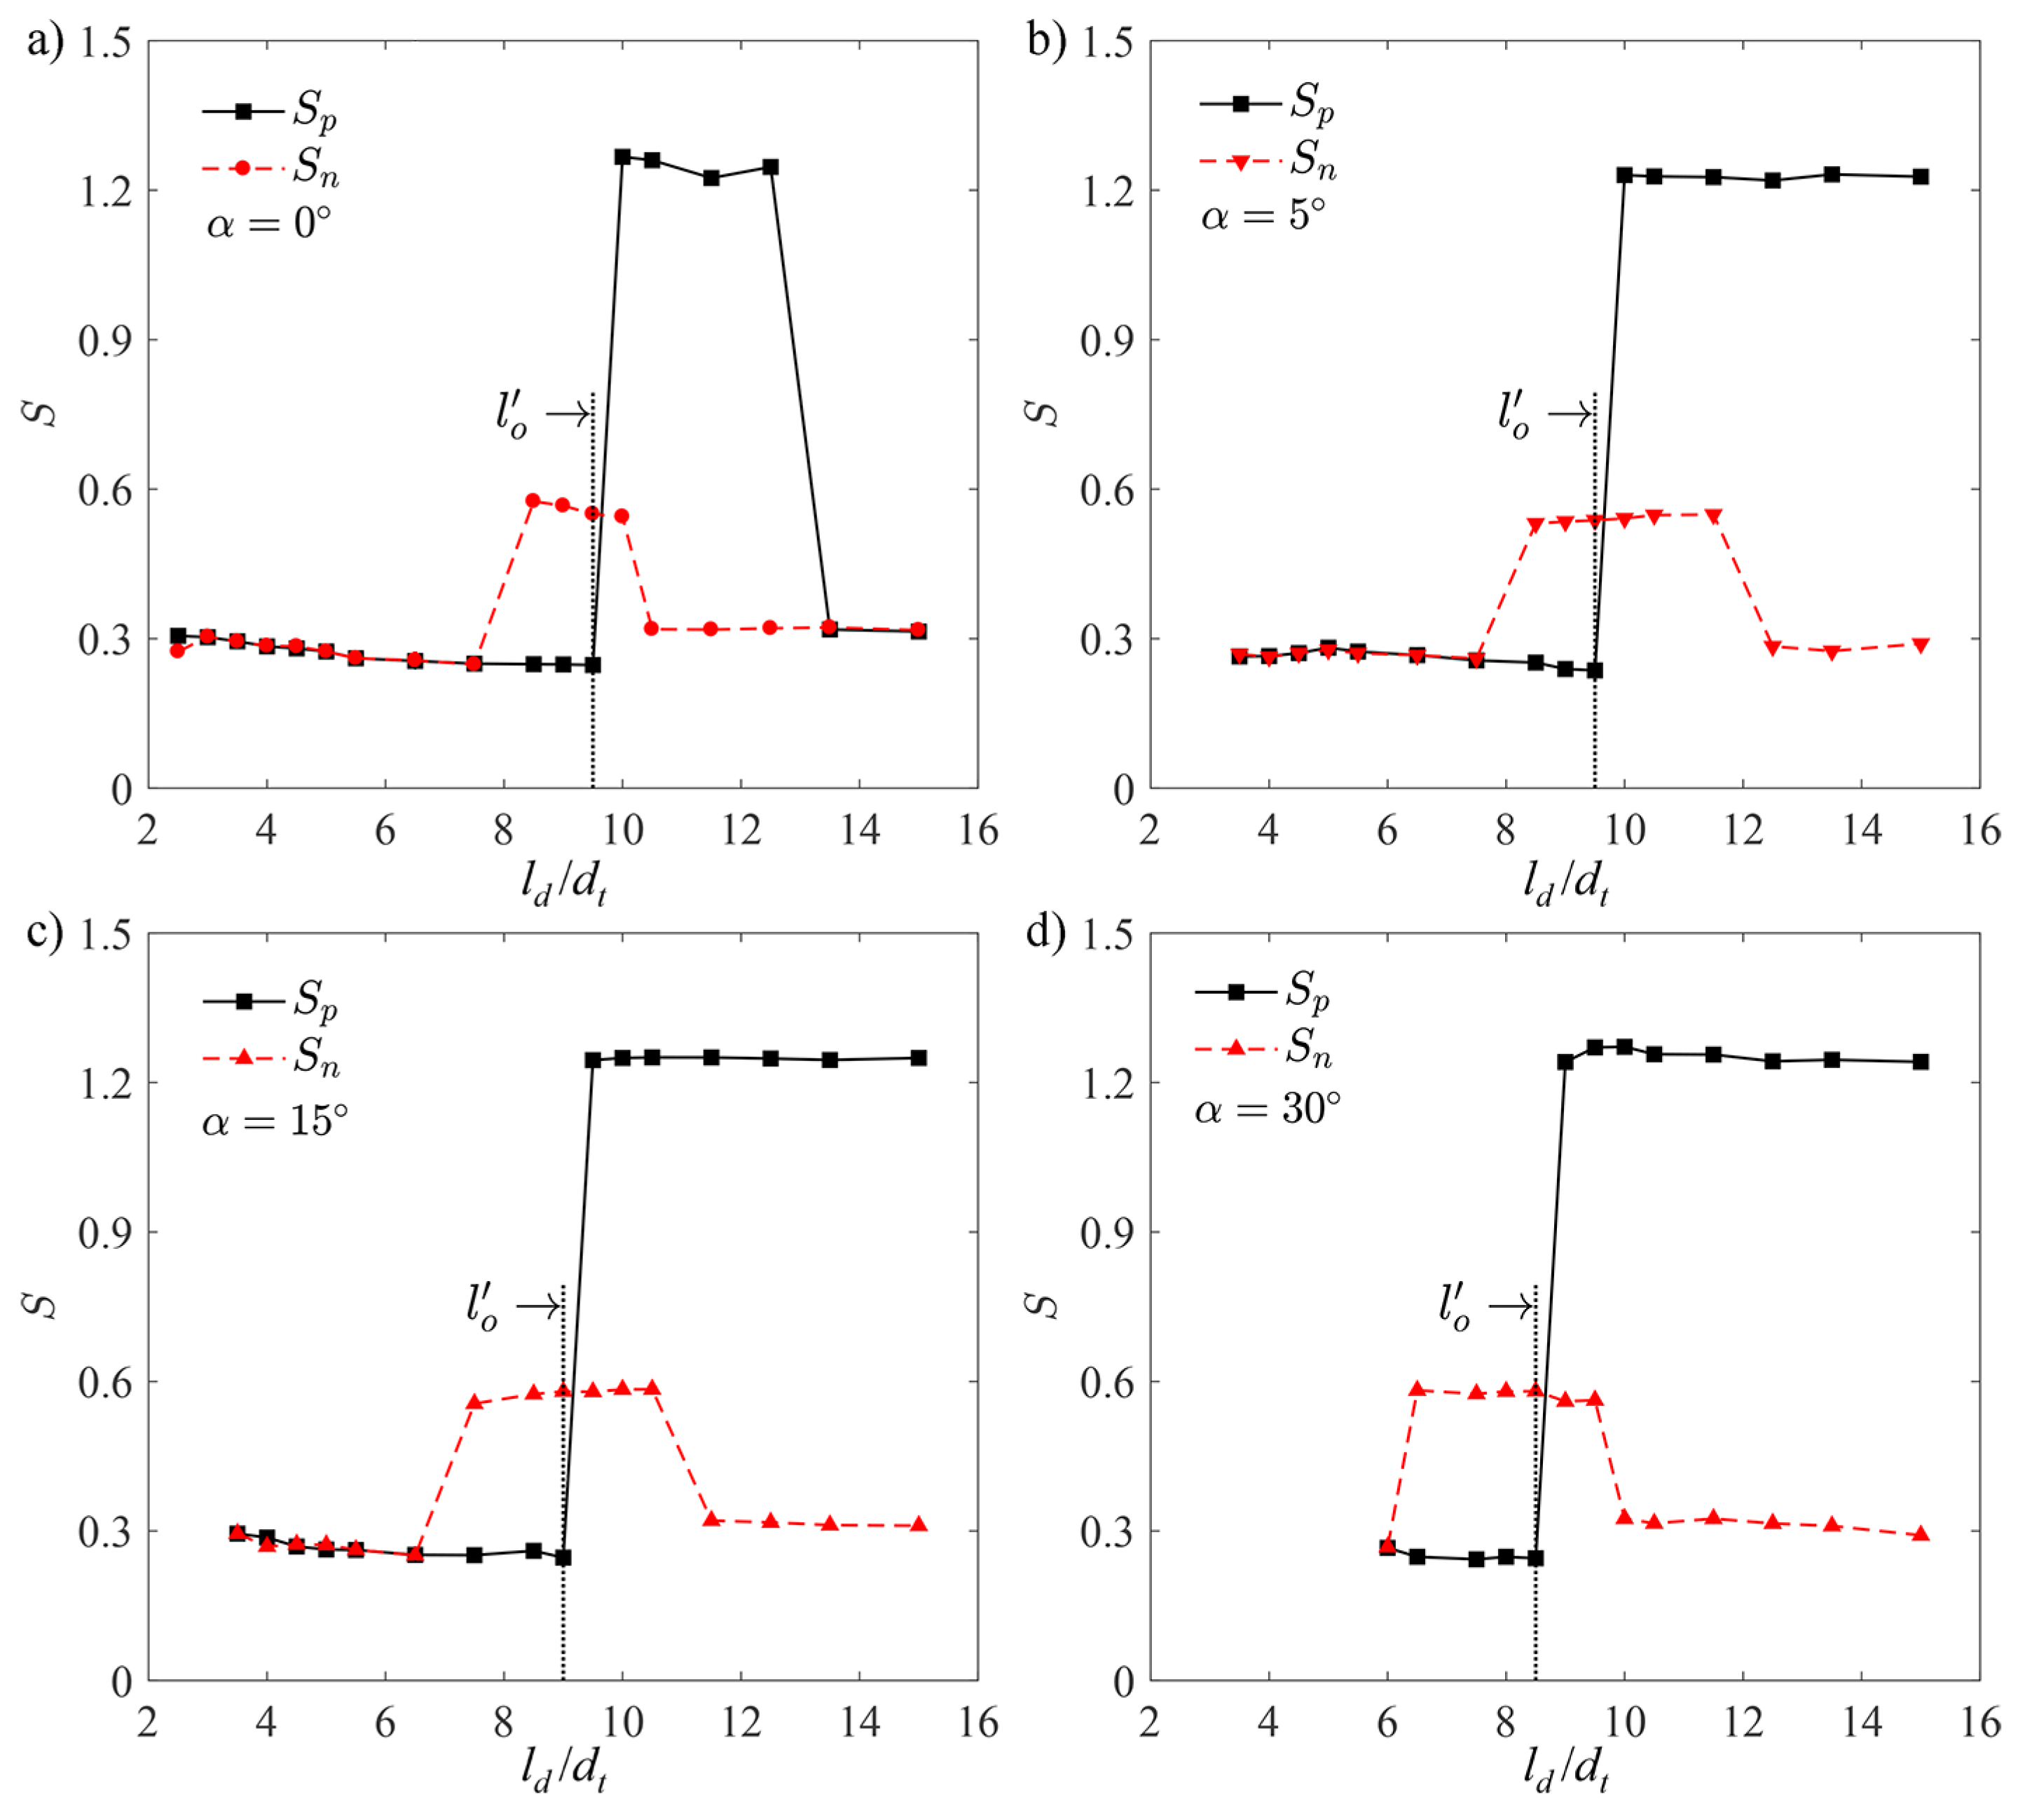
As illustrated in Figure 15, the primary oscillations S p and S n are in the same level and almost independent of l d / d t for all the oblique specimens in the low l d / d t range. At the high standoff distance ratios, the cavitation collapse is promoted with increasing α , reflected by the noise oscillating with high dominating frequency ( S n 0.6 ). The normalized dominating frequency S n maintains in longer ranges of l d / d t than that in horizontal specimen, corresponding to the relative high mass loss as illustrated in Figure 3. The optimum standoff distance l o observed for α = 5° was same as the horizontal specimen α = 0°, presented in Figure 15b), which indicates that the effects from oblique surface with small α is indistinctive on the optimum standoff distance. However, in the range of α ∈ [5° 30°], the increase of oblique angle leads to the maximum erosion damage occurring at a closer standoff distance i.e., l o is marginally shorten.
Figure 15 summarizes the nondimensional dominant frequency S as a function of l d / d t and α , where S p and S n present the primary oscillations of upstream pressure and cavitation noise, respectively, given by the relations:
S = S p = f d d t / U m S n = f d d t / U m

4. Conclusions

This study highlights the relationship between erosion characteristics and self-resonating oscillations of a cavitating water jet on surfaces with various oblique angles. According to the mass loss and the surface morphology, various erosion patterns were identified in ranges of the comparatively low and high l d / d t , respectively. The valley of Δ m as a function of l d / d t is approximately independent of the oblique angle variation in α ∈ [0°, 15°].
In the low l d / d t range, two isolated circular erosion rings were observed on the horizontal specimen with α = 0°. With increase of α , the erosion transforms into two irregular oval shaped rings at α = 5° and separated horseshoe shaped rings at α = 15°. The upper part of oblique surfaces has the higher erosion depth, which mainly contributes to the mass loss. The low aggressive ability in this l d / d t range is the result of the comparatively weak self-resonating oscillations and cavitation, because the dominating frequency f 0 is far from matching the design frequency of the organ-pipe nozzle. The cavitation is substantially enhanced ahead of the self-resonating oscillations achieving more energy. Based on the spectral structure obtained at the optimum standoff distance l o , a balance state is observed that the self-resonating oscillations are still dominated by f 0 right before evaluating into the severe oscillations with f d = 5 f 0 , while the cavitation primarily collapses at the second harmonics 2 f 0 . The balance state of pressure oscillations and cavitation noise might serve as a basis of the strongest aggressive ability. The increase of oblique angle in α ∈ [5°, 30°] advances the occurrence of the maximum erosion damage at a closer l o and promotes the cavitation collapse in longer ranges of l d / d t than the horizontal cases. The results obtained in this research are of instrumental relevance in the erosion performance of the jet on the targets with complex surfaces. Future efforts will focus on the impinging characteristics of cavitation clouds on the oblique surfaces using the high-speed photography visualization.

Author Contributions

Writing—review and editing, B.L.; supervision, F.M. All authors have read and agreed to the published version of the manuscript.

Funding

This work has been funded by the National Key R&D Program of China (Grant No.2018YFC0810500), the National Natural Science Foundation of China (Grant No.51774019) and the Fundamental Research Funds for the Central Universities (Grant No.FRF-IDRY-19-027).

Acknowledgments

This work was supported by the School of Mechanical Engineering, University of Science & Technology Beijing.

Conflicts of Interest

The authors declare no conflict of interest.

References

  1. Peng, K.; Tian, S.; Li, G.; Huang, Z.; Zhang, Z. Cavitation in water jet under high ambient pressure conditions. Exp. Therm. Fluid Sci. 2017, 89, 9–18. [Google Scholar] [CrossRef]
  2. Johnson, V.E.; Chahine, G.L.; Lindenmuth, W.T.; Conn, A.F.; Frederick, G.S.; Giacchino, G.J. Cavitating and structured jets for mechanical bits to increase drilling rate—Part I: Theory and concepts. J. Energy Resour. Technol. 1984, 106, 289–294. [Google Scholar] [CrossRef]
  3. Liu, W.; Kang, Y.; Zhang, M.; Wang, X.; Li, D.; Xie, L. Experimental and theoretical analysis on chamber pressure of a self-resonating cavitation waterjet. Ocean Eng. 2018, 151, 33–45. [Google Scholar] [CrossRef]
  4. Fujisawa, N.; Fujita, Y.; Yanagisawa, K.; Fujisawa, K.; Yamagata, T. Simultaneous observation of cavitation collapse and shock wave formation in cavitating jet. Exp. Therm. Fluid Sci. 2018, 94, 159–167. [Google Scholar] [CrossRef]
  5. Soyama, H. Enhancing the aggressive intensity of a cavitating jet by means of the nozzle outlet geometry. J. Fluids Eng. 2011, 133, 101301. [Google Scholar] [CrossRef]
  6. Soyama, H.; Yamauchi, Y.; Adachi, Y.; Sato, K.; Shindo, T.; Oba, R. High-speed observations of the cavitation cloud around a high-speed submerged water jet. JSME Int. J. Ser. B Fluids Therm. Eng. 1995, 38, 245–251. [Google Scholar] [CrossRef] [Green Version]
  7. Chahine, G.L.; Hsiao, C.T. Modelling cavitation erosion using fluid–material interaction simulations. Interface Focus 2015, 5, 20150016. [Google Scholar] [CrossRef]
  8. Lichtarowicz, A. Cavitating jet apparatus for cavitation erosion testing. In STP664-EB Erosion: Prevention and Useful Applications; West Conshohocken: Conshohocken, PA, USA, 1979; pp. 530–549. [Google Scholar]
  9. Yamaguchi, A.; Shimizu, S. Erosion Due to Impingement of Cavitating Jet. J. Fluids Eng. 1987, 109, 442–447. [Google Scholar] [CrossRef]
  10. Momma, T.; Lichtarowicz, A. A study of pressures and erosion produced by collapsing cavitation. Wear 1995, 186, 425–436. [Google Scholar] [CrossRef]
  11. Soyama, H. Surface mechanics design of metallic materials on mechanical surface treatments. Mech. Eng. Rev. 2015, 2, 14-00192. [Google Scholar] [CrossRef] [Green Version]
  12. Yamauchi, Y.; Soyama, H.; Adachi, Y.; Sato, K.; Shindo, T.; Oba, R.; Oshima, R.; Yamabe, M. Suitable region of high-speed submerged water jets for cutting and peening. JSME Int. J. Ser. B Fluids Therm. Eng. 1996, 38, 31–38. [Google Scholar] [CrossRef] [Green Version]
  13. Jorgensen, D.W. Noise from Cavitating Submerged Water Jets. J. Acoust. Soc. Am. 1961, 33, 1334–1338. [Google Scholar] [CrossRef]
  14. Arndt, R.E.A.; George, W.K. Pressure fields and cavitation in turbulent shear flows. In Twelfth Symposium on Naval Hydrodynamics; National Academy of Sciences: Washington, DC, USA, 1979; pp. 327–339. [Google Scholar]
  15. Chahine, G.L.; Johnson, V.E., Jr.; Lindenmuth, W.T.; Frederick, G.S. The use of self-resonating cavitating water jets for underwater sound generation. J. Acoust. Soc. Am. 1985, 77, 113–126. [Google Scholar] [CrossRef]
  16. Tsujino, T. Cavitation damage and noise spectra in a polymer solution. Ultrasonics 1987, 25, 67–72. [Google Scholar] [CrossRef]
  17. Chahine, G.L.; Johnson, V.E., Jr.; Frederick, G.S. Self resonating pulsed water jets for aircraft coating removal: Feasibility study. In Technical Report; Hydronautics, Inc.: Laurel, MD, USA, 1982; Volume 8268-1. [Google Scholar]
  18. Sato, K.; Sugimoto, Y.; Ohjimi, S. Pressure-wave formation and collapses of cavitation clouds impinging on solid wall in a submerged water jet. In Proceedings of the 7th International Symposium on Cavitation, Ann Arbor, MI, USA, 16–20 August 2009. [Google Scholar]
  19. Soyama, H. Enhancing the aggressive intensity of a cavitating jet by introducing a cavitator and a guide pipe. J. Fluid Sci. Technol. 2013, 9, 1300238. [Google Scholar] [CrossRef] [Green Version]
  20. Momma, T. Cavitation Loading and Erosion Produced by a Cavitating Jet; University of Nottingham: Nottingham, UK, 1991. [Google Scholar]
  21. Chahine, G.L.; Courbière, P. Noise and Erosion of Self Resonating Cavitating Jets. J. Fluids Eng. 1987, 109, 429–435. [Google Scholar] [CrossRef]
  22. Sato, K.; Taguchi, Y.; Hayashi, S. High Speed Observation of Periodic Cavity Behavior in a Convergent-Divergent Nozzle for Cavitating Water Jet. J. Flow Control Meas. Vis. 2013, 1, 102–107. [Google Scholar] [CrossRef] [Green Version]
  23. Testud, P.; Moussou, P.; Hirschberg, A.; Aurégan, Y. Noise generated by cavitating single-hole and multi-hole orifices in a water pipe. J. Fluids Struct. 2007, 23, 163–189. [Google Scholar] [CrossRef]
  24. Kang, C.; Liu, H.; Soyama, H. Estimation of aggressive intensity of a cavitating jet with multiple experimental methods. Wear 2018, 394, 176–186. [Google Scholar] [CrossRef]
  25. Okada, T.; Yoshiro, I.; Shuji, H.; Norio, T. Relation between impact load and the damage produced by cavitation bubble collapse. Wear 1995, 184, 231–239. [Google Scholar] [CrossRef]
  26. Zhou, M.; Liu, H.; Kang, C.; Wei, X. Resistance of curved surfaces to the cavitation erosion produced through high-pressure submerged waterjet. Wear 2019, 440, 203091. [Google Scholar] [CrossRef]
  27. Chi, P.; Tian, S.; Li, G. Joint experiments of cavitation jet: High-speed visualization and erosion test. Ocean Eng. 2018, 149, 1–13. [Google Scholar]
  28. Li, D.; Kang, Y.; Wang, X.; Ding, X.; Fang, Z. Effects of nozzle inner surface roughness on the cavitation erosion characteristics of high speed submerged jets. Exp. Therm. Fluid Sci. 2016, 74, 444–452. [Google Scholar] [CrossRef]
  29. Soyama, H. Key Factors and Applications of Cavitation Peening. Int. J. Peen. Sci. Technol. 2017, 1, 3–60. [Google Scholar]
  30. Liu, B.; Pan, Y.; Ma, F. Pulse pressure loading and erosion pattern of cavitating jet. Eng. Appl. Comput. Fluid Mech. 2008, 14, 136–150. [Google Scholar] [CrossRef] [Green Version]
  31. Chahine, G.L.; Johnson, V.E., Jr. Mechanics and Applications of Self-Resonating Cavitating Jets. In International Symposium on Jets and Cavities; ASME: Miami Beach, FL, USA, 1985; Volume 31, pp. 21–33. [Google Scholar]
  32. Li, D.; Kang, Y.; Ding, X.G.; Liu, W. Experimental study on the effects of feeding pipe diameter on the cavitation erosion performance of self-resonating cavitating waterjet. Exp. Therm. Fluid Sci. 2016, 82, 314–325. [Google Scholar] [CrossRef]
  33. Liu, B.; Hamed, A.M.; Jin, Y.; Chamorro, L.P. Influence of vortical structure impingement on the oscillation and rotation of flat plates. J. Fluids Struct. 2017, 70, 417–427. [Google Scholar] [CrossRef]
  34. Liu, B.; Hamed, A.M.; Chamorro, L.P. On the Kelvin–Helmholtz and von Kármán vortices in the near-wake of semicircular cylinders with flaps. J. Turbul. 2017, 12, 270–281. [Google Scholar] [CrossRef]
  35. Liu, B.; Yan, Q.; Wei, W. Numerical investigations of the flow induced oscillation of a torque converter. Eng. Appl. Comput. Fluid Mech. 2018, 12, 270–281. [Google Scholar] [CrossRef]
  36. De, M.K.; Hammitt, F.G. New Method for Monitoring and Correlating Cavitation Noise to Erosion Capability. J. Fluids Eng. 1982, 104, 434–441. [Google Scholar] [CrossRef]
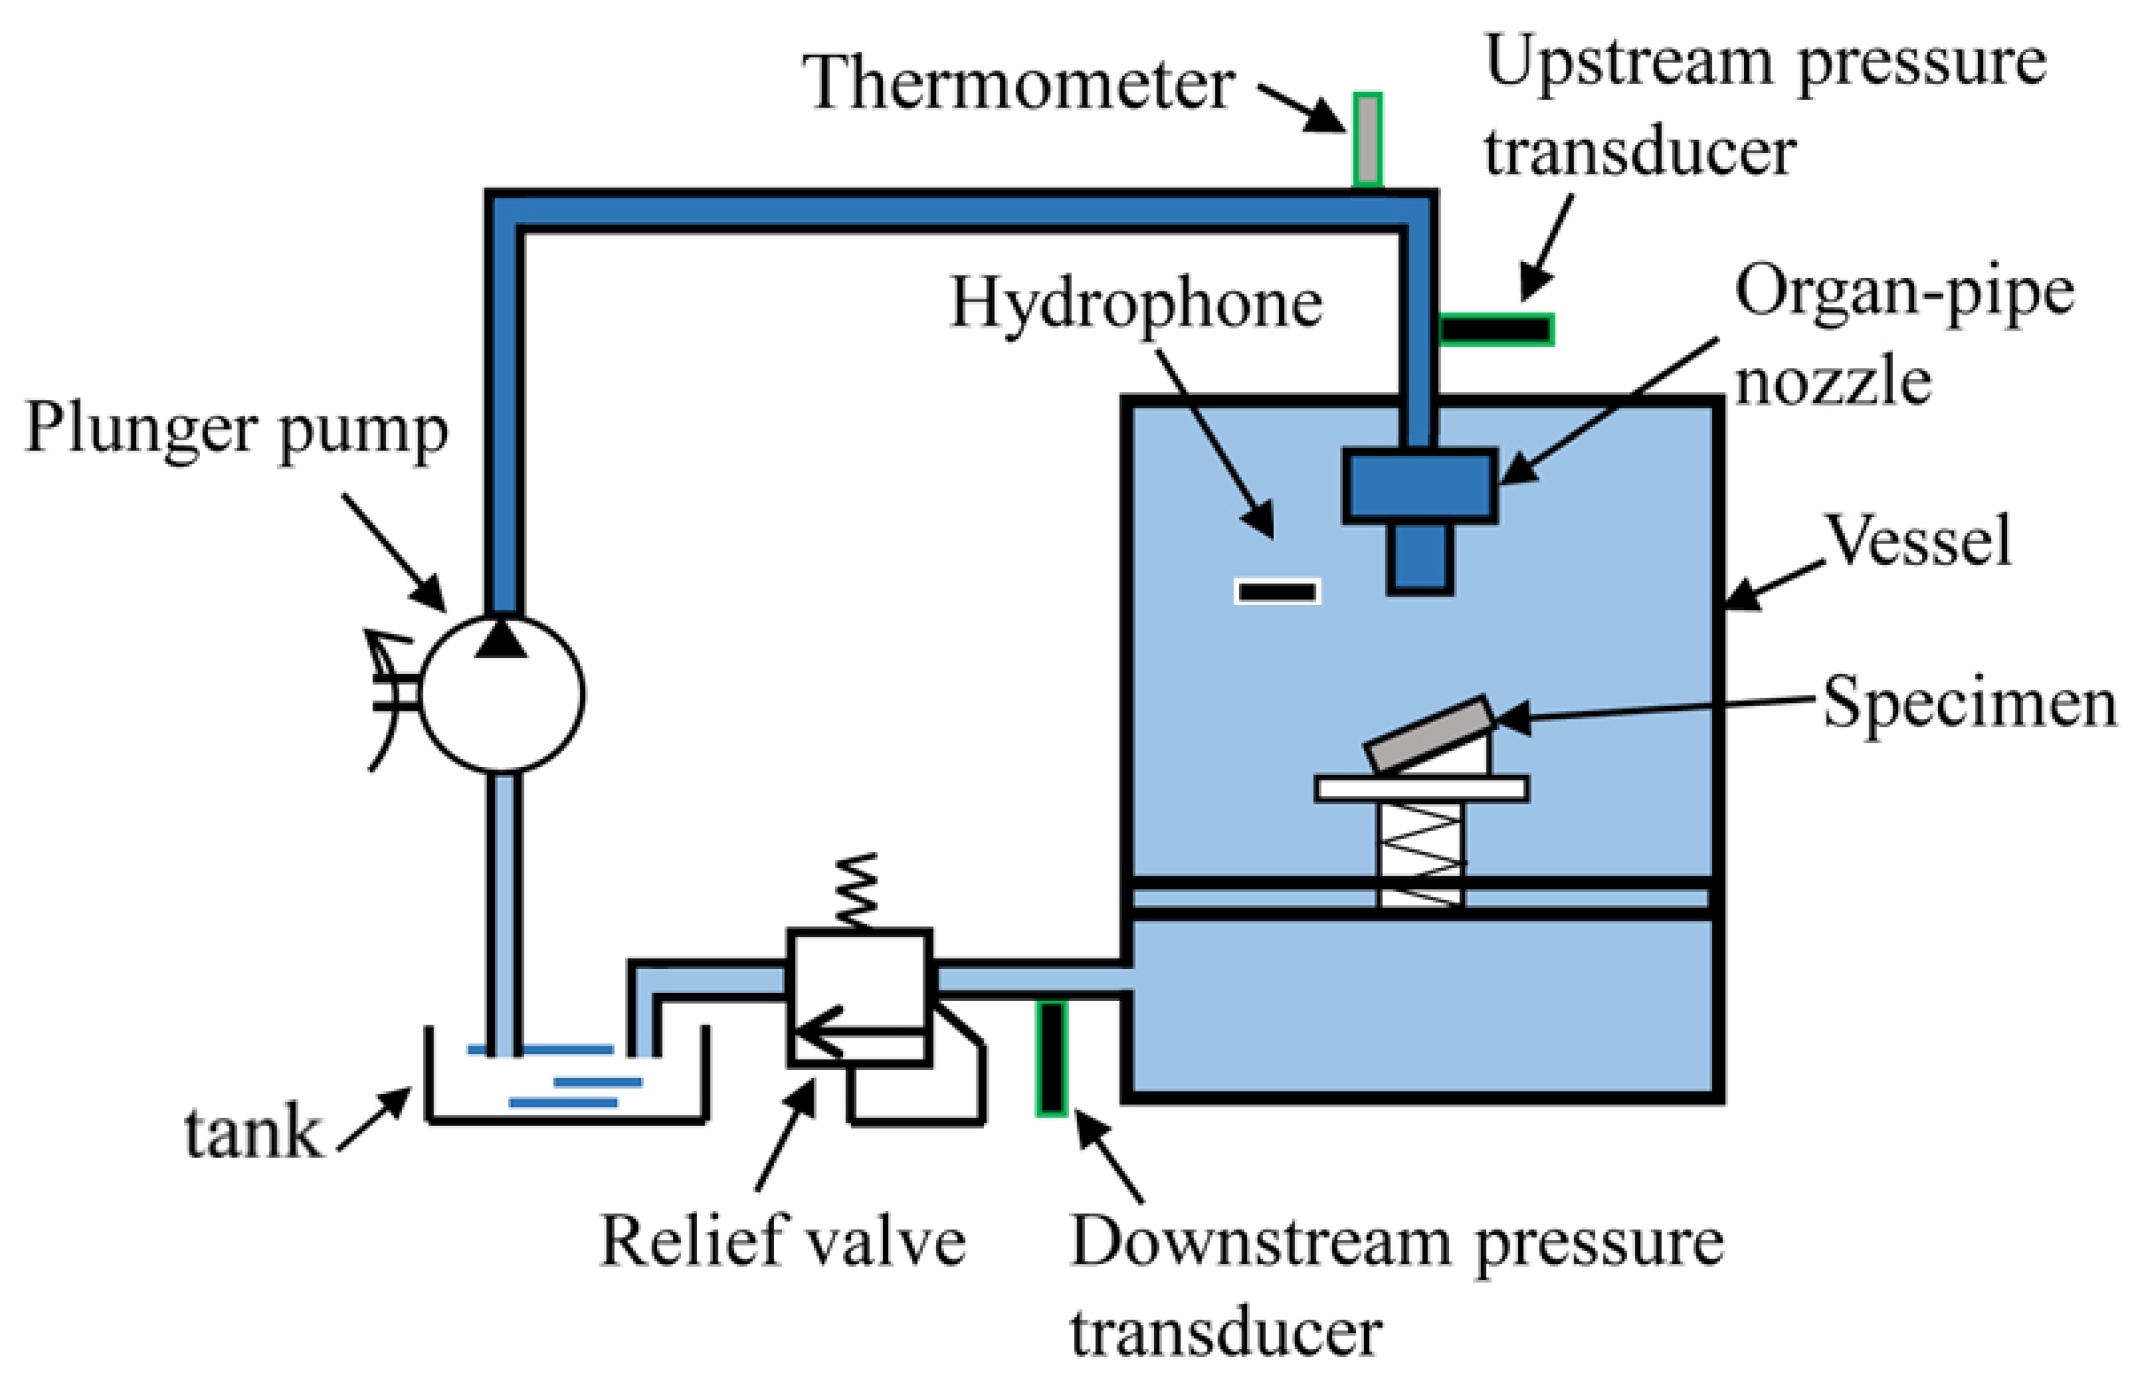
Figure 1. Schematic of the water jet erosion testing system.
Energies 13 02563 g001
Figure 2. Schematic and geometry parameters of the nozzle.
Energies 13 02563 g002
Figure 3. Mass loss at various oblique angles across serial standoff distances.
Energies 13 02563 g003
Figure 4. Normal view of eroded surface at α = 0°: (a1) l d / d t = 3.5, (a2) l d / d t = 9.5, (b1,b2) schematics of erosion area, (c) erosion distribution.
Energies 13 02563 g004
Figure 5. Profiles of the erosion at α = 0°: (a) l d / d t =4 and (b) l d / d t = 7.5.
Energies 13 02563 g005
Figure 6. Normal view of eroded surface at α = 5°: (a1) l d / d t = 5, (a2) l d / d t = 10, (b1,b2) schematics of erosion area, (c) erosion distribution.
Energies 13 02563 g006
Figure 7. Profiles of the erosion at α = 5°. (a1) longitudinal section at l d / d t = 4; (a2) transverse section at l d / d t = 4; (b1) longitudinal section at l d / d t = 7.5; (b2) transverse section at l d / d t = 7.5.
Energies 13 02563 g007
Figure 8. Normal view of eroded surface at α = 15°: (a1) l d / d t = 5, (a2) l d / d t = 9, (b1,b2) schematics of erosion area, (c) erosion distribution.
Energies 13 02563 g008
Figure 9. Profiles of the erosion at α = 15°. (a) longitudinal section at l d / d t = 4; (b) transverse section.
Energies 13 02563 g009
Figure 10. Normal view of eroded surface at α = 30°: (a1) l d / d t = 6.5, (a2) l d / d t = 10, (b) schematic of erosion area, (c) erosion distribution.
Energies 13 02563 g010
Figure 11. Spectra of the self-resonating oscillations (left column) and the cavitation noise (right column) at α = 0°. (a1,a2) l d / d t = 4 ; (b1,b2) l d / d t = 7.5 ; (c1,c2) l d / d t = 8.5 ; (d1,d2) l d / d t = 9.5 ; (e1,e2) l d / d t = 11.5 .
Energies 13 02563 g011
Figure 12. Spectra of the self-resonating oscillations (left column) and the cavitation noise (right column) at α = 5°. (a1,a2) l d / d t = 4 ; (b1,b2) l d / d t = 7.5 ; (c1,c2) l d / d t = 9.5 ; (d1,d2) l d / d t = 11.5 ; (e1,e2) l d / d t = 15 .
Energies 13 02563 g012
Figure 13. Spectra of the self-resonating oscillations (left column) and the cavitation noise (right column) at α = 15°. (a1,a2) l d / d t = 5 ; (b1,b2) l d / d t = 7.5 ; (c1,c2) l d / d t = 9 ; (d1,d2) l d / d t = 11.5 .
Energies 13 02563 g013
Figure 14. Spectra of the self-resonating oscillations (left column) and the cavitation noise (right column) at α = 30°. (a1,a2) l d / d t = 6 ; (b1,b2) l d / d t = 8.5 ; (c1,c2) l d / d t = 11.5 .
Energies 13 02563 g014
Figure 15. Normalized dominating frequencies (S) of the upstream pressure oscillations and the cavitation noise. (a) α = 0°; (b) α = 5°; (c) α = 15°; (d) α = 30°.
Energies 13 02563 g015
Table 1. Nozzle dimensions.
Dimensions (mm) d p 2 d p 1 d t d e l p 2 l p 1 l t l h l g β ( )
value2612214134240.72.825
Table 2. Testing cases list.
α (°) l d / d t
02.5, 3, 3.5, 4, 4.5, 5, 5.5, 6.5, 7.5, 8.5, 9, 9.5, 10, 10.5, 11.5, 12.5, 13.5, 15
53.5, 4, 4.5, 5, 5.5, 6.5, 7.5, 8.5, 9, 9.5, 10, 10.5, 11.5, 12.5, 13.5, 15
153.5, 4, 4.5, 5, 5.5, 6.5, 7.5, 8.5, 9, 9.5, 10, 10.5, 11.5, 12.5, 13.5, 15
306, 6.5, 7.5, 8, 8.5, 9, 9.5, 10, 10.5, 11.5, 12.5, 13.5, 15