Article

Prediction of Health-Related Leave Days among Workers in the Energy Sector by Means of Genetic Algorithms

by
Aroa González Fuentes
1,
Nélida M. Busto Serrano
2,*,
Fernando Sánchez Lasheras
3,*,
Gregorio Fidalgo Valverde
4 and
Ana Suárez Sánchez
4
1
School of Mining, Energy and Materials Engineering of Oviedo, University of Oviedo, 33007 Oviedo, Spain
2
Labor and Social Security Inspectorate, Ministry of Labor and Social Economy, 33007 Oviedo, Spain
3
Mathematics Department, Faculty of Sciences, University of Oviedo, 33007 Oviedo, Spain
4
Department of Business Administration, School of Mining, Energy and Materials Engineering of Oviedo, University of Oviedo, 33007 Oviedo, Spain
*
Authors to whom correspondence should be addressed.
Energies 2020, 13(10), 2475; https://doi.org/10.3390/en13102475
Submission received: 3 April 2020 / Revised: 11 May 2020 / Accepted: 12 May 2020 / Published: 14 May 2020
(This article belongs to the Special Issue Predicting the Future—Big Data and Machine Learning)

Abstract

:
In this research, a model is proposed for predicting the number of days absent from work due to sick or health-related leave among workers in the industry sector, according to ergonomic, social and work-related factors. It employs selected microdata from the Sixth European Working Conditions Survey (EWCS) and combines a genetic algorithm with Multivariate Adaptive Regression Splines (MARS). The most relevant explanatory variables identified by the model can be included in the following categories: ergonomics, psychosocial factors, working conditions and personal data and physiological characteristics. These categories are interrelated, and it is difficult to establish boundaries between them. Any managing program has to act on factors that affect the employees’ general health status, process design, workplace environment, ergonomics and psychosocial working context, among others, to achieve success. This has an extensive field of application in the energy sector.

Graphical Abstract

1. Introduction

Over the past few years, the main concerns of industry, especially in developed countries, have been to improve the workers’ productivity, occupational health and safety in the workplace, physical and mental well-being, and job satisfaction. Through the application of ergonomics, it has been shown that these issues have improved, so an effective implementation of ergonomics in the workplace can achieve a balance between the characteristics of the worker and the demands of the task, in addition to improving workplace design and introducing appropriate management programs. Companies that belong to the energy sector have also been working in this direction, showing some distinctive features that have been identified and studied here.
When the industry does not get involved in the abovementioned issues, it can affect the lives of workers. This results in a risk of deterioration in health and causes absenteeism. Currently, one of the major concerns is sick leave.
There are several factors that affect sick leaves. In this introduction, we first revise the studies that explain the behavior of such factors in the general working environment. Afterwards, we focus on the few works that are specifically oriented to the singularities of the energy sector.
According to the EUROSTAT [1], some 1194 M€ have been spent on sickness and health benefits in the European Union. This number was equivalent to 8.0% of gross domestic product (GDP). The average expenditure per inhabitant was 2338 Euros. In recent years, the spending on sick leave benefits has increased to 12.4%, with Norway being the country with the highest spending (32.4%) compared to Portugal, the country with the lowest (5.8%). For these reasons, the problem of absenteeism is of great interest to healthcare professionals, employers and economists.
According to the latest research published by the European Commission [2], women have higher rates of sick leave than men. There are multiple reasons for this. They have more precarious work and work contracts often linked to low income. Moreover, women often seek medical help for less-serious illnesses and are more frequently diagnosed with mental-health-related illnesses. Another explanation is connected to the burden of housework and childcare.
The aforementioned study [2] also mentions that sick leave increases with age; elderly people take longer-term leave compared to young people, who generally take short-term leave. This is due to the fact that health worsens with age, and working conditions have deteriorated since the economic recession. A clear correlation between occupational, socioeconomic status and absence due to illness is highlighted: the more physically demanding the occupation is and the lower the socioeconomic status, the higher the absenteeism.
Regarding the energy sector, different factors have been studied that may lead to sick leave. A study carried out in the petroleum industry [3] corroborates that women are more likely to take sick leave than men. This may be mainly due to three factors: there is sick leave due to pregnancy; they tend to have more temporary contracts; and they suffer more psychological problems. Another risk factor is smoking; workers who are smokers or former smokers have a higher risk of taking sick leave than non-smokers, those who consume alcohol and even workers exposed to chemical products. Other good predictors of absenteeism due to illness are abnormal sleep and job dissatisfaction. Some physical activity is recommended for workers.
Another specific factor that has been studied in the energy sector is how the different shiftwork patterns can cause sick leave. The employees of a power plant prefer 12-hour shifts rather than eight-hour shifts, since they enjoy longer breaks and an improved social and domestic life. This measure also improves mood, health status and both the quality and quantity of sleep. The only drawback is that it can pose a potential safety risk for the employee when performing highly demanding tasks at the end of the shift, since concentration decreases [4]. A study conducted among workers of a nuclear power plant [5] confirms all these findings on the relation between working in shifts and domestic, social life and well-being of the worker.
Another relevant factor in the energy sector is the type of work carried out. It has been proven that people who do manual work, also called blue-collar (production) workers, are more likely to remain on long-term leave, and this would be of longer duration than in those people who perform skilled jobs, also known as white-collar workers (office workers and managers). The latter are exposed to a greater risk for short-term pain, mainly musculoskeletal disorders (MSD), but this could be avoided by correcting posture [6].
The design of the job is another very important factor to take into account in this sector. A study of workers in a thermal power plant [7] detected deficiencies both in its facilities and its resources. This type of industry is complex and usually has more problems than other industries. Apart from health problems due to ergonomic factors, it has been found that production work in combination with bad environmental conditions (excessive temperatures in summer) and very noisy and dusty environments are factors that tend to worsen the health of workers and increase the possibility of their going on sick leave.
In summary, talking about the energy sector, it seems that absenteeism rates have different behaviors attending to factors like gender, working organization circumstances, such as shifts or psychosocial demands, workplace environment and other factors related with workstation design. The way these factors combined affect sick leave remains unexplored.
The use of machine-learning techniques to predict occupational health and safety outcomes in different fields is not new, whether focused on work-related accidents [8], fire risk [9,10], MSD [11,12,13,14] or visual disorders [15,16]. Some of these works focus on specific sectors, such as mining or the health industry.
Nevertheless, to date, no researches have studied how the combination of factors such as age, gender, well-being, domestic and social life, as well as psychosocial factors, can influence the proneness to sick leave among workers in the energy sector. As far as it is known by the authors, most of the previous research in this field that make use of machine-learning techniques employed just only, for example, support vector machines [8,16], artificial neural networks [9,11], Multivariate Adaptive Regression Splines (MARS) [10,14] or k-nearest neighbors [12]. All these research studies have shown the utility of machine-learning techniques in this area for both regression and classification. However, until today, there have been few works [13,15] that combine more than one machine-learning methodology in order to improve their performance.
In this research, a hybrid methodology that combines MARS and genetic algorithm is proposed for predicting the number of days absent from work due to sick or health-related leave, among workers in the industry sector, according to ergonomic, social and work-related factors reported in the Sixth European Working Conditions Survey (EWCS).

2. Materials and Methods
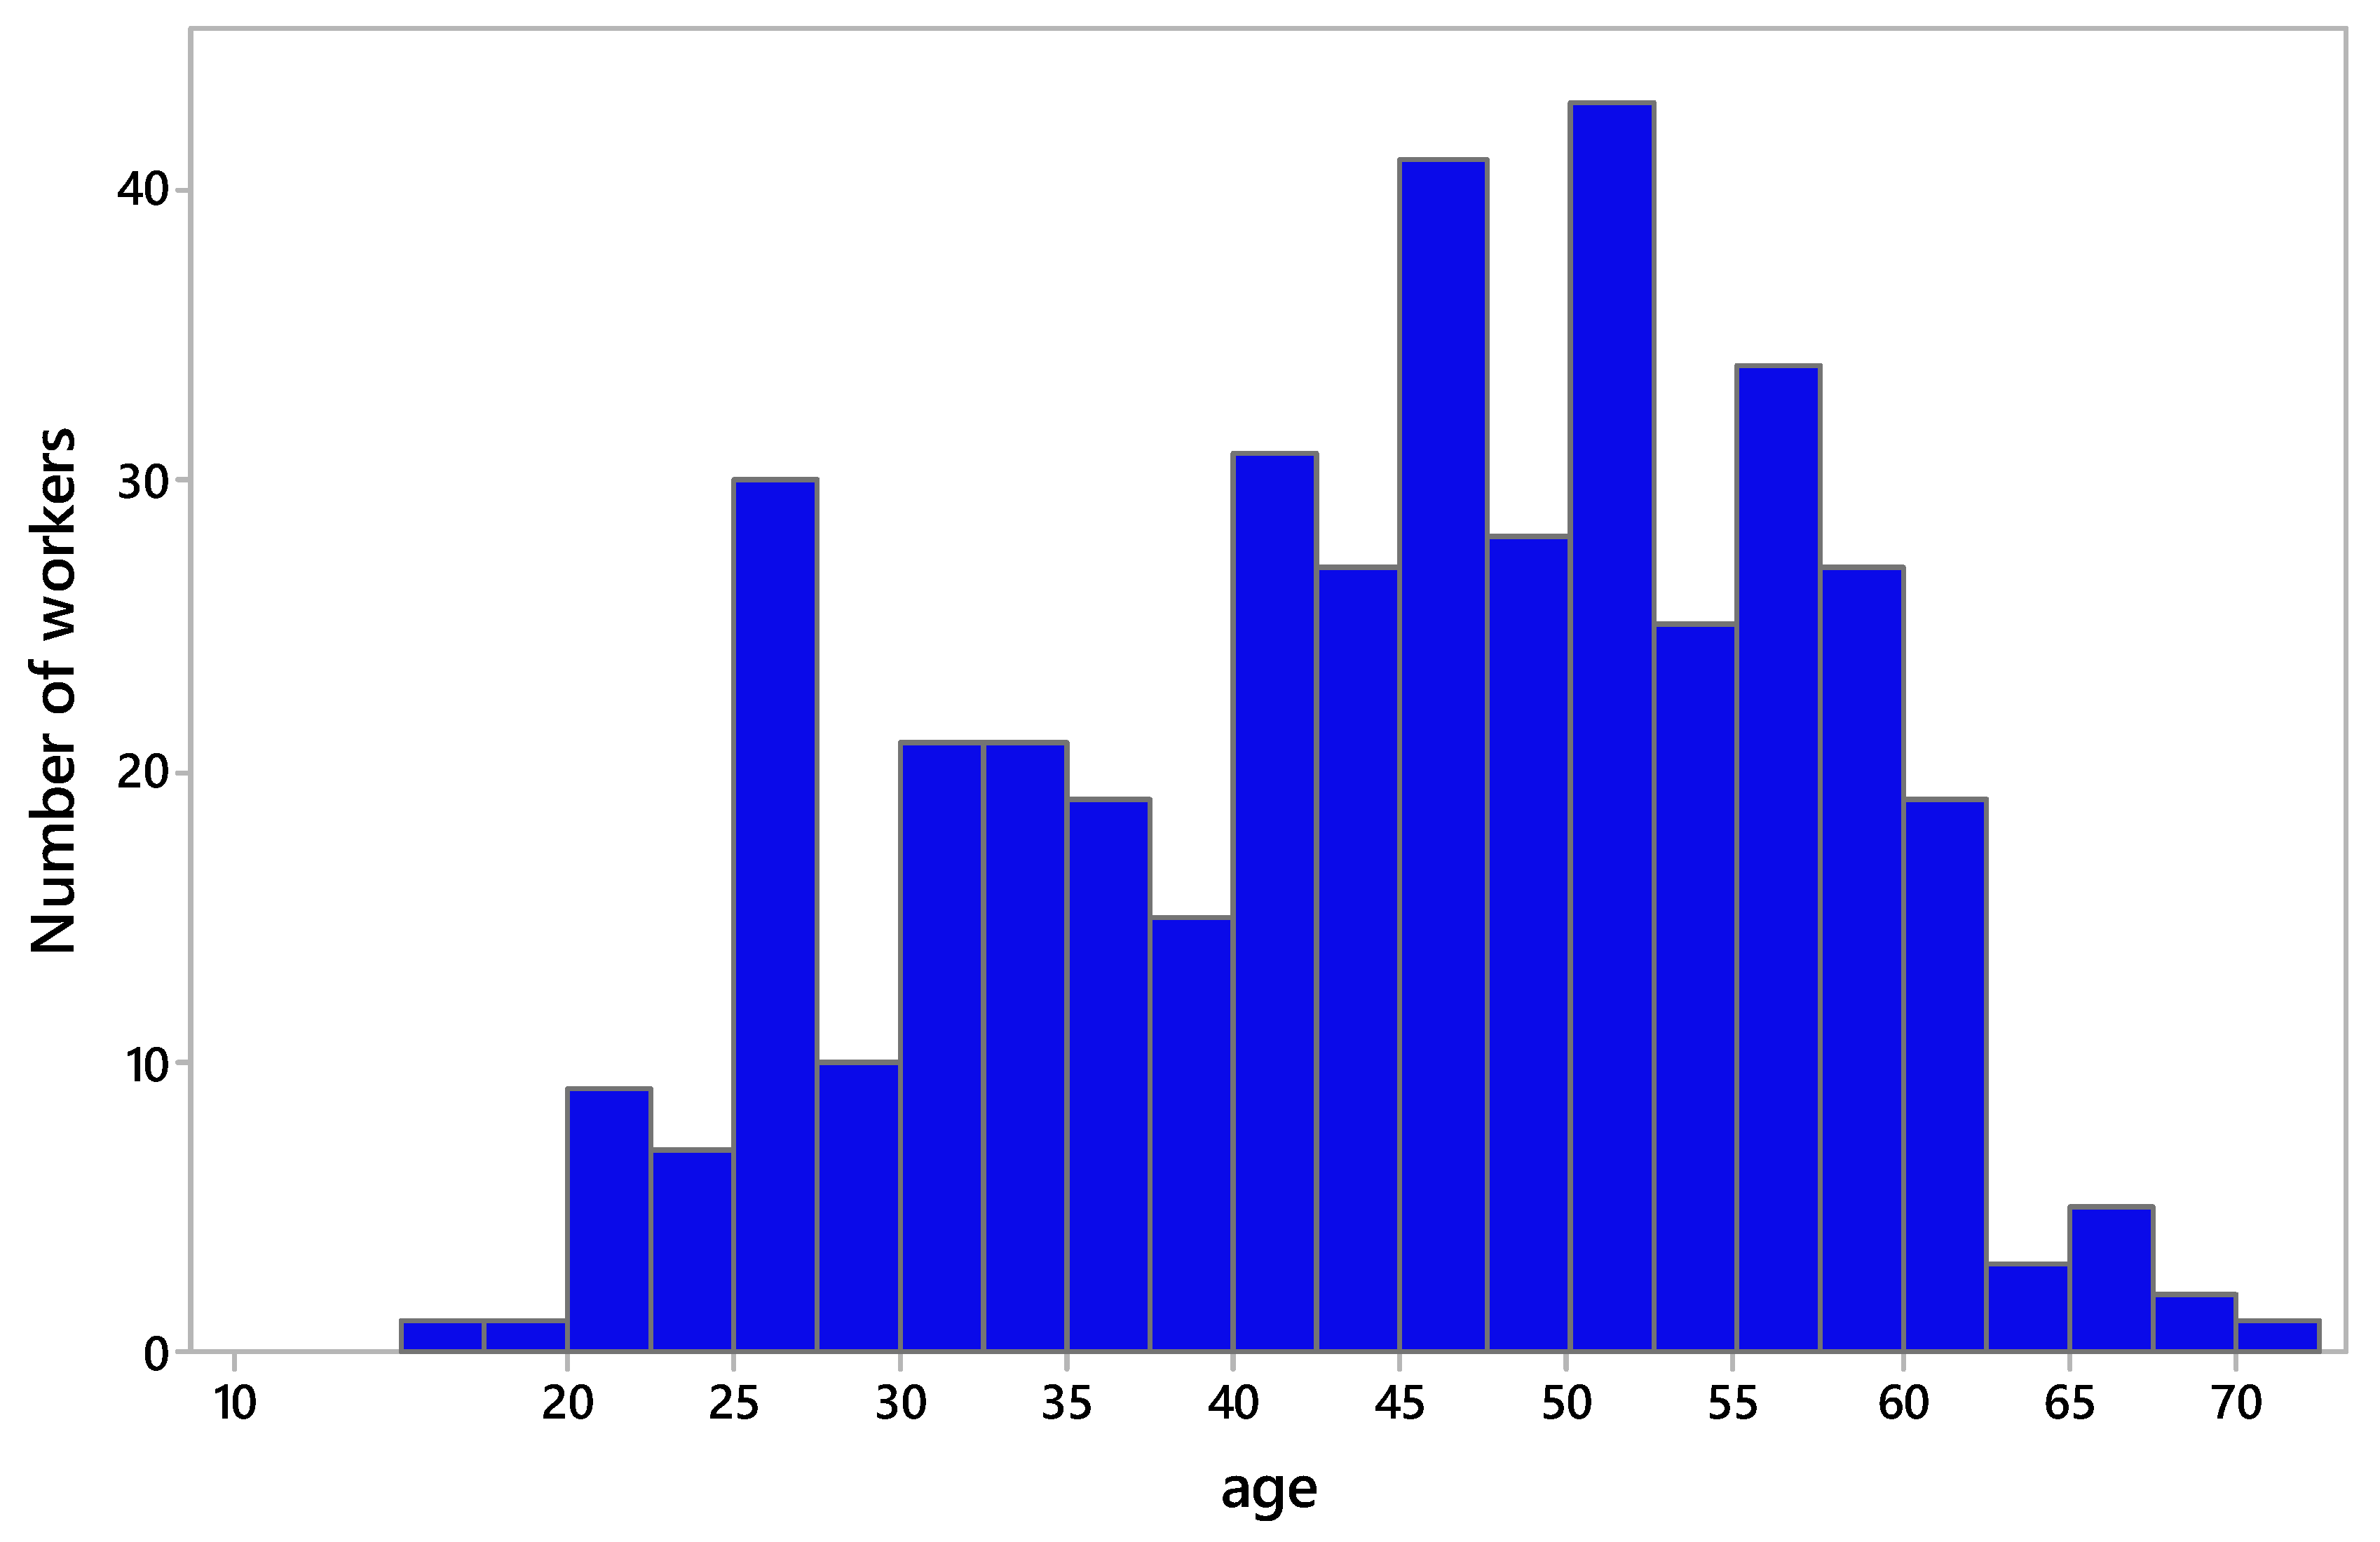
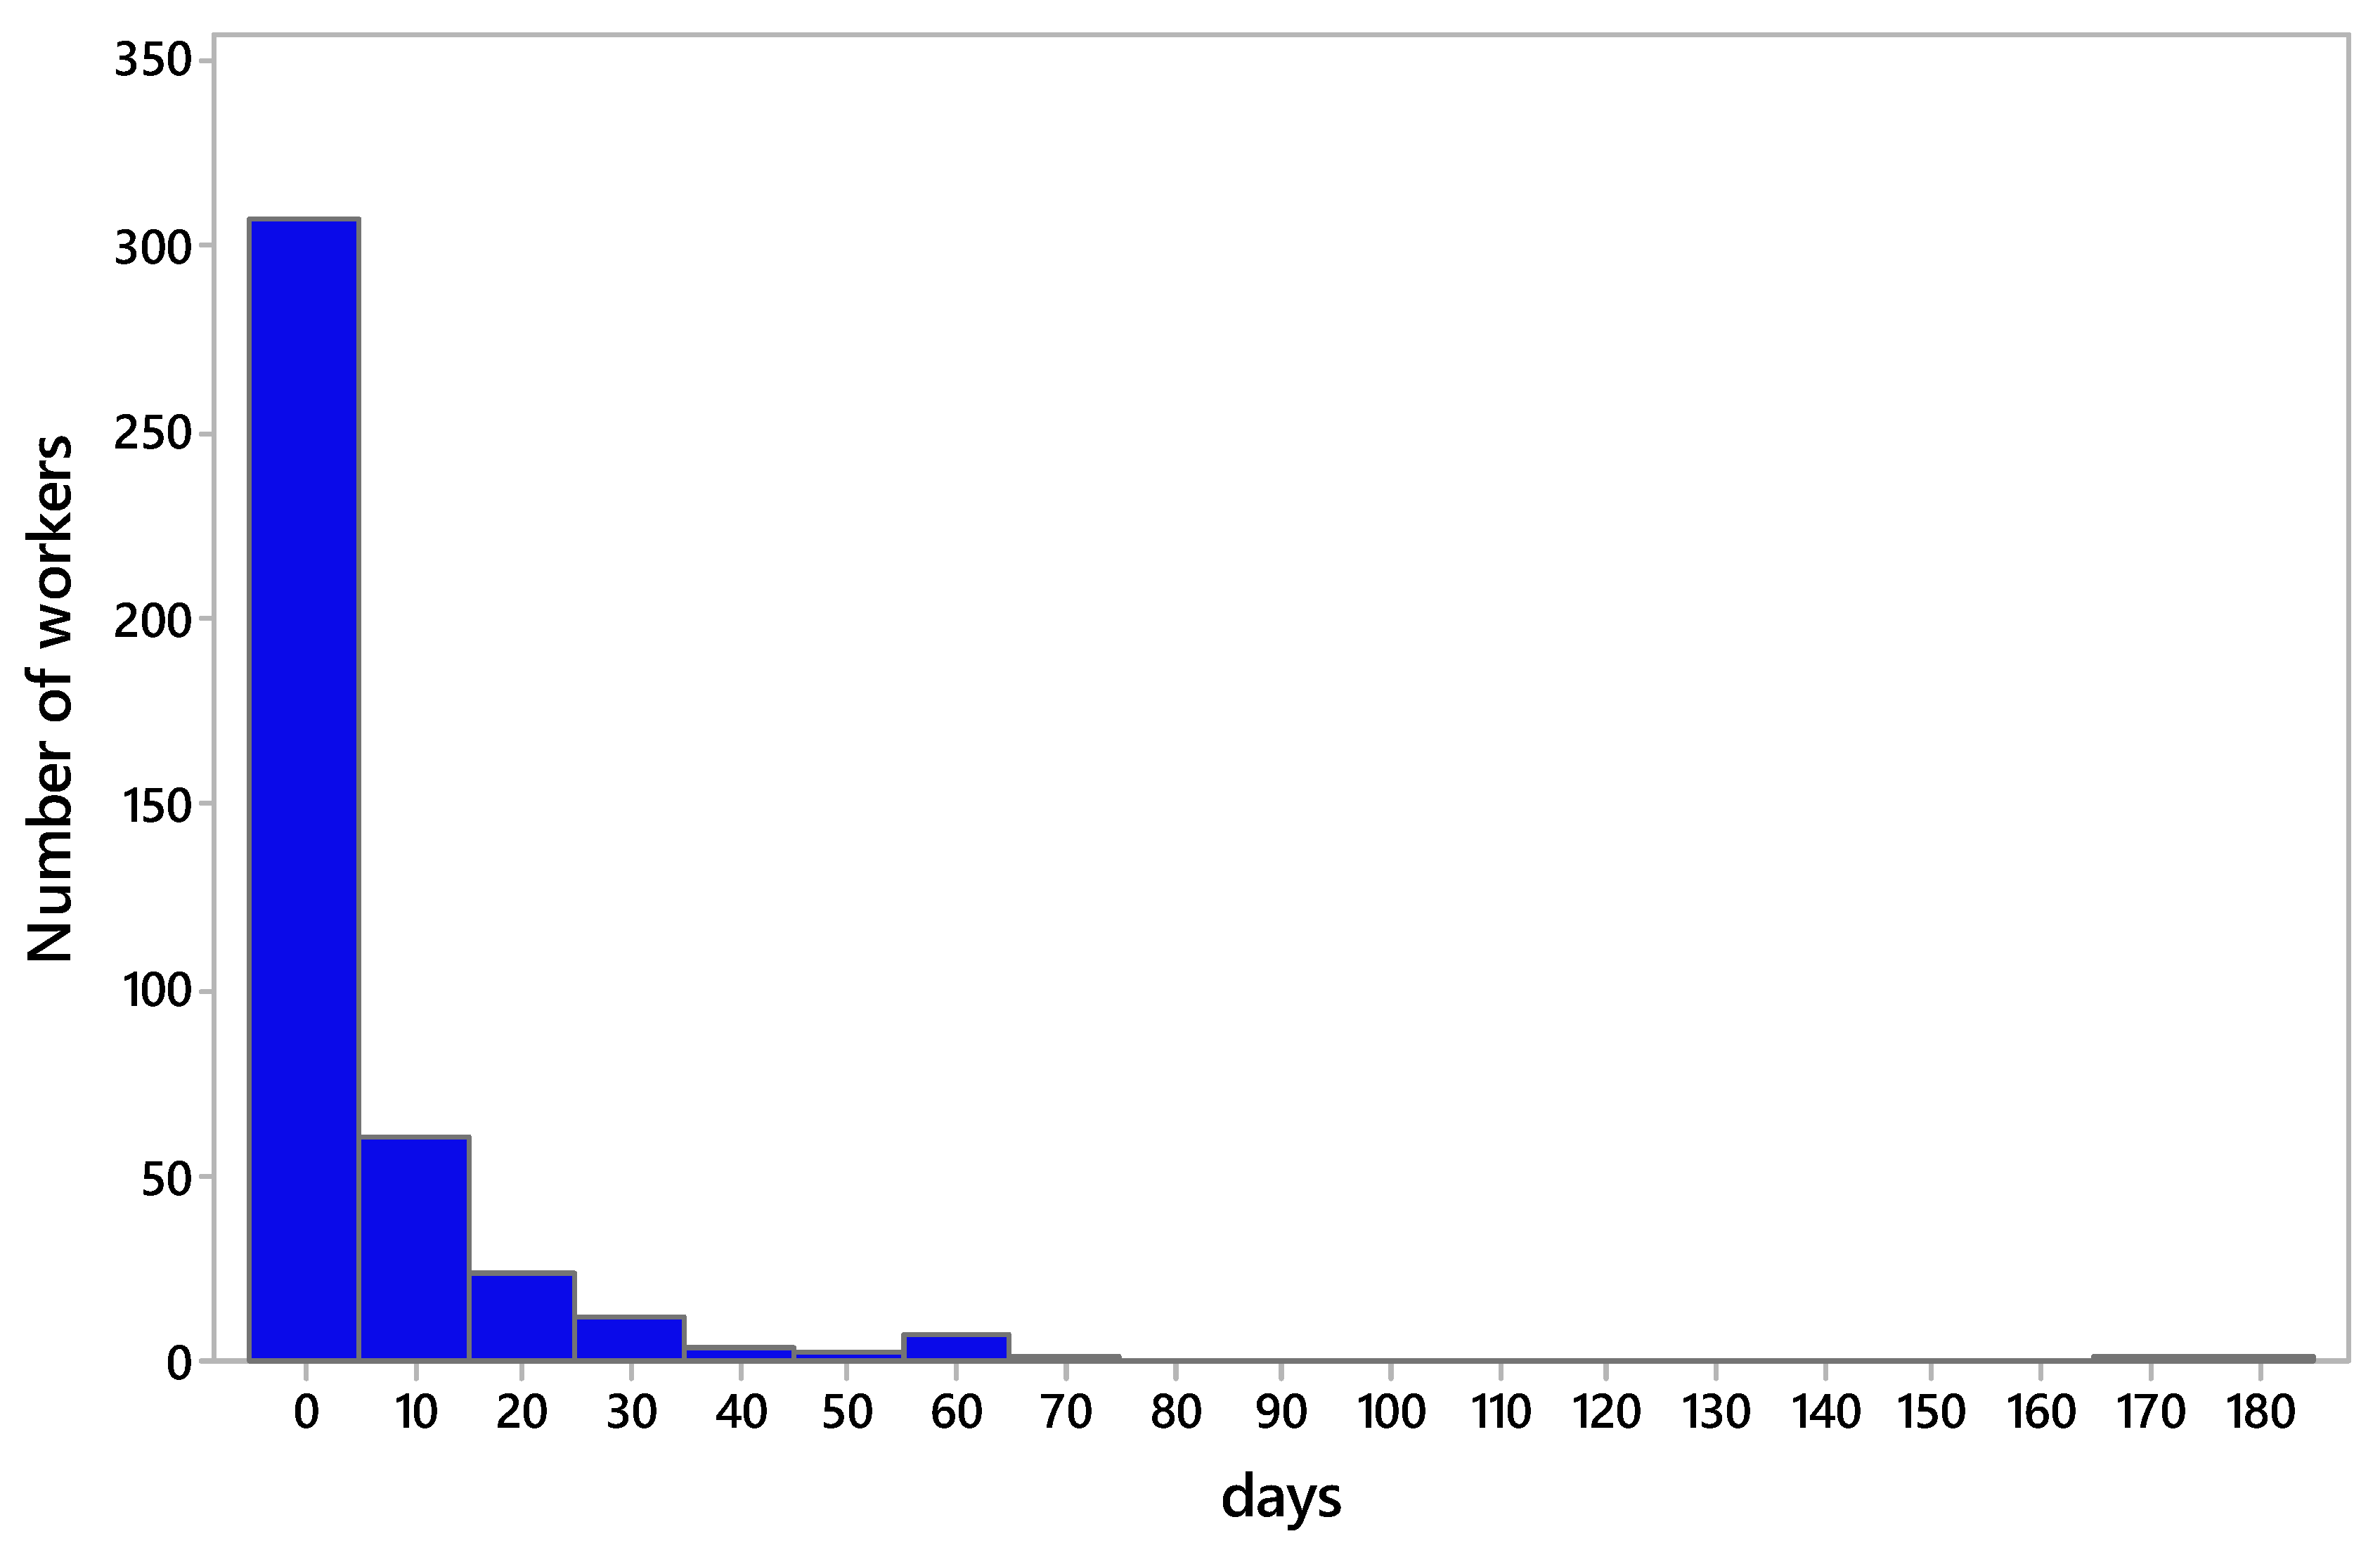
2.1. Dataset

This research work employs selected microdata from the Sixth European Working Conditions Survey (EWCS), which was conducted in 2015 by the European Foundation for the Improvement of Living and Working Conditions, Eurofound [17]. The EWCS is generally conducted every five years, providing an overview of working conditions of the European population. A random representative sample of “persons in employment” (i.e., employees and the self-employed) is surveyed through a questionnaire administered face-to-face. The Eurofound datasets are stored and promoted online by the UK Data Service [18]. Upon request, the data are available free of charge, provided they will be used for non-commercial purposes.
Almost 44,000 workers in 35 countries were interviewed through the sixth wave of the EWCS. The validity of the questionnaire was guaranteed by a questionnaire-development group composed of experts and representatives of the European Commission and different international organizations [19]. This sixth edition codified more than 370 variables that included physical and psychosocial risk factors, working time, place of work, work-pace determinants, employee participation, job security, social relations, personal conditions, etc. The whole list of variables included in the sixth wave of the survey can be found in the source questionnaire, available online at the website of Eurofound [20]: https://www.eurofound.europa.eu/sites/default/files/page/field_ef_documents/6th_ewcs_2015_final_source_master_questionnaire.pdf.
The size of the initial dataset was first reduced by only selecting workers from energy-related sectors. The final sample consisted of 420 workers (333 men and 87 women), aged between 17 and 71 years (average 44; see Figure 1) from the following NACE Revision 1 sections: mining of coal and lignite; extraction of peat; extraction of crude petroleum and gas; mining of uranium and thorium ores; manufacture of coke, refined petroleum products and nuclear fuel; electricity, gas, steam and hot water supply. The distribution of the subjects by country is shown in Table 1. Table 2 presents their level of studies, according to the International Standard Classification of Education (ISCED). Table 3 shows the distribution of the sample of workers according to their household’s total monthly income. The average leave time was of 5.9 days, with a standard deviation of 16.1 days. Only two workers have a leave longer than 100 days. Please also note that leaves over 10 days represent only 18.33% of the total.
A second-dimensional reduction was carried out by decreasing the number of variables through expert criteria. Only the 59 most relevant independent variables were preselected to initially feed the model developed and to try to explain the output variable. Some of the variables were designed as Likert scales, some of them were binary and a few were continuous (numerical). Please note that it would have been possible to perform this reduction also by means of either genetic algorithms or other methodologies like decision trees or PCA, but in our understanding, it was less time-consuming to use expert criteria. Please note that this is a good way in order to avoid finding spurious relationships.
The output variable, y15_Q82, records the answers provided by the sample of workers to the following question: “In the past 12 months, how many days absent from work due to sick leave or health-related leave?” It is a numerical variable, ranging from 0 to 360, and synthetizes the duration of the sick leave taken by the workers.

2.2. Multivariate Linear Regression

Let us consider a set of k + 1 quantitative variables with y as the dependent variable and x 1 ,   x 2 ,   ,   x k as independent variables. The multivariate linear regression method consists of creating a lineal model that predicts y , using variables x 1 ,   x 2 ,   ,   x k . It can be expressed as follows [21]:
y = β 0 + β 1 x 1 + + β k x k
The parameters’ estimation is performed by means of the ordinary least squares approach [22] by means of the following:
m i n β k + 1 y X β 2 = m i n β k + 1 i = 1 n ( y i β 0 j = 1 k β j x i j ) 2
where · denotes the Frobenius norm.

2.3. Support Vector Machine for Regression

Let us consider again a set of k + 1 quantitative variables with y as the dependent variable and x 1 ,   x 2 ,   ,   x k as independent variables, where each i element constitutes a row vector. Let Φ : χ be the function that corresponds to each row vector with a point of the characteristics space . Let us define a function as follows [23]:
f ( x ) = < ω , Φ ( x ) > + b
The problem to solve is as follows:
min 1 2 ω 2 + C i = 1 n ( ξ i + ξ i * )
Constrains:
y i < ω , ϕ ( x i ) > ε + ξ i                 i = 1 , , n < ω , ϕ ( x i ) > y i > ε + ξ i *                 i = 1 , , n ξ i 0 ,   ξ i * 0                           i = 1 , , n
The problem complexity depends on the dimension of the row vectors [24]. The solution of this problem gives as a result the model of support-vector machines for regression.

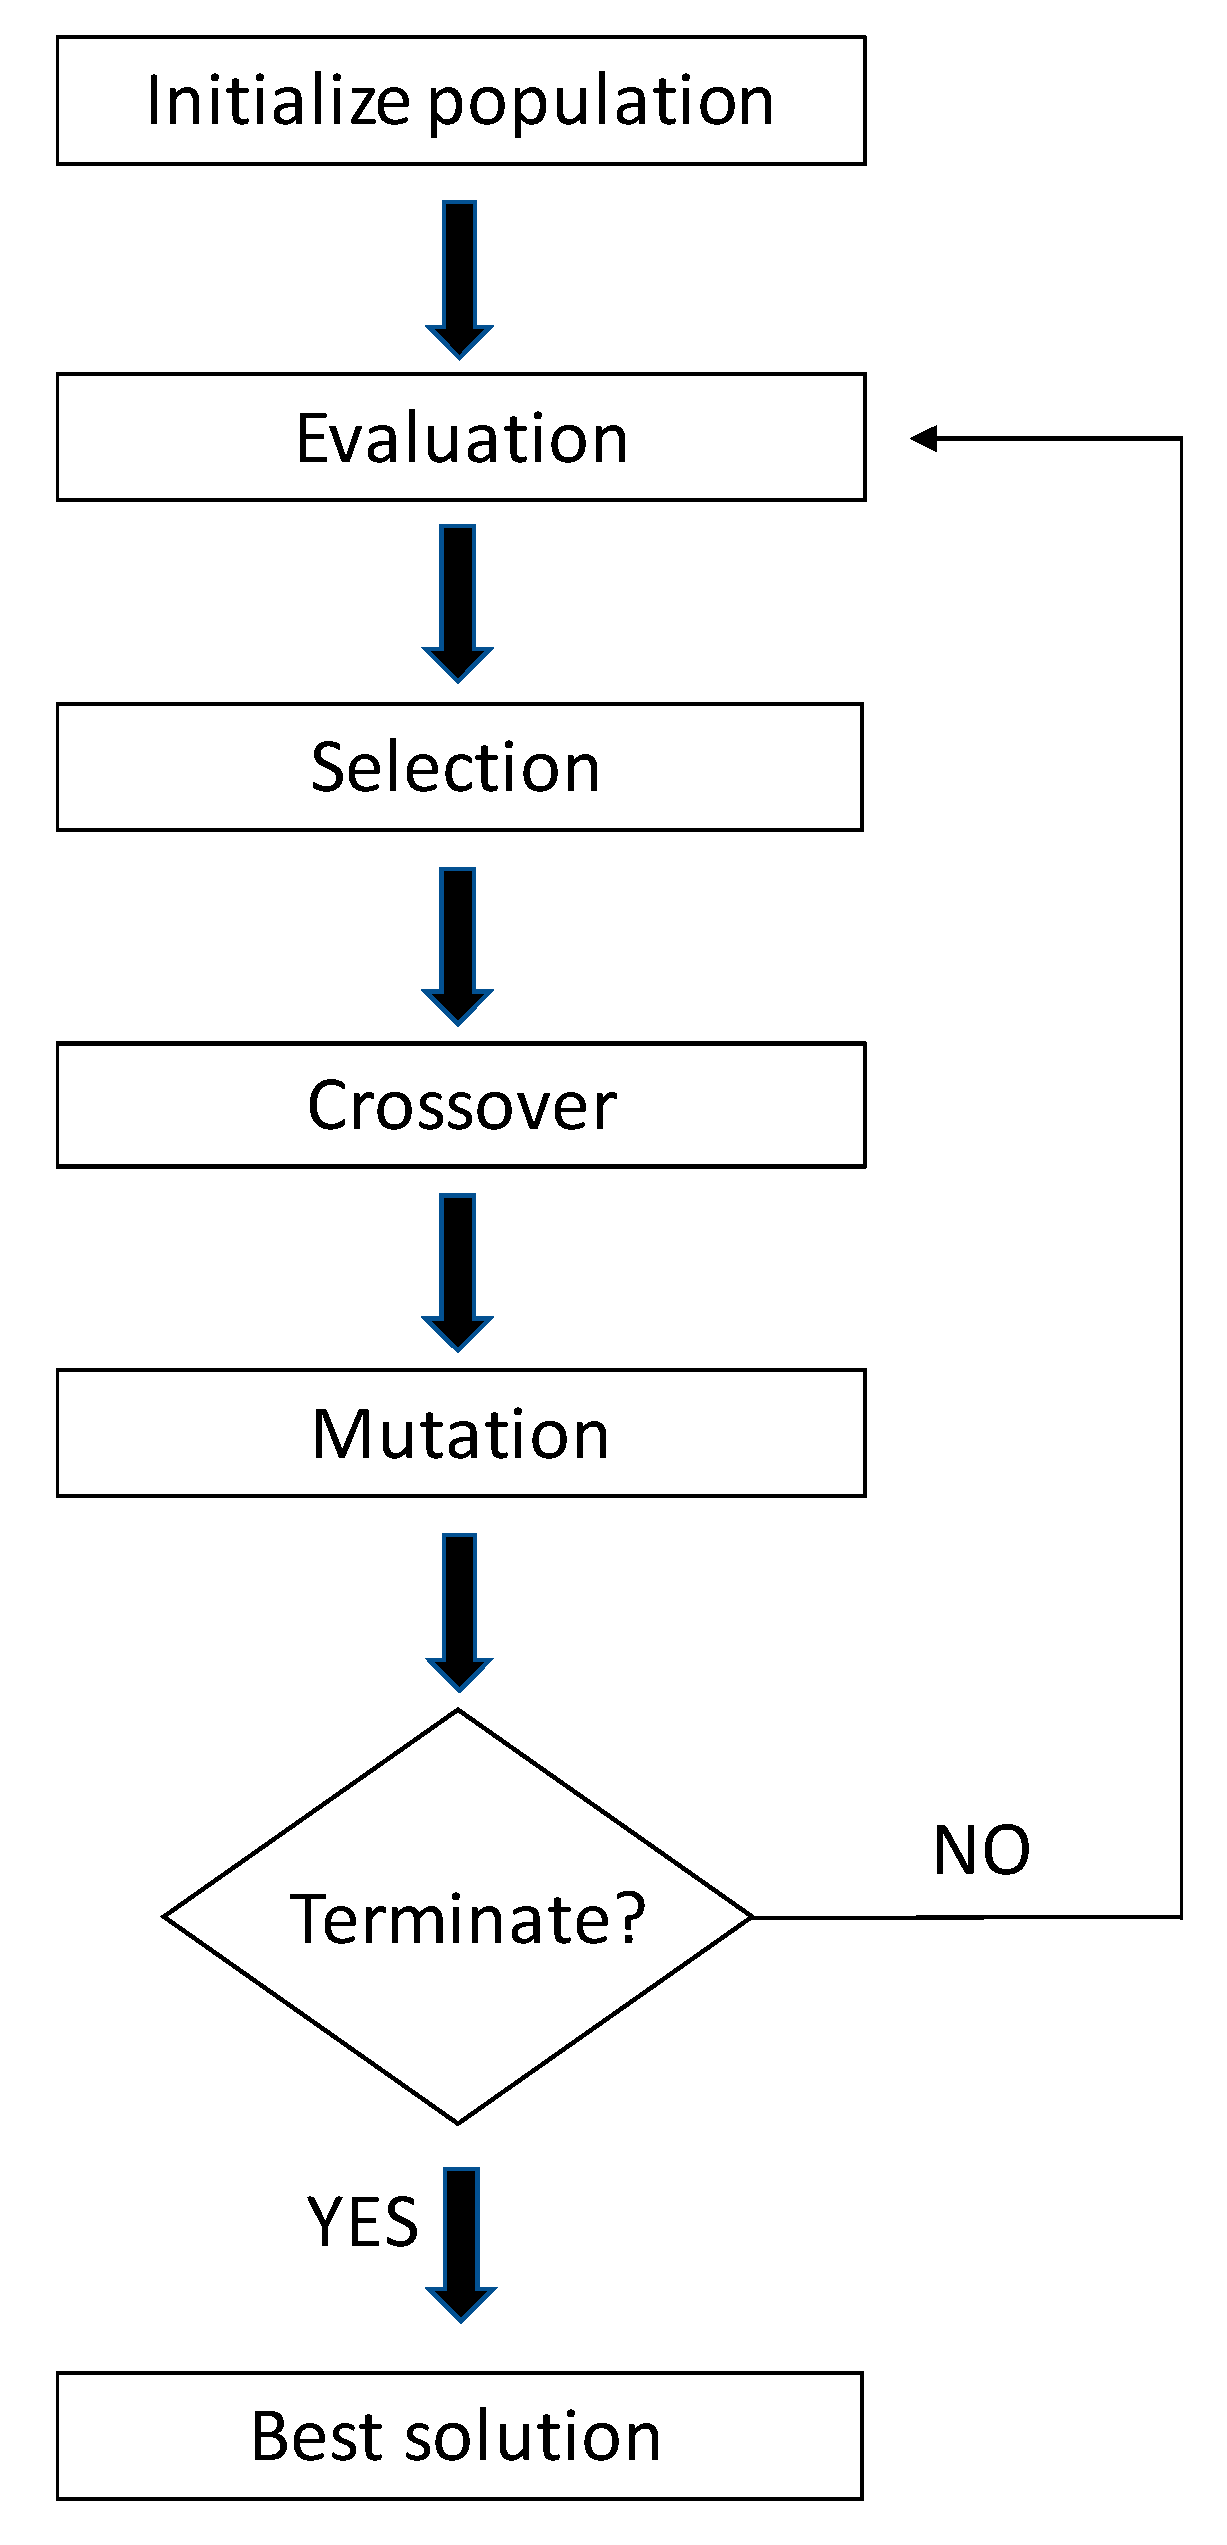
2.4. Genetic Algorithms

The process of learning by trial and error can be considered as being similar to the natural evolution process. The development of genetic algorithms (GA) started with the works of Holland [25]. GA is a kind of evolutionary algorithm that is based on the evolution of a certain set of solutions trying to either maximize of minimize the result of an objective function. GA is a bioinspired methodology that mimics the procedure of natural selection. The interest in GA methodology in optimization is because they are a global and robust method for finding solutions that do not require any a priori knowledge about the problem.
GA make use of the following three basic operators [16]:
  • Crossover;
  • Mutation;
  • Elitism.
The crossover operator takes two different individuals of the population and creates a new one, mixing the two. The mutation operator performs random changes in those individuals, created with the help of the crossover operator. Mutation makes it possible to introduce new strings in the next generation, giving the ability to search beyond the scope of the initial population. Another interesting mechanism is elitism, which makes a certain number of individuals with a good performance according to the result of the objective function survive and pass to the next generation, without any change.

2.5. Multivariate Adaptive Regression Splines

MARS is a well-known parametric methodology that builds a non-linear model based on hinge functions. It is expressed by the following equation [26]:
y j ^ = β 0 + i = 1 k β i · B ( x i ) ,
where y j ^ represents each one of the outputs forecasted values per each y j , β i are the model parameters and B are the model basis functions. The basis functions are defined as follows:
B = { ( t x ) q       i f   x < t 0                 o t h e r w h i s e B + = { ( t x ) q       i f   x t 0                 o t h e r w h i s e
where q is a natural number that represents the power function.
When a MARS model is created, there are three different well-known methods that take part in the model in order to assess the importance of the variables. They are the following:
  • nsubsets: this criterion indicates the number of model subsets that make use of the variable. The larger the number of subsets that include the variable, the more important they will be considered.
  • gcv: this criterion calculates the generalized cross-validation (GCV) of the variables, and, taking into account the results, those variables that contribute most to increasing the GCV value are considered the most important.
  • rss: this criterion can be considered equivalent to gcv, but making use of the residual sum of squares (RSS) expression.
The GCV expression is as follows [23]:
G C V ( M ) = 1 n · i = 1 n ( y j y j ^ ) ( 1 C ( M ) n ) 2 ,
where C ( M ) is the complexity penalty function that increases with the number of basis functions in the model and which is defined with this equation, where M is the number of basis functions. In the case of the present research, the maximum interaction degree allowed was nine.
The equation for RSS is as follows [27]:
R S S = G C V ( M ) · 3 · M n 3

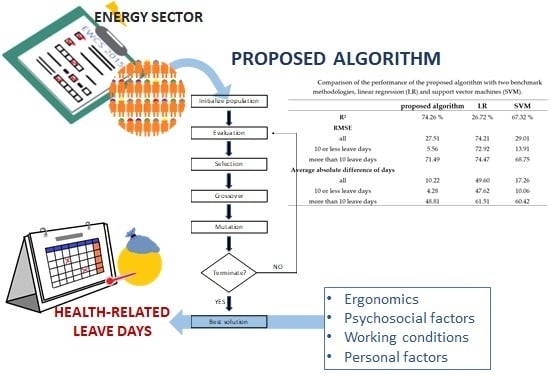
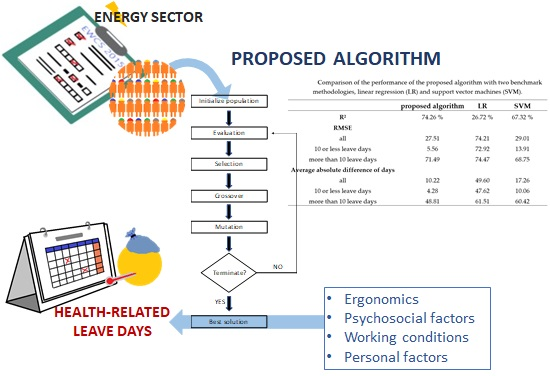
2.6. The Proposed Algorithm
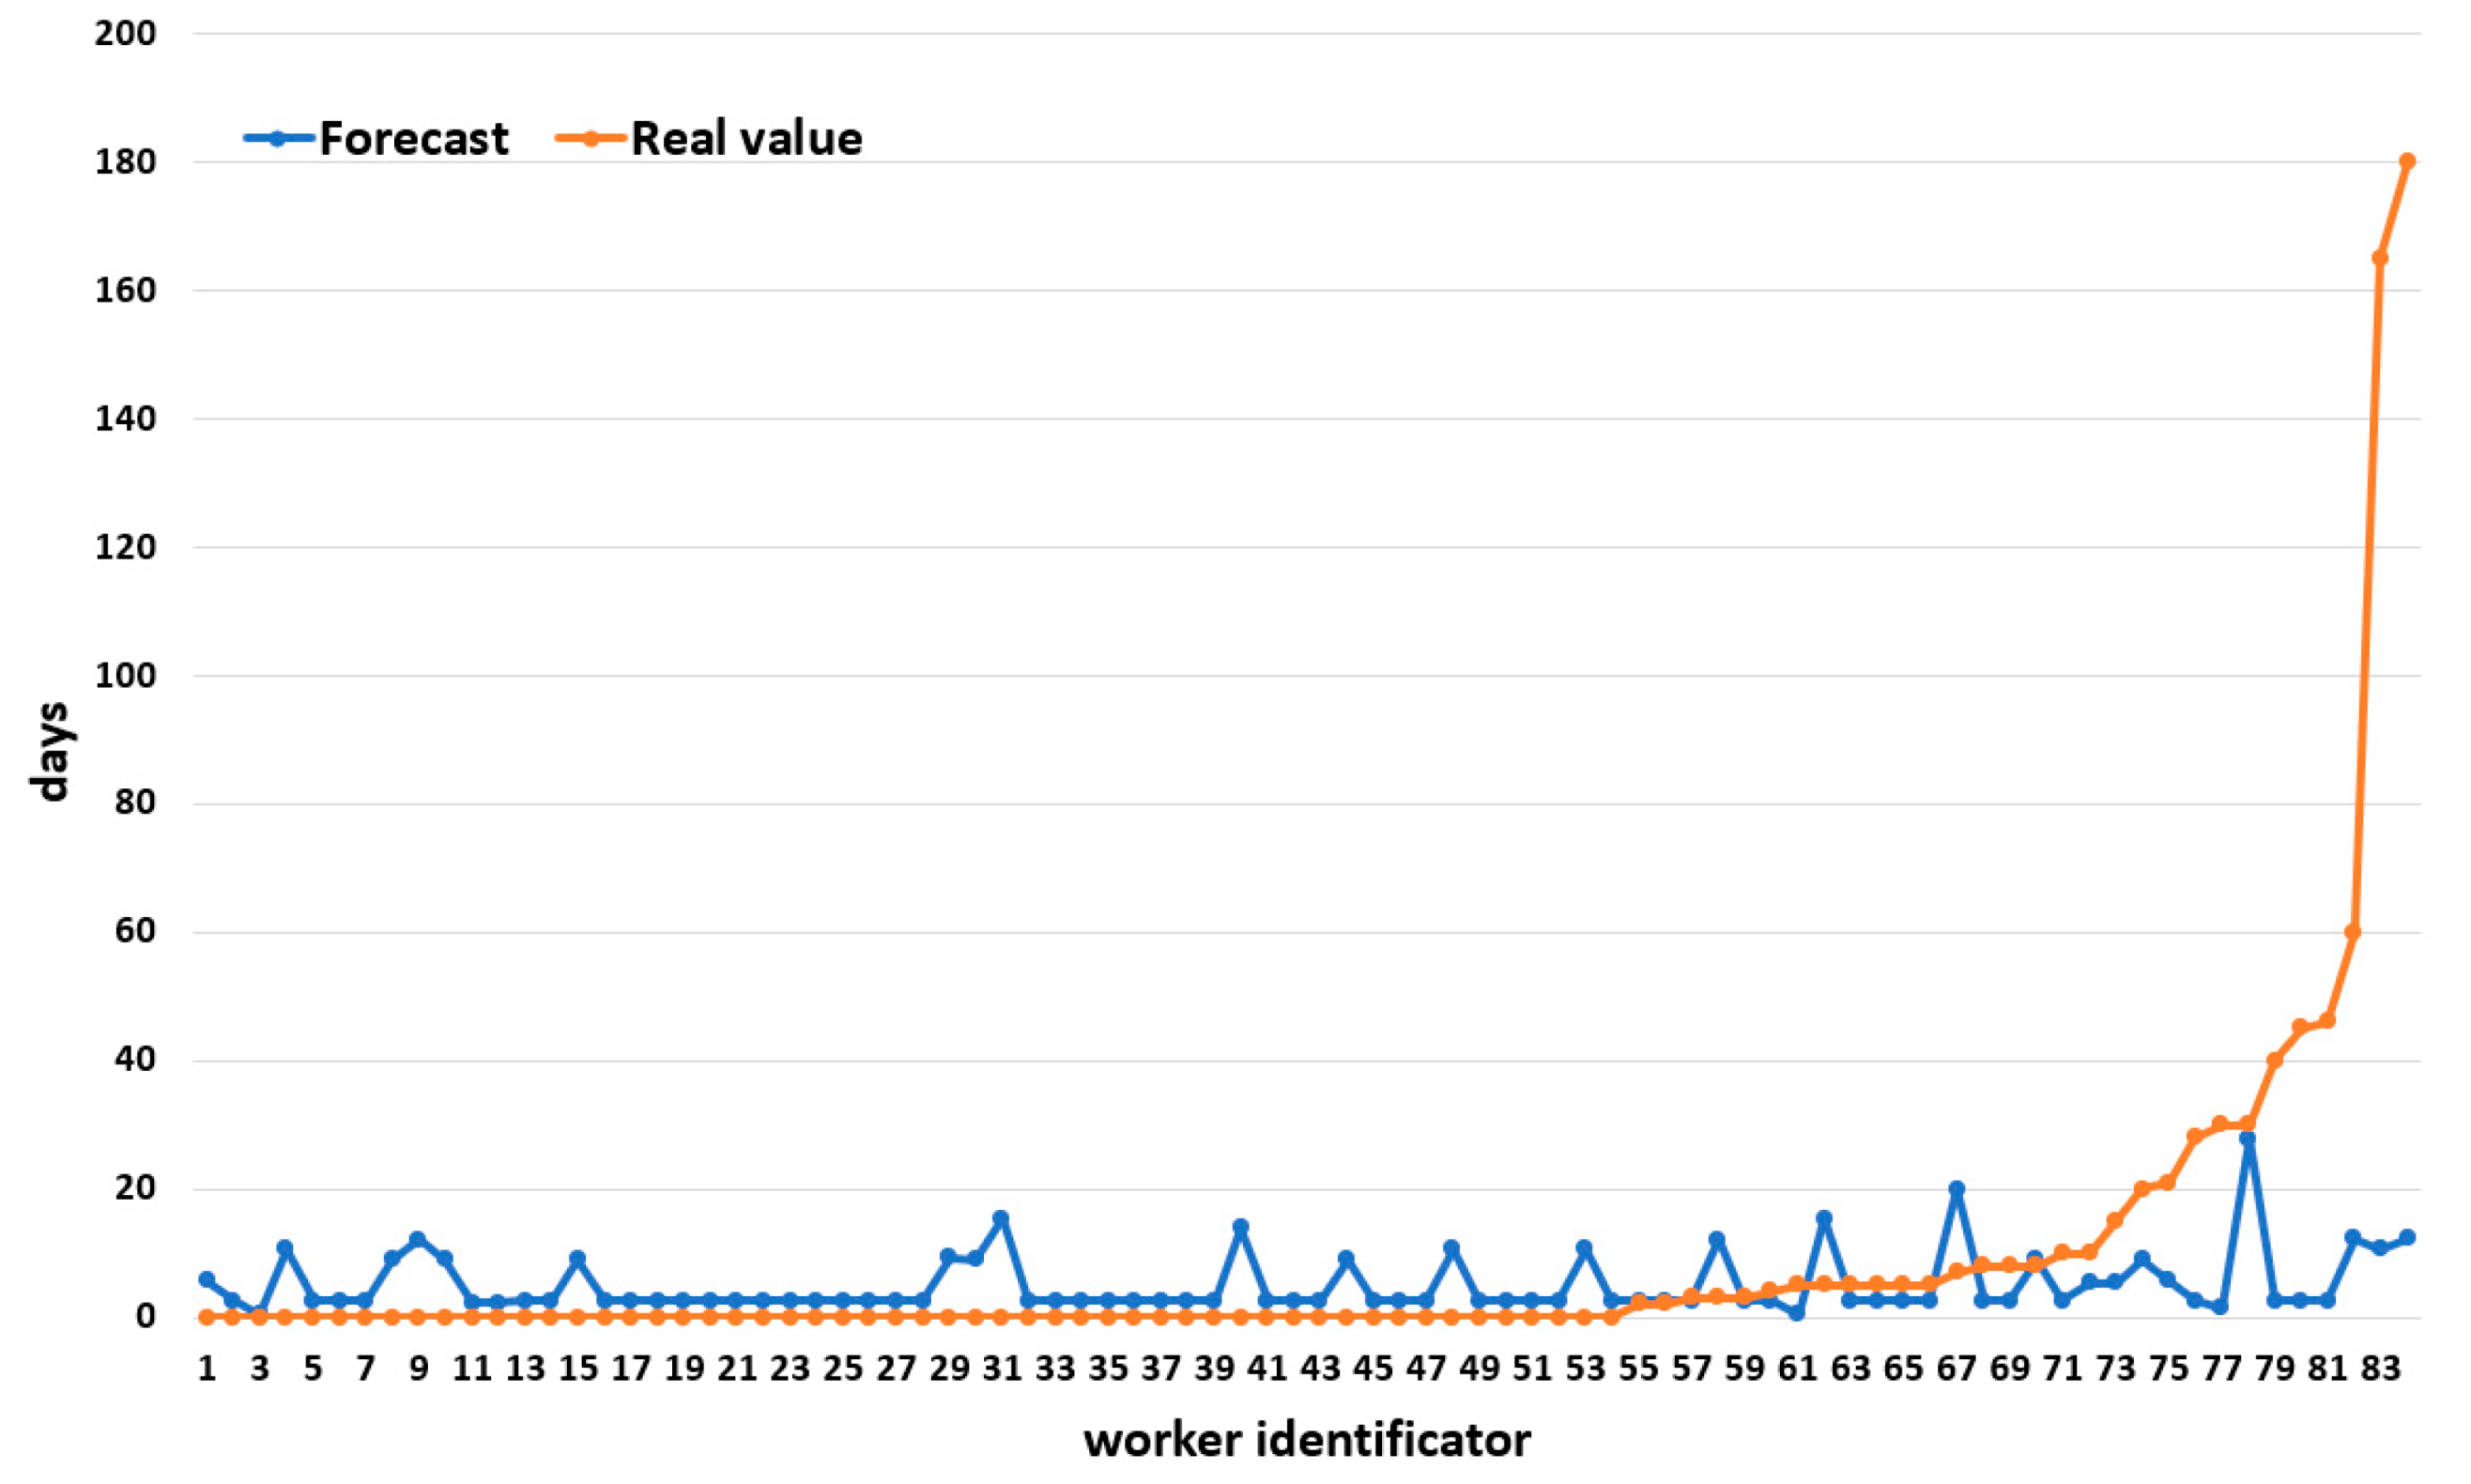
The proposed algorithm works as is explained here. First, it is initialized with a random population. Each member of the random population represents a subset of all the available variables that will be employed for the forecast of the number of days off for each worker. It is a string, as in the following example: 1100011…0101 with a total of 59 digits, one per variable, where 1 means that the variable is present and 0 that is missing.
In order to know how each of the variables subsets performs, they are employed for training a MARS model, using 80% of the available individuals, while the other 20% are employed for the model validation. This process is repeated 1000 times for each of the variables subset and the average R2 value obtained is used as the result of the objective function. Following the usual methodology of genetic algorithms, the best individuals of the population are selected and crossed.
In the present research, a mutation rate of 10% was allowed, and a 5% of elitism, which means that the 5% of the best individuals of a generation are included in the next one. In the case of the present research, a fine-tuning was performed, testing mutation rates from 0.5% to 15% in steps of 0.5%. The R2 values obtained did not find statistically significant differences from 0.5% to 10%, while in higher mutation values, the R2 decreased. Therefore, results with 10% probability mutation rates are presented. The crossover methodology employed is known as single point crossover, in which both parental chromosomes are split in only one point randomly selected. Each generation of the genetic algorithm population is formed by 1000 individuals; this means that there are 1000 different variables subsets. The results shown were obtained after 100 iterations, which means that 100,000 variables subsets were examined. This is a small number if compared with the more than 5.7 × 10¹⁷ possible variables subsets that can be obtained for a problem like this with 59 independent variables. Finally, it can also be highlighted that the performance of the algorithm would be improved if those workers whose leave durations are over certain threshold value (i.e., 10 or 100 days) were considered as outliers and removed. The flowchart for the proposed algorithm is shown in Figure 2.

3. Results

The average value of the R2 for the 1000 models trained for the variables that were finally selected in each case was 74.26%. The RMSE average value was 27.51. The average difference in days in absolute value of forecasted and real number of days off was 10.22. If workers are divided in those with leaves of 10 or less days, 85% of the total, and those with leaves of more than 10 days, the RMSE values obtained are quite different. In the case of those with leaves of 10 or less days, the RMSE value was of 5.56 and 71.49 for those with leaves of more than 10 days. In the case of average difference in days in absolute value of forecasted and real number of days off, it was 4.28 for those with leaves of 10 or less days and 48.81 for those whose leaves are over 10 days. It means that prediction for those leaves of 10 or less days are much more accurate. Figure 3 shows the histogram of the number of leave days for all the workers. It can be observed that most of the leaves are of 10 or less days. The results described in this paragraph are in line with what is said in Section 2.3 about how an outlier’s removal would improve the algorithm performance.
In order to assess the performance of the proposed algorithm, it was compared with two benchmark methodologies: linear regression [28] and support vector machines for regression [29]. In both algorithms, 1000 models with different training and validation datasets were tested. For the linear regression, the average R2 value was of 26.72% with an RMSE of 74.21, while in the case of support vector machine for regression the average R2 value was of 67.32% with a RMSE of 29.01. Table 4 shows a comparison of the performance of the proposed algorithm with the two benchmark methodologies referred before, linear regression and support vector machines.
Figure 4 shows the results of one of the models created with these variables. In such a model, the forecasted and real number of days off for all the workers randomly included in the validation dataset can be observed. The values in the horizontal axis are the workers’ identificators. Please note that the largest differences of forecasted and real values can be found for workers with numbers from 81 to 83 that would be considered as spurious. In this case, the difference in days of forecasted and real number of days off was on average −4.255, with a median of 2.53 and a standard deviation of 27.34. In absolute values, the mean was 10.642 days. As after 100 iterations all the models give similar results in terms of R2, Table 5 shows the list of variables selected by this model as the most relevant when predicting absenteeism among workers in the energy sector, using the three importance criteria (nsubsets, gcv and rss) referred to in Section 2.2.

4. Discussion

The results obtained show that it is possible to make use of machine-learning methodologies such as MARS and GA in order to predict the number of days of health-related leave taken by workers in the energy sector, taking into account a certain number of variables linked to personal and work-related factors for each individual. The results obtained are not surprising, as GA and MARS have proven to be valid in similar scenarios [23] and in other problems linked to the energy field [30,31]. The worst forecasts were obtained for the longest leaves, as they were few and present a behavior outside the normal range. In future research, the MARS model could be substituted by other regression models such as neural networks or support vector machines for regression, and even by replacing GA with other evolutive methods like particle swarm optimization or differential evolution.
As other studies have shown [13,32], there are several factors that have an influence on absenteeism in the workplace. It should be pointed out that, in this case study, sick leave due to common illness and sick leave due to occupational illness or occupational accidents were not analyzed separately. This is the reason behind the multiple kinds of factors that become part of the model, and implies that some difficulties may appear during the discussion of the results [33]; in any case, it is necessary to consider both, in order to understand the causes behind absenteeism.
The model was built with twenty items that can be classified into four categories:
  • Ergonomics;
  • Psychosocial factors;
  • Working conditions;
  • Personal data and physiological characteristics.
It must be pointed out that several of these items could belong to different categories simultaneously. Therefore, they are included in those ones that better explain their impact as a cause of absenteeism. Moreover, there are many interrelated circumstances between each category, to the extent that it is difficult to find studies that only deal with one of them. In fact, there are several research studies that cover issues in relation to ergonomics while speaking about working conditions, workers’ personal characteristics and organizational contexts at the same time [32].
In absolute terms, working conditions have the greatest impact on sick leave among workers, since nine out of twenty items of the model developed fall into this category. However, as mentioned before, several of these items also affect other categories, such as ergonomics and psychosocial factors.
A discussion on the relationship between absenteeism and the items in each category is presented next.

4.1. Ergonomics

There are five items in the model that show the impact of ergonomics on sick leave among workers. This is in consonance with other researchers’ conclusions [33,34,35,36] that maintain that poor ergonomics in the workplace and prevalence of musculoskeletal disorders (MSD) are linked and could therefore mean an increase in sick leave. These five items are as follows:
  • Doing short repetitive tasks of less than 1 min.
  • Doing monotonous tasks.
  • Doing short repetitive tasks of less than 10 min.
  • Suffering tiring or painful positions.
  • Remaining seated for a long time.
It is remarkable that the model seems to suggest a contradictory idea in relation to repetitive tasking, in that it considers that short repetitive tasks of less than ten minutes have a negative impact on sick leave among workers, whereas short repetitive tasks of less than one minute can reduce absenteeism. Concerning ergonomics, the shorter the task, the more damaging it could be, so at first glance, this would seem to be an error.
On the other hand, there could be several explanations for this curious result. For instance, it is difficult to find a job that requires doing the same repetitive tasks lasting less than one minute for the entire working day. However, it is more feasible to find jobs that include the same repetitive task lasting less than ten minutes for the entire working day. Thus, multitasking would preferably be linked to the first of these cases, and multitasking is a valued characteristic of good ergonomics. This would be a proper explanation for the behavior of these items in the model. In any case, this sets a starting point for future research.
Other items that are included in the model and classified into the ergonomics category, such as monotonous tasks, painful positions and sitting, are ergonomic factors traditionally considered during risks assessments due to their negative impact on MSD prevalence. As a first conclusion, the model has proven that the beliefs as to how ergonomic investments have a positive impact on MSD prevalence and occupational absenteeism are a step in the right direction. This study therefore supports other researchers’ conclusions that are applicable to industrial environments [37] and to the energy sector in particular [38].

4.2. Psychosocial Factors

Only one item falls into this category: that of being in situations that are emotionally disturbing. However, there are several studies that point out that psychosocially demanding working environments have a deeply negative impact on absenteeism [39,40]. Nevertheless, it should be noted that this does not mean that psychosocial factors are less relevant than others. In fact, there is a close interrelation between them and the rest. For instance, as other studies have shown [41], ergonomic interventions could be counterproductive, unless they attend to psychosocial factors.

4.3. Working Conditions

Working conditions is the category that includes the largest number of items from the model. However, as previously stated, that does not necessarily mean it is the category with the strongest influence on absenteeism. The nine items from the model classified in this category are as follows:
  • Being satisfied with working conditions;
  • Income;
  • Restructuring or reorganization at the workplace;
  • Working environment: smoke, fumes, powder and dust;
  • Another paid job;
  • Work affects health;
  • Noise;
  • Work hours/week;
  • Working environment: low temperatures.
First of all, it must be said that “being satisfied with working conditions” could be included in the category of psychosocial factors; after all, this item depends both on how working conditions are designed and how workers perceive them. In any case, this aspect has already been discussed in the previous section. In fact, the item included on working conditions highlights the interaction between categories and the importance of psychosocial factors on the control of absenteeism.
Working conditions cover a great spectrum of factors that can become causes of occupational absenteeism. Indeed, workers’ general health status, MSD prevalence and other diseases are closely related to the working environment. Therefore, in terms of the energy sector in particular, each company has to understand and act on several working conditions, to develop health management, as other works have already shown [42].
A conclusion that can be obtained by analyzing the factors that appear in this category is, as has been the case with others, the existence of a link with the category concerning personal conditions. For example, it has been proven that a low income of the worker increases the probability of his/her taking sick leave. One wonders if, in fact, this circumstance reveals the effects of socioeconomic status on occupational absenteeism [43].
Other working condition factors included in the model show the effects of workplace environment on sick leave: noise, air pollution, extreme temperatures, etc. This was to be expected, because it points in the direction of occupational diseases, in line with several previous studies [44,45].
The only remarkable item that could be seen as a contradiction is that workers with more than one job seem to be less vulnerable to sick leave. Several explanations can be suggested. For instance, having more than one job could be linked with multitasking and, therefore, lower prevalence of MSD. Another possible reason could be that this kind of worker is more likely to belong to a precarious social stratum where health damages are sometimes underreported. In any case, this could be the subject of a future line of research.

4.4. Personal Data and Physiological Characteristics

There are five possible causes of absenteeism included in this category:
  • Having headaches and eyestrain;
  • Outside work: receiving training or education;
  • General health status;
  • Suffering a long-lasting illness;
  • Age.
This category joins together several factors related to lifestyle that are too difficult to identify and analyze properly, especially when the studied variable includes both common and occupational diseases as a cause of absenteeism. In fact, there are many studies that deal with this subject without achieving unanimity [46,47,48].
It seems to be expected that general health status [49] and, as a result, other factors that can alter it, like age, must affect the prevalence of several illnesses that end up causing sick leave. There are other studies that go further and that try to analyze gender differences in this matter [14]. In this category, however, everything is vaguely interrelated, so there are many questions to answer in future research.
Apart from the item that refers to activities outside work, every factor included in this category is a cause or an effect of the workers’ general health status. This appraisal has many implications that must be kept in mind when planning any move designed to reduce absenteeism among a company’s workforce.

5. Conclusions

It is possible to make use of machine-learning methodologies, such as MARS and GA, in order to create models able to predict the number of days of health-related leave among workers in the energy sector. Absenteeism can be monitored and predicted by using a model that employs several items included in the following categories:
  • Ergonomics;
  • Psychosocial factors;
  • Working conditions;
  • Personal data and physiological characteristics.
These categories are all interrelated, and it is difficult to establish boundaries between them, but as a positive consequence of this, acting on one of them to reduce absenteeism in a company could have a great impact on the others.
Any management program has to act on factors that affect the employees’ general health status, process design, workplace environment, ergonomics and psychosocial working context, among others, if it is going to be successful. This has an extensive field of application in the energy sector, where most of the activities are undertaken in an industrialized context.

Author Contributions

Conceptualization, F.S.L.; formal analysis, F.S.L.; investigation, A.G.F., N.M.B.S. and A.S.S.; methodology, F.S.L. and A.S.S.; project administration, A.S.S.; resources, A.G.F.; validation, G.F.V.; writing—original draft, A.G.F. and N.M.B.S.; writing—review and editing, G.F.V. and A.S.S. All authors have read and agree to the published version of the manuscript.

Funding

This research received no external funding.

Acknowledgments

The authors wish to acknowledge the European Foundation for the Improvement of Living and Working Conditions (Eurofound), as well as the UK Data Service, for providing us with the results of the database used in this work.

Conflicts of Interest

The authors declare no conflict of interest.

References

  1. Social Protection Statistics—Sickness and Health Care Benefits. Available online: https://ec.europa.eu/eurostat/statistics-explained/index.php?title=Social_protection_statistics_-_sickness_and_health_care_benefits#Relative_importance_of_expenditure_on_sickness_and_healthcare_benefits (accessed on 3 January 2020).
  2. European Comission. Sick Pay and Sickness Benefit Scheme in the European Union. Background Report for the Social Protection Committee’s. In-Depth Review on Sickness Benefits. Available online: https://ec.europa.eu/social/BlobServlet?docId=16969&langId=en (accessed on 3 January 2020).
  3. Oenning, N.; Carvalho, F.M.; Lima, V.M.C. Risk factors for absenteeism due to sick leave in the petroleum industry. Rev. Saúde Pública 2014, 48, 103–112. [Google Scholar] [CrossRef] [PubMed] [Green Version]
  4. Mitchell, R.; Williamson, A.M. Evaluation of an 8 hour versus a 12 hour shift roster on employees at a power station. Appl. Ergon. 2000, 31, 83–93. [Google Scholar] [CrossRef]
  5. Takahashi, M.; Tanigawa, T.; Tachibana, N.; Mutou, K.; Kage, Y.; Smith, L.; Iso, H. Modifying effects of perceived adaptation to shift work on health, wellbeing, and alertness on the job among nuclear power plant operators. Ind. Health 2005, 43, 171–178. [Google Scholar] [CrossRef] [PubMed] [Green Version]
  6. Murtezani, A.; Hundozi, H.; Orovcanec, N.; Berisha, M.; Meka, V. Low back pain predict sickness absence among power plant workers. Indian J. Occup. Environ. Med. 2010, 14, 49–53. [Google Scholar] [CrossRef]
  7. Hole, J.; Pande, M. Worker productivity, occupational health, safety and environmental issues in thermal power plant. In Proceedings of the 2009 IEEE International Conference on Industrial Engineering and Engineering Management, Hong Kong, China, 8–11 December 2009; Volume 8, pp. 1082–1086. [Google Scholar] [CrossRef]
  8. Sánchez, A.S.; Fernández, P.R.; Lasheras, F.S.; Juez, F.D.C.; Nieto, P.G. Prediction of work-related accidents according to working conditions using support vector machines. Appl. Math. Comput. 2011, 218, 3539–3552. [Google Scholar] [CrossRef]
  9. Krzemień, A. Dynamic fire risk prevention strategy in underground coal gasification processes by means of artificial neural networks. Arch. Min. Sci. 2019, 64, 3–19. [Google Scholar] [CrossRef]
  10. Krzemień, A. Fire risk prevention in underground coal gasification (UCG) within active mines: Temperature forecast by means of MARS models. Energy 2019, 170, 777–790. [Google Scholar] [CrossRef]
  11. Asensio-Cuesta, S.; Diego-Mas, J.A.; Alcaide-Marzal, J. Applying generalised feedforward neural networks to classifying industrial jobs in terms of risk of low back disorders. Int. J. Ind. Ergon. 2010, 40, 629–635. [Google Scholar] [CrossRef]
  12. Sánchez, A.S.; Iglesias-Rodríguez, F.; Fernández, P.R.; Juez, F.D.C. Applying the K-nearest neighbor technique to the classification of workers according to their risk of suffering musculoskeletal disorders. Int. J. Ind. Ergon. 2016, 52, 92–99. [Google Scholar] [CrossRef]
  13. Serrano, N.M.B.; Nieto, P.J.G.; Sánchez, A.S.; Lasheras, F.S.; Fernández, P.R. A Hybrid Algorithm for the Assessment of the Influence of Risk Factors in the Development of Upper Limb Musculoskeletal Disorders. In Lecture Notes in Computer Science; Springer Science and Business Media LLC: Philadelphia, PA, USA, 2018; pp. 634–646. [Google Scholar]
  14. Serrano, N.B.; Sánchez, A.S.; Lasheras, F.S.; Iglesias-Rodríguez, F.; Valverde, G.F. Identification of gender differences in the factors influencing shoulders, neck and upper limb MSD by means of multivariate adaptive regression splines (MARS). Appl. Ergon. 2019, 82, 102981. [Google Scholar] [CrossRef]
  15. Ríos, E.M.A.; Sáchez-Lasheras, F.; Sánchez, A.S.; Iglesias-Rodríguez, F.J.; Crespo, M.D.M.S. Prediction of Computer Vision Syndrome in Health Personnel by Means of Genetic Algorithms and Binary Regression Trees. Sensors 2019, 19, 2800. [Google Scholar] [CrossRef] [Green Version]
  16. Ríos, E.M.A.; Sánchez, A.S.; Sáchez-Lasheras, F.; Crespo, M.D.M.S. Genetic algorithm based on support vector machines for computer vision syndrome classification in health personnel. Neural Comput. Appl. 2018, 32, 1239–1248. [Google Scholar] [CrossRef]
  17. Eurofound (European Foundation for the Improvement of Living and Working Conditions). European Working Conditions Survey Integrated Data File, 1991–2015 [Data Collection], 7th ed.; UK Data Service: Colchester, UK, 2018. [Google Scholar]
  18. UKDS (UK Data Service) Website. Available online: https://www.ukdataservice.ac.uk/ (accessed on 30 March 2020).
  19. Eurofound. Sixth European Working Conditions Survey—Overview Report; Publications Office of the European Union: Luxembourg, 2016. [Google Scholar]
  20. Eurofound Website. EWCS 2015—Source Questionnaire. Available online: https://www.eurofound.europa.eu/sites/default/files/page/field_ef_documents/6th_ewcs_2015_final_source_master_questionnaire.pdf (accessed on 24 April 2020).
  21. Afifi, A.; Clark, V.; May, S. Computer-Aided Multivariate Analysis; Chapman & Hall/CRC: Boca Raton, FL, USA, 2004. [Google Scholar]
  22. Bhattacharyya, H.T.; Kleinbaum, D.G.; Kupper, L.L. Applied Regression Analysis and Other Multivariable Methods. J. Am. Stat. Assoc. 1979, 74, 732. [Google Scholar] [CrossRef]
  23. Ordóñez, C.; Sáchez-Lasheras, F.; Roca-Pardiñas, J.; Juez, F.J.D.C. A hybrid ARIMA–SVM model for the study of the remaining useful life of aircraft engines. J. Comput. Appl. Math. 2019, 346, 184–191. [Google Scholar] [CrossRef]
  24. Juez, F.J.D.C.; Sáchez-Lasheras, F.; Roqueni, N.; Osborn, J. An ANN-Based Smart Tomographic Reconstructor in a Dynamic Environment. Sensors 2012, 12, 8895–8911. [Google Scholar] [CrossRef] [PubMed]
  25. Holland, J.H. Adaptation in Natural and Artificial Systems; MIT Press – Journals: Cambridge, MA, USA, 1992. [Google Scholar]
  26. Nieto, P.G.; Lasheras, F.S.; Juez, F.D.C.; Alonso-Fernández, J.R. Study of cyanotoxins presence from experimental cyanobacteria concentrations using a new data mining methodology based on multivariate adaptive regression splines in Trasona reservoir (Northern Spain). J. Hazard. Mater. 2011, 195, 414–421. [Google Scholar] [CrossRef]
  27. De Andrés, J.; Sánchez-Lasheras, F.; Lorca, P.; De Cos Juez, F.J. A hybrid device of Self Organizing Maps (SOM) and Multivariate Adaptive Regression Splines (MARS) for the forecasting of firms’ bankruptcy. Account. Manag. Inf. Syst. Contab. Inform. Gestiune 2011, 10, 351–374. [Google Scholar]
  28. Alonso-Fernández, J.R.; Muñiz, C.D.; Nieto, P.G.; Juez, F.D.C.; Lasheras, F.S.; Roqueni, N. Forecasting the cyanotoxins presence in fresh waters: A new model based on genetic algorithms combined with the MARS technique. Ecol. Eng. 2013, 53, 68–78. [Google Scholar] [CrossRef]
  29. Sprent, P.; Draper, N.R.; Smith, H. Applied Regression Analysis. Biomaterials 1981, 37, 863. [Google Scholar] [CrossRef]
  30. Jakus, D.; Čađenović, R.; Vasilj, J.; Sarajčev, P. Optimal Reconfiguration of Distribution Networks Using Hybrid Heuristic-Genetic Algorithm. Energies 2020, 13, 1544. [Google Scholar] [CrossRef] [Green Version]
  31. Krzywanski, J. A General Approach in Optimization of Heat Exchangers by Bio-Inspired Artificial Intelligence Methods. Energies 2019, 12, 4441. [Google Scholar] [CrossRef] [Green Version]
  32. Hallman, D.M.; Holtermann, A.; Björklund, M.; Gupta, N.; Rasmussen, C.D.N. Sick leave due to musculoskeletal pain: Determinants of distinct trajectories over 1 year. Int. Arch. Occup. Environ. Health 2019, 92, 1099–1108. [Google Scholar] [CrossRef] [PubMed] [Green Version]
  33. Benavides, F.G.; Benach, J.; Moncada, S.; Vahtera, J.; Kivimaki, M. Working conditions and sickness absence: A complex relation. J. Epidemiol. Community Health 2001, 55, 368. [Google Scholar] [CrossRef] [PubMed] [Green Version]
  34. Hellig, T.; Rick, V.; Stranzenbach, R.; Przybysz, P.; Mertens, A.; Brandl, C. Investigation of the Effectiveness of European Assembly Worksheet in Assessing Organizational Measures for MSD Risk Assessment. In Advances in Intelligent Systems and Computing; Springer Science and Business Media LLC: Philadelphia, PA, USA, 2017; Volume 602, pp. 229–235. [Google Scholar]
  35. Motamedzade, M.; Faghih, M.A.; Golmohammadi, R.; Faradmal, J.; Mohammadi, H. Effects of Physical and Personal Risk Factors on Sick Leave Due to Musculoskeletal Disorders. Int. J. Occup. Saf. Ergon. 2013, 19, 513–521. [Google Scholar] [CrossRef] [PubMed] [Green Version]
  36. Kemmlert, K. Economic impact of ergonomic intervention—Four case studies. J. Occup. Rehab. 1996, 6, 17–32. [Google Scholar] [CrossRef]
  37. Parenmark, G.; Malmkvist, A.-K.; Örtengren, R. Ergonomic moves in an engineering industry: Effects on sick leave frequency, labor turnover and productivity. Int. J. Ind. Ergon. 1993, 11, 291–300. [Google Scholar] [CrossRef]
  38. Farhadi, R.; Omidi, L.; Balabandi, S.; Barzegar, S.; Abbasi, A.L.; Poornajaf, A.H.; Karchani, M. Investigation of musculoskeletal disorders and its relevant factors using quick exposure check (QEC) method among Seymareh hydropower plant workers. J. Res. Health 2014, 4, 715–720. [Google Scholar]
  39. Mohanty, P.; Mohanty, S. Impact of Workplace Bullying on Performance, Psychological Distress and Absenteeism: An Original Review of Healthcare Sector. J. Econ. Perspect. 2017, 11, 1277–1286. [Google Scholar]
  40. Petrén, V.; Petzäll, K.; Preber, H.; Bergstrom, J. The relationship between working conditions and sick leave in Swedish dental hygienists. Int. J. Dent. Hyg. 2007, 5, 27–35. [Google Scholar] [CrossRef]
  41. Christmansson, M.; Fridén, J.; Sollerman, C. Task design, psycho-social work climate and upper extremity pain disorders—Effects of an organisational redesign on manual repetitive assembly jobs. Appl. Ergon. 1999, 30, 463–472. [Google Scholar] [CrossRef]
  42. Lee, L.-K.; Yang, S.-M.; Park, J.; Kim, J. The Effort of Health Management for Workers in Y Combined Cycle Power Plant in Korea. Toxicol. Environ. Health Sci. 2018, 10, 42–48. [Google Scholar] [CrossRef]
  43. Piha, K.; Laaksonen, M.; Martikainen, P.; Rahkonen, O.; Lahelma, E. Interrelationships between education, occupational class, income and sickness absence. Eur. J. Public Health 2009, 20, 276–280. [Google Scholar] [CrossRef] [PubMed] [Green Version]
  44. Hansen, A.C.; Selte, H.K. Air Pollution and Sick-leaves. Environ. Resour. Econ. 2000, 16, 31–50. [Google Scholar] [CrossRef]
  45. Lee, J.; Lee, W.; Choi, W.-J.; Kang, S.-K.; Ham, S. Association between Exposure to Extreme Temperature and Injury at the Workplace. Int. J. Environ. Res. Public Health 2019, 16, 4955. [Google Scholar] [CrossRef] [Green Version]
  46. Huijs, J.J.J.M.; Koppes, L.L.J.; Taris, T.W.; Blonk, R.W.B. Differences in Predictors of Return to Work Among Long-Term Sick-Listed Employees with Different Self-Reported Reasons for Sick Leave. J. Occup. Rehab. 2012, 22, 301–311. [Google Scholar] [CrossRef]
  47. Eriksen, W.; Bruusgaard, D. Physical Leisure-Time Activities and Long-Term Sick Leave: A 15-Month Prospective Study of Nurses Aides. J. Occup. Environ. Med. 2002, 44, 530–538. [Google Scholar] [CrossRef]
  48. Hildebrandt, V.H.; Bongers, P.M.; Dul, J.; Van Dijk, F.J.H.; Kemper, H.C.G. The relationship between leisure time, physical activities and musculoskeletal symptoms and disability in worker populations. Int. Arch. Occup. Environ. Health 2000, 73, 507–518. [Google Scholar] [CrossRef]
  49. Montano, D. A psychosocial theory of sick leave put to the test in the European Working Conditions Survey 2010–2015. Int. Arch. Occup. Environ. Health 2019, 93, 229–242. [Google Scholar] [CrossRef]
Figure 1. Age distribution of the workers.
Energies 13 02475 g001
Figure 2. Flowchart of the proposed algorithm.
Energies 13 02475 g002
Figure 3. Histogram of the number of leave days of all those individuals that took part in the present research.
Energies 13 02475 g003
Figure 4. Results of one of the models created: forecasted and real number of days off for all the workers randomly included in the validation dataset.
Energies 13 02475 g004
Table 1. Distribution of the sample of workers by country.
CountryNumber of Workers%
Norway358.3%
Albania266.2%
Slovenia256.0%
Serbia256.0%
Spain225.2%
Belgium184.3%
United Kingdom174.0%
Croatia174.0%
Montenegro174.0%
Czech Republic153.6%
Poland143.3%
Bulgaria133.1%
Germany133.1%
France122.9%
Romania122.9%
Denmark112.6%
Lithuania112.6%
Austria112.6%
Estonia102.4%
Other countries *7618.1%
Total420
* Other countries: FYROM, Luxembourg, Slovakia, Hungary, Netherlands, Sweden, Switzerland, Greece, Turkey, Italy, Finland, Cyprus, Portugal, Malta.
Table 2. Distribution of the sample of workers according to the level of studies (ISCED).
Level of Studies (ISCED)Number of Workers%
Early childhood education10.2%
Primary education10.2%
Lower secondary education399.3%
Upper secondary education18544.0%
Post-secondary non-tertiary education235.5%
Short-cycle tertiary education5412.9%
Bachelor or equivalent5212.4%
Master or equivalent6315.0%
Doctorate or equivalent20.5%
Total420
Table 3. Distribution of the sample of workers according to their household’s total monthly income.
Is Your Household Able to Make Ends Meet?Number of Workers%
Very easily5513.1%
Easily10124.0%
Fairly easily12128.8%
With some difficulty10424.8%
With difficulty307.1%
With great difficulty92.1%
Total420
Table 4. Comparison of the performance of the proposed algorithm with two benchmark methodologies, linear regression (LR) and support vector machines (SVM).
Performance MetricProposed AlgorithmLRSVM
R274.26%26.72%67.32%
RMSE
all27.5174.2129.01
10 or less leave days5.5672.9213.91
more than 10 leave days71.4974.4768.75
Average absolute difference of days
all10.2249.6017.26
10 or less leave days4.2847.6210.06
more than 10 leave days48.8161.5160.42
Table 5. A list of variables selected by the model as the most relevant to predict absenteeism among workers in the energy sector.
VariableNsubsets 1gcv 2rss 3Description
y15_Q48a30100100Short repetitive tasks of less than 1 min
y15_Q8830100100Satisfied with working conditions
y15_Q10030100100Income
y15_Q202990.391.0Restructuring or reorganization at the workplace
y15_Q53d2990.391.0Monotonous tasks
y15_Q78f2990.391.0Headaches, eyestrain
y15_Q95f2781.782.5Outside work: taking a training or education
y15_Q752462.665.2General health status
y15_Q48b1945.649.4Short repetitive tasks of less than 10 min
y15_Q30a1841.746.0Tiring or painful positions
y15_Q30h1738.543.2Being in situations that are emotionally disturbing
y15_Q761738.543.2Long-lasting illness
y15_Q29e1534.839.3Smoke, fumes, powder, dust
y15_Q30d1430.936.2Sitting
y15_Q27_lt1327.933.6Other paid job
y15_Q741224.831.0Work affects health
y15_Q29b915.923.9Noise
y15_Q24813.922.0Work hours/week
y15_Q29d513.418.2Low temperatures
y15_Q2b411.215.9Age
1 nsubsets: number of model subsets that make use of the variable (see Section 2.2). 2 gcv: generalized cross-validation of the variables (see Section 2.2). 3 rss: residual sum of squares (see Section 2.2).

