Article

Energy Effects of Retrofitting the Educational Facilities Located in South-Eastern Poland

1
Faculty of Civil Engineering and Architecture, Lublin University of Technology, 40 Nadbystrzycka Str., 20-618 Lublin, Poland
2
Faculty of Environmental Engineering, Lublin University of Technology, 40B Nadbystrzycka Str., 20-618 Lublin, Poland
3
Faculty of Civil Engineering, Czech Technical University in Prague, Thákurova 7, 166 29 Praha 6, Czech Republic
*
Author to whom correspondence should be addressed.
Energies 2020, 13(10), 2449; https://doi.org/10.3390/en13102449
Submission received: 7 April 2020 / Revised: 4 May 2020 / Accepted: 9 May 2020 / Published: 13 May 2020
(This article belongs to the Special Issue Building Energy Audits-Diagnosis and Retrofitting)

Abstract

:
One way to decrease the greenhouse gas emissions in the building sector is to improve the building energy performance, which can be mainly achieved by the reduction of energy consumption. In the case of the existing objects, this goal could be achieved by the thermo-modernization of the building partitions and equipment. This article concerns the issue of heat consumption for heating purposes after a comprehensive retrofitting of nine educational buildings (two kindergartens and seven schools) located in south-eastern Poland where both the total efficiency of the heating installation and the thermal insulation of building partitions were improved. The evaluation of the real energy effects was made on the basis of the measurements performed over the 8 year period of operation for each building. The obtained values were compared with the boundary values of the factors that were in force in Poland during the period when all of the buildings were retrofitted. Additionally, they were compared with the results of theoretical calculations included in the energy audits of the example of three objects and an attempt to describe the reasons for the discrepancies was made. All obtained results were discussed with the available literature sources and summarized with the suitable conclusions.

1. Introduction

The treaty on climate change from the conference in Kyoto, which was held in 1997, was ratified by 141 countries and entered into force on February 16, 2005. The countries that ratified it, including Poland, were obliged to reduce their own greenhouse gas emissions, and thus to achieve the overarching goal of environmental protection. This goal can be achieved, among others, by reducing the energy consumption in the building sector, which is one of the most energy-consuming branches of the economy [1,2,3,4]. Therefore, energy savings have been sought in this area for a long time, setting increasingly high requirements in terms of the thermal insulation of building partitions and energy efficiency for modernized and newly constructed buildings as well as the technical systems that constitute their equipment [5,6]. The activities to reduce the energy consumption in buildings have been conducted for over 20 years in Poland, and even longer in some other European countries (Germany, Denmark) which have particularly intensified after the introduction of the European Parliament Directive [7]. In the case of the existing buildings, the reduction of energy consumption is achieved through their comprehensive retrofitting, which gives better results than individual improvements [8,9,10]. In order to achieve the intended goal, work usually begins with the legislative process and implementation of national legal acts in the form of directives, laws and regulations [7,11]. In Poland, one of the first acts that contributed to the promotion of the activities leading to a reduction of heat consumption in the existing buildings was the Act on supporting thermo-modernization projects of 1998 and its executive regulations of 1999 regarding the principles of preparing an energy audit and its verification [12,13]. For the first time, the procedures were formalized to obtain financial support from the state budget for comprehensive thermal modernization of buildings, which resulted in the dynamic development of deep thermal modernization of primarily residential and public buildings [14,15]. Additional financial support for the measures to reduce the energy consumption in the existing buildings was received by Poland after joining the European Union, which resulted in the launch of many thermo-modernization investments, especially in the buildings belonging to the local government units.
In the abovementioned Act [12], limiting the issue to the building and its equipment with technical systems, a thermo-modernization project is defined as an improvement or a set of improvements based on the technical activities as a result of which the energy demand of a building for heating and ventilation as well as hot water preparation is reduced. The most common technical actions taken in buildings concern two areas; the first one is related to the parameters of the building balance shield, i.e., the improvement of thermal insulation of opaque building partitions (most often external walls, roofs, flat roofs, internal partitions between heated and unheated spaces), replacement of windows and doors with tighter ones, characterized by much lower heat transfer coefficient values [16,17,18,19,20]. The second one, covers the improvement of the overall efficiency of the building heating system and the system used to prepare hot water in the building [21,22,23,24]. The modernization activities are carried out to improve the technical systems, but often, especially in the buildings where the technical systems are characterized by a significant degree of exploitation and wear, new heating and hot water preparation systems are implemented. Then, the devices using renewable energy sources are often employed. A necessary condition for a properly conducted retrofitting is to adapt the heating system to technical requirements in such a way that the system automatically adapts to the energy demand of a building, depending on the changing parameters of the external and internal environment in the building.
Due to the fact that the financial support for thermo-modernization investments most often comes from the national or EU funds, it is necessary to properly prepare the investment process. One of the elements of this preparation is the performance of an energy audit, which aims to comprehensively analyze the condition of the existing building and determine the optimal, in terms of scope and costs, technical measures to reduce the energy demand of a building and improve the energy efficiency. An audit is often referred to as a technical and economic analysis of a building thermo-modernization; it is a common study required when conducting this type of investment [15,25,26]. This study, among other things, aims to provide the forecast of energy savings resulting from the thermo-modernization measures assuming standard boundary conditions for the indoor and outdoor environment of the building. The energy saving level calculated in the audit is the forecasted or expected effect of measures to improve the energy efficiency. The requirements in terms of heat transfer coefficients of building partitions, as well as the efficiency of technical systems set for buildings after retrofitting are usually the same as for the newly constructed buildings. Retrofitting contributes to achieving measurable energy effects, and thus economic and ecological benefits, as well as improves the thermal comfort in the heated rooms. Often, barriers and restrictions of a legal, technical or financial nature arise when planning a deep thermo-modernization. The assessment of the thermo-modernization energy effects can be made by comparing the measured energy consumption before and after the investment is carried out over a period of several years or heating seasons, taking into account at least the variability of the external environment conditions. For this purpose, it is reasonable to calculate the unit indicators related to 1 m2 of the heated building surface. The indicators can also be used to compare and evaluate buildings in terms of the energy quality. A comparative analysis of the level of annual energy consumption in individual years and buildings are the key issues related to the monitoring and rational energy management in the building.
The aim of the research presented in this work was to determine the actual energy effects obtained as a result of comprehensive thermo-modernization in educational buildings. The energy saving levels obtained from the measurements under operating conditions were compared with the predicted results of the theoretical calculations contained in audits available for some of the considered buildings. The analysis was based on measuring the data from long-term exploitation of the buildings before and after retrofitting. Additionally, in three cases theoretical investigation was conducted based on the Polish regulations [26].

2. Materials and Methods

In this work, the subject of analyses involves only the thermal needs of the buildings related solely to heating. All considered energy factors in the presented investigation refer to a year, that is why the annual heat consumption was measured for each building. Using these data, the decrease in heat consumption for heating due to comprehensive retrofitting was calculated, real factors of annual final and non-renewable primary energy consumption were determined, and then they were compared with the values included in the national technical and construction regulations required during the thermo-modernization investment period. At that time, the limit values in these provisions were determined as a function of the building shape factor [27].
The analysis is a case study of 9 educational buildings (hereinafter referred to as SUCs–“system use cases”): two pre-school buildings serving as kindergartens (SUC1 and SUC2) and seven primary school buildings (SUC3–SUC9). The number of students in the examined objects was relatively constant within the considered period of time. In the case of three buildings, the results of energy audits carried out before proceeding with the thermo-modernization investment were available. All buildings are located in a large city of eastern Poland and are supplied with heat from the same provider. None of the objects are equipped with a cooling system. Five buildings are supplied with the heat from a centralized heating system covering the thermal needs for heating and hot water preparation, also four from a centralized system, but only covering the needs for heating purposes (see the Table 1). The heat source for the distribution system is a municipal combined heat and power (CHP) plant operating in a cogeneration system (electricity and heat, coal and gas combustion). For each building, the value of the shape factor was determined, the heated usable area was given, and the year in which the thermo-modernization was carried out was determined. The analysis used the results of annual measurements of heat consumption from an eight-year period, several years before and several years after retrofitting. The measured values were corrected with a factor taking into account the variability of the number of degree-days, which is characteristic for a given year in relation to the number of degree-days specified under standard conditions for a given location using a correction coefficient φ calculated according to the following Formulas (4) and (5). The measurements from heat meters and data for determining the correction factor were obtained from the heat supplier, who manages the centralized heat distribution system in the city and supplies heat to the considered buildings.
In the case of the buildings that drew heat from the heating network, also to cover the needs related to hot water preparation, the heat consumption measurements obtained from the supplier were available in the summer months, in which the heat consumption for heating purposes was zero. In the considered location, deep water was used and seasonal water temperature fluctuations could be neglected, which allowed estimating the annual heat consumption for hot water preparation and to extract the heat consumption for heating purposes according to Formulas (1)–(3).
In all buildings, the retrofitting projects included: insulation of external walls (Uwall), roofs (Uroof) or flat roofs (Uflat roof), replacement of windows (Uwindow) and external doors (Udoor), modernization or replacement of central heating installations. The calculated heat transfer coefficients of building partitions after insulation are presented in the Table 1. The assumed values of the average efficiencies of the building heating systems were the following: efficiency of heat generation ηH,g = 1.0 (heat source behind the balance cover of the building), efficiency of heat transfer within the balance cover ηH,d = 0.95, efficiency of heat accumulation ηH,s = 1.0 (systems without heat accumulators), efficiency of heat adjustment and utilization ηH,e = 0.90. These values are assumed as constant coefficients depending on the type and technical condition of the installations, according to the Polish regulations [28]. The data are the same for all buildings due to the identical range of heating system modernization.
Additionally, the authors of the investigation had received the information from the object managers and directors that before retrofitting the buildings were unheated and after retrofitting the parameters of thermal comfort were respected in all institutions.
All buildings were monitored for heat consumption for the period of 8 years (since 2003 until 2010). During this period, thermo-modernization was conducted, which significantly influenced the heat-meter readouts. The years of thermo-modernization are presented in the Table 1 together with other basic technical data of the buildings.
In order to determine the energy effects due to thermo-modernization of buildings, the following algorithm was used (also presented as a block diagram in Figure 1):
  • Collecting the data from the measurements of legalized heat meters under real conditions for eight years (several years before and several after retrofitting).
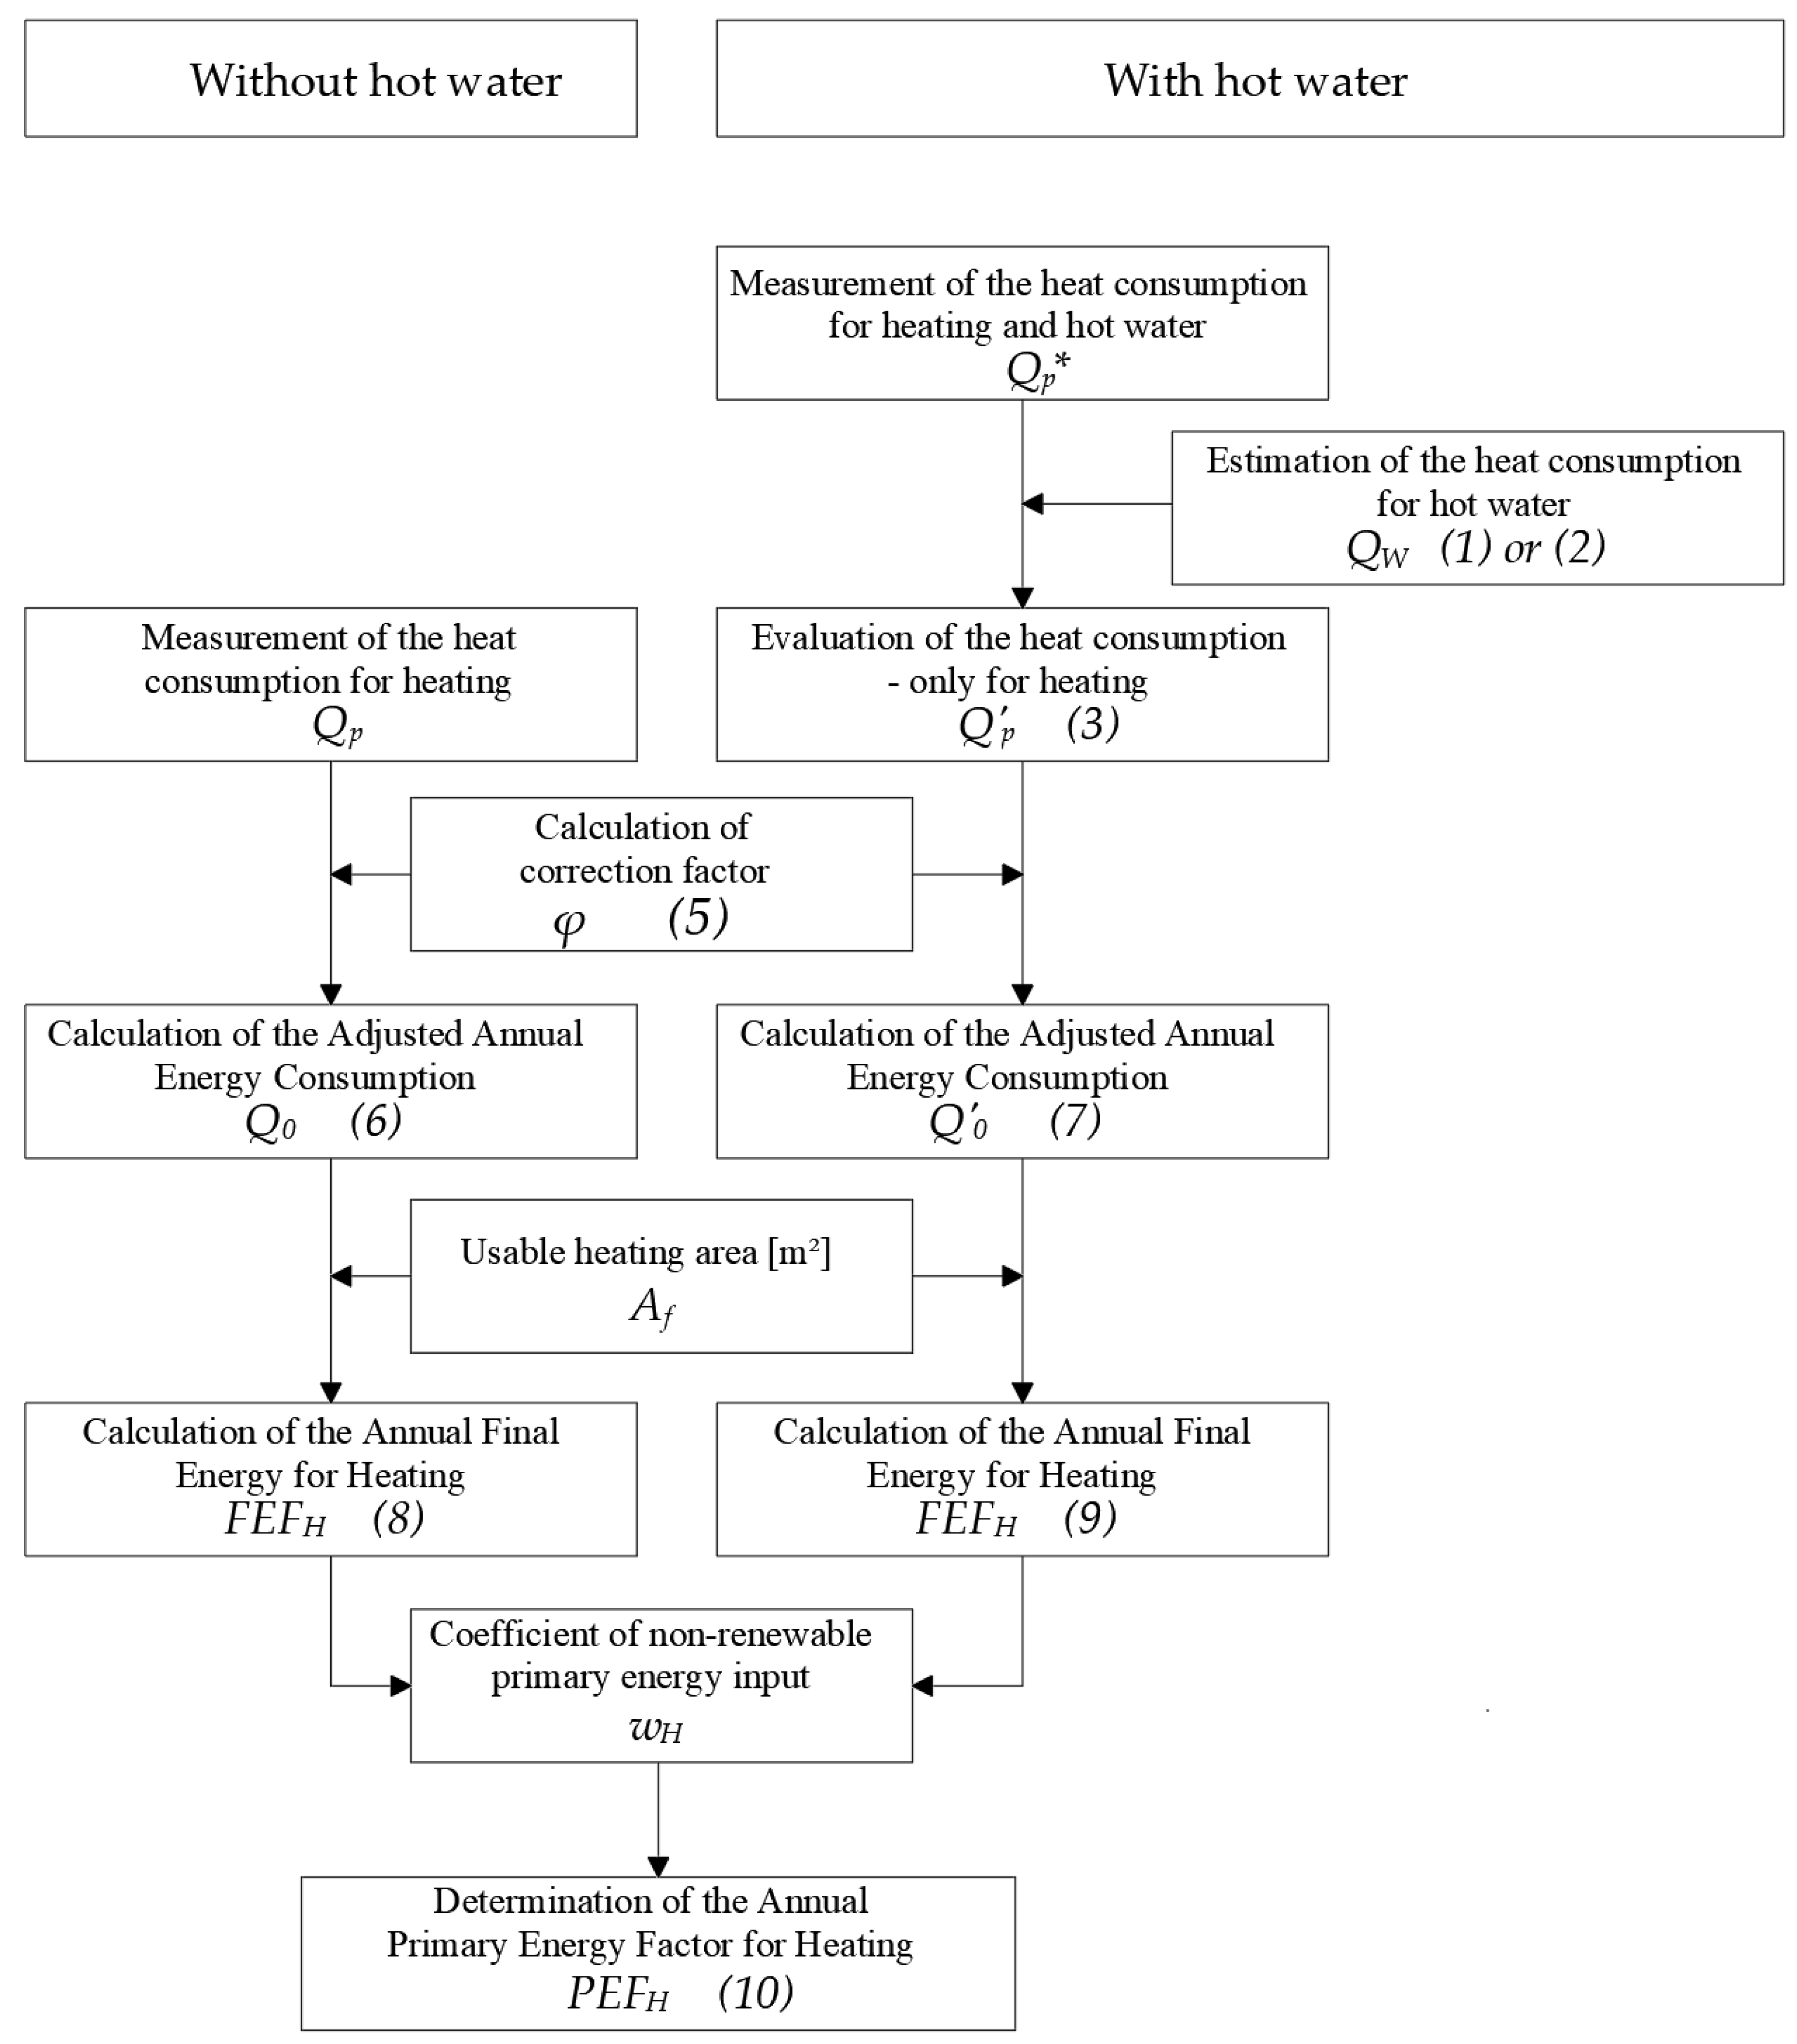
    • Measurement of the heat consumption for heating purposes in the buildings not equipped with a central hot water installation by means of legalized heat meters installed on the main pipelines of the installation, before the distributors (Qp, GJ/a);
    • Measurement of the heat consumption in total for the purposes of heating and hot water preparation in the buildings equipped with a central hot water installation supplied from the heating network (Qp*, GJ/a);
    • Measurement of the heat consumption only for the purposes of hot water preparation in June, July, August, (outside the heating season) in the buildings equipped with a central hot water system supplied from the heating network, used to estimate the heat consumption for hot water;
    • Estimated heat consumption for hot water (QW, GJ/a) using one of the two methods:
      for the objects without summer break (SUC2) according to:
      QW = qw,j · d
      where:
      qw,j—unit daily heat consumption for hot water calculated from the measurements during three summer months (June, July, August) in the particular year, GJ/day;
      d—number of days during the year, 365 days/a.
      for the objects with summer break (July, August) according to:
      QW = qw,j* · d* + QW*
      where:
      qw,j*—unit daily heat consumption for hot water calculated from the measurements in June in the particular year, GJ/day;
      d*—number of days during the year without July and August, 303 days/a (10 months);
      QW*—measured heat consumption for hot water preparation in July and August of the particular year (during 32 days of the year), GJ.
    • evaluation of the heat consumption for heating of the building equipped with the hot water system powered from the heating network (Qp, GJ/a):
      Qp = Qp*QW
  • Collecting the data concerning the duration of the heating period and month average temperatures of the outside air.
  • Calculation the number of degree-days for each year covered the with analysis according to the following formula:
    S d = ( θ i n t , H θ e , m ) · L d m
    where:
    Sd—number of degree-days calculated for each year, day·K/a;
    θe,m—average monthly temperature of outdoor air for the particular year, °C;
    θint,,H—temperature of indoor air in the heating zone, established 20 °C;
    Ldm—number of heating days in the particular month for each year, day.
  • Calculation of correction factor resulting from the variation of degree-day according to the following dependence:
    φ = S d 0 S d
    where:
    φ—correction coefficient;
    Sd0—number of degree-days in standard year, calculated for the standard year using average month outdoor air temperatures from multi-year measurement and theoretical duration of the heating period (222 days), which equals 3825.2 day∙K/a for the location of the analyzed buildings (constant value for the considered location).
    Table 2 presents values of correction factor calculated using Equation (5).
  • Correction of the measured values to the standard year according to the following formulas:
    Q 0 = Q p φ
    Q 0 = Q p φ
    where:
    Q0–Adjusted Annual Energy Consumption (under standard conditions), GJ/a;
    Q′0–Adjusted Annual Energy Consumption (under standard conditions) in the buildings with the hot water system powered from the heating network, GJ/a;
    Qp–measured annual energy consumption, GJ/a;
    Q′p–estimated annual energy consumption in the buildings with the hot water system powered from the heating network, GJ/a.
  • Determination of the Annual Final Energy Factor for Heating (FEFH) according to the following relation:
    F E F H = 1000   ·   Q 0   3.6 ·   A f
    or
    F E F H = 1000   ·   Q 0 3.6 ·   A f
    where:
    FEFH—Final Energy Factor for Heating (FEFH), kWh/(m2·a);
    Af—usable heating area of the building, m2.
  • Determination of the Annual Primary Energy Factor for Heating (PEFH) according to the following relation:
    PEFH = wH FEFH
    where:
    wH—coefficient of non-renewable primary energy input assumed for cogeneration as 0.8 according to Polish regulations [27,28].
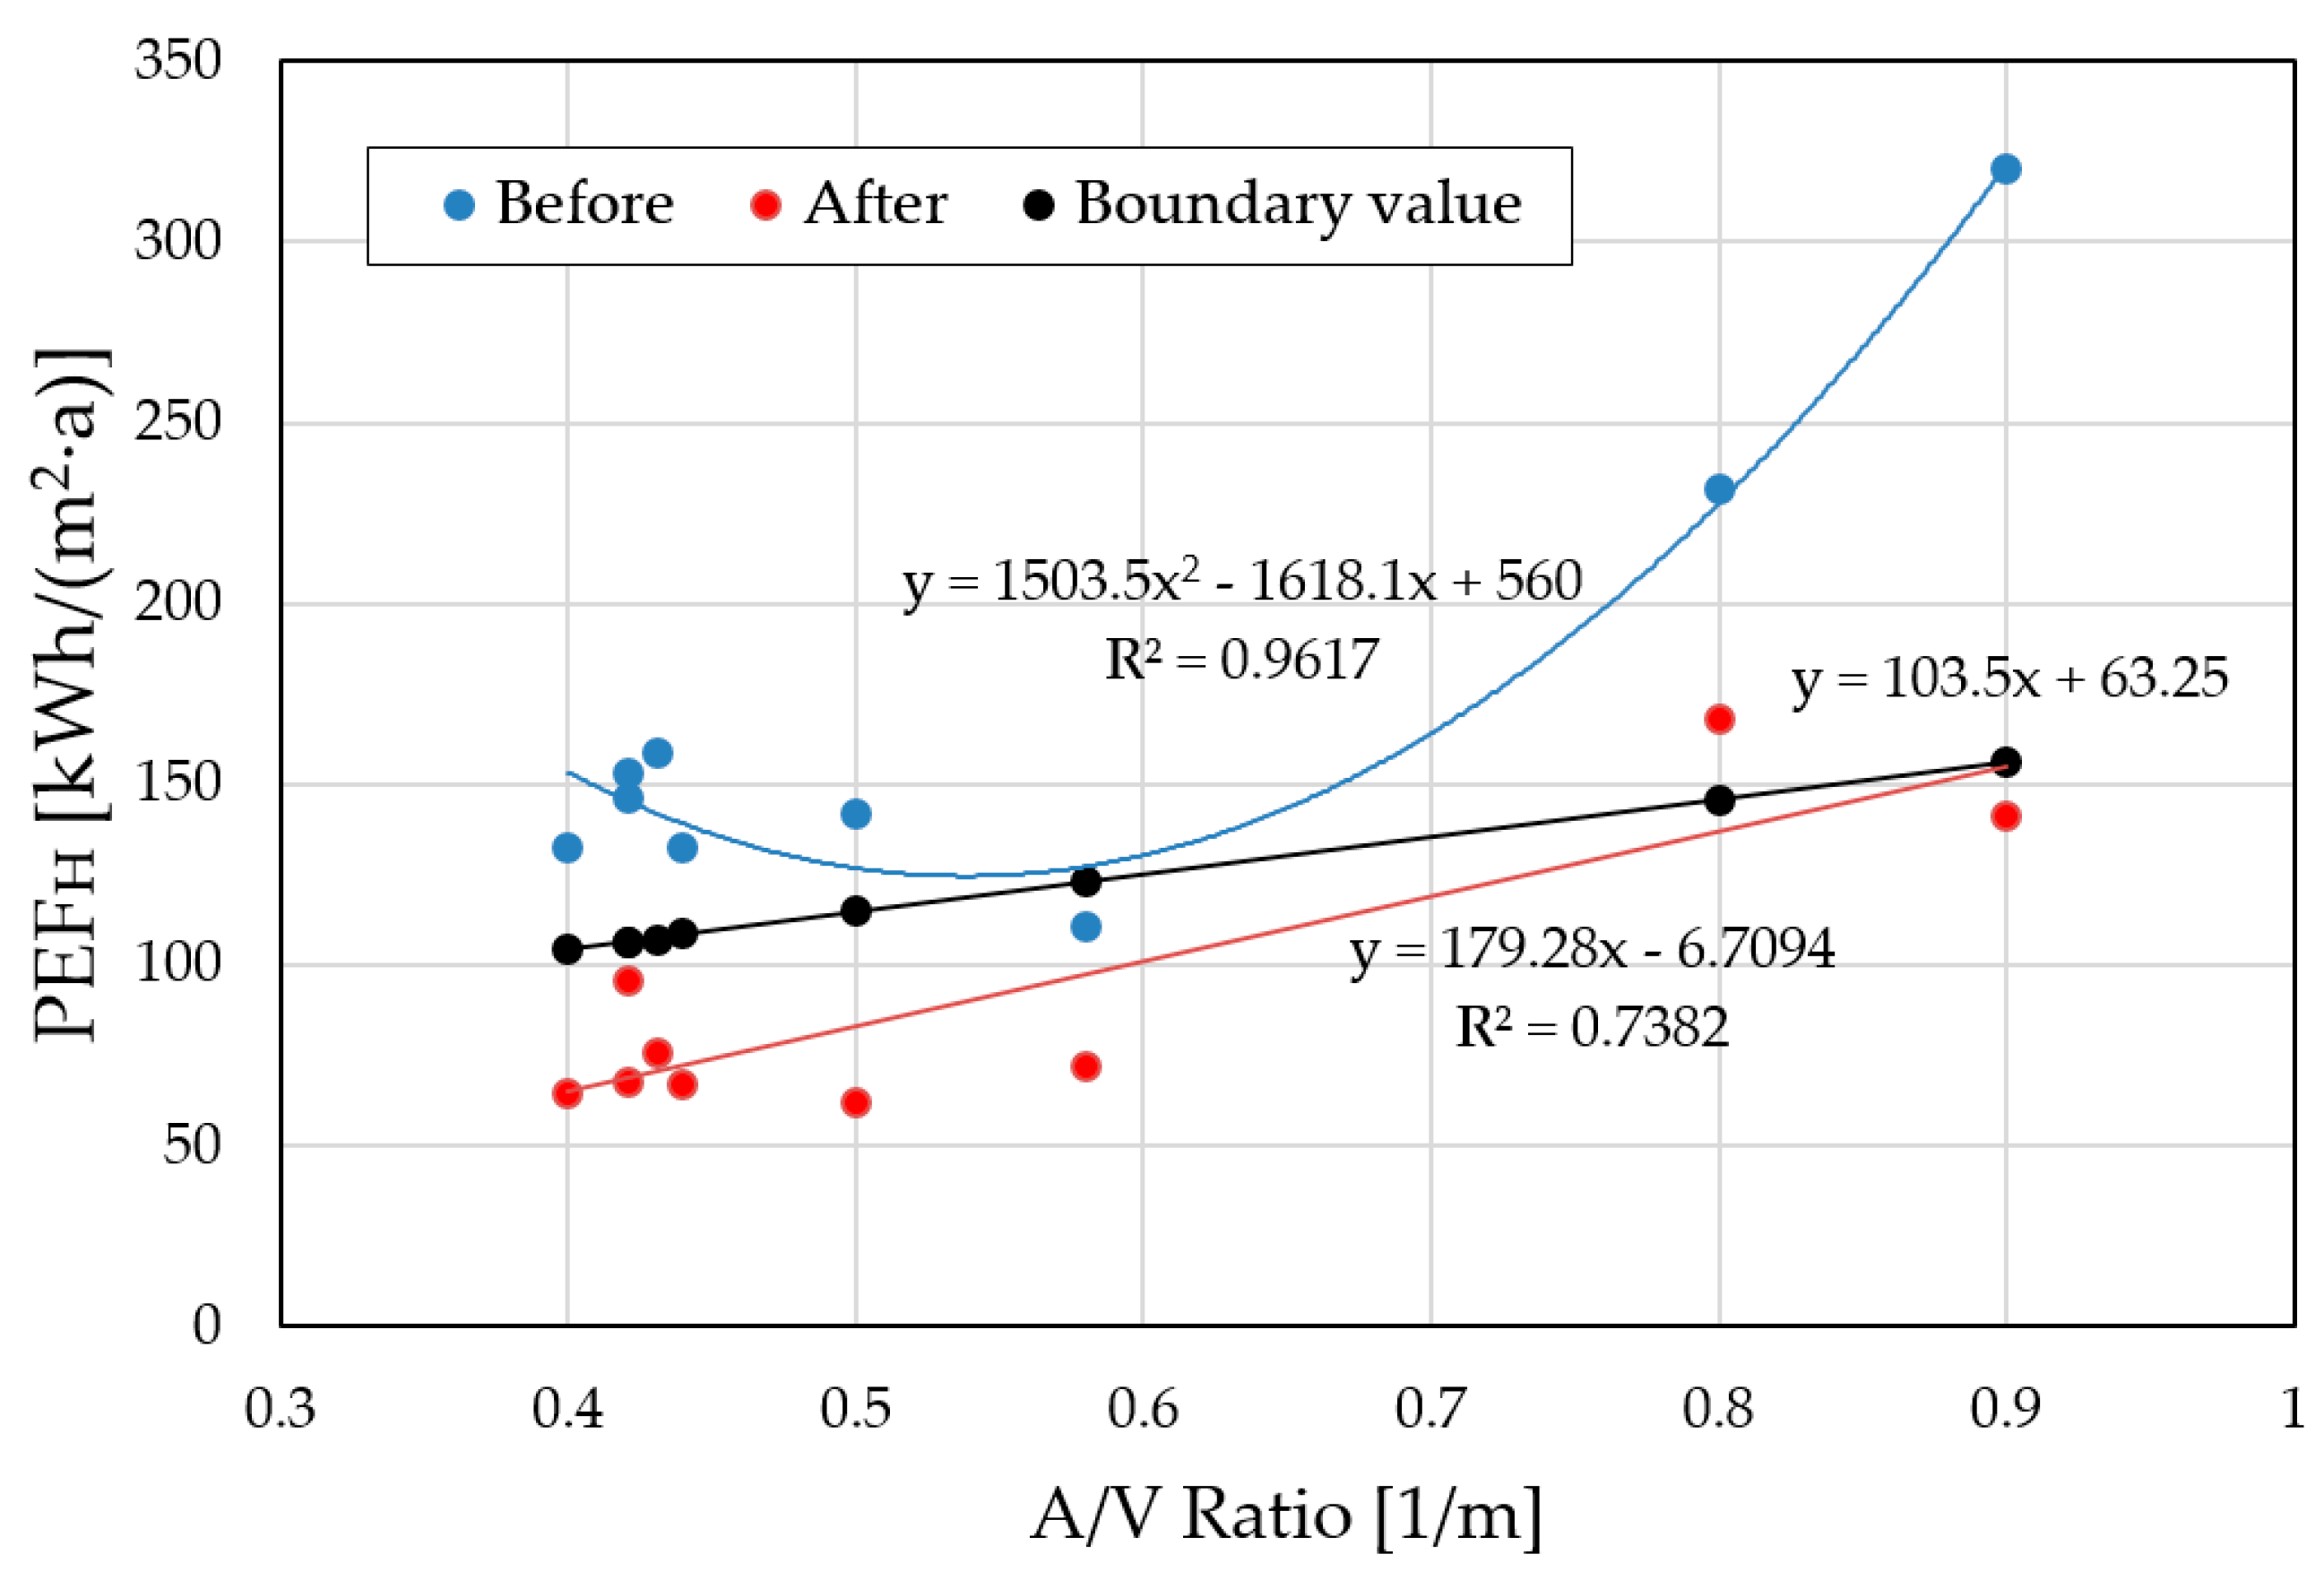
  • Calculation of the boundary value of the Annual Primary Energy Factor for Heating (PEFH,0) in relation to the Building Shape Factor, according to the national (Polish) requirements from the period when thermo-modernization was carried out, according to the relation [27]:
    PEFH,0 = 1.15 · [55 + 90 · (A/V)]
    where:
    PEFH,0—maximal value of the Annual Primary Energy Factor for Heating (PEFH), kWh/(m2·a);
    A/V—Building Shape Factor–ratio between the sums of the areas of building boundaries serving the balance cover and heated volume of the building measured in outer contour, 1/m.
  • Determination of the energy consumption savings according to the following dependences:
    ΔQ%,avg = (Q01,avg − Q02,avg)/Q01,avg · 100
    ΔQ%,min = (Q01,avg − Q02,min)/Q01,avg · 100
    ΔQ%,max = (Q01,avg − Q02,max)/Q01,avg · 100
    where:
    ΔQ%,avg, ΔQ%,min, ΔQ%,max—average, minimal and maximal (respectively) obtained decrease of Annual Energy consumption after thermo-modernization related to the annual value of the average Annual Energy Consumption before thermo-modernization, %;
    Q01,avg—average Annual Energy Consumption before thermo-modernization reduced to the standard conditions, GJ/a;
    Q02,avg, Q02,min, Q02,max—average, minimal and maximal (respectively) Annual Energy Consumption after thermo-modernization reduced to the standard conditions, GJ/a.

3. Results

3.1. Readouts of Energy Consumption

The readouts of energy consumption in the considered period of time (8 years) were presented in Table 3 for the particular examined objects. The columns present the values of Annual Energy Consumption for heating purposes (Qp or Q′p) [GJ/a]. The years when retrofitting was conducted (transition years), are indicated using asterisks.

3.2. Calculation of the Thermo-Modernization Efficiency

3.2.1. Evaluation of the Boundary Value of the Annual Primary Energy Factor for Heating

The first stage of the theoretical investigation was to evaluate the boundary value of the Annual Primary Energy Factor for Heating (PEFH,0) which was assessed in relation to the Building Shape Factor, serving as a reference value to verify the quality of the thermo-modernization procedure. All data were calculated from the A/V ratio values presented in Table 1, and recalculated using Equation (11). Those data are also presented in Table 4.

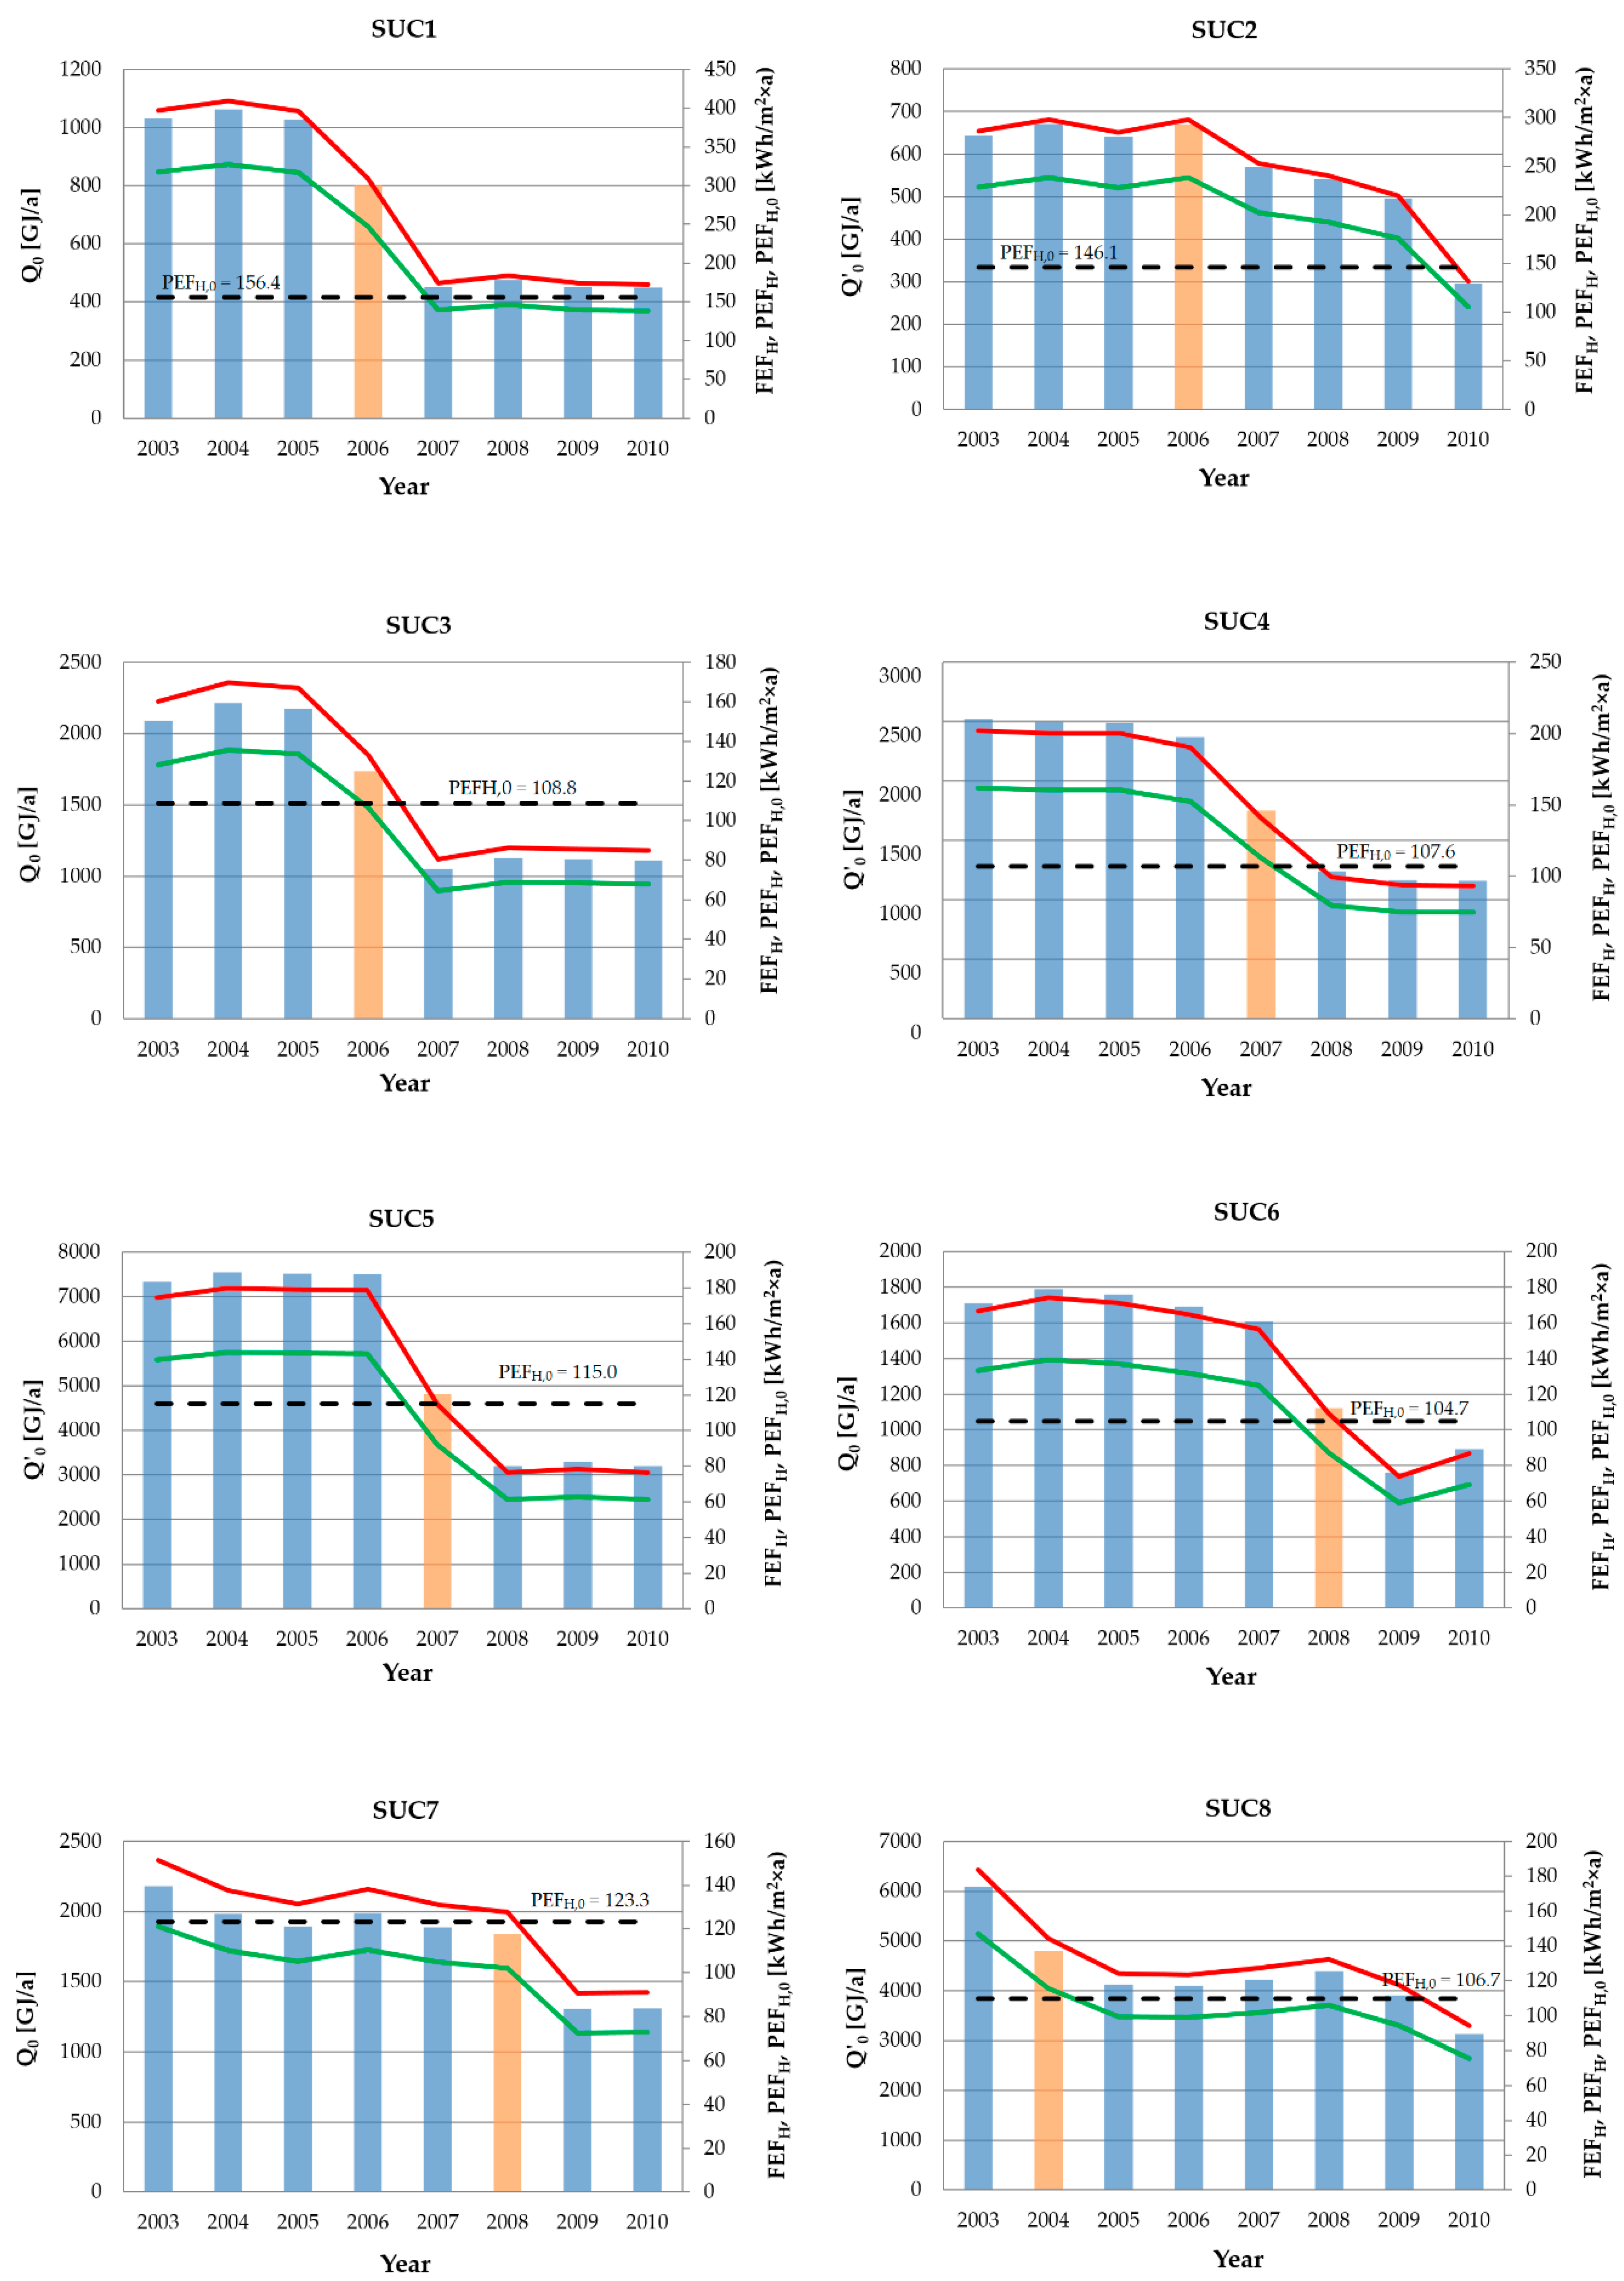
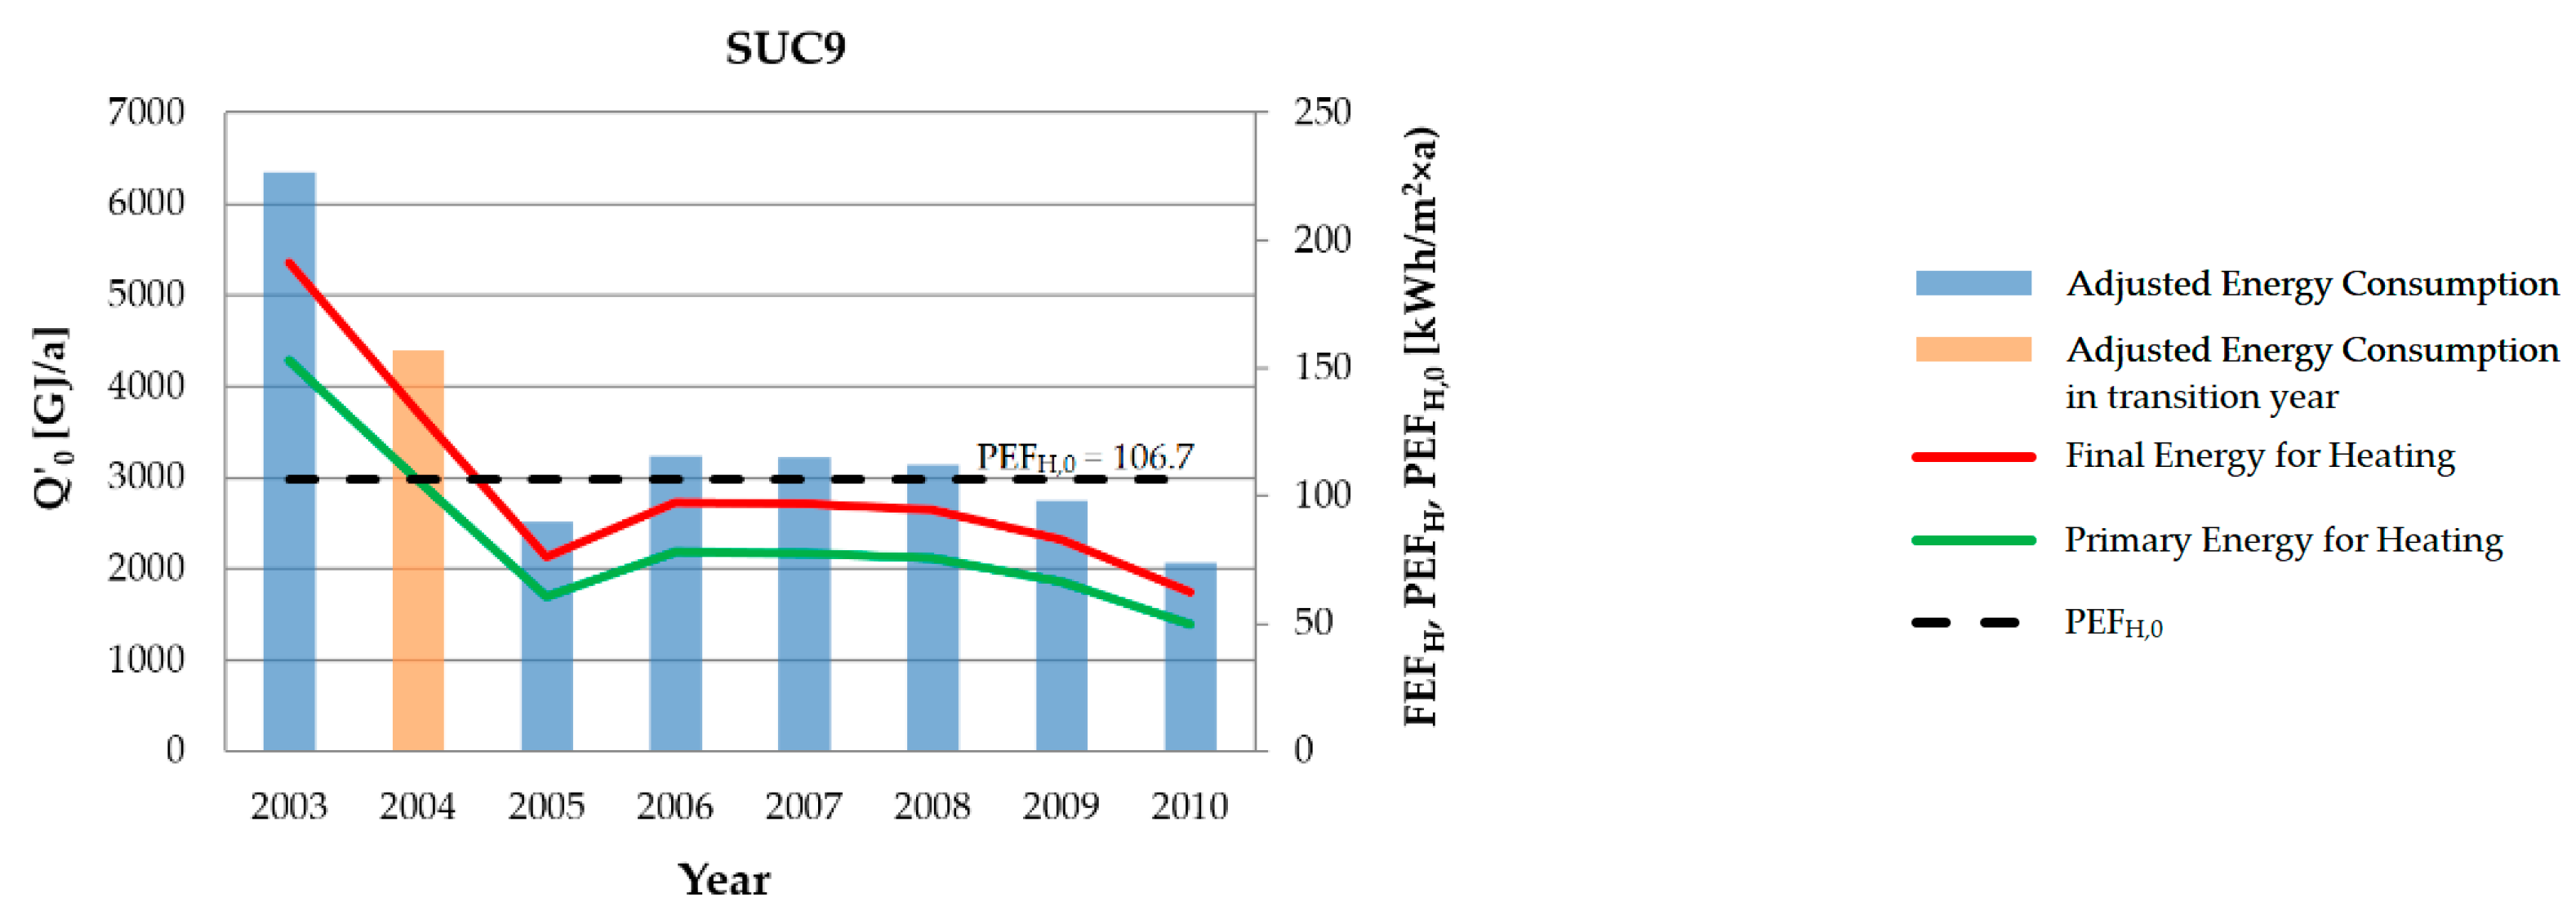
3.2.2. Evaluation of Annual Energy Consumption and Energy Factors for Heating

With the data presented in Table 3, the value of the Adjusted Annual Energy Consumption (Q0 or Q′0) [GJ/a] was calculated using Equations (6) and (7), Final Energy Factor for Heating (FEFH) [kWh/m2a], calculated using Formulas (8) or (9), and Primary Energy Factor for Heating (PEFH) [kWh/m2a] calculated using Equation (10). All calculated data are presented in Table 5, with the transition years marked using asterisks, similarly to Table 3.
The data presented in Table 2 describing the harshness of winter period by the φ coefficient prove that the conditions during winter period do not influence the heat consumption significantly. In the considered region and period of time, these values varied between 0.897 and 1.08. This means that the difference between both values differs only by 20%, but the average value of φ coefficient for the period of 8 years equals 1.008. It should be also noticed that through most of the examined period (between 2004 and 2009) these differences were even smaller (winters of 2003 and 2010 were more severe); the range of φ varies between 0.095 and 1.08 which means 8.5% in the difference between those values. Nevertheless, the Adjusted Annual Energy Consumption (Q0) being a measure of standard heating period independent of weather conditions, was used for the comparative purposes. This value is more objective than the Annual Energy Consumption (Q0), not being influenced by the hardness of the winter period
Additionally, the data contained in Table 5 are visualized in Figure 2. The adjusted energy consumption is set with Primary and Final Energy Factors for Heating. The diagrams were extended with the graphical presentation of the boundary value of the Annual Primary Energy Factor for Heating (PEFH,0) in relation to the Building Shape Factor serving as a critical value to evaluate the efficiency of retrofitting efforts. The presented data correspond to the values of energy consumption in the Polish educational buildings available in the scientific literature, where the annual heating energy consumption in Polish schools was evaluated to be at the level of 120 kWh/(m2∙a) [29,30].

4. Discussion

With the data presented in Table 5 and Figure 2, it is clearly visible that, due to the thermo-modernization processes, both the Energy Consumption (Qp and Q0) and values of Final and Primary Energy Factors decreased. This confirms the efficiency of this process. In the case of SUC1 with transition year 2006, the decrease of heat consumption after 2006 is clearly visible. Even during the transition year, the heat consumption bar shows the value of 802 GJ/a, which is about 23% lower than the previous building status. Following the completion of the modernization process, the Q0 value equals about 450 GJ/a, which proves the efficiency of the modernization process. The Final and Primary Energy Factors confirm this trend. From the diagram it can be also noted that the PEFH value is smaller than the reference PEFH,0 value, which means that after this procedure the building fulfills heat standards that became effective in 2009 for that type of object.
In the case of SUC2 (Kindergarden), the efficiency of thermo-modernization is not that visible. It is caused by the prolonged period of the retrofitting procedures, which was conducted for the period of 3 years. This is visible on the diagram as a gradual decrease of the annual heat consumption. The final result of the thermo-modernization is visible in 2010, when the Primary Energy Factor value is below the reference value PEFH,0 according to the standards from the discussed period.
In the case of the other buildings that served as Primary Schools (SUC3-9), the energy performance was comparable to SUC1 (Kindergarten), where a partial consumption decrease was visible during the transition year and became more significant afterwards.
For better visualization, the averaged values of Q0 before and after modernization determined in all tested buildings are summarized in Table 6.
The averaged values of the Adjusted Heat Consumption for Heating in each case decrease after the thermo-modernization process. During the transition period, the energy consumption was in all cases between the values before and after that period. This can be explained by the fact that the thermo-modernization process was conducted partially, mainly during the non-heating period, and the advantages of the procedure were observed only in December.
The thermo-modernization procedure provided the owners of the buildings with energy savings at a very high level. The average percentage of energy savings from all buildings was equal to 46.8%, which meant that for all considered objects, almost 50% of the measured energy was saved. It must be noticed that the real (measured) energy savings were smaller than those projected by the auditing methodology. This can be explained by the fact that, before thermo-modernization, those buildings were unheated, and after the renovation, the heat comfort of those buildings increased, which required higher energy consumption. Three of the examined objects were additionally investigated theoretically using the auditing methodology. The calculated energy savings expressed in heat consumption would reach the level 70.2%. Averaged heat consumption after thermo-modernization read by heat meters reached in this case 56%. This value is very promising, but significantly below the theoretical estimation. In the case of the SUC8, this difference is more significant: 82.3% of savings from theoretical evaluation but only 34.7% of real readouts. In the case of SUC9, these differences were smaller but still visible—82.4% for theoretical evaluation and 55.4% from heat-meter readouts—after adjusting.
The theoretical energy consumption calculated in audits (Table 7) is significantly higher than the measured adjusted energy consumption (Table 6). After thermo-modernization, the relations between the abovementioned values are reversed. For example, in the case of SUC1, the measured value of heat consumption before thermo-modernization Q0 was smaller and equal to 1040.2 GJ/a, while the calculated value was higher and equaled 1324.9 GJ/a. On the other hand, after the renovation procedure, the measured value was higher from the calculated one (457.4 GJ/a and 395.0 GJ/a respectively). Similar relations were observed for the primary schools (SUC8 and SUC9). It is supposed that the reason for these differences is the insufficient heating of the rooms and improper ventilation (real ventilation flux was lower than the calculated one). After the thermo-modernization procedure, higher temperatures could occur but also the assumed weakening in heating may be omitted within the theoretical calculations. Irrational energy management in the buildings could also have taken place, if there was no person responsible for monitoring heat consumption or no central heating system control. The abovementioned reasons cause the difference in the measured heat consumption between schools SUC8 and SUC9 (with the same design and shape factor), and the differences in the calculations are due to various assumed weakening factors in the heating system performance. It should be emphasized that a more thorough analysis should be conducted where all objects would be investigated under the operating conditions and (theoretically) energy audits would be calculated.
Additionally, the influence of building shape ratio on Primary Energy Factor for Heating was checked. Figure 3 presents the relation between these two factors characterizing the tested buildings before and after the retrofitting processes. From the diagrams it can be noticed that before the modernization, the values of PEFH were significantly higher, independent of the building shape. It was observed that in the case of low A/V ratio values before the thermo-modernization, the influence of building shape was not significant and was even negative. Accordingly, it can be interpreted that those buildings were operated differently and maybe some of them could be unheated. In the case of the buildings with a worse (higher) value of A/V ratio, higher energy consumption expressed as Primary Energy Factor for Heating was higher and rising. The discussed relation can be described by the polynomial model presented in Figure 3 with the determination coefficient equal to 0.96.
On the other hand, the relation between the building shape factor and Primary Energy Factor for Heating after retrofitting is clearer and could be also described by the linear regression model presented in Figure 3. Coefficient of determination equals 0.74 in that case, but there is no visible significant decrease of PEFH value in the case of the lower values of the A/V ratio.
Additionally, the boundary value of the Annual Primary Energy Factor for Heating (PEFH,0) in relation to the Building Shape Factor was presented (black line) to compare the energy consumption before and after the retrofitting procedure. It can be observed that, before thermo-modernization, averaged consumption did not exceed the boundary value (only in the case of the primary school SUC7). In the case of the buildings with a higher value of A/V ratio, the energy consumption was significantly higher. After thermo-modernization, nearly all the buildings had lower value of energy consumption compared to the PEFH,0 value. Both relations are represented by the linear regression models and importantly, the y-intercept values differ in value–boundary values of PEFH in the case of small A/V ratio values and are higher compared to the real ones. On the other hand, the slope is smaller. This can be interpreted that all the examined buildings with small A/V ratio had better energy properties compared to the boundary values coming from the local regulations [27]. In the case of the buildings with more complicated shapes, the energy savings were not that significant and in the case of Kindergarten SUC2, PEFH,0 was exceeded even after thermo-modernization.
The analyzed objects indicate that different energy effects can be obtained in the same building under operating conditions, as shown in the Table 6—e.g., the SUC6 building where the minimum value of energy saving is 47.9% and the maximum value 55.7%.
Comparing the obtained results to the literature reports, it can be noticed that similar dependences can be found in the scientific sources. Marrone et al. [30] compared the energy savings resulting from thermo-modernization evaluated by theoretical analysis and from real readouts. The savings from theoretical calculations varied up to 40%, but the savings from real data reached 33%. Comparing the cited results with those presented in Table 6, it should be noticed that average energy savings achieved in seven Polish educational objects were higher and in two cases (SUC7 and SUC8) they were comparable. On the other hand, Mazzola et al. [31] elaborated a method of auditing the energy renovation of the historical buildings based on energy simulations. The differences between the readouts of the real objects and the simulations varied between 1% and 5%.
In their theoretical investigation presented in the article [32], Biserni et al. found that retrofitting a building by changing the existing windows caused the energy savings at the level of 13%, additional thermal insulation of the external walls provided the energy savings at the level of 50.1% and finally, complex retrofitting of the external building envelope covering the exchange of the windows, walls and roof additional thermal insulation, provided energy savings of 70.3%. Those values were similar or smaller by about 10% compared to those calculated in our research and presented in Table 7.
Mancini and Nastasi [33] conducted the simulations of the energy consumption in the residential buildings based on surveys and readouts from the bills for energy use. The investigated objects were modernized for many scenarios, from the elements of the building envelopes through the heating systems. After retrofitting of the envelopes, they achieved average primary energy savings between 8.5% and 30.8%. Retrofitting of the heating systems decreased the energy consumption by about 7%. Combined modernization of the envelopes and heating systems gave energy savings at the level of 30%–35%, depending on the situation. This was still less compared to the results achieved in our investigation (Table 6).
Under the Polish conditions, Zender-Swiecz and Telejko [34] investigated the residential buildings that were retrofitted—renovation relied on the insulation of the building external envelope which sealed the building and had a significant negative influence on the amount of the air delivered to the rooms. That worsened the indoor microclimate causing negative effects on the human health. Similar conclusions were drawn by Gładyszewska-Fiedoruk [35] who investigated kindergartens located in eastern Poland. After retrofitting a building by replacing the old windows with the new tight ones, the ventilation of the building was hindered and the indoor air conditions deteriorated.
Woroniak and Piotrowska-Woroniak [15] examined small church buildings in eastern Poland, using a similar methodology of energy considerations. They achieved between 31% and 66% decrease in the seasonal demand. Życzyńska, in the article [17] described thermo-renovation energy effects of the group of the buildings built in the traditional technology in the 1960s and 1970s. The thermo-renovation concerned only the external walls, roofs and the replacement of some windows. The decrease of energy consumption equaled between 16.3% and 21.5% for the whole group of the objects. The technical requirements expressed as PEFH,0 reference factor were not met.

5. Conclusions

A thorough analysis of the obtained results from the heat consumption measurement and theoretical calculations enables us to draw the following conclusions:
  • Under the operating conditions, the state calculated theoretically is not obtained. The actual energy consumption decreases are much lower than predicted, which mainly results from the improvement of thermal comfort in the rooms of the building.
  • In the cases analyzed, the energy consumption under operating conditions decreased in the range of 34%–56%, which gave an average decrease in heat consumption of 46.8%.
  • For better building energy management, the heat consumption for heating and hot water production should be monitored separately.
  • In the buildings with identical shape factors and a similar manner of use, different energy effects are obtained under operating conditions.
  • The efficiency of thermo-modernization in the case of the buildings with a simple shape was better compared to the objects with a higher A/V ratio.

Author Contributions

Conceptualization, A.Ż. and Z.S.; Formal analysis, A.Ż. and Z.S.; Methodology, A.Ż.; Project administration, A.Ż.; Supervision, J.K. and R.Č.; Validation, J.K. and R.Č.; Writing—original draft, A.Ż. and Z.S.; Writing—review and editing, J.K. and R.Č. All authors have read and agreed to the published version of the manuscript.

Funding

This research was financially supported by Ministry of Science and Higher Education in Poland within the statutory research of scientific units under subvention for science program (FN-61/ILT/2019, FN-70/IŚ/2019) and by the Grant Agency of the Czech Technical University in Prague under project No. SGS19/143/OHK1/3T/11.

Conflicts of Interest

The authors declare no conflict of interest.

References

  1. Moretti, E.; Barbanera, M.; Foschini, D.; Buratti, C.; Cotana, F. Energy and environmental performance analysis of biomass-fuelled combined cooling and heating system for commercial building retrofit: An Italian case study. Energy Procedia 2016, 101, 376–383. [Google Scholar] [CrossRef]
  2. European Union. EU Energy in Figures, Statistical Pocketbook. 2012. Available online: https://op.europa.eu/en/publication-detail/-/publication/4fbba65f-6690-4c3f-878a-e4ce0bc3515c (accessed on 4 May 2020).
  3. Saheb, Y.; Bodis, K.; Szabo, S.; Ossenbrink, H.; Panev, S. Energy Renovation: The Trump Card for the New Start for Europe; Publications Office of the European Union: Luxembourg, 2015. [Google Scholar]
  4. Tettey, U.Y.A.; Dodoo, A.; Gustavsson, L. Effect of different frame materials on the primary energy use of a multi storey residential building in a life cycle perspective. Energy Build. 2019, 185, 259–271. [Google Scholar] [CrossRef]
  5. Aste, N.; Del Pero, C. Impact of domestic and tertiary buildings heating by natural gas in the Italian context. Energy Policy 2012, 47, 164–171. [Google Scholar] [CrossRef]
  6. Le Truong, N.; Gustavsson, L. Costs and primary energy use of heating new residential areas with district heat or electric heat pumps. Energy Procedia 2019, 158, 2031–2038. [Google Scholar] [CrossRef]
  7. Directive 2010/31/EU of the European Parliament and of the Council of 19 May 2010 on the Energy Performance of Buildings. Available online: https://eur-lex.europa.eu/legal-content/EN/TXT/?uri=CELEX%3A32010L0031 (accessed on 4 May 2020).
  8. Piccardo, C.; Dodoo, A.; Gustavsson, L.; Tettey, U.Y.A. Retrofitting with different building materials: Life-cycle primary energy implications. Energy 2020, 192, 116648. [Google Scholar] [CrossRef]
  9. Pardo-Bosch, F.; Cervera, C.; Ysa, T. Key aspects of building retrofitting: Strategizing sustainable cities. J. Environ. Manag. 2019, 248, 109247. [Google Scholar] [CrossRef]
  10. Cho, K.H.; Kim, S.S. Energy performance assessment according to data acquisition levels of existing buildings. Energies 2019, 12, 1149. [Google Scholar] [CrossRef] [Green Version]
  11. Directive 2002/91/EC of the European Parliament and of the Council of 16 December 2002 on the Energy Performance of Buildings. Available online: https://eur-lex.europa.eu/legal-content/EN/TXT/?uri=CELEX%3A32002L0091 (accessed on 4 May 2020).
  12. Act of Polish Government of 18 December 1998 on Supporting Thermomodernization Projects. Available online: http://prawo.sejm.gov.pl/isap.nsf/DocDetails.xsp?id=WDU19981621121 (accessed on 4 May 2020).
  13. Regulation of the Polish Minister of Interior and Administration of 30 April 1999 Concerning Scope and Form of the Energy Audit as Well as Algorithms for Assessing the Profitability of Thermo-Modernization Project and the Patterns of the Energy Audit Cards. Available online: http://prawo.sejm.gov.pl/isap.nsf/DocDetails.xsp?id=WDU19990460459 (accessed on 4 May 2020).
  14. Wojdyga, K.; Chorzelski, M. Chances for Polish district heating systems. Energy Procedia 2017, 116, 106–118. [Google Scholar] [CrossRef]
  15. Woroniak, G.; Piotrowska-Woroniak, J. Effects of pollution reduction and energy consumption reduction in small churches in Drohiczyn community. Energy Build. 2014, 72, 51–61. [Google Scholar] [CrossRef]
  16. Mavromatidis, L.E.; Bykalyuk, A.; Lequay, H. Development of polynomial regression models for composite dynamic envelopes thermal performance forecasting. Appl. Energy 2013, 104, 379–391. [Google Scholar] [CrossRef]
  17. Życzyńska, A. The heat consumption and heating costs after the insulation of building partitions of building complex supplied by the local oil boiler room. Eksploatacja Niezawodnosc 2014, 16, 313–318. [Google Scholar]
  18. El-Darwish, I.; Gomaa, M. Retrofitting strategy for building envelopes to achieve energy efficiency. Alex. Eng. J. 2017, 56, 579–589. [Google Scholar] [CrossRef] [Green Version]
  19. Fan, Y.; Xia, X. A multi-objective optimization model for energy-efficiency building envelope retrofitting plan with rooftop PV system installation and maintenance. Appl. Energy 2017, 189, 327–335. [Google Scholar] [CrossRef] [Green Version]
  20. Song, X.; Ye, C.; Li, H.; Wang, X.; Ma, W. Field study on energy economic assessment of office buildings envelope retrofitting in southern China. Sustain. Cities Soc. 2017, 28, 154–161. [Google Scholar] [CrossRef]
  21. Fabrizio, E.; Ferrara, M.; Monetti, V. Smart heating systems for cost-effective retrofitting. In Cost-Effective Energy Efficient Building Retrofitting, Materials, Technologies, Optimization and Case Studies, 1st ed.; Pacheco-Torgal, F., Granqvist, C., Jelle, B., Vanoli, G., Bianco, N., Kurnitski, J., Eds.; Elsevier: Amsterdam, The Netherlands, 2017. [Google Scholar] [CrossRef]
  22. Wang, Q.; Holmberg, S. Combined retrofitting with low temperature heating and ventilation energy savings. Energy Procedia 2015, 78, 1081–1086. [Google Scholar] [CrossRef] [Green Version]
  23. Życzyńska, A. The influence of heating and hot water system on the energy performance of a building. Rynek Energii 2009, 6, 46–54. [Google Scholar]
  24. Życzyńska, A. The primary energy factor for the urban heating system with the heat source working in association. Eksploatacja Niezawodnosc 2013, 15, 458–462. [Google Scholar]
  25. Regulation of the Polish Minister of Infrastructure of 6 November 2008 Concerning the Methodology for Calculating the Energy Performance of the Building and a Residential Unit or Part of a Building Which Is the Whole Technical-Independent Utility and the Preparation and Presentation of Certificates of Energy Performance. Available online: http://isap.sejm.gov.pl/DetailsServlet?id=WDU20082011240 (accessed on 4 May 2020).
  26. Regulation of the Polish Minister of Infrastructure of 17 March 2009 Concerning Scope and Form of the Energy Audit and the Repair Audit, Design Audits Cards, as Well as Algorithms for Assessing the Profitability of Thermo-Modernization Project. Available online: http://isap.sejm.gov.pl/DetailsServlet?id=WDU20090430347 (accessed on 4 May 2020).
  27. Regulation of the Minister of Infrastructure of 6 November 2008. Amending the Regulation on the Technical Conditions to Be Met by Buildings and Their Location. Available online: http://prawo.sejm.gov.pl/isap.nsf/DocDetails.xsp?id=WDU20082011238 (accessed on 4 May 2020).
  28. Regulation of the Polish Minister of Infrastructure of 27 February 2015 Concerning the Methodology for Calculating the Energy Performance of the Building or Part of a Building and the Preparation of Certificates of Energy Performance. Available online: http://prawo.sejm.gov.pl/isap.nsf/DocDetails.xsp?id=WDU20150000376 (accessed on 4 May 2020).
  29. Pereira, L.D.; Raimondo, D.; Corgnati, S.P.; Gameiro Da Silva, M. Energy consumption in schools—A review paper. Renew. Sustain. Energy Rev. 2014, 40, 911–922. [Google Scholar] [CrossRef]
  30. Marrone, P.; Gori, P.; Asdrubali, F.; Evangelisti, L.; Calcagnini, L.; Grazieschi, G. Energy benchmarking in educational buildings through cluster analysis of energy retrofitting. Energies 2018, 11, 649. [Google Scholar] [CrossRef] [Green Version]
  31. Mazzola, E.; Dalla Mora, T.; Peron, F.; Romagnoni, P. An integrated energy and environmental audit process for historic buildings. Energies 2019, 12, 3940. [Google Scholar] [CrossRef] [Green Version]
  32. Biserni, C.; Valdiserri, P.; D’Orazio, D.; Garai, M. Energy retrofitting strategies and economic assessments: The case study of a residential complex using utility bills. Energies 2018, 11, 2055. [Google Scholar] [CrossRef] [Green Version]
  33. Mancini, F.; Nastasi, B. Energy retrofitting effects on the energy flexibility of dwellings. Energies 2019, 12, 2788. [Google Scholar] [CrossRef] [Green Version]
  34. Zender-Swiercz, E.; Telejko, M. Impact of insulation building on the work of ventilation. Procedia Eng. 2016, 161, 1731–1737. [Google Scholar] [CrossRef] [Green Version]
  35. Gładyszewska-Fiedoruk, K. Correlations of air humidity and carbon dioxide concentration in the kindergarten. Energy Build. 2013, 62, 45–50. [Google Scholar] [CrossRef]
Figure 1. Block diagram of the calculation algorithm (numbers of formulas and explanation of the symbols presented below).
Energies 13 02449 g001
Figure 2. Presentation of changes of the Annual Adjusted Energy Consumption within the investigated period together with Final and Primary Energy Factor for Heating.
Energies 13 02449 g002aEnergies 13 02449 g002b
Figure 3. Relation between Primary Energy Factor for Heating evaluated by measurements and A/V ratio of all tested buildings, before and after retrofitting.
Energies 13 02449 g003
Table 1. Basic parameters of the buildings examined for energy consumption.
ObjectConstruction YearTechnology
of Construction
A/VHeated, Usable Area [m2]Retrofitting
Year
Energy Needs
SUC11968traditional0.907212006heating
SUC21981industrialized0.806252007heating + hot water
SUC31970industrialized0.4436242006heating
SUC41963traditional0.4334582007heating + hot water
SUC51985industrialized0.5011,6542007heating + hot water
SUC61961traditional0.4028552008heating
SUC71974industrialized0.5840002008heating
SUC81982industrialized0.429216.22004heating + hot water
SUC91983industrialized0.429216.22004heating + hot water
Before RetrofittingAfter Retrofitting
ObjectUwalls
[W/m2K]
Uroof/Uflat roof [W/m2K]Uwindow/Udoor [W/m2K]Uwalls
[W/m2K]
Uroof/Uflat roof [W/m2K]Uwindow/Udoor [W/m2K]
SUC10.95 **1.28 **2.6/2.5 **0.24 **0.22 **1.8/1.8 **
SUC21.16 ***0.70 ***3.0/5.60.25 *0.22 *1.8/1.8 *
SUC31.120.855.1/3.50.25 *0.22 *1.8/1.8 *
SUC41.16 ***0.70 ***5.6/5.60.25 *0.22 *1.8/1.8 *
SUC51.130.852.6/2.50.25*0.22 *1.8/1.8 *
SUC61.16 ***0.70 ***3.0/5.60.25 *0.22 *1.8/1.8 *
SUC71.16 ***0.70 ***3.0/5.60.25*0.22 *1.8/1.8 *
SUC81.12 **1.54/2.37 **2.8/5.6 **0.24 **0.21/0.22 **1.3/1.3 **
SUC91.12 **1.54/2.37 **2.8/5.6 **0.24 **0.21/0.22 **1.3/1.3 **
* based on requirements [13]. ** based on energy audits. *** based on requirements during erecting the building. without asterisks—based on archival documentation or manager’s information.
Table 2. Coefficients reflecting the harshness of winter in the particular year of the examination period.
YearSd0Sdφ
20033825.23938.30.971
20043714.71.030
20053844.50.995
20063788.81.010
20073677.41.040
20083542.51.080
20093669.21.043
20104263.90.897
Table 3. Annual Energy Consumption (Qp or Q′p) [GJ/a] for heating purposes in the particular year of the conducted examination read by the heat-meters.
YearSUC1SUC2SUC3SUC4SUC5SUC6SUC7SUC8SUC9
20031062662.98215325927550.341761.82245.962736531.9
20041031.2650.362148.82421.47323.2817361924.64651.5 *4274.8 *
20051032.4643.62189.22505.67556.951768.31901.34143.92536
2006794.5 *6631716.7 *2347.97425.351675.51968.14058.43201.4
2007434.4546.9 *1010.81683.9 *4636.12 *1544.31816.24056.23101.9
2008441501.41042.251146.92970.31038.3 *1701.6 *4064.92910.1
2009434.2473.81071.41118.43153.72727.41251.13742.22641.8
2010500329.51235.81295.43575.89993.71460.13485.52313.8
* transition year.
Table 4. Evaluation of energy savings and Primary Energy Factor for Heating after retrofitting.
SUC1SUC2SUC3SUC4SUC5SUC6SUC7SUC8SUC9
PEFH,0 [kWh/(m2·a)]156.4146.1108.8107.6115.0104.7123.3106.7106.7
Table 5. Adjusted Annual Energy Consumption (AECH), Final Energy Factor (FEF) and Primary Energy Factor (PEFH) for heating achieved from the heat meter readouts in the particular year of the research.
SUC1SUC2
YearQ0(Q′0) [GJ/a]FEFH [kWh/m2a]PEFH [kWh/m2a]Q0(Q′0) [GJ/a]FEFH [kWh/m2a]PEFH [kWh/m2a]
20031031.2397.29317.83643.8286.11228.89
20041062.1409.21327.37669.9297.72238.18
20051027.2395.76316.61640.4284.61227.69
2006802.4 *309.16 *247.32 *669.6297.61238.09
2007451.8174.05139.24568.8 *252.79 *202.23 *
2008476.3183.50146.80541.5240.67192.54
2009452.9174.48139.58494.2219.63175.71
2010448.5172.79138.23295.6131.36105.09
SUC3SUC4
YearQ0(Q′0) [GJ/a]FEFH [kWh/m2a]PEFH [kWh/m2a]Q0(Q′0) [GJ/a]FEFH [kWh/m2a]PEFH [kWh/m2a]
20032090.6160.24128.192516.8202.17161.74
20042213.3169.65135.722494.0200.34160.28
20052178.3166.96133.572493.1200.27160.21
20061733.9 *132.90 *106.32 *2371.4190.49152.39
20071051.280.5864.461751.3 *140.68 *112.54 *
20081125.686.2869.021238.799.5079.60
20091117.585.6568.521166.593.7074.96
20101108.584.9767.971162.093.3474.67
SUC5SUC6
YearQ0(Q′0) [GJ/a]FEFH [kWh/m2a]PEFH [kWh/m2a]Q0(Q′0) [GJ/a]FEFH [kWh/m2a]PEFH [kWh/m2a]
20037331.4174.75139.801710.7166.44133.15
20047543.0179.79143.831788.1173.97139.18
20057519.2179.22143.381759.5171.19136.95
20067499.6178.76143.001692.3164.65131.72
20074821.6 *114.92 *91.94 *1606.1156.26125.01
20083207.976.4661.171121.4 *109.10 *87.28 *
20093289.378.4062.72758.773.8259.05
20103207.676.4561.16891.386.7269.38
SUC7SUC8
YearQ0(Q′0) [GJ/a]FEFH [kWh/m2a]PEFH [kWh/m2a]Q0(Q′0) [GJ/a]FEFH [kWh/m2a]PEFH [kWh/m2a]
20032180.8151.44121.156091.1183.59146.87
20041982.3137.66110.134791.0 *144.40 *115.52 *
20051891.8131.37105.104123.2124.2799.42
20061987.8138.04110.434099.0123.5498.84
20071888.8131.17104.944218.4127.14101.72
20081837.7 *127.62 *102.10 *4390.1132.32105.85
20091304.990.6272.493903.1117.6494.11
20101309.790.9572.763126.594.2375.39
SUC9
YearQ0(Q′0) [GJ/a]FEFH [kWh/m2a]PEFH [kWh/m2a]
20036342.5191.16152.93
20044403.0 *132.71 *106.17 *
20052523.376.0560.84
20063233.497.4677.96
20073226.097.2377.79
20083142.994.7375.78
20092755.483.0566.44
20102075.562.5650.04
* transition year.
Table 6. Averaged values of the Adjusted Energy Consumption before, during and after the transition year together with comparison of the energy savings.
ObjectQ0 before [GJ/a]Q0 Transition Year
[GJ/a]
Q0 after [GJ/a]ΔQ%,avg [%]ΔQ%,min [%]ΔQ%,max [%]
SUC11040.2802.0457.456.054.256.9
SUC2651.3568.5295.654.6--
SUC32160.71733.91100.749.147.951.3
SUC42468.81751.31189.051.849.852.9
SUC57473.34821.63234.956.756.057.1
SUC61711.31121.4825.051.847.955.7
SUC71986.31837.71307.334.234.134.3
SUC86091.14791.03976.734.7 *27.9 *48.7 *
SUC96342.54403.02826.155.4 *49.0 *67.3 *
* related to only the first year of the monitored period before thermo-modernization (2003).
Table 7. Heat consumption values before and after thermo-modernization according to energy audits (theoretical calculations).
ObjectQ before [GJ/a]Q after
[GJ/a]
Energy Savings
[%]
SUC11324.9395.070.2
SUC89373.71662.682.3
SUC98472.41487.582.4

