Article

Power and Frequency Control in the National Power System of the 370 MW Coal Fired Unit Superstructured with a Gas Turbine

1
Department of Power Engineering Management, Opole University of Technology, 45-758 Opole, Poland
2
Department of Thermal Technology, Silesian University of Technology, 44-100 Gliwice, Poland
3
Department of Electrical Engineering, Czestochowa University of Technology, 42-201 Częstochowa, Poland
*
Author to whom correspondence should be addressed.
Energies 2020, 13(10), 2432; https://doi.org/10.3390/en13102432
Submission received: 30 March 2020 / Revised: 8 May 2020 / Accepted: 9 May 2020 / Published: 12 May 2020
(This article belongs to the Section A1: Smart Grids and Microgrids)

Abstract

:
A very important task of power units with high power capacity is their participation in the control of the national power system. One of the most important questions posed at work is whether a 370 MW power unit superstructured with a gas turbine in parallel and a heat recovery steam generator be able to take part in the national power system control and if such an upgrade will be economically effective. The analysis was carried out using a proprietary and novel mathematical model. The model takes into account, among others, the influence of the ambient temperature on the parameters of the gas turbine and the changes in thermal steam parameters at its steam extractions as a result of load changes. The results of the analyses showed that it is possible for the modernized unit to participate in the power system control. It can be done only by using a gas turbine with a variable power and a shut off option. The presented results of economic calculations show that at price and cost levels assumed for calculations, the turbine gas superstructure is at the threshold of viability and the investment carries a high degree of risk.

1. Introduction

One of the extremely important tasks of power units with ultra-high rated power is their share in the balancing of the national power system. It takes place at a hierarchic (master) balancing system as part of the automatic frequency and power generation control that adapts the active power generated within the national power system to current needs (the so-called power balancing). Automatic frequency and power generation control is a central balancing system that adjusts the control valve opening in high-pressure turbine parts, thus changing the steam input. As a result, the processes of boiler output change are enabled implemented by their independent control systems in individual power plants. In addition to power balancing, automatic frequency and power generation control provides high quality electric power, i.e. fixed voltage and frequency values. At the same time, it is frequency, which is obvious, that is the value used to control (balance) active power within the system. It depends directly on the balancing (equalizing) state of the power received by customers with the power generated by power units operating in the national power system. The surplus of power generated over the power absorbed (positive power balance error) increases the frequency (positive frequency error) and vice versa, shortage of power generated over the absorbed power reduces the frequency value.
Equalizing power generated with power absorbed by customers is carried out centrally by the national power dispatching centre. The national power dispatching centre monitors the exchange power i.e. the difference between power generated and power absorbed as well as frequency in the national power system on a continuous basis. This system-based balancing carried out by central controllers of the automatic frequency and power generation control is referred to as secondary balancing (the so-called second level control) and is designed to determine subsequent new pre-set values on a continuous basis for power units and inputting them via telemetry transmitters to turbine controllers in individual system power units and resetting the deviation as well as the exchange power error within the system. Control stage one, the so-called primary balancing, i.e. turbogenerator RPM control (i.e. primary frequency control), is decentralized. This is because it is executed by independent turbine control systems at individual power plants. The primary control is used to eliminate active power balance disturbance as soon as possible in the national power system. For a power unit synchronized with the system it is carried out by changing the active power depending on the frequency error in the national power system in accordance with the static turbine RPM controller characteristics, which usually takes between ten and twenty seconds. The primary control, as a proportional control, cannot fully eliminate the static frequency error (deviation), which can only be fully eliminated by the secondary proportional-integral control that superposes on the primary control. Control stage three, the so-called tertiary control, provides economic distribution of loads between power units operating within the national power system control.
Controlling the national power system requires knowing the power unit operation, i.e. knowing thermodynamic processes inside it, its dynamics, power unit operation management technique, etc. While the fundamental parameter for power unit power control in the system is the frequency, it is the range of their possible load changes that is fundamental for the participation of power units in the power and frequency control system of the national power system. It is obvious that power units with low power ranges cannot take part in the control operation of the national power system.
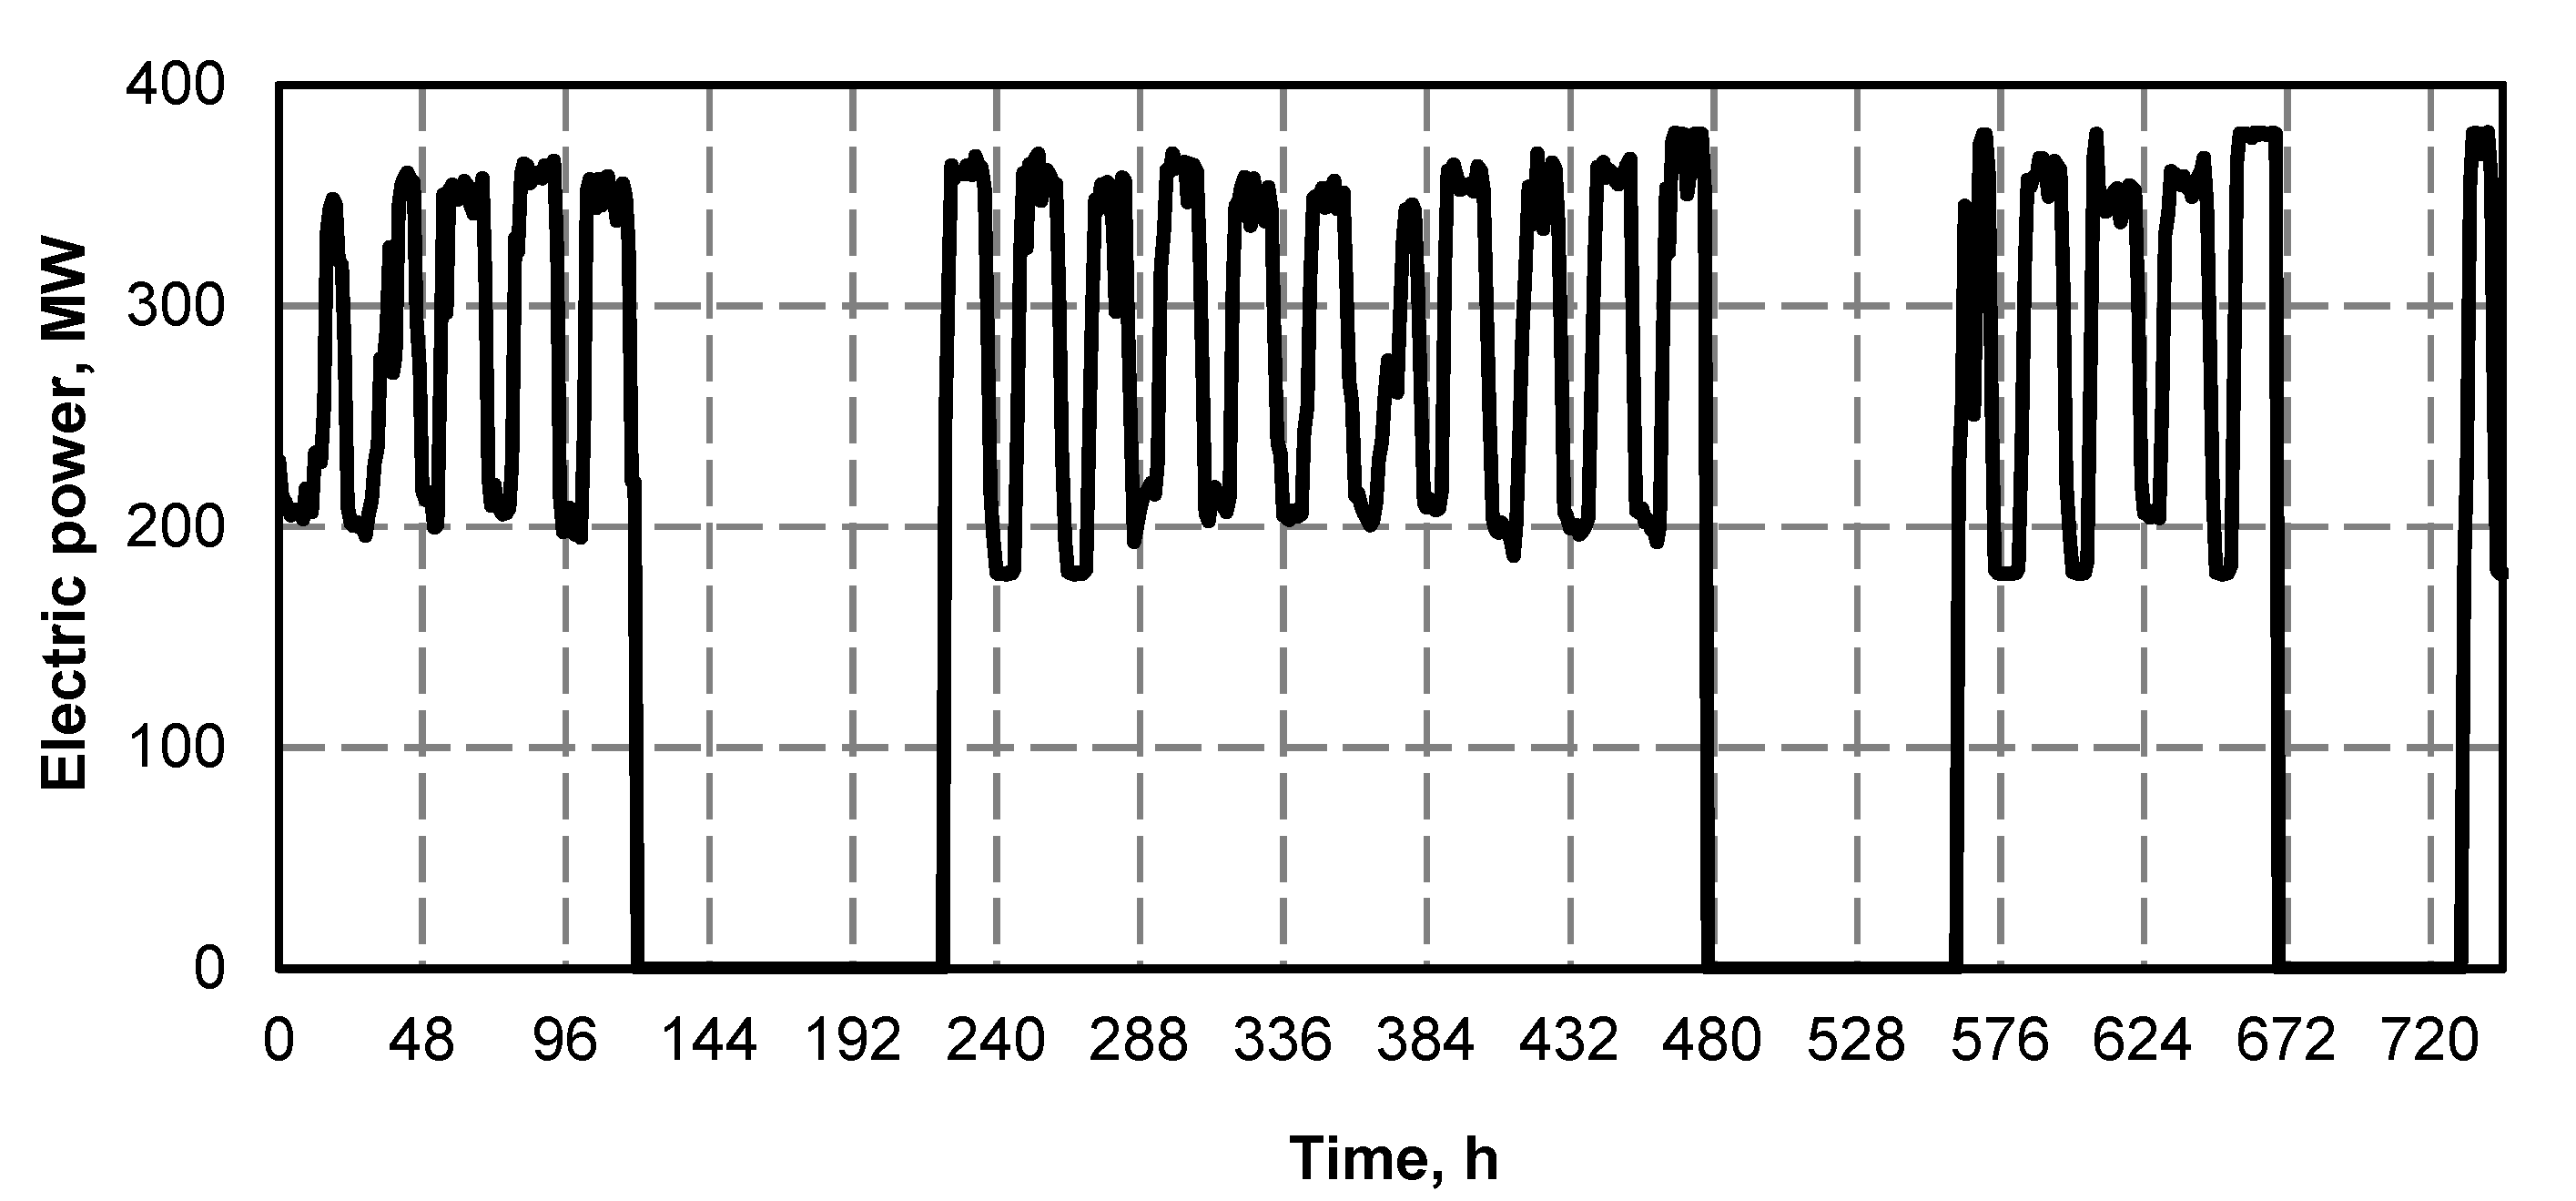
The control operation of a power unit with a rated power of 370 MW is most commonly confined to operating at an electric power ranging from about 180 MW during the night power absorption drop (night valley) to a maximum permanent power of about 380 MW during the daily peak power absorption period. The percentage range of power unit power changes is about 55% of its maximum power (Figure 1 and Figure 2).
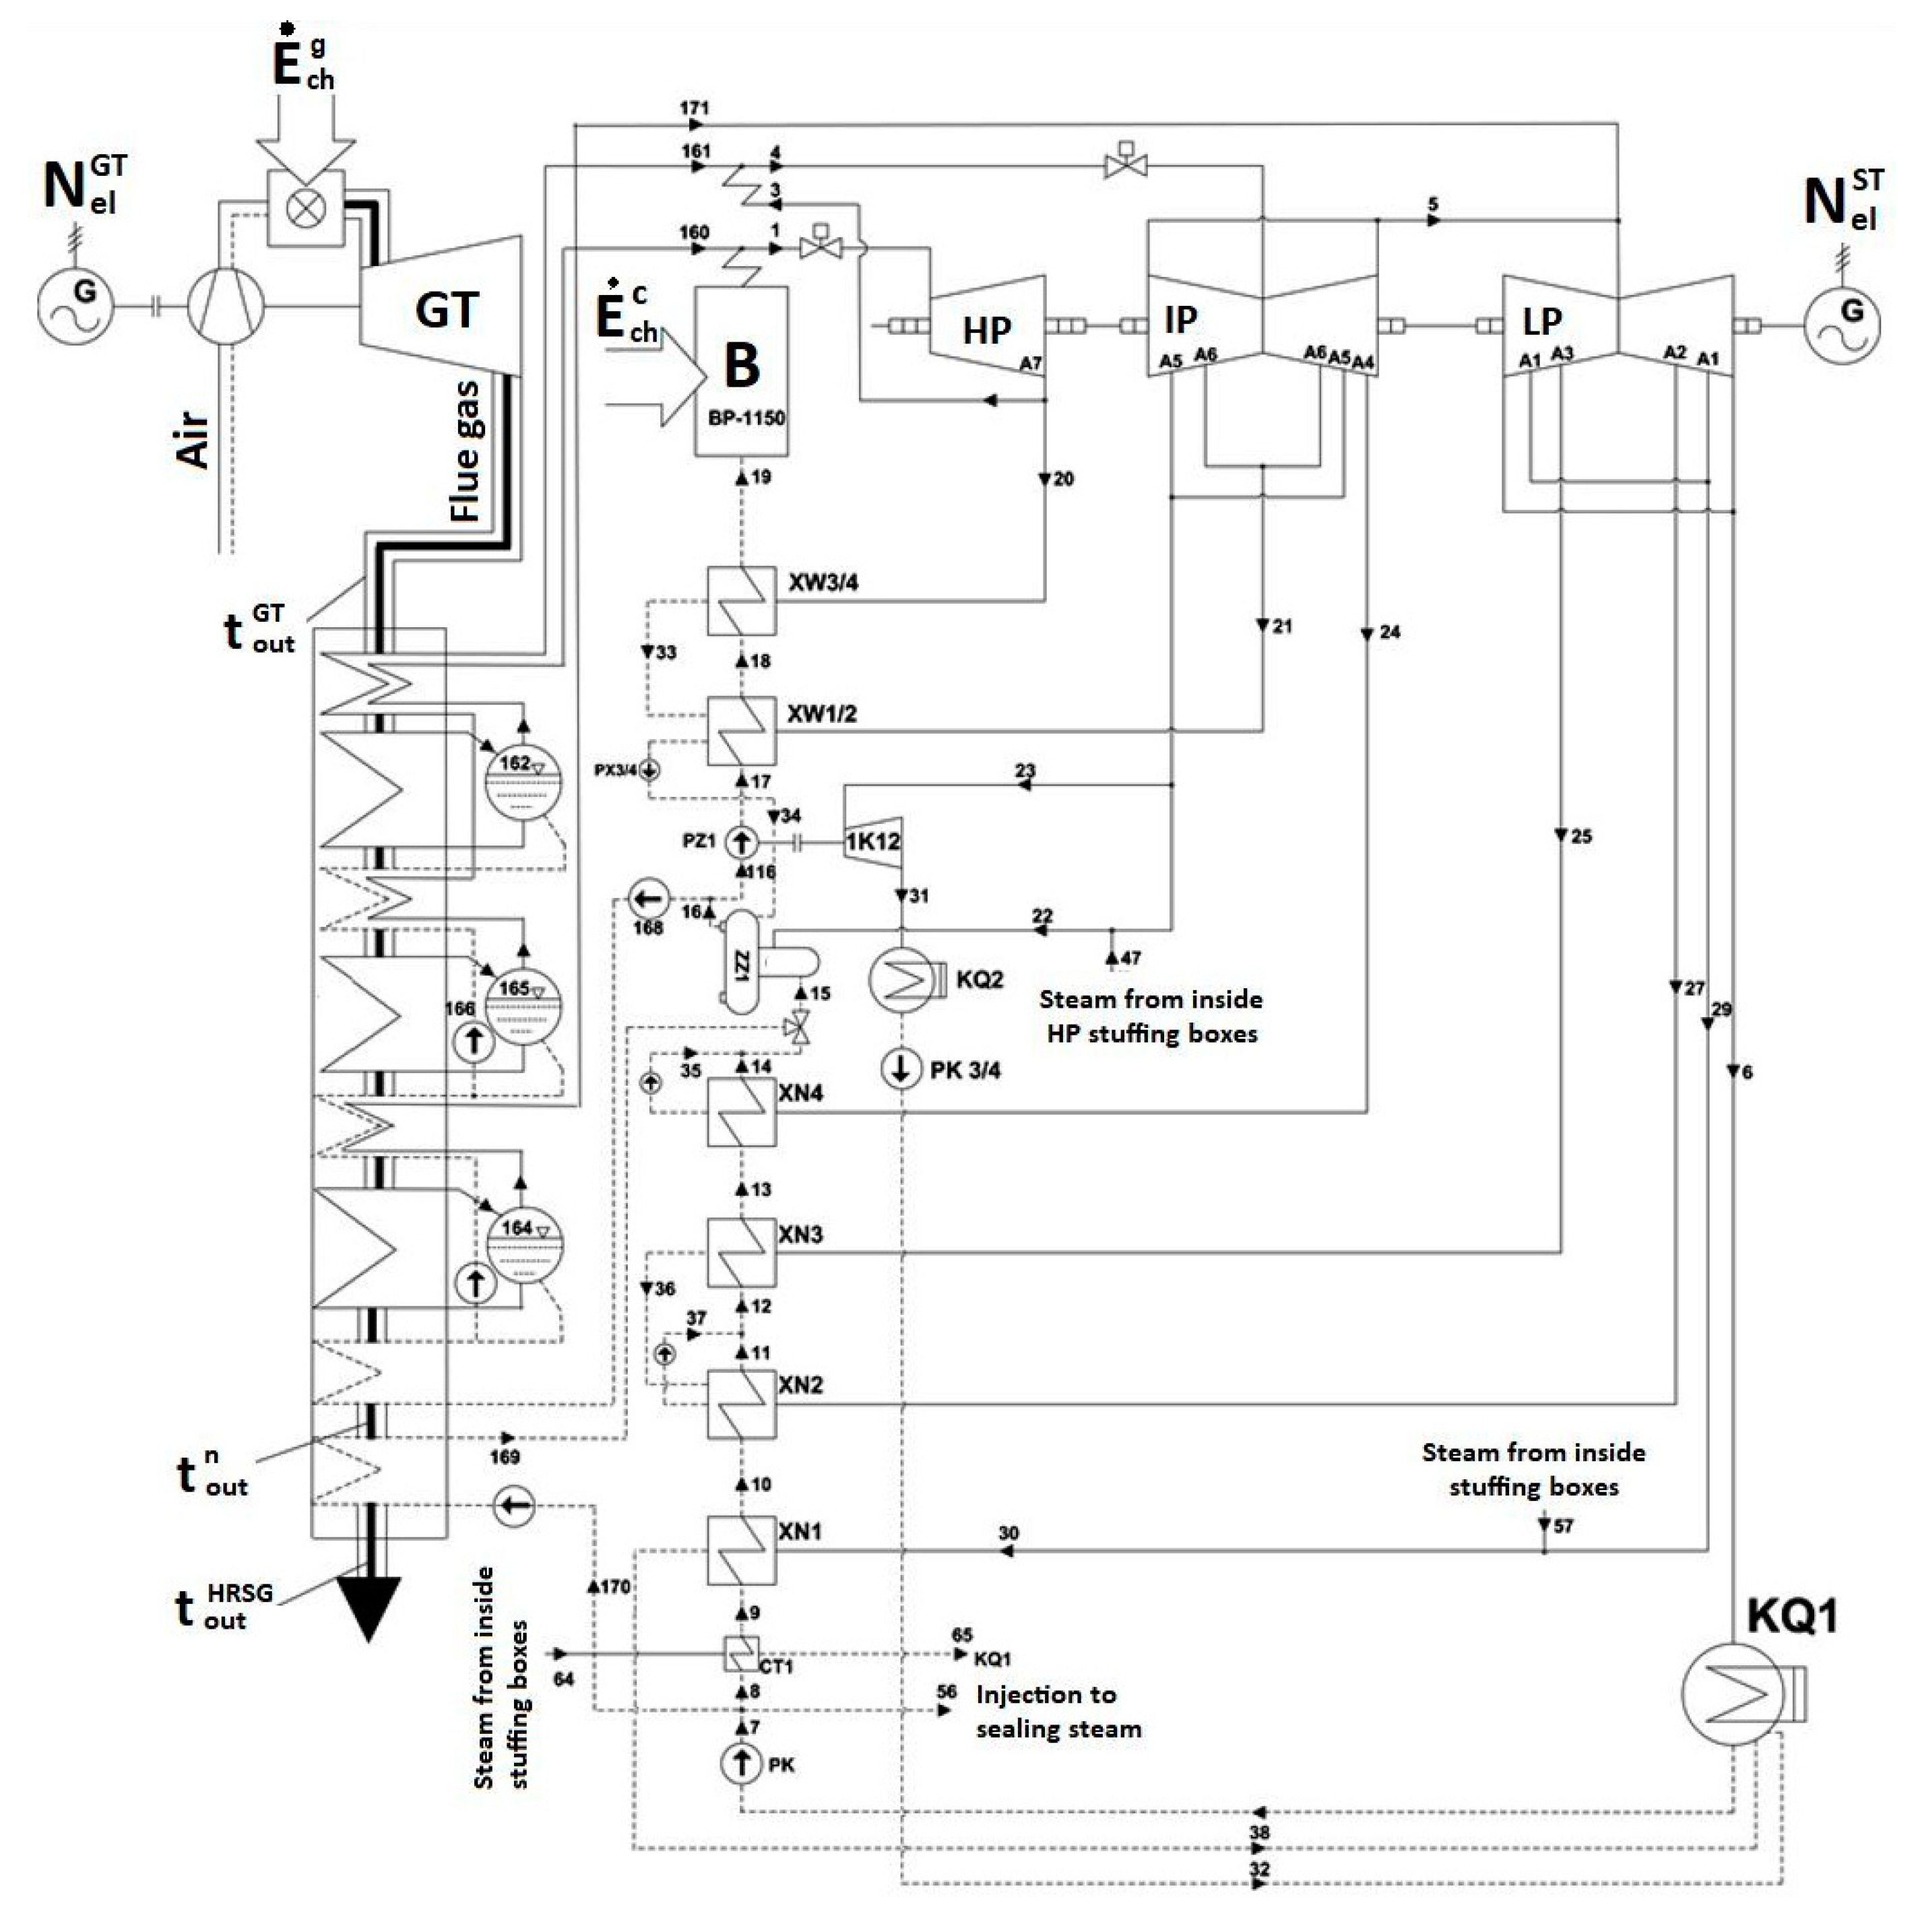
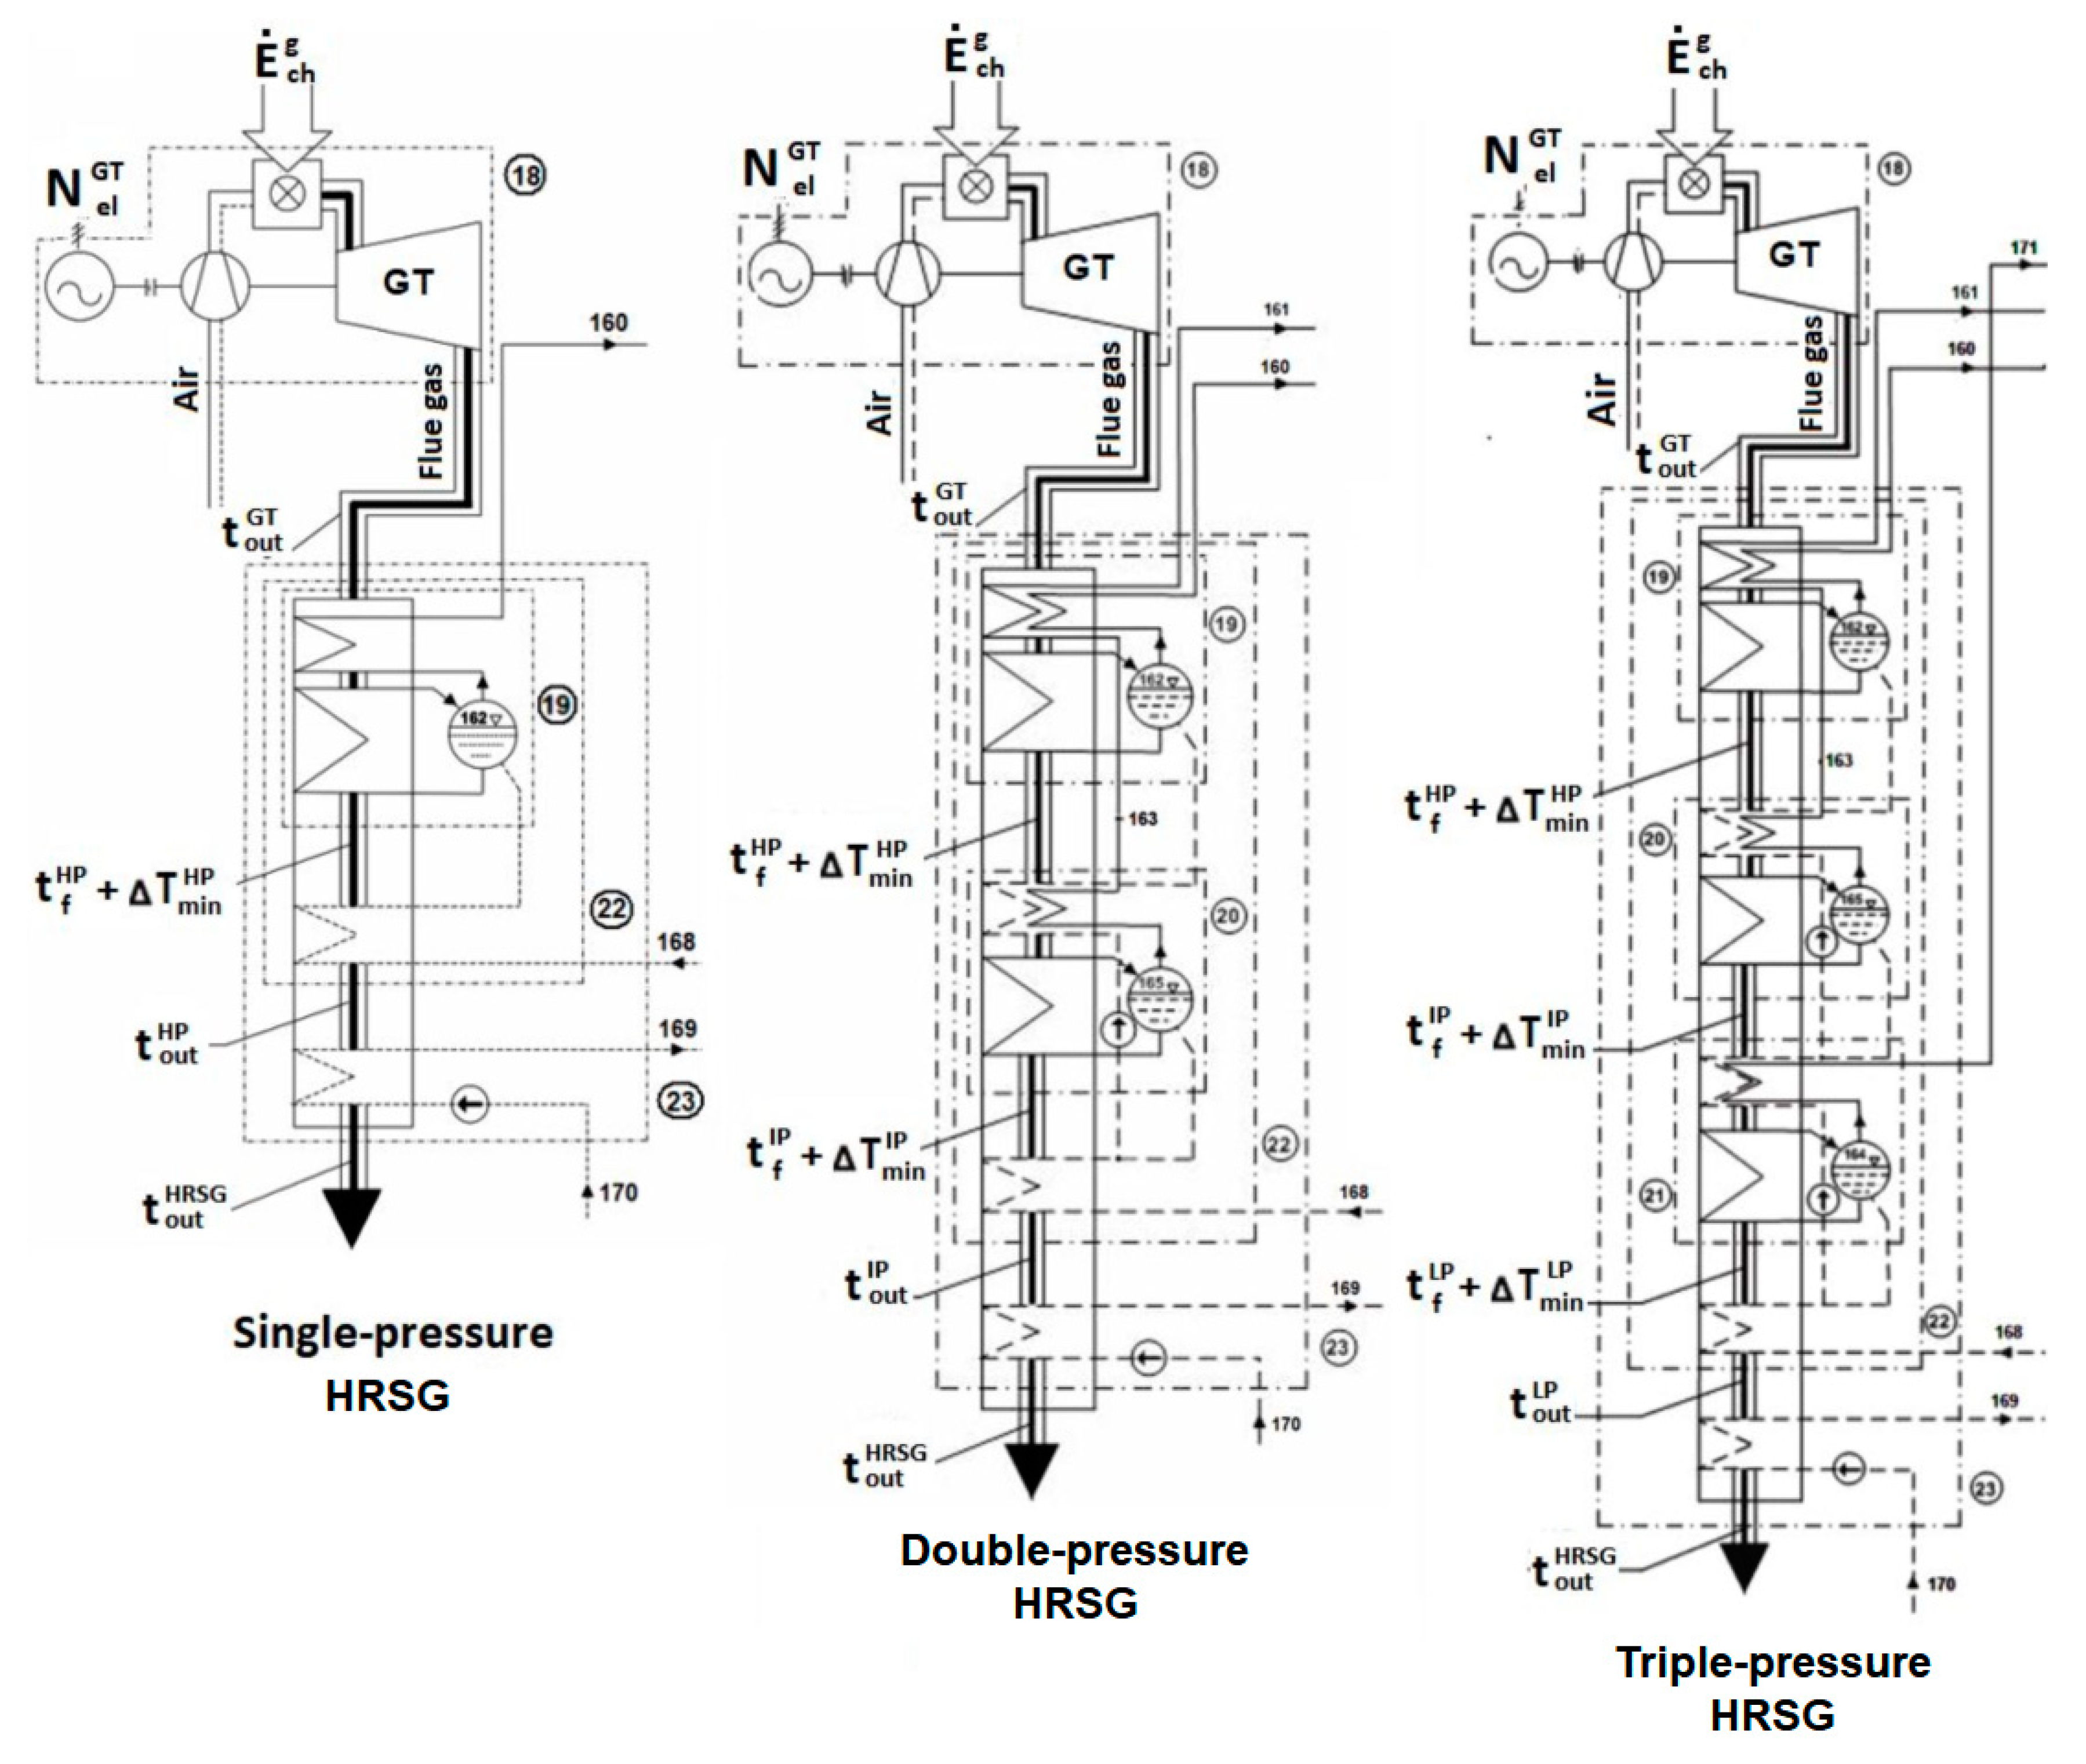
Considering the abovementioned it is important to answer the following questions: (1) How does the superstructure of 370 MW power unit with a single gas turbine in parallel (Figure 3) affect the change in its available power range? (2) Is the minimum achievable load in compliance with the grid demand trends? (3) How does the gas turbine power affect the available power range? (4) How is the available power range affected by the number of pressure stages (Figure 4) in the heat recovery steam generator (HRSG)? (5) Should the gas turbine operate under its fixed rated load, i.e. at its maximum energetic efficiency, or at the same time, at a variable power?
Moreover, there are no such analyses in the literature. The available sources focus mainly on the advantages related to the increase of efficiency, reduction of specific emission of pollutants or increase of power [1,2,3,4,5,6,7,8,9,10,11,12,13,14,15,16,17]. Some sources also describe cogeneration systems with gas turbine [18,19] and trigeneration system with gas turbine [20,21,22]. For example, in the works [2,3] the influence of gas turbine superstructure existing under-utilized WTE power plant was studied. The carried out analysis shows that power output increase even up to three times and efficiency increase in the range of 8–15% points can occur, depending on the GT model and layout selection. In the paper [4], various variants of reducing CO2 emissions to the 420 kg/MWh net for new coal plants and existing coal plants required by the Canadian government were analysed. The calculations have shown that repowering existing steam turbines with new natural gas combined-cycle plant without any additional CO2 abatement, delivered both the lowest capital costs and cost of electricity. In the works [5,7,11] the use of exhaust gases from a gas turbine for regeneration of fed water supplying a steam boiler was analysed. The authors emphasized the increase in efficiency, reduction of carbon dioxide emissions and increase in installed capacity. The reduction of carbon dioxide emissions and related costs was also analysed in [8]. In [11] the effects of three HRSG pressure levels on the performance of existing boiler and turbines for Montazeri Steam Power Plant in Iran were analysed. The results show that a single-pressure level HRSG with a reheat is recommended. If one-pressure level HRSG and a gas turbine Mitsubishi-701G2, net energy and exergy efficiencies and produced power will increase 52.19%, 50.9% and 485.8 MW, respectively.
In the literature there is some evidence that combining with natural gas, deeply exploring the energy saving potential in coal-fired and can provide an effective way for solving the problems with higher energy consumption of coal plants [23]. Another interesting article about combined cycle power plant (CCPP) [24] presents energetic and exergetic analyses are conducted using operating data for Sabiya. In the work [25], the results are reported of the energy and exergy analyses of three biomass-related processes for electricity generation: the biomass gasification integrated externally fired combined cycle, the biomass gasification integrated dual-fuel combined cycle, and the biomass gasification integrated post-firing combined cycle. The energy efficiency for the biomass gasification integrated post-firing combined cycle is 3% to 6% points higher than for the other cycles. In [26] gas turbine power plant is analyzed among others for simultaneous production of electricity by combining steam Rankine cycle using heat recovery steam generator (HRSG) with presentation of economic and environmental benefits. In [27] the authors present an attempt to the valuation of the operational flexibility of the energy investment project based on the example of combined cycle gas turbine (CCGT). For this purpose, the real options approach (ROA), net present value (NPV) method, and the Monte Carlo (MC) simulation have been used. In [28] authors proved that increasing of geothermal steam quality by supplying exhaust gas from a gas turbine to the installation has a positive effect on the system efficiency and power. Paper [29] presents an off-design analysis of a gas turbine Organic Rankine Cycle (ORC) combined cycle. Combustion turbine performances are significantly affected by fluctuations in ambient conditions, leading to relevant variations in the exhaust gases’ mass flow rate and temperature. The effects of the variation of ambient air temperature have been considered in the simulation of the topper cycle and of the condenser in the bottomer one.
The maximum allowable gas turbine power ranges from 100% to 60% of its maximum rated value. The turbine efficiency decreases linearly down to approximately 85% of the rated efficiency under 60% of load (further reduction gradually converts the gas turbine just into a very expensive gas combustion chamber). The absolute value for the available range of power changes in the superstructured power unit increases significantly in this power generation management mode, as then it summarizes the ranges for both turbine sets. An alternative for the gas turbine set with a variable power could be to shut off the generation at a low power demand in the national power system and using the power unit control operation only within the available range of power change for the steam turbine set. However, the disadvantage of this operation is a step (not gradual) unit power reduction, the more intense, the higher is the value of gas turbine power. The operation of superstructured 370 MW power unit with a variable gas turbine power or fixed power with additional shut off option at a low power demand in the national power system forces us to answer another question: (6) At what price ratios between energy media will be all the above-mentioned gas turbine set operation variants economically viable?
To answer all the questions listed above a thermodynamic and economic analysis of the power unit operation were conducted. To do this its mathematical model was used [30]. The mathematical model was made using the Engineering Equation Solver program. It is based on mass and energy balances, energy characteristics of power unit equipment and steam and water state equations. It includes, importantly, the impact of ambient temperature on the changes of gas turbine power, its efficiency and flue gas temperature, which consequently affects also the changes in stream values and the thermal parameters of circulation medium, water and steam, in individual points of power unit under upgrade. The higher the gas turbine power, the higher the changes of those parameters. It is also important to use the Stodola-Flügel flow capacity equation in the model for the steam turbine to include the changes in thermal steam parameters at its steam extractions as a result of load changes. Then, the full range power values for manufactured gas turbines N e l , n G T ∈(0;350 MW) and all the types of recovery boilers, one-, two, and three-pressure ones used in practice, were considered (Figure 4). This is because the range of available power depends on the gas turbine power and the structure of recovery boiler. All boiler types were additionally fitted in their final zones, i.e. in the range of low temperature exhaust gases with a surface for low-pressure recovery partly replacing (at high gas turbine power, completely) the low-heater exchangers (XN1–XN4) surfaces powered from the low-pressure part of the steam turbine (LP) (Figure 3). It makes it possible to raise the power of the power unit under upgrade and both its energetic and exergetic efficiency. The analysis used an all-year hourly average curve of electric power imposed by the national power system. The analysis took into account power unit outages (Figure 2).

2. Discussion and Analysis of Thermodynamic Calculation Results

Below we present the results of thermodynamic analysis for the impact of the 370 MW power unit superstructured with a parallel gas turbine on its balancing (control) capacity.

2.1. Single-Pressure Boiler System

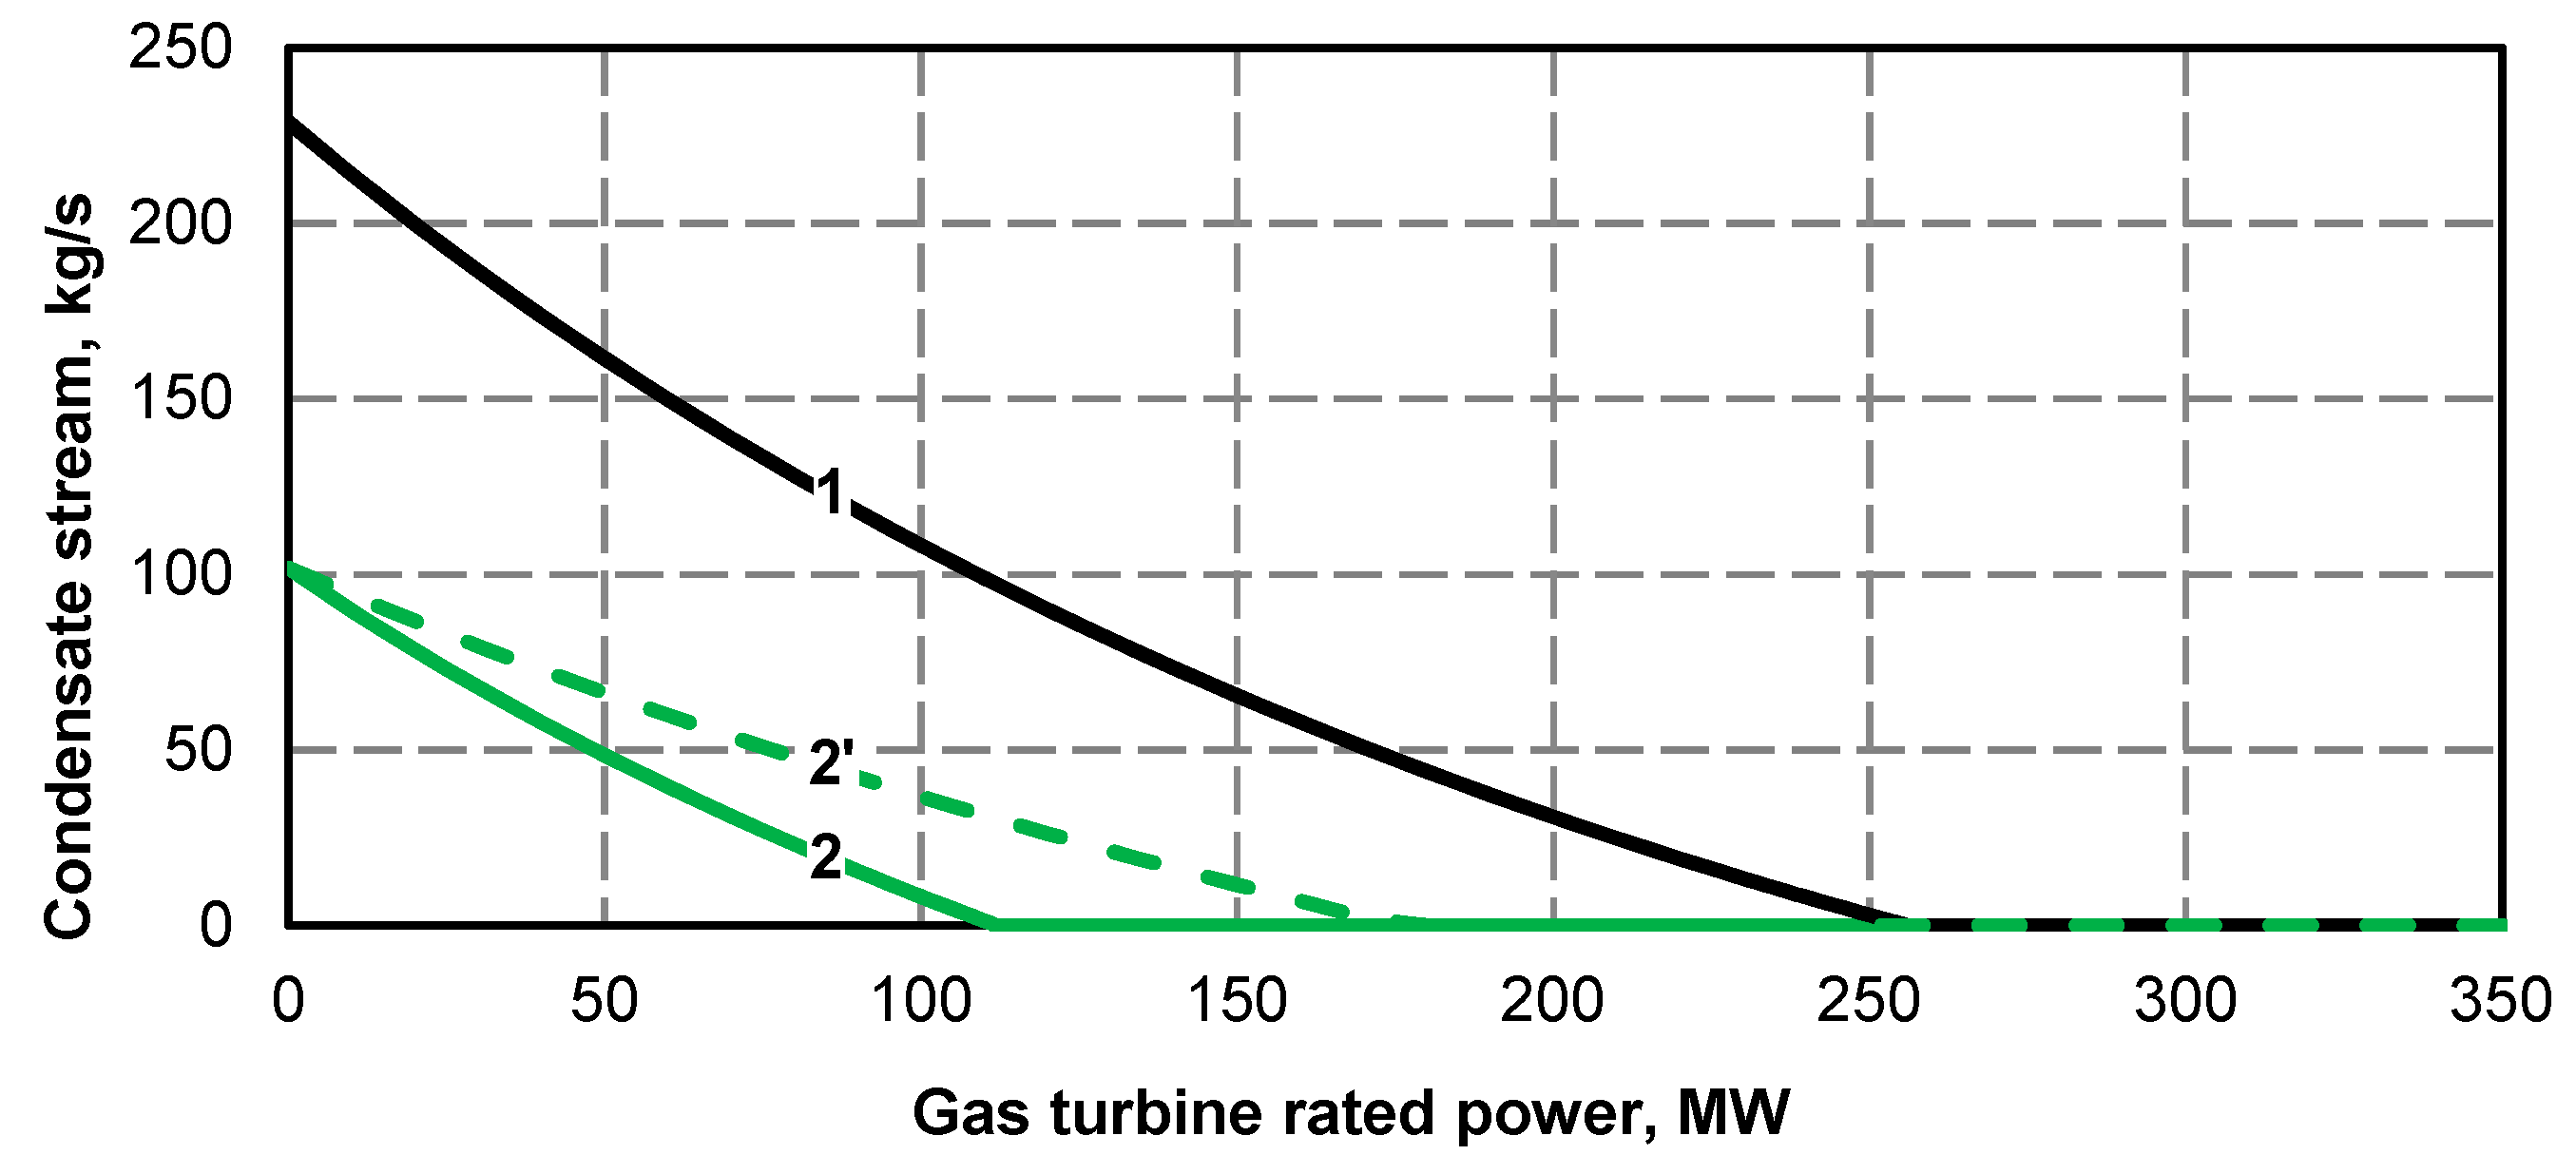
Figure 5 presents the changes in the condensate stream value delivered to the KQ1 condenser, (stream 8, Figure 3), resulting from adding a gas turbine superstructure to the power unit.
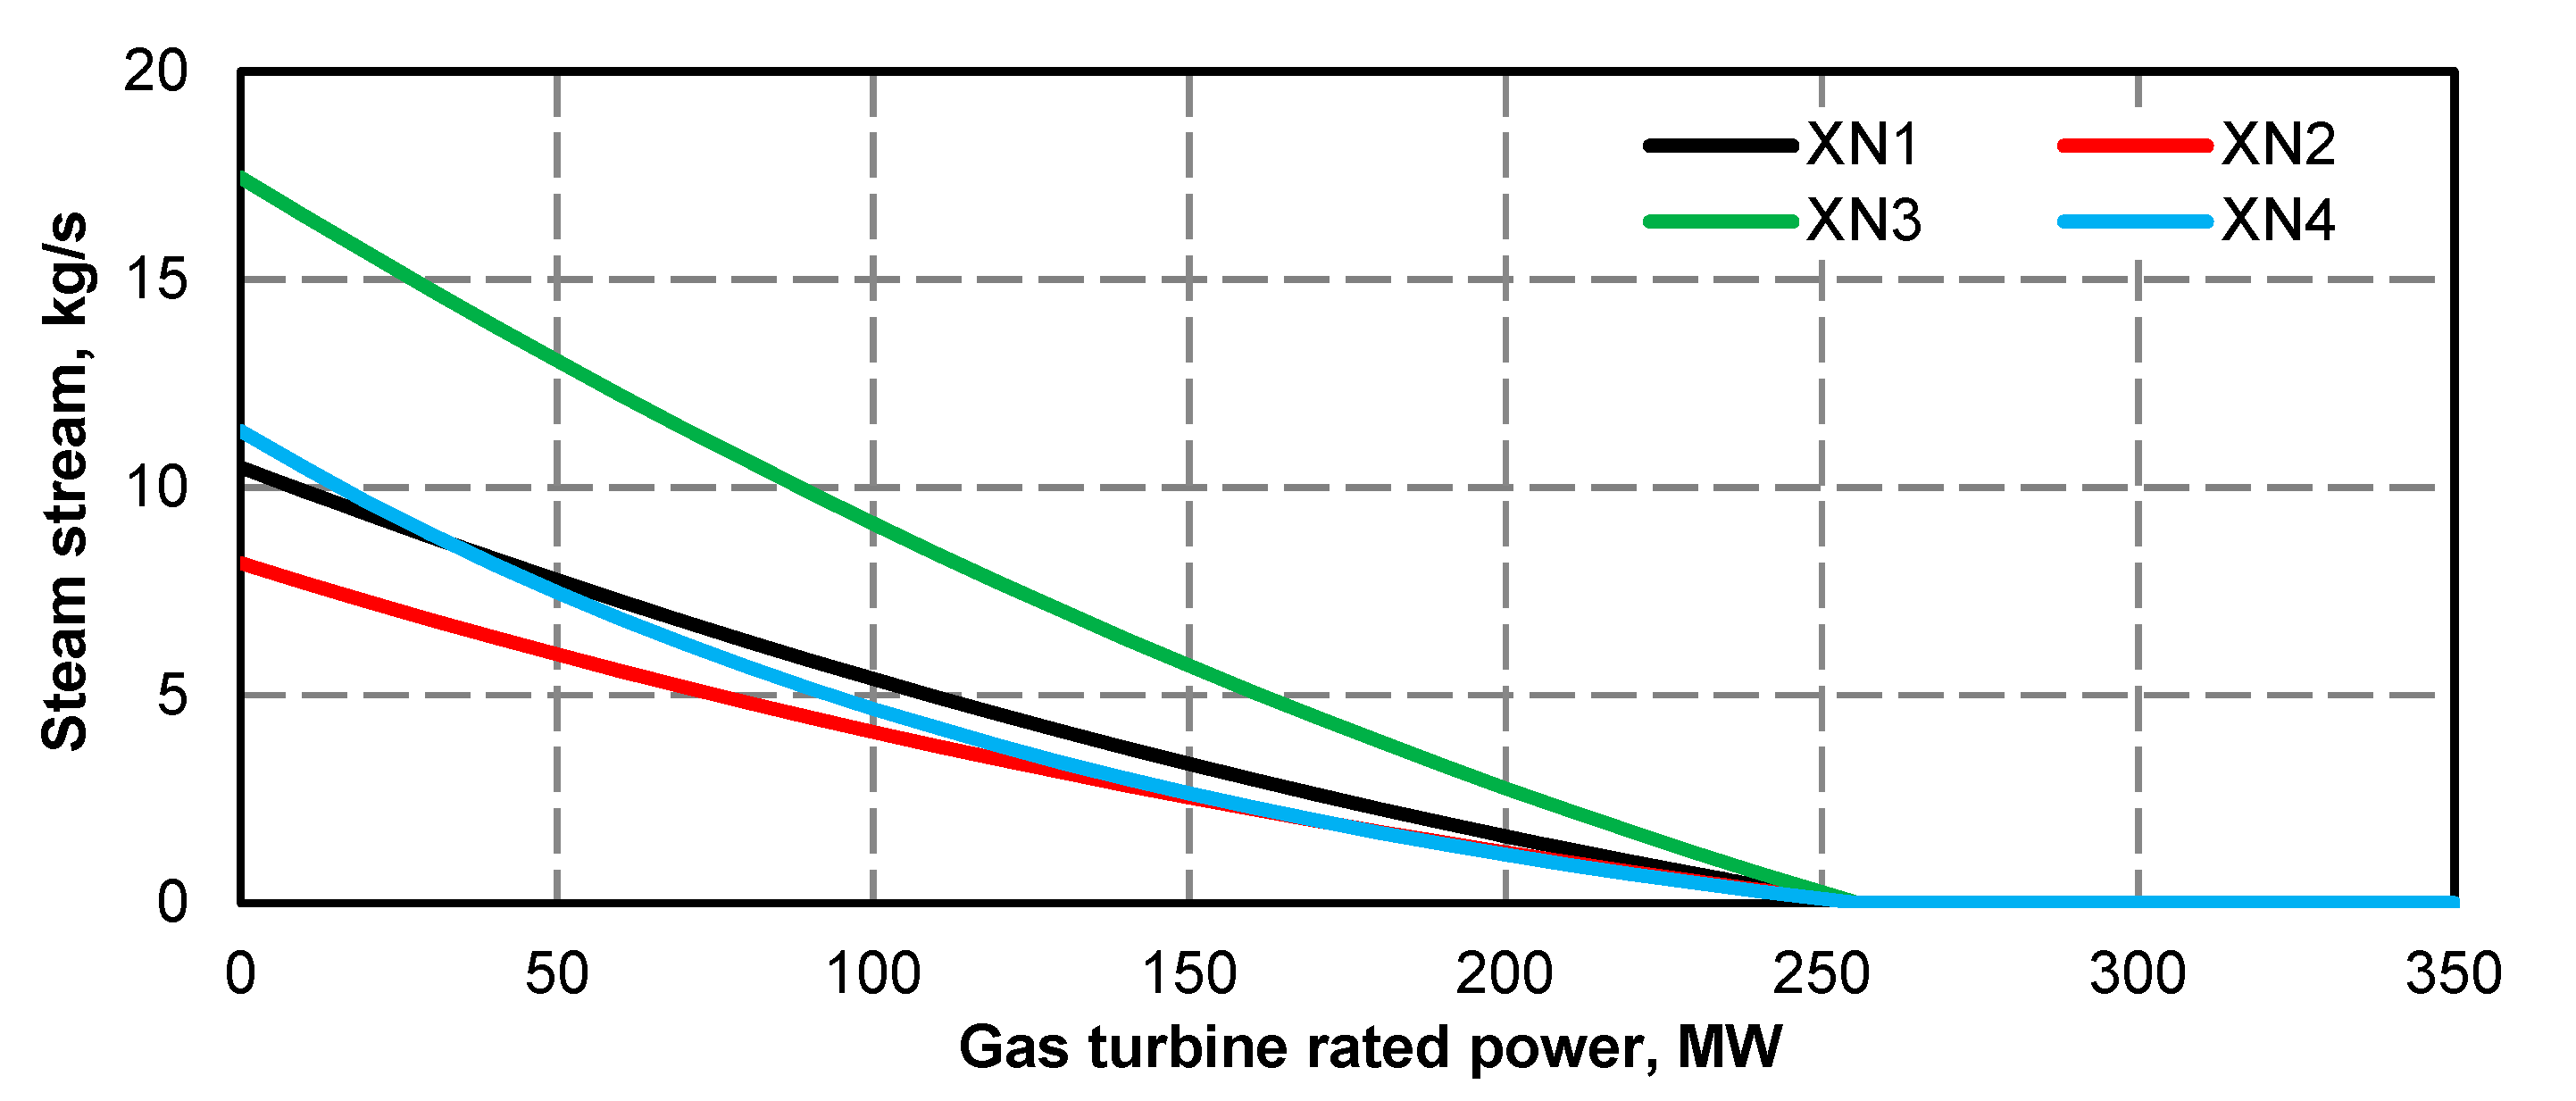
The lack of condensate stream as shown in Figure 5 makes that the exhaust heat from the recovery boiler is not fully used and its temperature rises above the assumed 90 °C. The higher the rated output of the gas turbine, the greater the flue gas flow through the recovery boiler. To take advantage of the enthalpy of this flux with an increase in the rated output of the gas turbine, the flux of condensate to the recovery boiler increases. The increase in the flow of condensate to the recovery boiler causes its reduction to the XN1-4 low-pressure regeneration exchangers. The smaller the flow of condensate to the XN1-4 exchangers, the smaller the steam flow to them.
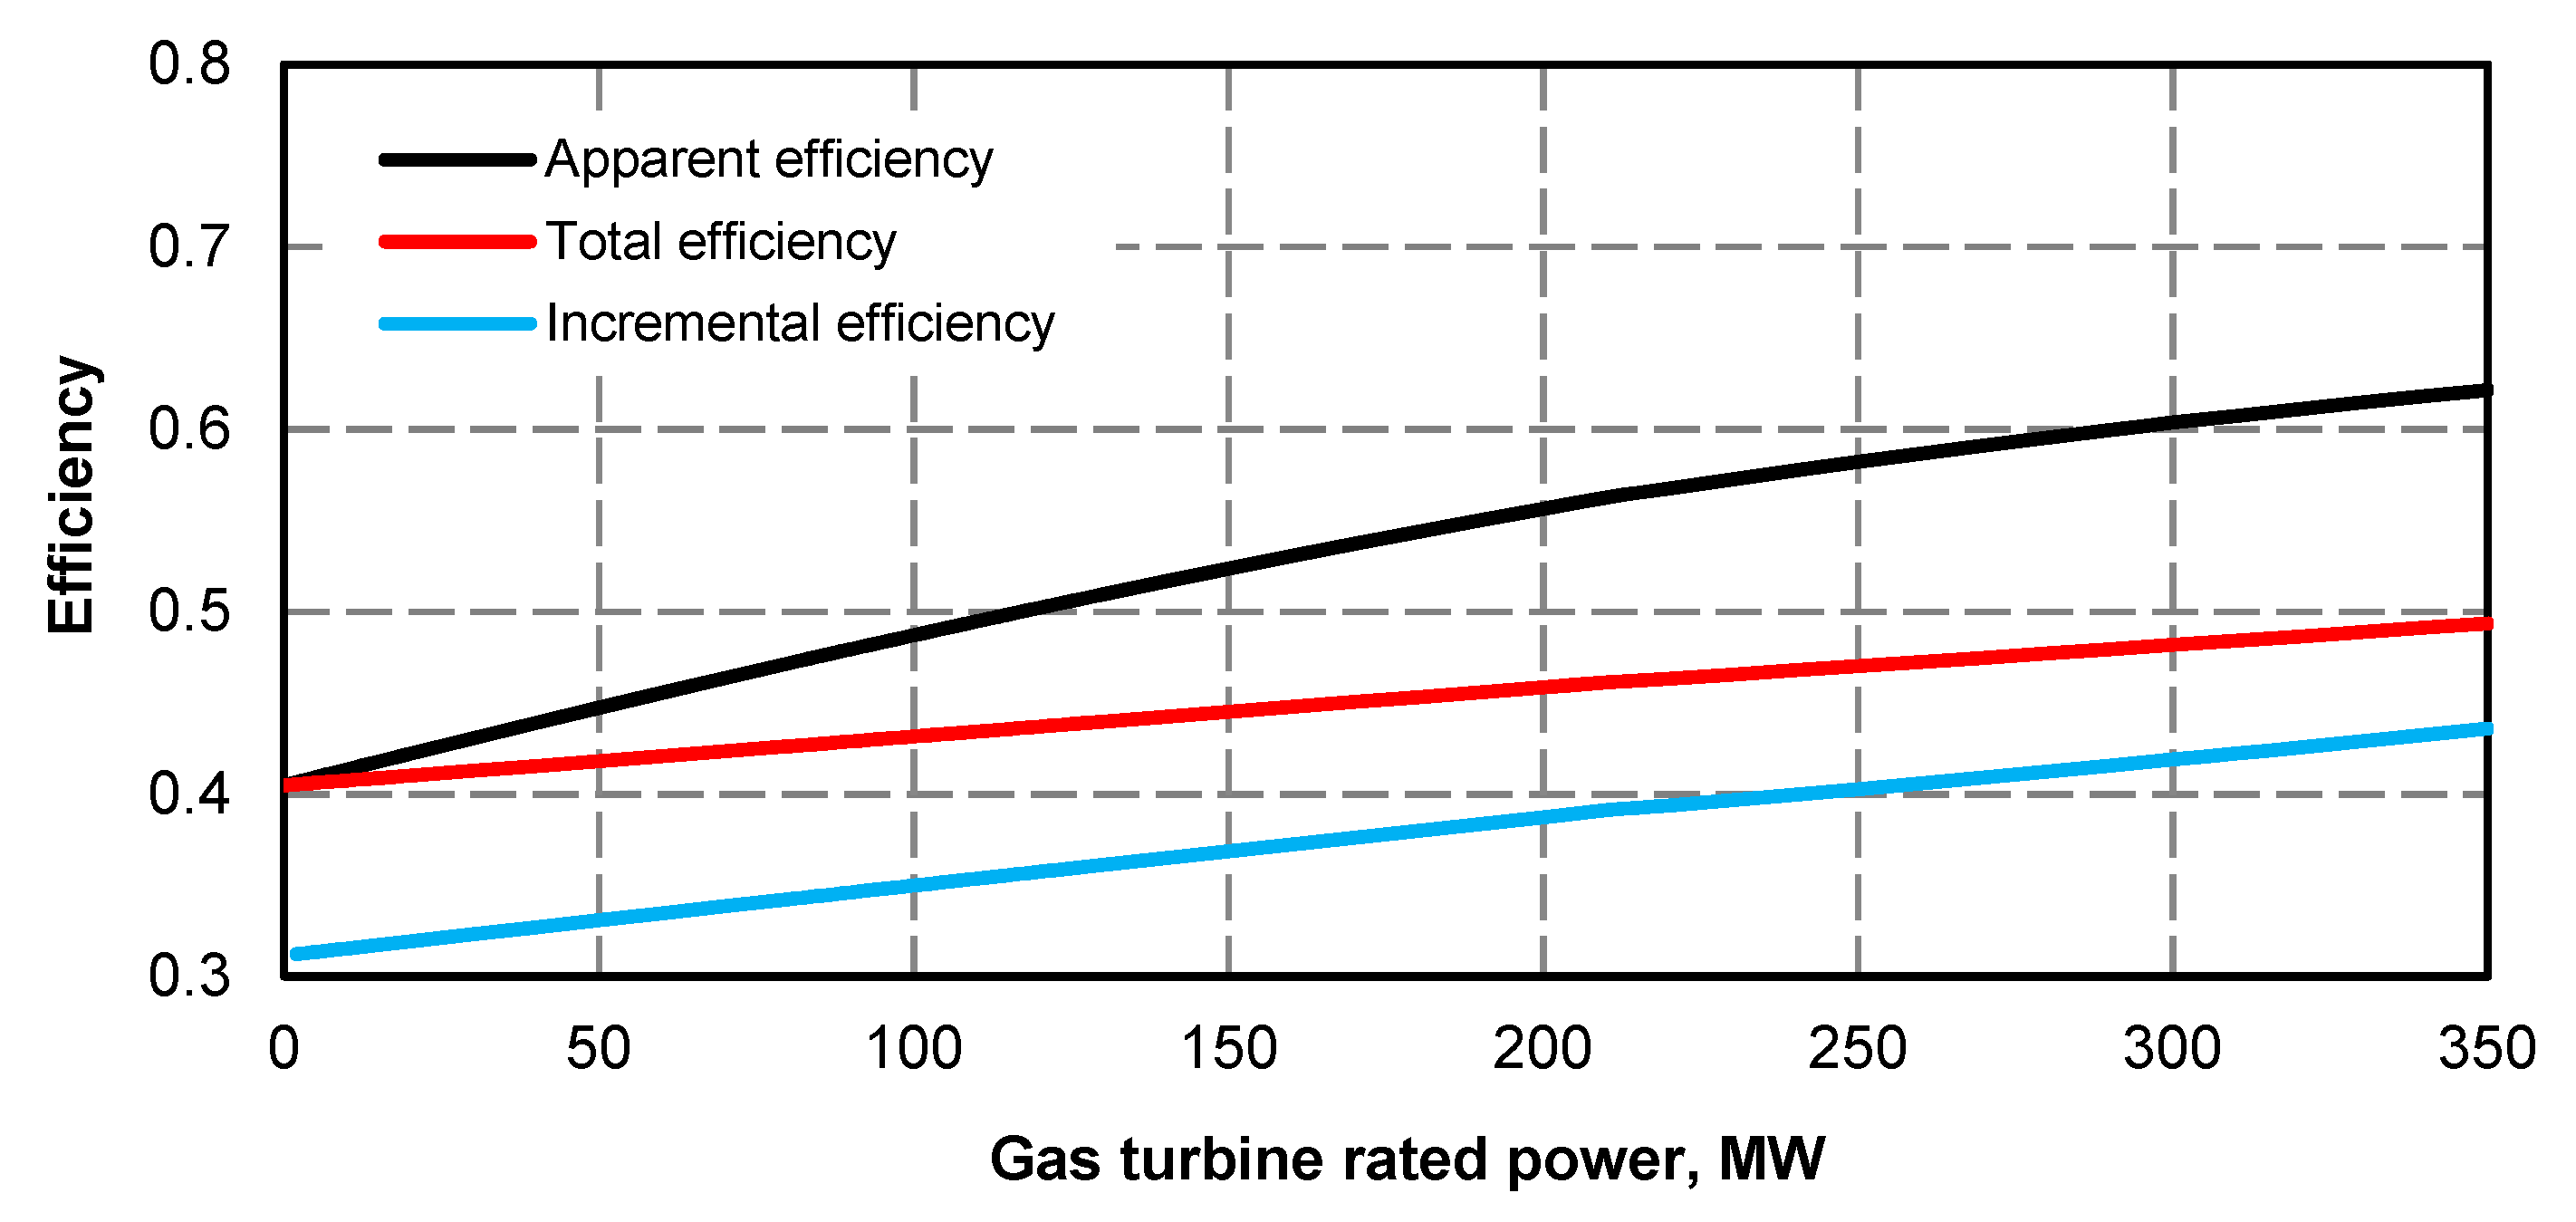
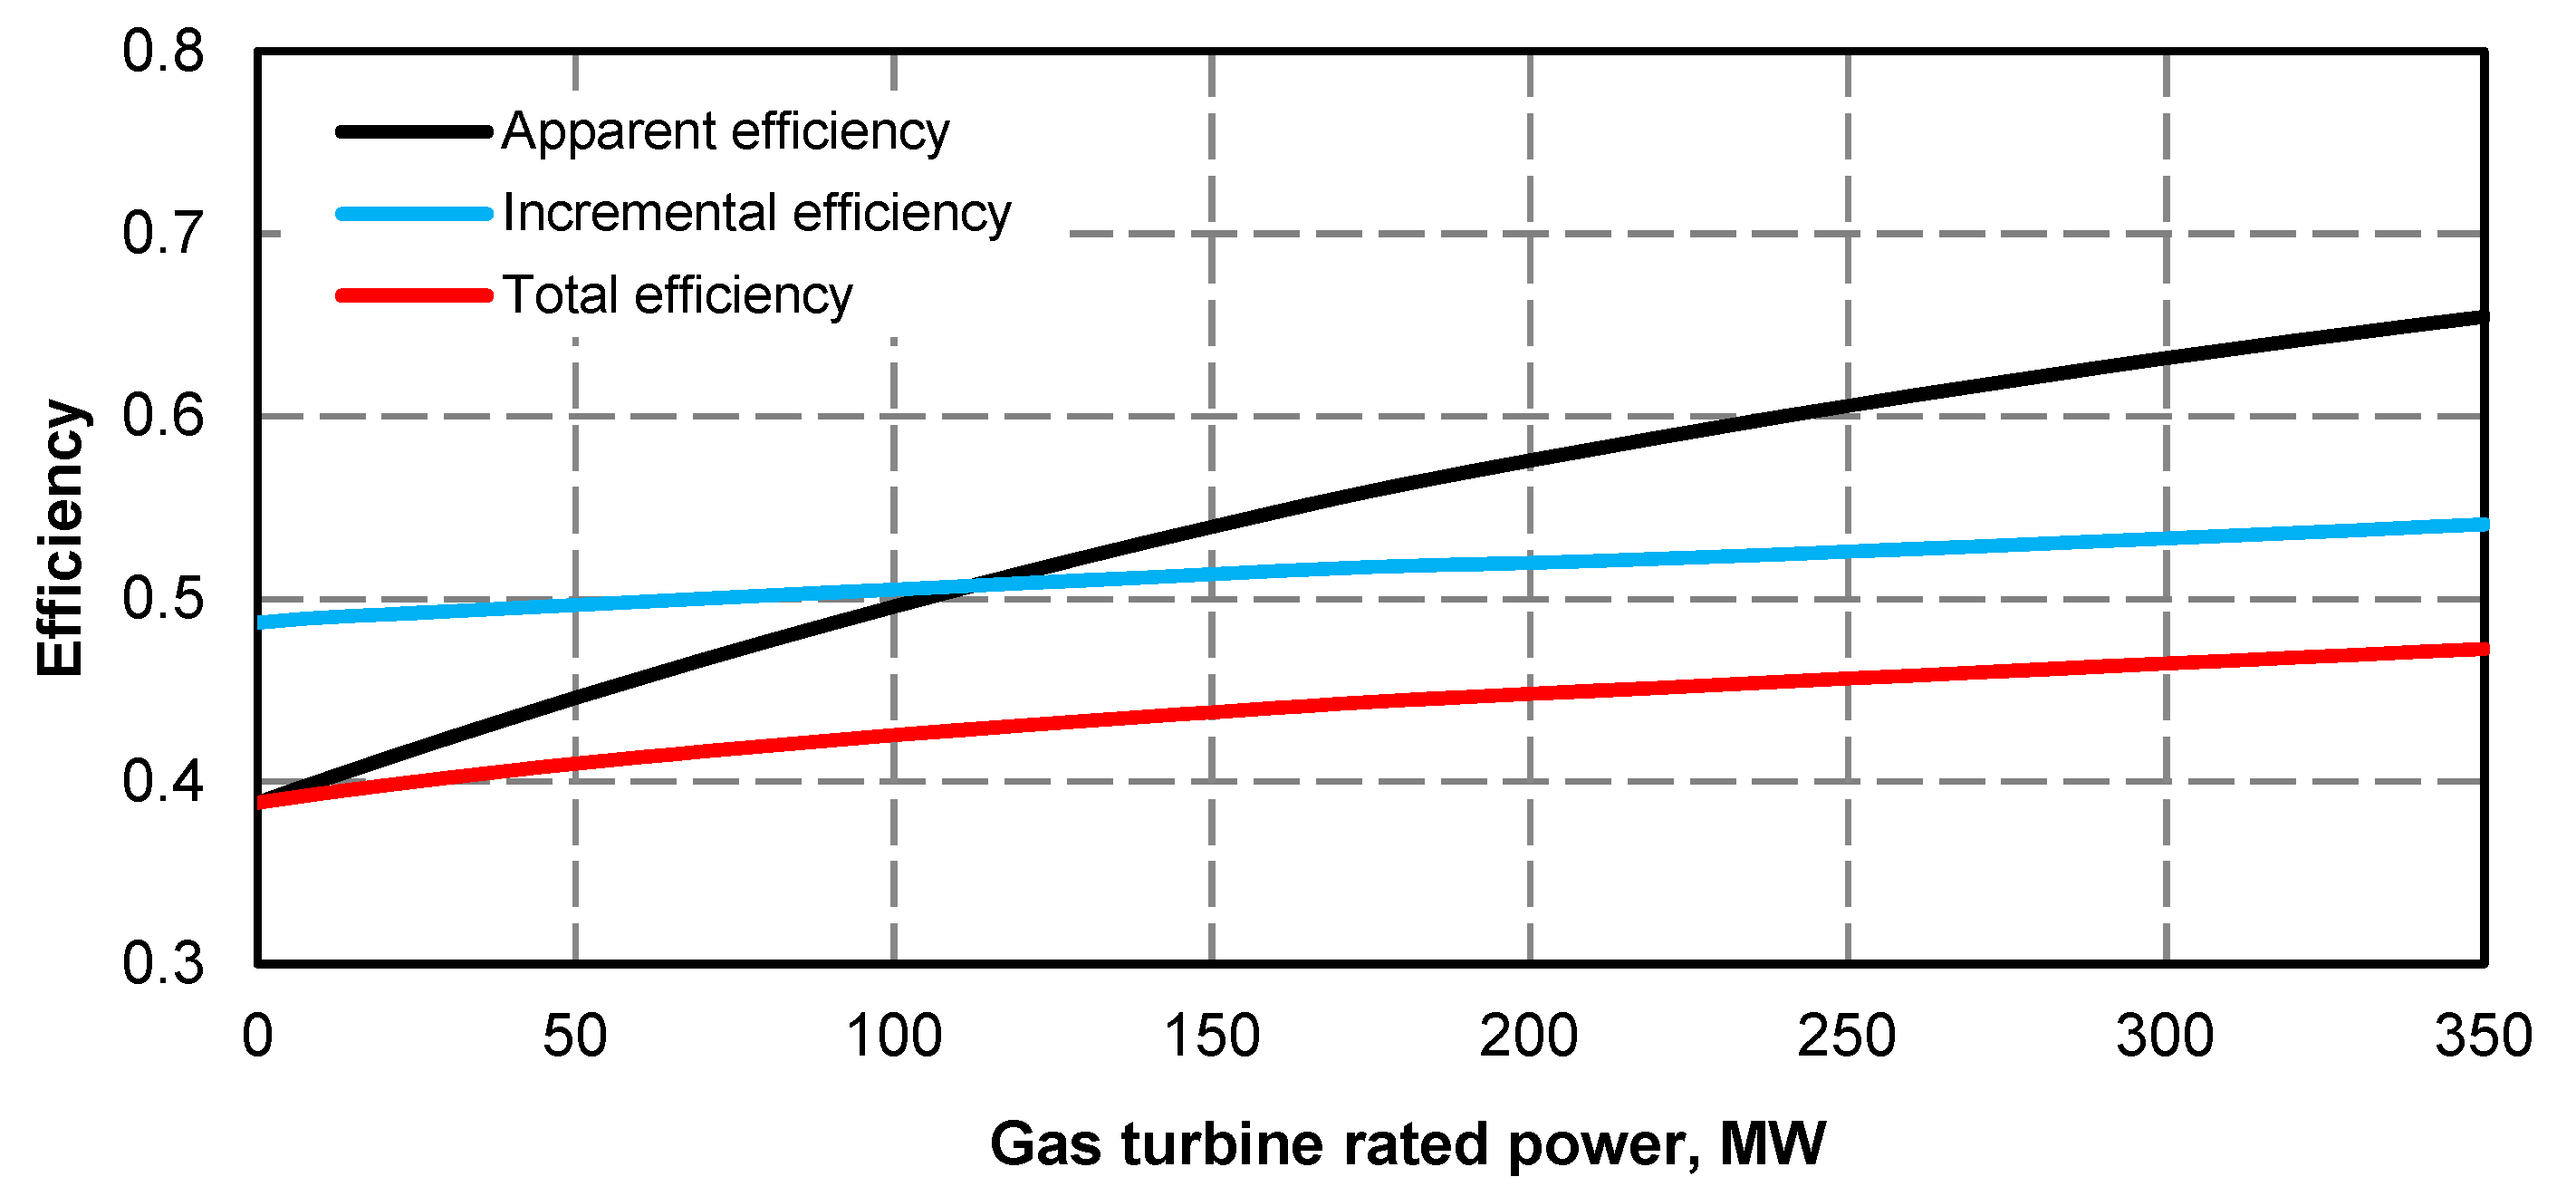
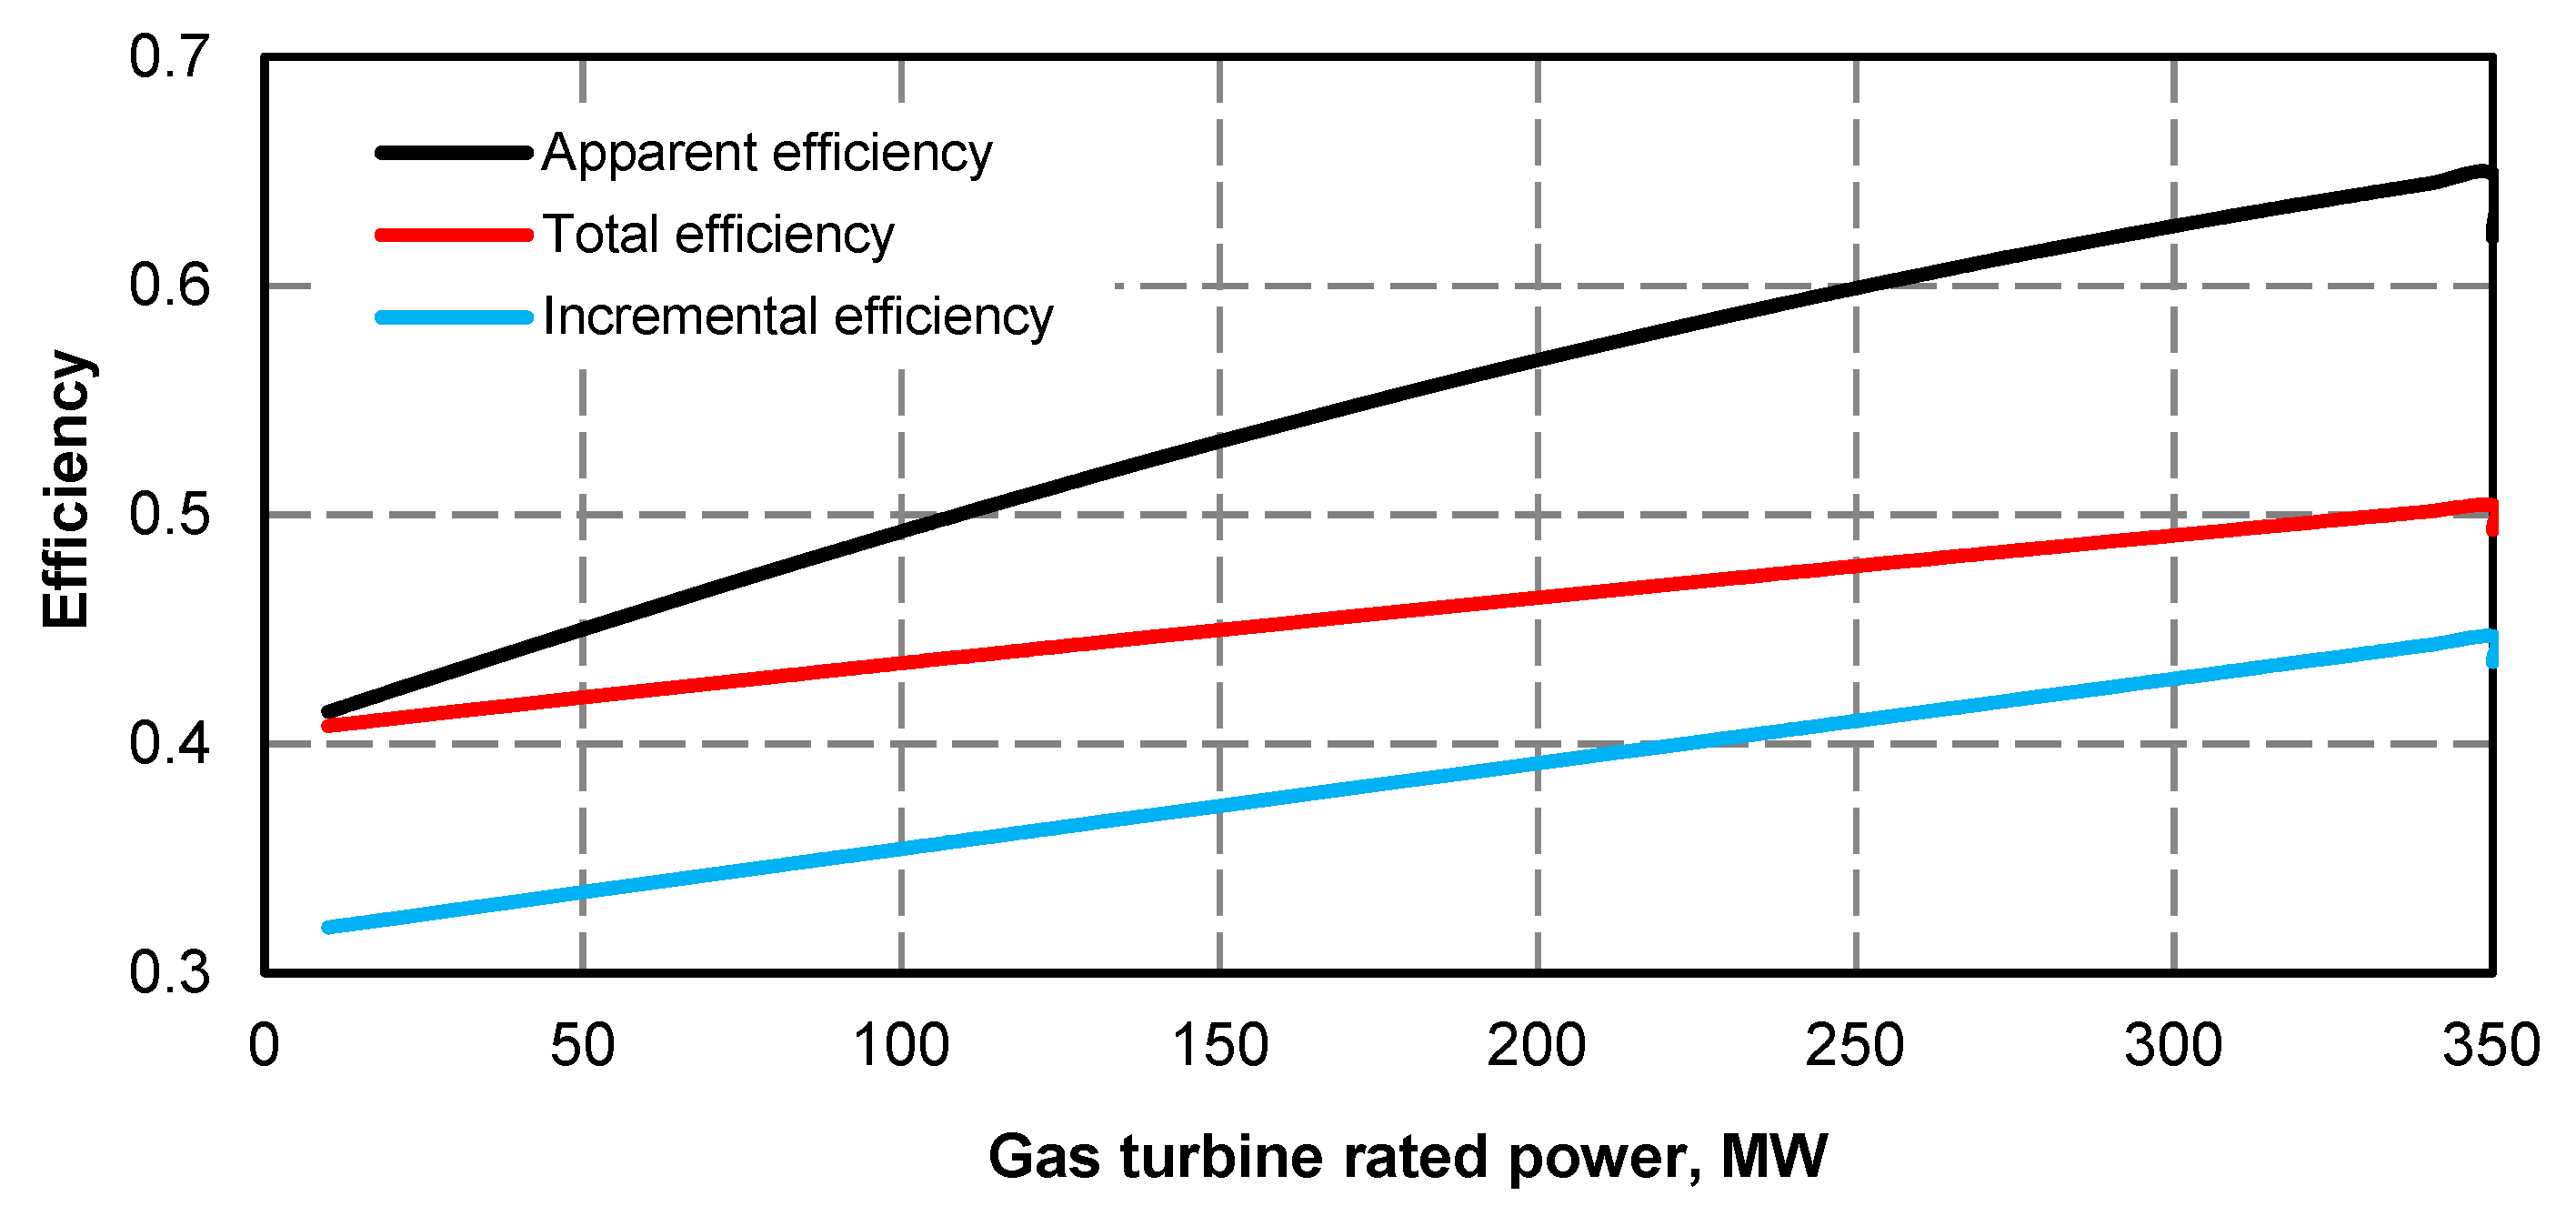
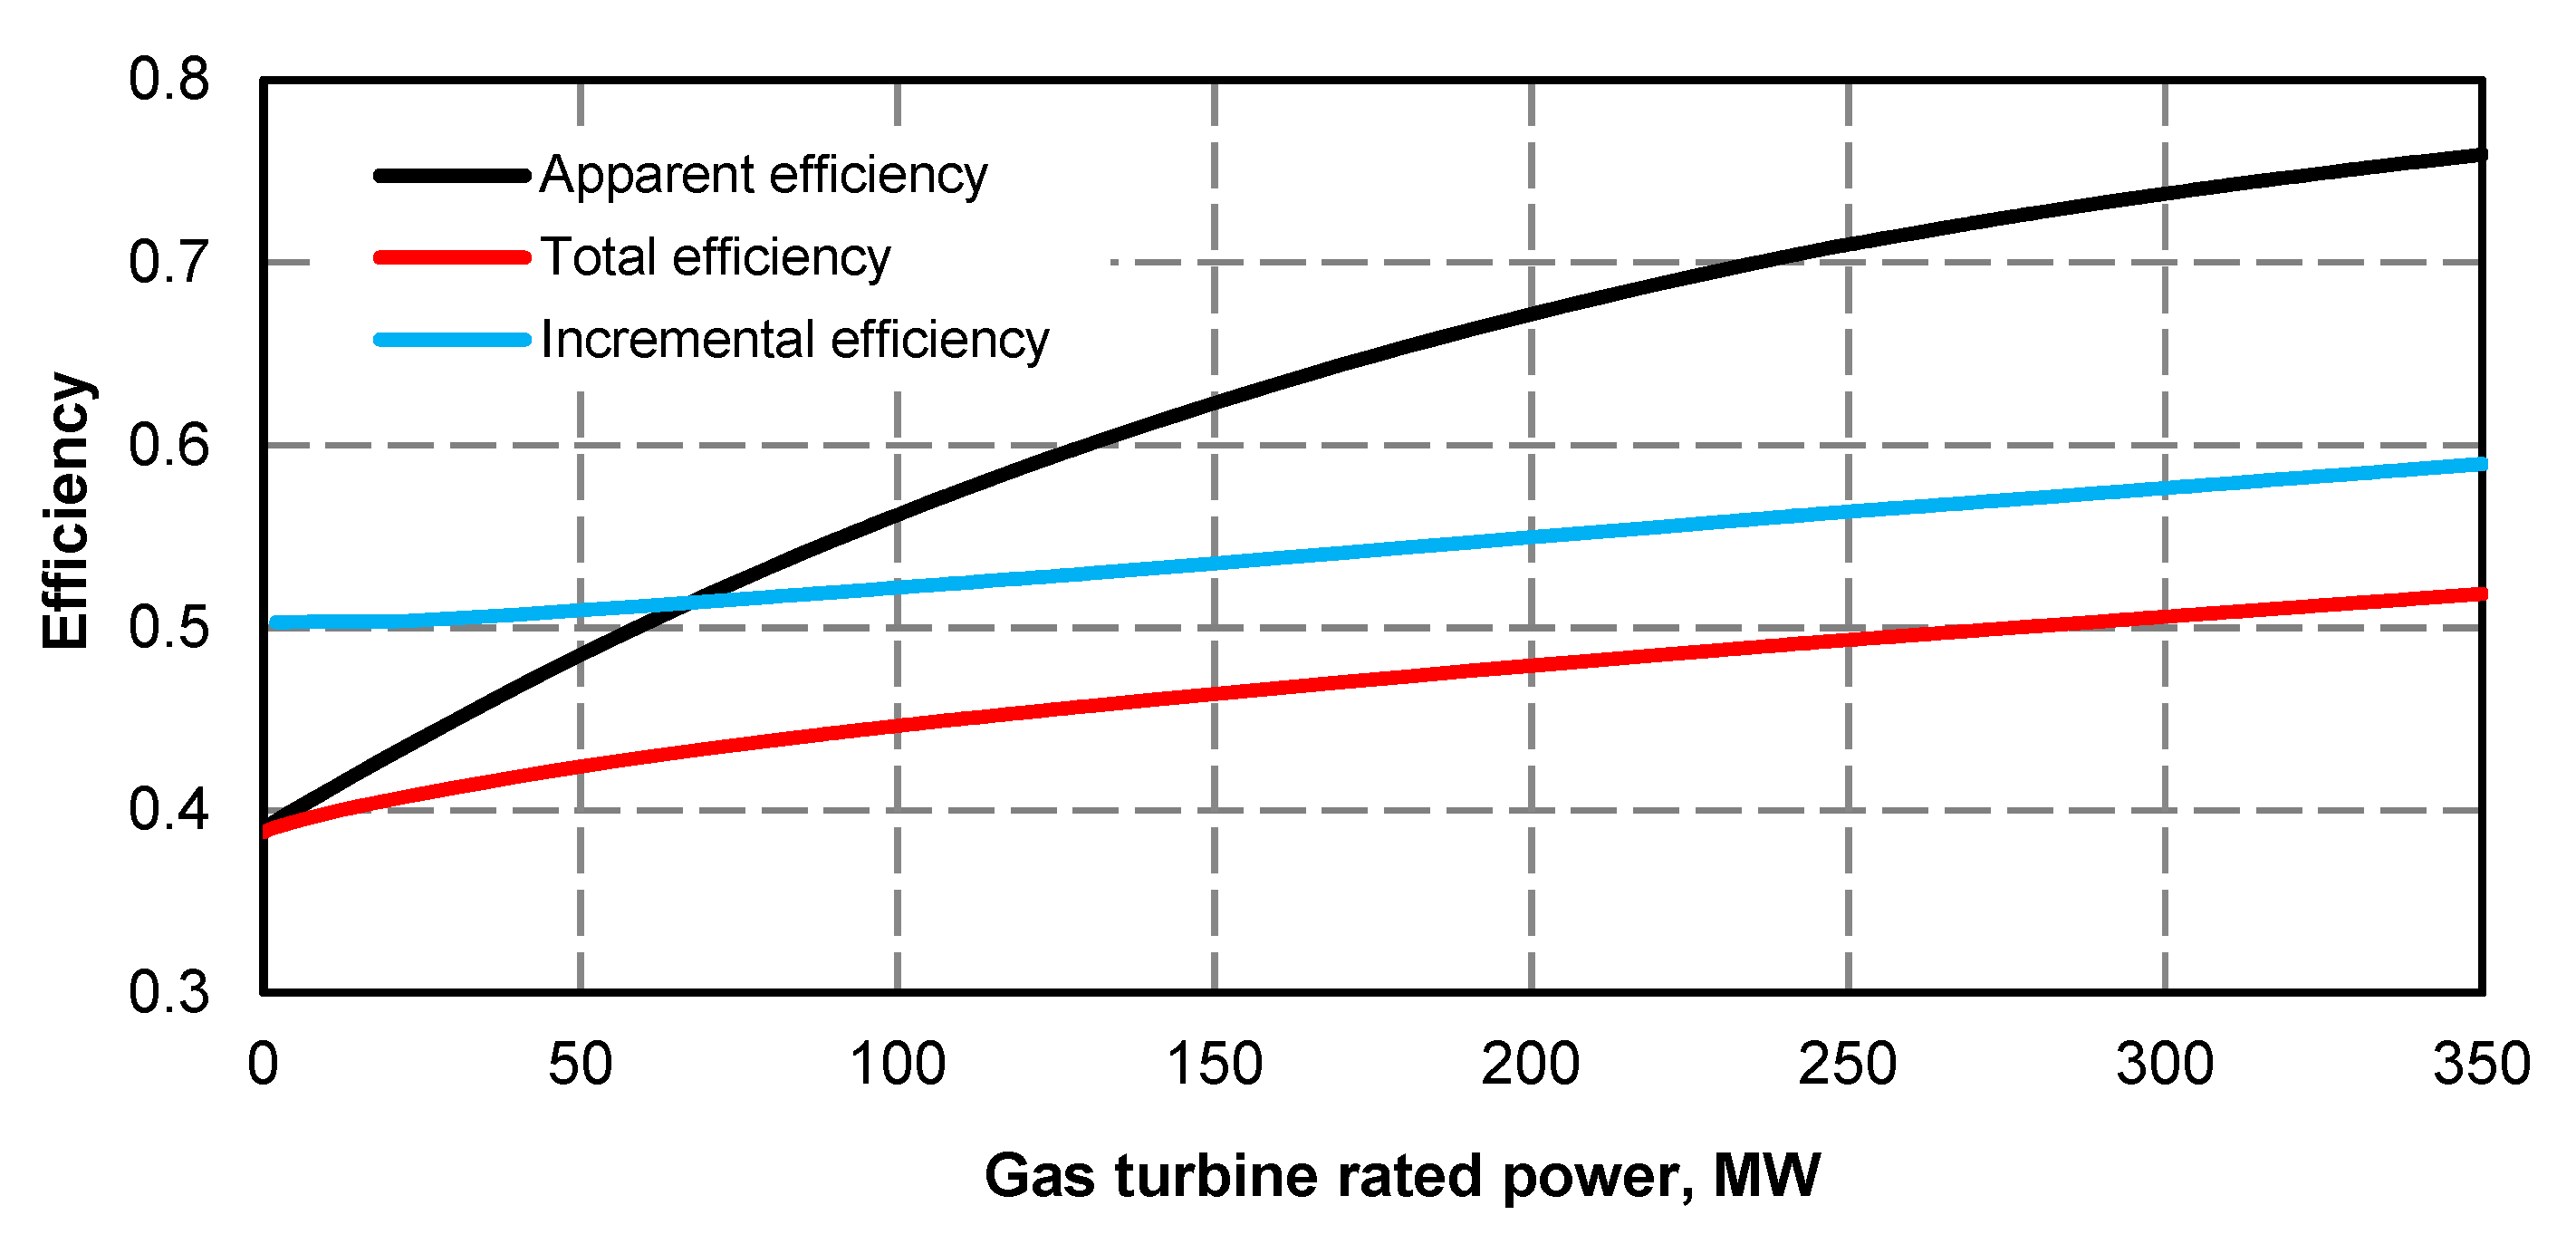
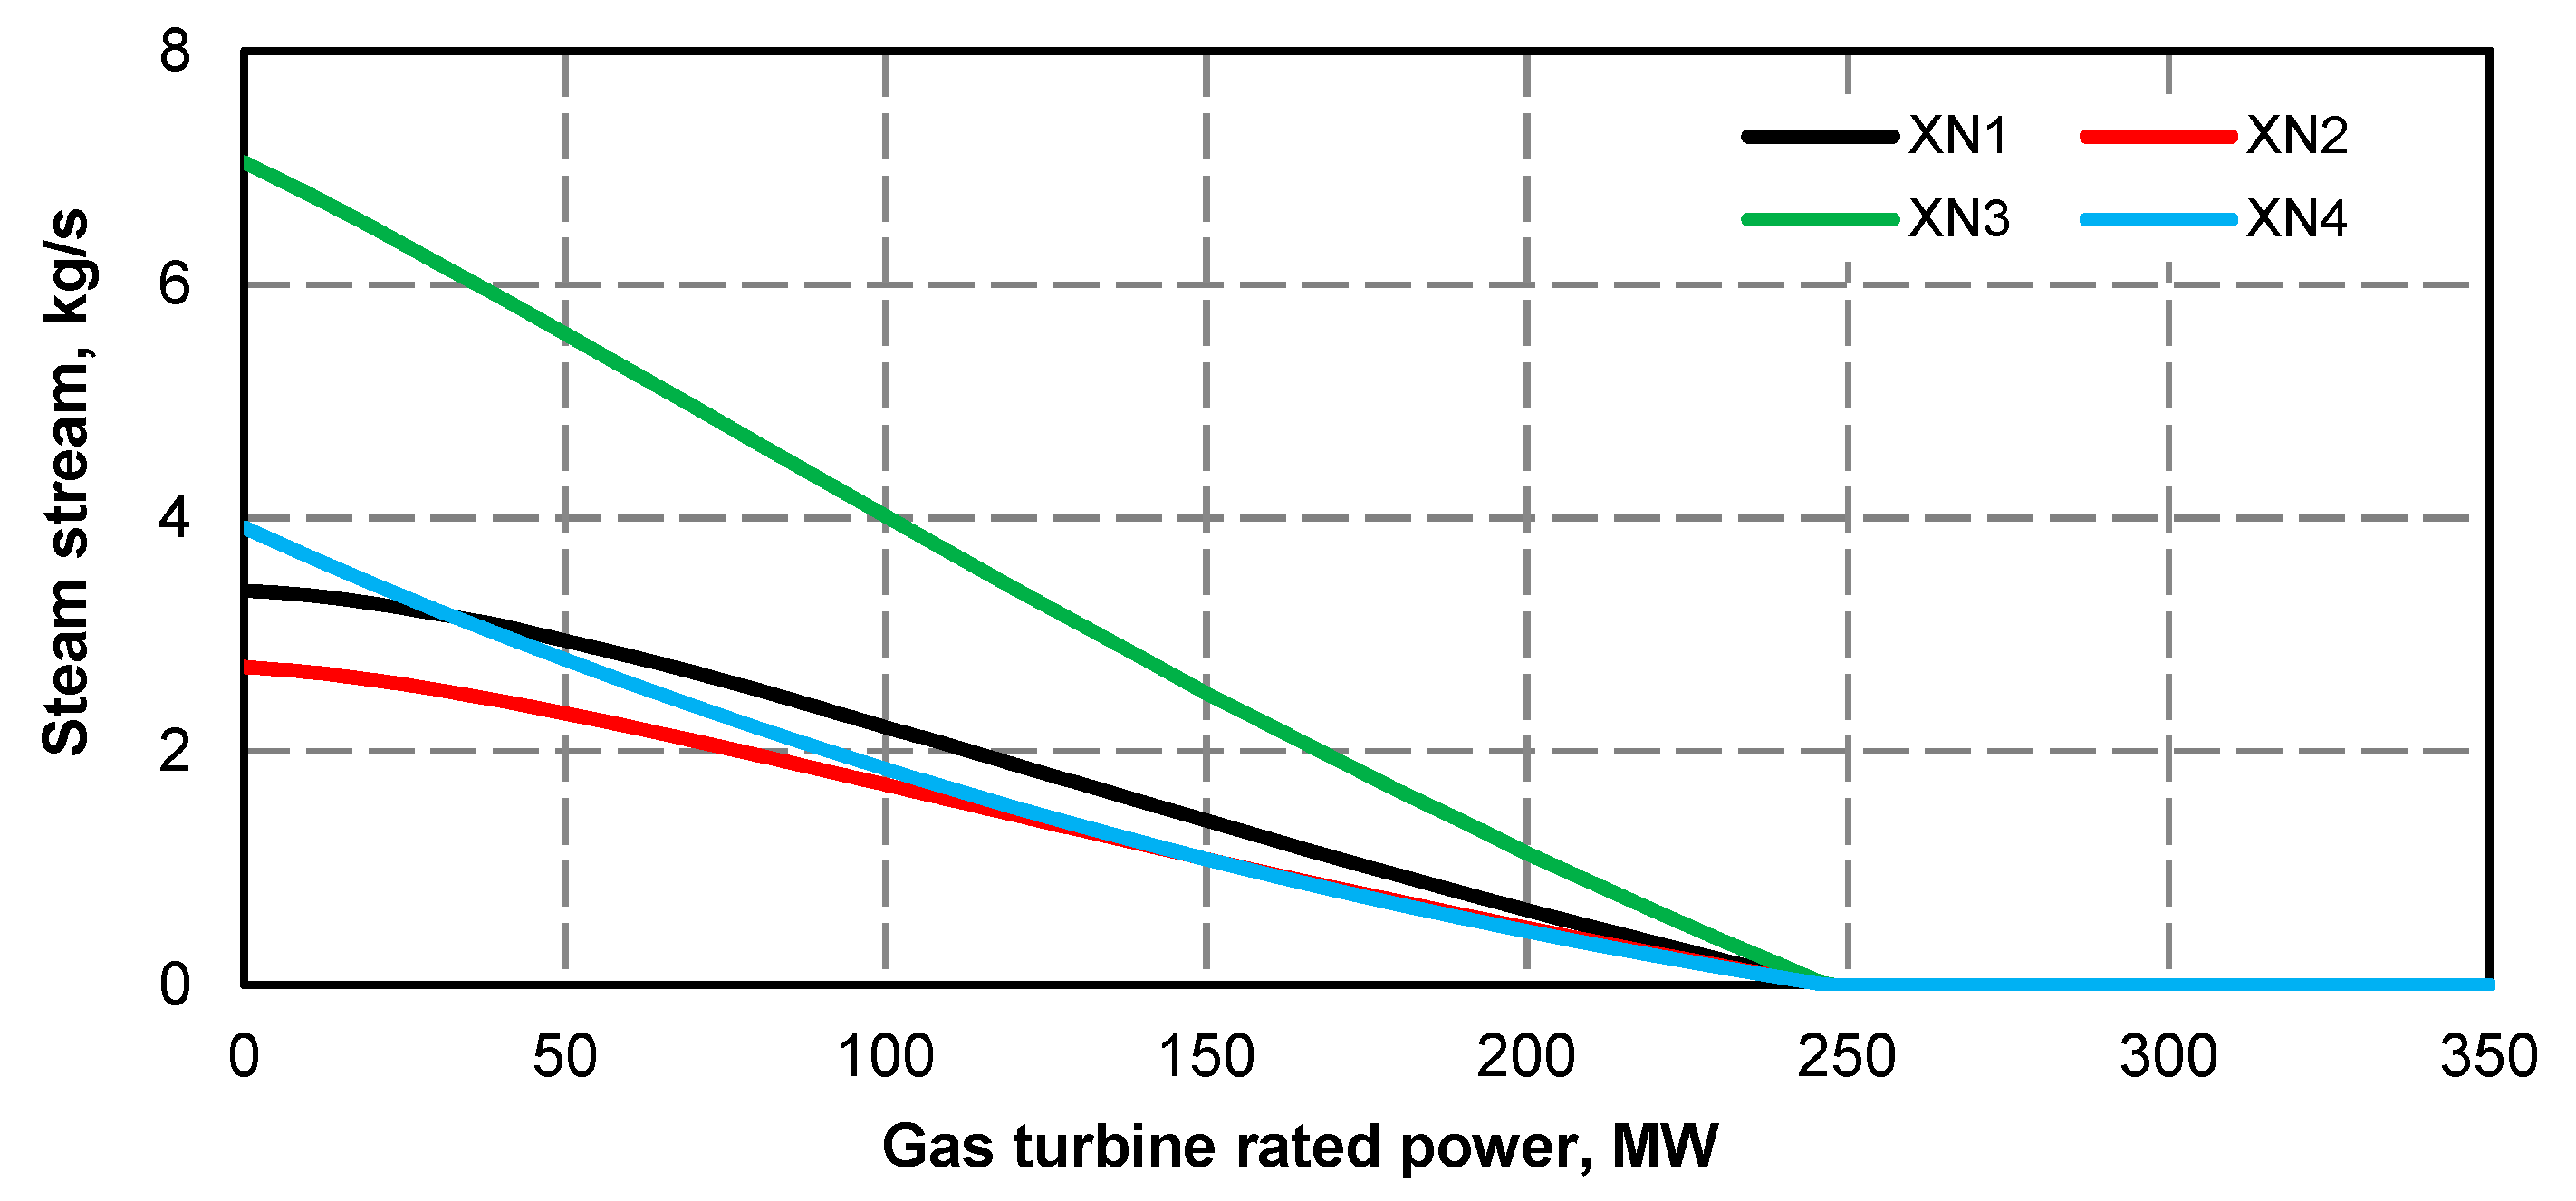
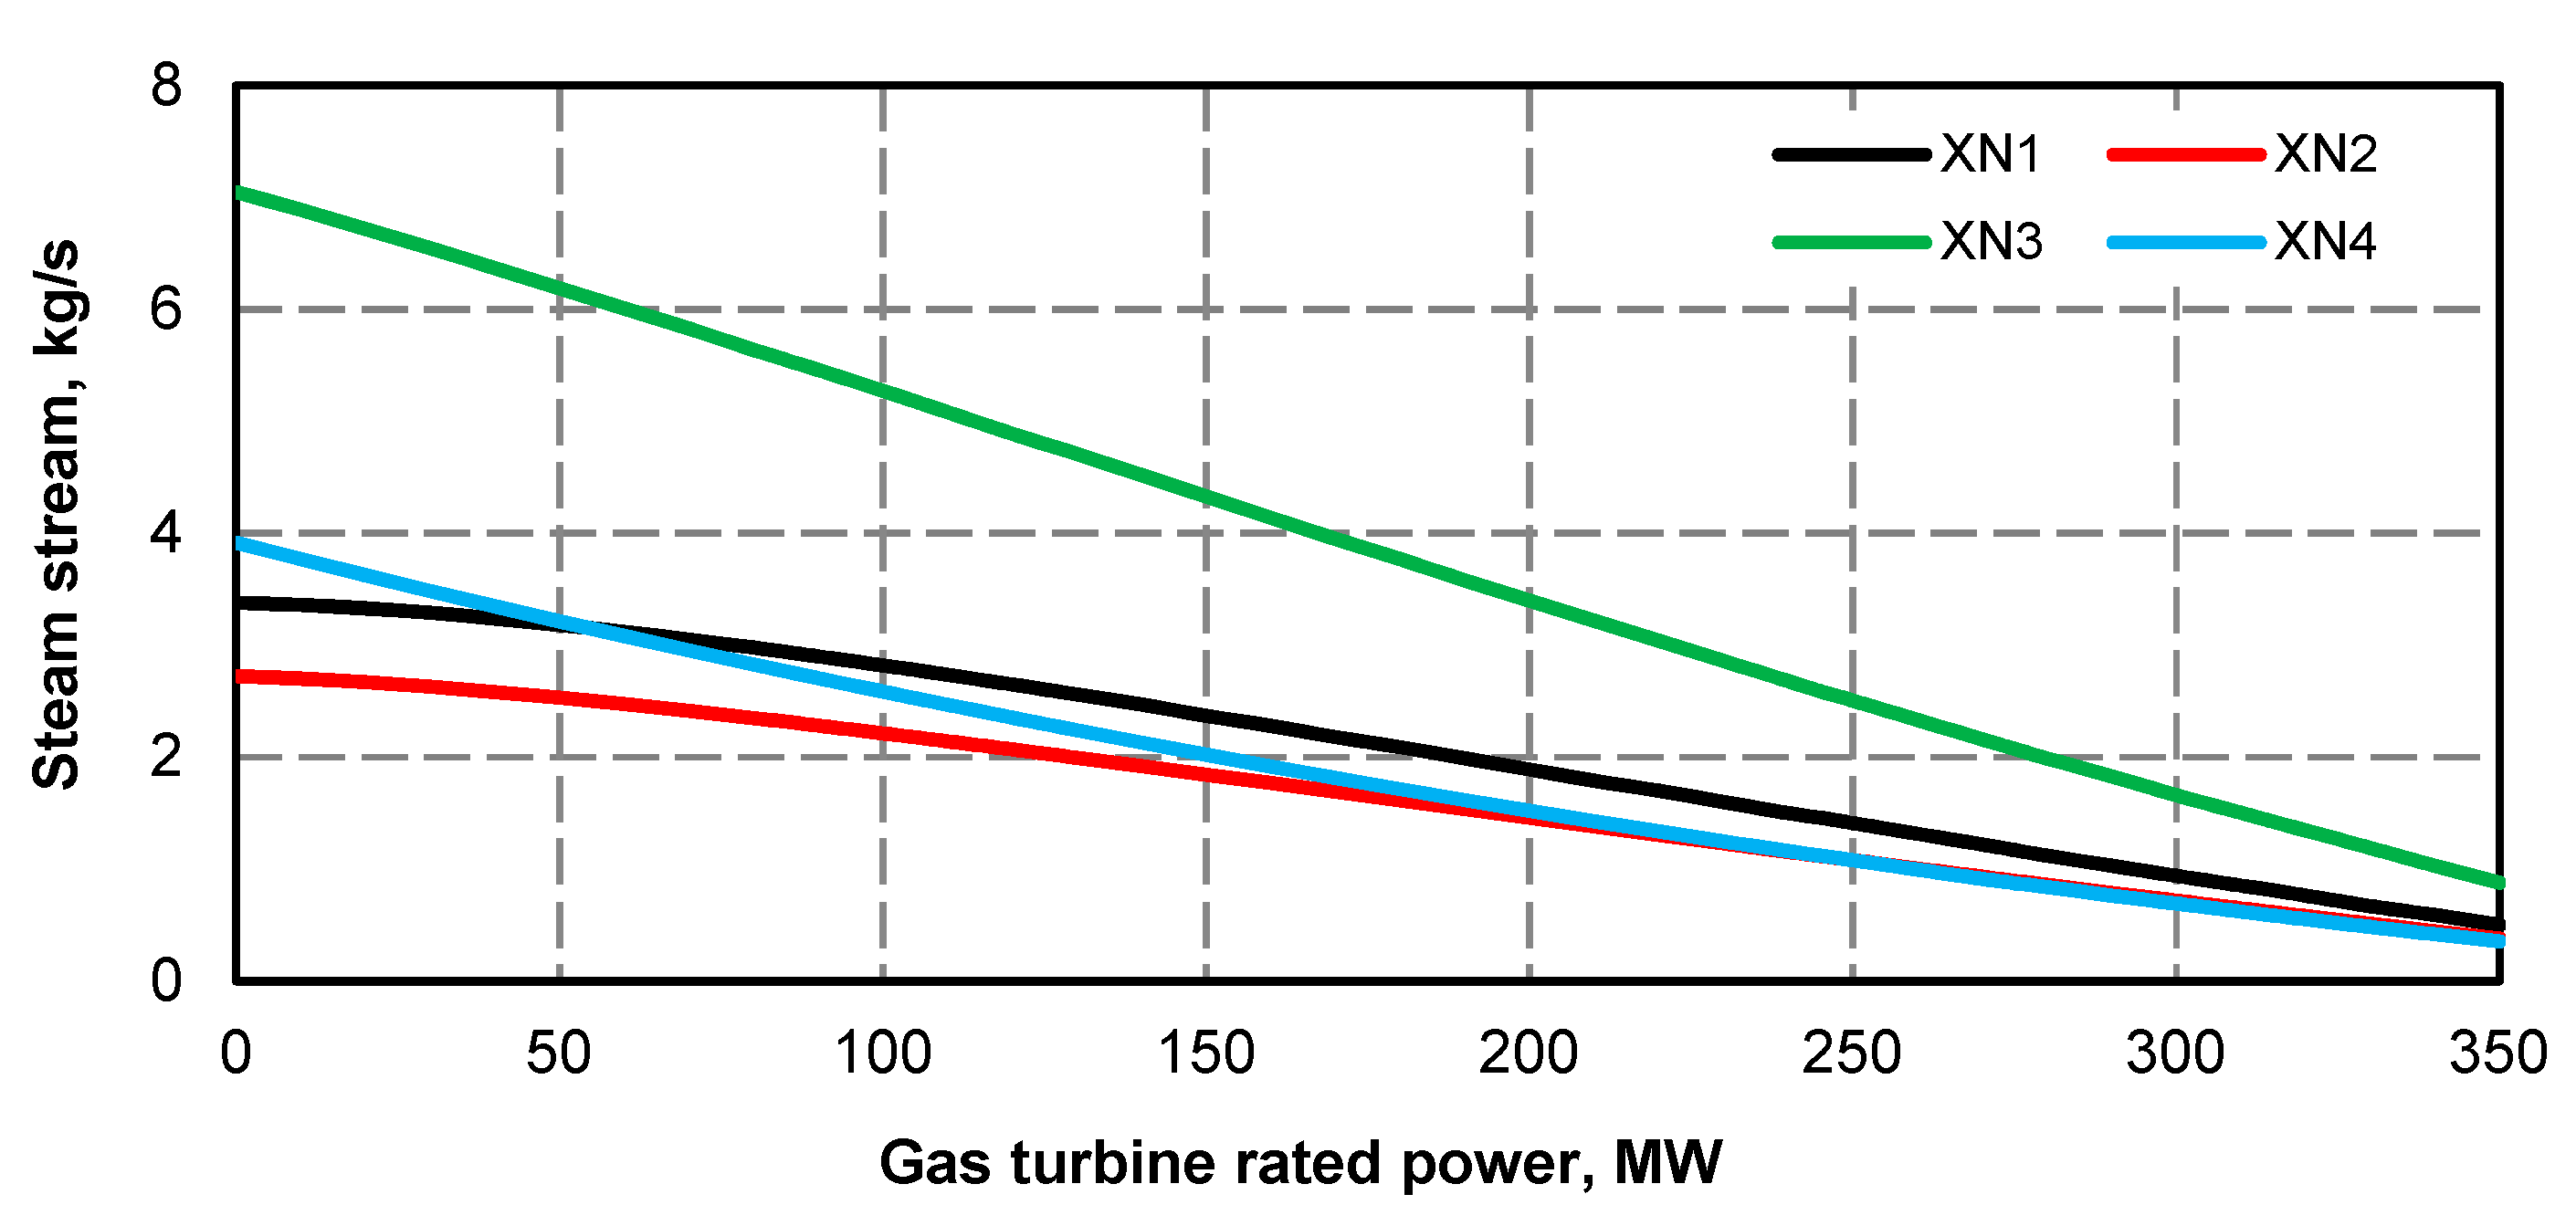
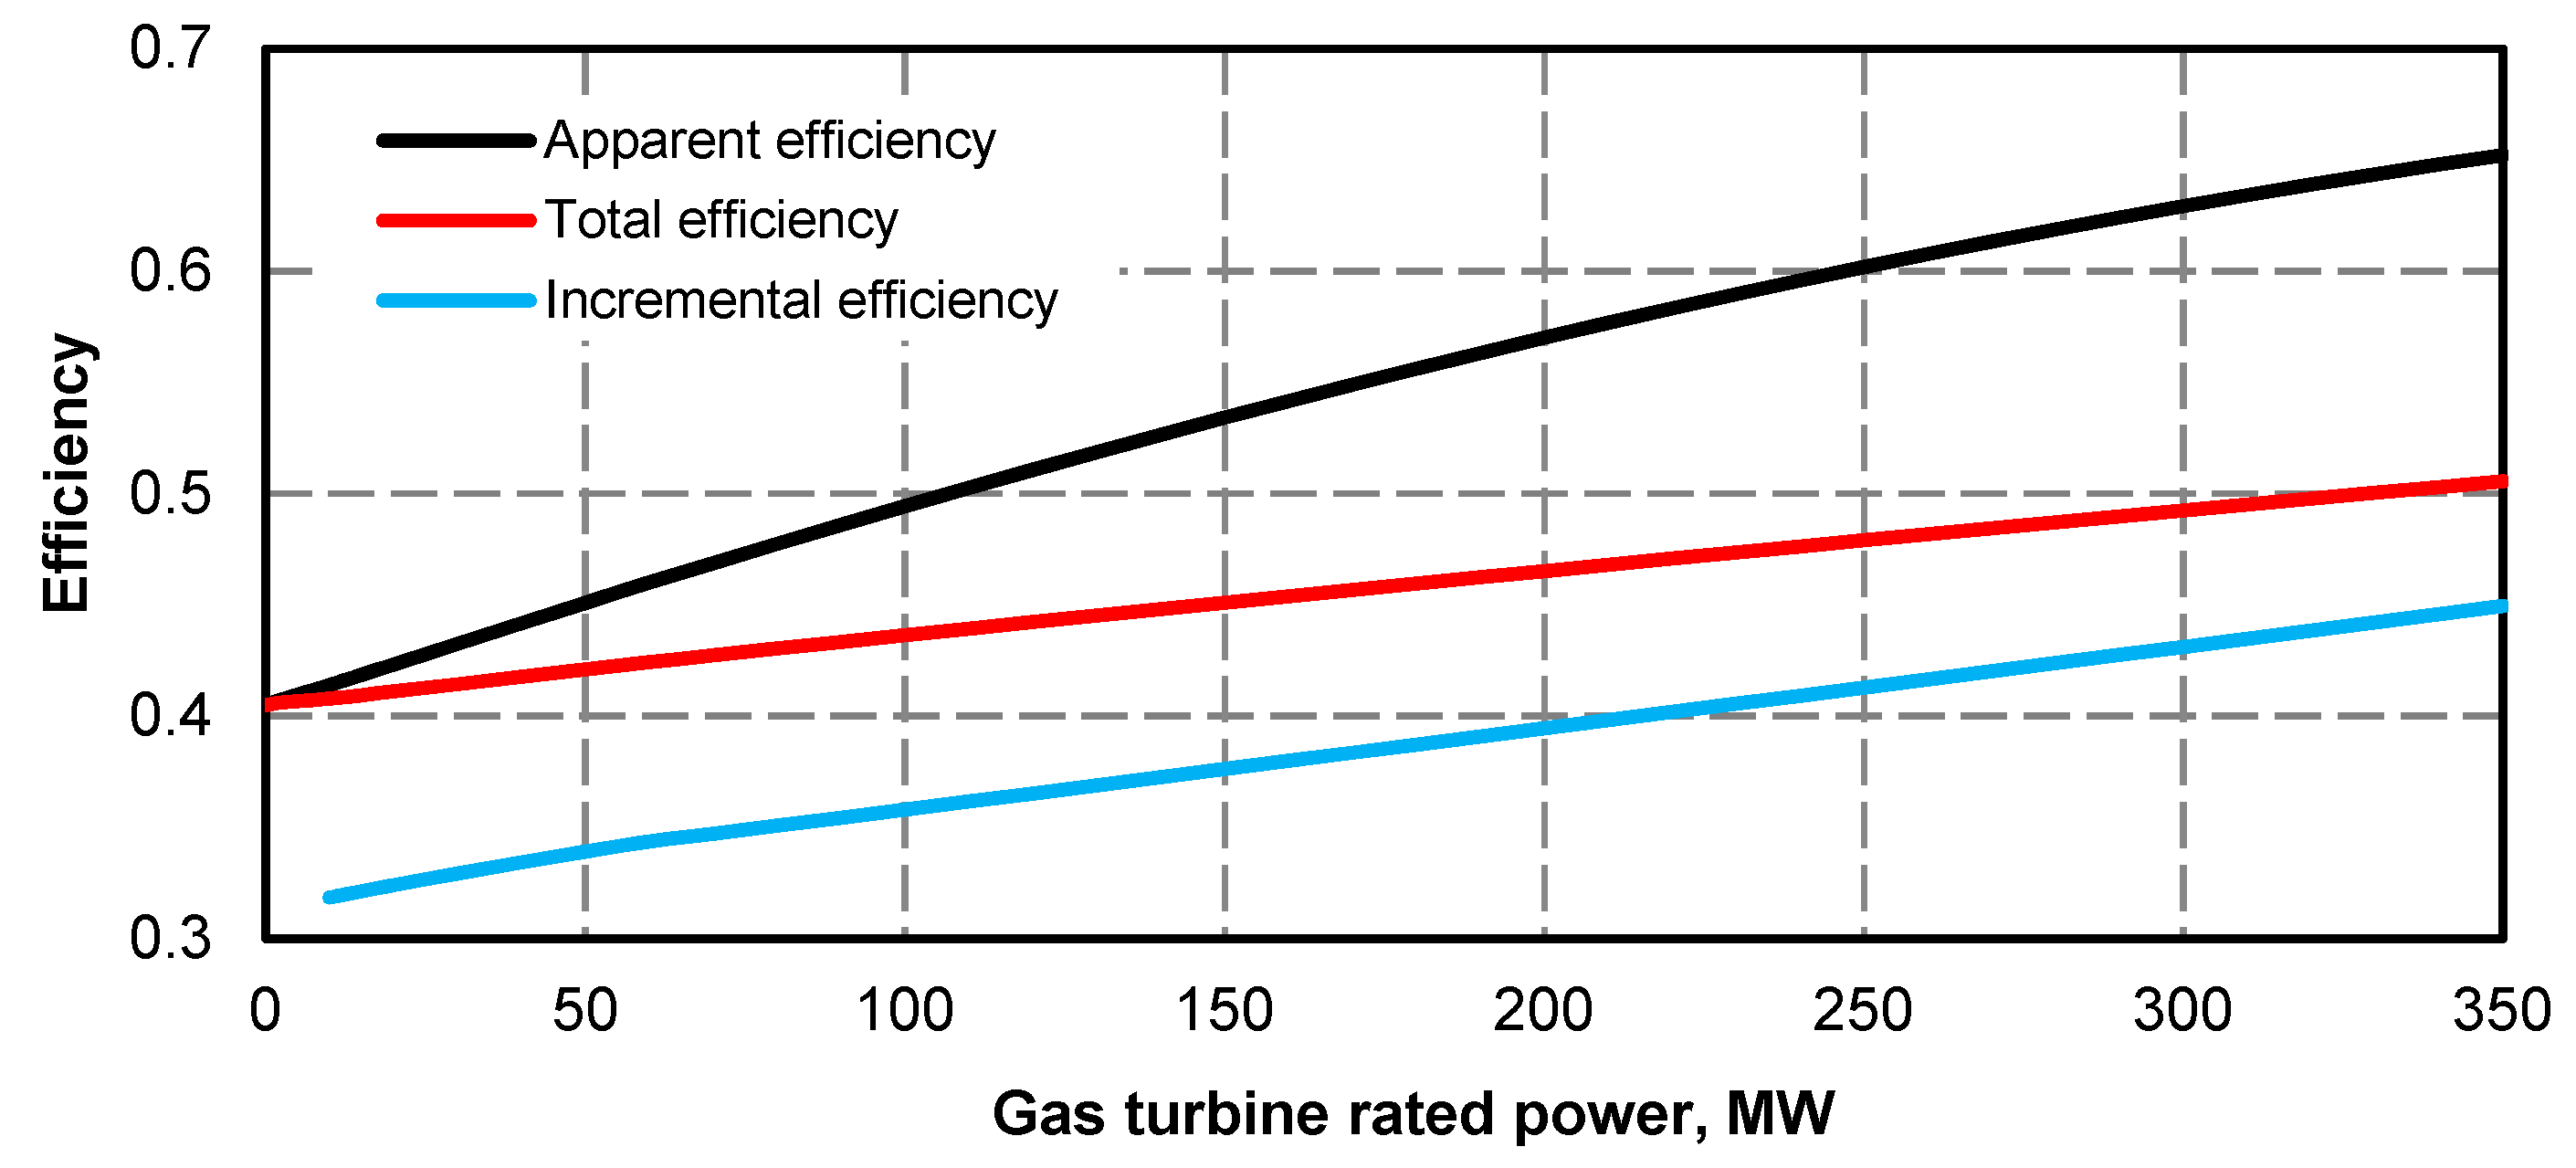
Figure 6, Figure 7 and Figure 8 show a change in extraction steam streams fed to the low-pressure regeneration exchangers caused by the change in condensate flow to those exchangers, as shown in Figure 5. Heating the condensate in the recovery boiler allows us to use a low-temperature exhaust (flue) gas enthalpy and thus additionally raise the energetic and exergetic efficiency of the system. However, the main reason for the significant increase in its efficiency remains obviously reducing steam production in a coal-fired boiler by the steam stream value generated in the recovery boiler. The more the recovery boiler “unloads” the coal-fired boiler, being the higher source of exergetic losses because of the high temperature difference, approximately 1000 K, between the coal combustion temperature inside it and the average thermodynamic circulation medium temperature, water and steam, absorbing heat in the boiler. That is why the more the recovery boiler “unloads” the coal-fired boiler the higher the energetic efficiency of the electric power generation in the superstructured power unit [30] (Figure 9, Figure 10 and Figure 11).
The efficiency of electric power generation in the upgraded power unit can be expressed by the following formula:
η E e l = N e l E l + Δ N e l S T + N e l G T E ˙ c h c + E ˙ c h g = N e l S T + N e l G T E ˙ c h c + E ˙ c h g
where: E ˙ c h c , E ˙ c h g —streams of chemical energy of coal and gas fired in the system after adding the superstructure to the power unit, N e l E l —steam turbine power before adding the superstructure to the power unit, Δ N e l S T —power gain of the steam turbine after adding the superstructure to the power unit, N e l S T —power of the steam turbine and N e l S T = N e l E l + Δ N e l S T —power of the steam turbine after adding the superstructure to the power unit.
It is also possible to determine the incremental efficiency for electric power generation in the superstructured power unit (this efficiency represents the electric power generation efficiency in the currently most thermodynamically perfect, classic, single-fuel series gas-steam system):
η Δ = N e l G T + Δ N e l S T E ˙ c h g
By analogy, the apparent efficiency for electric power generation in the steam power unit after adding the superstructure can be defined in the following way:
χ = N e l E l + Δ N e l S T E ˙ c h c = N e l S T E ˙ c h c
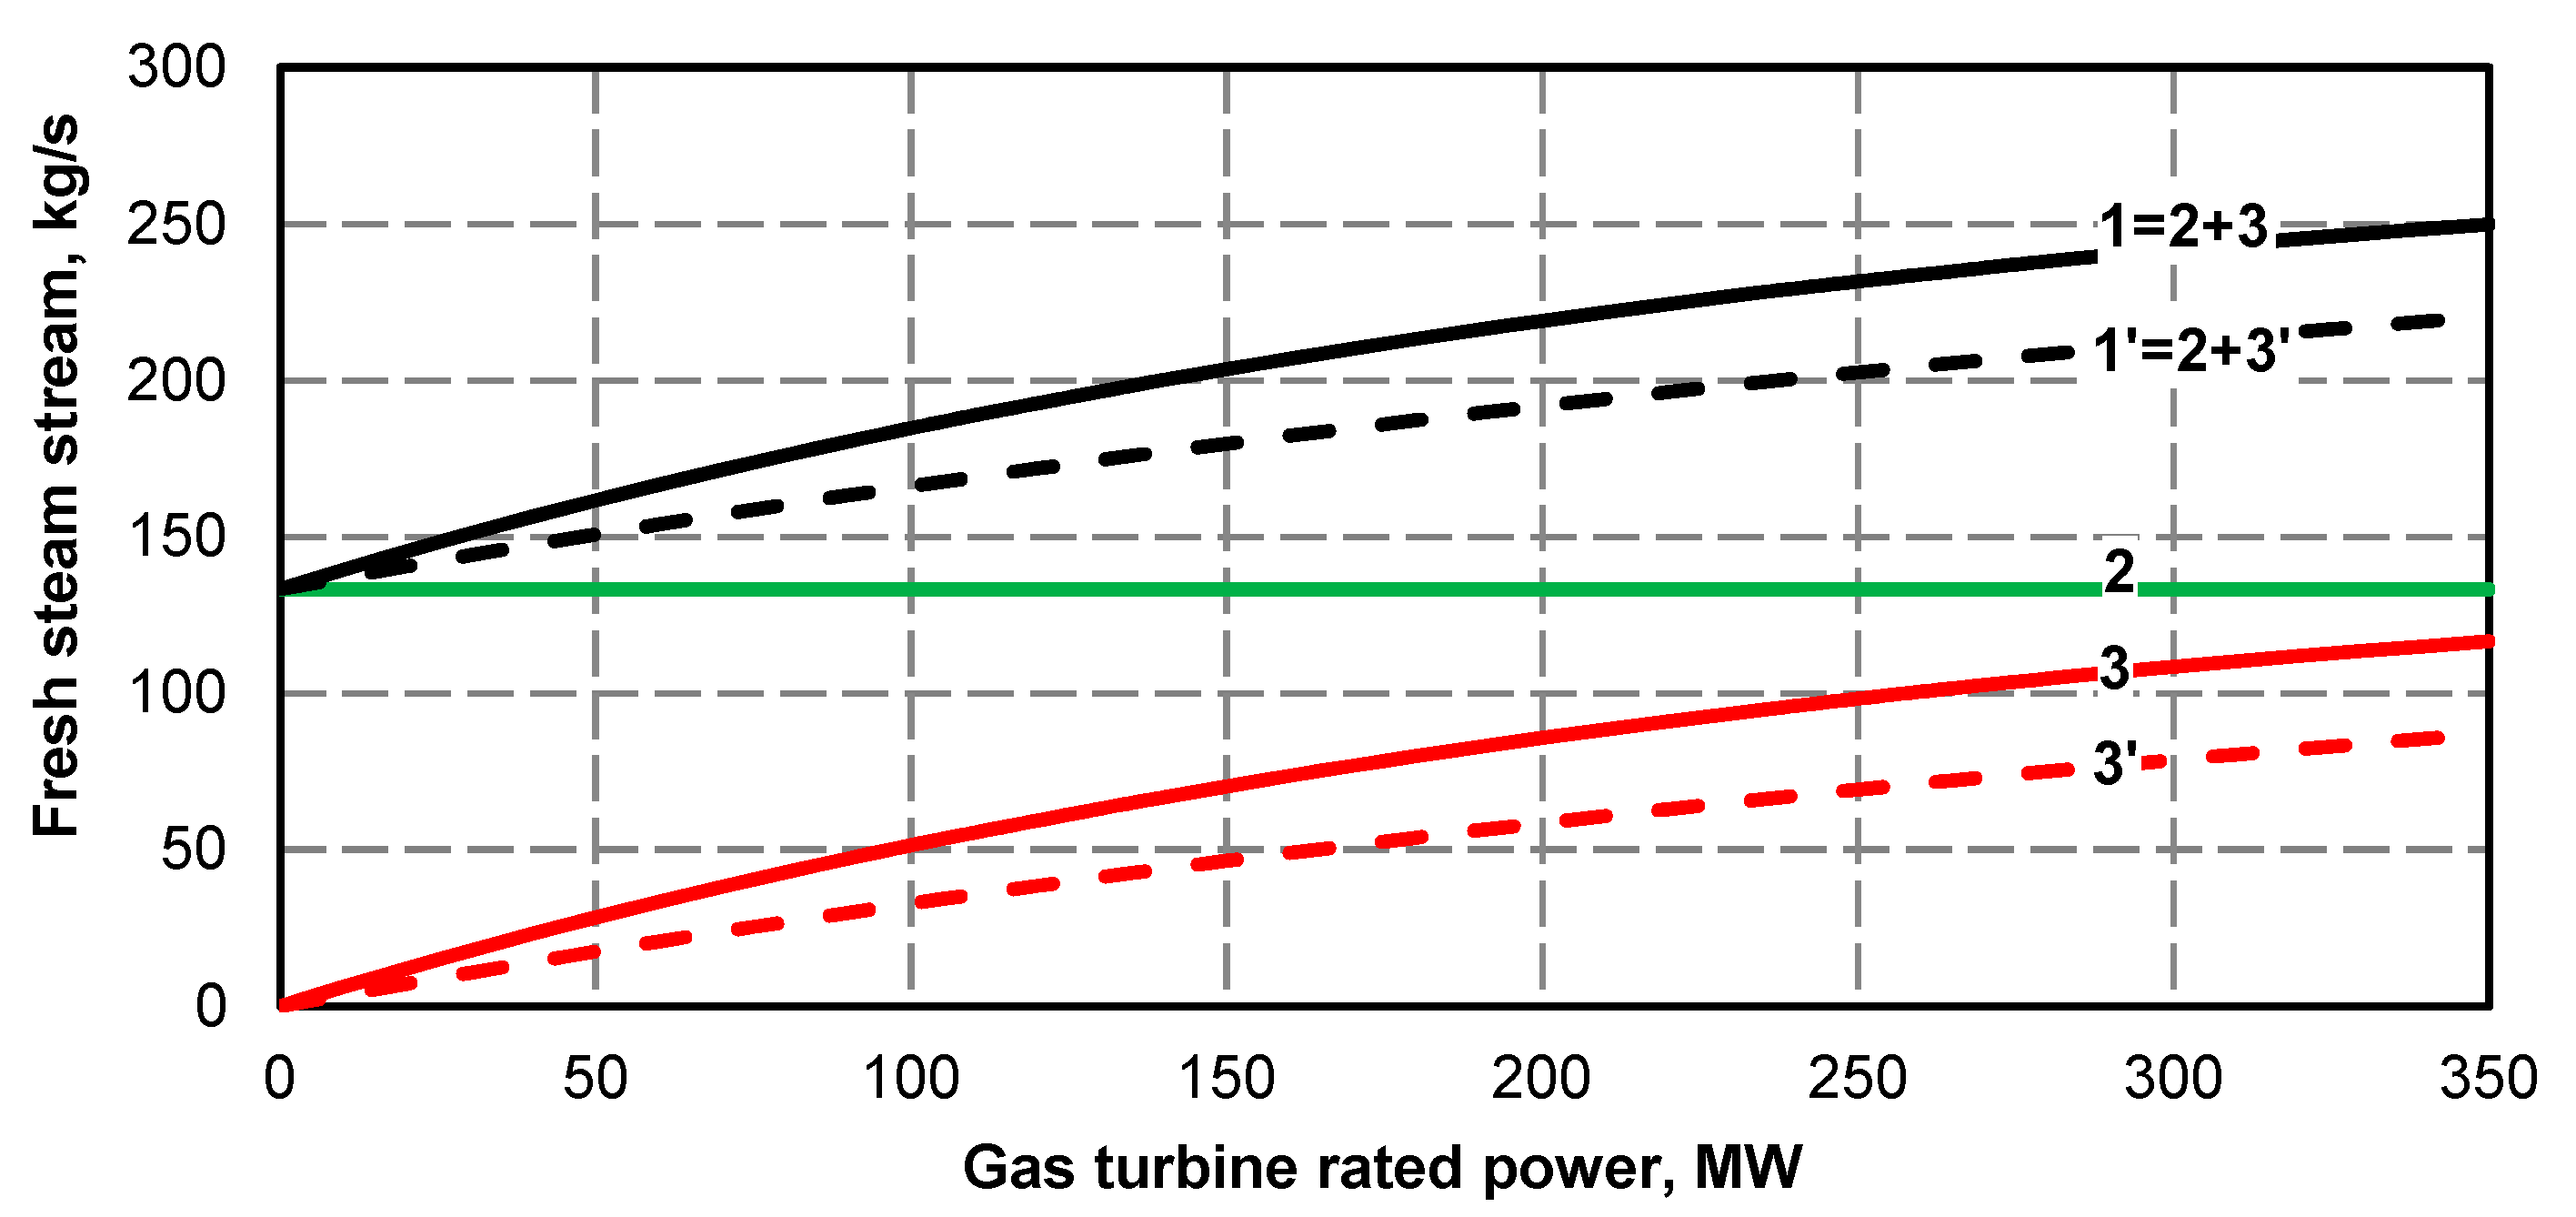
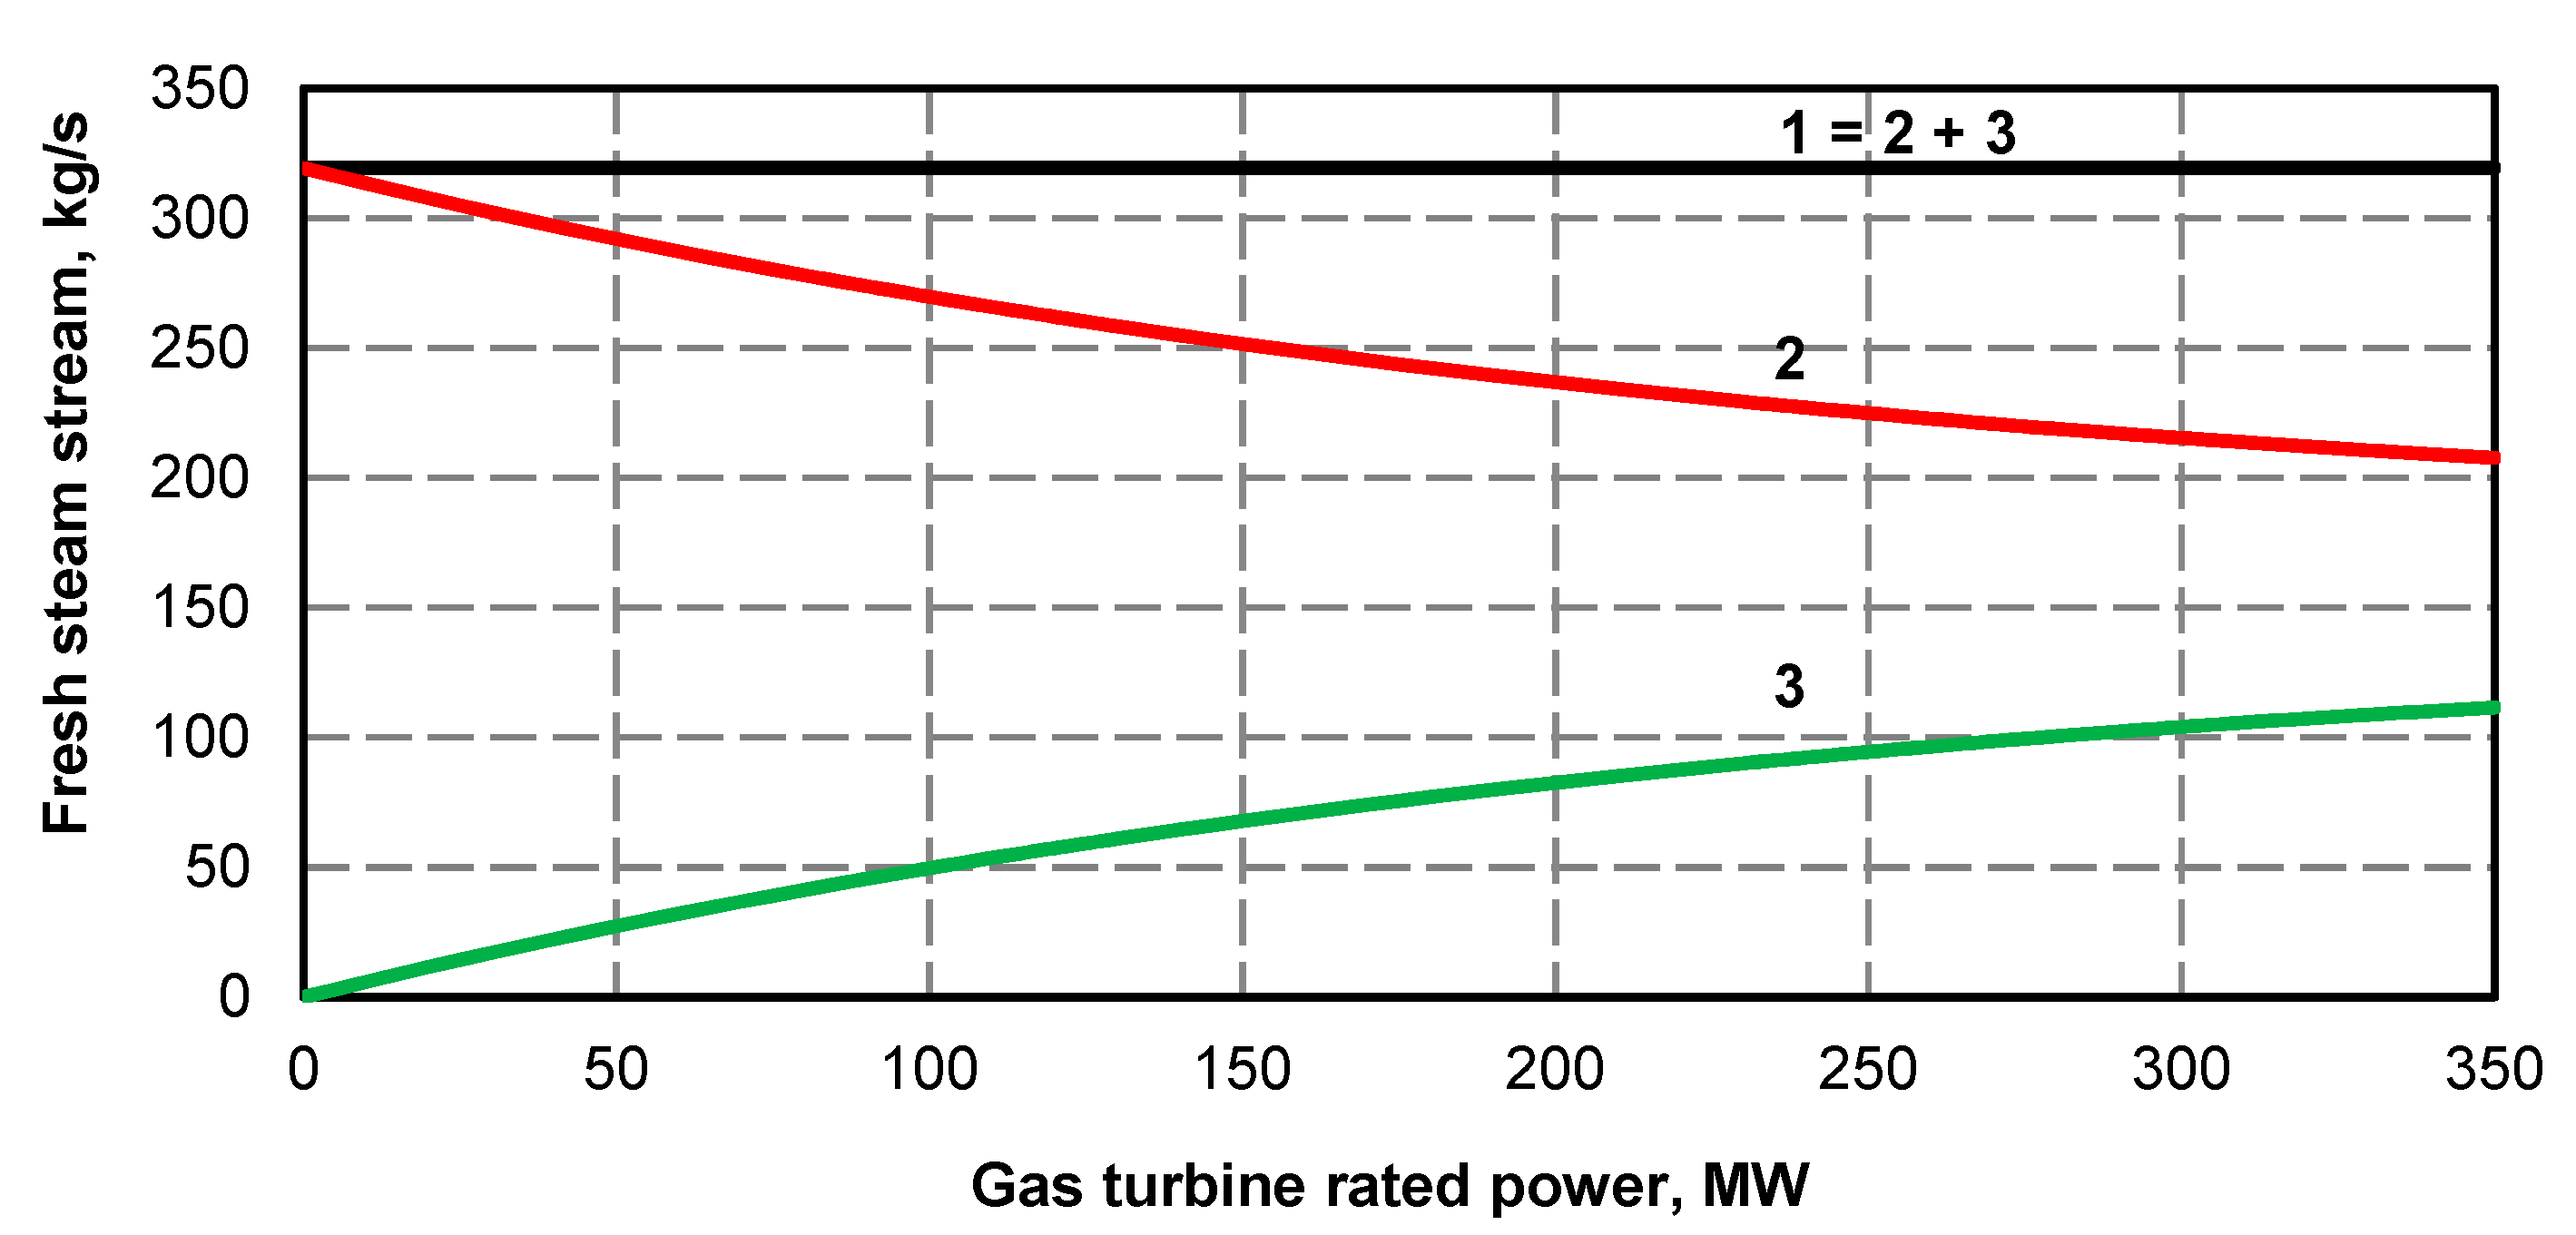
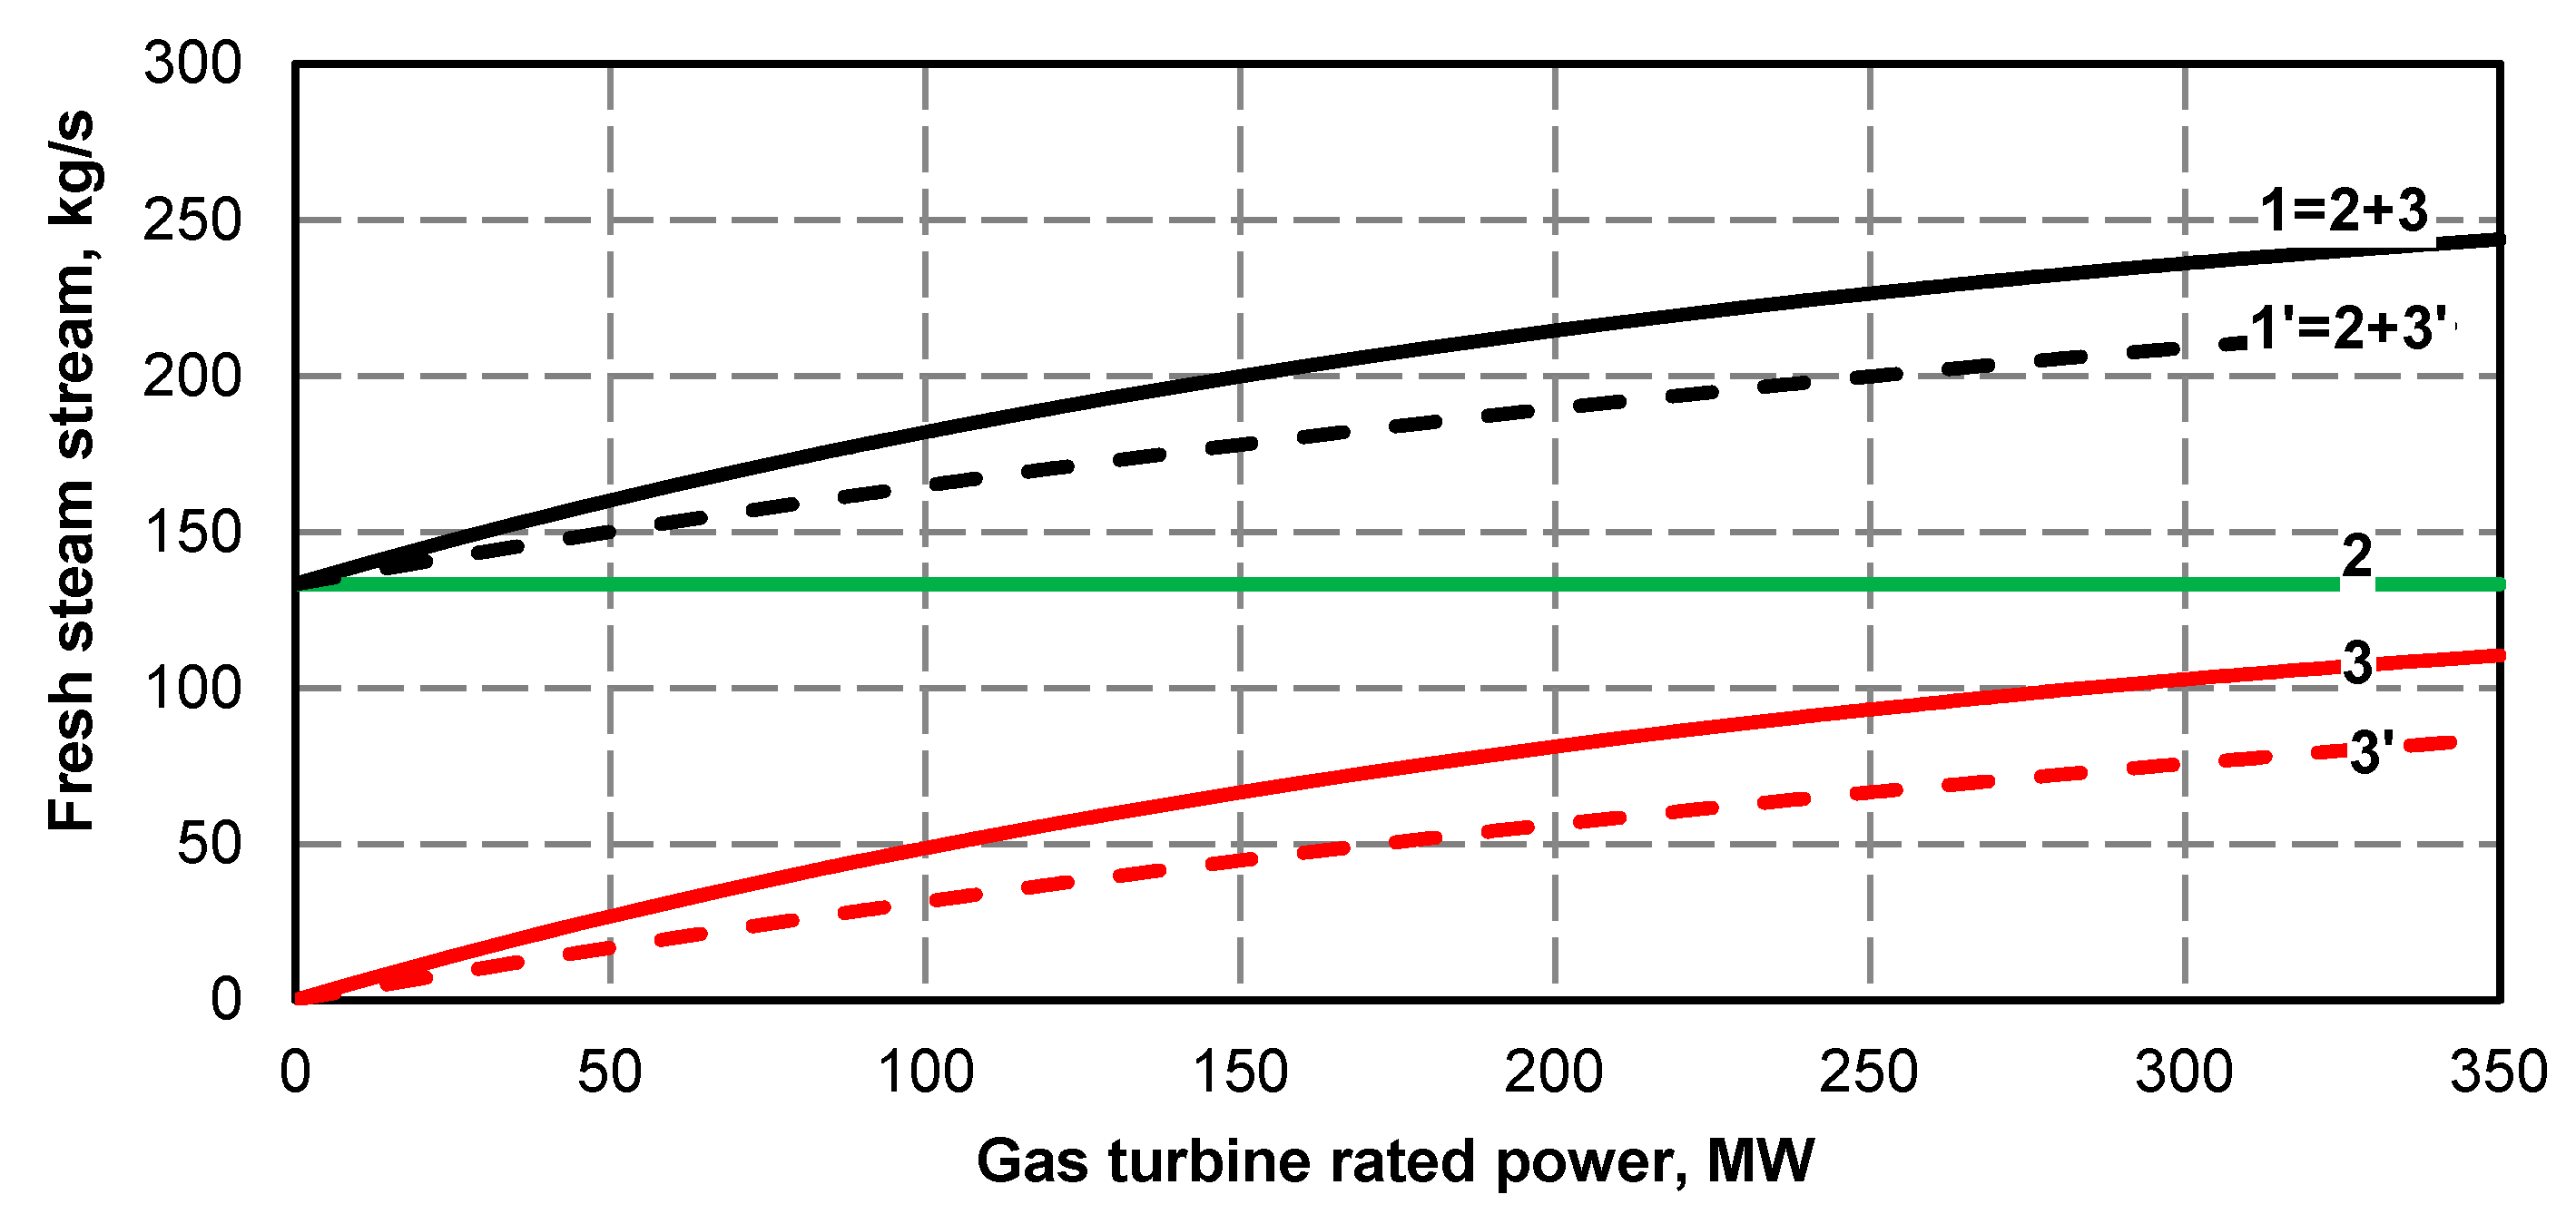
Heating the condensate and feed water with flue gas from the recovery boiler restricts the flow of extraction steam to regeneration exchangers, which increases the steam turbine power. The steam generated by the recovery boiler reduces the amount of steam generated in the steam boiler, which significantly reduces its exergetic losses. The greatest increase in efficiency occurs in the operation of a steam boiler with minimum output and operation of a gas turbine with rated output (Figure 10). The higher the efficiency of the gas-steam system, the more the chemical energy of coal is replaced by the chemical energy of gas. The stream of steam produced in the recovery boiler is obviously the higher, the higher the gas turbine power (Figure 12 and Figure 13).
The curves presented in Figure 5, Figure 6, Figure 7 and Figure 8 show the changes in condensate stream fed from the KQ1 condenser to the XN1–XN4 low-pressure regeneration exchangers and the changes of extraction heating steam fed to them as a function of gas turbine rated power. The streams are presented for three extreme values that determine the available range of steam turbine power changes. One of them, the one that limits the steam turbine power and available range from the top is the fixed, fresh steam stream fed to the high-pressure turbine part of 319.4 kg/s. The stream does not depend on the gas turbine power and is the sum of variable streams generated in the coal-fired and recover boilers (Figure 12).
The second and the third values that restrict power and available range, but from the bottom are fresh steam streams fed to the high-pressure turbine part for the minimum output (process minimum) of the coal-fired boiler of 133.3 kg/s for two gas turbine power values - rated power and 60% of rated power (Figure 13 and Figure 14). These streams, in contrast to the maximum stream are not fixed and they depend on the gas turbine power. They are the sum of minimum coal-fired boiler output of 133.3 kg/s and variable steam streams generated in the recovery boiler (Figure 13).
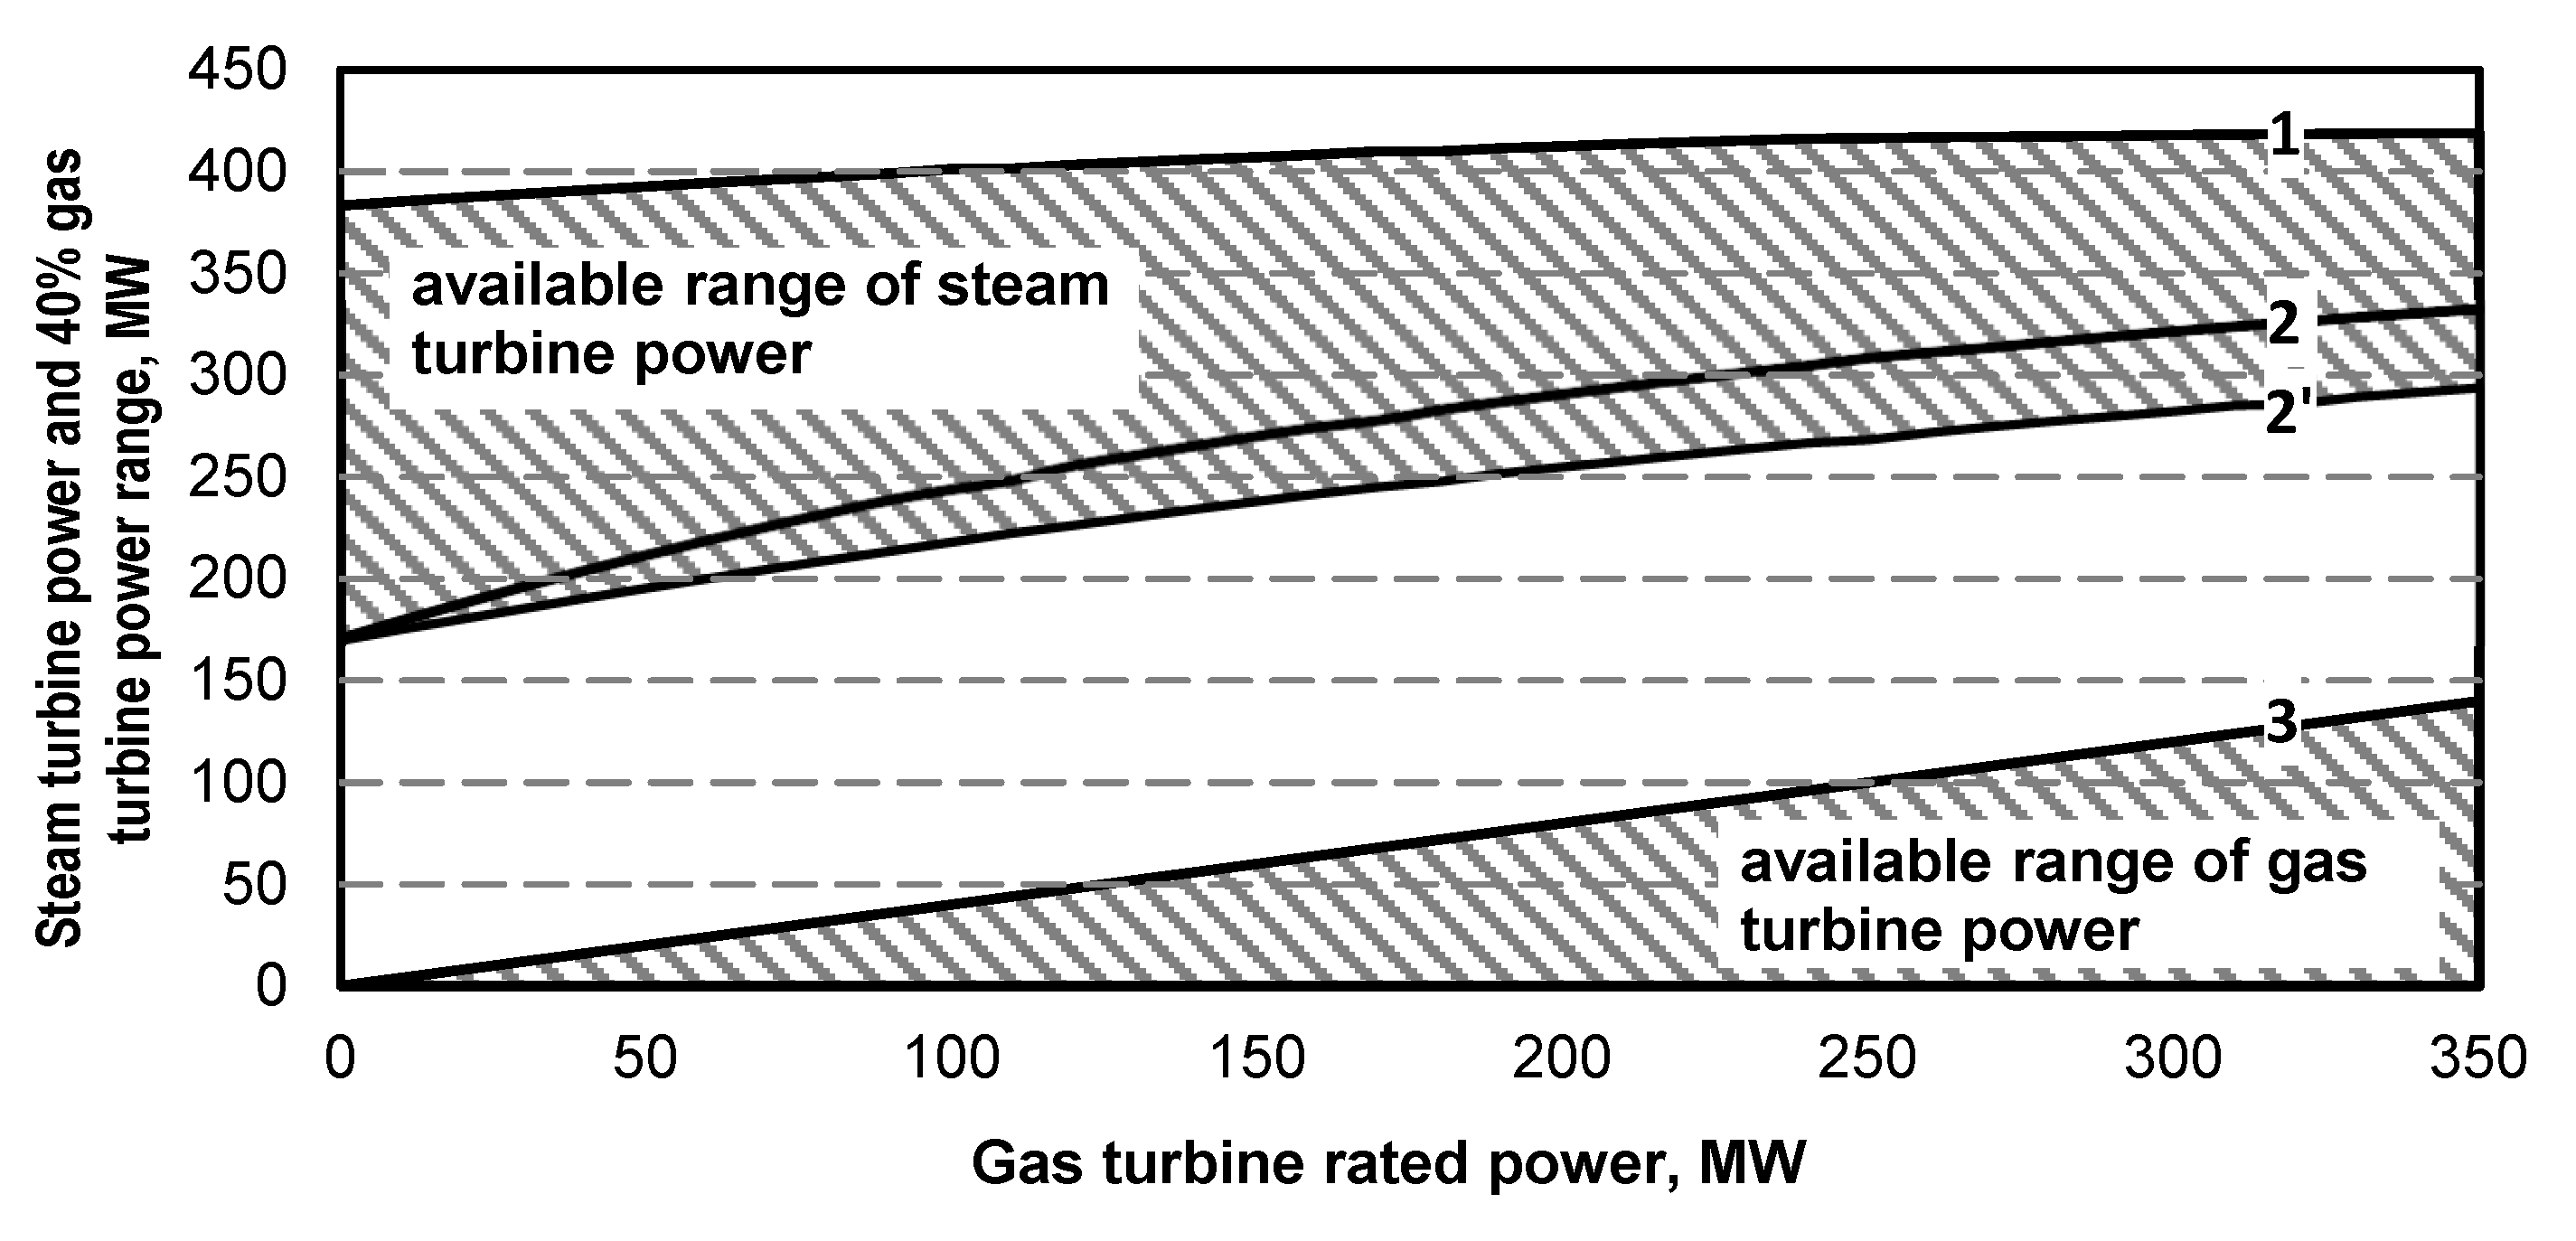
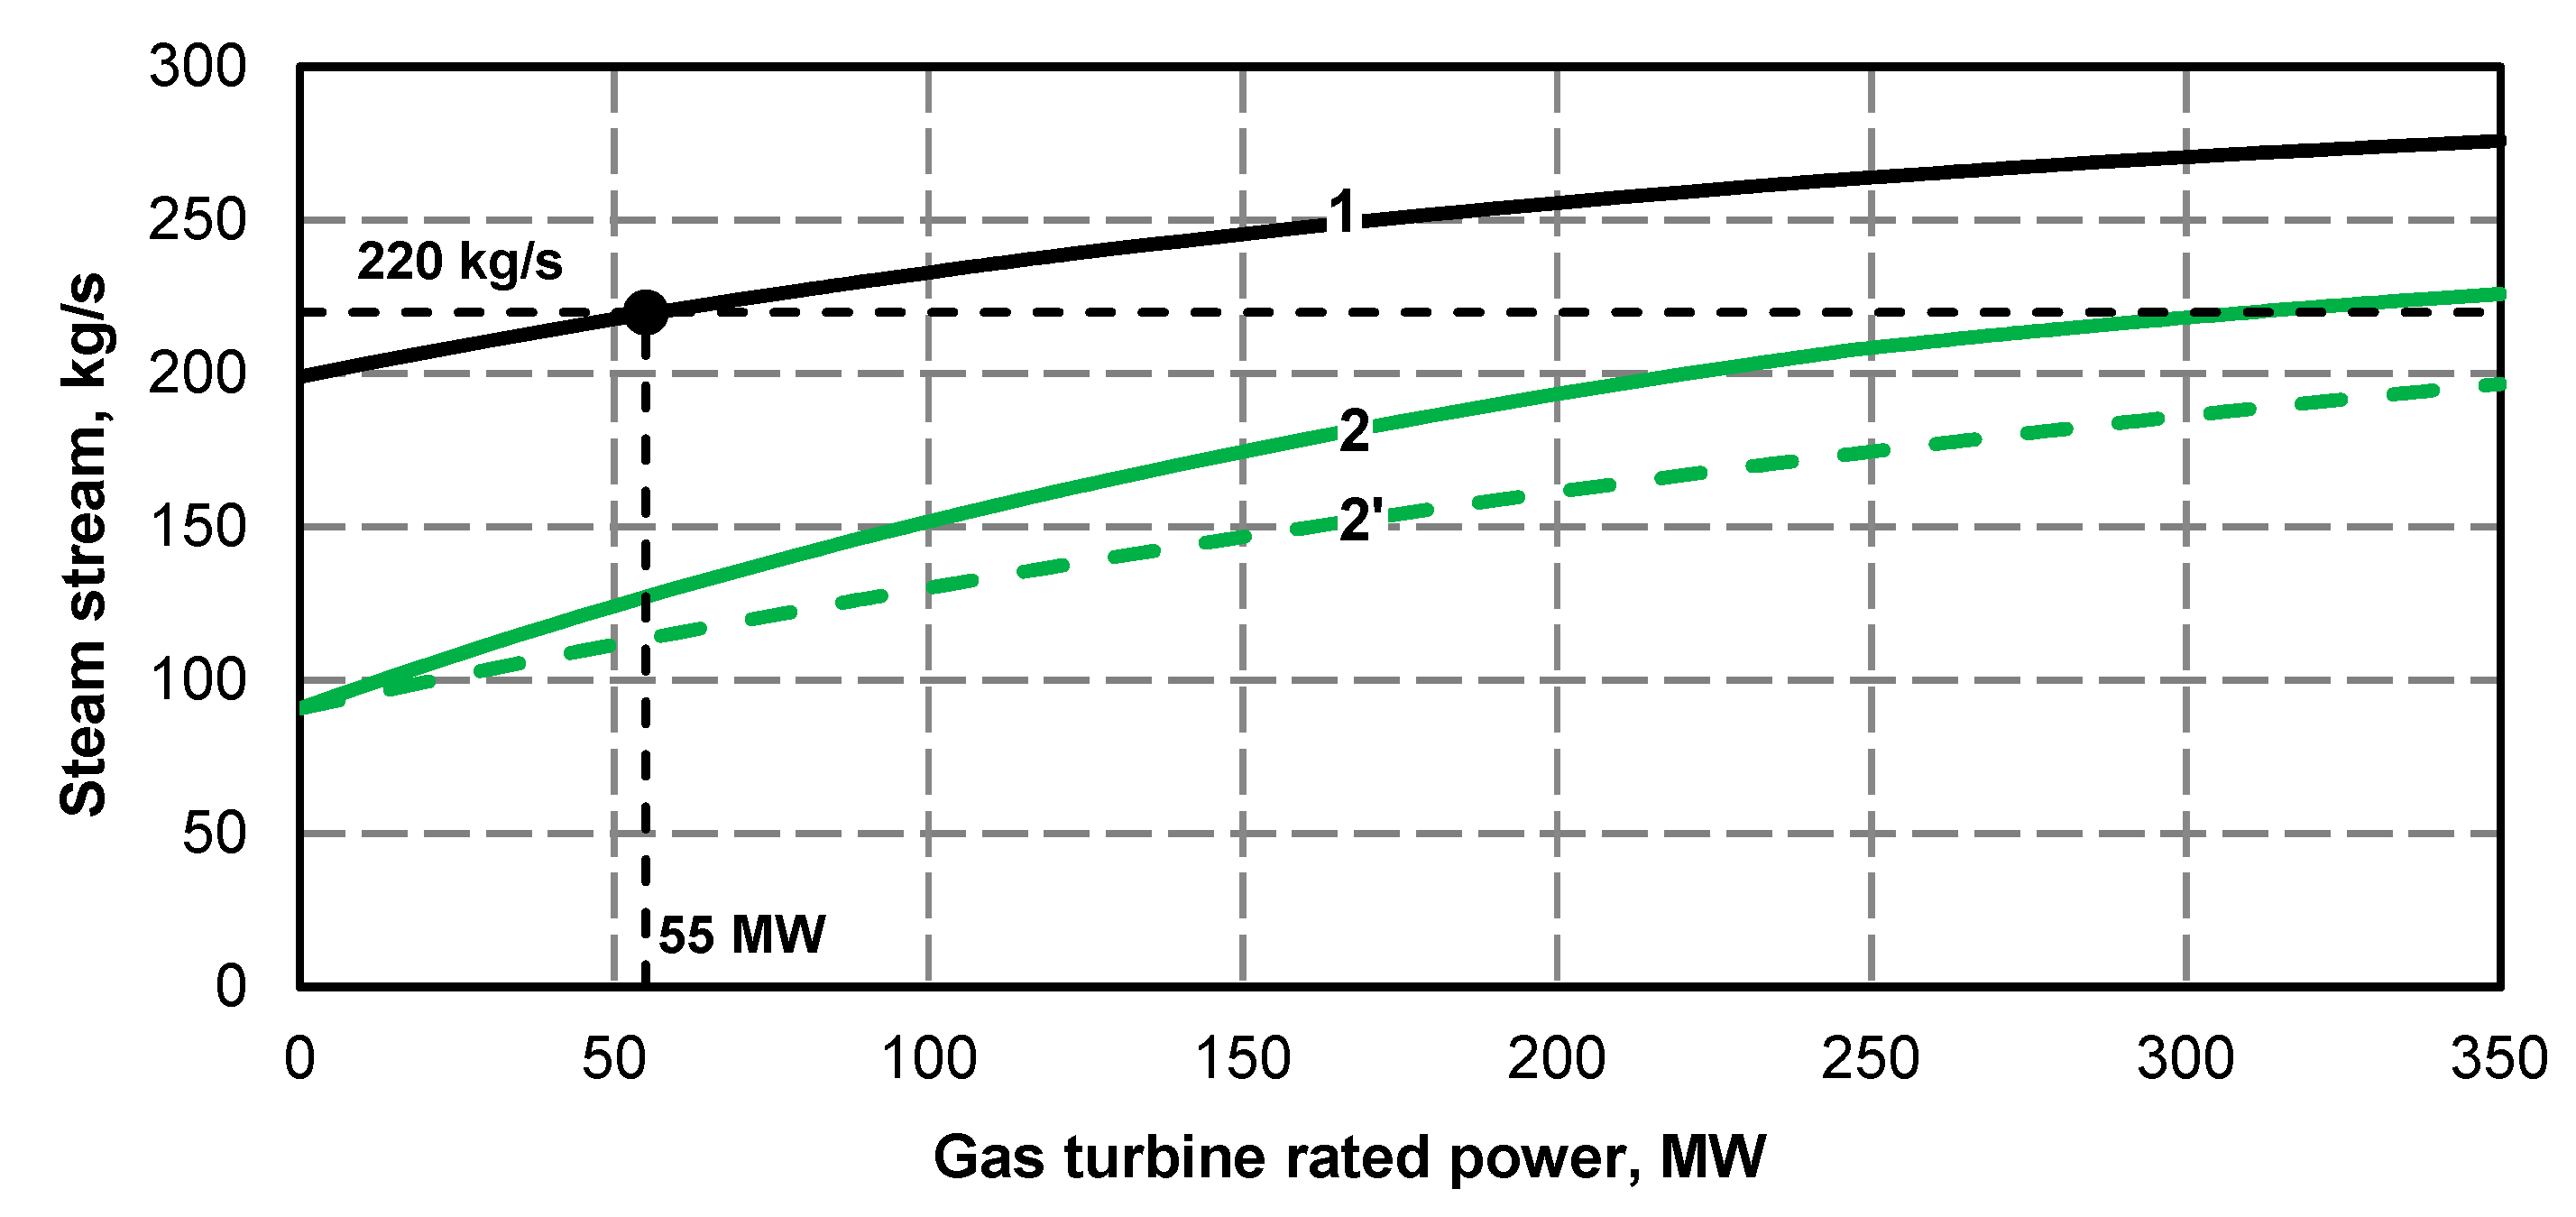
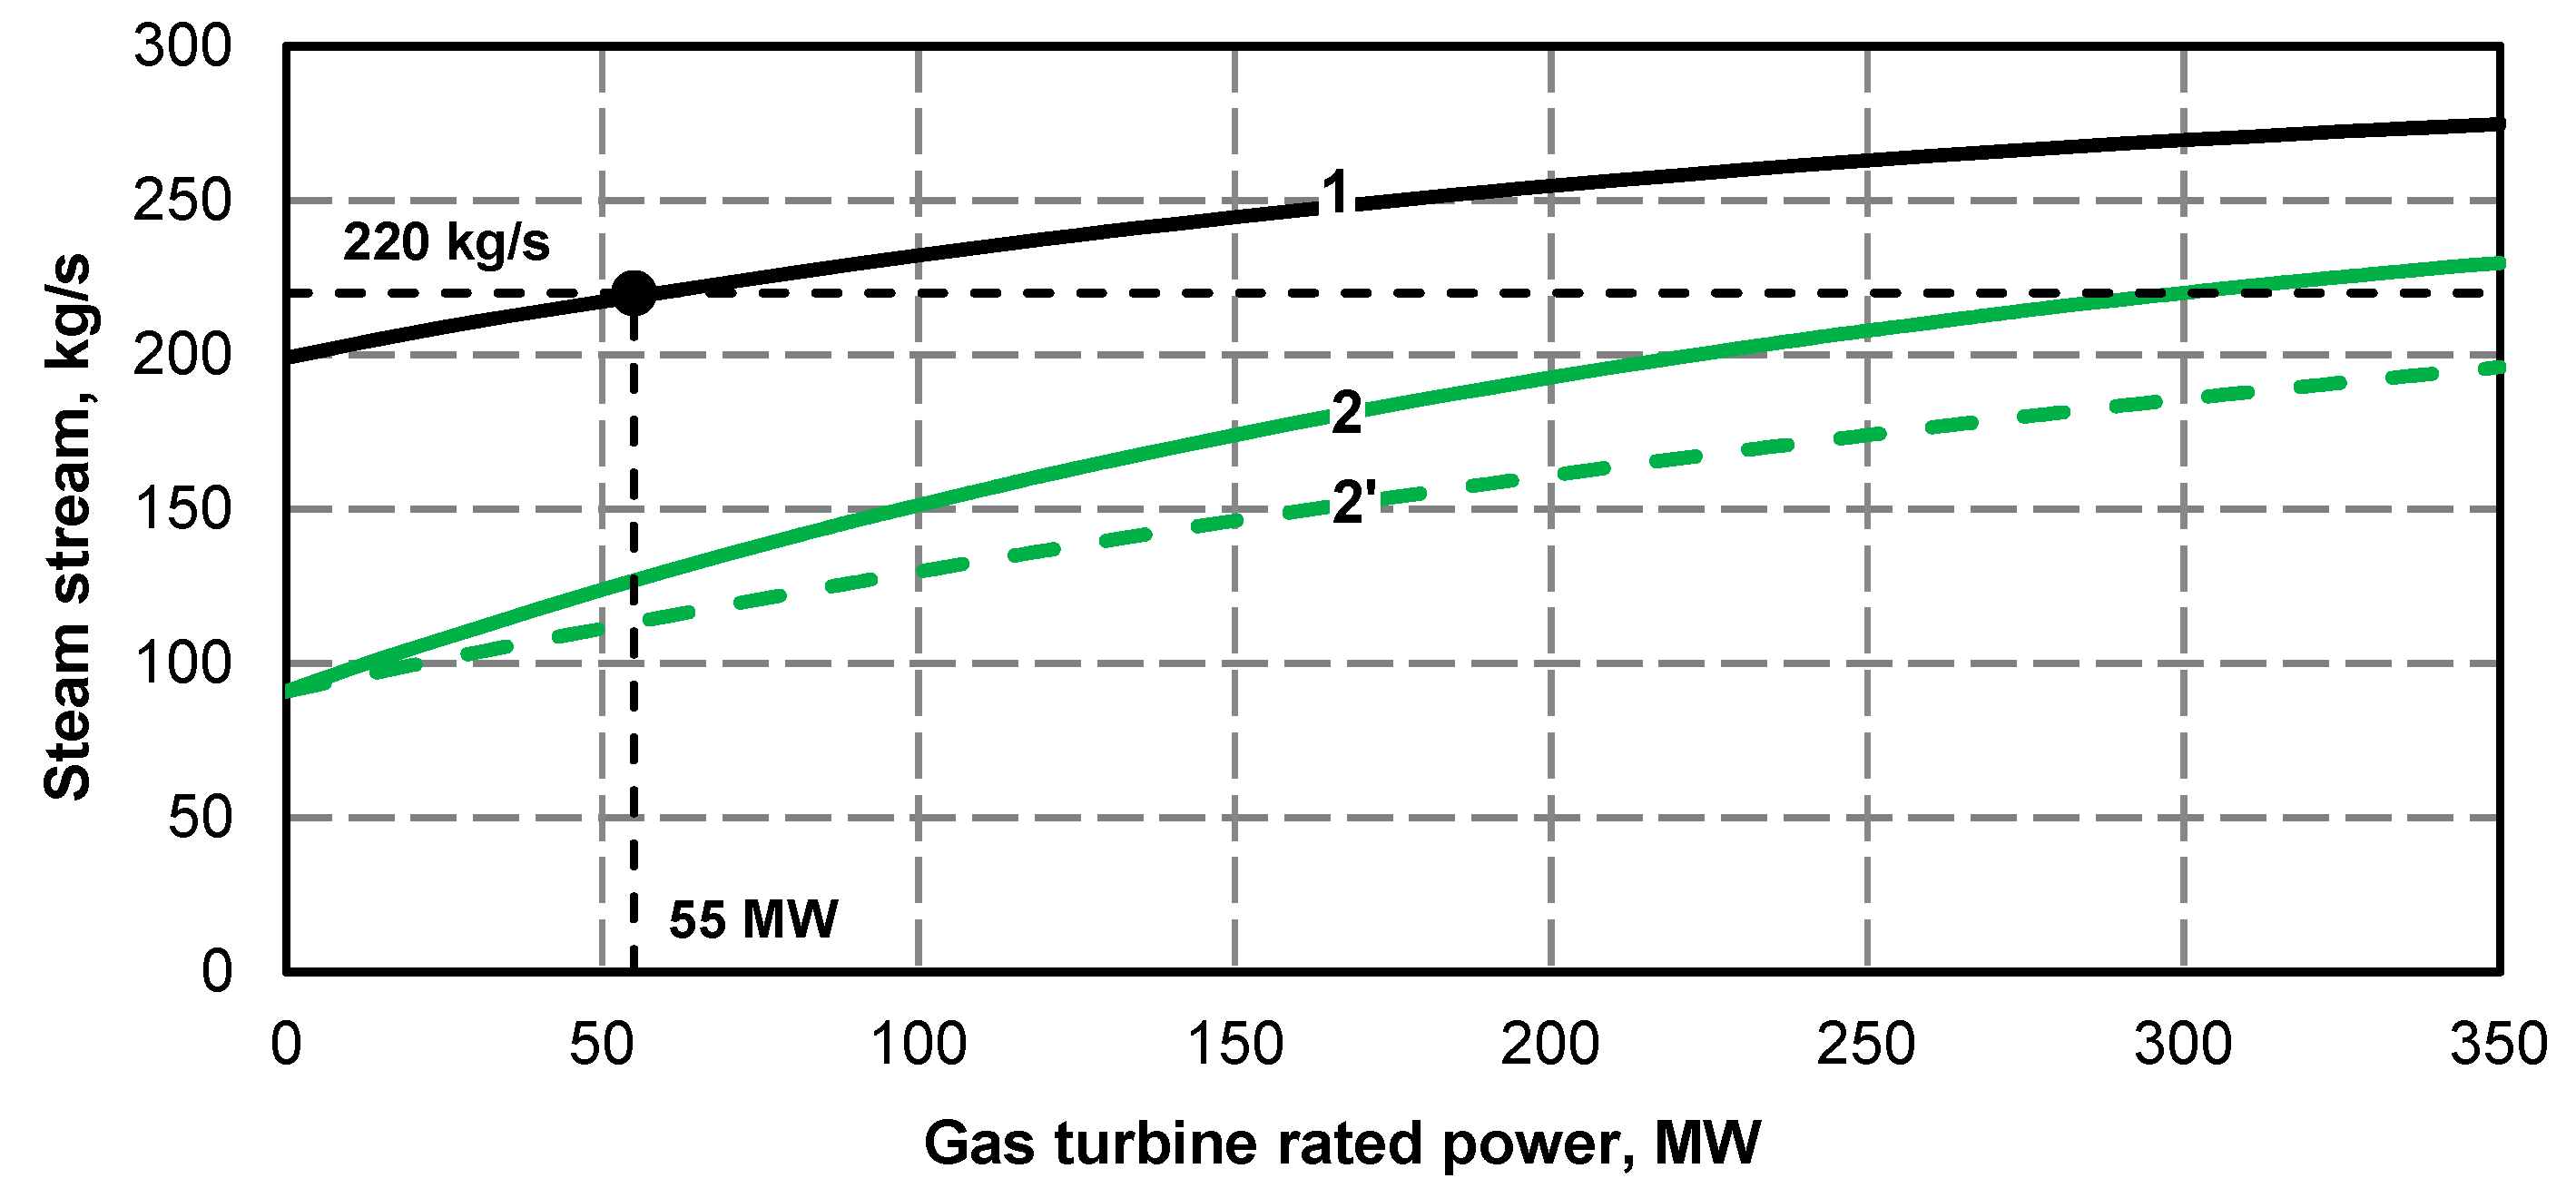
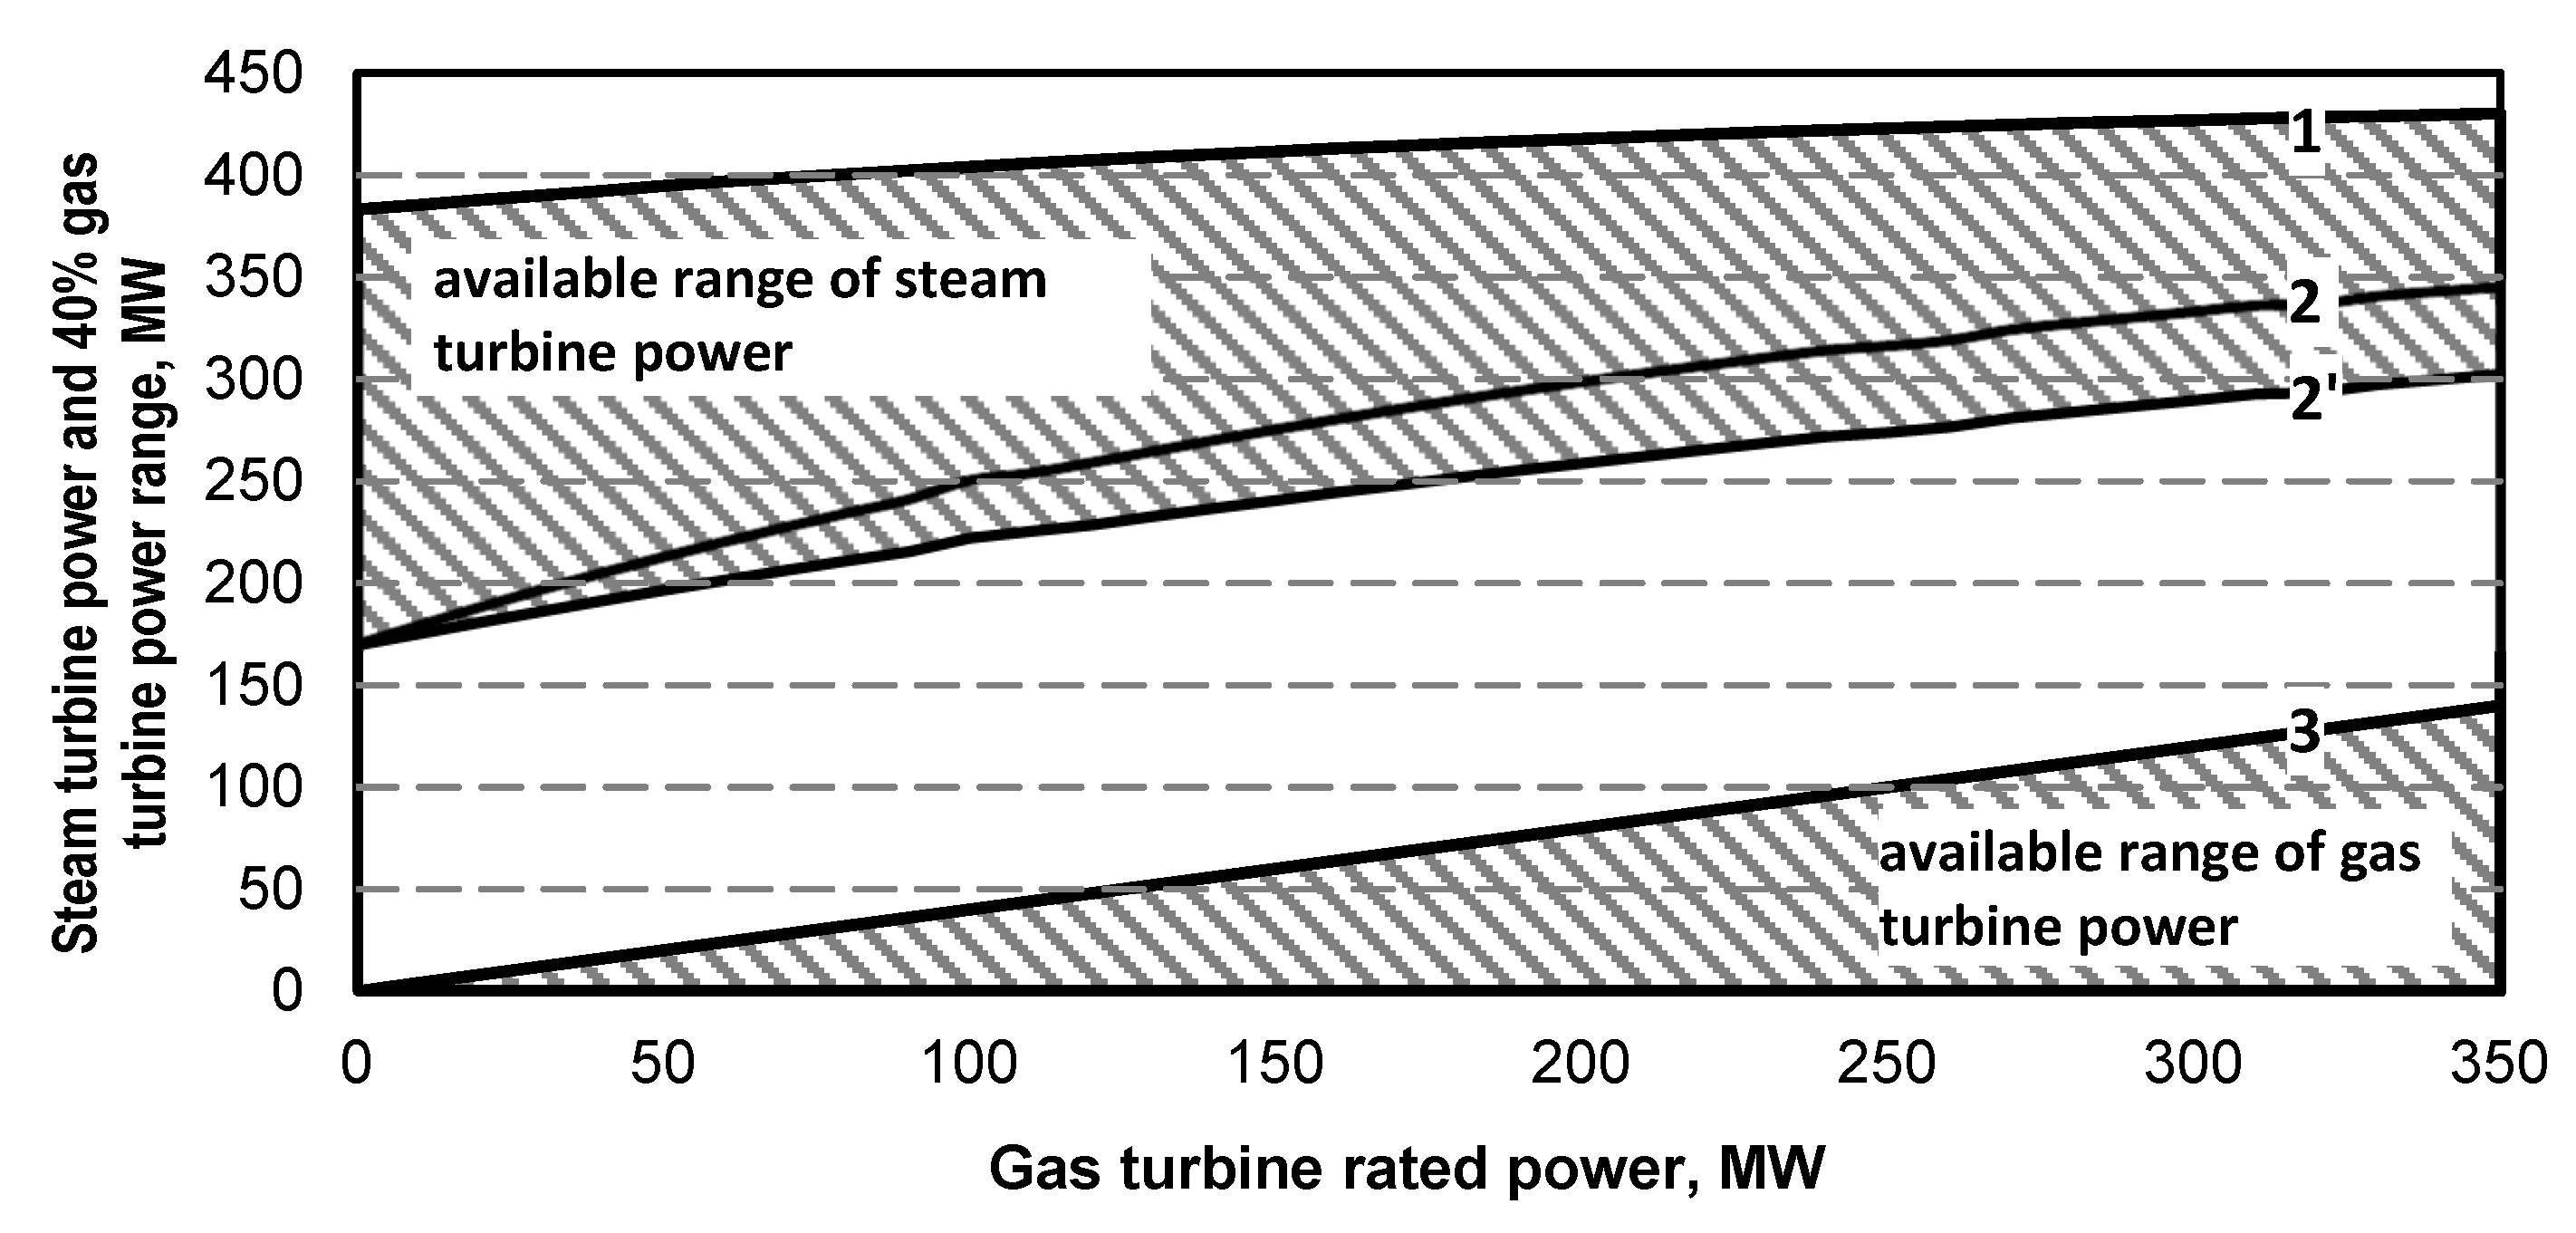
The increase in gas turbine power raises the steam turbine power by as much as approximately 40 MW from the value of approximately 380 MW to approximately 420 MW for the gas turbine power of 350 MW (Figure 15). This gain results only from the power increase in the low-pressure part of the turbine caused by increased flow of steam stream through it due to reduced extraction steam streams fed to XN1–XN4 regeneration exchangers. The power of high and low-pressure part hardly changes [30]. The power gain stimulates the increase of blade system overload of the low-pressure steam turbine and the overload of the power generator coupled with it. The maximum allowable GTHW-370 generator overload is 406 MW. The overload of the low-pressure turbine part increases the bending stresses in the blades as a result of increased aerodynamic forces, higher stresses in the body, guiding disks and the pressure on the thrust bearing. The last stage blades are exposed to the highest risk of damage. This is because they are exposed to high tensile stresses caused by the centrifugal force, even with no overload. In case of low-pressure turbine overloads it is also important to suspend the flow of steam through its last stages. The stream of steam outgoing from the low-pressure part through the throat to the condenser should not be permanently higher by approximately 10% than the flow at a rated load. For the 18K370 turbine this rated (reference) flow is 202 kg/s, while the maximum allowable is 220 kg/s. Higher values require higher throat cross-sections. Therefore, there is an upper limit value for gas turbine power, which, if exceeded, needs a new, higher throughput and power low-pressure steam turbine part, condenser and power generator, which should be taken into account when planning investment outlays on power unit superstructure. This limit power for the gas turbine is approximately 55 MW (Figure 14).
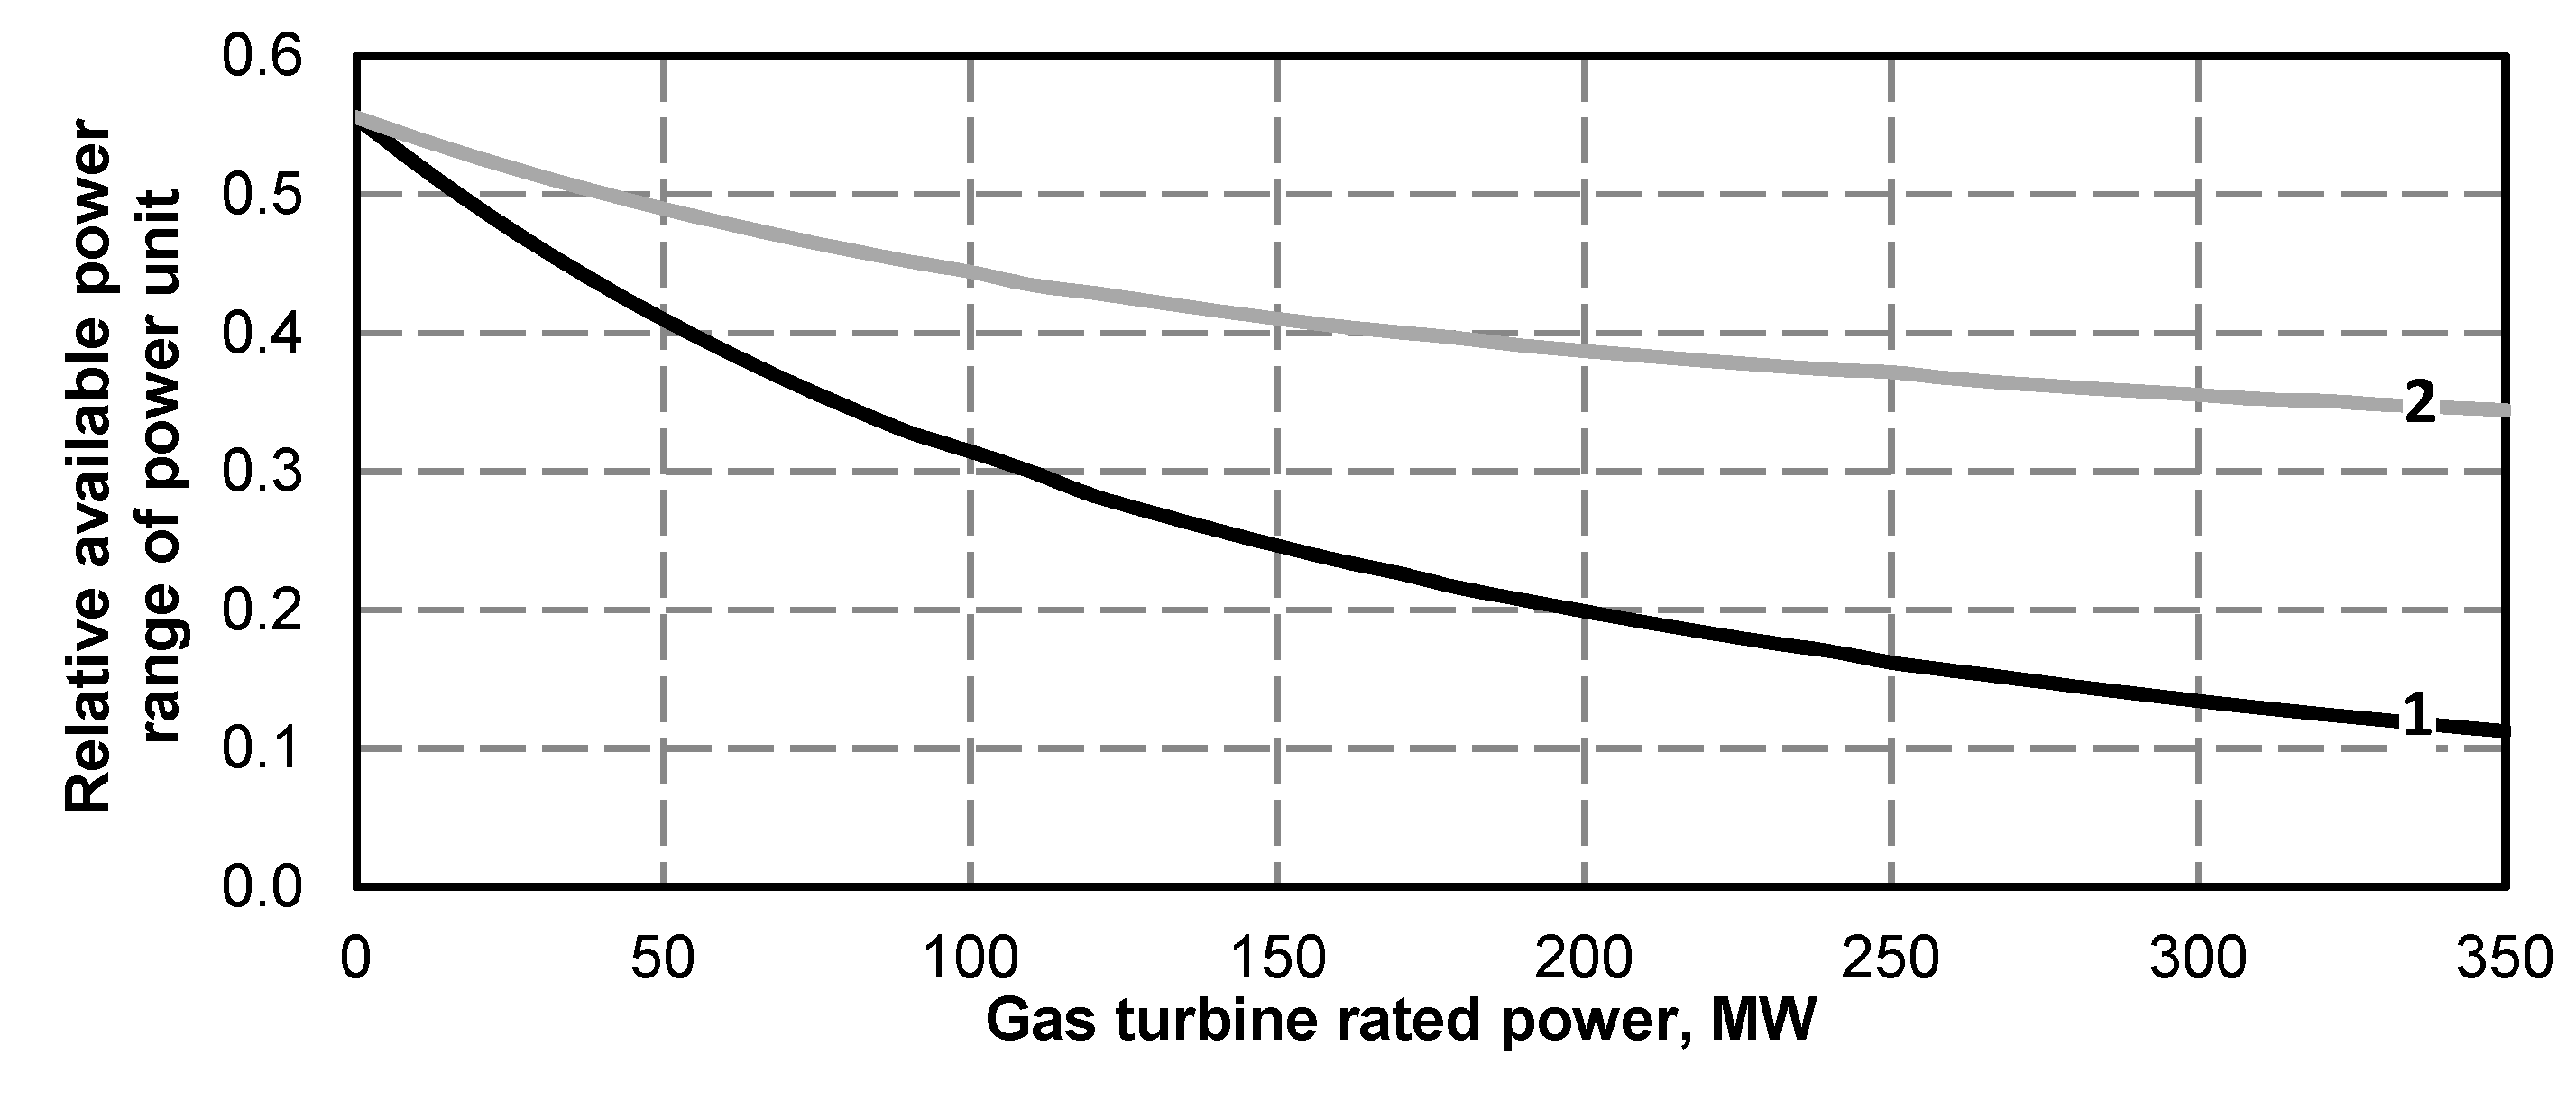
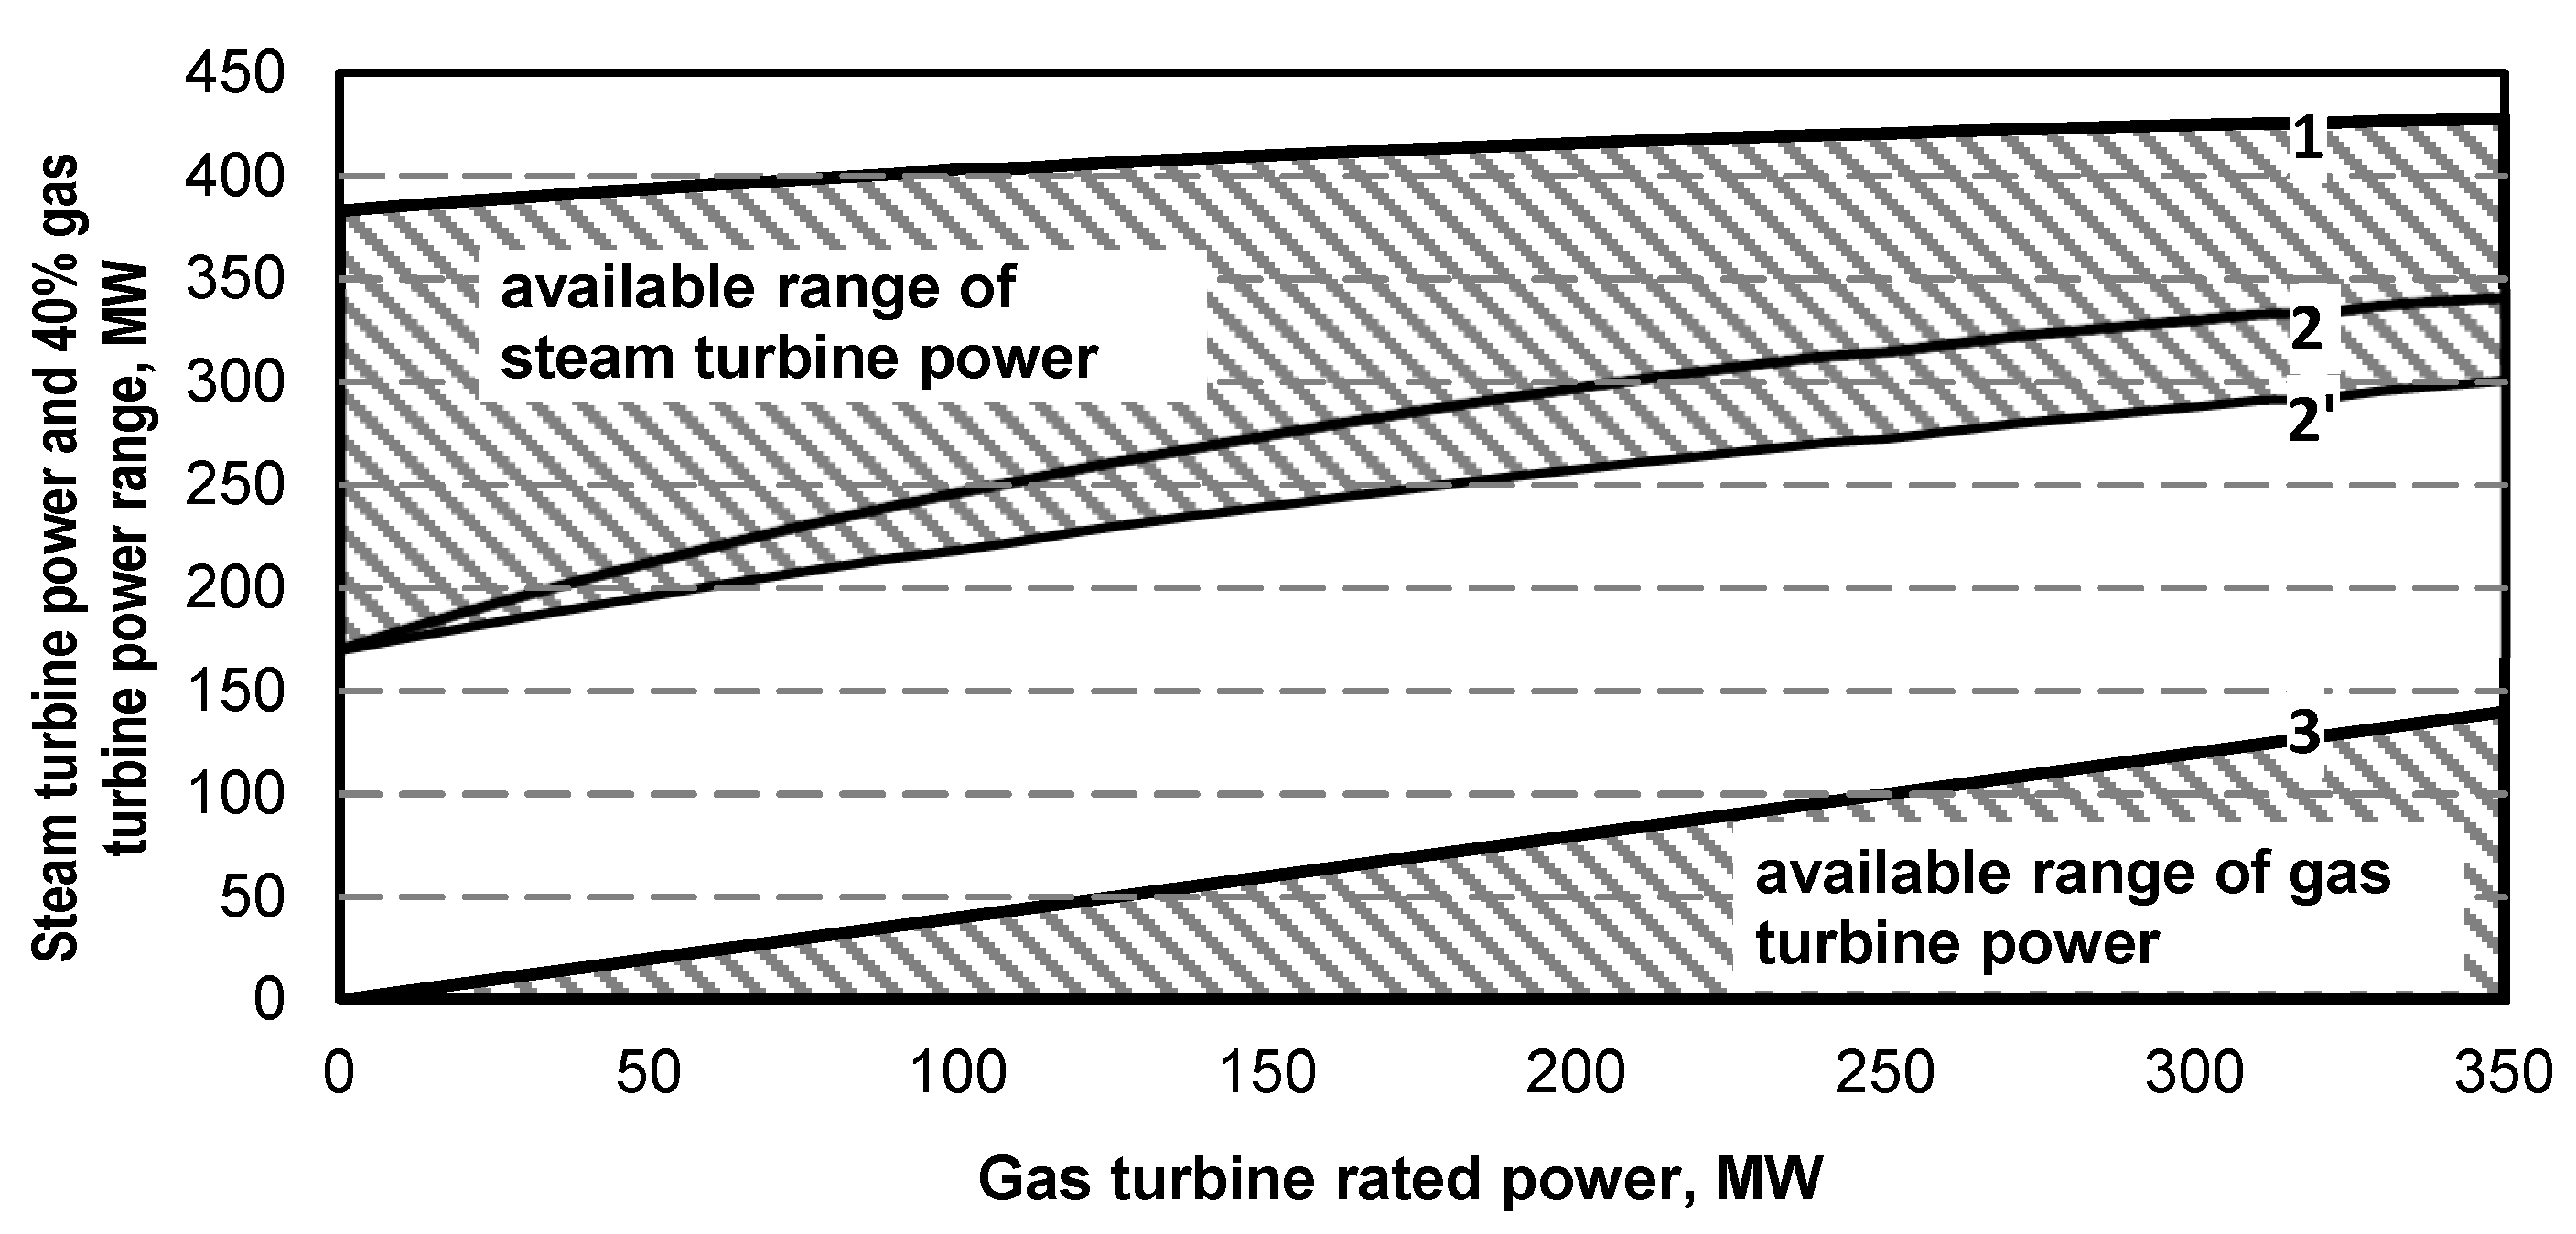
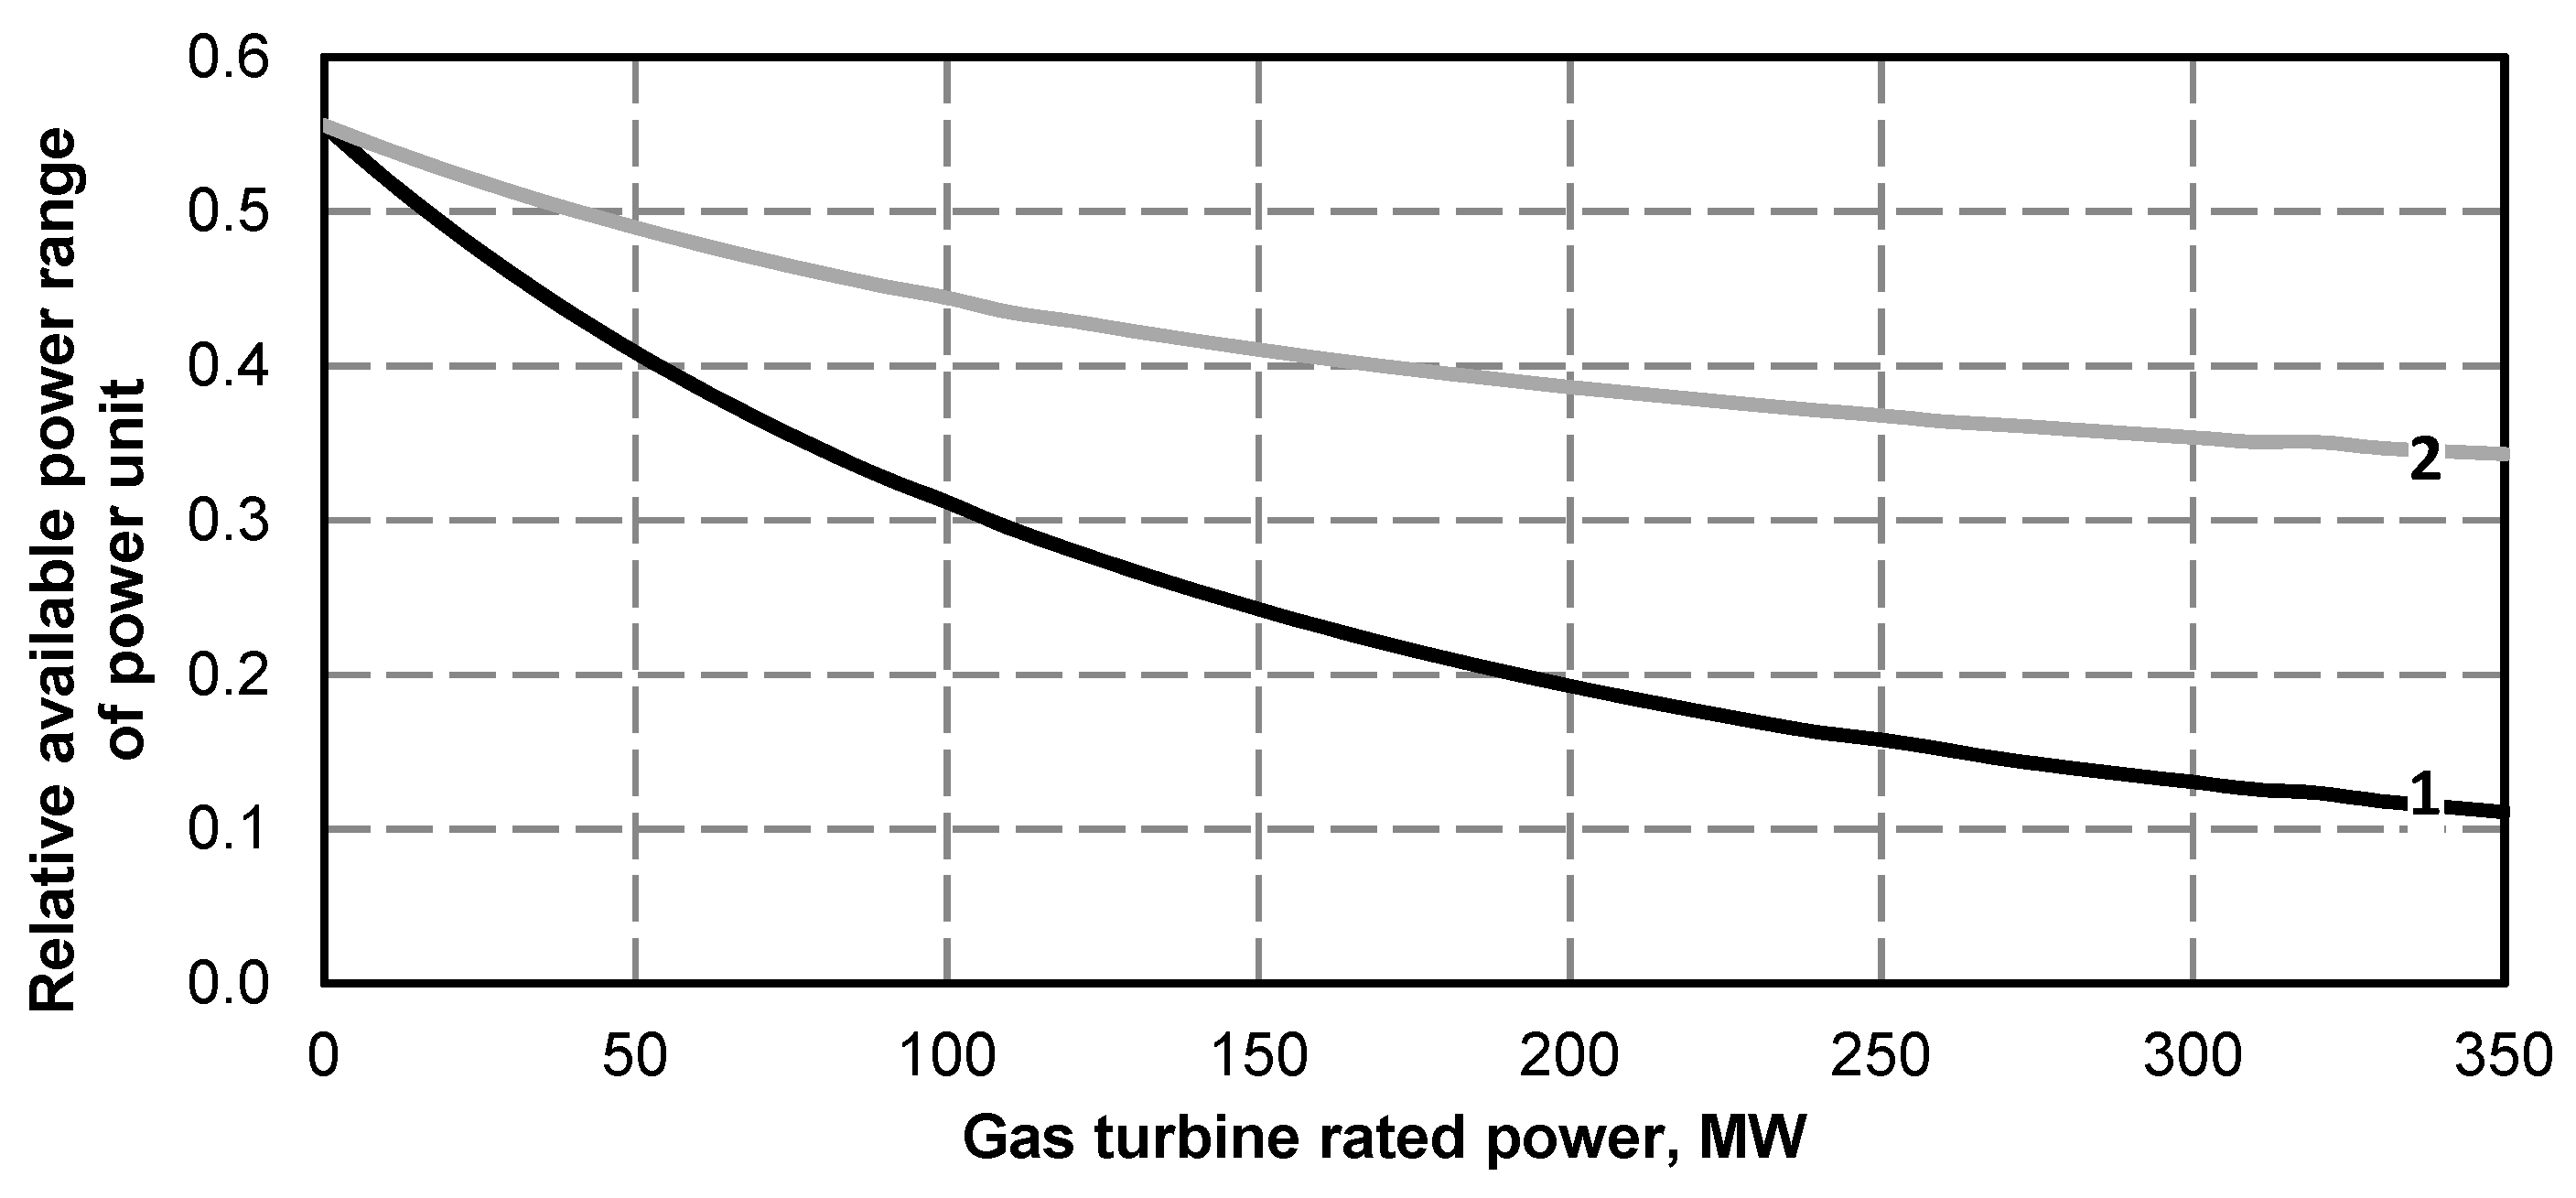
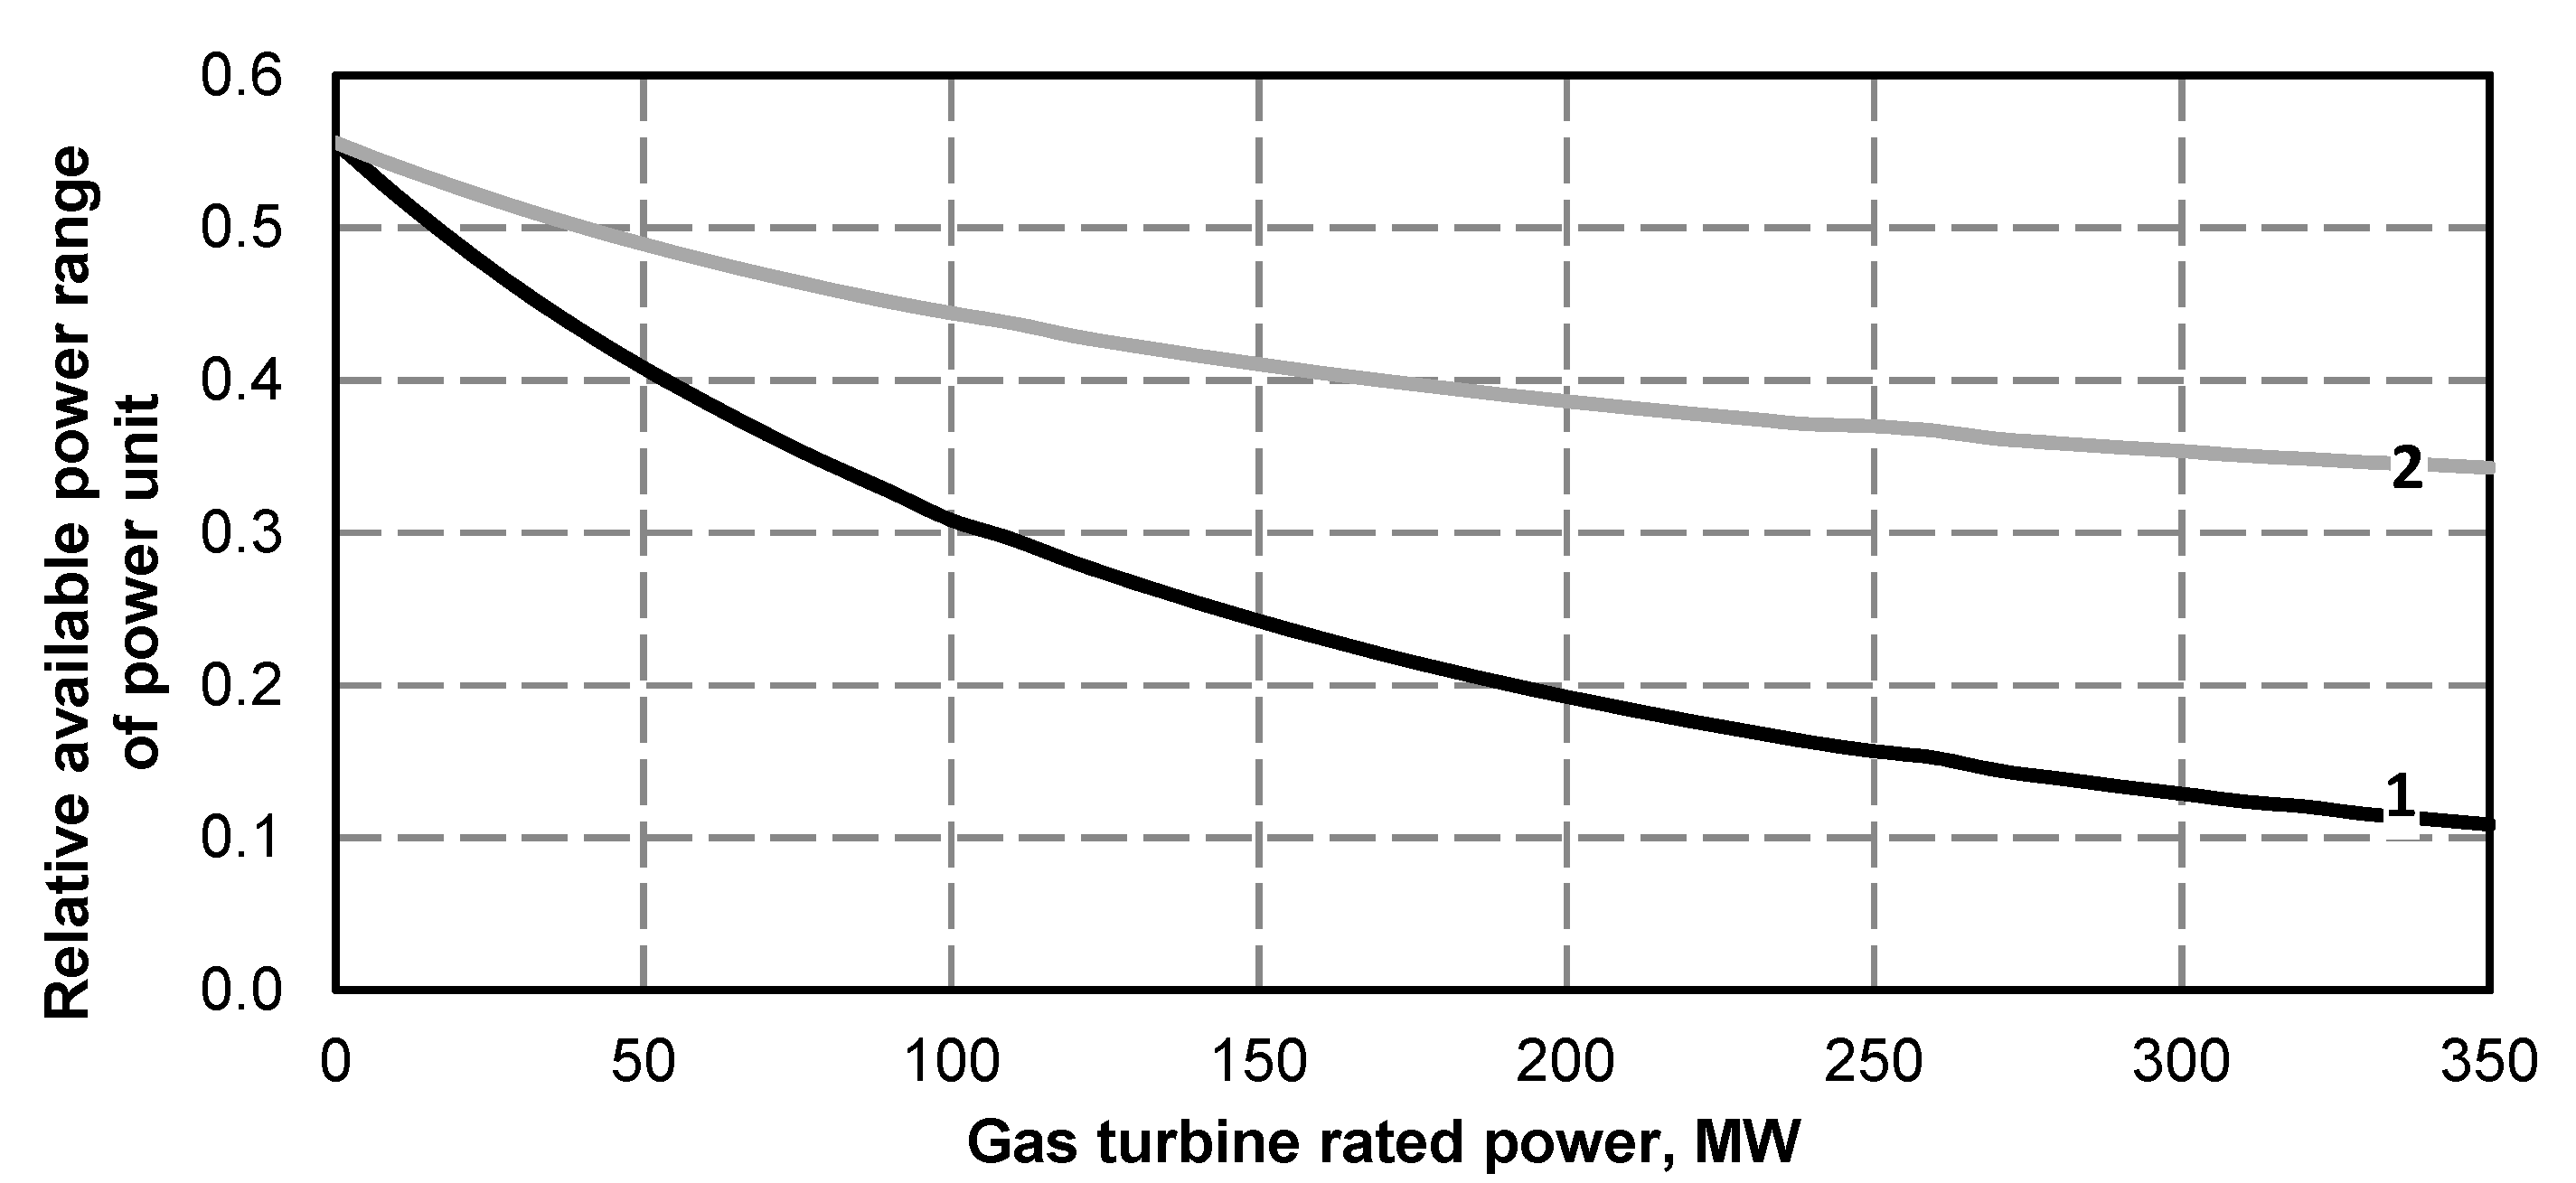
Figure 15 shows that the available power of steam turbine depends on the gas turbine power and it decreases as the power grows. Curves 1 and 2 in Figure 16 restrict the range of its power for situations when the gas turbine operates only with its rated power, i.e. with its maximum energy efficiency, which is most favourable both for thermodynamic and economic reasons. The highest power range of the steam turbine is observed for its operation with no power unit superstructured with a gas turbine and is 200 MW. In percentage, in reference to the maximum power unit power it is, as already mentioned, approximately 53% of maximum permanent power of about 380 MW (Figure 11). The lowest range is observed for the gas turbine power of 350 MW and it is approximately 90 MW, which in percentage makes up only about 12% (=90/(419 + 350)) of its maximum power for the superstructured power unit–curve 1 (Figure 15). Consequently, it is relatively low. To increase it, the gas turbine should operate not only under its fixed rated load, i.e. at its maximum energetic efficiency, but also at a variable power. The maximum allowable gas turbine operation power ranges from 100% to 60% of its rated power. Then, the turbine efficiency decreases linearly down to approximately 85% of rated efficiency under 60% of the maximum load. Its further reduction would gradually convert the gas turbine into just an expensive gas combustion chamber. The absolute value for the available range of power changes in the superstructured power unit increases significantly in this power generation management mode, as then it summarises the ranges for both turbine sets. Consequently, curve 2’ in Figure 15 represents a bottom limit for the available steam turbine power range, when the gas turbine operates at 60% of its rated power. For example, with the 370 MW power unit superstructured with a 350 MW gas turbine the available power range is approximately 265 MW (=125 + 0.4 × 350), and it allows for its operation in the power system control, though its percentage is lower from the absolute power unit range without its superstructure and makes up only approximately 34% (265/(419 + 350)) of maximum power (Figure 16).
An alternative for the gas turbine set with a variable power could be to shut off the generation at a low power demand in the national power system and using the power unit control operation only within the available range of power change for the steam turbine set. The disadvantage of this operation is a step power unit power reduction, the more intense, the higher is the value of gas turbine power.

2.2. Double-Pressure Boiler System

In the gas turbine system with a double-pressure boiler, the recovery boiler uses, in addition to condensate heating and fresh steam generation, also to generate reheated steam, which extends the use of its enthalpy–the stream of condensate from the KQ1 condenser to low-pressure regeneration disappears only when the steam boiler operates at a fixed minimum efficiency and with the rated gas turbine power (Figure 17, curve 2).
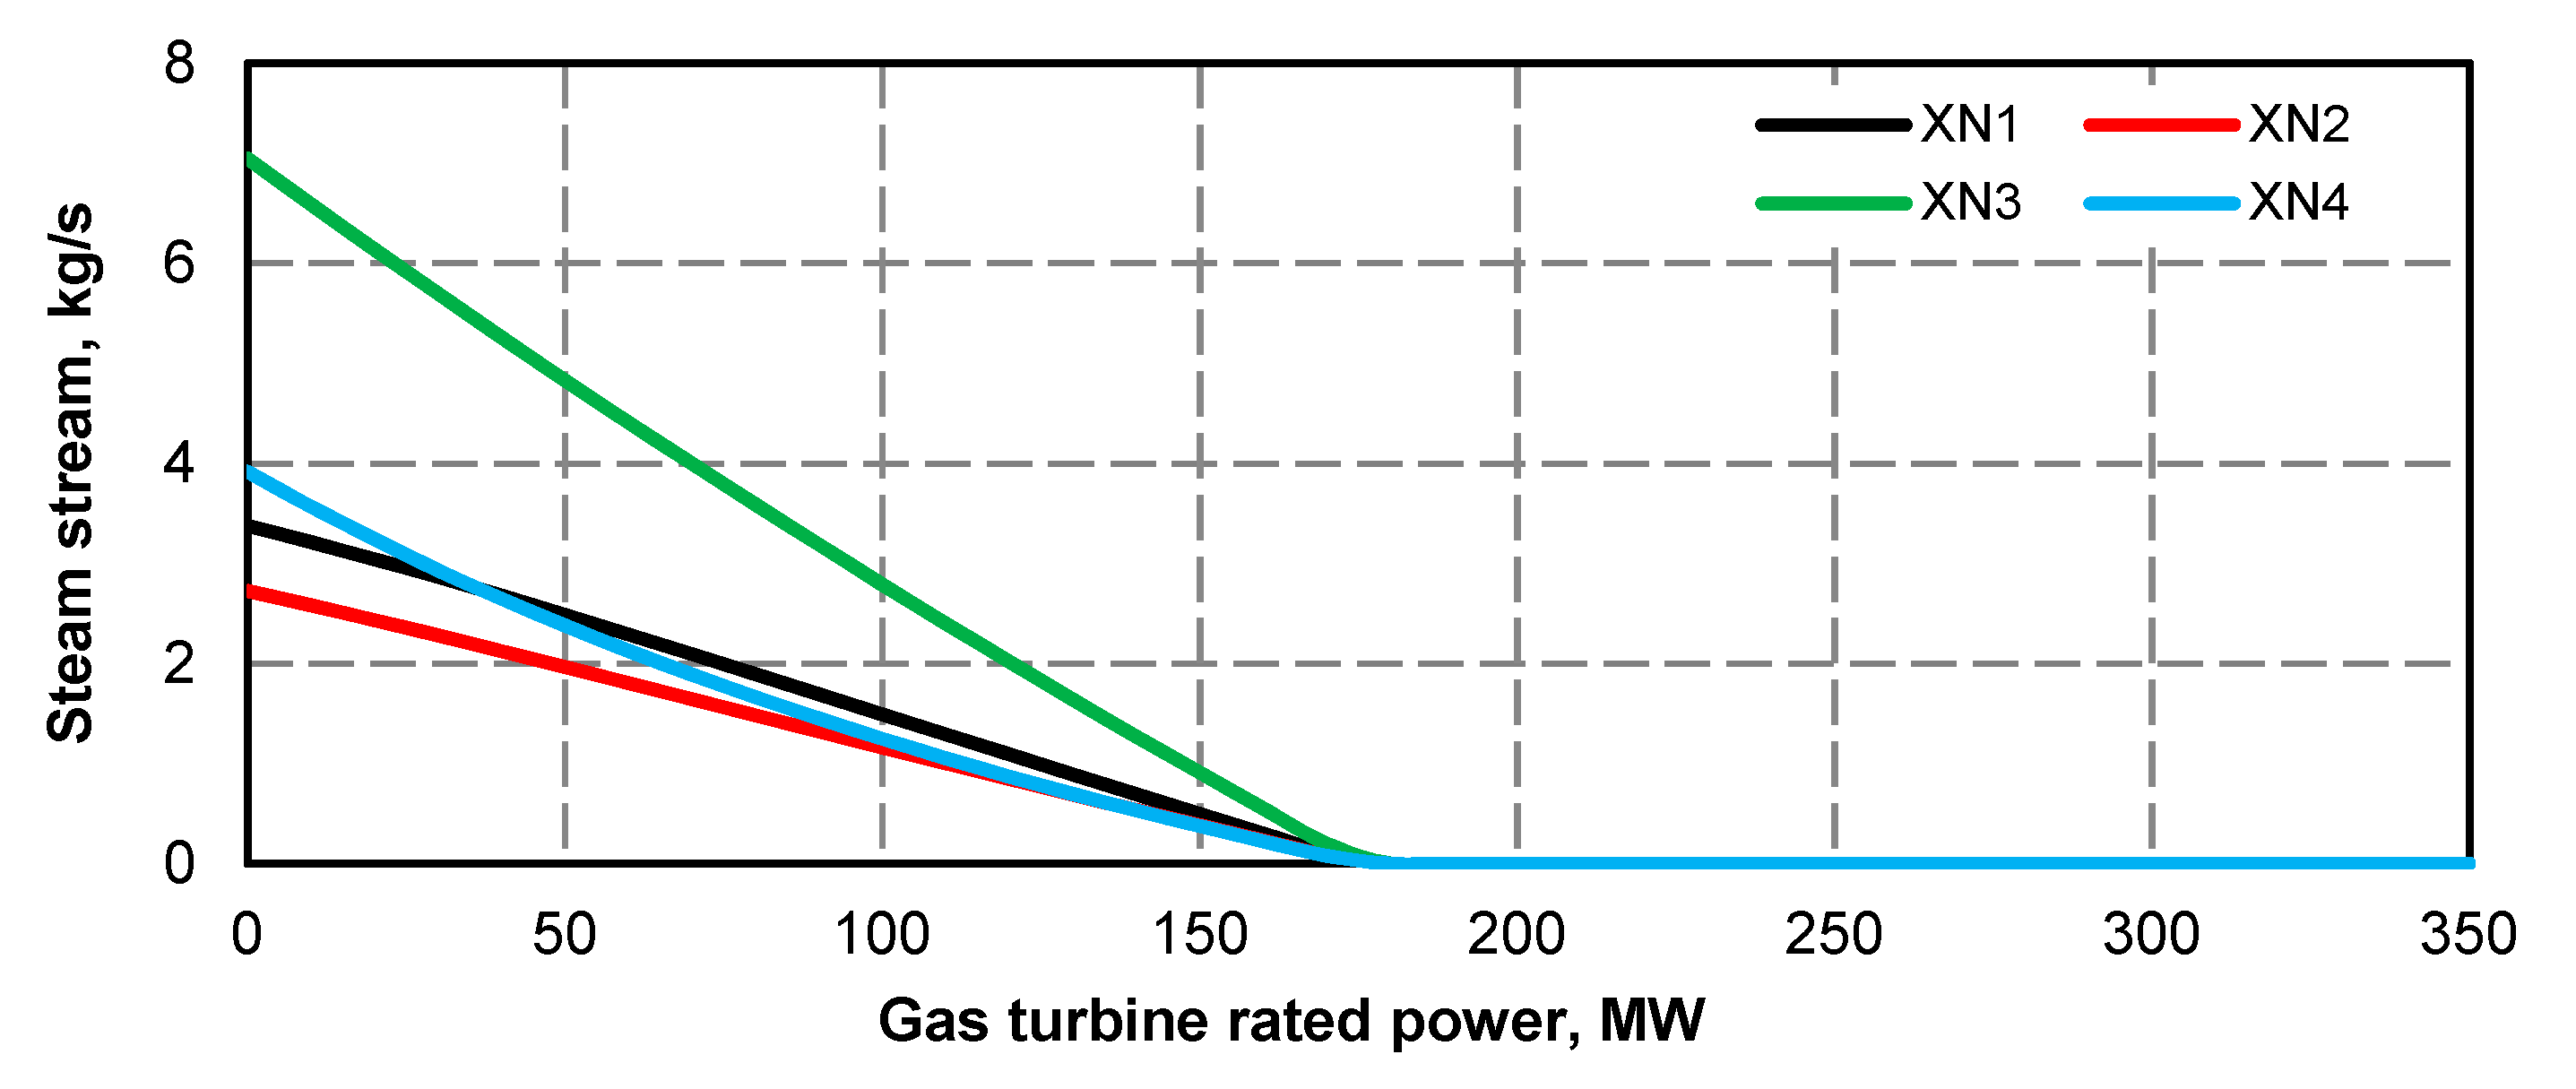
Figure 18, Figure 19 and Figure 20 show the changes in extraction steam streams fed to particular low-pressure regeneration exchangers caused by the change in condensate flow change (Figure 17).
As it can be seen, reducing the condensate stream fed to the exchangers of low-pressure regeneration exchangers decreases proportionally the extraction steam volume delivered to the exchangers. Their complete disappearance occurs only for the minimum steam boiler output and when the gas turbine operates at its rated power.
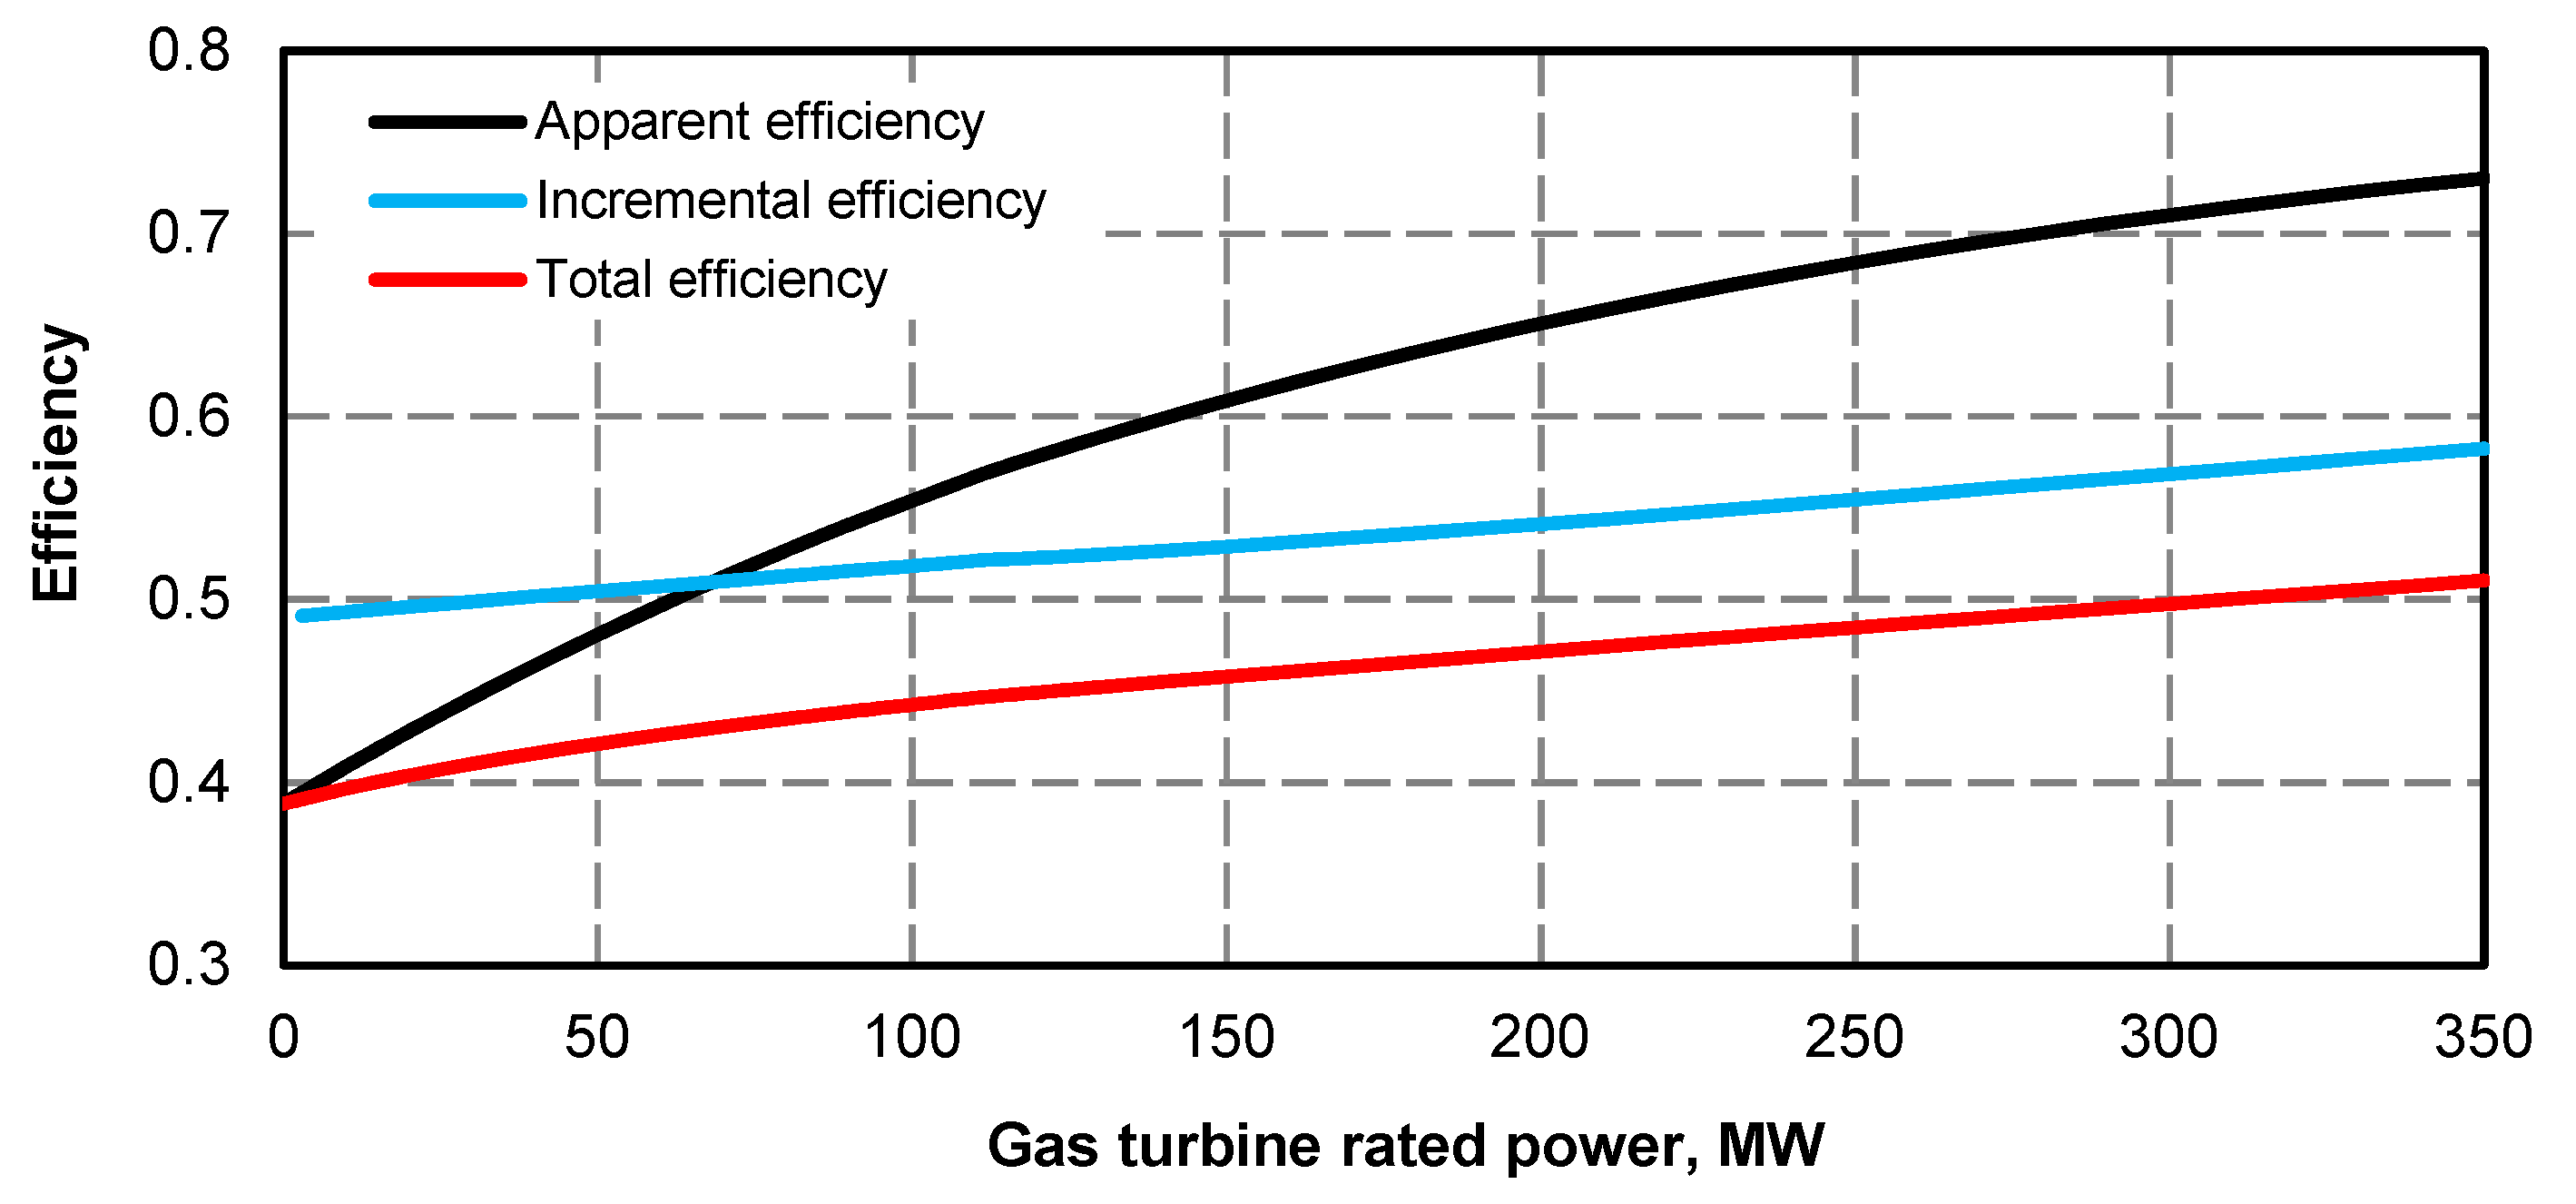
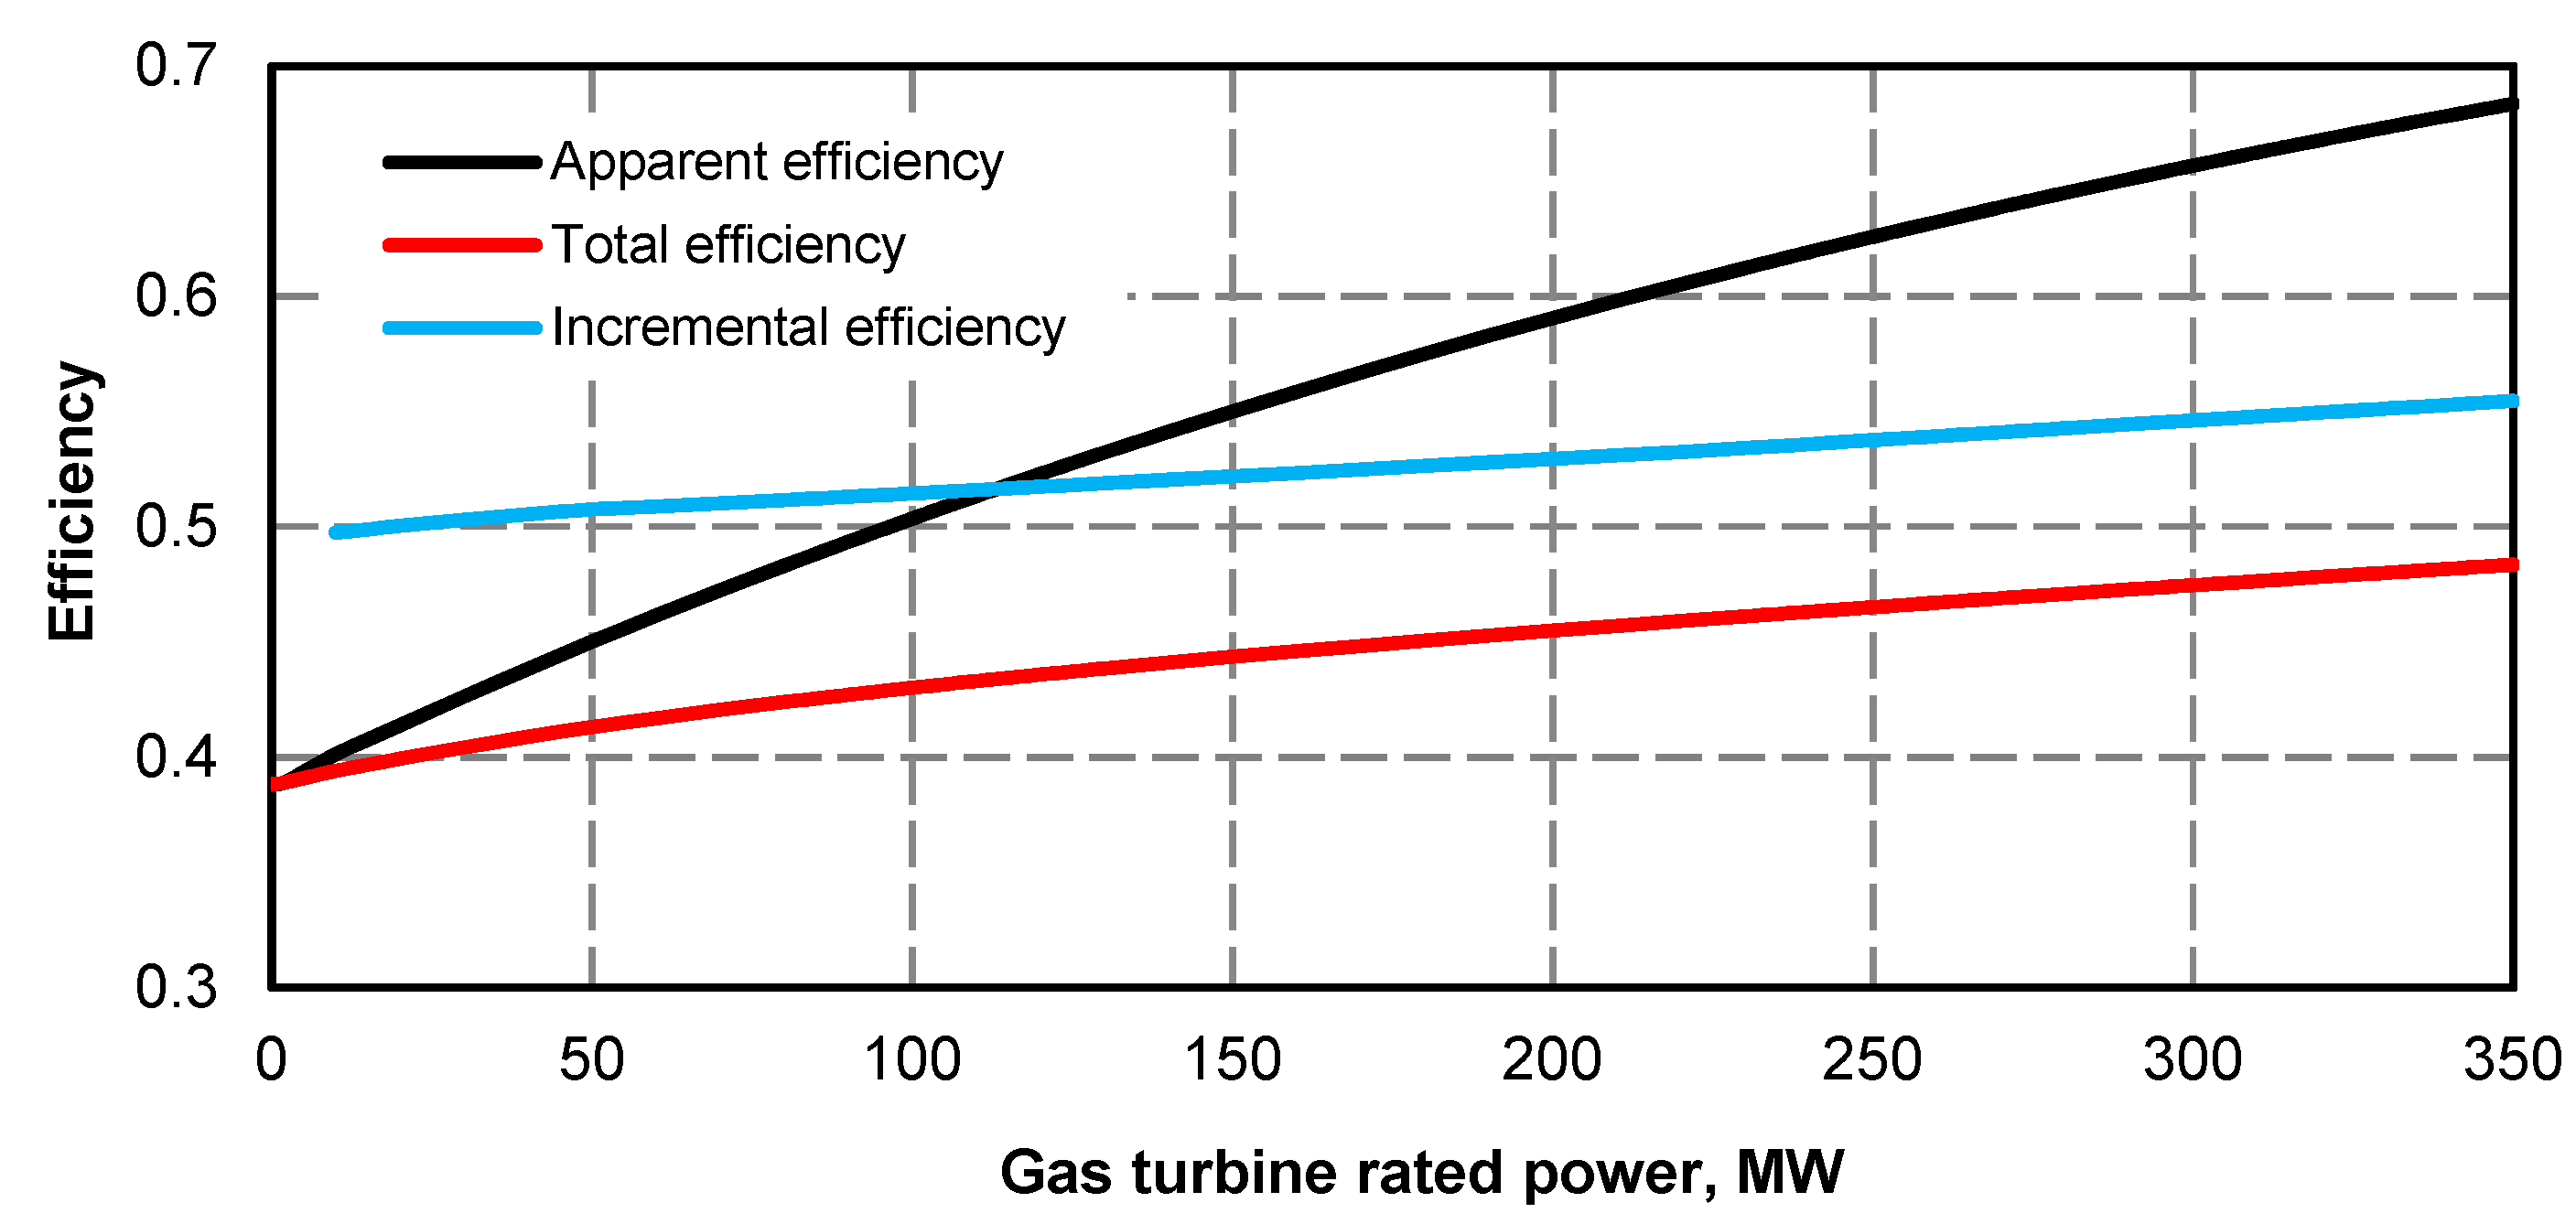
Likewise, in the case of the superstructure with a single-pressure boiler, the energy efficiency for electric power generation increases (Figure 21, Figure 22 and Figure 23).
The shape of curves depicting the energy efficiency (Figure 21 and Figure 23) is similar to curves for the structure with one single-pressure boiler. They reach slightly higher values for the corresponding gas turbine rated power, though.
For the steam turbine operating with a maximum stream of fresh steam, dependencies between fresh steam generation in the steam and recovery boiler were prepared. The sum of those streams is a fixed value amounting to the flow of steam to the steam turbine (Figure 24).
As it can be seen, as compared to the structure fitted with a single-pressure boiler (Figure 12), the amount of fresh steam generated in the recovery double-pressure boiler is slightly lower, which results from the fact that part of exhaust gas enthalpy is also used for reheated steam generation.
During steam boiler operation with a fixed minimum efficiency (Figure 25), the curve of dependency of fresh steam generation to the gas turbine rated power is also similar to the one for the single-pressure boiler (Figure 13). The sum of fresh steam stream is, for the maximum gas turbine power, by about 5 kg/s lower than for the structure with a single-pressure boiler.
Figure 26 presents the dependence between steam valve to the main turbine condenser and the gas turbine rated power. This curve changes only slightly from the curve for the single-pressure boiler structure. Also in this case, the highest gas turbine power that does not require changing the condenser is approximately 55 MW.
The control capacity of the system fitted with a double-pressure recovery boiler changes only slightly from its capacity for the single-pressure boiler. The maximum steam turbine power at a rated fresh steam flow, for the gas turbine power of 350 MW, is approximately 429 MW (Figure 27, curve 1), i.e. by approximately 9 MW more than for the structure with a single-pressure recovery boiler. At the same time, the power of steam turbine is higher by approximately 9 MW at a minimum steam boiler output (Figure 7, curve 2), which causes that the available range of steam turbine power remains unchanged and is about 11% (Figure 28, curve 1).
The operation of gas turbine with a power of 60% of its rated efficiency (Figure 27, curve 2’), increases the control range whose maximum value is approximately 127 MW for a rated gas turbine power of approximately 350 MW. This is the value similar to the value reached for a single-pressure recovery boiler, which will cause that the relative available power level will remain at a similar level (Figure 28).

2.3. Triple-Pressure Boiler System

In the triple-pressure recovery boiler exhaust (flue) gas, in addition to heating the condensate, fresh and reheated steam generation is also used to generate low-pressure steam. It causes that, as compared to other boiler designs, the drop in enthalpy used to heat the condensate stream in the recovery boiler is at the lowest level. Figure 29 shows the condensate flow values to low-pressure regeneration exchangers, while Figure 30, Figure 31 and Figure 32 present the changes of extraction steam streams fed to the exchangers.
As it can be seen for the operation of steam turbine with a maximum steam stream for it, the exhaust (flue) gas enthalpy is insufficient for the maximum gas turbine power to heat the whole stream of condensate flowing from the main turbine condenser. A similar phenomenon can be observed when the boiler operates at its minimum efficiency and at a reduced gas turbine power. The streams of steam transferred to exchangers are subject to lower limitations. However, the power of the low-pressure part of the steam turbine is higher than the power for that part with a single and double-pressure structures, because of the fact that it is additionally fed with steam generated by the triple-pressure boiler.
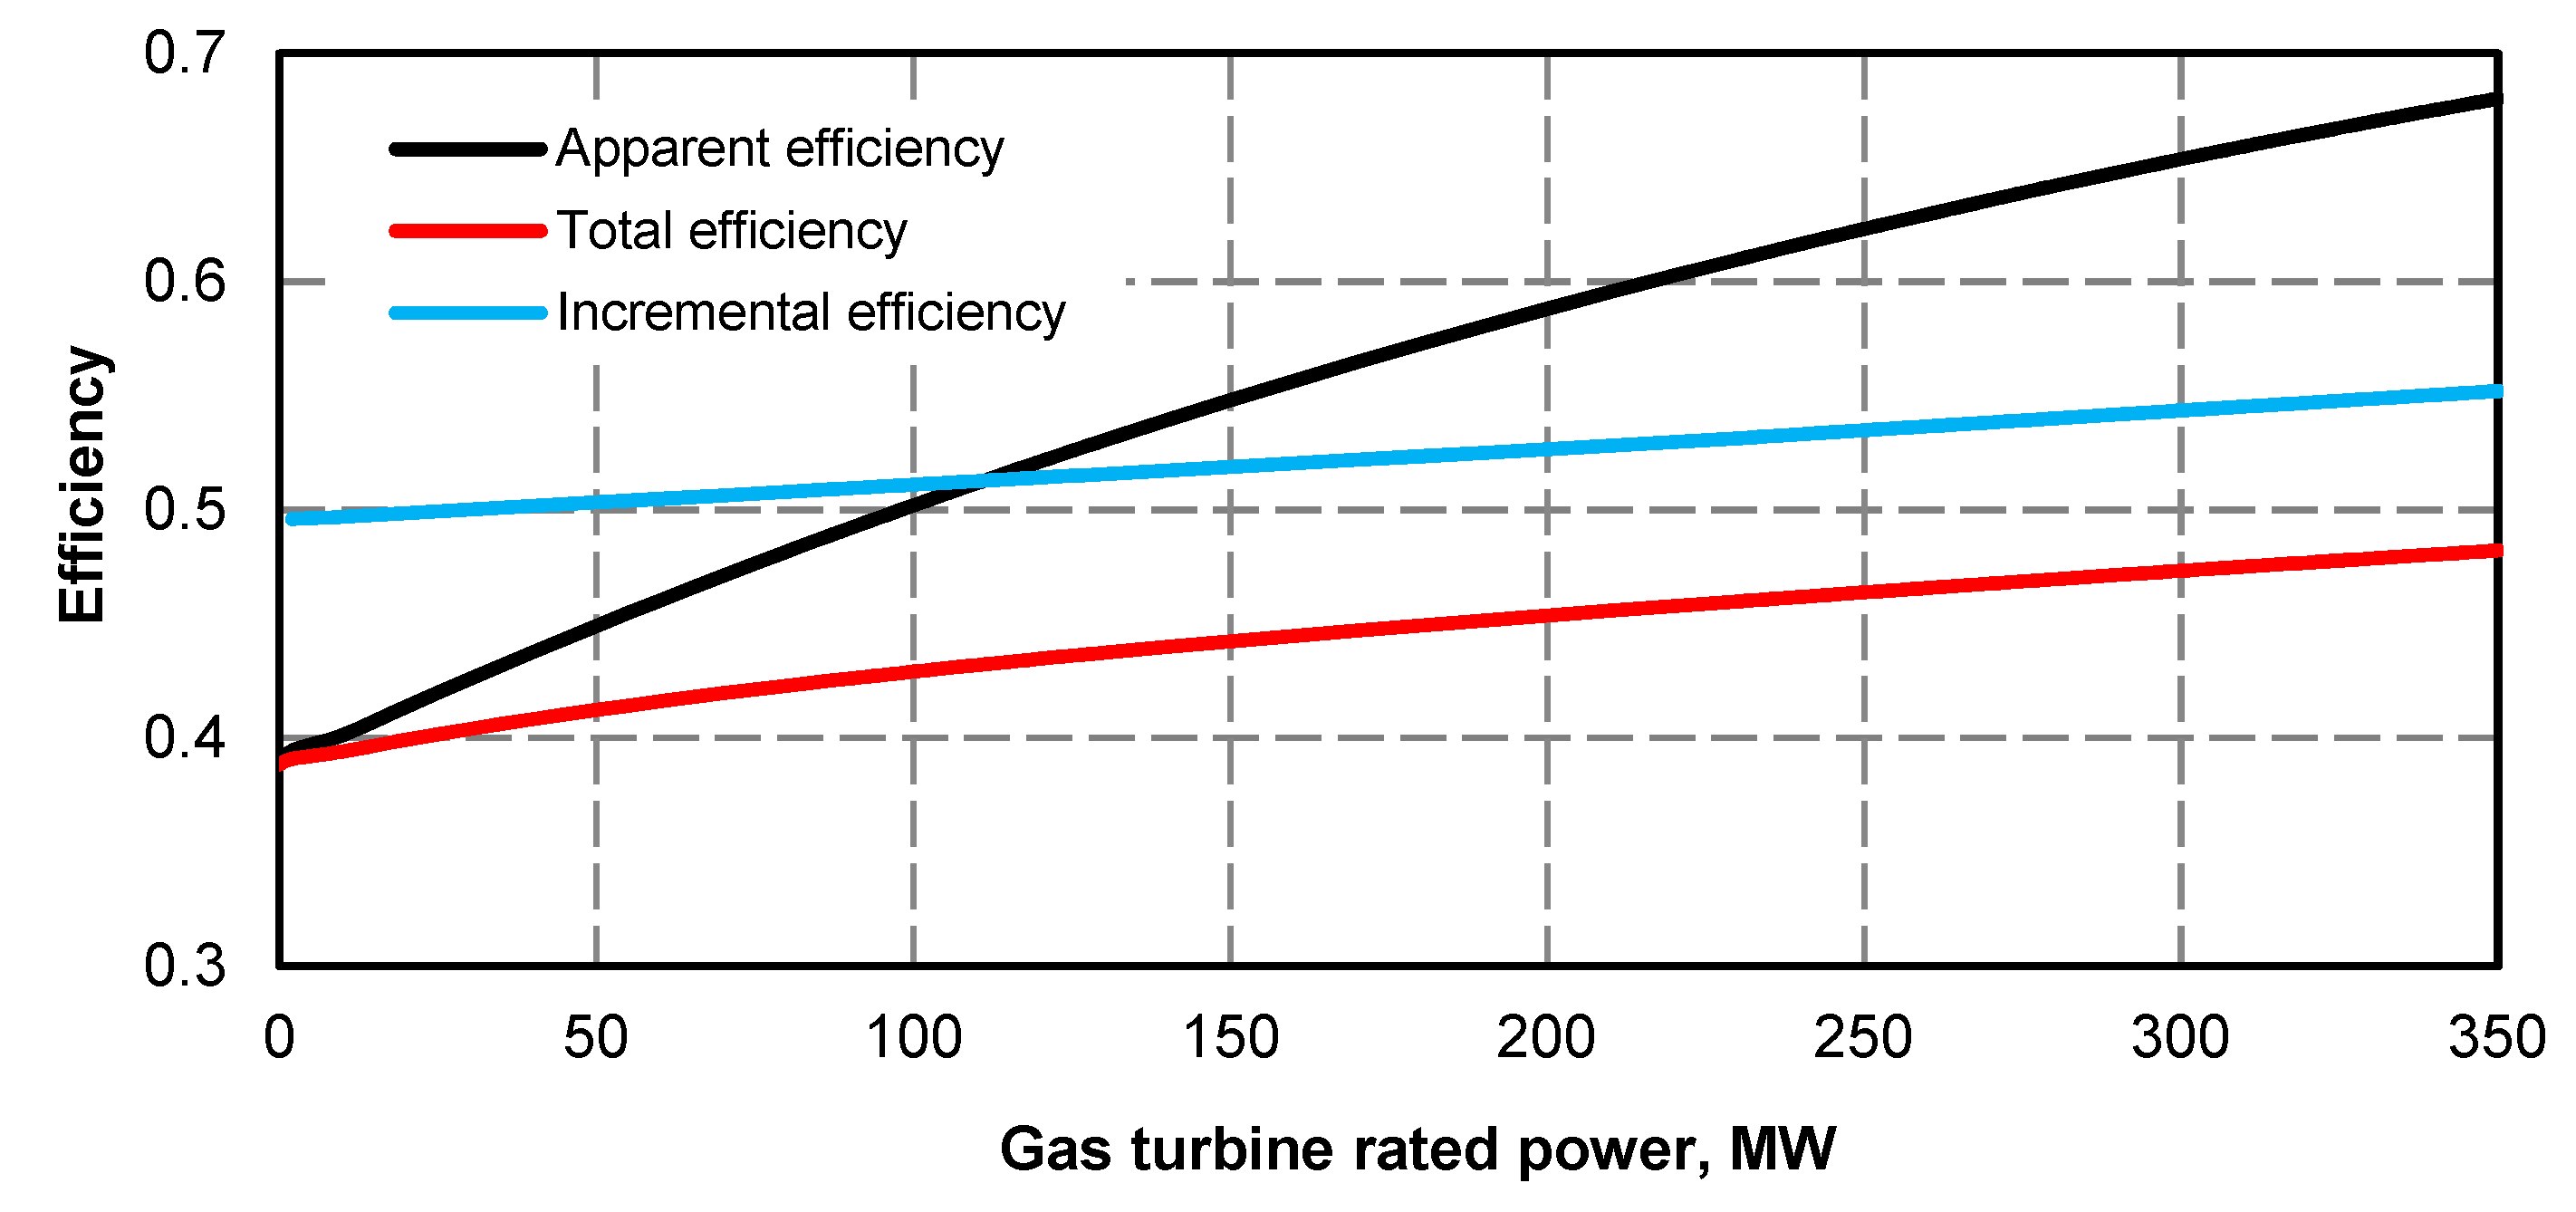
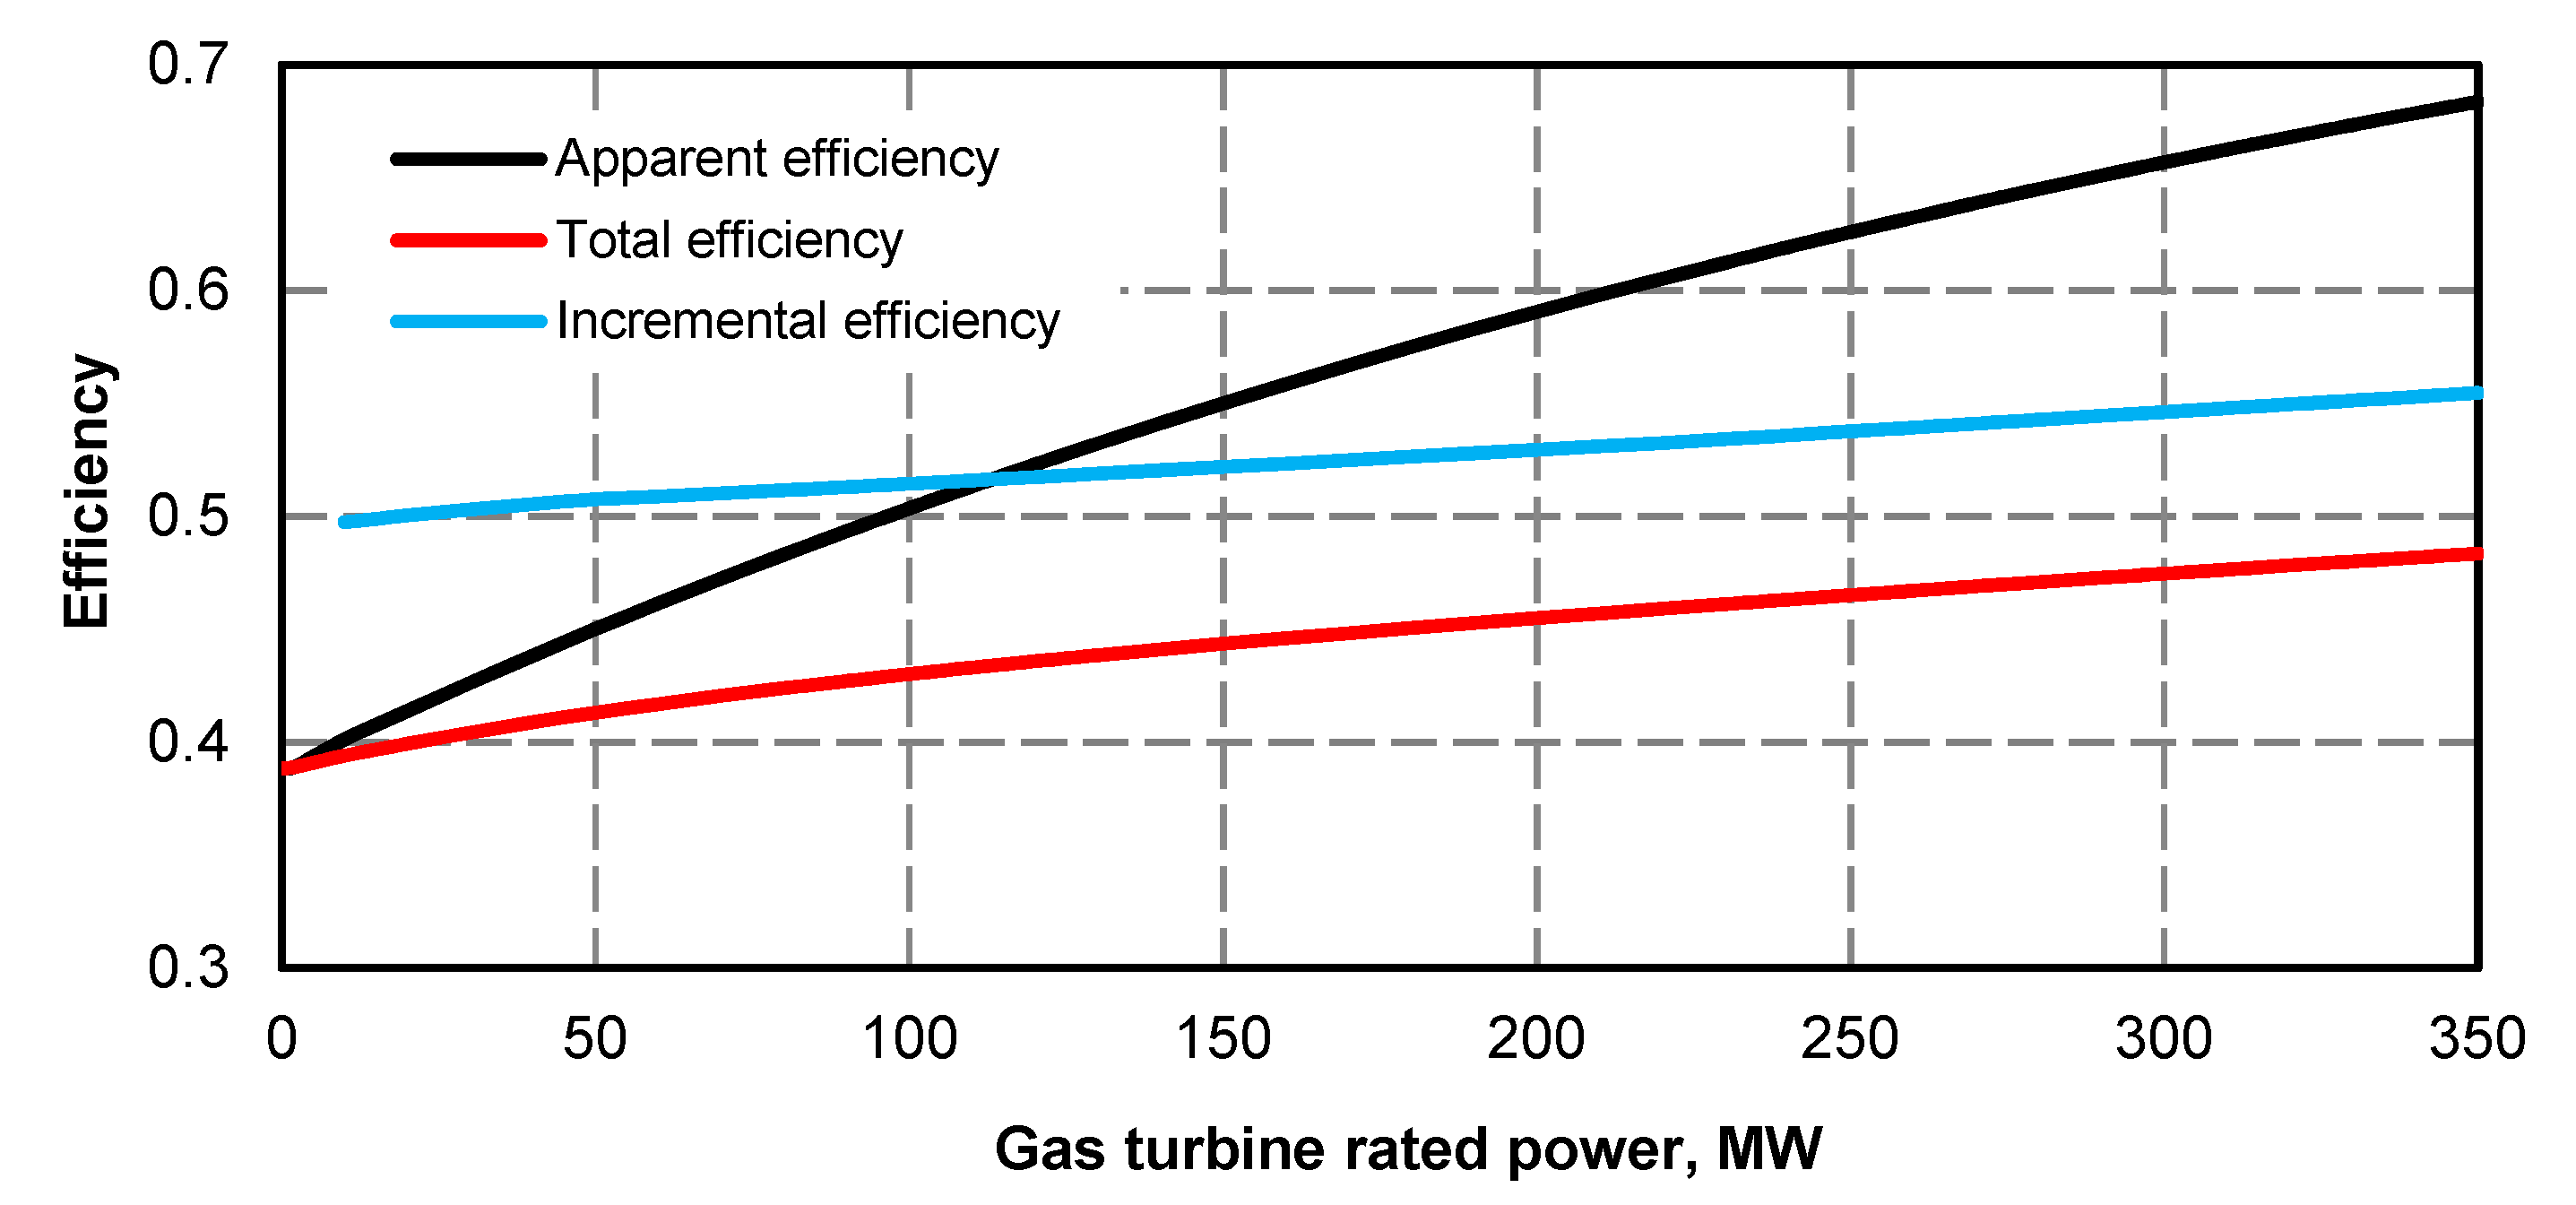
The curves for this structure fitted with a triple-pressure boiler are shown in Figure 33, Figure 34 and Figure 35. They are almost the same as the shape of efficiency curves for the structure fitted with a double-pressure boiler.
Likewise, in the case of systems with a single-pressure and double-pressure recovery boiler dependencies between fresh power generation in the steam boiler and recovery boiler and the rated power of gas turbine were prepared. The sum of those streams is a fixed value equalling the flow of steam to the steam turbine (Figure 36, Figure 37 and Figure 38). The shape of those curves is almost identical as for the system with a double-pressure recovery boiler.
The limitation of gas turbine power depending on the maximum steam stream is shown in Figure 38. Like for the remaining cases the maximum power of steam turbine that does not require outlays on a new condenser is about 50 MW.
Very similar values of thermodynamic parameters for structures with a double-pressure and triple-pressure boilers cause that available power ranges for the steam and gas turbine power are almost identical (Figure 39 and Figure 40).

3. Economic Analysis of the All-Year Quasi-Steady State of 370 MW Power Unit Operation Superstructured with a Gas Turbine Installed in Parallel

When optimizing the way of adding the gas turbine superstructure and recovery boiler to the condensation power unit one should take into account the economic criterion, as it decides on accepting a specific technical upgrade solution for implementation [30,31]. However, the economic analysis can be performed only after conducting a technical analysis as its results provide input data for the economic analysis [30,31].
This section presents the all-year economic analysis, hour by hour, quasi-steady state of power unit with a rated power of 370 MW superstructured with a gas turbine installed in parallel. The calculations were performed for a full power range of gas turbines manufactured N e l , n T G ∈(0;350 MW) and for various structures of recovery boiler. In the analyses while calculating the annual electric energy generation in power unit (Eel,A)ex (Equation (4)) an all-year hourly average curve of electric power curve, imposed by the national power dispatching centre, was used. The analysis took into account power unit outages (Figure 2). Three operation variants of the upgraded power unit were considered:
  • all-year quasi-steady state of power unit operation with a fixed rated power of gas turbine; power unit output is controlled only by changing the output of the steam boiler,
  • all-year quasi-steady state of power unit operation with a fixed power of 60% gas turbine rated power during the night low power demand (“load valleys”) and with a fixed rated power beside the night low power demand; power unit output is controlled only by changing the output of the steam boiler,
  • all-year quasi-steady state of power unit operation with shutting off the gas turbine during the night low power demand (“load valleys”) and with a fixed rated power beside the night low power demand; power unit output is controlled only by changing output of the steam boiler.
For each of the above-mentioned variants calculations for the three types of recovery boiler: single, double and triple-pressure were performed (Figure 4).
As already mentioned above, before deciding on an upgrade investment the operator wants to know if it is profitable. Consequently, it is necessary to know the unit cost of electric power generation in the upgraded power unit. The cost is expressed by the dependency [1,2]:
( k e l ) m o d = ( K A ) m o d ( E e l , A ) m o d ,
where (Eel,A)ex—net annual electric power production loco power unit before the upgrade, (Eel,A)mod—net annual electric power production loco power unit after the upgrade, ΔEel,A—net annual electric power production gain loco power unit after the upgrade, (KA)ex—annual cost of power unit operation after the upgrade, (KA)ex—annual cost of power unit operation before the upgrade and ΔKA—gain of annual cost of power unit operation after the upgrade,
At the same time the cost of electric power production in power unit before its upgrade is obviously:
( k e l ) e x = ( K A ) e x ( E e l , A ) e x ,
while unit gain cost of production is expressed by the following formula:
( k e l ) Δ E e l , A = Δ K A Δ E e l , A ,
The gain of annual ΔKA cost is expressed by the following formula:
Δ K A = ( K A ) m o d ( K A ) e x = ( z ρ + δ s e r v ) J m o d + K g G T + K e n v G T Δ K f u e l c Δ K r , m , w c Δ K e n v c Δ K C O 2 c ,
where Jmod—“turnkey” investment outlays on the power unit upgrade by adding the superstructure with a gas turbine and a recovery boiler, K g G T —cost of natural gas fired in the gas turbine, K e n v G T —cost of the economic use of the environment resulting from firing natural gas in the gas turbine, Δ K f u e l c —reduction in coal purchase cost, Δ K C O 2 c —reducing the cost of purchasing the CO2 emission permits as a result of decreased coal consumption of the upgraded power unit, Δ K r , m , w c —reducing the costs of maintenance and repairs, non-energetic raw materials and auxiliary materials as well as replenishing water in the existing coal-fired system; in calculations it can be assumed without a high error that Δ K r , m , w c = 0, Δ K e n v c —reducing the cost of economic use of the environment resulting from lower amount of annual coal fired in the power plant, = z(r+s) − annual investment capital cost (r—cost of capital, s—depreciation rate) and δserv—rate of fixed costs depending on the upgrade investment outlays (equipment maintenance, repair).
The cost of natural gas fired in the gas turbine can be expressed by the following formula:
K g G T = E c h , A g e g = N e l G T η G T τ A e g ,
where E c h , A g —annual consumption of chemical gas energy depending on the gas turbine power, eg—unit (per energy unit) gas price, N e l G T —power of the gas turbine, ηGT—efficiency of the gas turbine and τA—annual gas turbine operation time (this time is different for the three operation variants considered in the section).
The reduction in the cost of coal fired in the existing steam boiler is as follows:
Δ K f u e l c = Δ E c h , A c e c ,
where ec—unit (per energy unit) coal price and Δ E c h , A c —annual consumption reduction of chemical coal energy in the power unit.
Environmental cost K e n v G T for the gas system and cost reduction Δ K e n v c resulted from reducing the amount of coal fired in the power unit depend on the unit tariff rates for the economic use of the environment and can be expressed by the following formulas [30,31]:
K e n v G T = E c h , A g ( ρ g C O 2 p C O 2 + ρ g C O p C O + ρ g S O 2 p S O 2 + ρ g N O x p N O x ) ,
Δ K e n v c = Δ E c h , A c ( ρ c C O 2 p C O 2 + ρ c C O p C O + ρ c S O 2 p S O 2 + ρ c N O x p N O x + ρ c d u s t p d u s t ) ,
where p C O 2 , p C O , p S O 2 , p N O x , p d u s t —unit rate per CO2, CO, NOx, SO2, dust emission, PLN/kg, ρ g C O 2 , ρ g C O , ρ g S O 2 , ρ g N O x , ρ g d u s t CO2, CO, NOx, SO2 emission per gas chemical energy unit, kg/GJ and ρ c C O 2 , ρ c C O , ρ c S O 2 , ρ c N O x , ρ c d u s t CO2, CO, NOx, SO2, dust emission per coal chemical energy unit, kg/GJ,
Total cost of the environmental protection in the coal-fired system can be expressed by the following formula [31]:
Δ K e n v c = Δ K e n v f u e l + Δ K e n v n o n f u e l .
The non-fuel cost Δ K e n v n o n f u e l includes the costs of dust and slag disposal, waste dumping, water consumption and waste water dump, purchase and transport of chemicals used for water treatment (demineralization and decarbonization), limestone flour, and remaining chemicals used for wet flue-gas desulphurisation, and the cost of urea for the NOx reduction plant. Net annual electric power production gain in the upgraded power unit is as follows:
Δ E e l , A = ( E e l , A G T , g r o s s + Δ E e l , A S T , g r o s s ) ( 1 ε e l m o d ) ,
where: E e l , A G T , g r o s s , Δ E e l , A S T , g r o s s means, respectively, annual gross electric power production in the gas turbine and annual gross electric power production gain in the steam turbine, ε e l m o d coefficient of in-house load of the upgraded power unit (the calculations assumed ε e l m o d = 4%).
By substituting in (4) formulas (5) and (6) in the dependency, we obtain, obviously, that the unit cost of electric power generation (kel)mod in the upgraded power unit is the average weighted cost (kel)ex and ( k e l ) Δ E e l , A , i.e. the cost (kel)ex of electric power production before its upgrade and the cost of ( k e l ) Δ E e l , A production gain achieved after the upgrade:
( k e l ) m o d = ( E e l , A ) e x ( E e l , A ) e x + Δ E e l , A ( k e l ) e x + Δ E e l , A ( E e l , A ) e x + Δ E e l , A ( k e l ) Δ E e l , A
In practice, the cost (kel)mod was calculated by using Equation (14) in the following form:
( k e l ) m o d = ( E e l , A ) e x ( k e l ) e x + Δ K A ( E e l , A ) e x + Δ E e l , A
while the gain of annual ΔKA cost was calculated by using Equation (7).
Equation (14) allows us to analyse the impact of various parameters on the economic viability of the power unit upgrade. The parameters include unit rates for the emission of harmful combustion products, unit prices for carbon dioxide emission, unit costs of coal and gas and its mutual relation as well as unit costs of electric power production in the power unit before its upgrade. It is also possible to analyse the impact of recovery boiler structure as it affects the production of electric power in the steam turbine.
The prerequisite of the economic viability for the power unit upgrade is to meet the following requirements:
( k e l ) m o d ( k e l ) e x 0 .
The sufficient condition for the economic viability satisfying the investor is the increment of accumulated net gain ΔNPVmod, relatively short DPBPmod return period for the investment outlays Jmod incurred on its upgrade and a relatively high IRRmod internal return rate of its interest higher from rcap, rate that can be obtained on the capital market. As a rule, the investor because of the investment risk incurred wants the investment profit to be higher than the profit from capital market deposits.

3.1. Power Production Unit Cost for the Quasi-Steady State of 370 MW Power Unit Operation with a Fixed Gas Turbine Power

To calculate the unit cost of electric power production by using the dependency (15) the following initial data are used:
  • Electric power curve for the steam turbine after adding the superstructure is compliant with its curve before the upgrade (Figure 1 and Figure 2); if at the high value of gas turbine power it was not possible to maintain the minimum power of steam turbine, the minimum efficiency of the steam boiler assumed for the calculations was 133.3 kg/s
  • Estimated investment outlays on the power unit upgrade by adding the superstructure of gas turbine and a recovery boiler taking into account a new generator and a new condenser were assumed in accordance with [31]:
    J m o d = k ( N e l , n G T ) 0 , 73   [ million   PLN ]
    where:
    • k—parameter depending on the recovery boiler structure:
      • single-pressure boiler, k = 7.08
      • double-pressure boiler, k = 7.78
      • triple-pressure boiler, k = 8.57
    • N e l , n G T —rated electric power of the gas turbine, MW
      • power generation unit cost–(kel)ex = 170 PLN/MWh (including the variable cost 120 PLN/MWh)
      • unit coal price–ec = 10 PLN/GJ
      • unit gas price–eg = 27.7 PLN/GJ
      • unit rates for environmental tax– p C O 2 = 0.29 PLN/t, p C O = 0.11 PLN/kg, p S O 2 = 0.53 PLN/kg, p N O x = 0.53 PLN/kg, p d u s t = 0.35 PLN/kg
      • unit price for carbon dioxide emission permits–5 EUR/Mg (22 PLN/t at an exchange rate 1 EUR = 4.3 PLN)
      • annual rate of depreciation, maintenance and repairs zρ + δserv [30,31] = 16%.
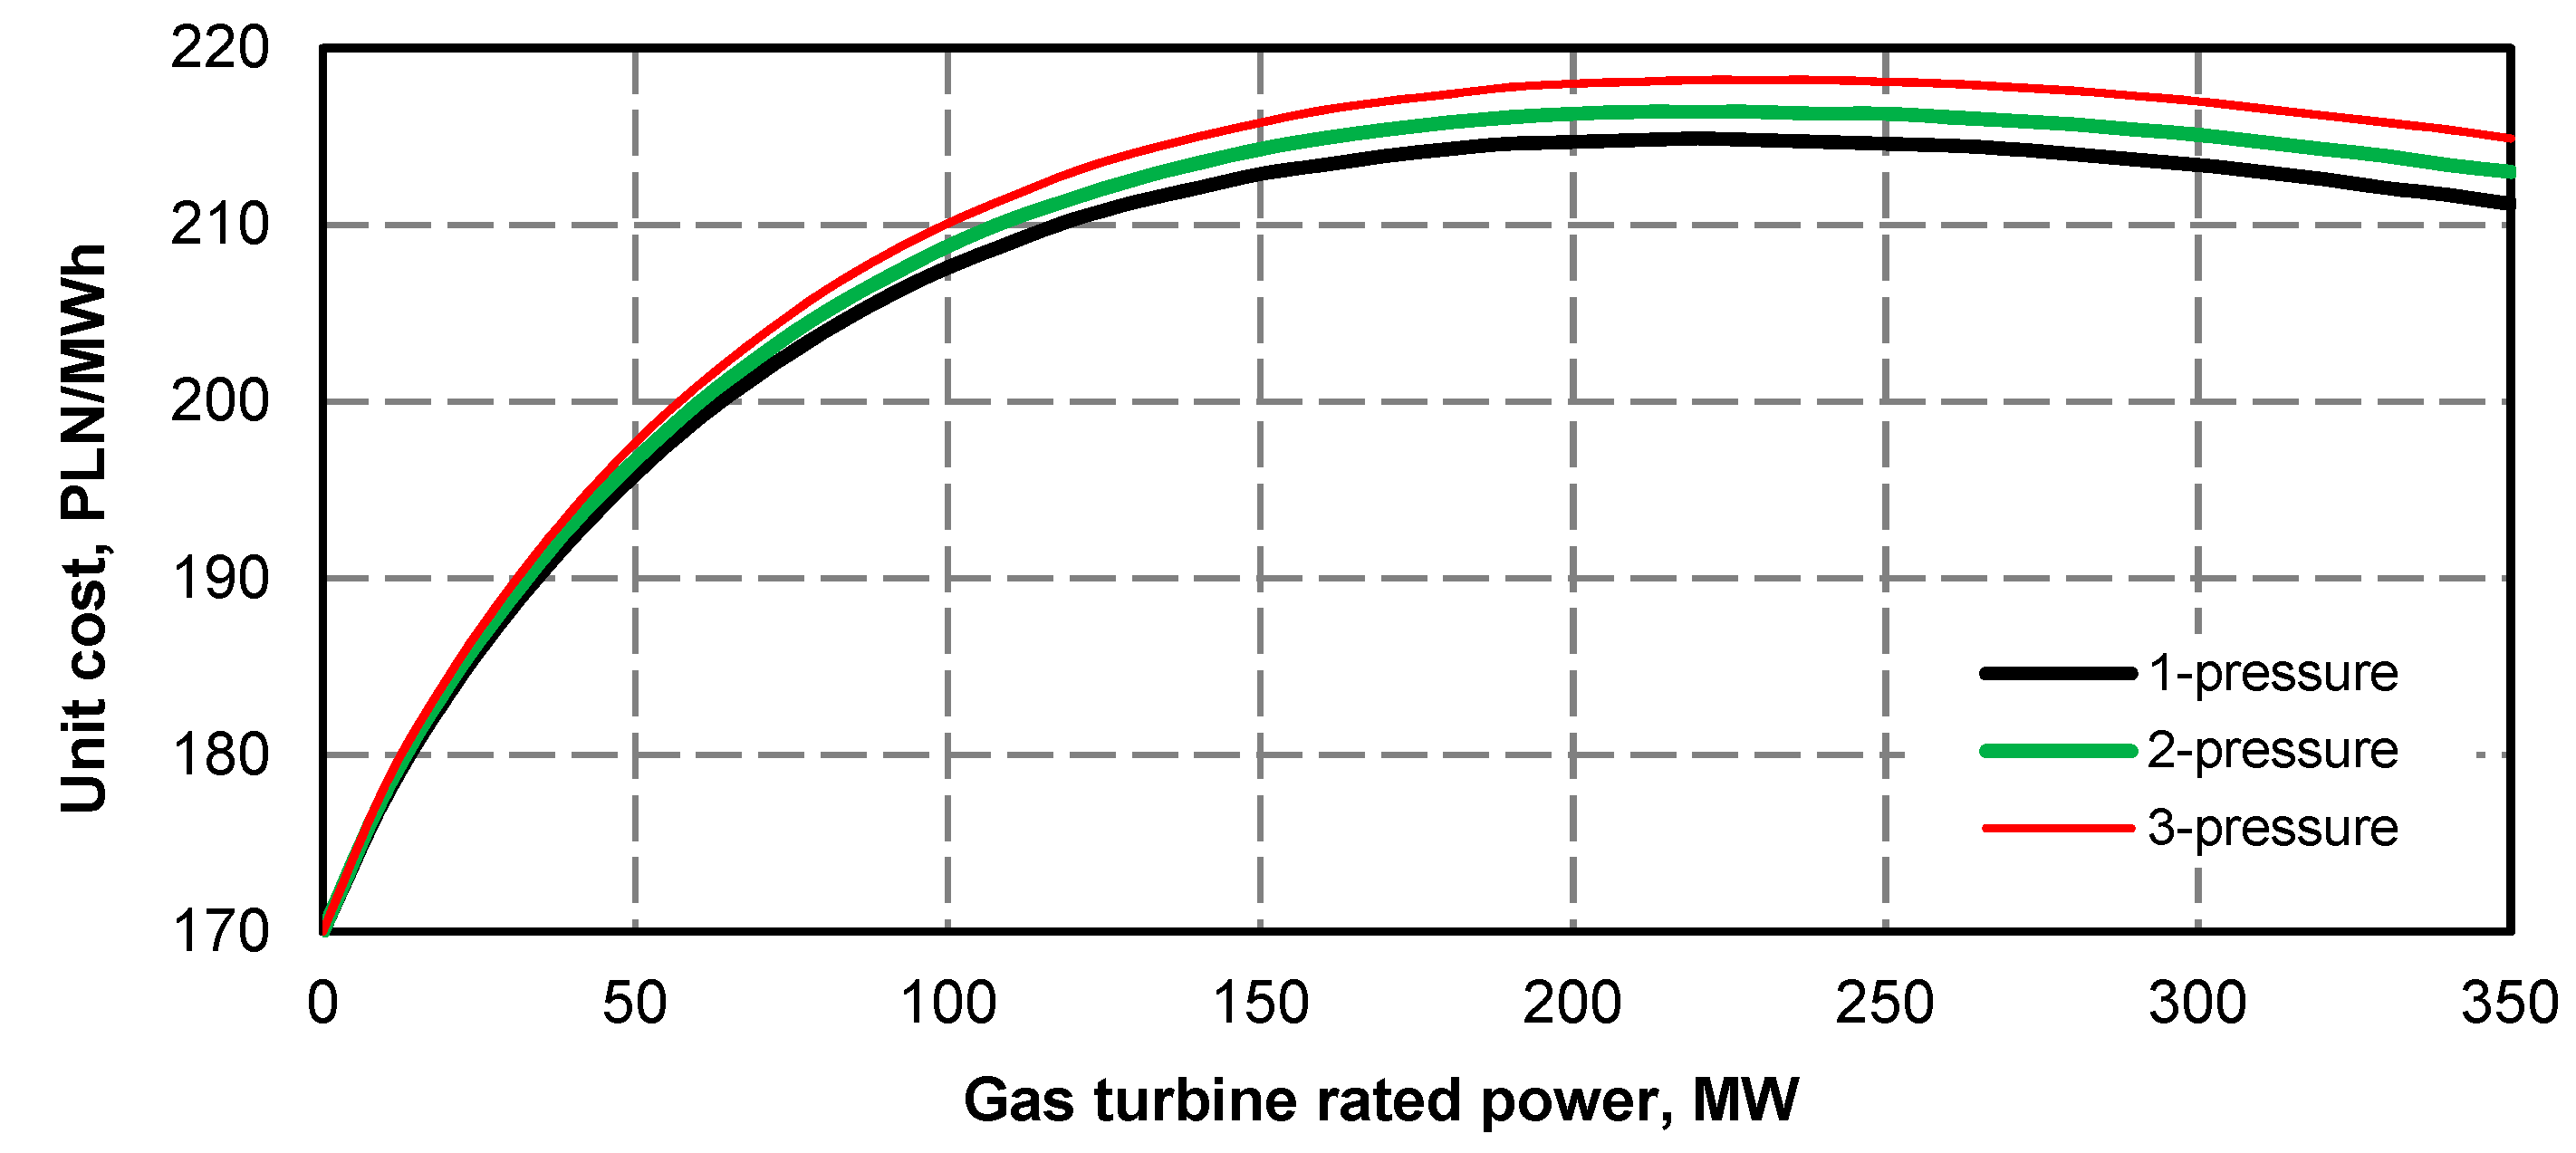
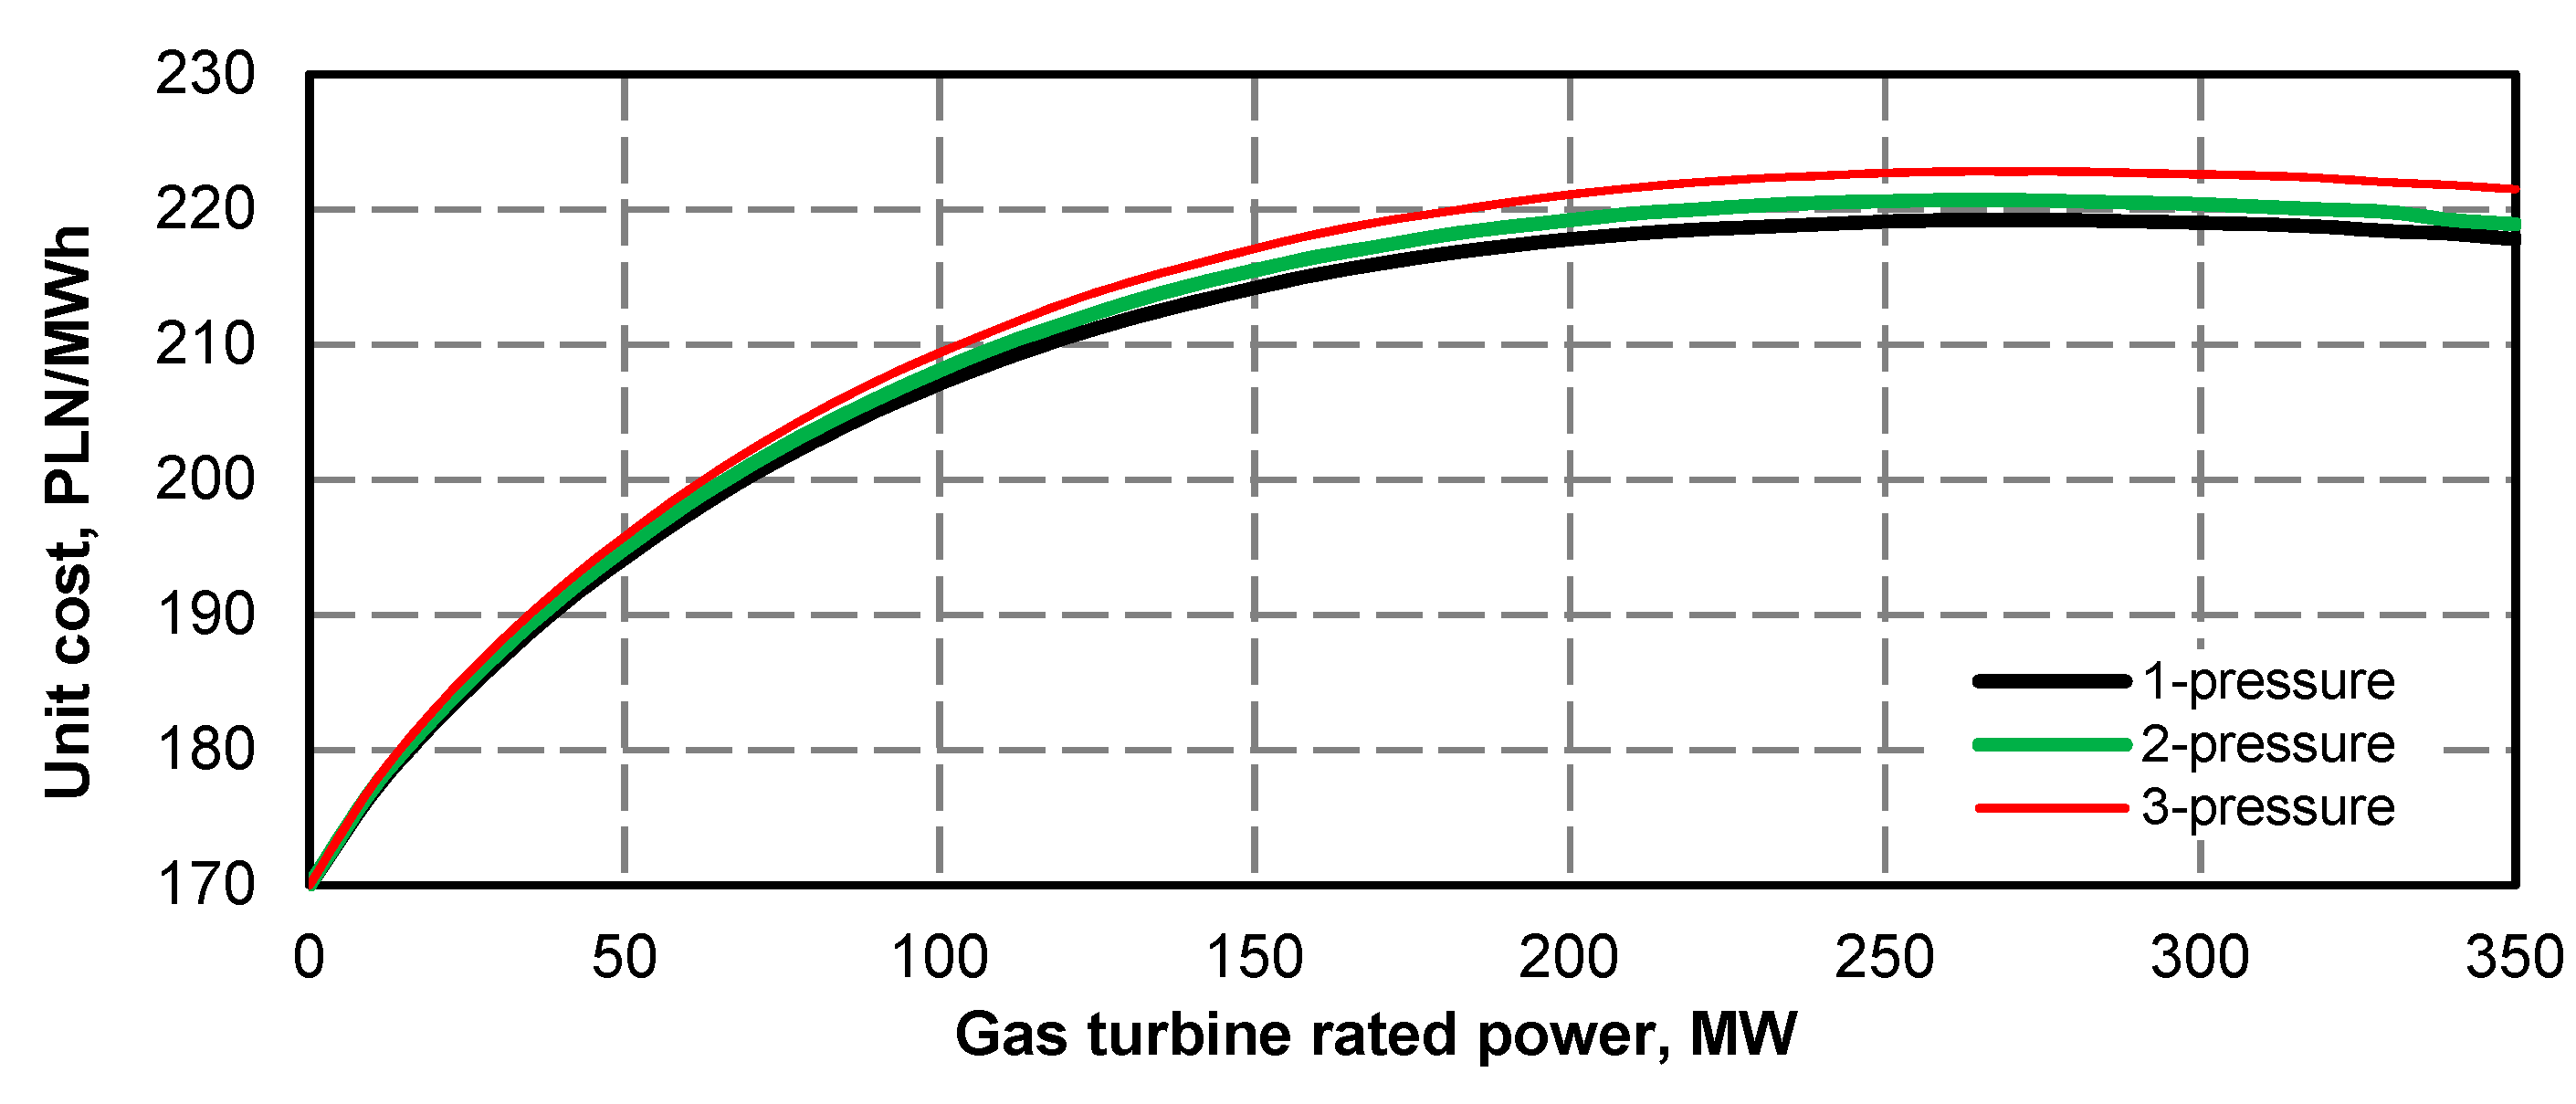
The results of calculating the cost of electric power generation as a function of gas turbine rated power for the specific initial parameters as shown in Figure 41.
Unit cost of electric power generation assumes a maximum rated power of approximately 200 MW, and then it decreases with its growth. It means that at assumed price relations, the most favourable in economic terms is the highest gas turbine power and a single-pressure structure of recovery boiler. The unit price of electric power generation for double and triple-pressure is slightly higher. The calculations show that the unit cost of electric power generation after adding the superstructure is higher by approximately 42 PLN/MWh from the cost in the existing power plants. This difference can decrease if the unit coal price is higher or unit gas price is lower.
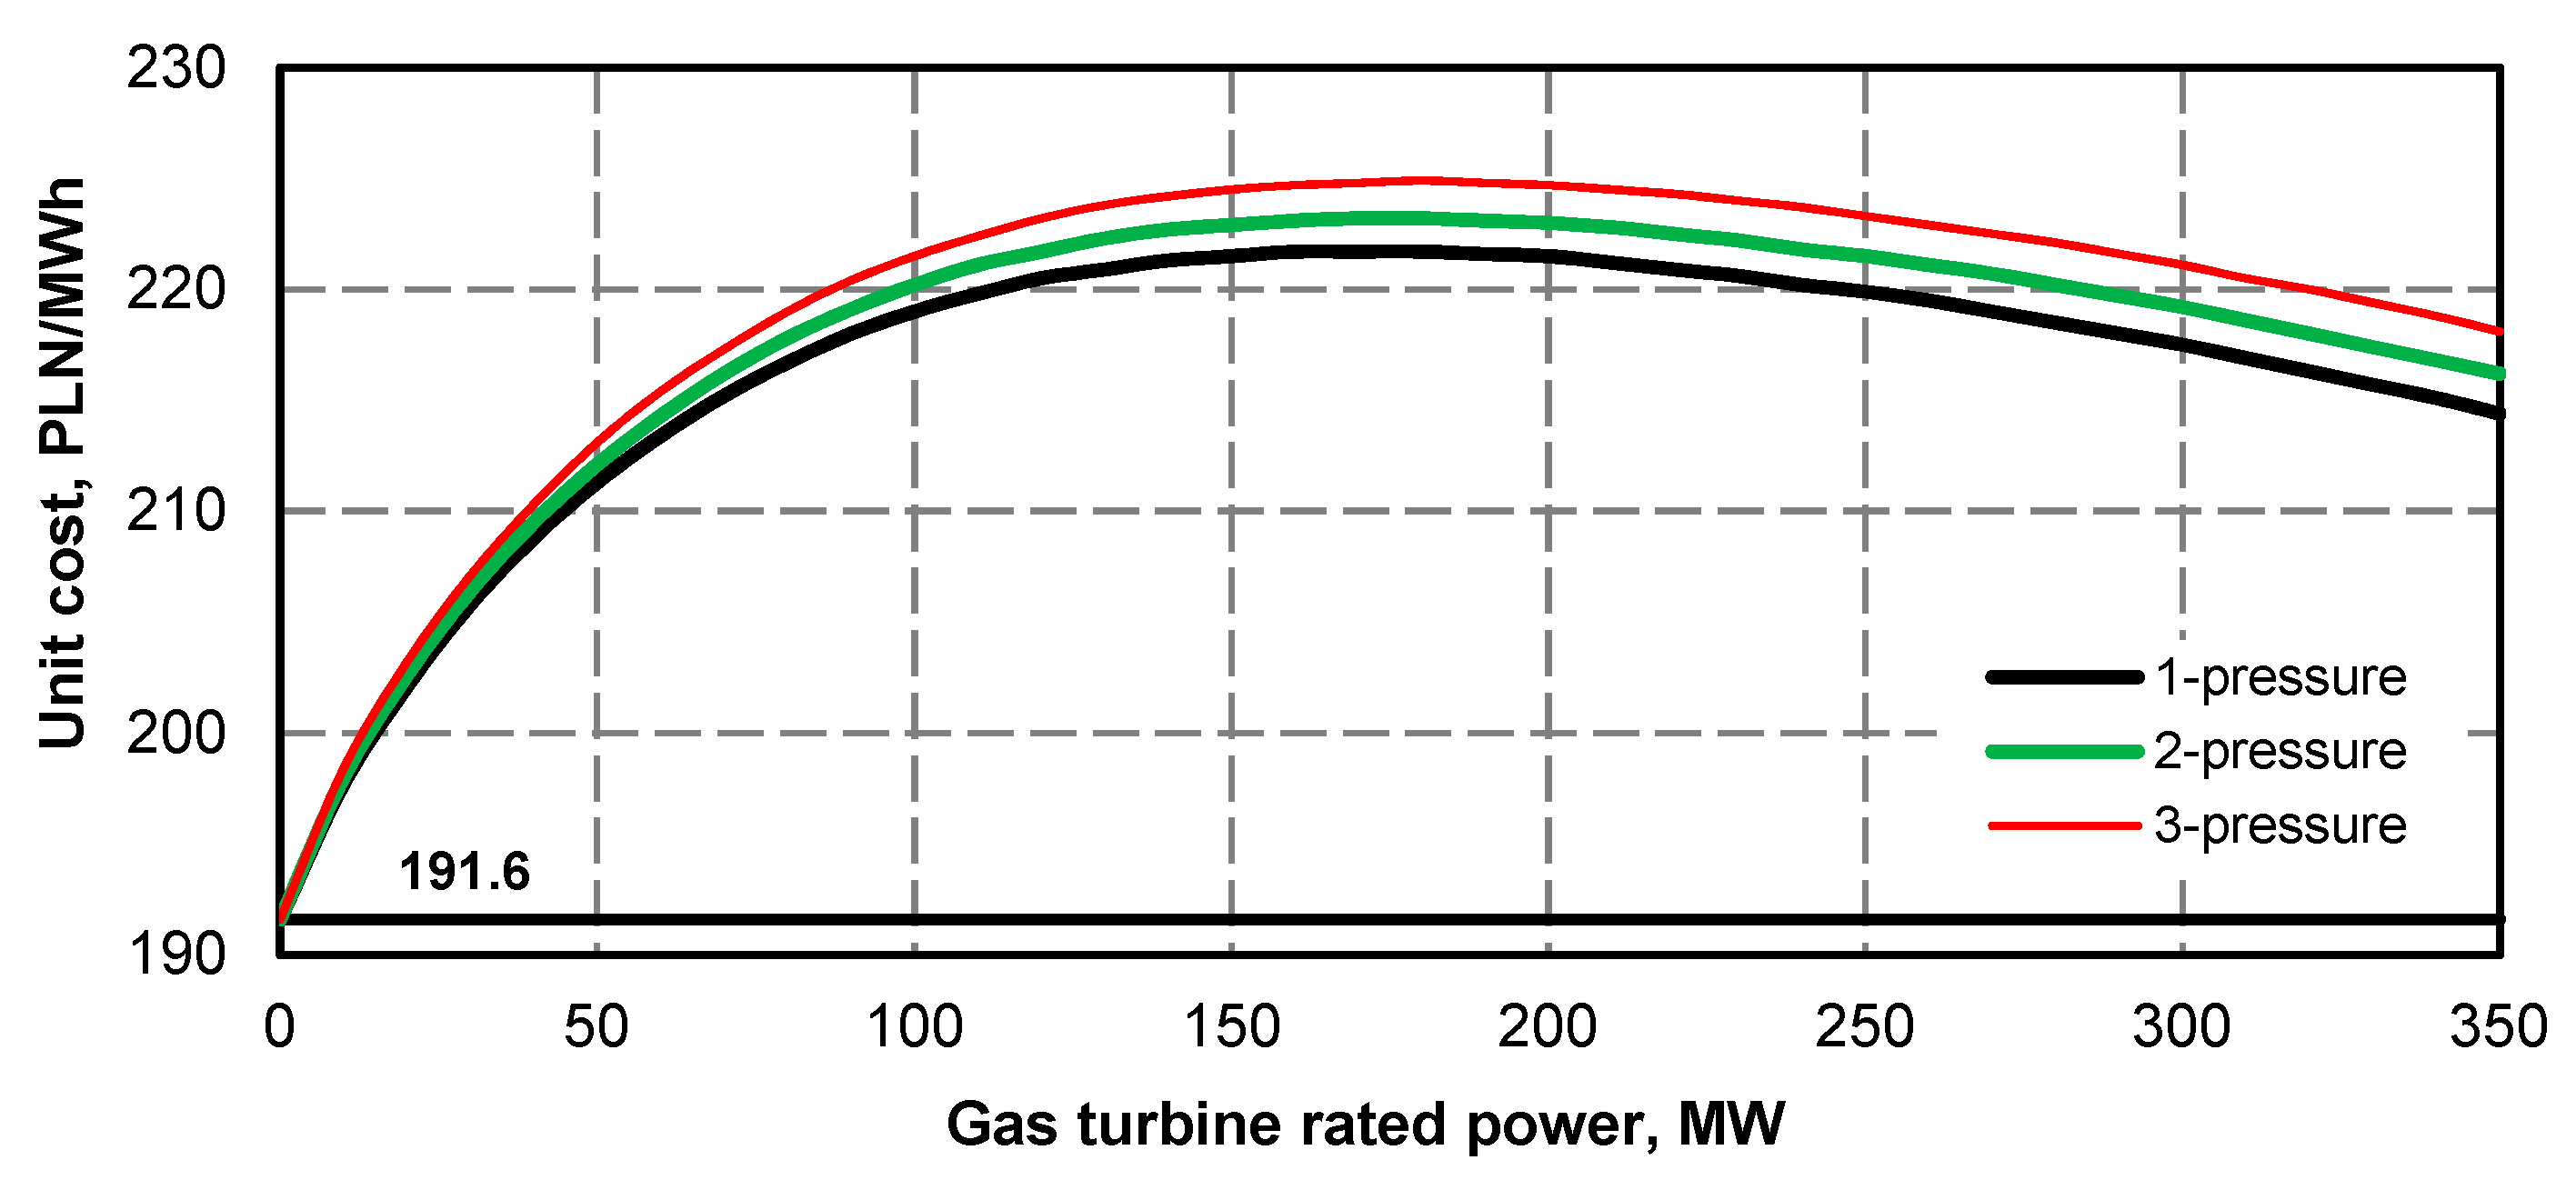
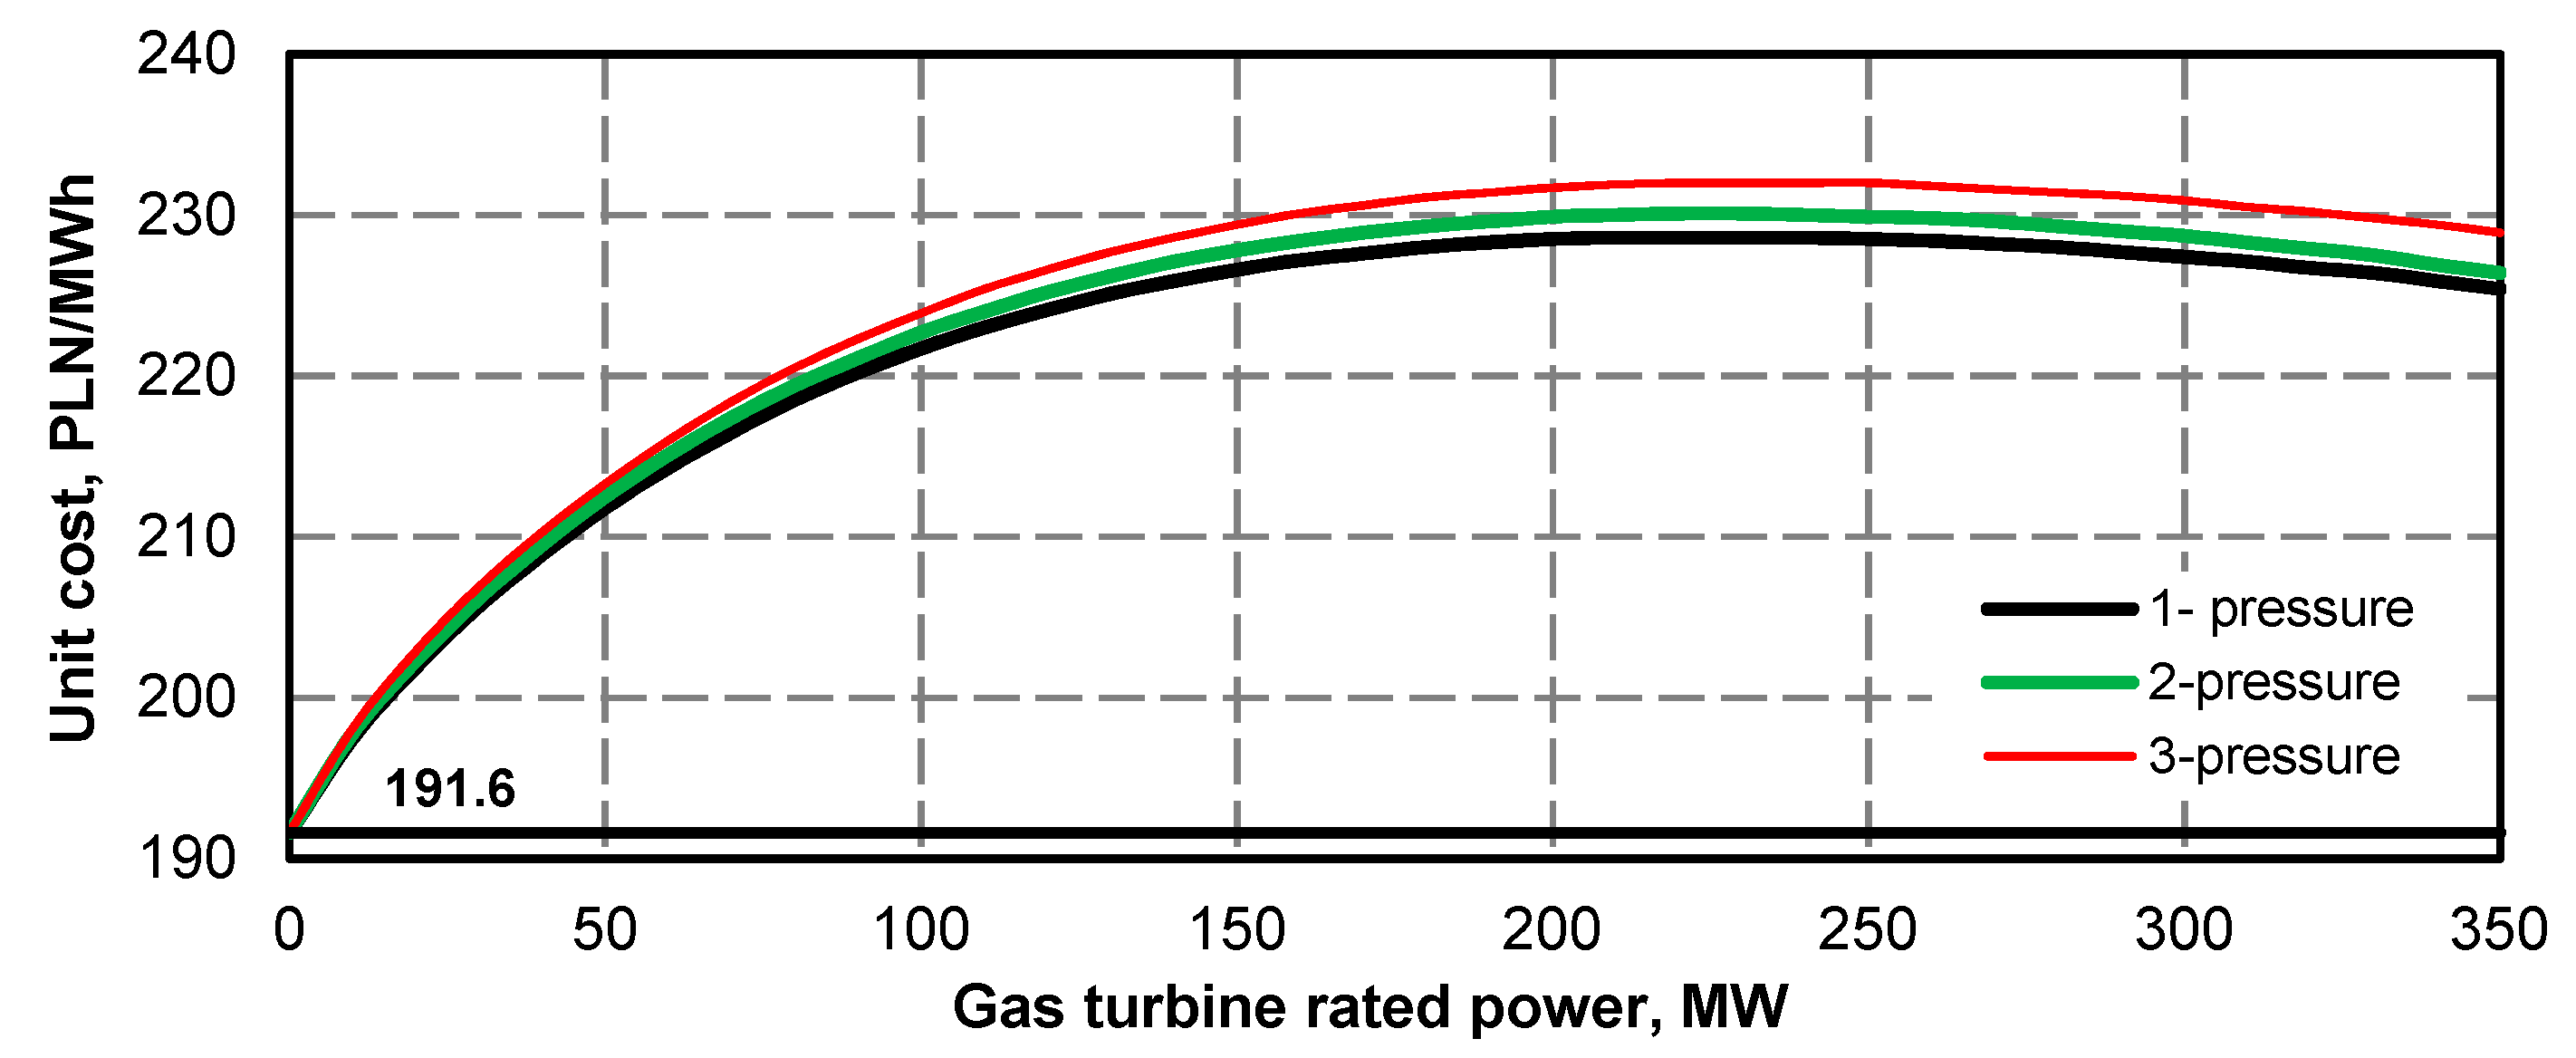
Figure 42 shows how the unit cost of electric power generation changes after increasing the coal unit price. It has been assumed that the price can reach the maximum value of approximately 12 PLN/GJ. Higher coal price causes that the proportionally higher will be also the unit cost of power generation in the existing power plant. Assuming that the coal price makes up 90% of generation cost, the new cost value (kel)ex will be 191.6 PLN/MWh.
As it can be seen, the increase in coal price causes that the difference between the cost of generation with the upgraded power unit and the cost of generation in the existing power plant is approximately 27 PLN/MWh, however the investment still remains unprofitable.
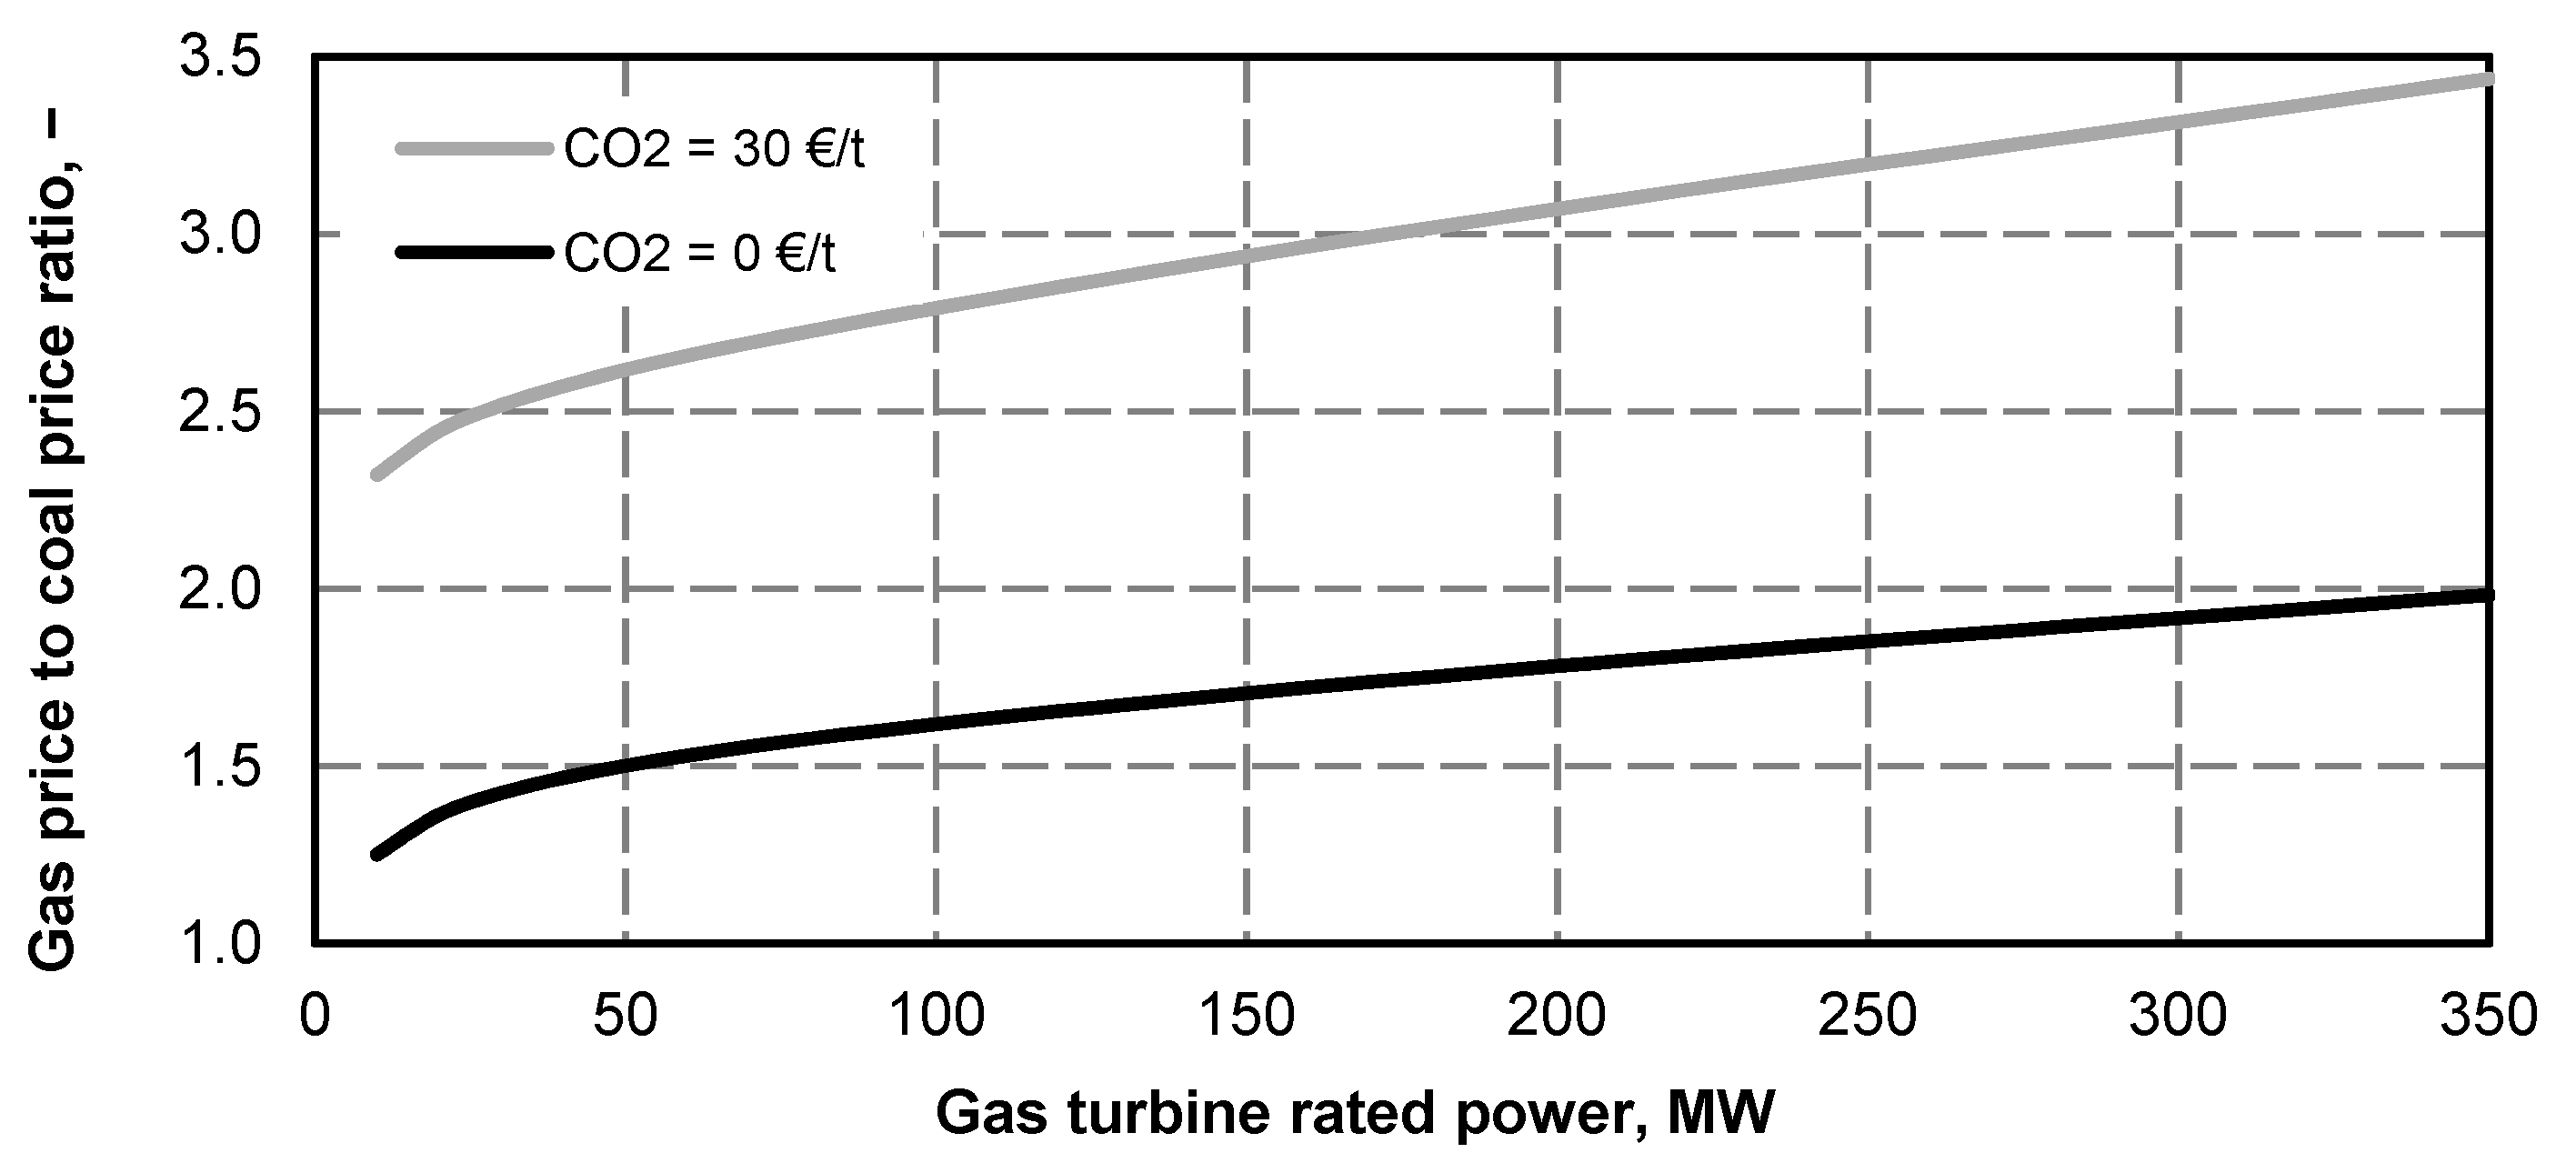
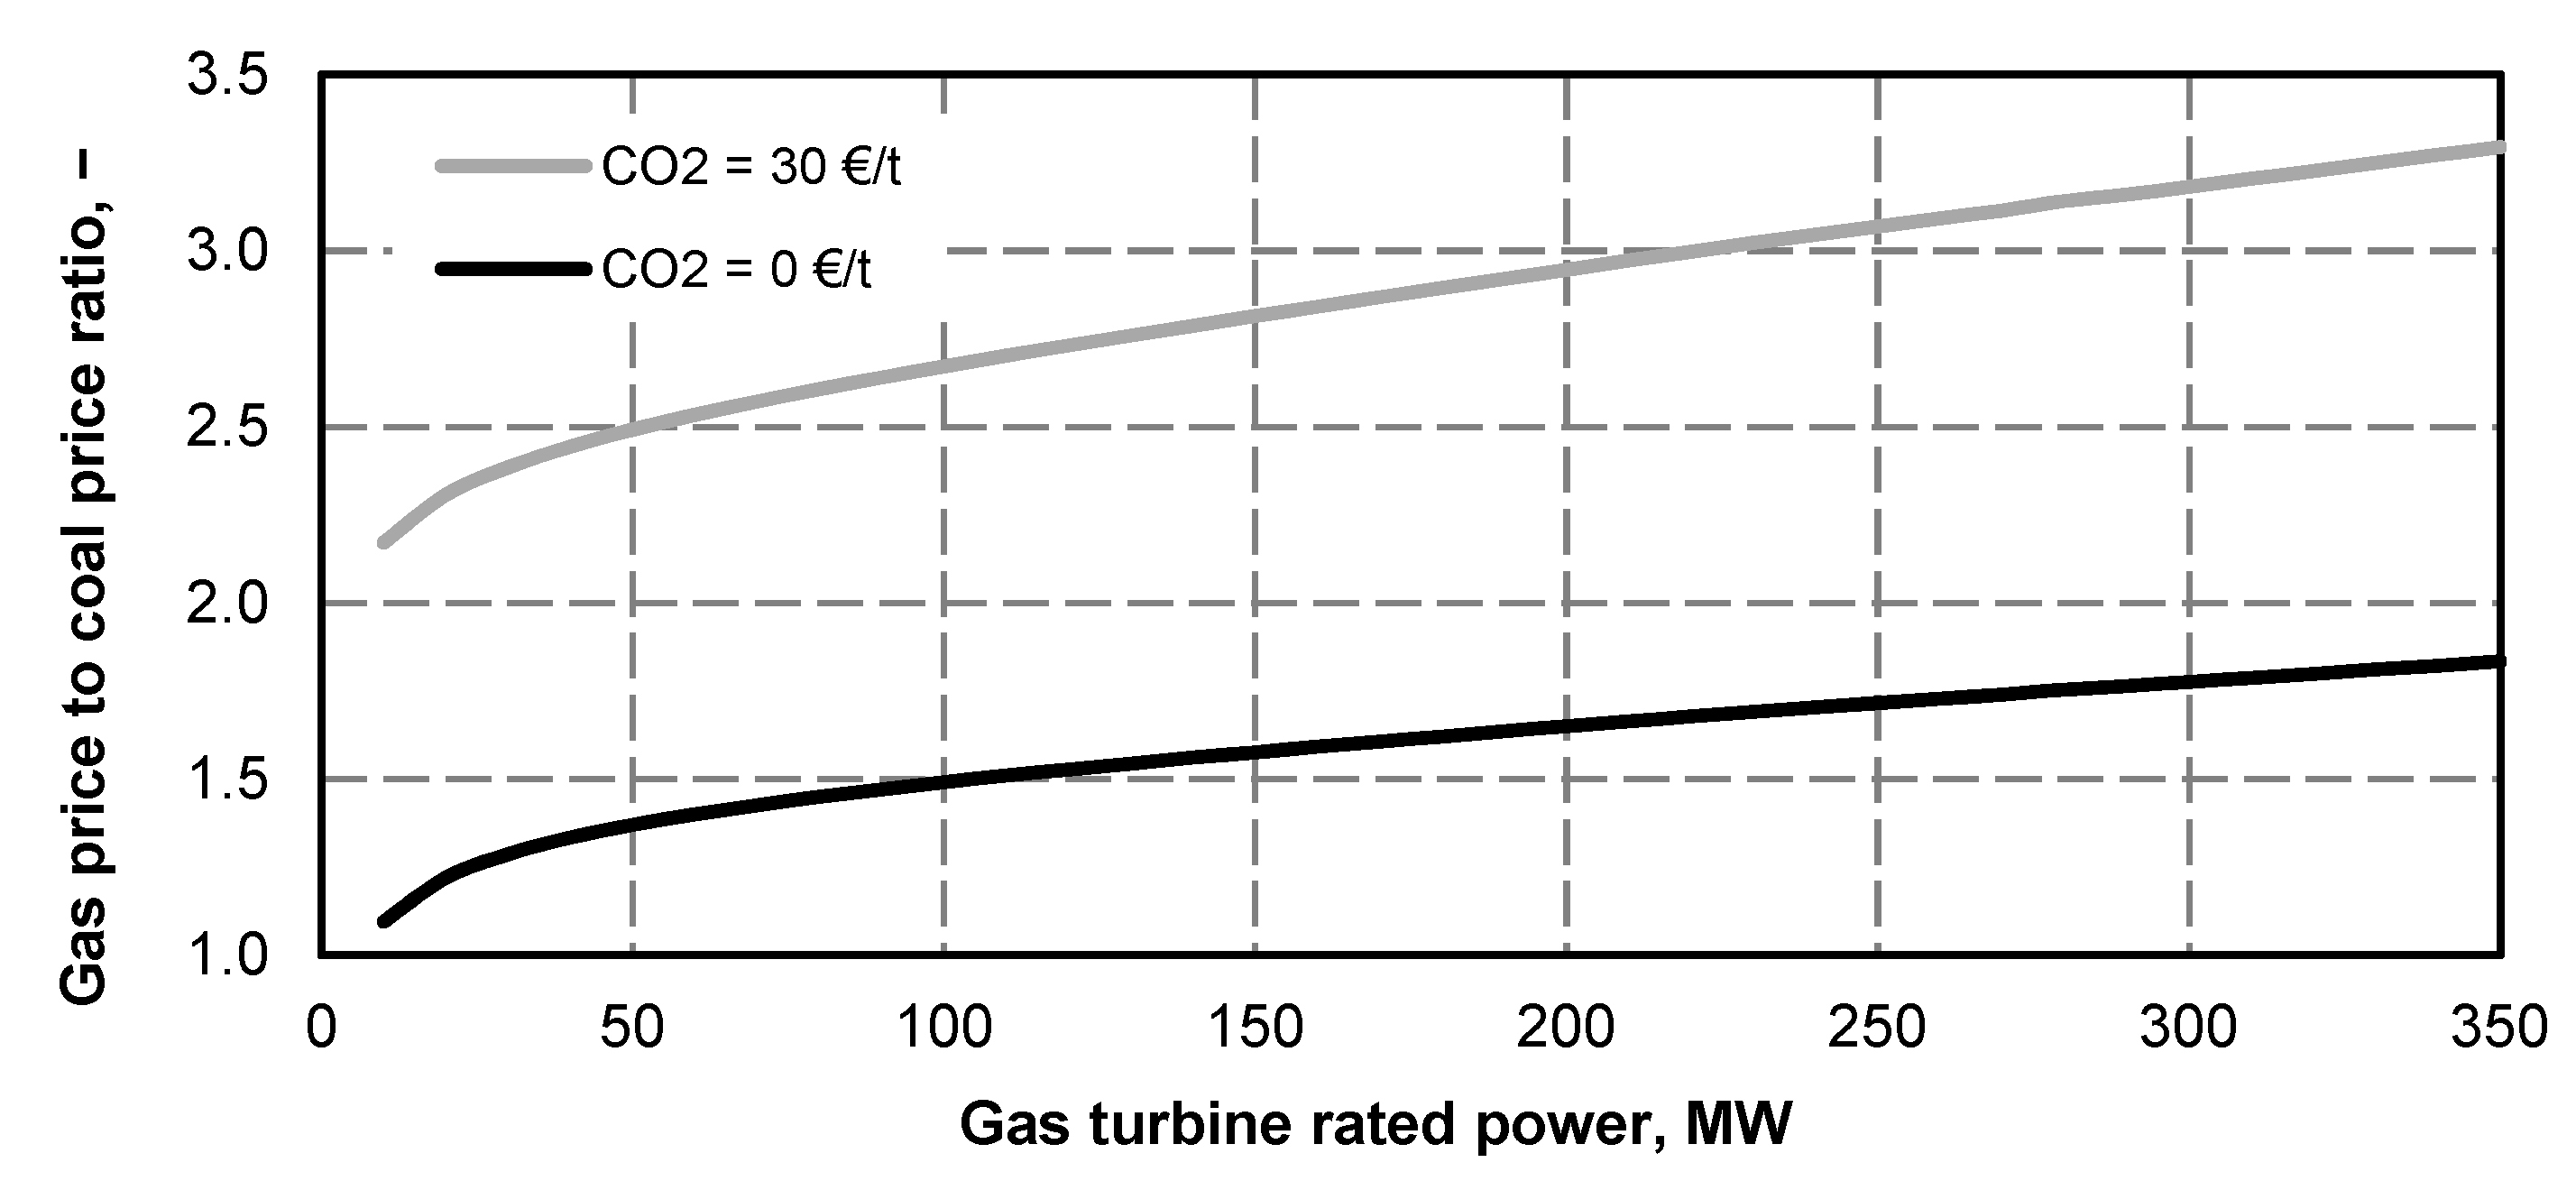
Figure 43 additionally shows what relation of unit gas price to the unit coal price will make the investment viable, i.e. for what relations the unit electric power generation cost in the upgraded power unit will be equal to the unit generation cost before the upgrade.
The calculations were carried out for the coal unit price of 10 PLN/GJ, assuming no carbon dioxide emission taxes–the black line, for comparison, at taxes amounting to 30 EUR/tCO2–grey line. The calculation results show that without carbon dioxide emission taxes, assuming the unit coal price of approximately 10.0 PLN/GJ and the unit electricity price of 170 PLN/MWh, adding the gas turbine superstructure becomes viable at quota ranging from 1.3 to 2.0. Higher quota values represent higher gas turbine power values. The increase in carbon dioxide permit prices will, obviously, raise the unit cost of electric power generation. Assuming carbon emission of approximately 96 kg/GJ and the emission cost of approximately 30 EUR/t (12.4 PLN/GJ) it can be calculated that the unit prices of electric power generation will be 319 PLN/MWh. Calculations for the emission permit of 30 EUR/t shown in Figure 43 were carried out for the electric power generation cost of 319 PLN/MWh. As it can be seen at this level of prices, adding the gas turbine superstructure is viable even for quota ranging from 2.5 to 3.4, i.e. for the unit gas price ranges from 25 to 34 PLN/GJ. It means that the higher price of permit for carbon dioxide emission, the higher is the cost-effectiveness of the superstructure.
Another factor increasing the attractiveness of upgrade by using gas technologies is the unit rate for nitric oxide, sulphur dioxide, carbon monoxide and dust emission permits.
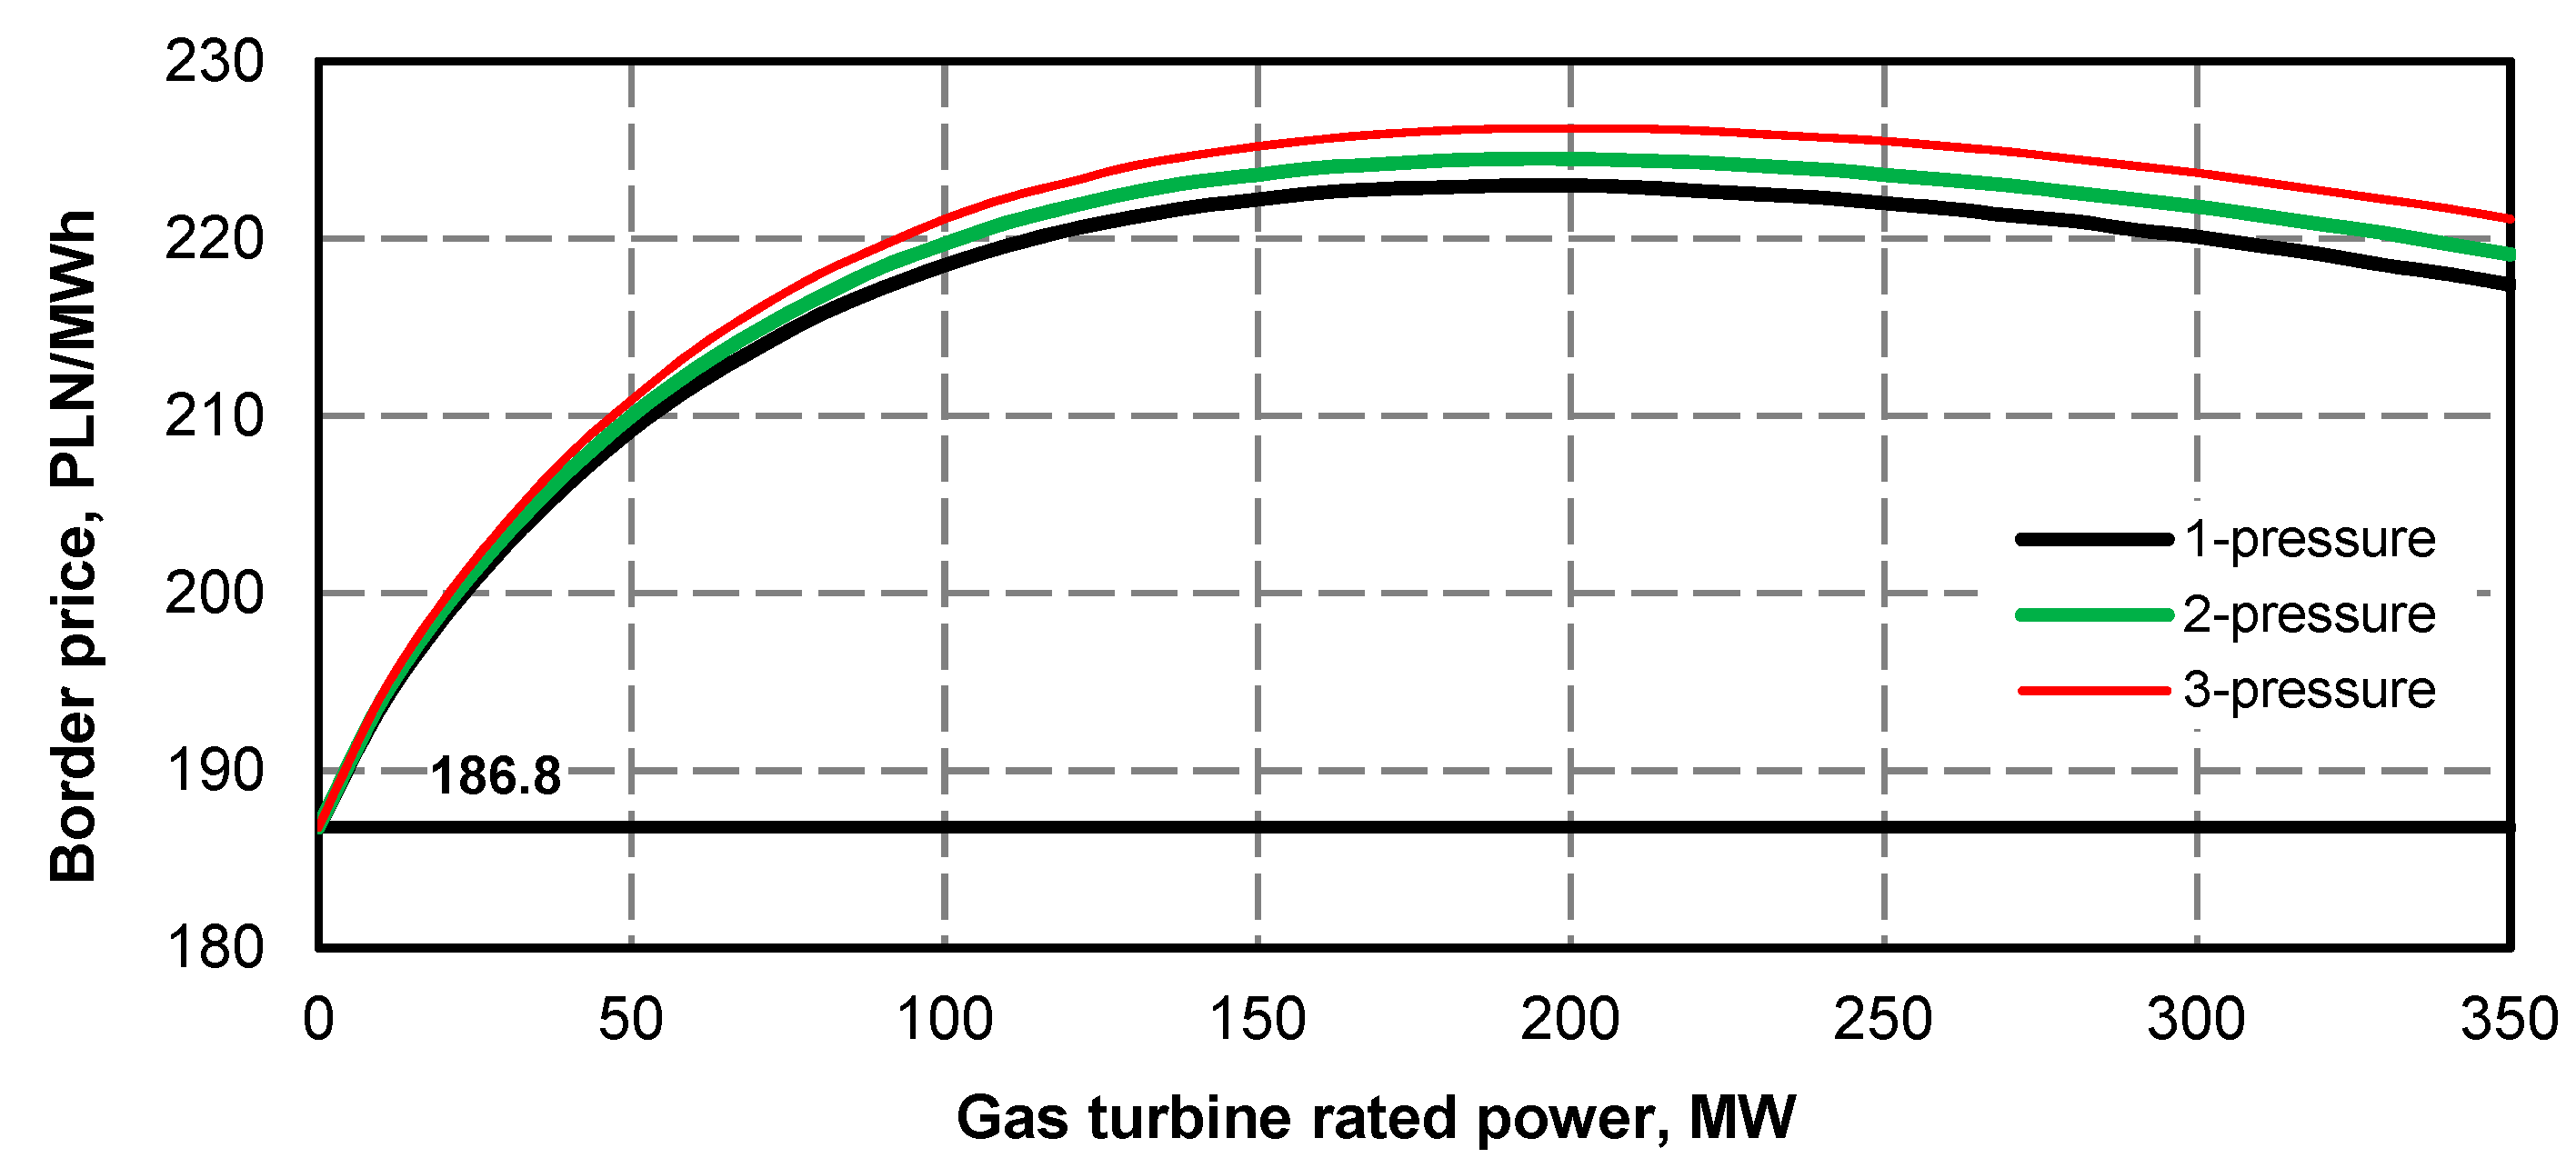
Figure 44 shows how the unit price of electric power generation will change after increasing 10 times the emission rates of the above-listed substances. The prices took into account the impact of higher environmental taxes on the unit price of electric power generation in the existing power plant whose new value was 186.8 PLN/MWh.
As we can notice, even the 10-time increase in emission unit rates does not make the investment non-profitable. The difference between the unit electric power generation cost in the upgraded power unit and the unit electric power generation cost in the power unit before the upgrade will be approximately 33 PLN/MWh, i.e. approximately 9 PLN/MWh less than before the upgrade. It results from the fact that steam power plant emission capacity reduces significantly, thanks to flue gas desulphurisation, denitronigenation, and dedusting systems that have to provide an emission level meeting the increasingly restricted EU requirements.

3.2. Power Production Unit Cost for the Quasi-Steady State of 370 MW Power Unit Operation with a Variable Gas Turbine Power

The calculations of the unit cost of electric power generation, when gas turbine operates with a variable power were performed based on the assumptions presented in Section 3.1. The results of the calculations for a unit coal price of 10.0 PLN/GJ are shown in Figure 45, while Figure 46 shows the results for the coal price of 12.0 PLN/GJ.
As one can notice, at assumed price relations, operating the gas turbine with a variable power makes that the electric power generation unit cost after the upgrade is higher than before the upgrade.
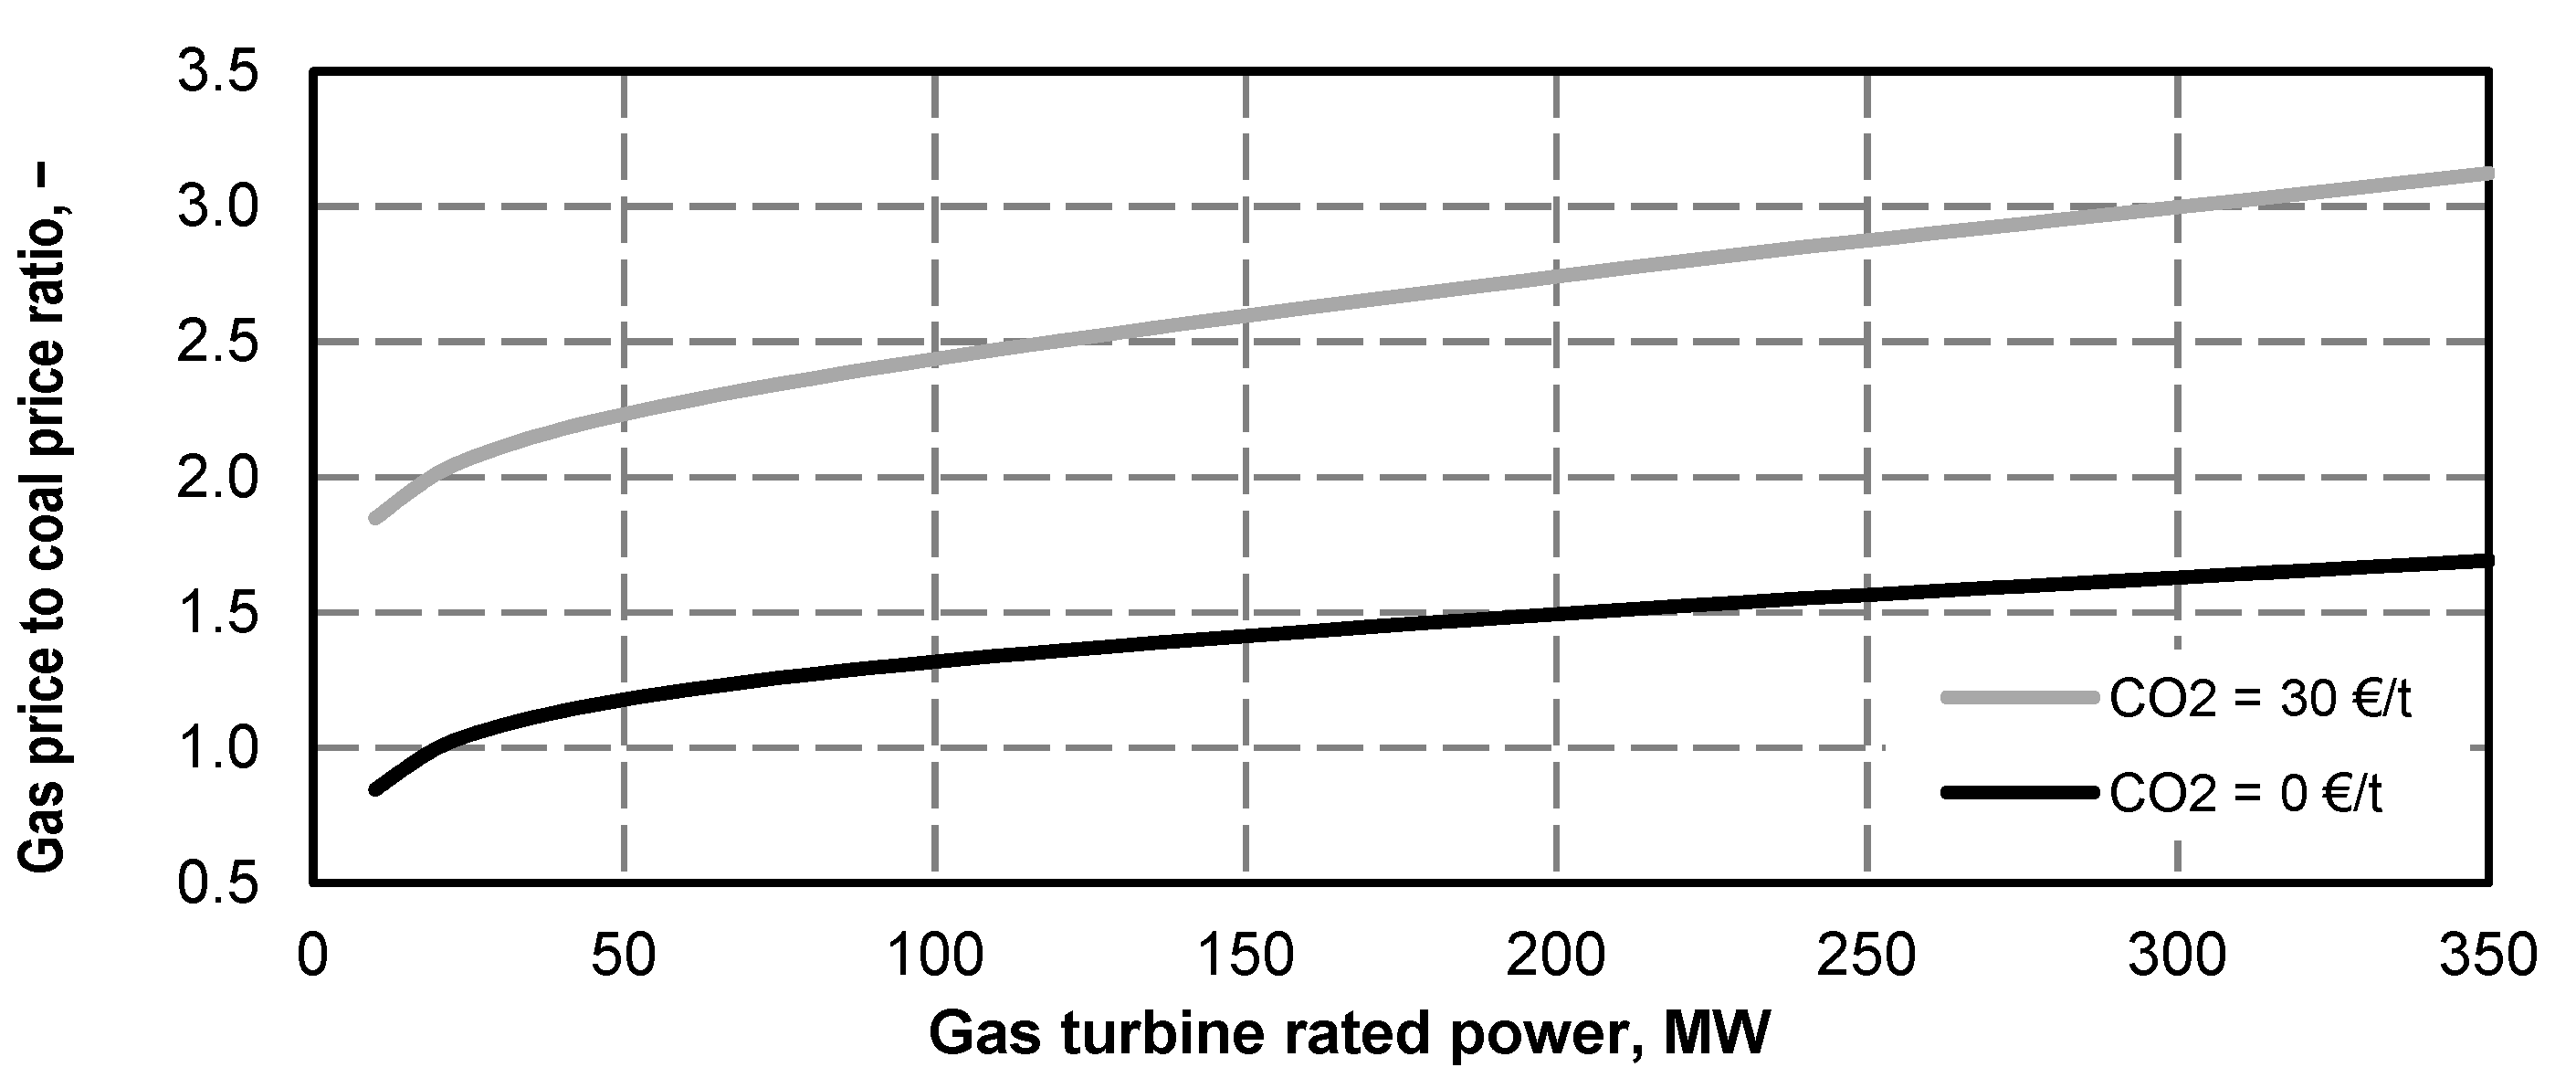
Like in Section 3.1, it was shown what ratios of gas unit price to coal unit price will make the investment profitable. The calculations were carried out for the coal unit price of 10 PLN/GJ, assuming no carbon dioxide emission taxes–the black line, for comparison, at taxes amounting to 30 EUR/tCO2–grey line. The examples of calculations for a single-pressure boiler are shown in Figure 47. Other structures of recovery boiler provided similar results.
The calculation results show that the investment, with no carbon dioxide emission taxes will be profitable at a ratio/gas/coal ranging from 1.2 to 1.8, i.e. slightly lower than for operating the gas turbine with its rated power. It means that, e.g. for coal price of 10.0 PLN/GJ, adding the gas turbine superstructure with a rated power of 350 MW will be viable for the gas price of 2.2 × 10 PLN/GJ = 22 PLN/GJ, i.e. lower by 5.7 PLN/GJ than the current price. In the case of superstructure of turbine with a lower rated power, the viability will be provided by accordingly lower gas price. The increase of unit carbon dioxide emission taxes and the resulting increase in electric power generation prices will make the 350 MW gas turbine upgrade viable at a gas price of 3.3 × 10 PLN/GJ = 33.0 PLN/GJ. For operating the power unit with a variable gas turbine power also only a dramatic increase of emission taxes, at least by several dozen-fold, could make the investment viable.

3.3. Power Production Unit Cost for the Quasi-Steady State of 370 MW Power Unit Operation With a Gas Turbine Shut Off During the Period of Night Low Demand (“Night Valley”)

The calculations of unit power generation cost that would make the superstructured power unit viable with shutting off the gas turbine during a lower power demand period are shown in Figure 48 and Figure 49. Like for remaining variants, the calculations were performed for a unit coal price of 10.0 PLN/GJ and 12.0 PLN/GJ.
As shown by the calculation results, an electric power generation unit price for all recovery boiler structures is higher than the cost before the upgrade of 170 PLN/MWh, even for a high coal price. Figure 50 shows what gas price to coal price ratio makes the gas turbine operation with a gas turbine shut off viable during the night low power demand (“night valley”).
For operating the superstructured power unit with shutting off the gas turbine during a lower power demand period (“night valley”) the gas price that provides economic viability for the 350 MW gas turbine is 1.7 × 10 PLN/GJ = 17.0 PLN/GJ, which is much below the current gas price. However, if the price of carbon dioxide emission permits increases to 30 EUR/t, and the cost of power generation increases to 250 PLN/MWh, the gas price providing economic viability can be even 3.1 × 10 PLN/GJ = 31 PLN/GJ. Here too, when assuming no permits for carbon dioxide emission, only a dramatic increase in environmental taxes can make the investment viable.

3.4. Sensitivity Analysis

The economic analysis of any business project should be complemented by a sensitivity analysis of the characteristic economic efficiency. It assumes that the future is unpredictable, and the variables assumed for calculations being part of the project (e.g. investment outlay value, sales level, price and cost level etc.) can differ from the initially assumed values. Most frequently the analysis covers net operating profit, gross profit, discounted net profit and internal return rate. In the case under consideration, the indicator of economic viability for adding a 370 MW gas turbine and a recovery boiler superstructure to the power unit is the unit cost of electric power generation whose upgrade profit is at least non-negative and must be lower than the electric power sales price. The lower the power generation cost than its sales price for the upgraded power unit, the higher will be the profit for the investor.
This section presents a sensitivity analysis that covered the system fitted with SGT5-4000F gas turbine with a rated power of 329 MW, gross rated efficiency of 41% and with a rated flue gas temperature of 599 °C and a single-pressure recovery boiler with a unit power generation cost at the lowest level for all variants under analysis. Estimated investment outlays for power unit amount to Jmod = PLN 487 million. The outlays include the purchase cost of new power generator, a new condenser and the low-pressure part of steam turbine with increased throughputs. The superstructure increased the power unit maximum power from 380 MW to 748 MW. The annual gross efficiency average also increases to 47.0% for a fresh steam stream delivery to turbine of 319.4 kg/s (1,150 t/h) and to the value of 47.8% for a minimum efficiency of the steam boiler of 133.3 kg/s (480 t/h). The higher increase for the minimum efficiency of the steam boiler was caused by lower electric energy losses whose highest levels are observed for the steam boiler.
For the previously analysed operation variants of the gas turbine, i.e. operating at a rated power, variable power, and the night gas turbine shut off, unit electric power generation cost providing a non-negative profit for the upgrade under analysis was calculated. Excluding carbon dioxide emission permits it was, 182.4 PLN/MWh, 184.3 PLN/MWh, 194.5 PLN/MWh, respectively Including carbon dioxide emission permits in the amount of 7 EUR/t, it was, 186.0 PLN/MWh, 190.4 PLN/MWh, 196.2 PLN/MWh, respectively
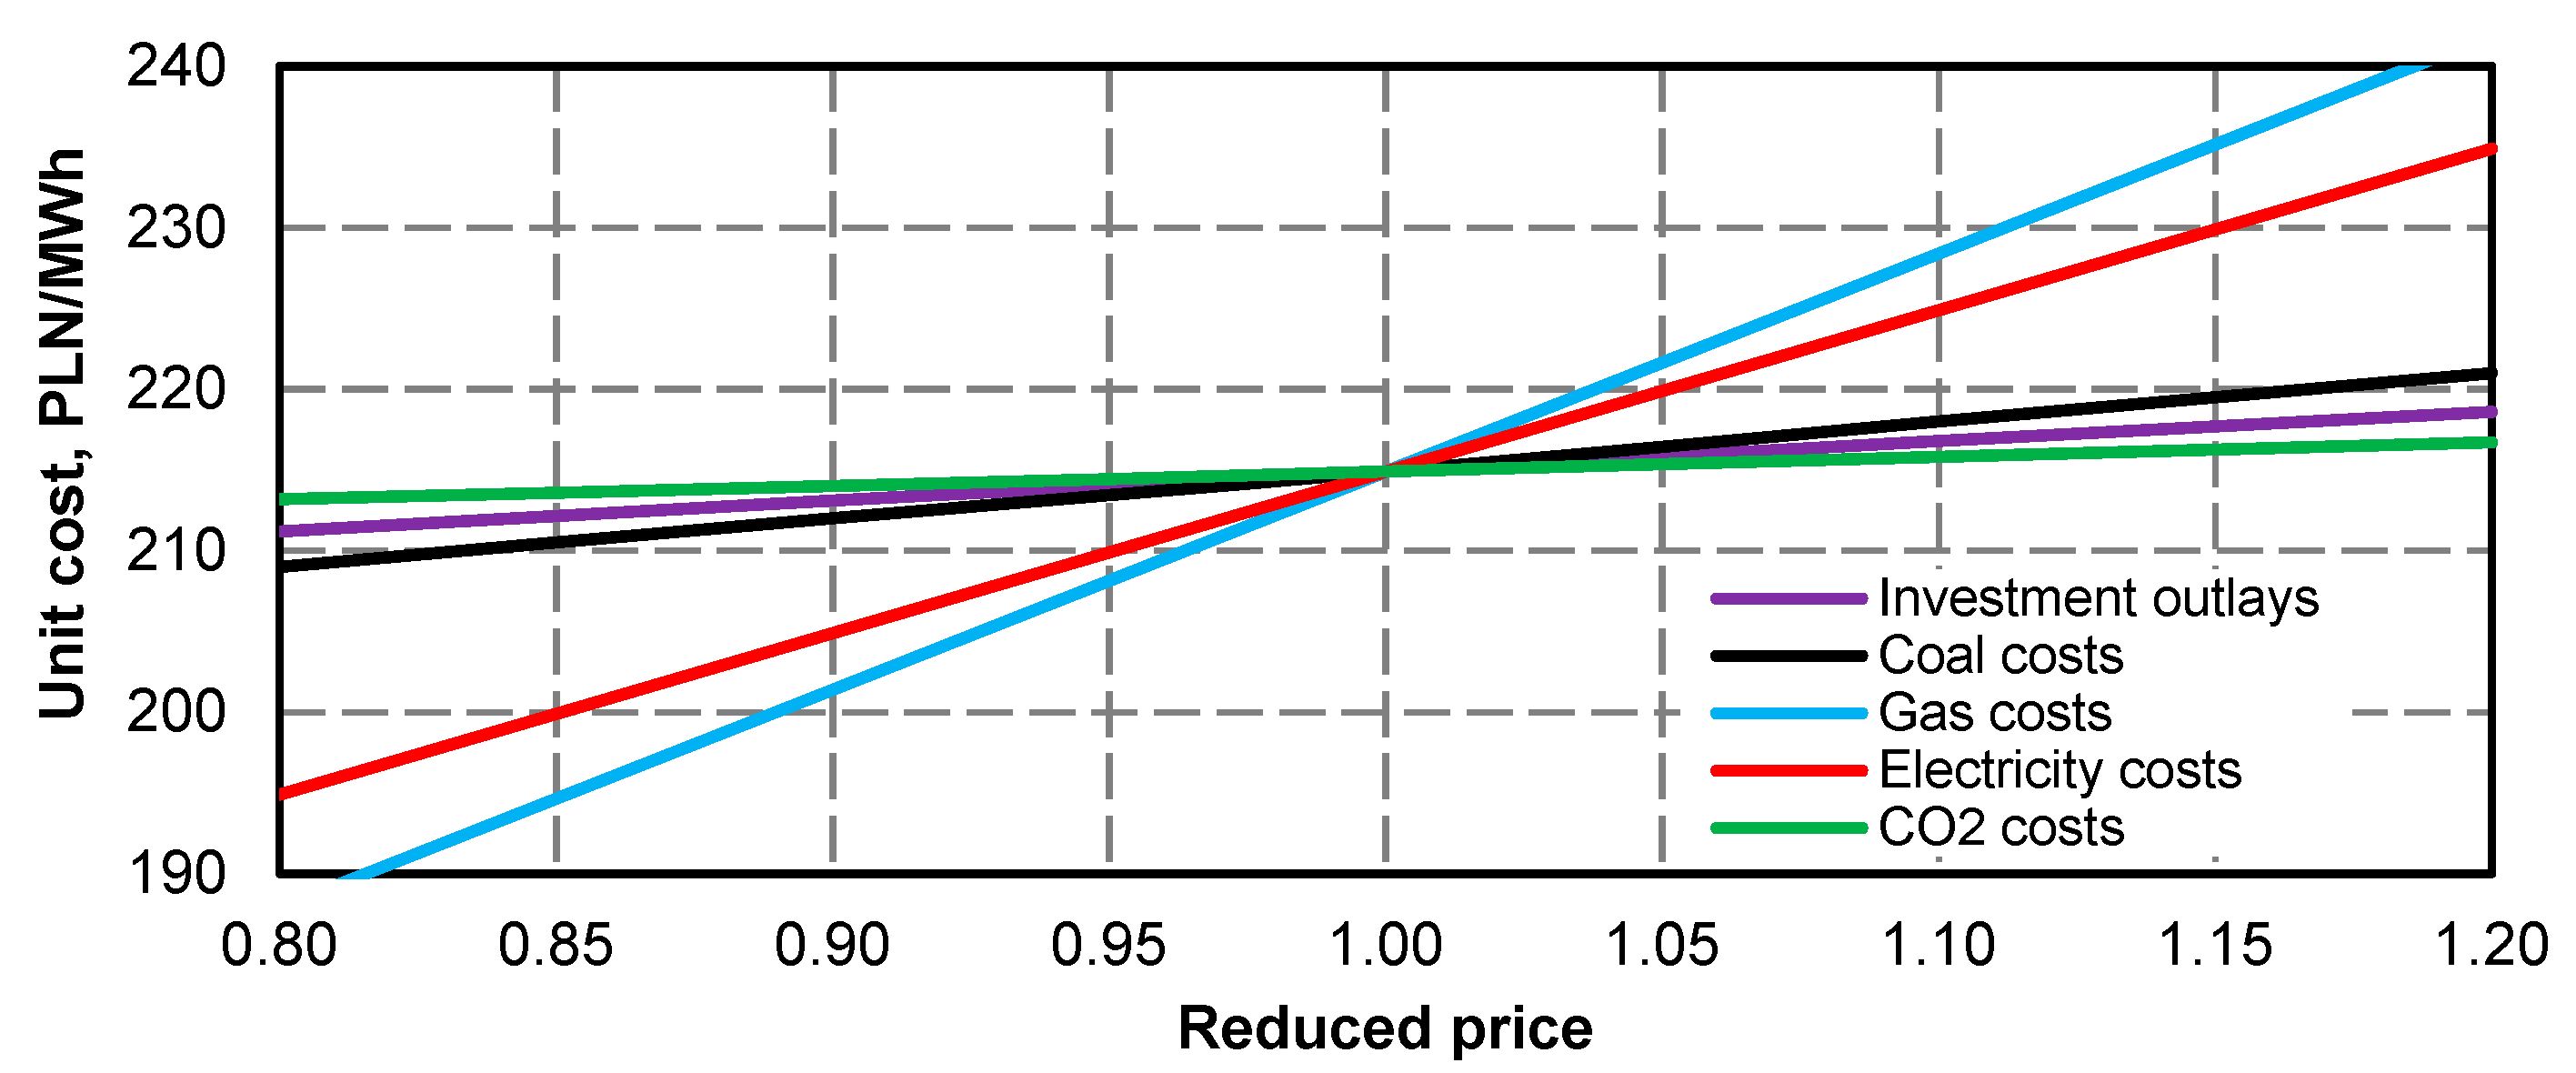
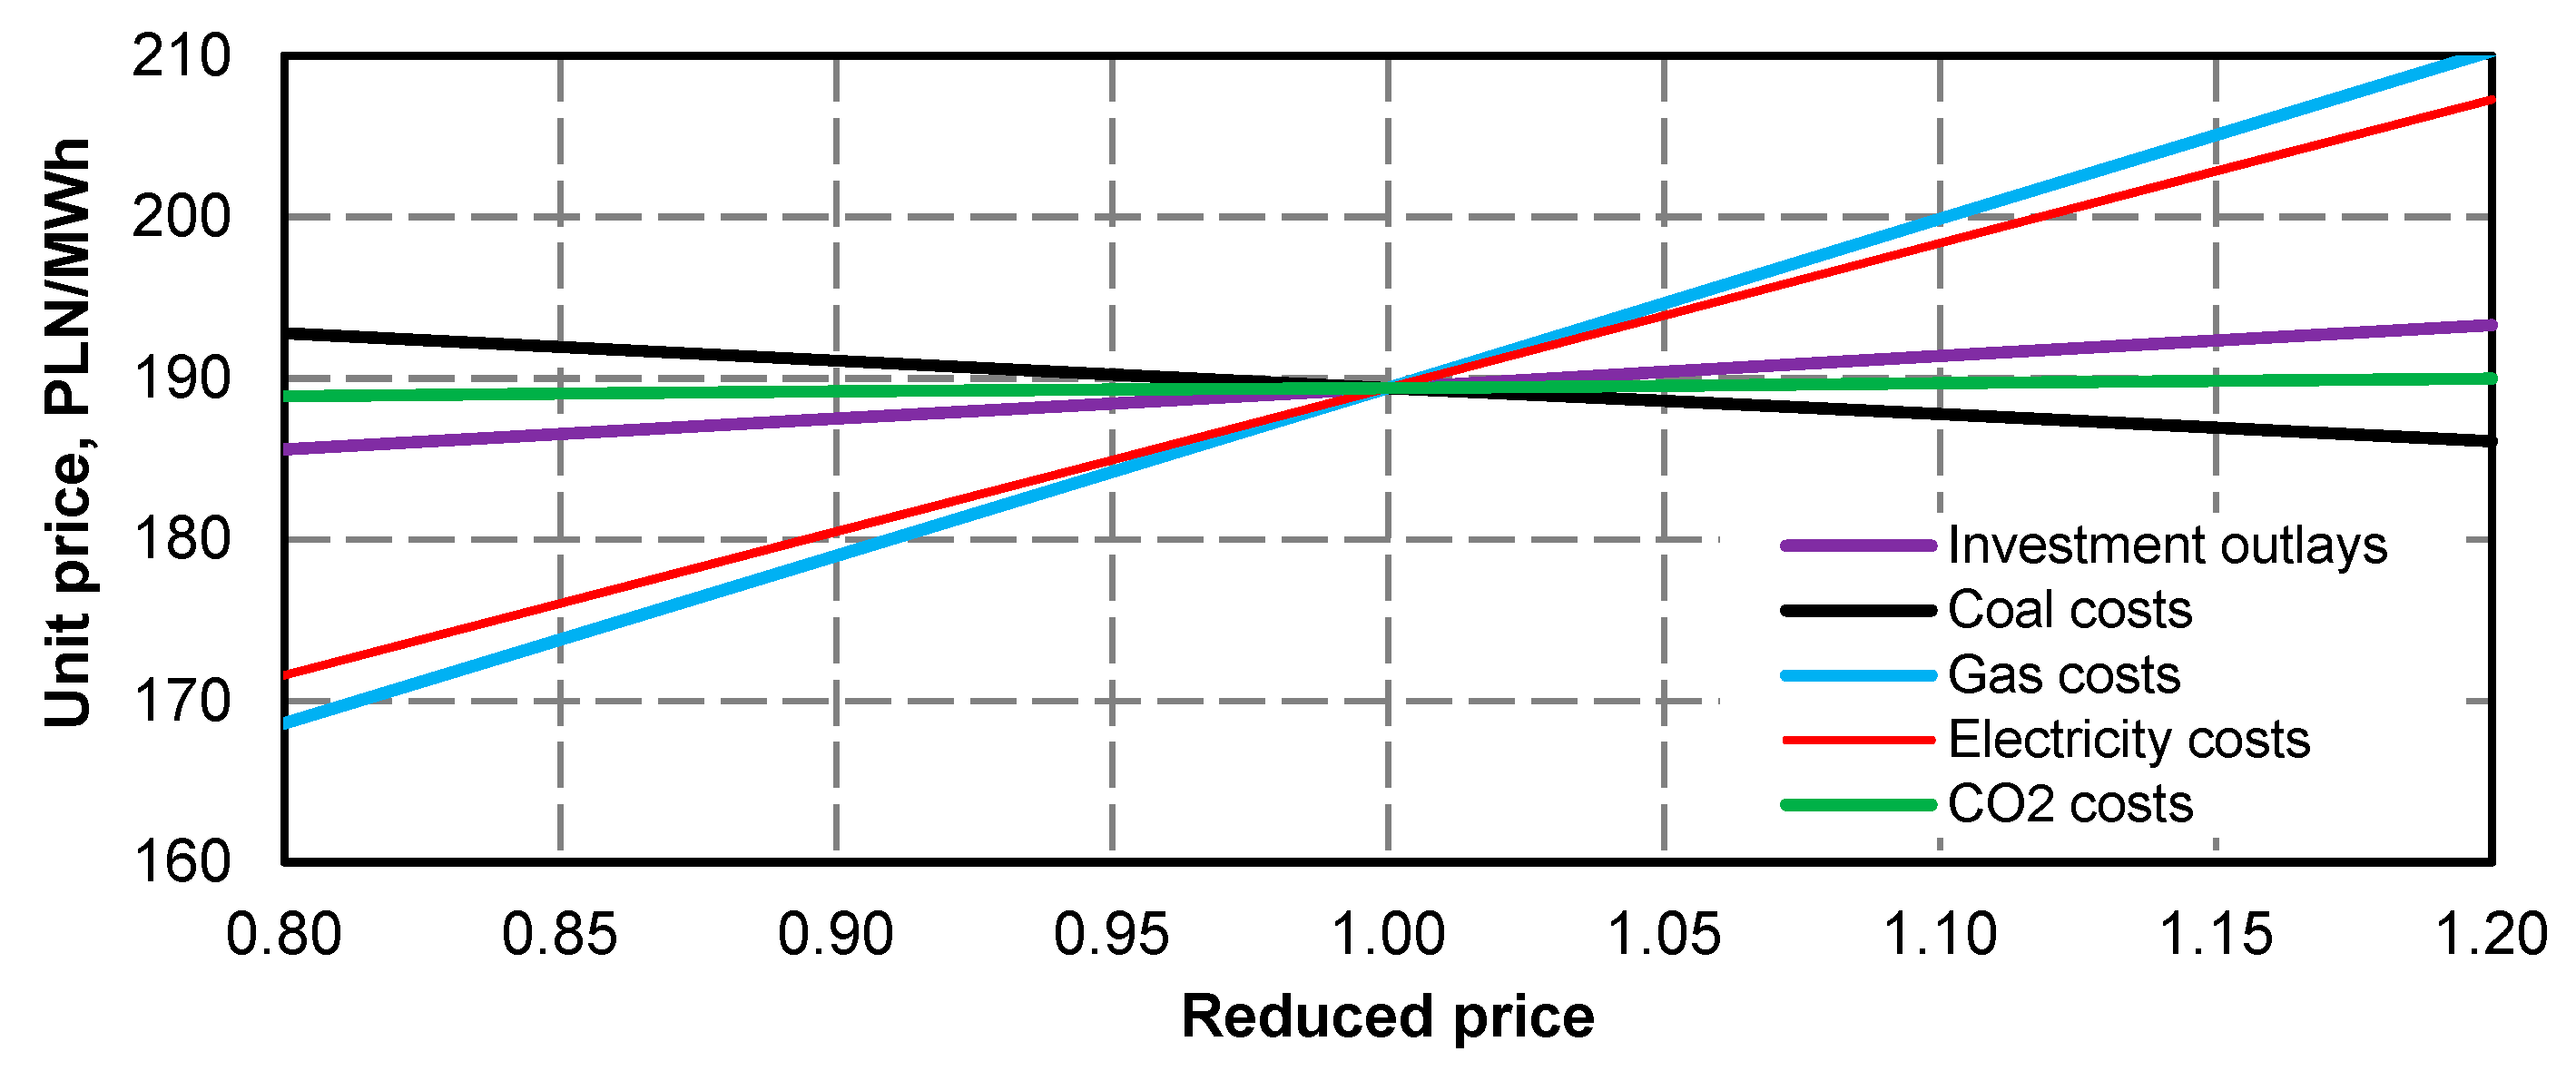
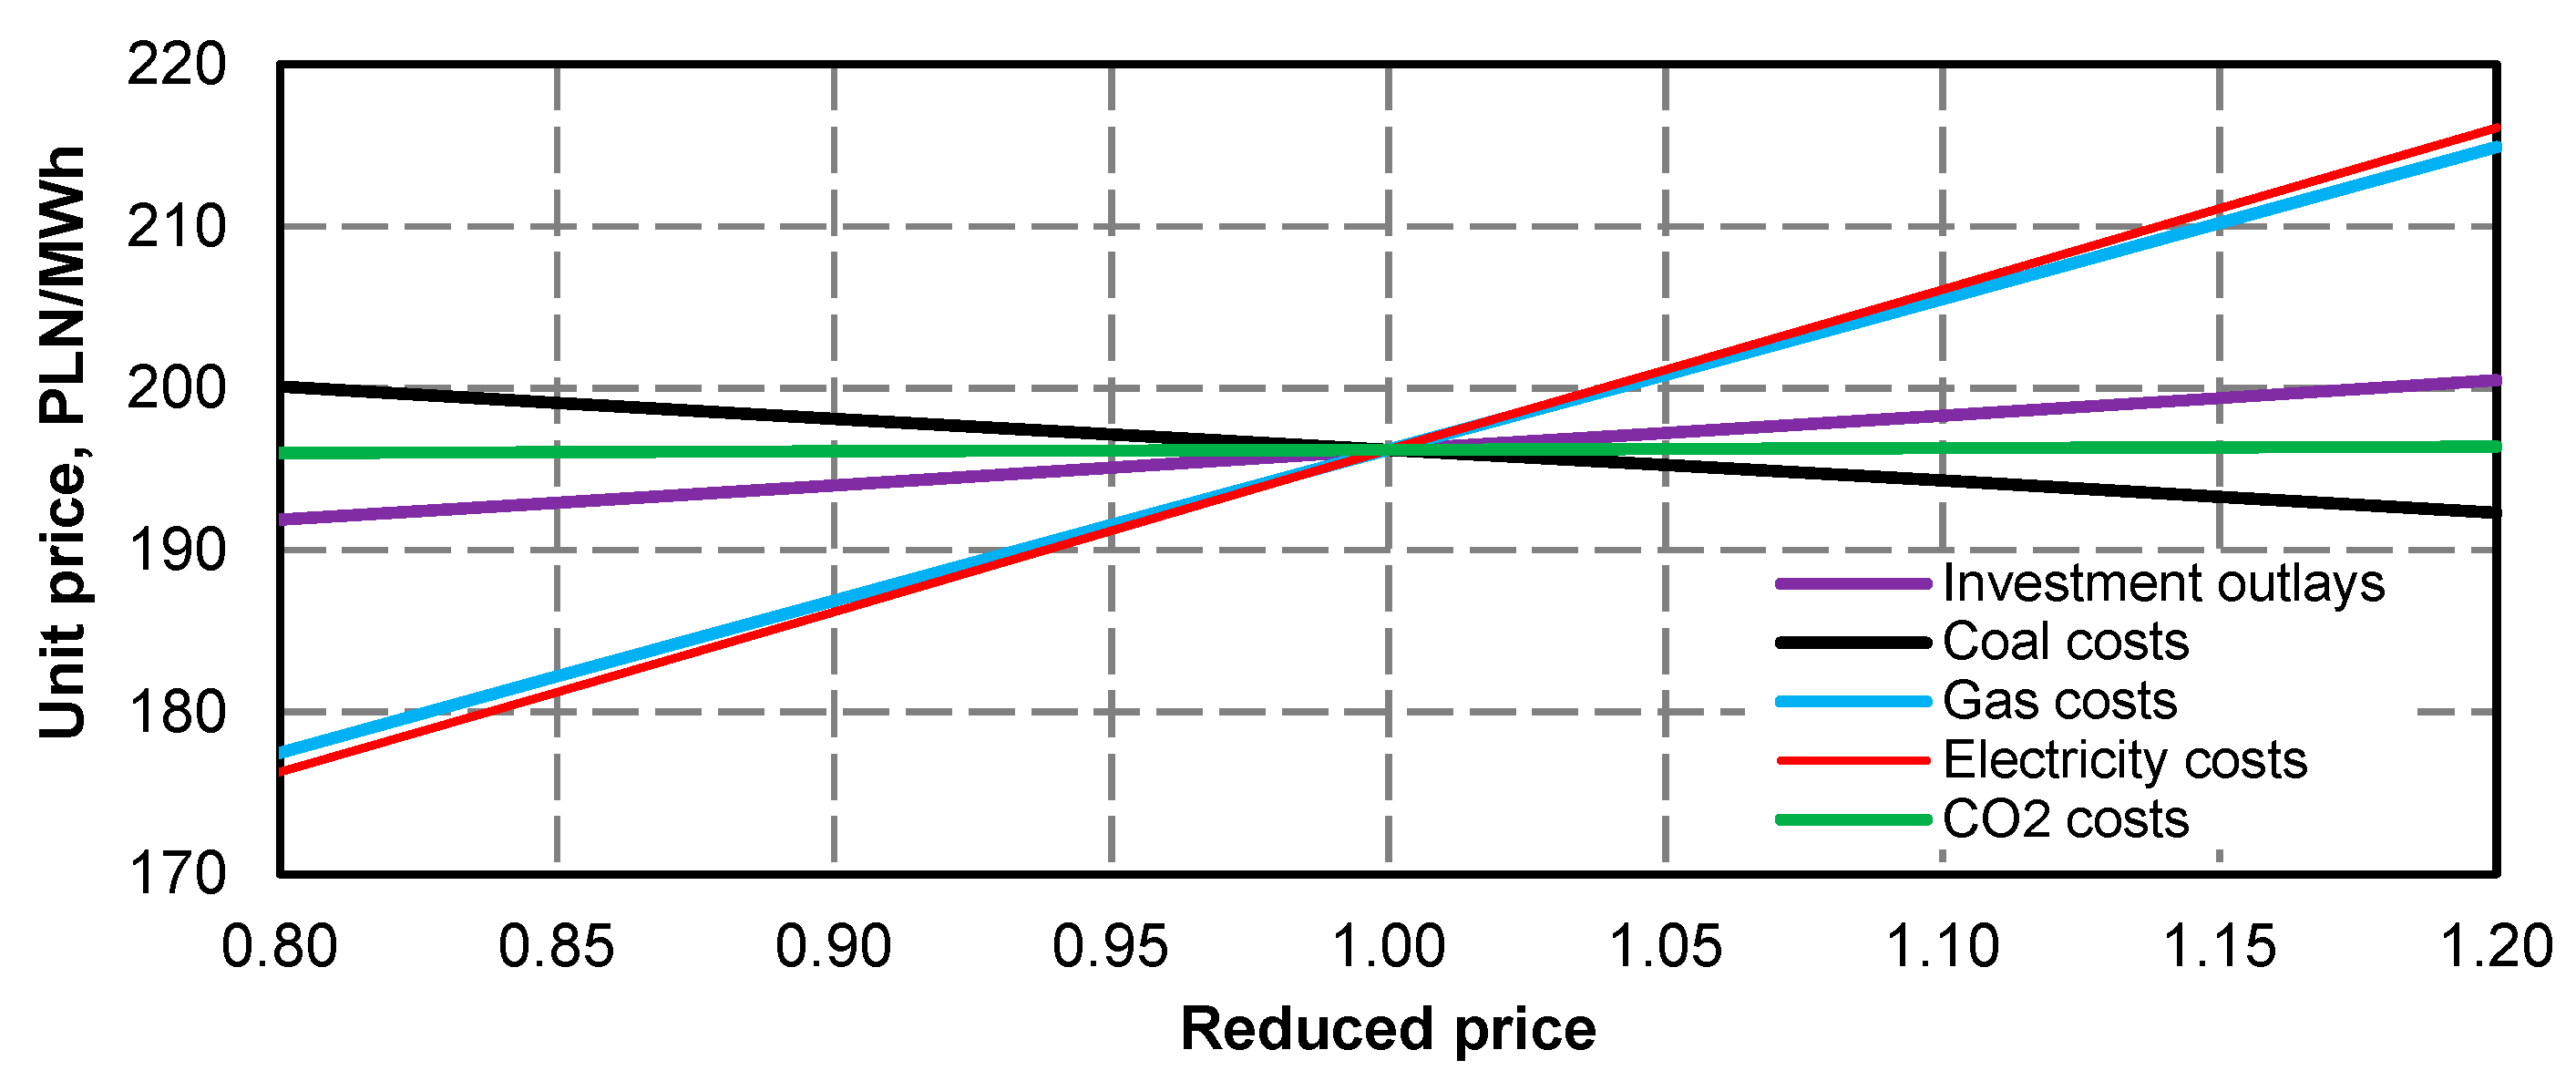
Figure 51, Figure 52 and Figure 53 present the impact of investment outlays, coal price, gas price, electricity price and the cost of carbon dioxide emission permits on the unit cost of power generation in the upgraded power unit. The calculations were performed for three gas turbine operation variants–at its rated power, variable power and with night gas turbine shut off.
As shown by the calculation results presented in Figure 51, Figure 52 and Figure 53, the unit cost of power generation exceeds the cost noted before its upgrade. However, the difference for the gas turbine operating at a rated power is not as high and it amounts to 16 PLN/MWh. However, this operation variant is highly unlikely, because of the power surplus generated by the system during the night low demand period and low balancing capacity of the power unit. The most likely is the operating variant with a variable gas turbine power and its night shut off. However, such an operation makes the economic viability worse, because in the case of shutting off the gas turbine at night, the unit price will be 196.2 PLN/MWh. Therefore, to make the investment viable for the customer, the unit cost of electric power for the least viable operating variant, it should be at least equal to the cost of generation before the upgrade, amounting to 170 PLN/MWh.
The highest impact on the unit cost of power generation exerts the unit gas fuel price. To a lesser extent, it depends on the investment outlays and coal prices and to the least degree, on the prices of carbon dioxide permits at their current, low level. To make the superstructure investment profitable for the least viable variant, the gas price should be reduced by approximately 28%, i.e. to approximately 19.9 PLN/GJ. It is also likely that the prices of carbon dioxide emission permits and coal price will increase, while, at the same time, the gas price will decrease. In this case the changes could be lower.

3.5. Summary

The presented results of economic calculations show that at price and cost levels assumed for calculations, the turbine gas superstructure is at the threshold of viability and the investment carries a high degree of risk. The electric power generation cost is lower from its current price only for the highest gas turbine rated power when the gas turbine operates at its rated power. As already mentioned, such an operation was highly unlikely because of power surplus in the period of low demand. The operation with a fixed gas turbine power would probably stimulate the necessity for night outages of the upgraded power unit, which would reduce its economic viability after the upgrade. More probable, and featuring higher flexibility, is the operation variant with balancing the gas turbine and its shut off in the period of night low power demand (night valley). However, such an operation provides lower thermodynamic and economic efficiency and would currently bring losses. However, the sensitivity analysis shows that a slight reduction in gas prices and the increase of electricity price would make this superstructure variant viable. The most important thermodynamic and economic parameters are shown in Table 1 and Table 2.
The calculations presented in the paper refer to the 370 MW power unit as for a power unit with subcritical parameters, a relatively high efficiency, reaching the level of 40%. In Poland there is still a lot of 200 MW power units with an efficiency lower even by a few percent points. For such power units the investment at current price ratios can be viable and extend its operating life endangered by the introduction of more stringent environmental requirements. Falling gas prices and the restrictive EU policy, expressed by the so-called Best Available Technology (BAT) conclusions suggest that gas technologies can become more popular in the near future.

4. Conclusions

The superstructure of the power unit with a gas turbine causes an increase in overall efficiency and a reduction in the unit emission of pollutants into the atmosphere. An advantage is also the possibility of even double the maximum capacity of the power unit. As a result of limiting the steam flow to the regeneration exchangers, the minimum power of the steam turbine increases. This reduces the available range of unit power regulation. The steam boiler has a minimum capacity below which it cannot operate in a stable manner. Without a gas turbine superstructure this minimum steam turbine capacity is 180 MW, i.e. approximately 48% of the nominal capacity of 370 MW.
  • As a result of the superstructure, depending on the power of the gas turbine and the structure of the recovery boiler, the minimum power of the steam turbine unit increases. For example, for a gas turbine power value of 350 MW, it increases to approximately 320–345 MW. Thus, it increases by about 140–165 MW over 180 MW. The increase in the maximum power of a steam turbine set is about 39–50 MW (Figure 15, Figure 27, Figure 39).
  • Due to a large increase in the minimum power of a steam turbine set and a small increase in its maximum power, the operating power range decreases. For operation of the superstructure of a unit with rated gas turbine capacity of 350 MW it is about 11% (Figure 16, Figure 28, Figure 40), which is a very small value.
  • Lowering the power of a gas turbine to 60% of its rated power increases the available power range to approx. 34%. However, the requirements imposed on power units participating in the NPS regulation are higher. According to the transmission system operation and maintenance manual, the relative change of electric power that should be characteristic of new or upgraded power units operating as centrally disposed units should be 0.6, which corresponds to the operation range 40–100% of rated power.
  • Extension of the control range can be realized by switching off the gas turbine during low power demand of the power system. This results that for a gas turbine capacity of 350 MW, it varies from 180 MW (steam turbine only, gas turbine is switched off) to approximately 770–780 MW (gas turbine operates with rated power). This corresponds to the relative available power range of approximately 0.77, which meets the requirements of the grid code.
  • Now, when system natural power changes are superimposed by uncontrollable production from renewable power sources, mainly wind power, the demand for flexible generating units increases. Facing a shortage in number of such units, the control of energy generation from system power plants takes place by shutting them off in the period of system lower power demand. This phenomenon aggravates especially in winter season, when heat and power plants work together within the system, and their electric power can be balanced only to a very low extent. Consequently, the power unit with added gas turbine superstructure has to meet the power grid requirements provided its power can change in a wide range. Such changes can be provided only by using a gas turbine with a variable power and a shut off option.

Author Contributions

R.B., Z.B. and A.H.-S. designed the study. Z.B. and A.H-S. conducted the literature review. R.B., Z.B. and A.H.-S. analyzed the data and interpreted the results. M.S. and T.P. provided the data. R.B. and Z.B. Writing-Original Draft Preparation; R.B., Z.B. and A.H.-S. Writing-Review & Editing.; All authors have read and approved the final manuscript.

Funding

This research received no external funding.

Conflicts of Interest

The authors declare no conflict of interest.

Nomenclature

DPBPDiscounted Payback Period (years)
eunit price (PLN/MWh, PLN/GJ)
envenvironment
Eenergy (MWh, GJ)
Ėenergy stream (MW)
IRRInternal Rate of Return (%)
Jinvestment outlays (PLN)
kunit cost (PLN/MWh, PLN/GJ)
Kcost (PLN)
Nelectrical power (MW)
NPVNet Present Value (PLN)
punit rate per emission (PLN/kg)
Greek letters
Δincrease or decrease
η efficiency (–)
τtime (h)
ρemission per chemical energy unit (kg/GJ)
χapparent efficiency (–)
Superscripts and Subscripts
Aannual
ccoal
chchemical
elelectric energy
GTgas turbine
exexisting (before modernization)
ggas
modafter modernization
r,m,wmaintenance and repairs, non-energetic raw materials, auxiliary materials, replenishing water
STsteam turbine

References

  1. Bartnik, R.; Buryn, Z.; Hnydiuk-Stefan, A.; Otawa, A.; Skomudek, W. Methodology and Continuous Time Mathematical Model to Select Optimum Power of Gas Turbine Set for Dual-Fuel Gas-Steam Combined Heat and Power Plant in Parallel System. Energies 2018, 11, 1784. [Google Scholar] [CrossRef] [Green Version]
  2. Bianchi, M.; Branchini, L.; Cesari, S.; De Pascale, A.; Melino, F. Repowering existing under-utilized WTE power plant with gas turbines. Appl. Energy 2015, 16015, 902–911. [Google Scholar] [CrossRef]
  3. Bianchi, M.; Branchini, L.; Cesari, S.; De Pascale, A. Combining waste-to-energy steam cycle with gas turbine units. Appl. Energy 2014, 1301, 764–773. [Google Scholar] [CrossRef]
  4. Butler, D.; Hume, S.; Scott, S.; Lamprecht, D. Repowering Options for Complying with Canadian CO2 Emission Intensity Limits on Existing Coal Plants. In Proceedings of the 13th International Conference on Greenhouse Gas Control Technologies (GHGT), Lausanne, Switzerland, 14–18 November 2016. [Google Scholar] [CrossRef]
  5. Carapellucci, R.; Giordano, L. Energy, economic and environmental assessments for gas-turbine integration into an existing coal-fired power plant. Energy Procedia 2014, 45, 1175–1184. [Google Scholar] [CrossRef] [Green Version]
  6. Carapellucci, R.; Giordano, L. Feed water repowering of coal fired power plants: Effects of steam turbine overloads on energy and economic performance of the integrated power system. In Proceedings of the ASME 2013 International Mechanical Engineering Congress and Exposition IMECE2013, San Diego, CA, USA, 15–21 November 2013. [Google Scholar] [CrossRef]
  7. Carapellucci, R. A unified approach to assess performance of different techniques for recovering exhaust heat from gas turbines. Energy Convers. Manag. 2009, 50, 1218–1226. [Google Scholar] [CrossRef]
  8. Escosa, J.; Luis, R. Optimizing CO2 avoided cost by means of repowering. Appl. Energy 2009, 86, 2351–2358. [Google Scholar] [CrossRef]
  9. Kehlhofer, R.; Hannemann, F.; Stirnimann, F.; Rukes, B. Combined Cycle Gas and Steam Turbine Power Plants, 3th ed.; PennWell Corporation: Tulsa, OK, USA, 2014; ISBN 10-1-59370-168-3. [Google Scholar]
  10. Liszka, M.; Manfrida, G.; Ziębik, A. Parametric study of HRSG in case of repowered industrial CHP plant. Energy Convers. Manag. 2003, 44, 995–1012. [Google Scholar] [CrossRef]
  11. Marzban, A.; Akbari, O.; Ahmadi, G. Evaluation of supply boiler repowering of an existing natural gas-fired steam power plant. Appl. Therm. Eng. 2017, 124, 897–910. [Google Scholar] [CrossRef]
  12. Najjar, Y. Efficient use of energy by utilizing gas turbine combined systems. Appl. Therm. Eng. 2001, 21, 407–438. [Google Scholar] [CrossRef]
  13. Naserabad, S.; Mobini, K.; Mehrpanahi, A.; Aligoodarz, M. Exergy-energy analysis of full repowering of a steam power plant. Front. Energy 2015, 9, 54–67. [Google Scholar] [CrossRef]
  14. Sarabchi, K.; Nayyeri, V. Investigation of gas turbinr parameters on repowering of existing steam power plants as fully fired combined cycle. In Proceedings of the ASME Turbo Expo, Barcelona, Spain, 8–11 May 2006; Volume 4, pp. 405–411. [Google Scholar] [CrossRef]
  15. Szargut, J. Energy and Ecological Effects of the Primary Gas-Turbine Supplementing a Coal-Fired Power Plant. Int. J. Appl. Thermodyn. 1999, 2, 1–4. [Google Scholar]
  16. Tańczuk, M.; Skorek, J.; Bargiel, P. Energy and economic optimization of the repowering of coal-fired municipal district heating source by a gas turbine. Energy Convers. Manag. 2017, 1491, 885–895. [Google Scholar] [CrossRef]
  17. Wołowicz, M.; Milewski, J.; Badyda, K. Feedwater repowering of 800 MW supercritical steam power plant. J. Power Technol. 2012, 92, 127–134. [Google Scholar]
  18. Najjar, Y.; Akyurt, M. Combined cycles with gas turbine engines. Heat Recovery Syst. Chp 1994, 14, 93–103. [Google Scholar] [CrossRef]
  19. Najjar, Y.; Akyurt, M.; Al-Rabghi, O.M.; Alp, T. Cogeneration with gas turbine engines. Heat Recovery Syst. Chp 1993, 13, 471–480. [Google Scholar] [CrossRef]
  20. Khaliq, A. Exergy analysis of gas turbine trigeneration system for combined production of power heat and refrigeration. Int. J. Refrig. 2009, 32, 534–545. [Google Scholar] [CrossRef]
  21. Mohammadi, K.; Saeed, M.; Khaledi, E.; Saghafifar, M.; Powell, K. Hybrid systems based on gas turbine combined cycle for trigeneration of power, cooling, and freshwater: A comparative techno-economic assessment. Sustain. Energy Technol. Assess. 2020, 37, 100632. [Google Scholar] [CrossRef]
  22. Popli, S.; Rodgers, P.; Eveloy, V. Trigeneration scheme for energy efficiency enhancement in a natural gas processing plant through turbine exhaust gas waste heat utilization. Appl. Energy 2012, 93, 624–636. [Google Scholar] [CrossRef]
  23. Zhang, S.Y.; Wang, X.L.; Li, Y.; Wang, W.Q.; Li, W.T. Study on a novel district heating system combining clean coal-fired cogeneration with gas peak shaving. Energy Convers. Manag. 2020, 203, 112076. [Google Scholar] [CrossRef]
  24. Almutairi, A.; Pilidis, P.; Al-Mutawa, N. Energetic and Exergetic Analysis of Combined Cycle Power Plant: Part-1 Operation and Performance. Energies 2015, 8, 14118–14135. [Google Scholar] [CrossRef]
  25. Soltani, S.; Athari, H.; Rosen, M.A.; Mahmoudi, S.M.S.; Morosuk, T. Thermodynamic Analyses of Biomass Gasification Integrated Externally Fired, Post-Firing and Dual-Fuel Combined Cycles. Sustainability 2015, 7, 1248–1262. [Google Scholar] [CrossRef] [Green Version]
  26. Mohan, G.; Dahal, S.; Kumar, U.; Martin, A.; Kayal, H. Development of Natural Gas Fired Combined Cycle Plant for Tri-Generation of Power, Cooling and Clean Water Using Waste Heat Recovery: Techno-Economic Analysis. Energies 2014, 7, 6358–6381. [Google Scholar] [CrossRef] [Green Version]
  27. Kryzia, D.; Kopacz, M.; Kryzia, K. The Valuation of the Operational Flexibility of the Energy Investment Project Based on a Gas-Fired Power Plant. Energies 2020, 13, 1567. [Google Scholar] [CrossRef] [Green Version]
  28. Matuszewska, D.; Olczak, P. Evaluation of Using Gas Turbine to Increase Efficiency of the Organic Rankine Cycle (ORC). Energies 2020, 13, 1499. [Google Scholar] [CrossRef] [Green Version]
  29. Carcasci, C.; Cheli, L.; Lubello, P.; Winchler, L. Off-Design Performances of an Organic Rankine Cycle for Waste Heat Recovery from Gas Turbines. Energies 2020, 13, 1105. [Google Scholar] [CrossRef] [Green Version]
  30. Bartnik, R.; Buryn, Z. Conversion of Coal-Fired Power Plants to Cogeneration and Combined Cycle. Thermal and Economic Effectiveness; Springer: London, UK, 2011. [Google Scholar] [CrossRef]
  31. Bartnik, R.; Bartnik, B. Rachunek Ekonomiczny w Energetyce; WNT: Warszawa, Poland, 2014; ISBN 978-83-7926-198-7. (In Polish) [Google Scholar]
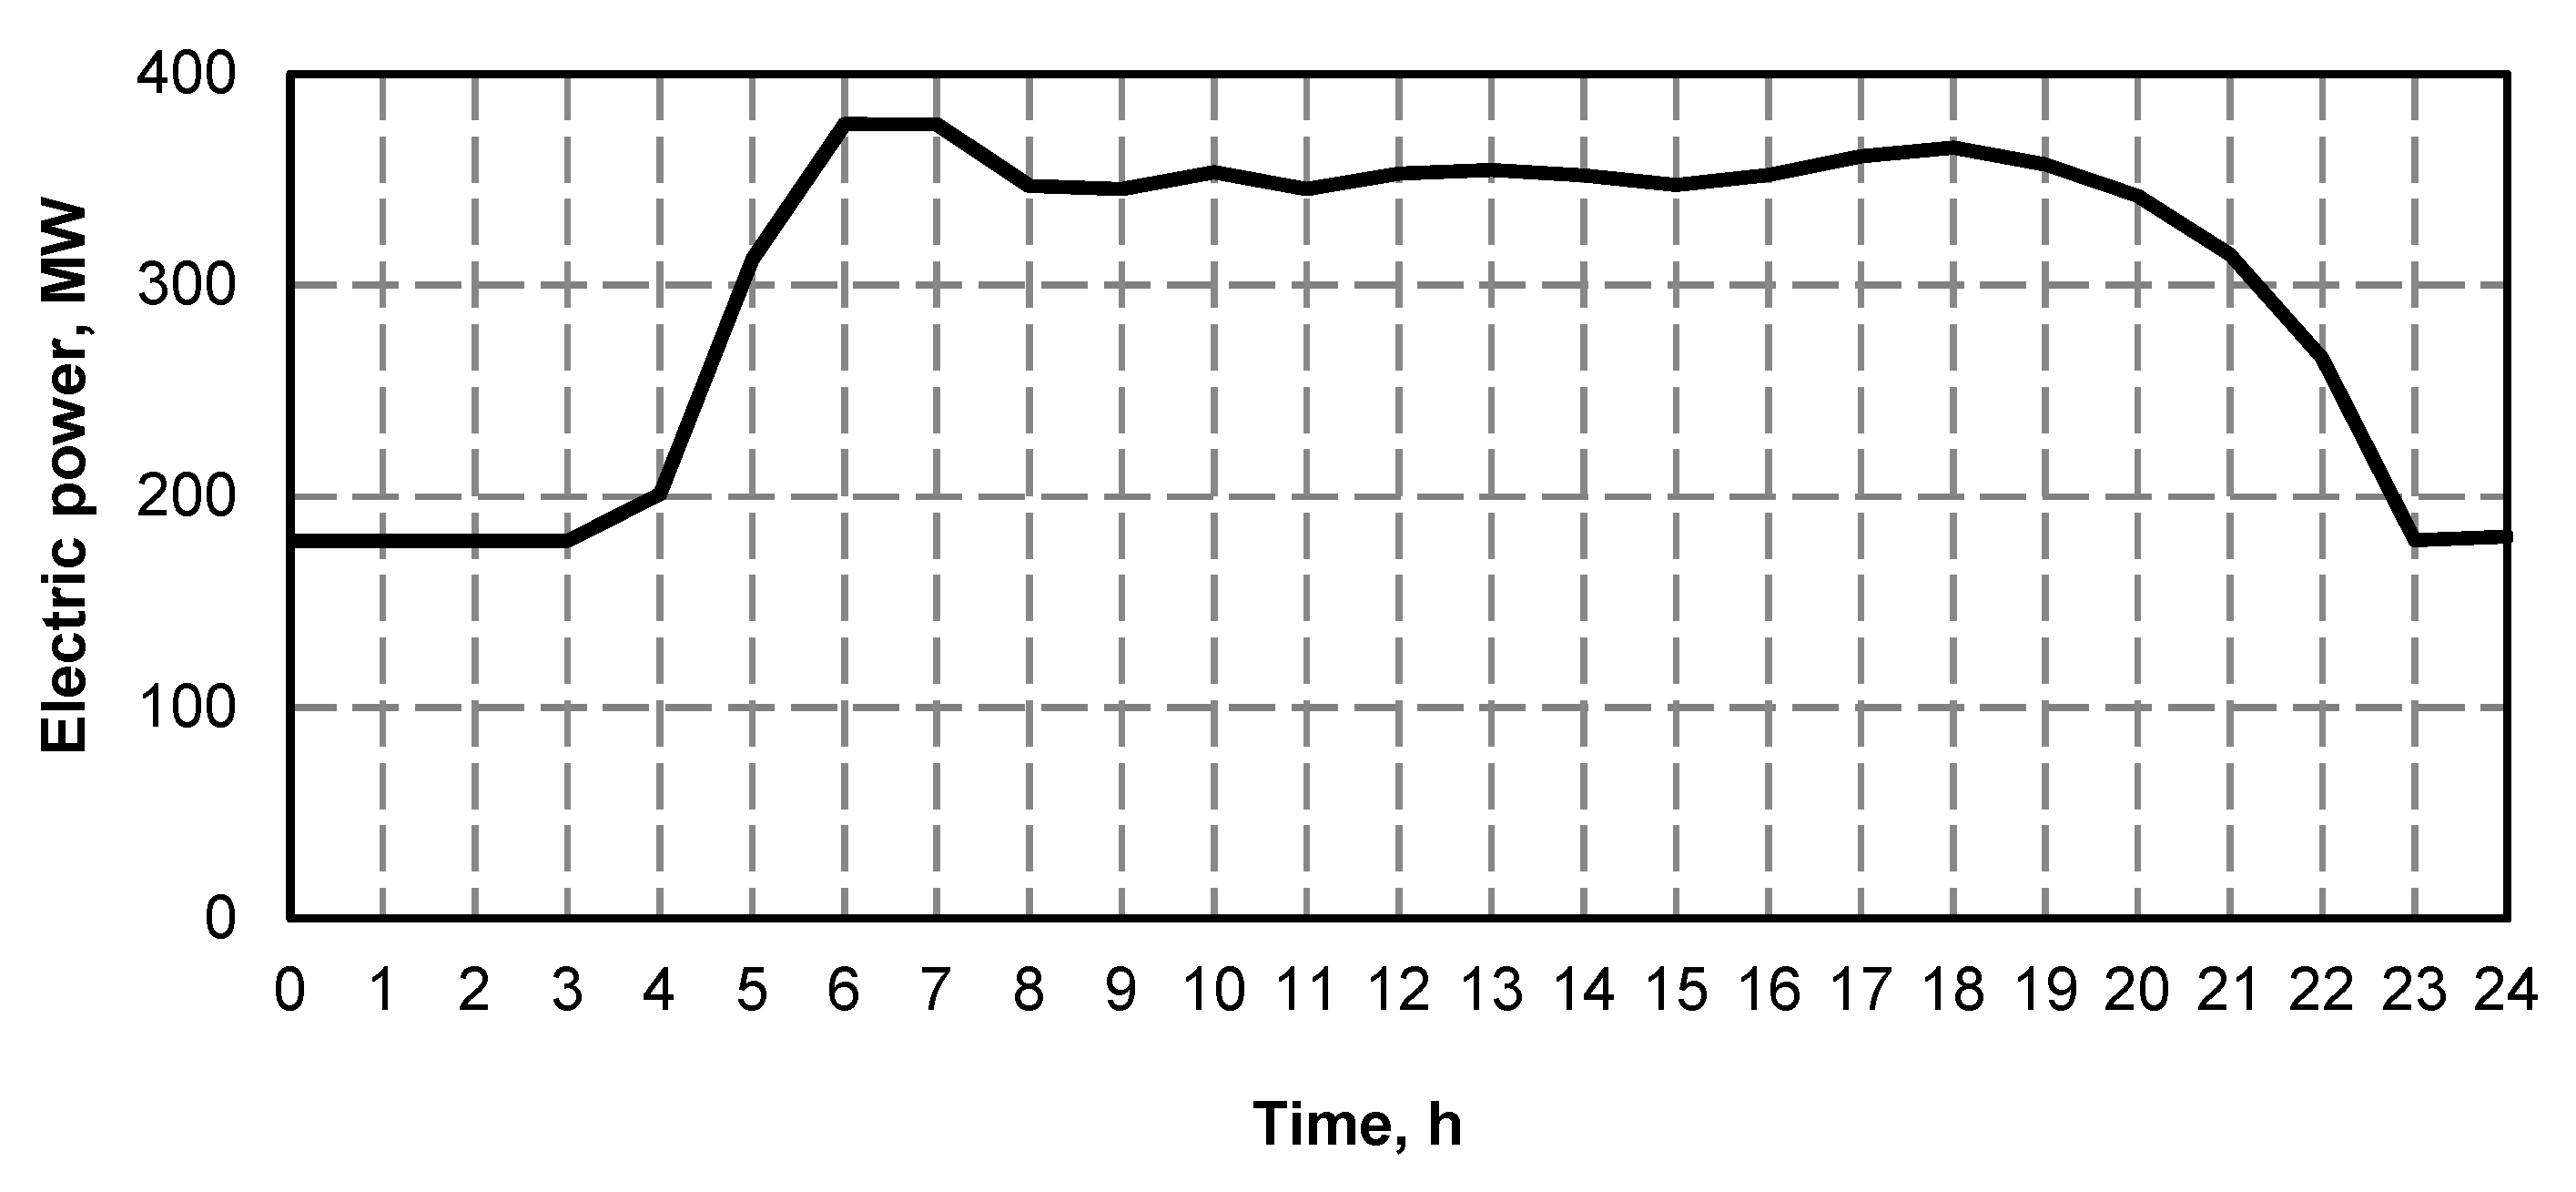
Figure 1. Typical daily power unit curve with a rated power of 370 MW in the Opole power plant taking part in the national power system control.
Energies 13 02432 g001
Figure 2. A fragment of all-year, actual hourly average curve of electric power for one of the 370 MW power units in the Opole power plant–January.
Energies 13 02432 g002
Figure 3. Heat schematic for the 370 MW power unit superstructured with a single gas turbine and a triple-pressure heat recovery steam generator (HRSG).
Energies 13 02432 g003
Figure 4. Schematic diagram for heat recovery steam generators (HRSG).
Energies 13 02432 g004
Figure 5. The stream of condensate fed from the KQ1 condenser to the XN1–XN4 low-pressure heat recovery exchangers as a function of gas turbine power: 1—maximum fixed stream of 319.4 kg/s fresh steam fed to steam turbine; 2—minimum steam boiler output of 133.3 kg/s and gas turbine operating with rated power, 2’—minimum steam boiler output of 133.3 kg/s and gas turbine operating with 60% of its rated power.
Energies 13 02432 g005
Figure 6. The streams of extraction steam for the XN1–XN4 low-pressure regeneration exchangers for a maximum fixed stream of 319.4 kg/s fresh steam fed to the steam turbine as a function of gas turbine rated power.
Energies 13 02432 g006
Figure 7. The streams of extraction steam for the XN1–XN4 low-pressure regeneration exchangers for a minimum steam boiler output of 133.3 kg/s and a gas turbine operating at a rated power.
Energies 13 02432 g007
Figure 8. The streams of extraction steam for the XN1–XN4 low-pressure regeneration exchangers for a minimum steam boiler output of 133.3 kg/s and gas turbine operating at 60% of its rated power.
Energies 13 02432 g008
Figure 9. The energy efficiency for the power unit with superstructure added as a function of gas turbine rated power for a maximum fixed stream of 319.4 kg/s fresh steam fed to the steam turbine.
Energies 13 02432 g009
Figure 10. The energy efficiency for the power unit with superstructure added as a function of gas turbine rated power at a minimum steam boiler output of 133.3 kg/s and with gas turbine operating at its rated power.
Energies 13 02432 g010
Figure 11. The energy efficiency for the power unit with superstructure added as a function of gas turbine rated power at a minimum steam boiler output of 133.3 kg/s and gas turbine operating at 60% of its rated power.
Energies 13 02432 g011
Figure 12. Fresh steam streams as a function of gas turbine rated power: 1—maximum fixed steam stream of 319.4 kg/s fed to the steam turbine 2—steam stream generated in the steam boiler, 3—steam stream generated in the recovery boiler.
Energies 13 02432 g012
Figure 13. Fresh steam streams as a function of gas turbine rated power at a minimum steam boiler output of 133.3 kg/s: 1, 1’—steam streams fed to the steam turbine, 2—steam stream generated in the steam boiler at its minimum output, 3—steam stream generated in the recovery boiler for gas turbine operating at its rated power, 3’—steam stream generated in the recovery boiler for gas turbine operating at 60% of its rated power.
Energies 13 02432 g013
Figure 14. The stream of outlet steam from the low-pressure steam turbine part to the KQ1 condenser as a function of gas turbine rated power: 1—maximum fixed stream of 319.4 kg/s fresh steam fed to steam turbine; 2—minimum steam boiler output of 133.3 kg/s and gas turbine operating at a rated power, 2’—minimum steam boiler output of 133.3 kg/s and gas turbine operating with 60% of its rated power.
Energies 13 02432 g014
Figure 15. Steam turbine power as a function of gas turbine rated power: 1—maximum fixed stream of 319.4 kg/s fresh steam fed to steam turbine; 2—minimum steam boiler output of 133.3 kg/s and gas turbine operating at a rated power, 2’—minimum steam boiler output of 133.3 kg/s and gas turbine operating with 60% of its rated power, 3—40% of gas turbine rated power.
Energies 13 02432 g015
Figure 16. Relative available power range of power unit as a function of gas turbine rated power: 1—gas turbine operating at its rated power, 2—gas turbine operating with variable power ranging from 100% to 60% of its rated power.
Energies 13 02432 g016
Figure 17. The stream of condensate fed from the KQ1 condenser to the XN1–XN4 low-pressure heat recovery exchangers as a function of gas turbine power: 1–maximum fixed stream of 319.4 kg/s fresh steam fed to steam turbine; 2–minimum steam boiler output of 133.3 kg/s and gas turbine operating with rated power, 2’– minimum steam boiler output of 133.3 kg/s and gas turbine operating with 60% of its rated power.
Energies 13 02432 g017
Figure 18. The streams of extraction steam for the XN1–XN4 low-pressure regeneration exchangers for a maximum fixed stream of 319.4 kg/s fresh steam fed to the steam turbine as a function of gas turbine rated power.
Energies 13 02432 g018
Figure 19. The streams of extraction steam for the XN1–XN4 low-pressure regeneration exchangers for a minimum steam boiler output of 133.3 kg/s and a gas turbine operating at a rated power.
Energies 13 02432 g019
Figure 20. The streams of extraction steam for the XN1–XN4 low-pressure regeneration exchangers for a minimum steam boiler output of 133.3 kg/s and gas turbine operating at 60% of its rated power.
Energies 13 02432 g020
Figure 21. The energy efficiency for the power unit with superstructure added as a function of gas turbine rated power for a maximum fixed stream of 319.4 kg/s fresh steam fed to the steam turbine.
Energies 13 02432 g021
Figure 22. The energy efficiency for the power unit with superstructure added as a function of gas turbine rated power at a minimum steam boiler output of 133.3 kg/s and with gas turbine operating at its rated power.
Energies 13 02432 g022
Figure 23. The energy efficiency for the power unit with superstructure added as a function of gas turbine rated power at a minimum steam boiler output of 133.3 kg/s and gas turbine operating at 60% of its rated power.
Energies 13 02432 g023
Figure 24. Fresh steam streams as a function of gas turbine rated power: 1—maximum fixed steam stream of 319.4 kg/s fed to the steam turbine 2—steam stream generated in the steam boiler, 3—steam stream generated in the recovery boiler.
Energies 13 02432 g024
Figure 25. Fresh steam streams as a function of gas turbine rated power at a minimum steam boiler output of 133.3 kg/s: 1, 1’—steam streams fed to the steam turbine, 2—steam stream generated in the steam boiler at its minimum output, 3—steam stream generated in the recovery boiler for gas turbine operating at its rated power, 3’—steam stream generated in the recovery boiler for gas turbine operating at 60% of its rated power.
Energies 13 02432 g025
Figure 26. The stream of outlet steam from the low-pressure steam turbine part to the KQ1 condenser as a function of gas turbine rated power: 1—maximum fixed stream of 319.4 kg/s fresh steam fed to steam turbine; 2—minimum steam boiler output of 133.3 kg/s and gas turbine operating at a rated power, 2’—minimum steam boiler output of 133.3 kg/s and gas turbine operating with 60% of its rated power.
Energies 13 02432 g026
Figure 27. Steam turbine power as a function of gas turbine rated power: 1—fixed stream of 319.4 kg/s fresh steam fed to steam turbine; 2–minimum steam boiler output of 133.3 kg/s and gas turbine operating at a rated power, 2’—minimum steam boiler output of 133.3 kg/s and gas turbine operating with 60% of its rated power, 3—40% of gas turbine rated power.
Energies 13 02432 g027
Figure 28. Relative available power range of power unit as a function of gas turbine rated power: 1–gas turbine operating at its rated power, 2–gas turbine operating with variable power ranging from 100% to 60% of its rated power.
Energies 13 02432 g028
Figure 29. The stream of condensate fed from the KQ1 condenser to the XN1–XN4 low-pressure heat recovery exchangers as a function of gas turbine power: 1—maximum fixed stream of 319.4 kg/s fresh steam fed to steam turbine; 2—minimum steam boiler output of 133.3 kg/s and gas turbine operating with rated power, 2’—minimum steam boiler output of 133.3 kg/s and gas turbine operating with 60% of its rated power.
Energies 13 02432 g029
Figure 30. The streams of extraction steam for the XN1–XN4 low-pressure regeneration exchangers for a maximum fixed stream of 319.4 kg/s fresh steam fed to the steam turbine as a function of gas turbine power.
Energies 13 02432 g030
Figure 31. The streams of extraction steam for the XN1–XN4 low-pressure regeneration exchangers for a minimum steam boiler output of 133.3 kg/s and a gas turbine operating at a rated power.
Energies 13 02432 g031
Figure 32. The streams of extraction steam for the XN1–XN4 low-pressure regeneration exchangers for a minimum steam boiler output of 133.3 kg/s and gas turbine operating at 60% of its rated power.
Energies 13 02432 g032
Figure 33. The energy efficiency for the power unit with superstructure added as a function of gas turbine rated power for a maximum fixed stream of 319.4 kg/s fresh steam fed to the steam turbine.
Energies 13 02432 g033
Figure 34. The energy efficiency for the power unit with superstructure added as a function of gas turbine rated power at a minimum steam boiler output of 133.3 kg/s and with gas turbine operating at its rated power.
Energies 13 02432 g034
Figure 35. The energy efficiency for the power unit with superstructure added as a function of gas turbine rated power at a minimum steam boiler output of 133.3 kg/s and gas turbine operating at 60% of its rated power.
Energies 13 02432 g035
Figure 36. Fresh steam streams as a function of gas turbine rated power: 1—maximum fixed steam stream of 319.4 kg/s fed to the steam turbine 2—steam stream generated in the steam boiler, 3—steam stream generated in the recovery boiler.
Energies 13 02432 g036
Figure 37. Fresh steam streams as a function of gas turbine rated power at a minimum steam boiler output of 133.3 kg/s: 1, 1’—steam streams fed to the steam turbine, 2—steam stream generated in the steam boiler at its minimum efficiency, 3—steam stream generated in the recovery boiler for gas turbine operating at its rated power, 3’– steam stream generated in the recovery boiler for gas turbine operating at 60% of its rated power.
Energies 13 02432 g037
Figure 38. The stream of outlet steam from the low-pressure steam turbine part to the KQ1 condenser as a function of gas turbine rated power: 1—maximum fixed stream of 319.4 kg/s fresh steam fed to steam turbine; 2—minimum steam boiler output of 133.3 kg/s and gas turbine operating at a rated power, 2’—minimum steam boiler output of 133.3 kg/s and gas turbine operating with 60% of its rated power.
Energies 13 02432 g038
Figure 39. Steam turbine power as a function of gas turbine rated power: 1 –fixed stream of 319.4 kg/s fresh steam fed to steam turbine; 2—minimum steam boiler output of 133.3 kg/s and for gas turbine operating at a rated power, 2’— minimum steam boiler output of 133.3 kg/s and gas turbine operating with 60% of its rated power, 3—40% of gas turbine rated power.
Energies 13 02432 g039
Figure 40. Relative available power range of power unit as a function of gas turbine rated power: 1—gas turbine operating at its rated power, 2—gas turbine operating with variable power ranging from 100% to 60% of its rated power.
Energies 13 02432 g040
Figure 41. Unit generation cost for electric power as a function of gas turbine rated power for various structures of a recovery boiler (ec = 10.0 PLN/GJ, eg = 27.7 PLN/MWh, (kel)ex = 170 PLN/MWh).
Energies 13 02432 g041
Figure 42. Unit generation cost for electric power as a function of gas turbine rated power for various structures of recovery boiler (ec = 12 PLN/GJ, eg = 27.7 PLN/MWh, (kel)ex = 191.6 PLN/MWh).
Energies 13 02432 g042
Figure 43. The ratio of unit gas price to unit coal price providing the viability of adding the superstructure of gas and single-pressure recovery boiler as a function of gas turbine rated power (ec = 10.0 PLN/GJ).
Energies 13 02432 g043
Figure 44. Unit generation cost for electric power as a function of gas turbine rated power for various structures of recovery boiler after increasing 10 times the emission rates for CO2, CO, SO2, NOx and dust (ec = 10.0 PLN/GJ, eg = 27.7 PLN/MWh, (kel)ex = 186.8 PLN/MWh).
Energies 13 02432 g044
Figure 45. Unit generation cost for electric power as a function of gas turbine rated power for operating it with 60% of rated power and various structures of recovery boiler (ec = 9.52 PLN/GJ, eg = 22 PLN/GJ, (kel)ex = 170 PLN/MWh).
Energies 13 02432 g045
Figure 46. Unit generation cost for electric power as a function of gas turbine rated power for operating it with 60% of rated power and various structures of recovery boiler (ec = 12 PLN/GJ, eg = 27.7 PLN/GJ, (kel)ex = 191.6 PLN/MWh).
Energies 13 02432 g046
Figure 47. The ratio of unit gas price to unit coal price providing the viability of adding the superstructure of gas turbine and single-pressure recovery boiler as a function of gas turbine rated power for operating the gas turbine with a variable power (ec = 9.52 PLN/GJ).
Energies 13 02432 g047
Figure 48. The unit generation cost for electric power as a function of gas turbine rated power for operating the gas turbine shut off during the night low power demand (“night valley”) and various structures of recovery boiler (ec = 9.52 PLN/GJ, eg = 22 PLN/GJ, (kel)ex = 170.0 PLN/MWh).
Energies 13 02432 g048
Figure 49. The unit generation cost for electric power as a function of gas turbine rated power for operating the gas turbine shut off during the night low power demand (“night valley”) and various structures of recovery boiler (ec = 12 PLN/GJ, eg = 22 PLN/GJ, (kel)ex = 191.6 PLN/MWh).
Energies 13 02432 g049
Figure 50. The ratio of unit gas price to unit coal price providing the viability of adding the superstructure of gas turbine and single-pressure recovery boiler as a function of gas turbine rated power for operating the gas turbine with shutting off during the night low power load (“night valley”) (ec = 9.52 PLN/GJ).
Energies 13 02432 g050
Figure 51. The impact of investment outlays, gas cost, unit cost of power generation before the upgrade, the cost of CO2 emission permits on the unit cost of electric power generation in the upgraded power unit for operating the gas turbine at a rated power and a single-pressure recovery boiler.
Energies 13 02432 g051
Figure 52. The impact of investment outlays, gas cost, unit cost of power generation before the upgrade, the cost of CO2 emission permits on the unit cost of electric power generation in the upgraded power unit for operating the gas turbine at a variable power and with a single-pressure recovery boiler.
Energies 13 02432 g052
Figure 53. The impact of investment outlays, gas cost, unit cost of power generation before the upgrade, the cost of CO2 emission permits on the unit cost of electric power generation in the upgraded power unit for operating the gas turbine with shutting off during the night low demand period (night valley) and with a single-pressure recovery boiler.
Energies 13 02432 g053
Table 1. Comparison of the most important thermodynamic parameters for various structure of HRSG.
ParameterSingle-
Pressure HRSH
Double-Pressure HRSGTriple-
Pressure HRSG
available range of steam turbine for N e l G T =350 MW125 MW127 MW128 MW
relative available power range of power block for N e l G T =350 MW0.340.340.34
Maximum fixed stream of fresh steam
efficiency of electric power generation0.40–0.490.40–0.500.40–0.51
incremental efficiency0.30–0.440.30–0.450.30–0.45
apparent efficiency0.40–0.620.40–0.650.40–0.66
Minimum steam boiler output and rated power of gas turbine
efficiency of electric power generation0.39–0.510.39–0.520.39–0.53
incremental efficiency0.49–0.580.49–0.590.49–0.59
apparent efficiency0.39–0.730.39–0.760.39–0.77
Minimum steam boiler output and 60% of rated gas turbine power
efficiency of electric power generation0.39–0.470.39–0.480.39–0.48
incremental efficiency0.48–0.540.48–0.550.48–0.56
apparent efficiency0.39–0.660.39–0.680.39–0.69
Table 2. Comparison of the most important economic parameters for various structure of HRSG.
ParameterSingle-
Pressure HRSH
Double-
Pressure HRSG
Triple-
Pressure HRSG
Steam boiler variable output and fixed gas turbine power
Unit generation cost (ec = 10.0 PLN/GJ, eg = 27.7 PLN/MWh, (kel)ex = 170 PLN/MWh)211 PLN/MWh213 PLN/MWh215 PLN/MWh
Unit generation cost (ec = 12 PLN/GJ, eg = 27.7 PLN/GJ,
(kel)ex = 191.6 PLN/MWh)
214 PLN/MWh216 PLN/MWh218 PLN/MWh
Steam boiler variable output and variable gas turbine power
Unit generation cost (ec = 10.0 PLN/GJ, eg = 27.7 PLN/MWh, (kel)ex = 170 PLN/MWh)214 PLN/MWh215 PLN/MWh217 PLN/MWh
Unit generation cost (ec = 12 PLN/GJ, eg = 27.7 PLN/GJ,
(kel)ex = 191,6 PLN/MWh)
221 PLN/MWh222 PLN/MWh224 PLN/MWh
Steam boiler variable output and gas turbine shut off during the “night valley”
Unit generation cost (ec = 10.0 PLN/GJ, eg = 27.7 PLN/MWh, (kel)ex = 170 PLN/MWh)218 PLN/MWh219 PLN/MWh222 PLN/MWh
Unit generation cost (ec = 12 PLN/GJ, eg = 27.7 PLN/GJ,
(kel)ex = 191.6 PLN/MWh)
225 PLN/MWh226 PLN/MWh229 PLN/MWh