Article

Evaluation and Projections of Wind Power Resources over China for the Energy Industry Using CMIP5 Models

by
Akintayo T. Abolude
1,*,
Wen Zhou
1 and
Akintomide Afolayan Akinsanola
2
1
Guy Carpenter Asia–Pacific Climate Impact Center, School of Energy and Environment, City University of Hong Kong, Kowloon, Hong Kong, China
2
Department of Geography, University of Georgia, Athens, GA 30602, USA
*
Author to whom correspondence should be addressed.
Energies 2020, 13(10), 2417; https://doi.org/10.3390/en13102417
Submission received: 15 April 2020 / Revised: 7 May 2020 / Accepted: 8 May 2020 / Published: 12 May 2020
(This article belongs to the Section A3: Wind, Wave and Tidal Energy)

Abstract

:
The energy industry is faced with important investment and optimization choices especially for wind power as a fuel of the future, especially for China which boasts the largest installed wind power capacity. This study therefore assessed the potential status of future wind power over China using Coupled Model Intercomparison Project phase 5 (CMIP5) models. Changes in wind power density relative to the current time period 1981–2005 were then analyzed using near-surface wind speeds extrapolated to hub-height of 90 m above ground level. The results showed relatively modest differences between the models and reanalysis. The majority of the models showed any two of location, shape, and size agreement for peak areas albeit models BCC-CSM-1-1-M, BNU-ESM, and CanESM2 tended to overestimate wind speed by up to 2.5 m/s. The multi-model ensemble mean performed better than most individual models in representing the wind characteristics over the study area. Future changes in wind power density showed an increase (decrease) over the coastal areas of the South China Sea and Bay of Bengal (areas along the 30°–40° N belt). In all, the changes were not significant enough to neither warrant a move away from wind energy nor threaten considerably the marketability and profitability under the present warming scenario rate.

1. Introduction

The role of wind power in energy portfolios for a green and sustainable future cannot be overlooked. Massive investments and general adoption of wind power globally has seen it emerge as one of the most important alternative energy sources. Recent statistics also confirm this, with China, USA, and Germany ranking top in cumulative installed capacity for wind power at about 237 GW, 105 GW, and 61 GW (36%, 16%, and 9% of world total) respectively as of December 2019 [1]. More importantly, assessing and characterizing wind power resources and potential under future climate is critical to decision-making related to power infrastructure, energy portfolio, and investment/switching costs etc. [2,3]. Important information such as historical evolution of wind properties [4], wind time scale variability [5], wind power potential under warming scenarios [6], and the resilience of wind power systems to extremes [7] can be gleaned only by detailed assessment of the spatial and temporal patterns of near-surface and hub-height wind speeds. More urgently however, the now accepted possibility of increasing energy demand [8] due in part to extreme weather and anthropogenic effects create a bigger burden on wind power as a fuel of the future.
Wind resources assessment has conventionally been carried out through station/observational data [9], reanalysis data [5], and a combination of both systems [10]. One study [11] used Climate Forecast System Reanalysis (CFSR) data to study 80 m hub-height wind speed over China and observed significant seasonal variability which was attributed to the East Asian monsoon. Another [5] took a regional approach to examine the impacts of monsoon variability on wind power in Asia using 6-hourly ERA-Interim data while a related study [12] used wind data from the Goddard Earth Observing System Data Assimilation System Version 5 (GEOS-5 DAS) to quantify wind energy potential. Outside of China, a study [13] used Modern Era Retrospective-Analysis for Research and Applications (MERRA) reanalysis data set to examine and quantify extreme wind power generation in Great Britain. The present global installed wind power capacity is evidence of the success of initial wind resources assessments and wind power potential. China’s largest wind farms are located in the northern region in nine ‘wind bases’ [2,14] spread around Inner Mongolia (29 GW), Xinjiang (19 GW), Hebei (14 GW), Gansu (13 GW), Ningxia (10 GW) and Shanxi (10 GW). The locations and profitability of these wind farms among many others could somewhat be controversial especially since estimates of wind power using reanalysis data show a Wind Power Density (WPD) of less than 150 W/m2 [11,15] which ideally suggests unprofitable for commercial wind power production. Limited observational data of surface wind speed collected conventionally for non-wind energy purposes on the other hand are slightly higher than reanalysis especially on a station by station basis although with a decreasing trend as reported in the literature [16,17,18]. Since actual installed capacity is however increasing, it becomes essential to investigate future scenarios of wind power potential when considering future energy mixes and planning the roadmap for continued wind power development.
Future projections of key atmospheric parameters have paved way for skillful predictions of future climate and weather. Particularly for wind energy purposes, there is scientific evidence of how changing climate may impact wind speed and WPD based on global and regional climate models. It is expedient to note differences in parameter magnitudes e.g., surface wind speed with models [4] and individual model’s ability to reproduce and capture specific observational characteristics. Nonetheless, the climatology and general characteristics are still been replicated broadly enough and thus they are effective for wind resources estimation [19], energy planning and policy [20] and assessing climate change impacts on wind power [21]. Studies on wind power projection indicated a decrease of about 1.0–4.5% in the USA over the 21st century [22], an increase in annual mean speed at 30–100 m above ground level between 2001 and 2009 in Japan [23]. A change in multi-year power production of about 5% magnitude was estimated for most European countries [24], albeit succinctly stating that climate change does not undermine nor favor wind energy development in Europe. Similar studies also reported increases for Europe [25,26] while Sawadogo et al. [6] reported a future increase in monsoon wind speed and WPD that intensified with higher warming levels over the Sahel subregion of West Africa. Globally, Zheng et al. [27] found a narrowing (expansion) of areas with WPD greater than 800 (400) Wm−2 for offshore wind in the future period 2080–2099 relatively to reference period 1980–1999. Their study focused on RCP4.5 and RCP8.5 emission scenarios only based on a previously defined multi-model ensemble mean of 12 CMIP5 Global Circulation Models [28]. A study opined that the warming in the Indian Ocean contributed to a dampening of upward motion over India thus reducing monsoonal wind speed. The authors conclude that this reduction consequently accounted for a 0.77 PWh/decade decrease in potential energy, and that it could reduce further with more warming [20]. For China, Chen et al. [15] concluded that wind speed at the end of the 21st century appears similar to the last historical 35 years, and that it is only slightly dependent on the Representative Concentration Pathway (RCP) applied when investigated using seven Atmosphere-Ocean General Circulation Models (AOGCMs). On the contrary, a decrease was projected in the future period 2071–2100 [29] in another study while Sherman et al. [2] using MERRA data from 1979–2015 noted a secular decrease in ‘wind power generating potential’ for Inner Mongolia and Gansu regions which are two prominent wind bases in China. With respect to near-surface wind speeds, it was reported that wind speed in the future (2020–2100) showed significantly decreasing trends of −0.002 (−0.007) ms−1 per decade under RCP4.5 and RCP8.5 emission scenarios respectively in Eastern China [30]. The authors in this study [30] specifically note two temporal stages of changes in trend; a decadal increase (decrease) during 2020–2055 (2055–2100) and 2020–2040 (2040–2100) for RCP4.5 and RCP8.5 respectively. Strategic and accurate projections of future wind power estimates are important for proper energy planning, decision-making, and further wind farm development. This study advances previous works by using ten CMIP5 models and investigating future potential at specific wind bases for more informed conclusions. Additionally, 20-year future time slices were introduced to provide a more robust time-based reference similar to those for with energy supply contracts and purchasing to aid wind power diffusion and profitability. Specifically, the objectives of this study are to investigate the spatial and temporal patterns of wind speed and WPD for historical (1950–1980) and current periods (1981–2005) using CMIP5 models; assess model performance in reproducing observed features and estimate bias; and to make skillful projections of future WPD including changes in spatio-temporal patterns under a warming scenario.
This introductory section is followed by details of the data used and methodology. Comprehensive results are presented in Section 3 with a discussion of the impacts and implications before a summary and conclusion section.

2. Data and Methodology

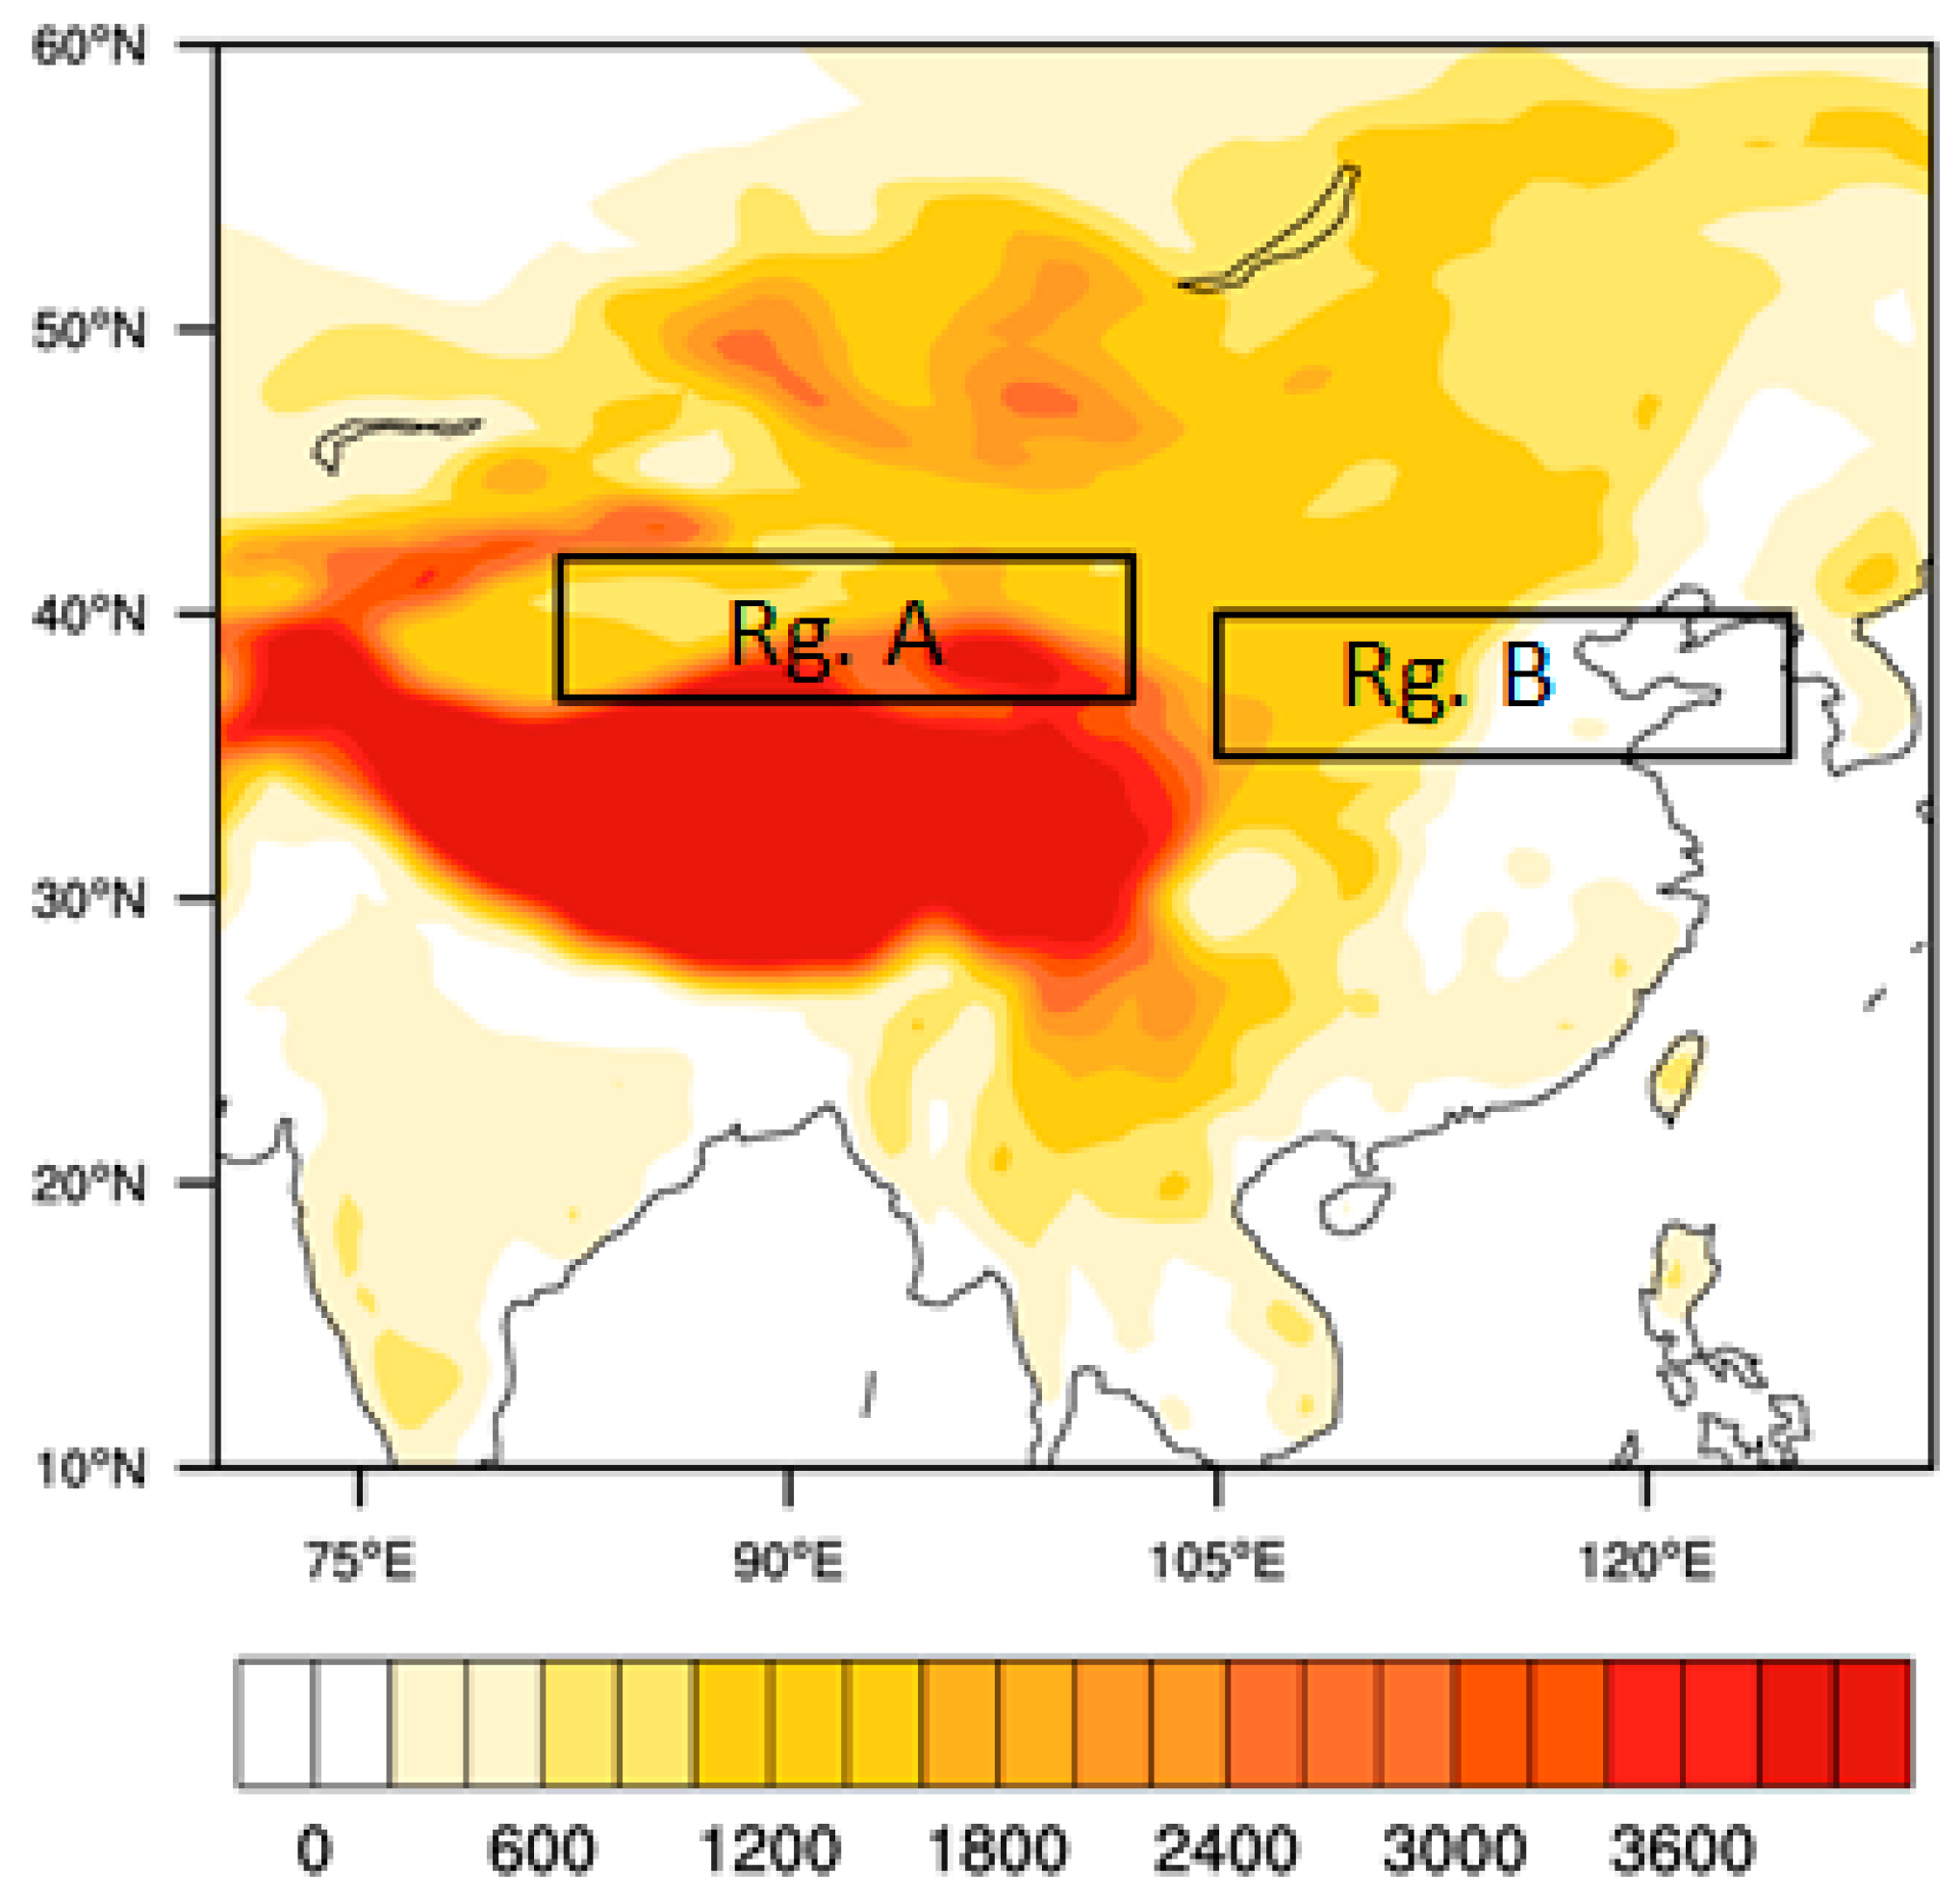
2.1. Study Area and Dataset

The study area comprises broadly of the regions contained in the 70°–130° E longitude and 10°–60° N latitude box inclusive of some offshore areas to effectively capture offshore and coastal patterns. Two focus regions of interest Rg. A and Rg. B are designated as shown in Figure 1 based on the locations of the largest wind farms in China earlier highlighted. For the purpose of meeting the study objectives, three time periods were defined as historical (1950–1980), current (1981–2005) and future (2021–2100). The historical period is based on available data of historical simulations for all the models considered. The current run of 1 January 1981 to 31 December 2005 was selected based on the overlapping period of data for all the CMIP5 models and reanalysis dataset used in the study i.e., consistent time period among all the datasets. The future run was further sub-divided into four time slices of two decades each chronologically i.e., 2021–2040, 2041–2060, 2061–2080, and 2081–2100. This was to achieve a more strategic foundation for policy purposes, energy planning, and subsequent or additional investments in wind power.
The datasets used consists of the CMIP5 historical experiments and future projections based on the Representative Concentration Pathway RCP8.5 scenario. The choice of RCP8.5 is based on the conclusions of Peters et al. [31] that present Green House Gases (GHGs) emissions are rather following a business-as-usual scenario rather than any of the reduced RCP scenarios. In lieu of the observational dataset, the ERA-Interim reanalysis dataset [32] is used for validation. Table 1 shows the major characteristics of the models used alongside their spatial resolutions. Detailed model information is available in the referenced online data repositories [33,34]. To facilitate convenient comparisons, all the datasets used in this study were regridded to a grid sizing of 1.12 × 1.12 using the distance-weighted interpolation method [35] reported to be able to significantly retain high resolution details of climate models [36].

2.2. Wind Speed

Daily values of near-surface (equivalent of 10 m height) zonal wind (u) and meridional wind (v) components were used to compute wind speed mathematically following the wind speed expression Equation (1) shown here
u m = u 10 2 + v 10 2
This wind speed um is representative of 10 m height, thus the wind power law seen in Equation (2) was further used to extrapolate to a hub-height of 90 m above ground level (agl) based on the specifications of a Vestas V90 3.0 MW wind turbine.
U ( z ) U ( z ) r = ( Z Z r ) α
The variables in the equation Z and Zr are the wanted and reference heights respectively, while U(Z) and U(Z)r are the wanted and reference height wind speed, respectively. The choice of Hellman exponent (α) used here was 0.14, in accordance with the one-seventh factor favored for its fair representation of open land surfaces in similar studies [4]. Wind resources literature suggest that α does vary by terrain, wind speed, atmospheric conditions, time of day, vegetation cover, etc. [37,38,39,40,41]. Thus, it is possible that the exponent used here may underestimate or overestimate hub-height wind speed under differing conditions.

2.3. Wind Power Density

WPD provides a more objective way to assess the potential wind energy from a wind turbine or wind farm for a particular location, especially since it does not consider turbine specifications. It rather measures how much energy is available to be converted by a wind turbine in W/m2 of turbine swept area as defined in Equation (3) below where ρ and uh represents air density and hub-height wind speed respectively.
WPD = 1 2 u h 3
The WPD at each grid point was estimated first based on grid point wind speed for each day, then the mean WPD calculated mathematically. This stepwise process allowed the cubic relationship between wind speed and wind power be maintained, while also reducing possible under-estimation as a result of directly averaging wind speed prior to WPD computation. The future projections for each of the time slice was discussed relative to the current time. Individual model bias was calculated relative to the reanalysis data i.e., ERA-Interim data.

3. Results and Discussions

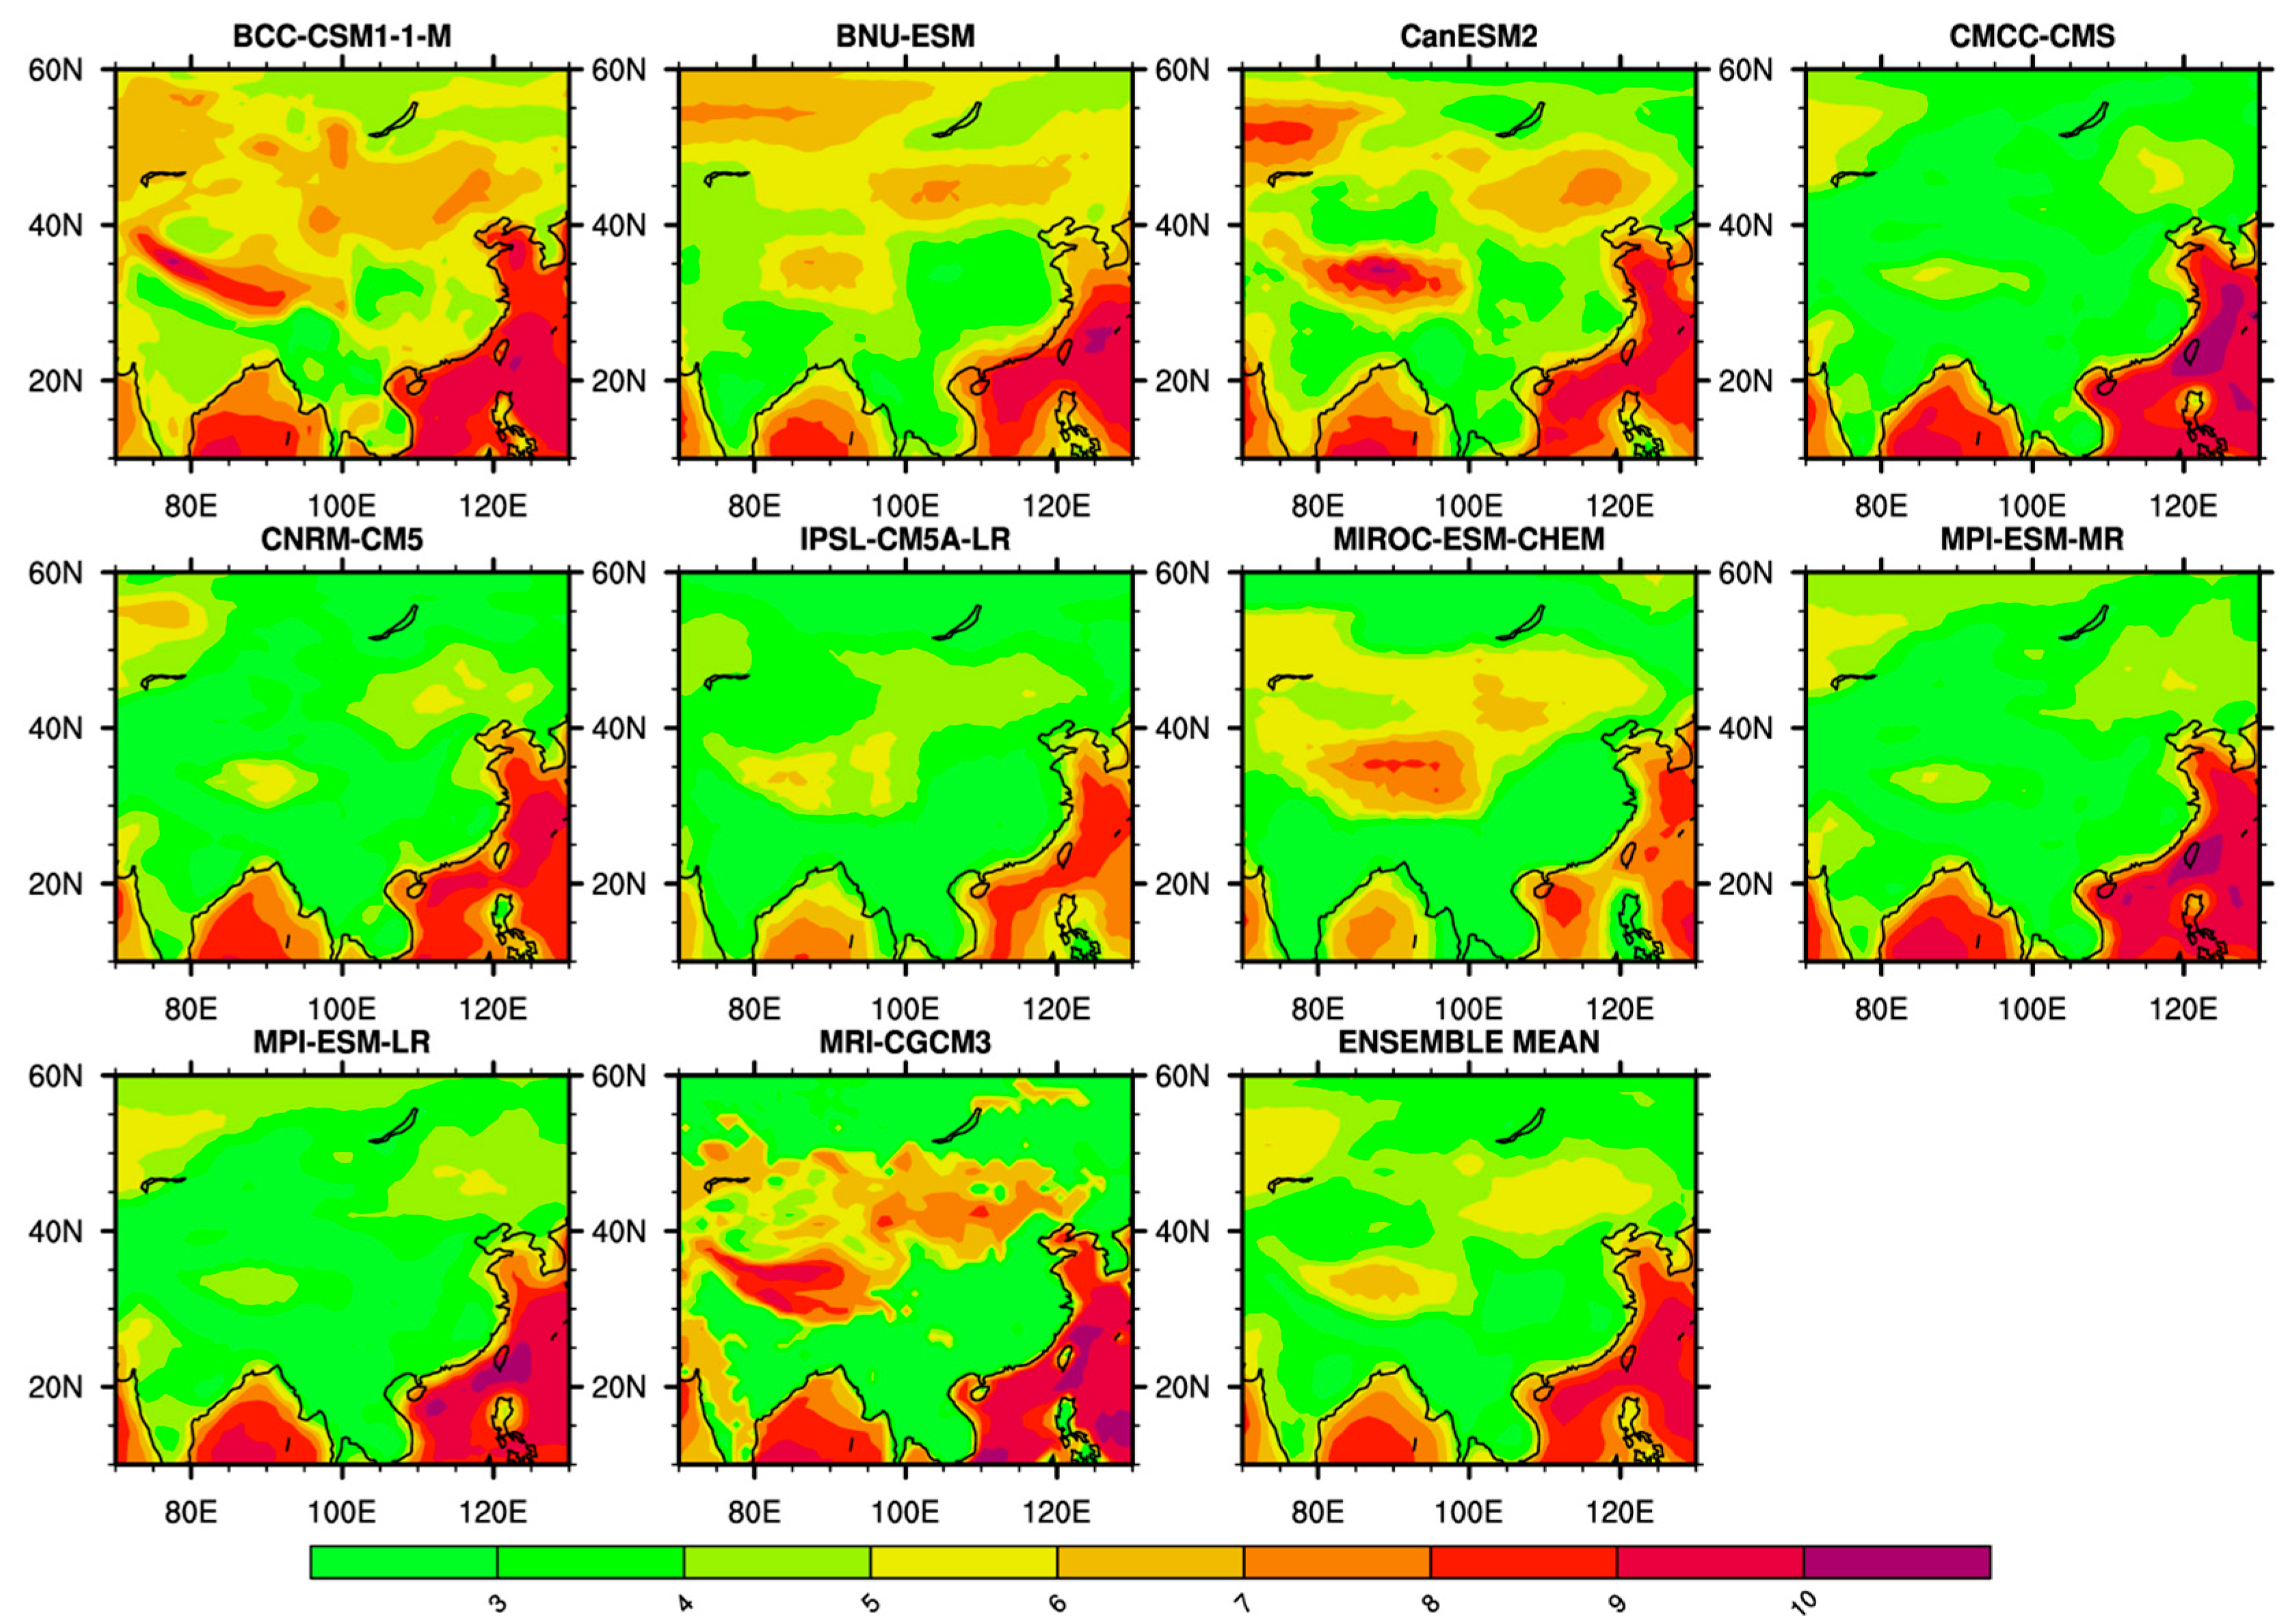
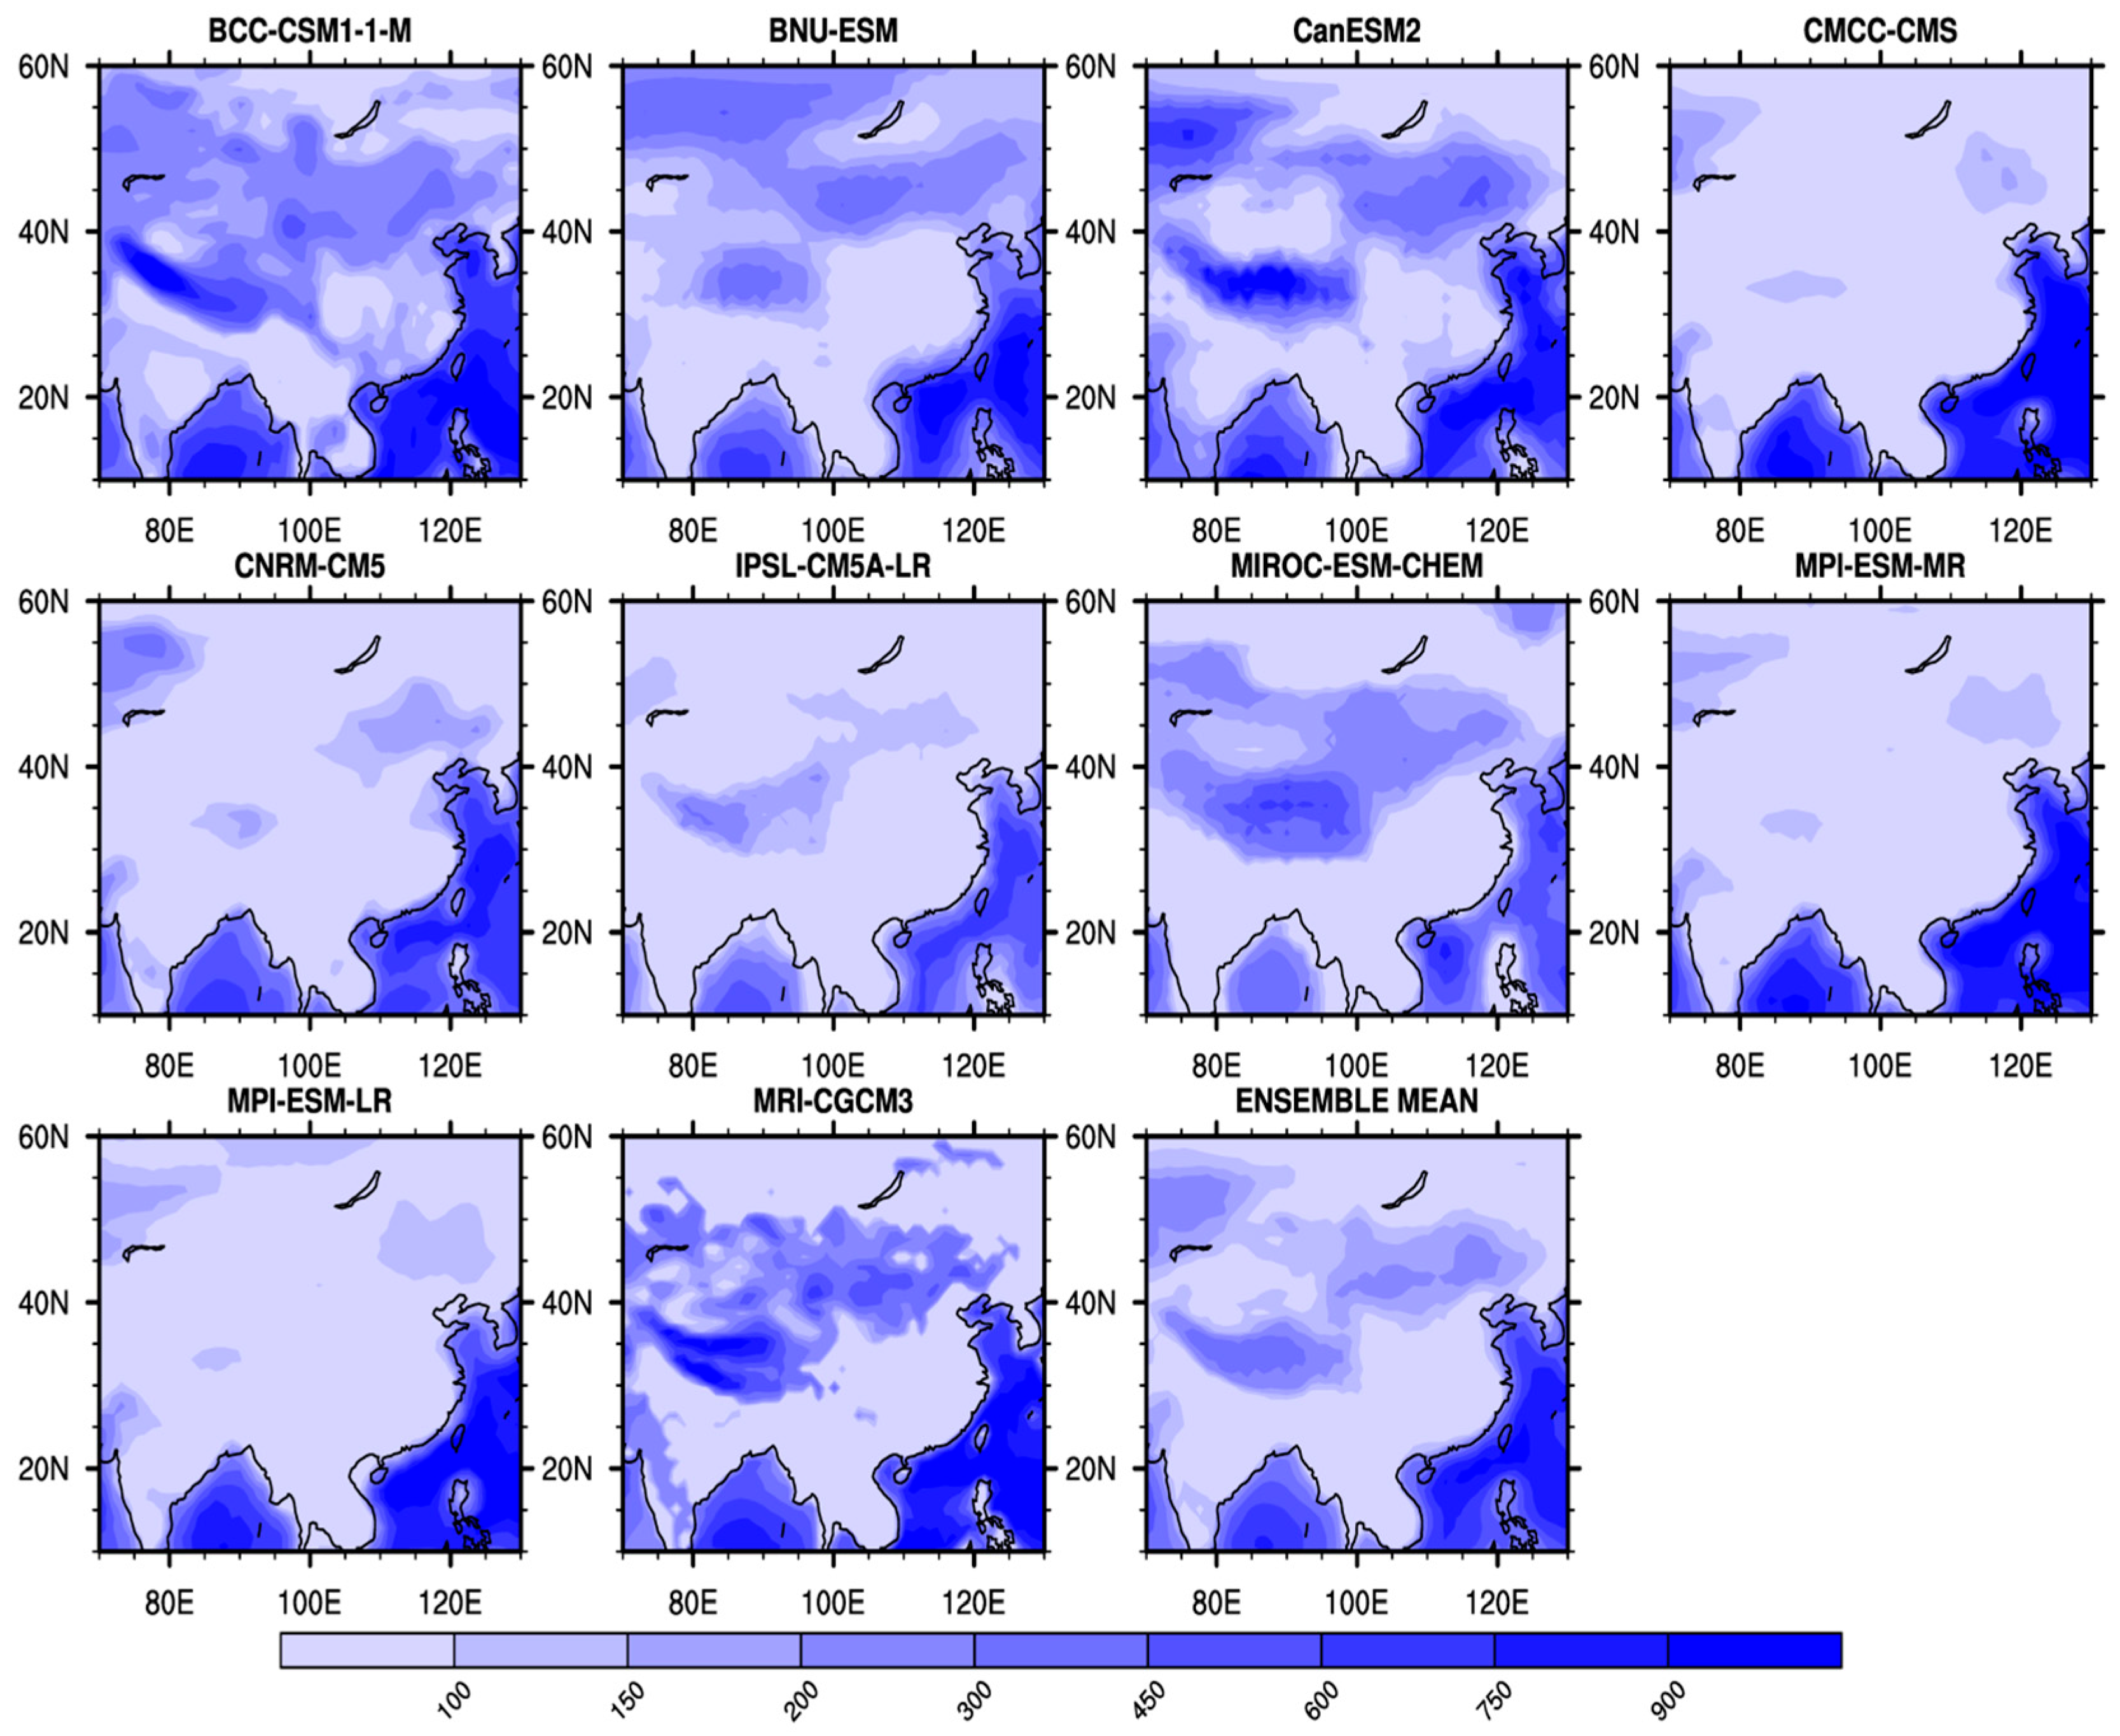
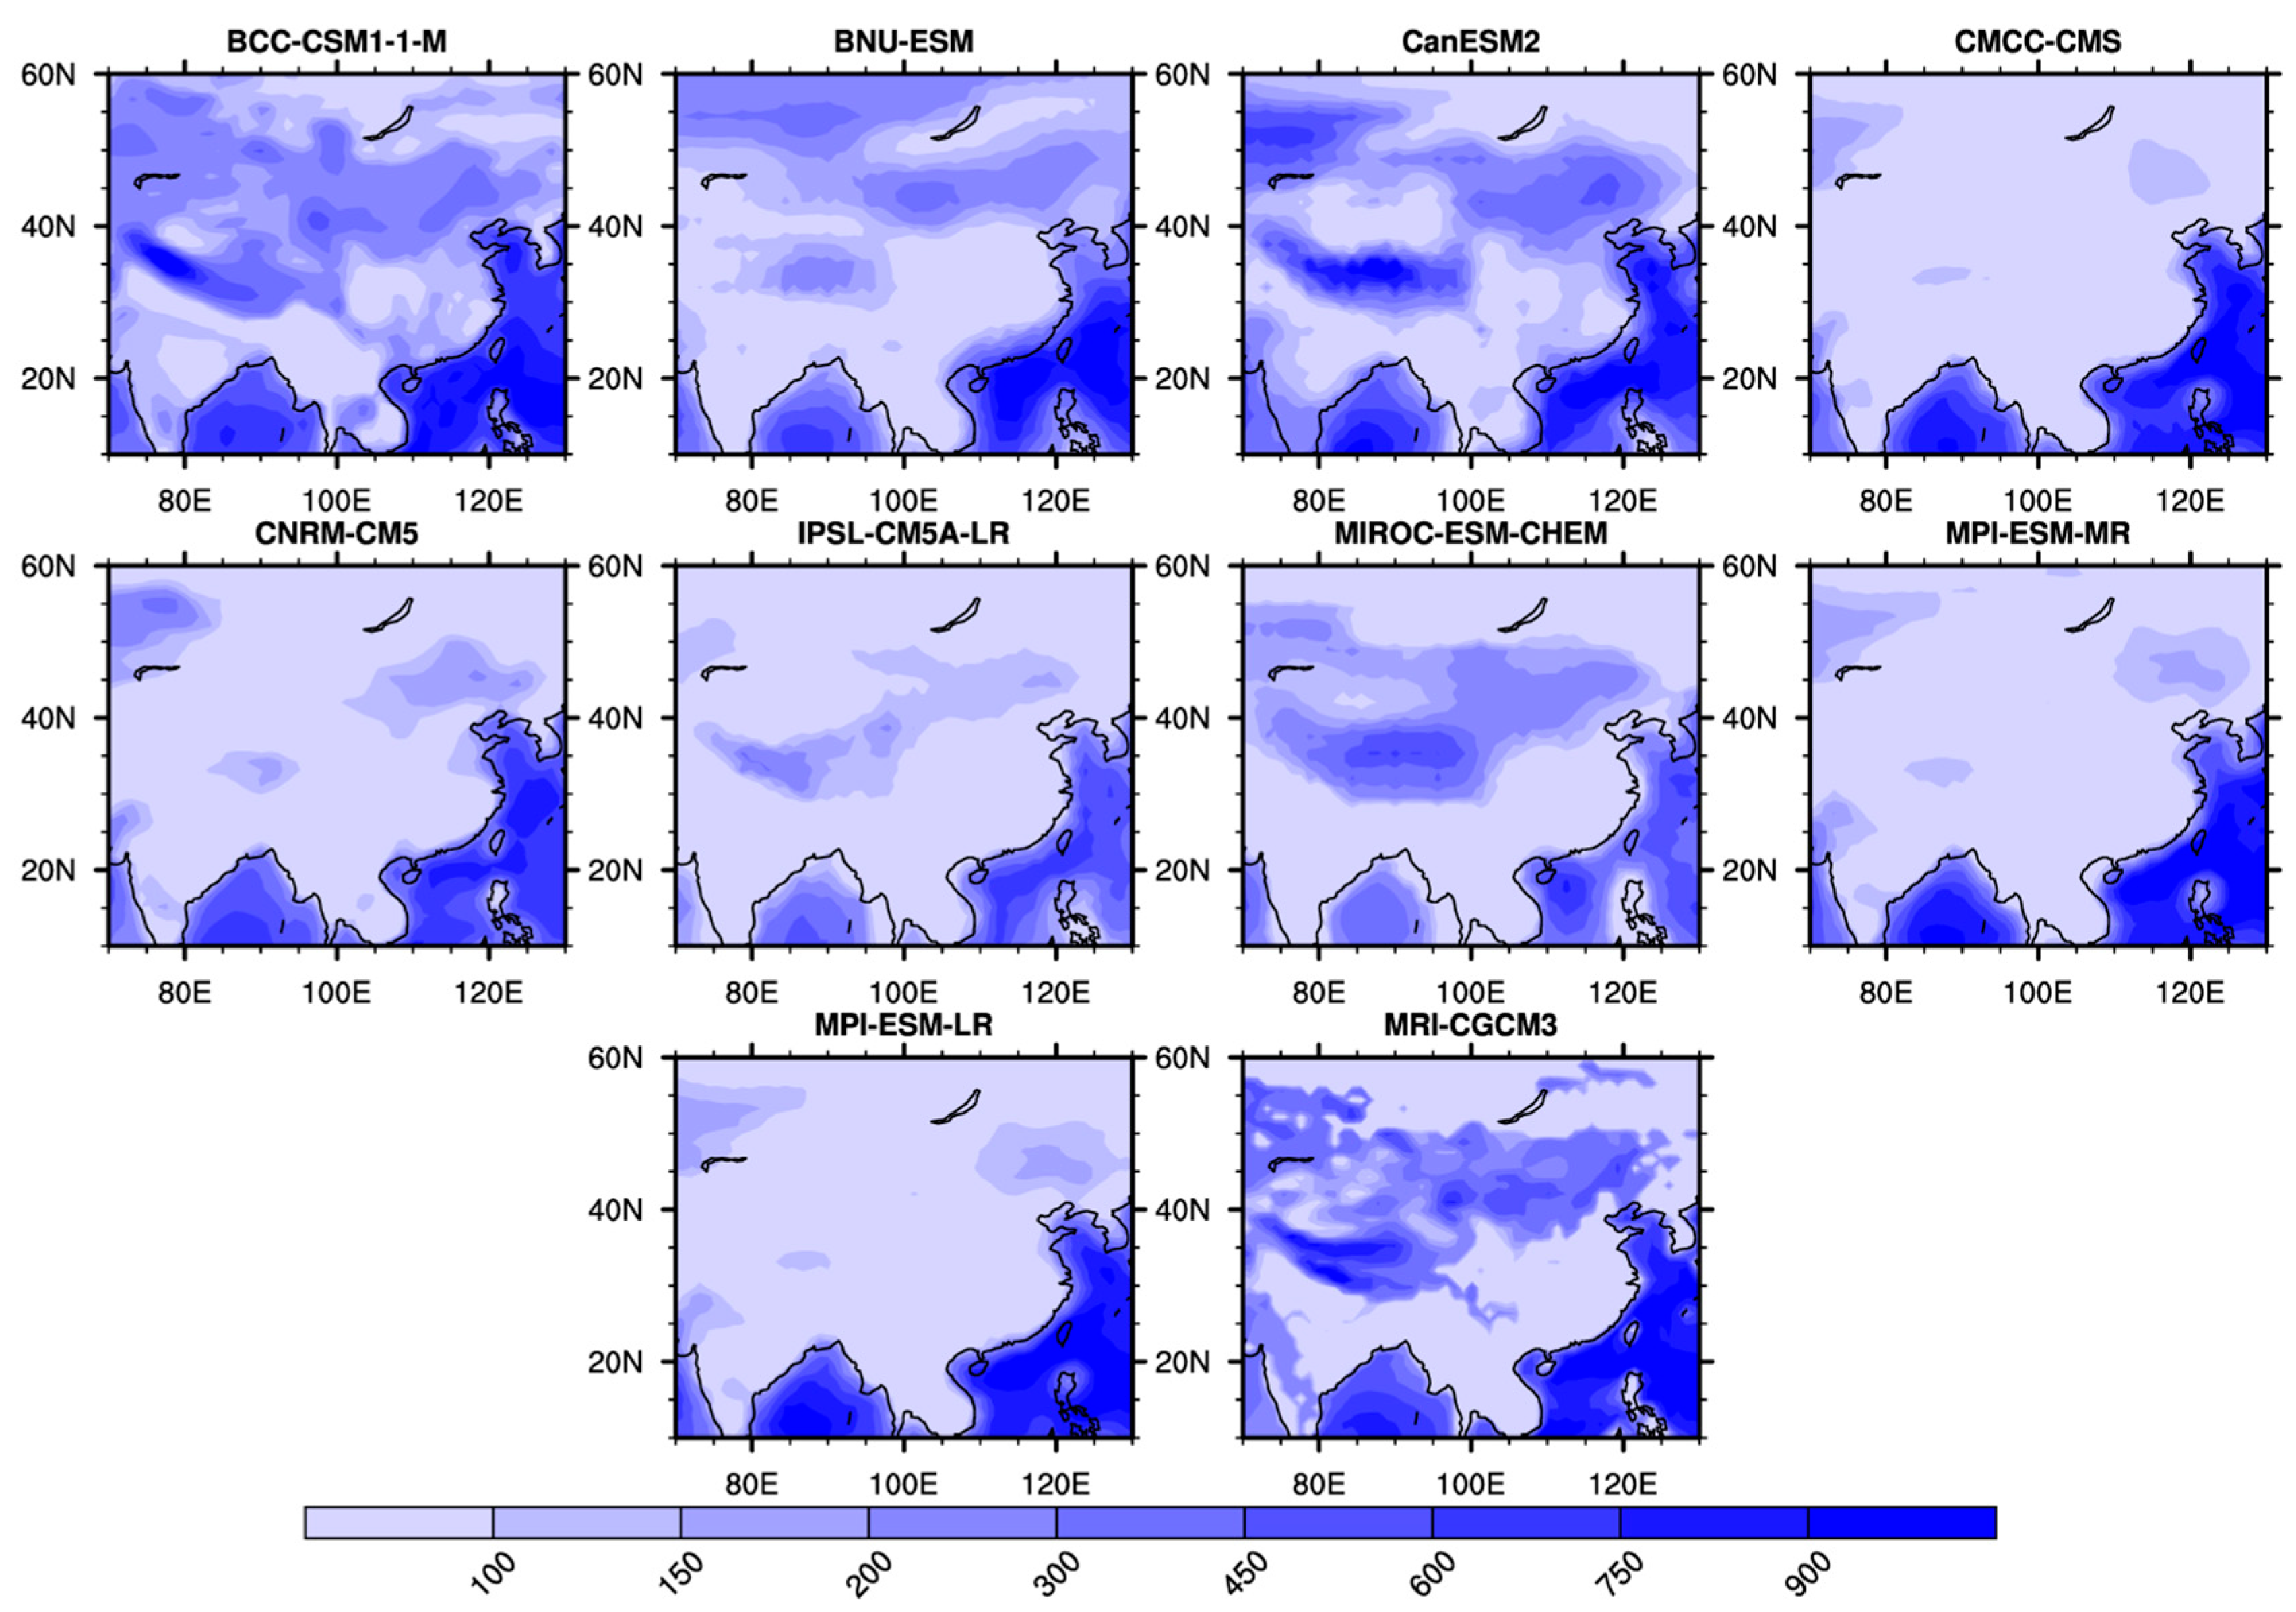
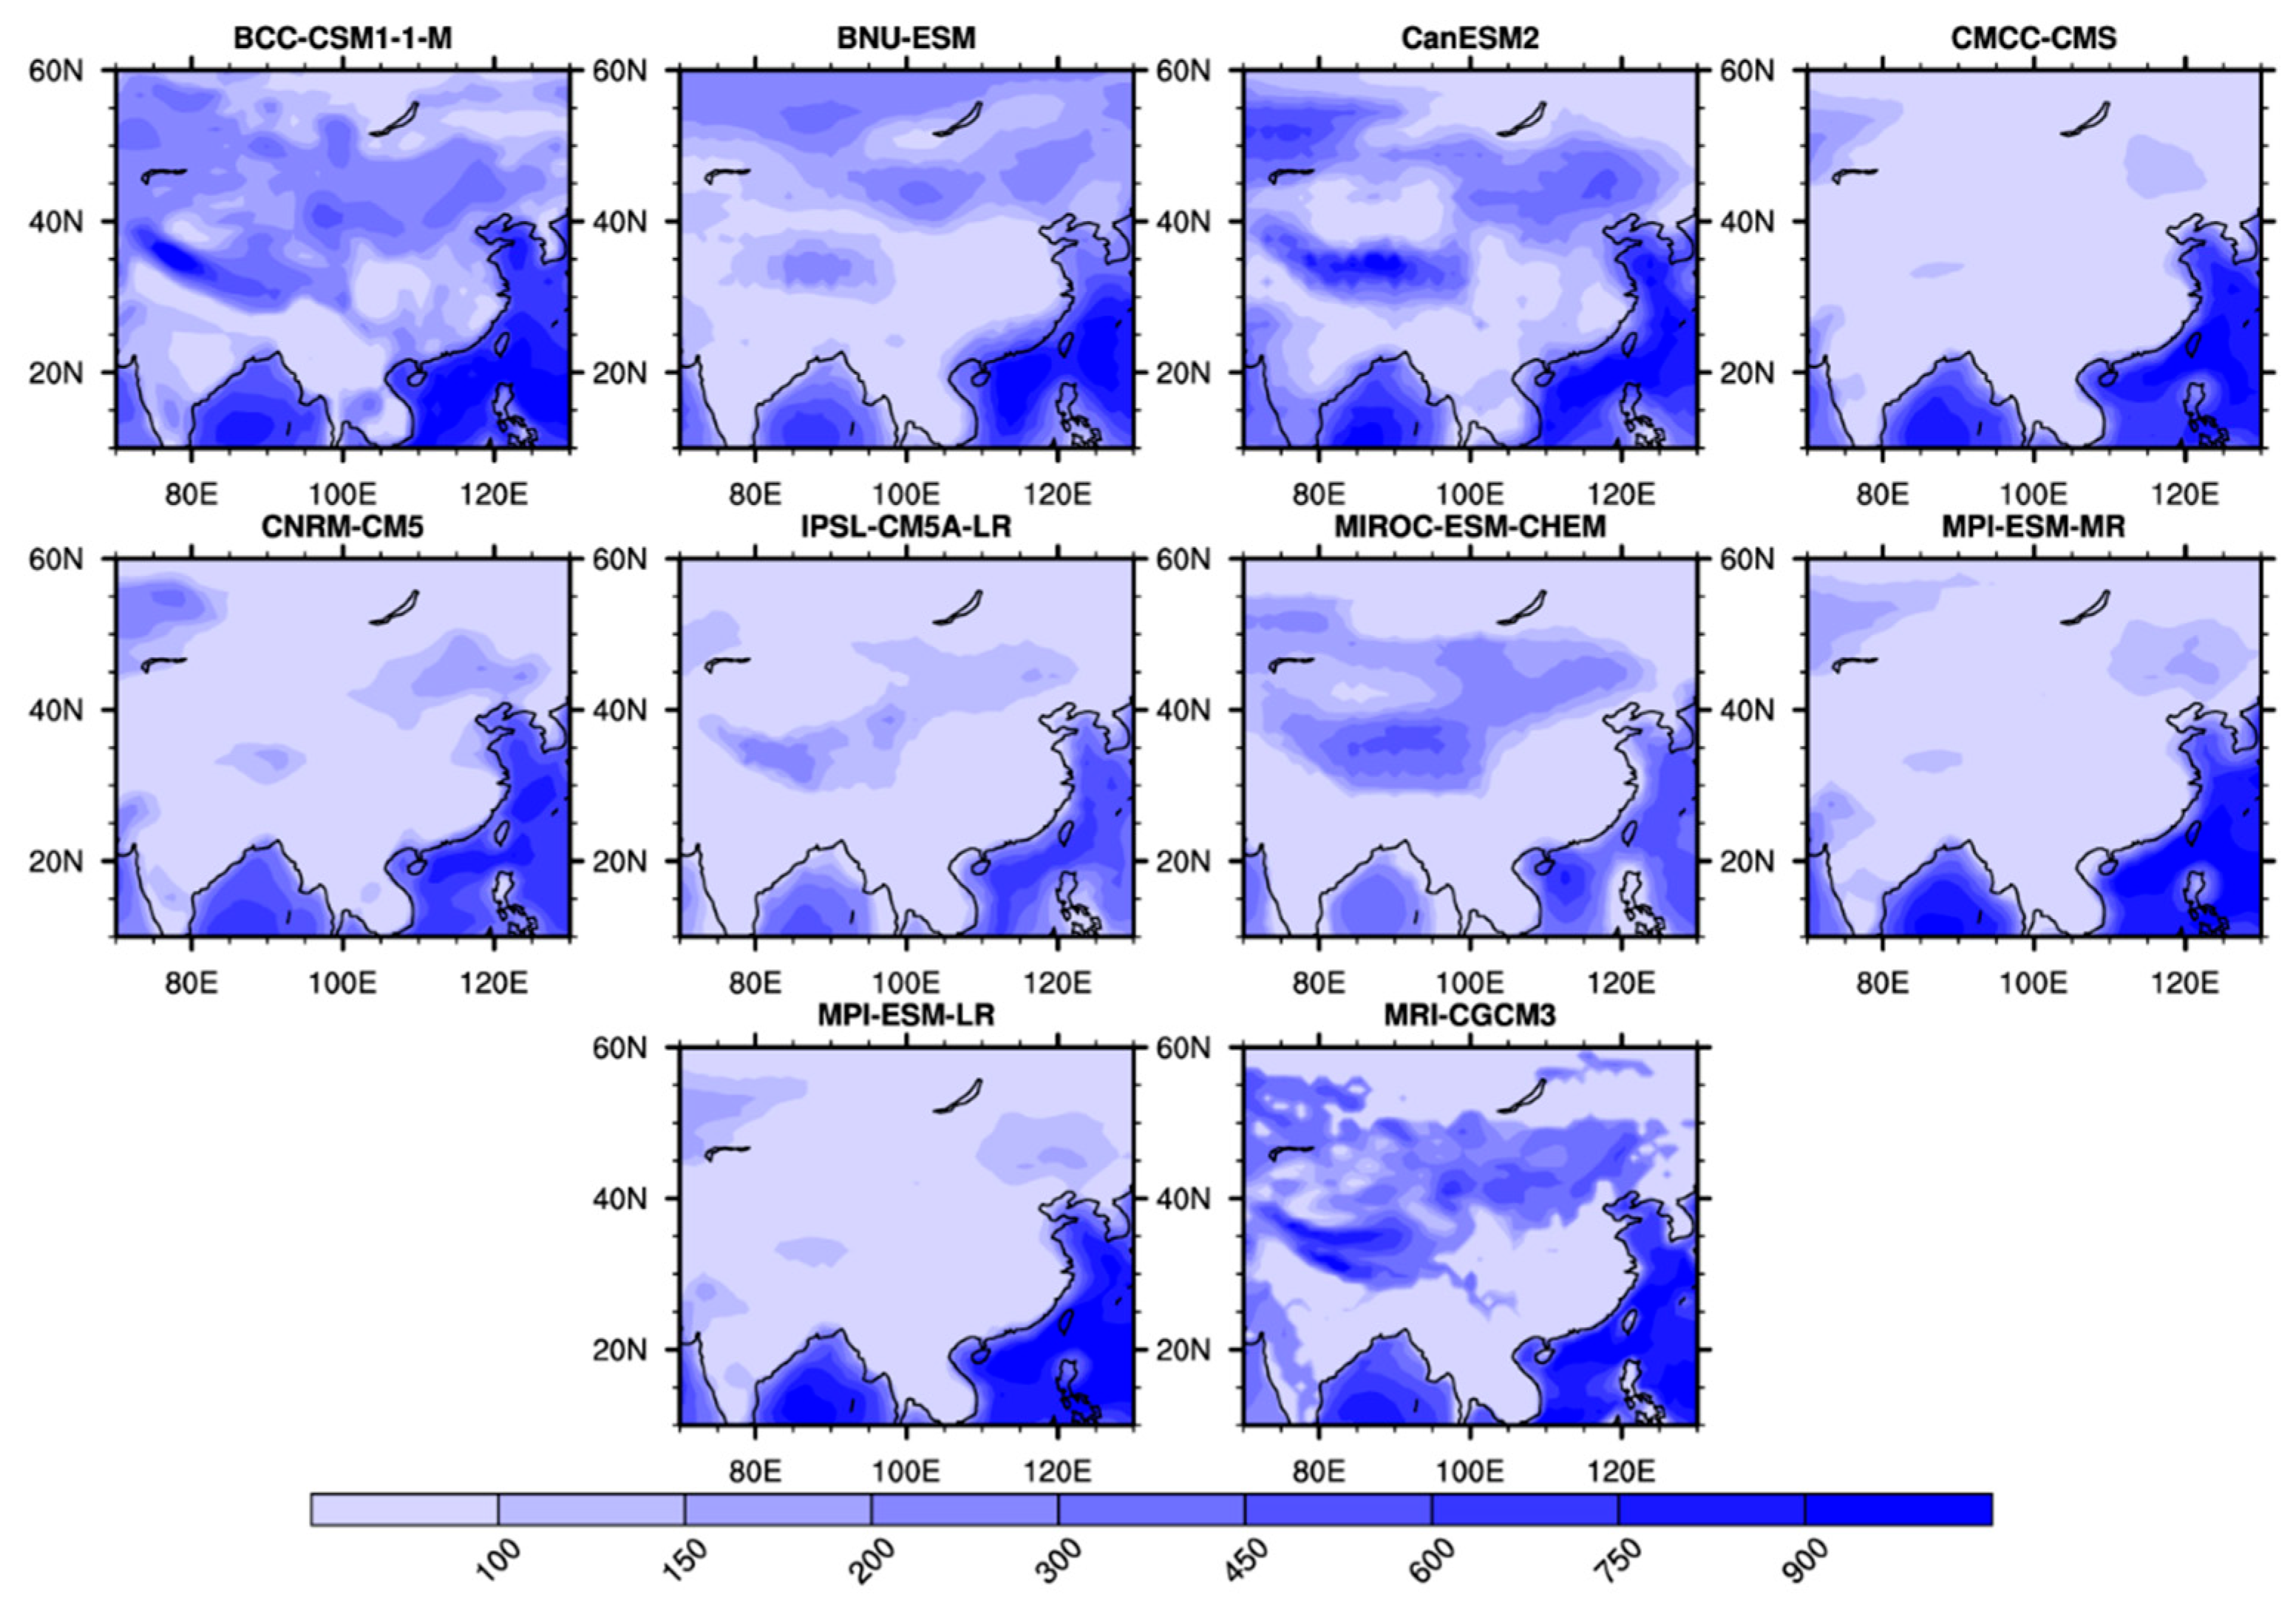
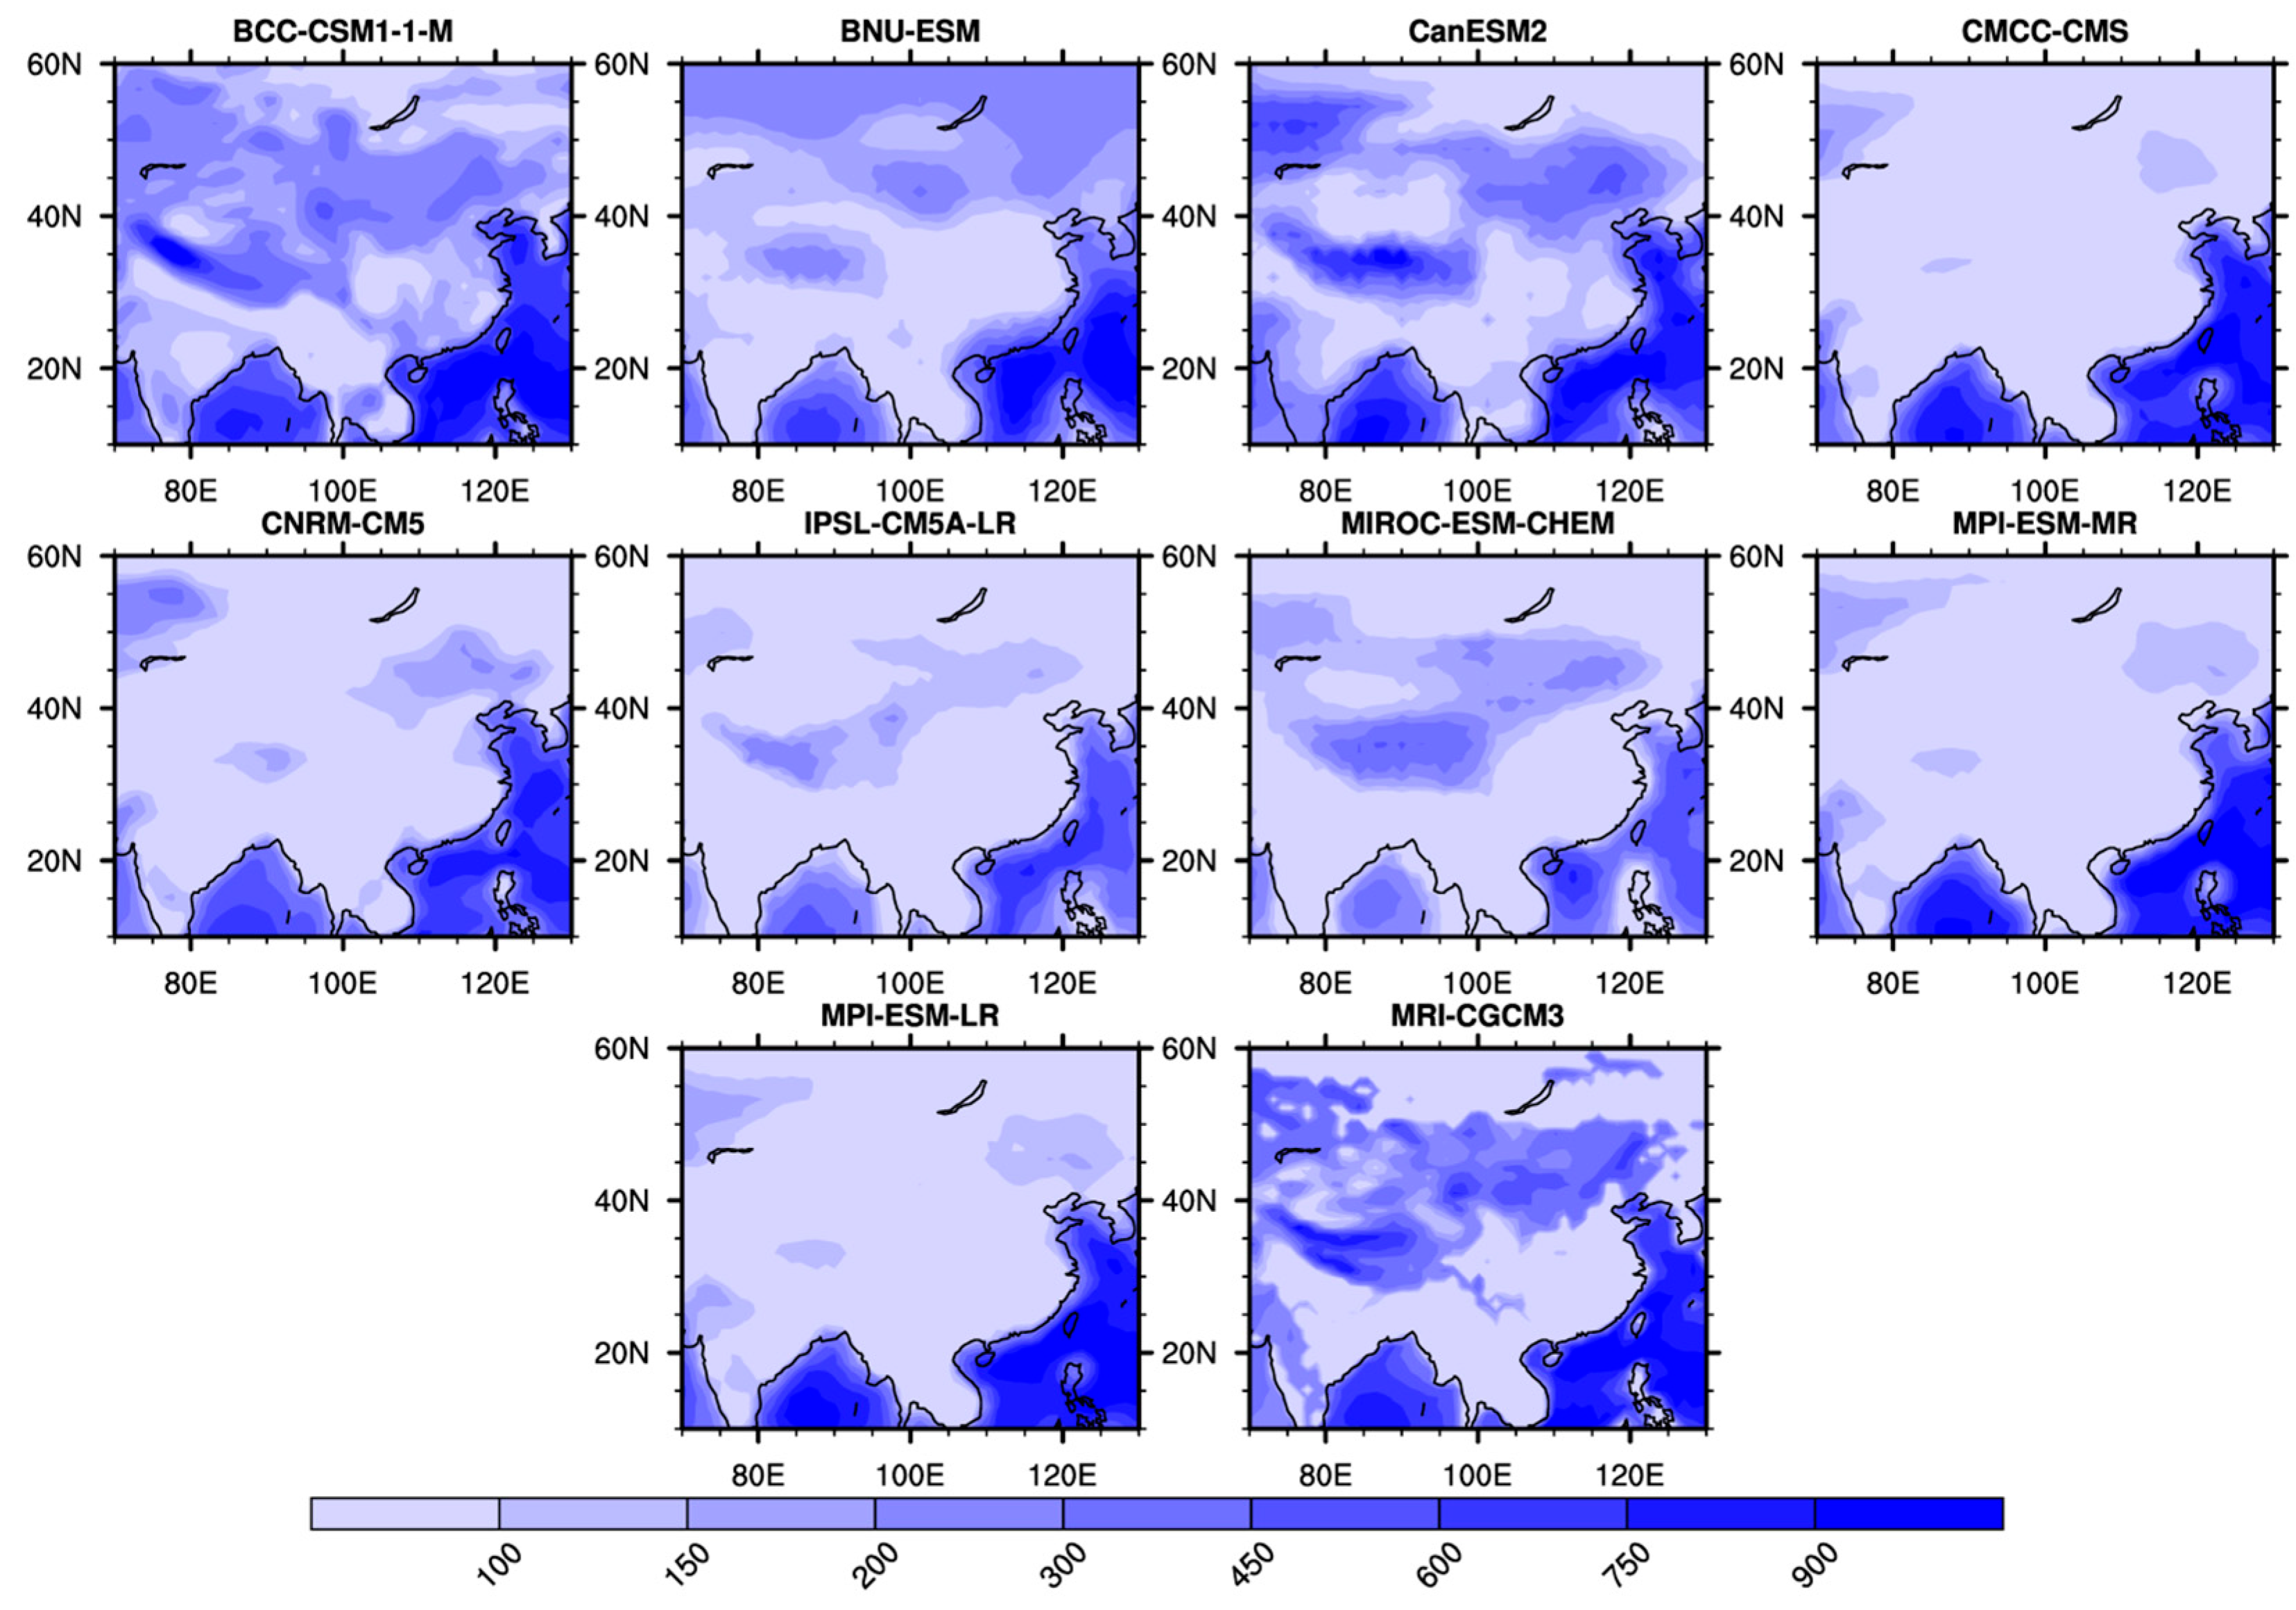
3.1. Wind Speed and Wind Power Density Historical Patterns

The ability of the ten CMIP5 models to realistically replicate the climatological patterns of wind speed distribution over the study area, as well as the agreement between models was first investigated for the historical period of 1950–1980 and is presented in Figure 2.
All the models showed higher mean wind speeds over the coastal areas as expected for offshore wind speeds albeit with varying magnitudes. MPI-ESM-LR, MPI-ESM-MR, MRI-CGCM3 and CMCC-CMS had mean wind speeds of about 9–10 m/s at the South China Sea (south-east) of the study domain but lesser around the Bay of Bengal area only about 6–8 m/s with all the four models showing an increasing gradient away from land. Models BCC-CSM1-1-M, CanESM2 and BNU-ESM show wind speeds >6 m/s in the 30°–50° N latitudinal belt, a pattern also replicated in the MRI-CGCM3 model. Overall, mean wind speed was lower in the IPSL-CM5A-LR and MIROC-ESM-CHEM models although the same spatial distribution observed in the earlier discussed models are also present. The ensemble mean model captured the same spatial distribution with a smaller sized area of higher wind speed along the 30°–50° N belt. The patterns for WPD are similar to that of the wind speed (Figure A1 in Appendix A), although most onshore areas show WPD below Class II which is less than 250 W/m2 [10].
Low WPD classes conventionally suggest that wind power development may not be commercially profitable in such a region. When this occurs alongside differences in model performance, it becomes more important to validate model values with field observations as well as to take steps to reduce uncertainties in future projections. To meet some of these challenges and limitations, individual model performance validation and characterization was done and presented in the following section.

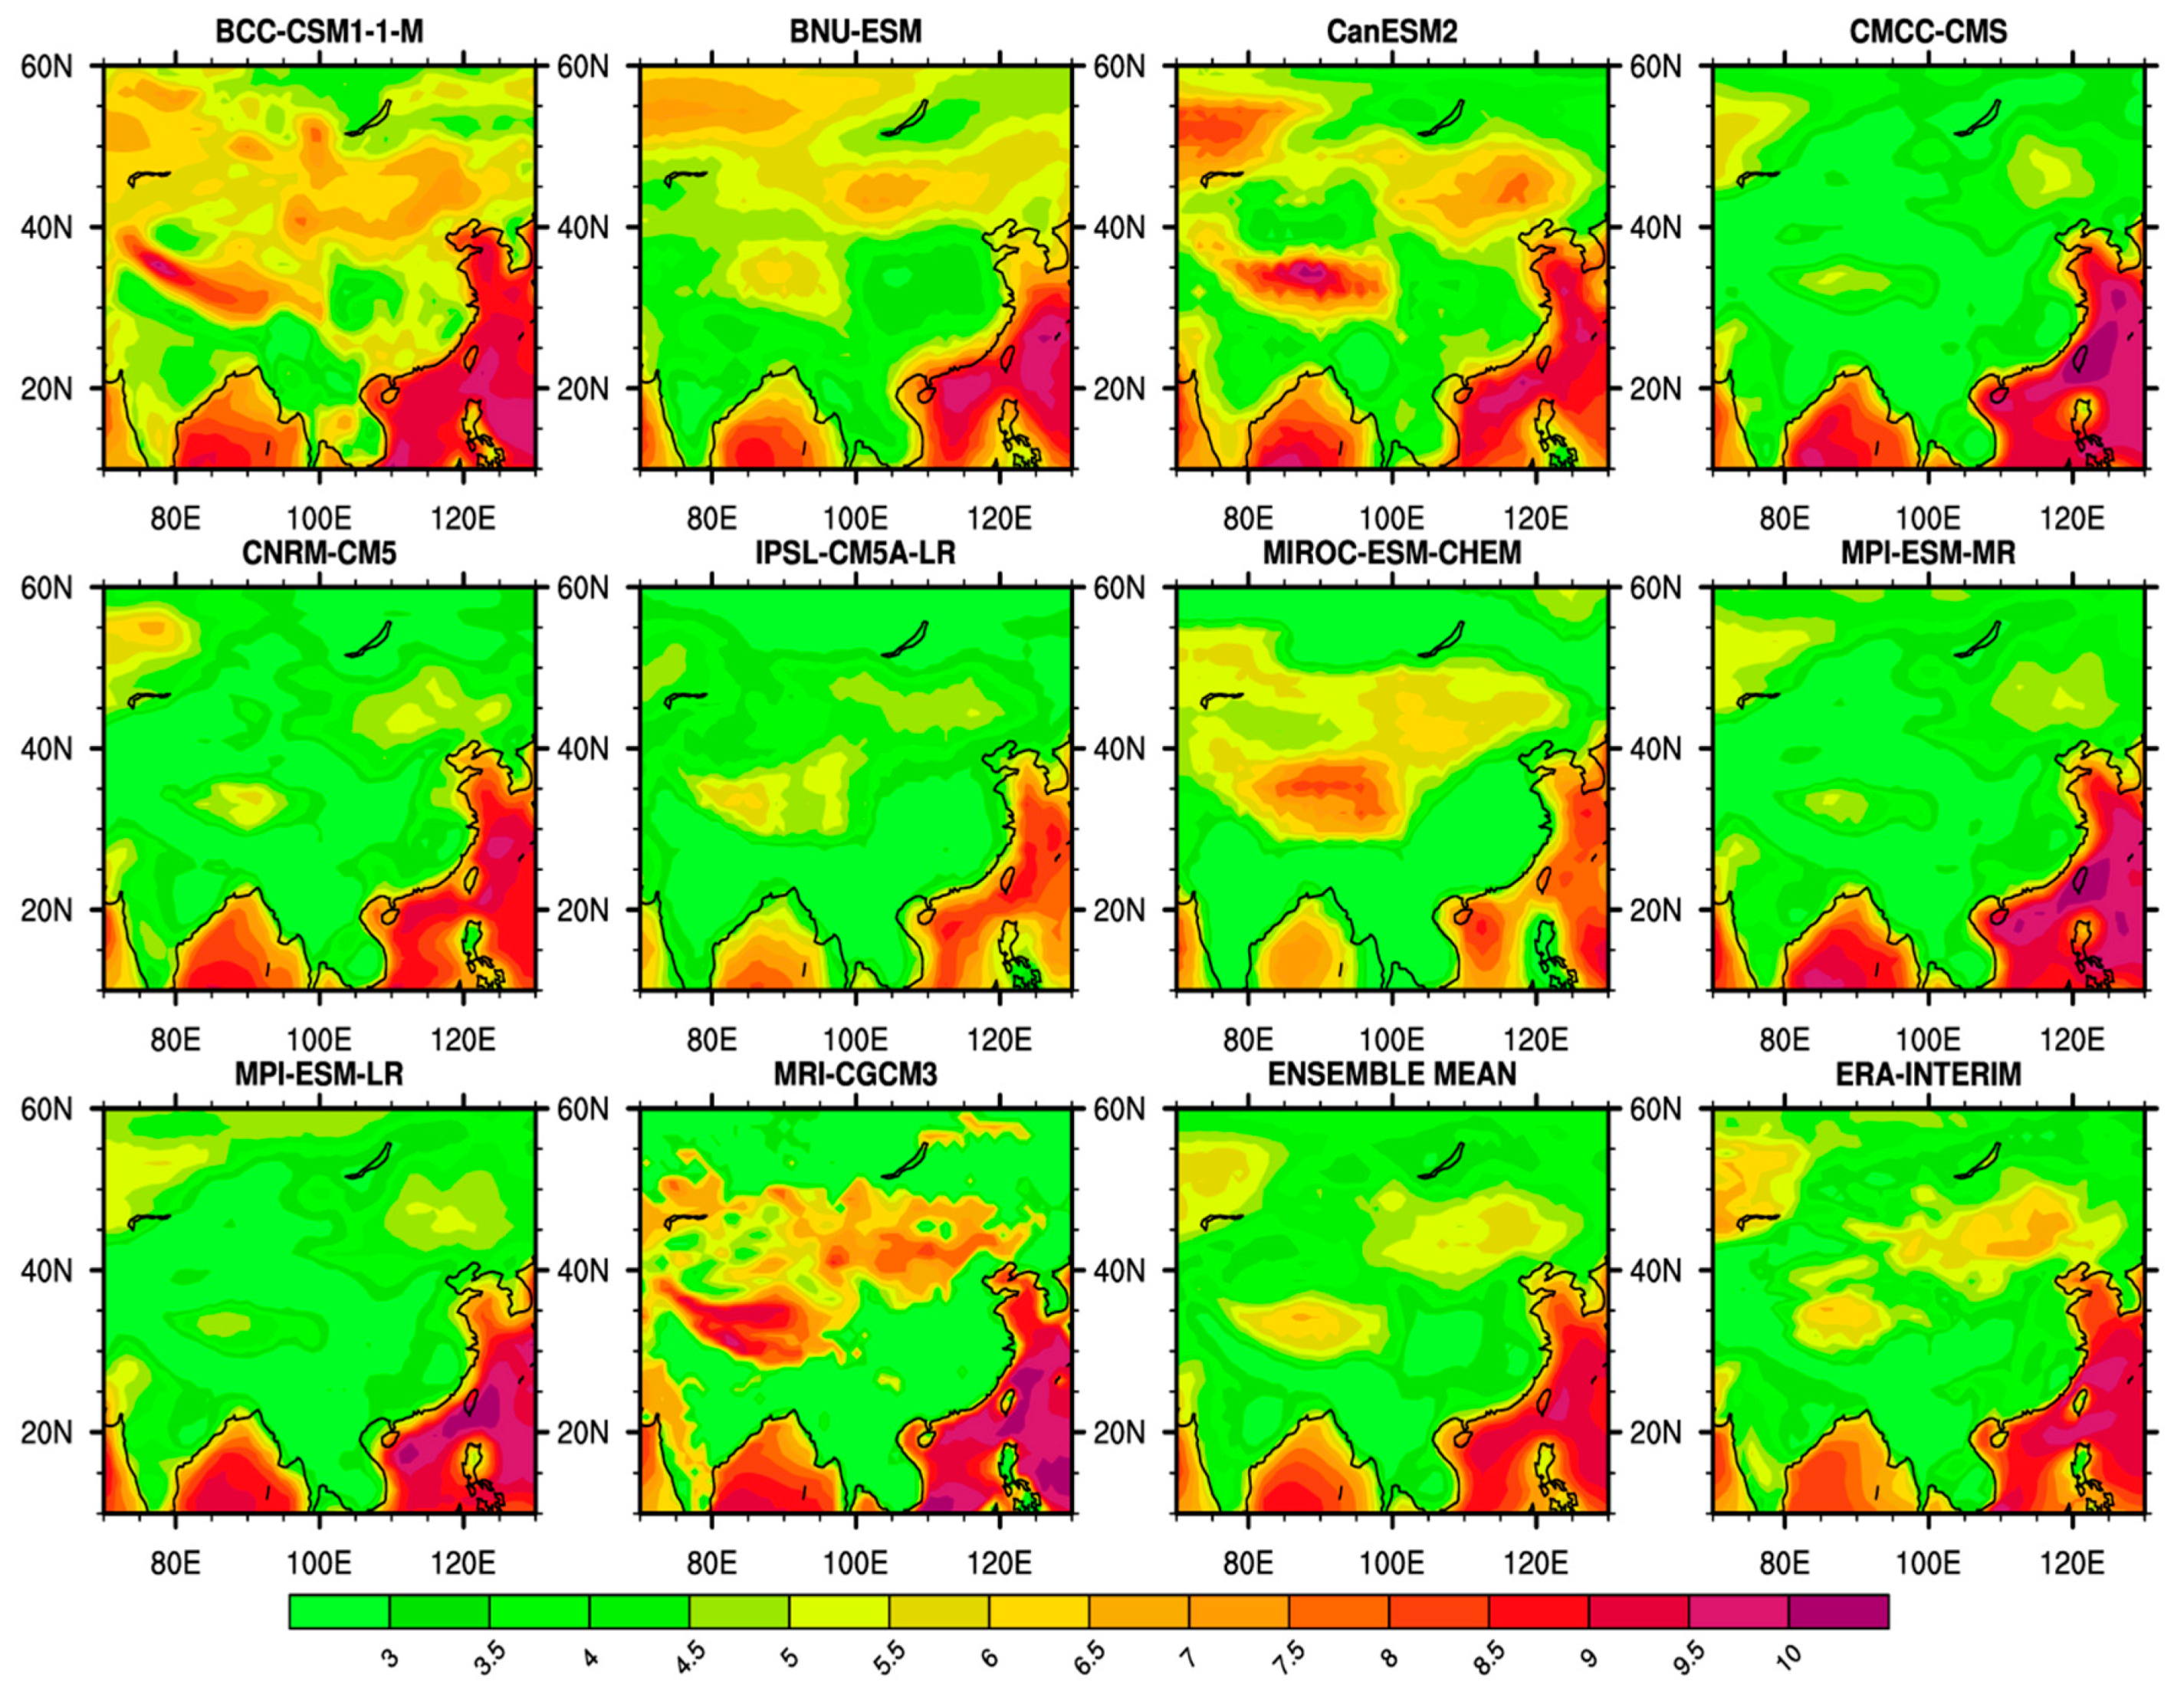
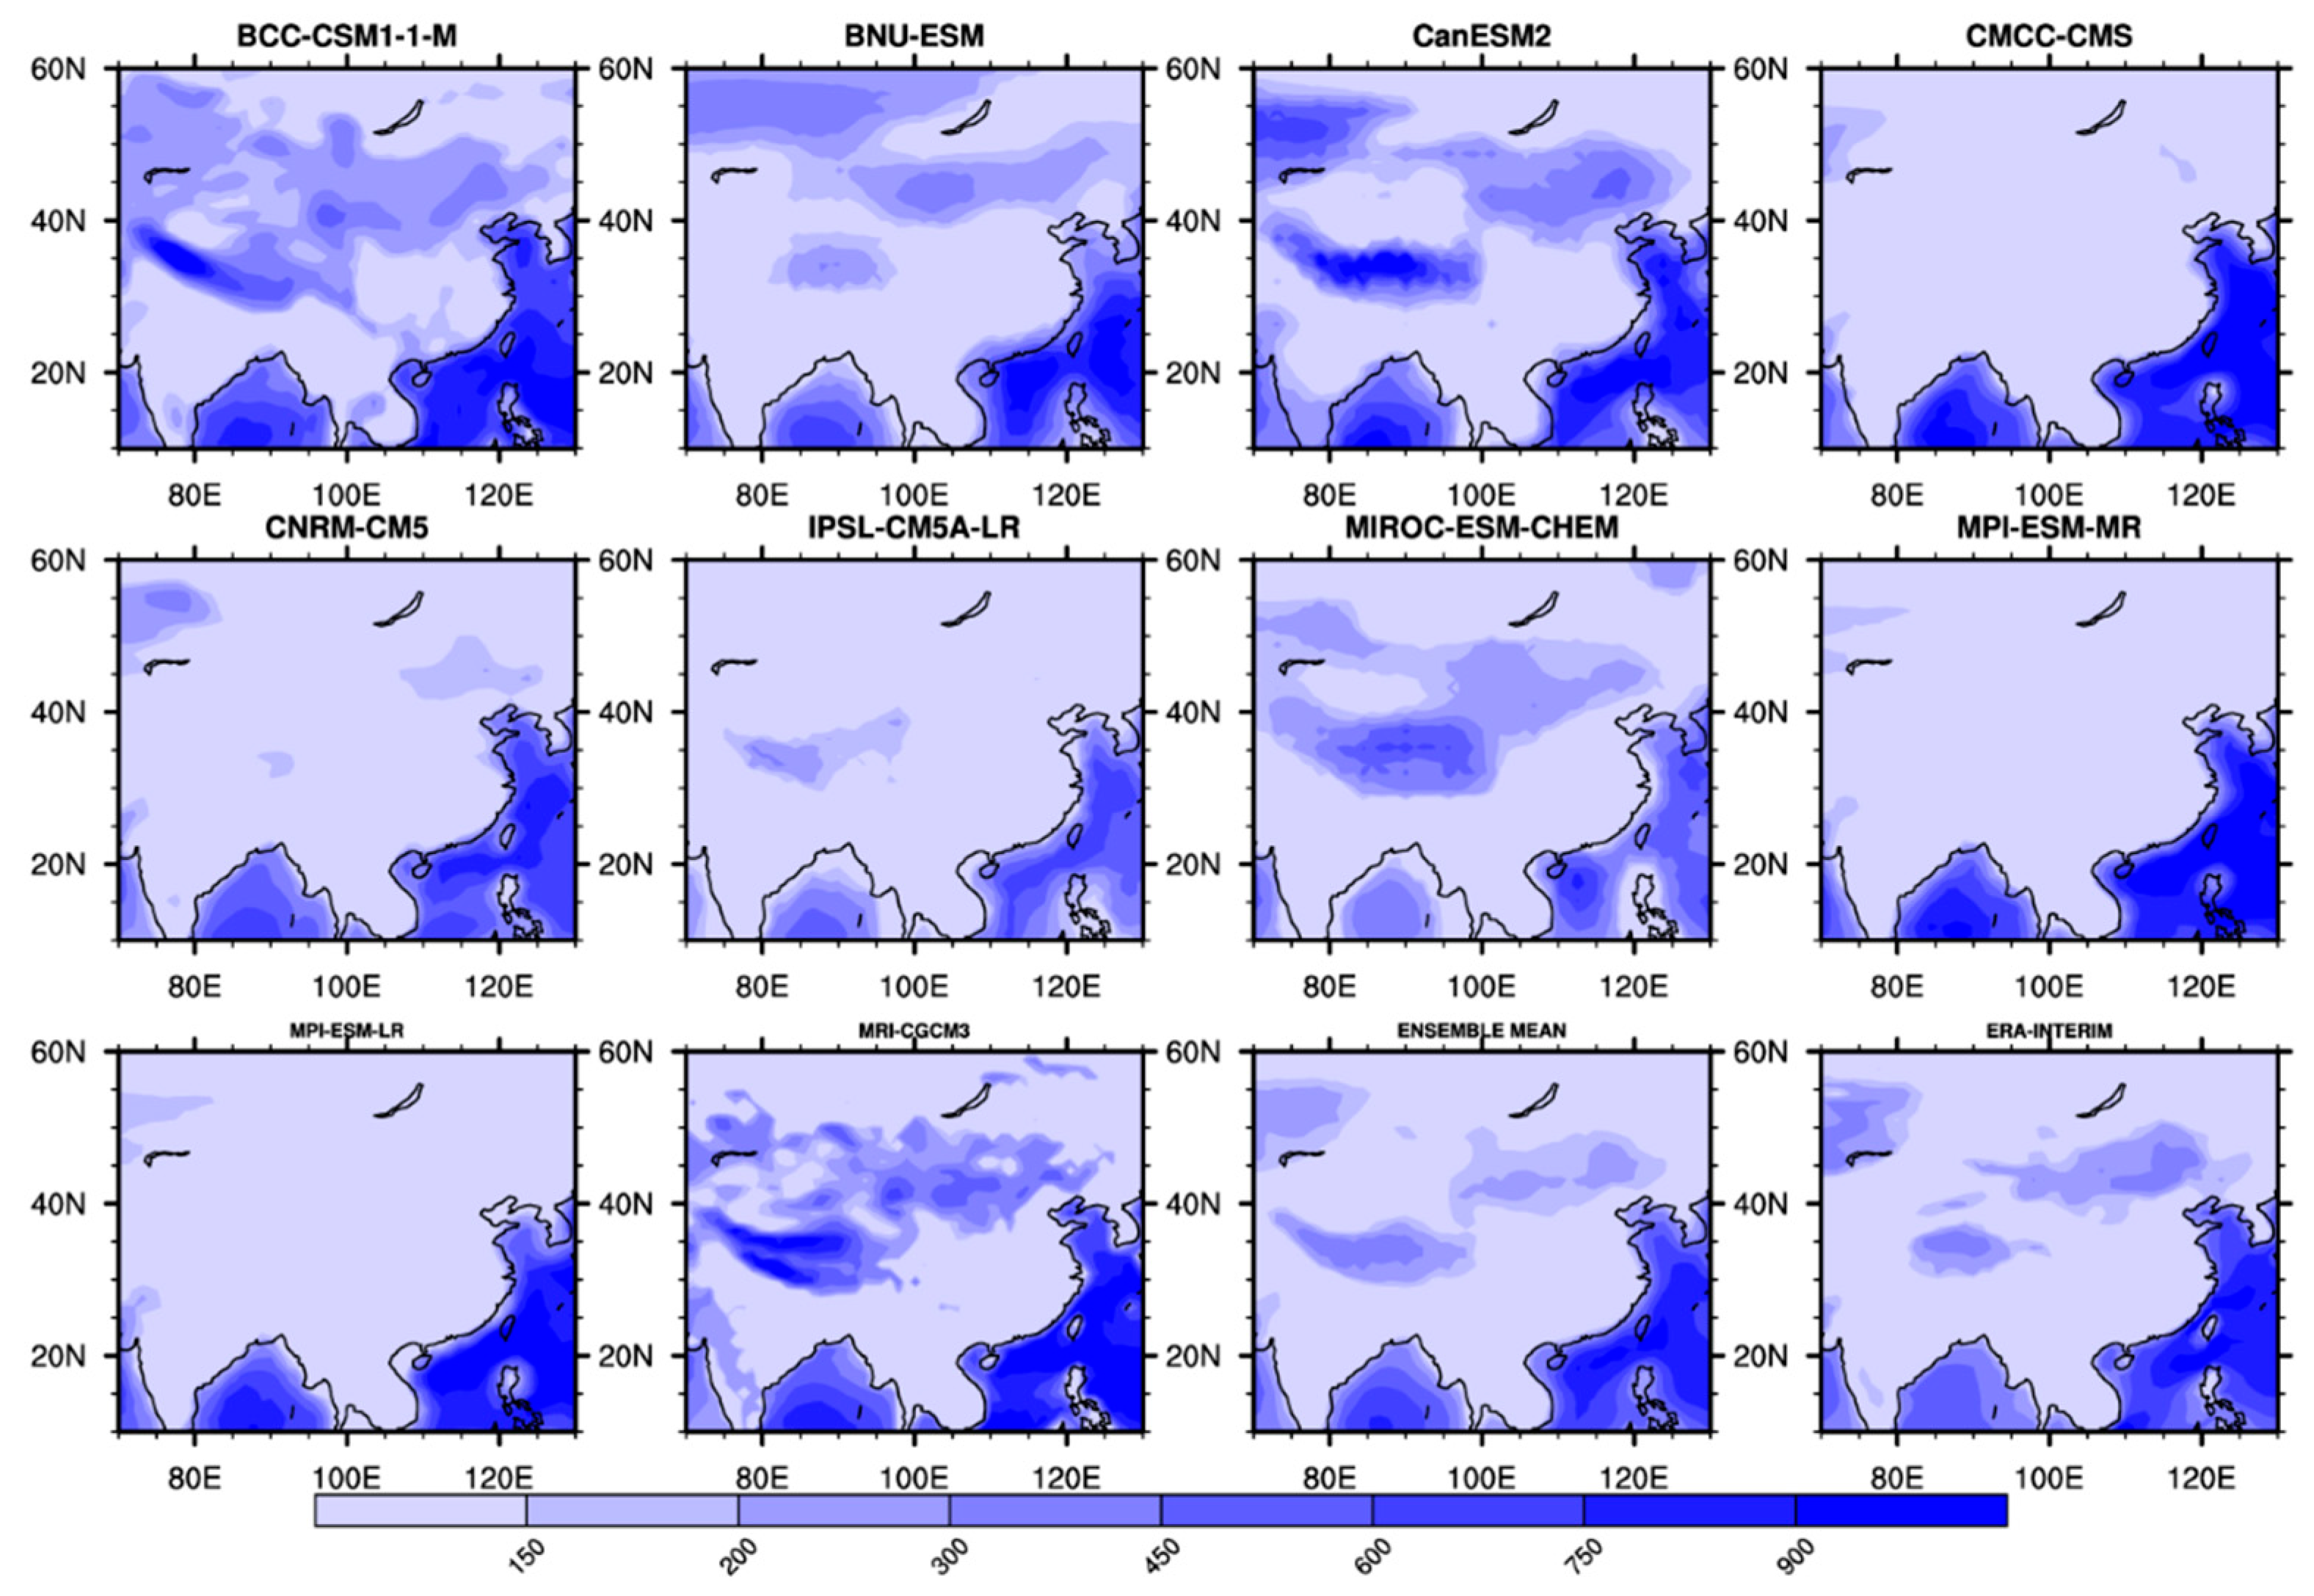
3.2. Evaluation of Wind Speed and Model Performance

Results of mean wind speed for the current period 1981–2005 are presented in Figure 3 for each CMIP5 model alongside their ensemble mean and the observation proxy ERA-Interim. The models are in good agreement with the reanalysis data capturing the spatial distribution of wind speed. These results are broadly going to be described with characteristics location, shape, and size. Location discusses the geographical area of observed pattern; shape refers to the form or outline while size refers to the lateral and vertical extent of the pattern.
The location agreement for wind speed peaks is relatively higher in the coastal areas of the study domain in the south-east and south-west although there are significant differences in magnitude. For size, all the models also show very high agreement except for the IPSL-CM5A-LR and MIROC-ESM-CHEM which show lesser spatial extents for the coastal areas covering the South China Sea and Bay of Bengal. Over the 30°–50° N belt, however, large differences in size are observed with some models having no wind speed peaks for the entire longitudinal expanse such as MPI-ESM-MR, MPI-ESM-LR, CMCC-CM5, and IPSL-CM5A-LR models. Relative to the reanalysis dataset, BCC-CSM1-1-M, CanESM2, MRI-CGCM3, and BNU-ESM overestimate the mean value, while the ensemble mean appears to moderately underestimate mean values. For the entire study area, BCC-CSM1-1-M, and CanESM2 tended to show higher mean wind speed while MPI-ESM-MR, MPI-ESM-LR lesser magnitudes. The ensemble mean outperforms individual models in capturing the spatial characteristics. Broadly, the mean wind speed ranged from about 8 m/s at the offshore and coastal areas of South China Sea, about 6–7 m/s at the Bay of Bengal region and about 4–5 m/s at most inland areas of the domain.
The spatial bias of mean wind speed relative to ERA-Interim is presented in Figure 4. The magnitude of bias ranged from about −3 m/s to +3 m/s. The bias shows that models BCC-CSM1-1-M, BNU-ESM and CanESM2 have significantly higher mean wind speeds in most of the study area with corresponding changes in size and location. CMCC-CMS, MPI-ESM-MR, and MPI-ESM-LR all showed slightly higher mean wind speeds in the coastal areas but lower mean wind speeds along the 30°–50° N belt with roughly the same shape and size distribution. IPSL-CM5A-LR and MIROC-ESM-CHEM both exhibit similar characteristics of higher mean wind speeds in the same latitudinal belt enveloped by lower mean wind speeds. The latter model (MIROC-ESM-CHEM) is about 1 m/s more (less) intense for the higher (lower) values relative to the former model. The MRI-CGCM3 model showed a strip of lower mean wind speed above the 30°–50° N belt while having over-estimations at the coastal areas also. The ensemble mean showed the least bias and thus adopted for the future projections.
To overcome some of the concerns posed by the results of the historical period for wind power class, values of the obtained wind speed are compared with literature data of station observational data. Liao et al. [42] used surface station data and observed that more than 80% of the total area in China had wind energy density between 0–150 W/m2. Jiang et al. [9] and Wang et al. [43] reported similar patterns for observational data from 535 stations and 729 stations, respectively. More studies concluded that similar surface data from China may suggest a recent decline in wind speed [16,17,18], albeit the range of observations show only modest differences with the values obtained from the reanalysis dataset used in this study. Thus, for the projections contained in the following section special considerations were made.
One consideration is that the estimations were made relative to the period 1981–2005 such that irrespective of the bias in the model, the magnitude of change observed between the current and future climate is still accurate and reliable for guiding increased investment and energy planning, as well as estimating future wind energy supply. Also, the cubic relationship between wind speed and wind power when doing wind power estimations can be misleading. Using mean wind speed as the only indicator may result in estimation errors as time-step differences in wind speed would give a different value compared to time-step differences in wind power i.e., ( t 1 + t 2 2 ) 3 ( t 1 3 + t 2 3 2 )
To overcome this limitation, the spatial characteristics are discussed using WPD as this also accommodates the timescale variability and Weibull fit distribution of wind speed. The results of the future projections based on the ensemble mean and are detailed below for the RCP8.5 scenario. WPD for current period 1980–2005 and future time slices for each CMIP5 model is shown in Figure A2, Figure A3, Figure A4, Figure A5 and Figure A6.

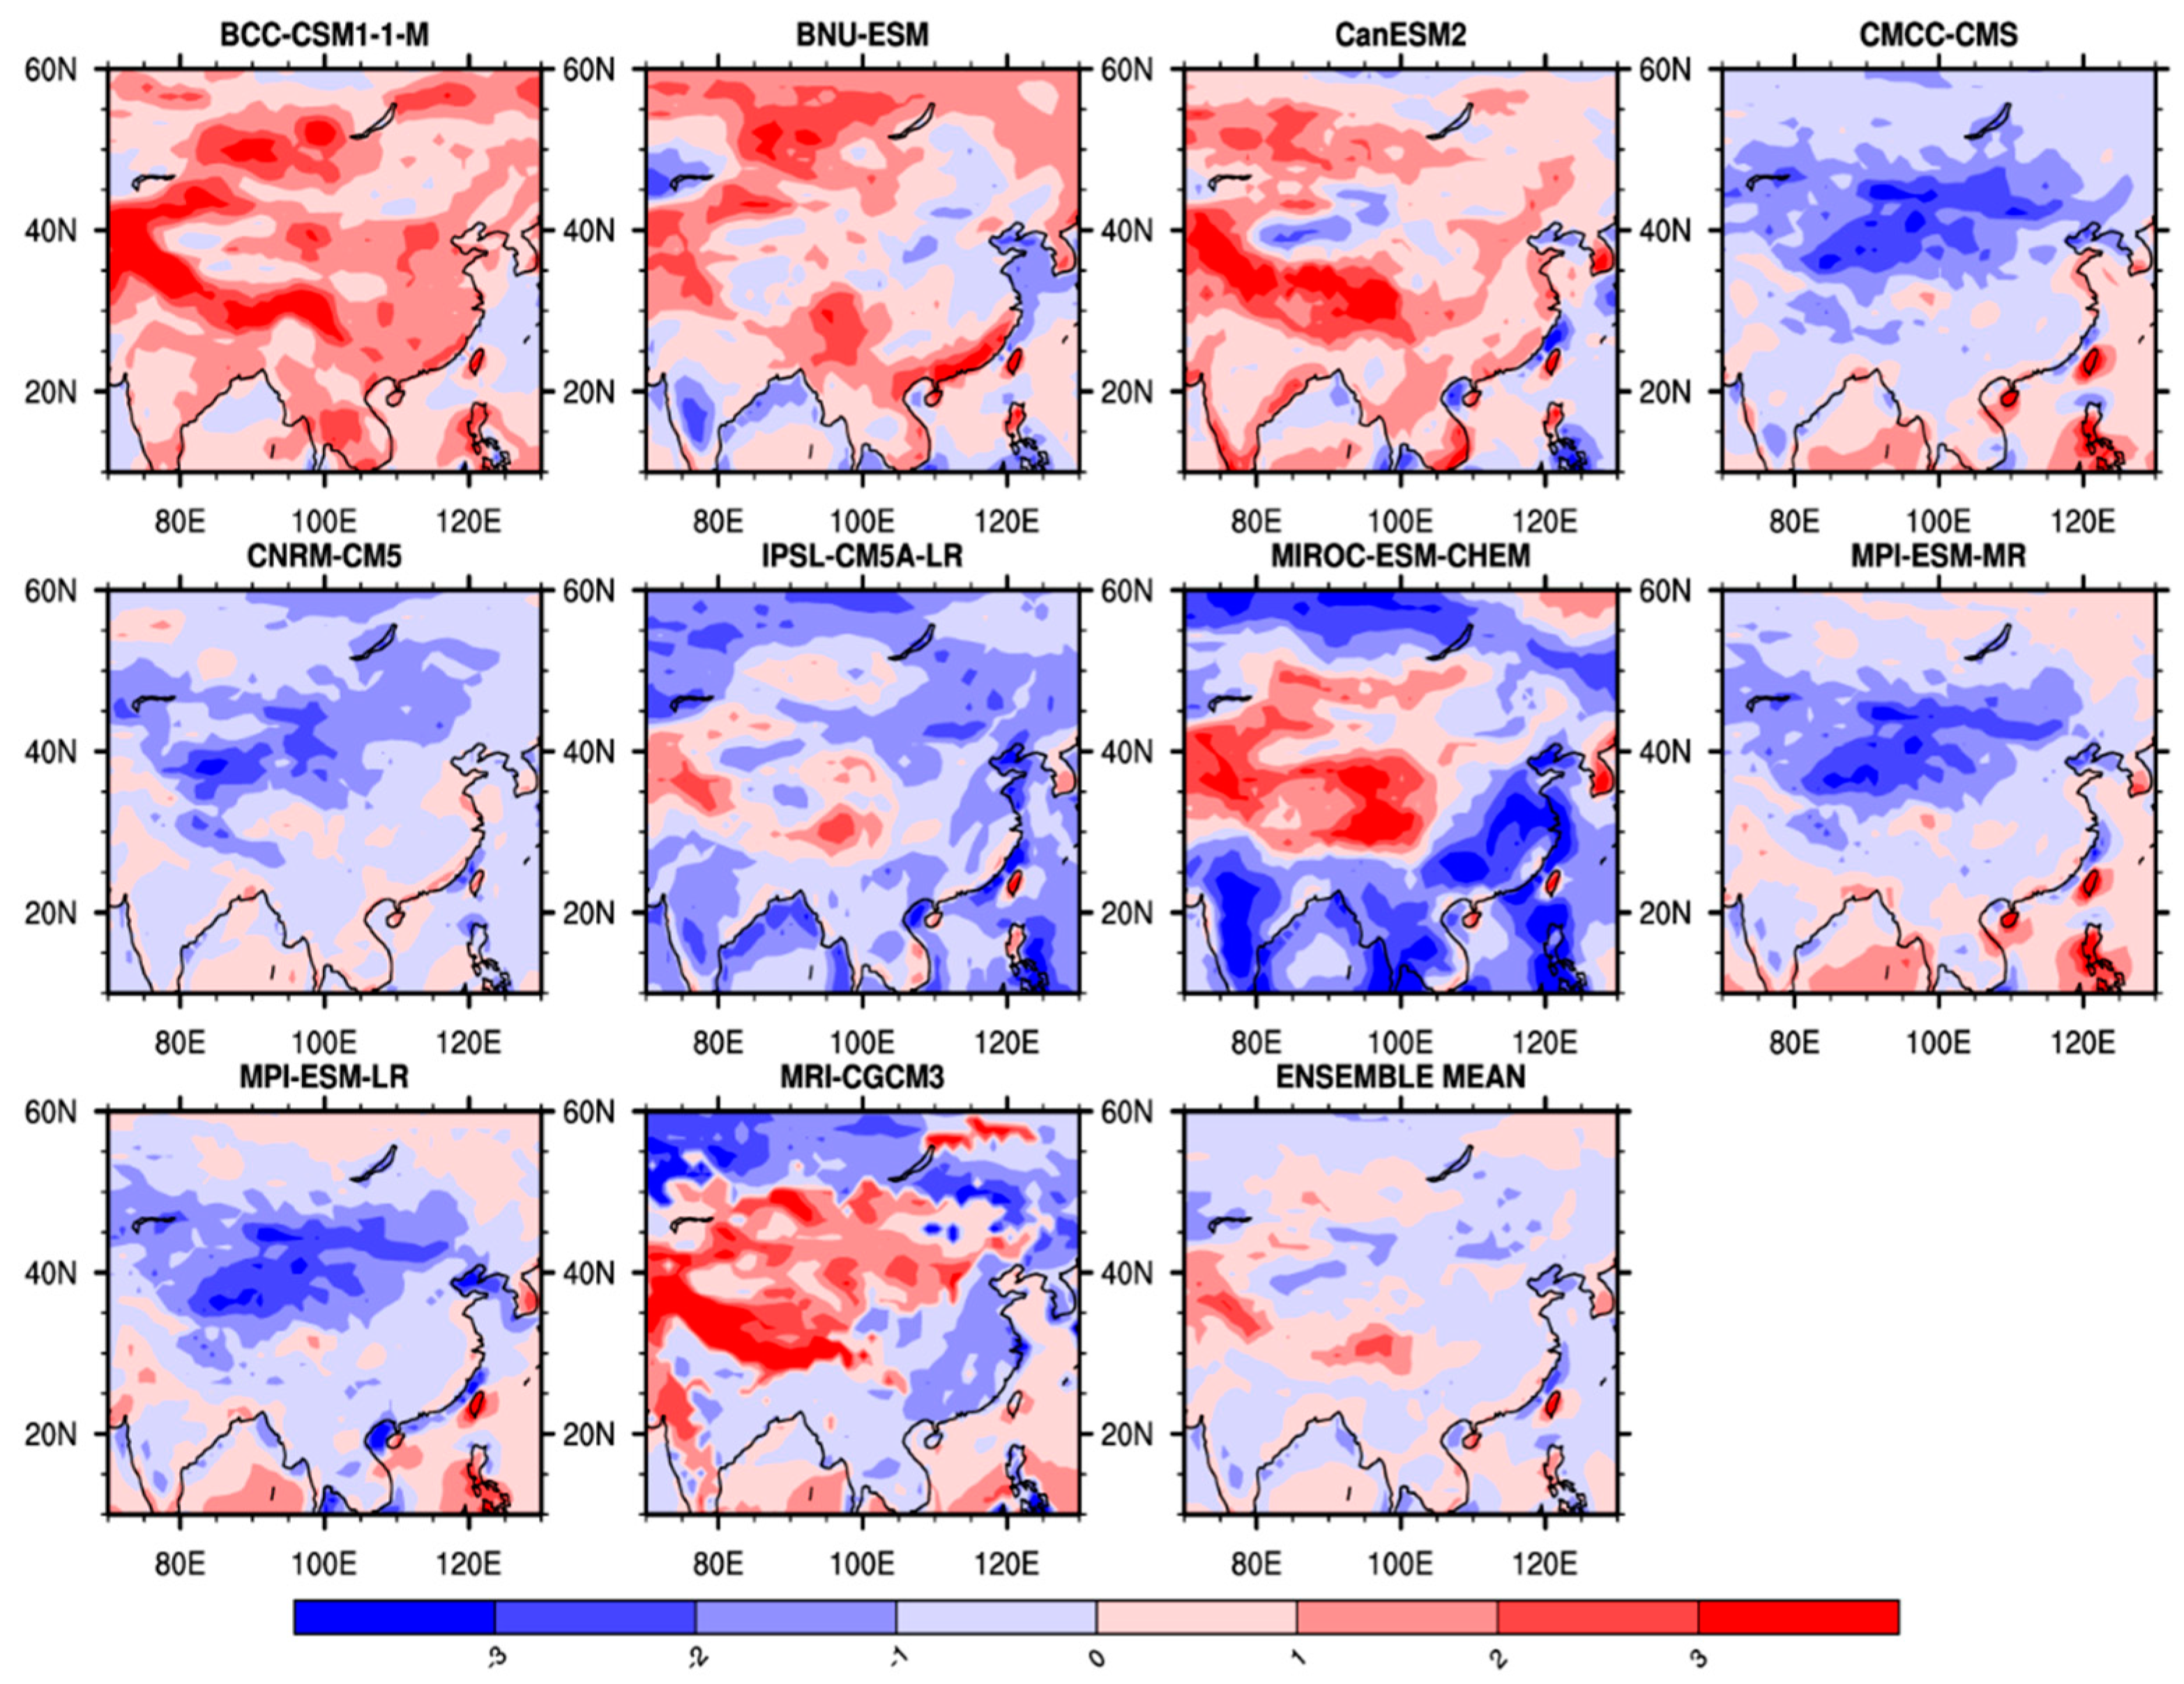
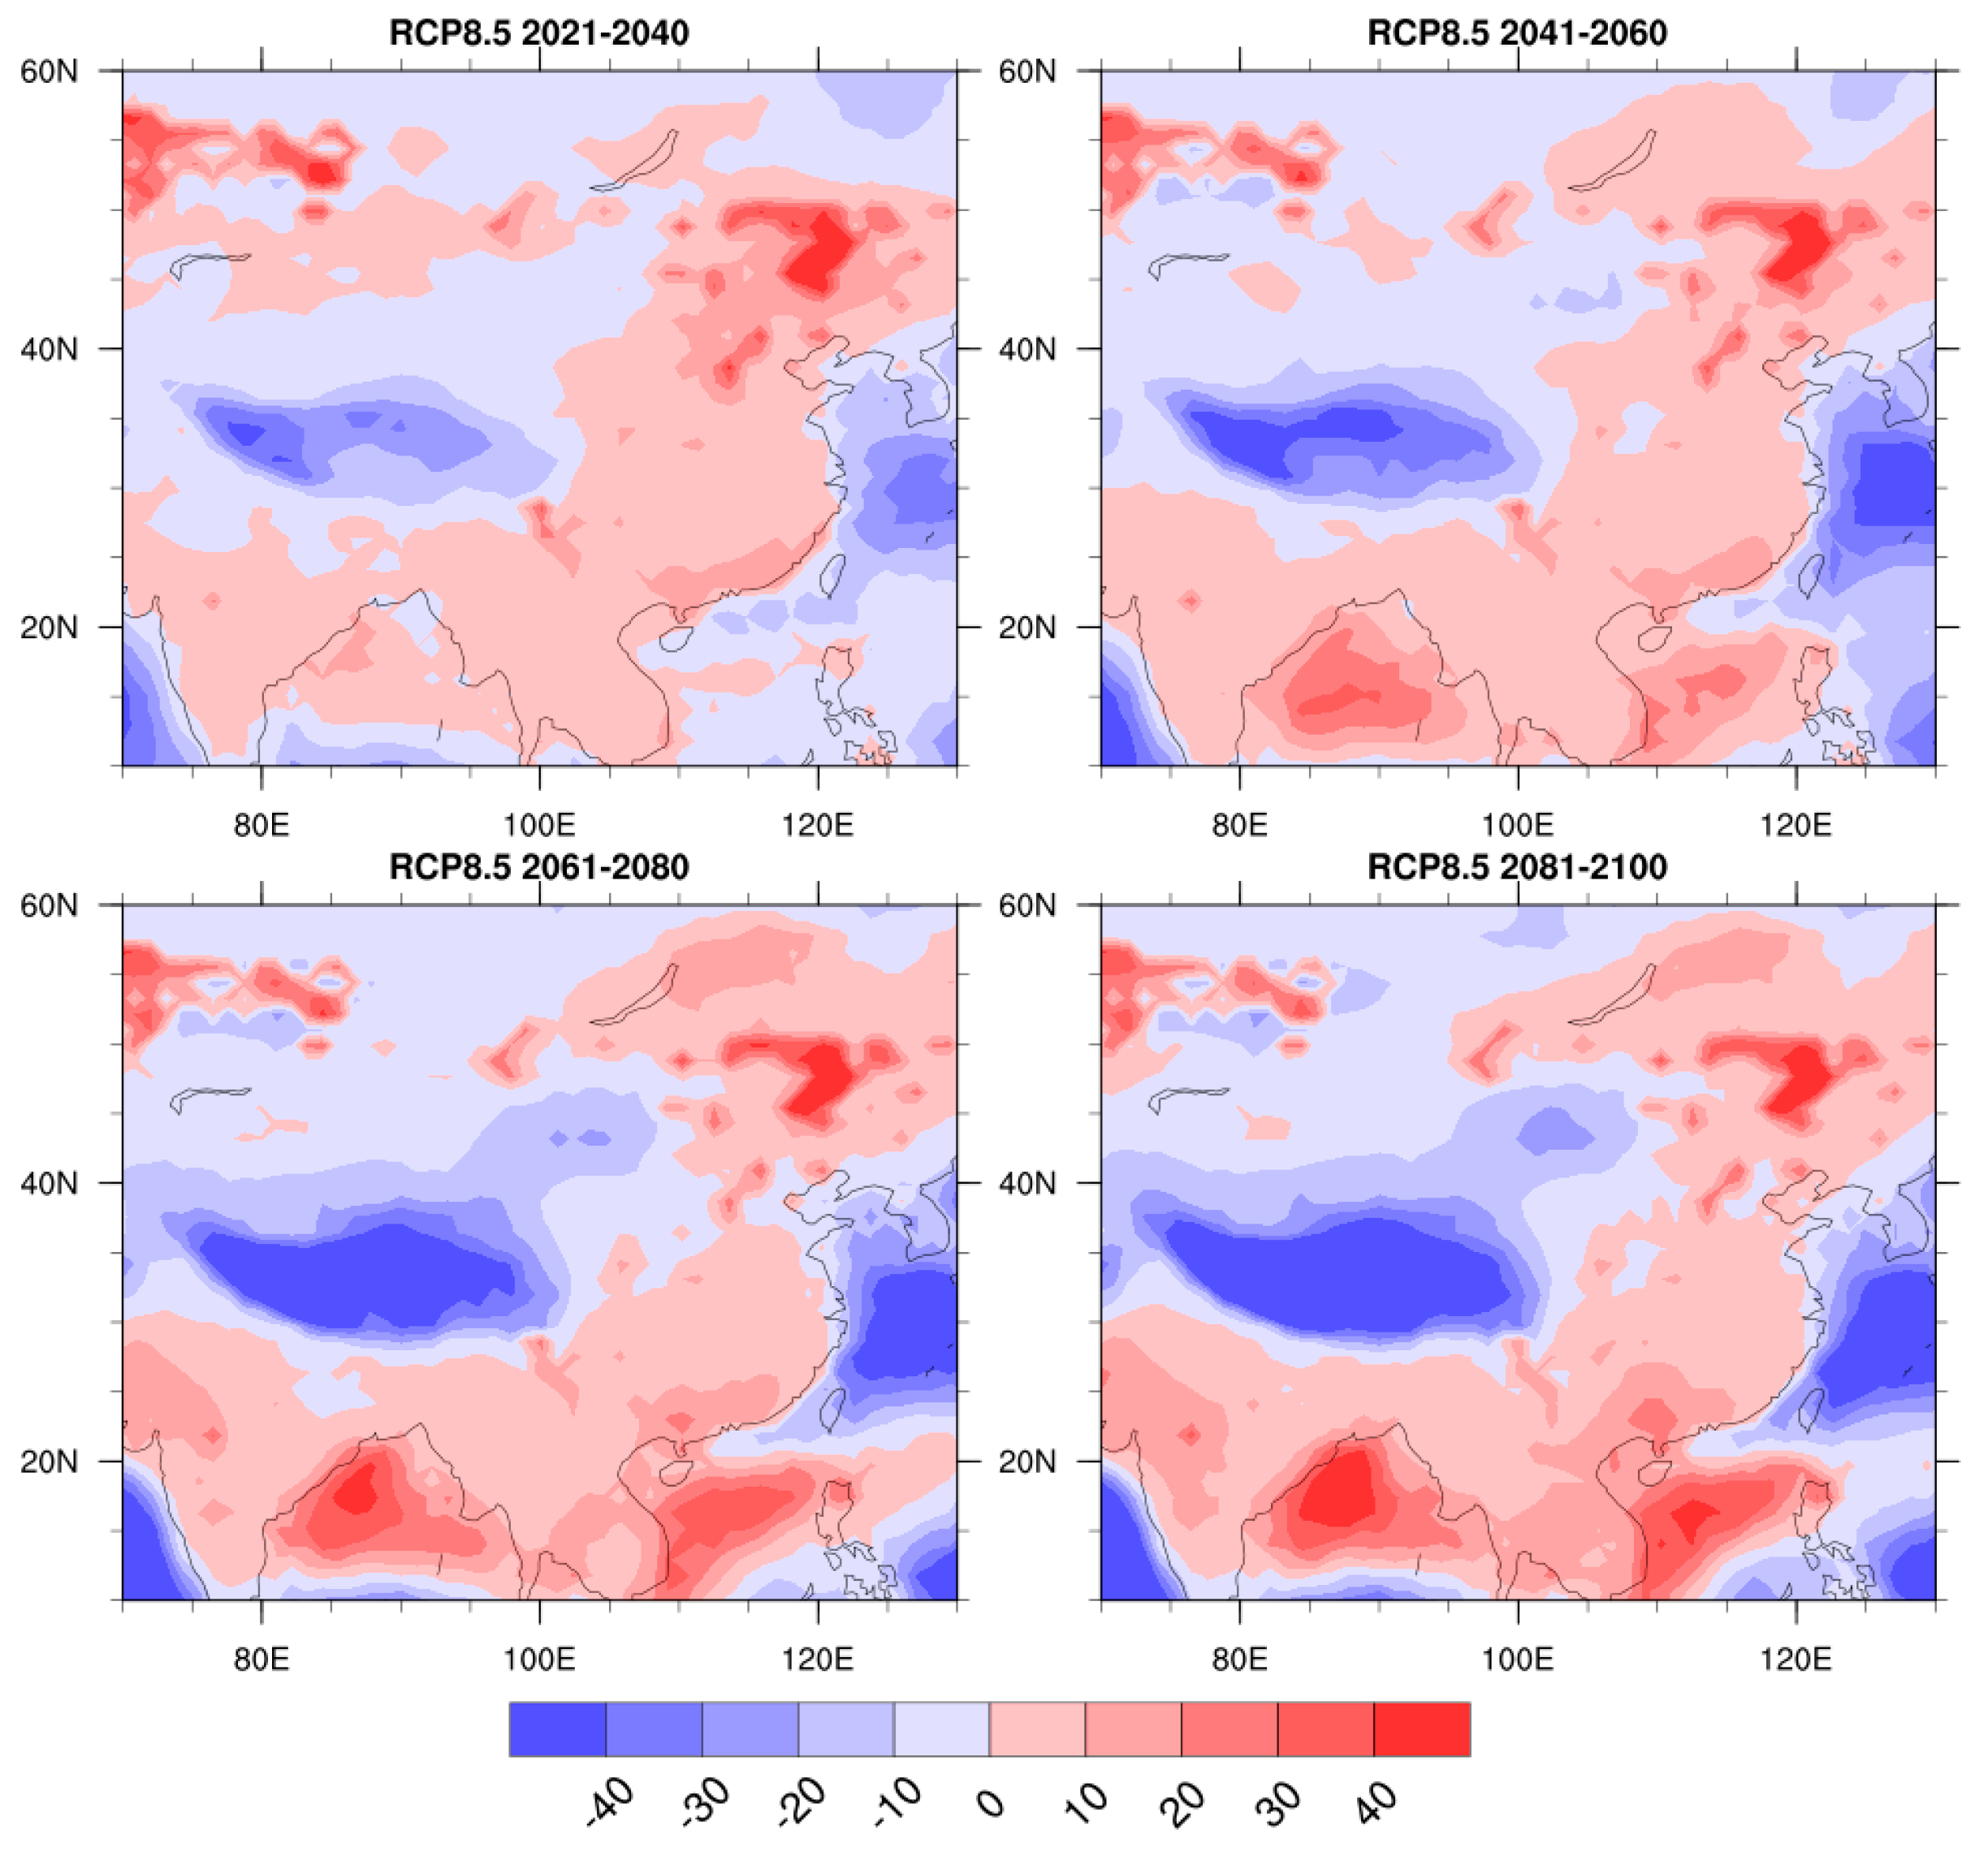
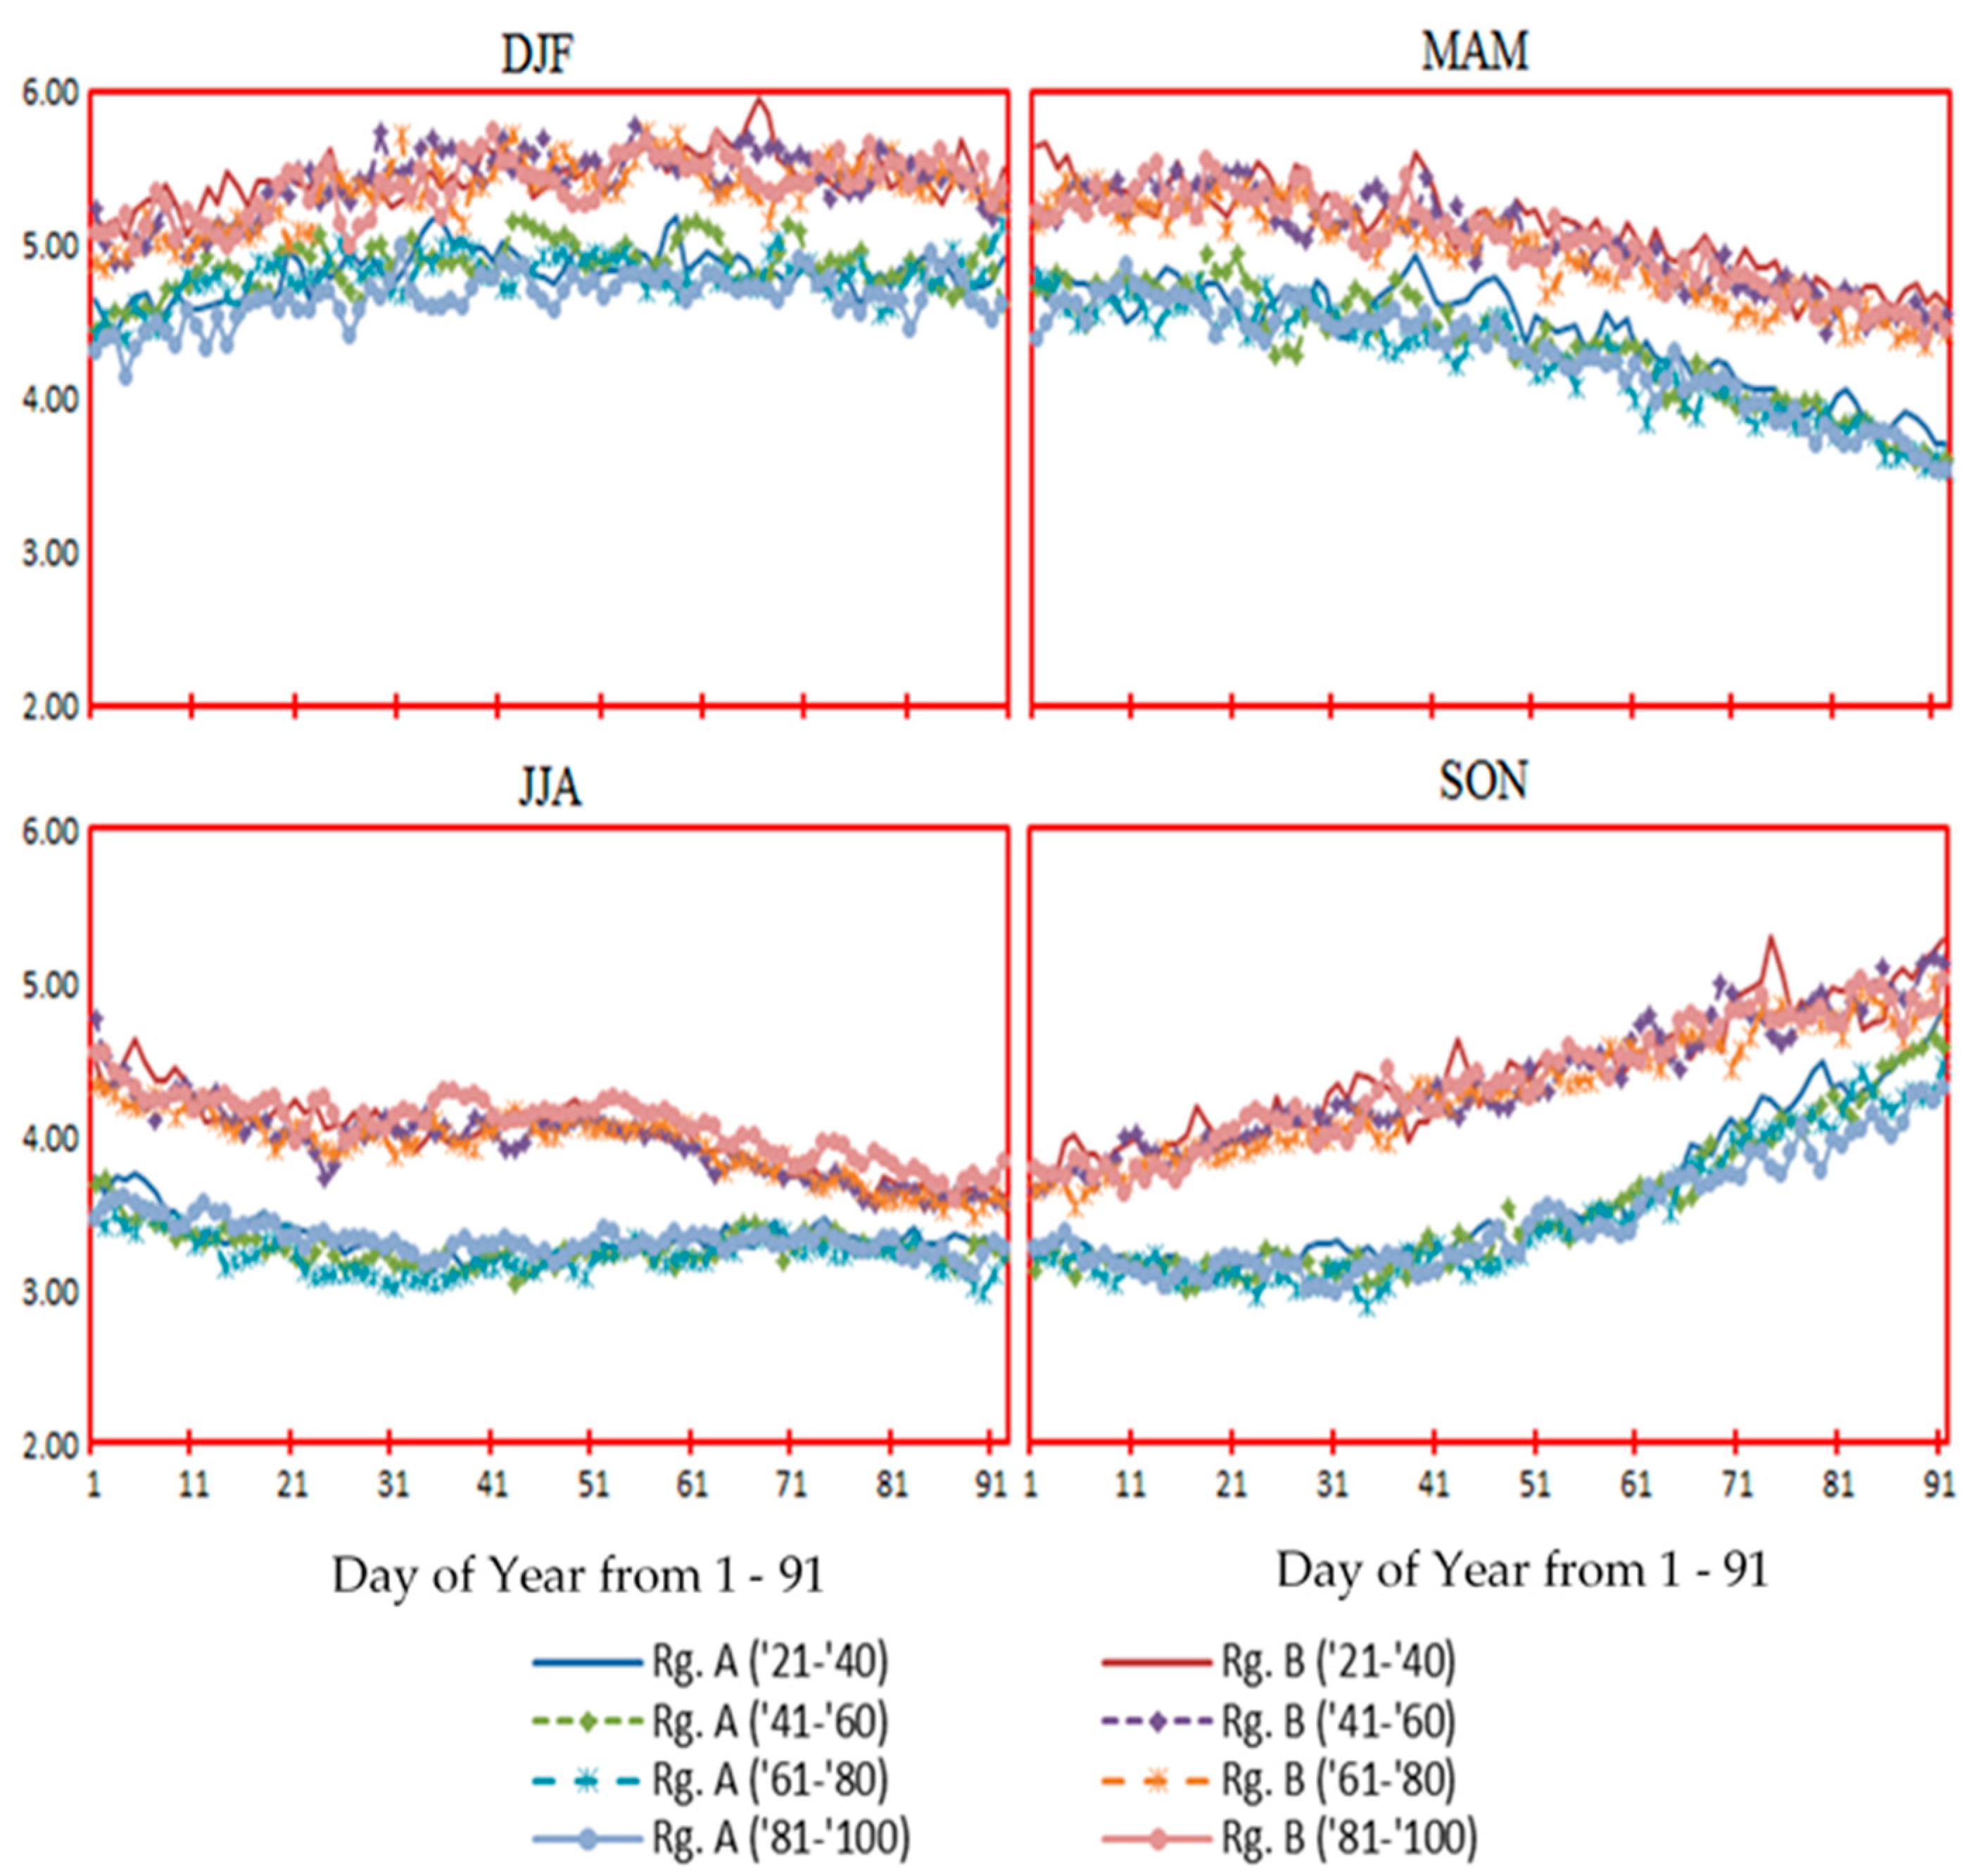
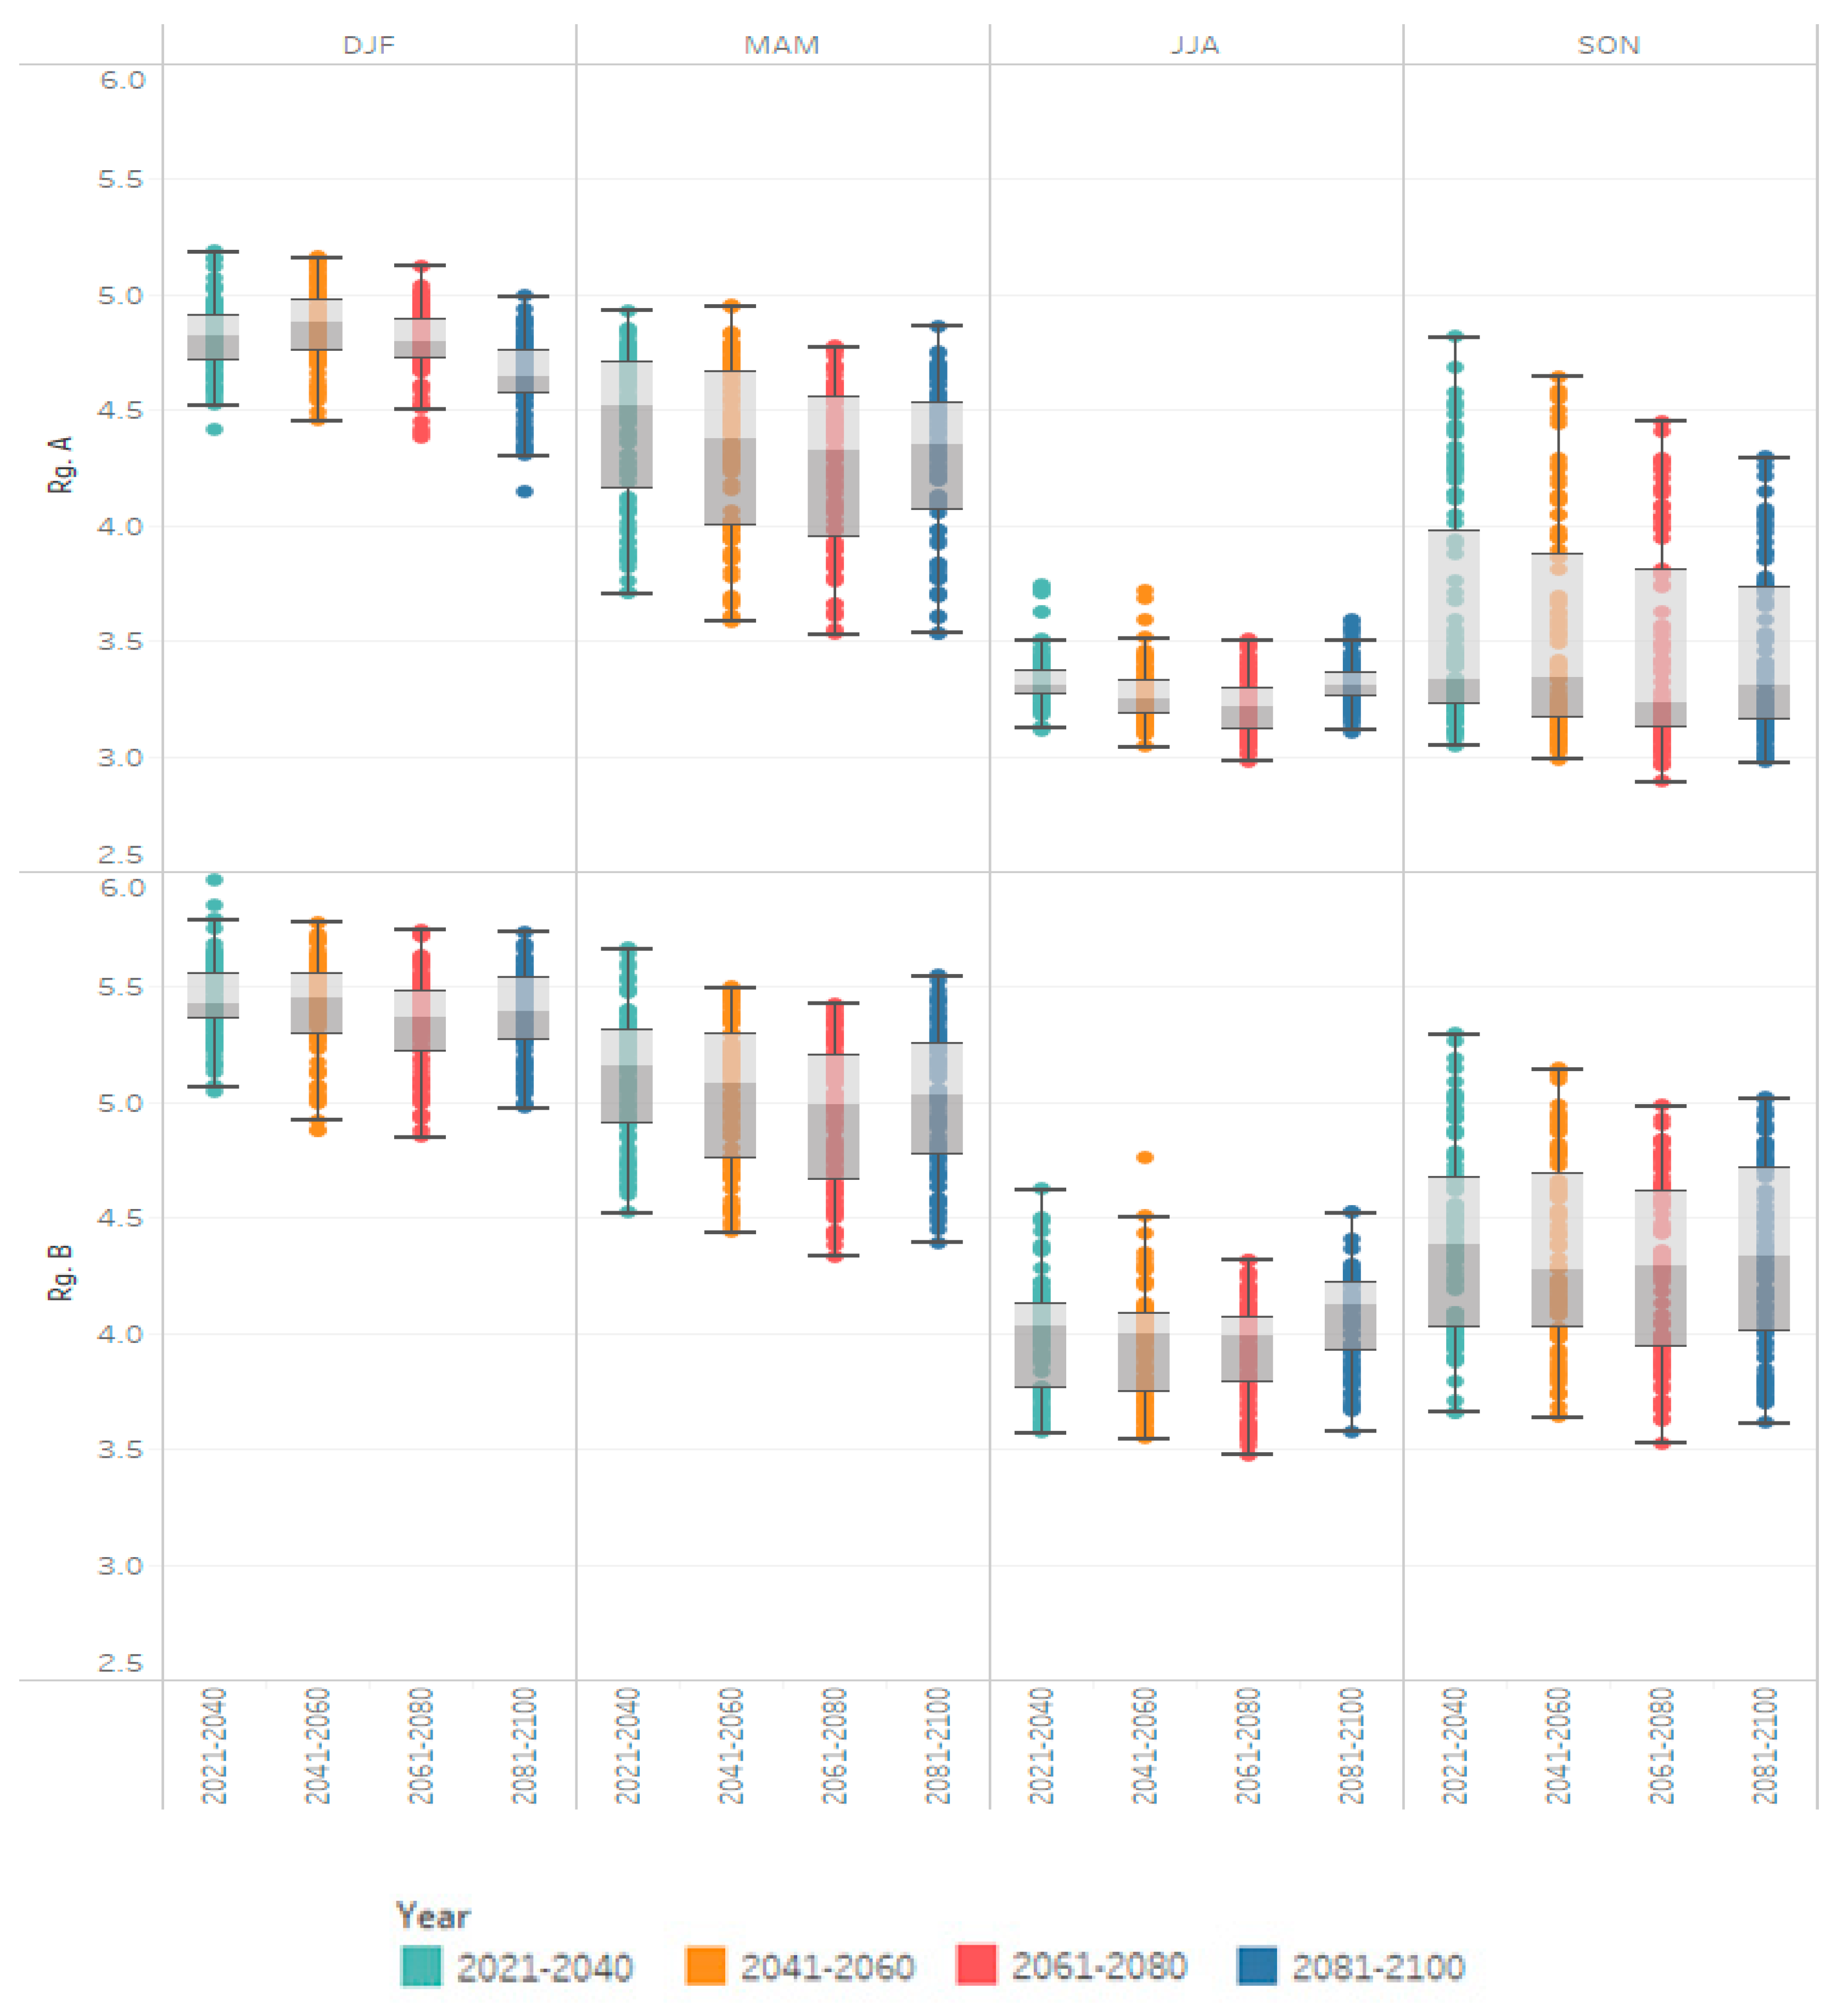
3.3. Future Wind Power Scenarios

As earlier stated, future projections of WPD are evaluated relative to the simulations for the current time period. Broadly, the potential changes in each time slice are quite modest with a range of ±40 W/m2 for the decadal time slices considered. The spatial distribution also shows a large similarity to the current WPD especially in terms of peak locations. Nonetheless there are significant differences in sizes (of these peak values). The result shown in Figure 5 suggests that the most notable changes in future wind power may exhibited in a more temporal form.
The Tibetan region of the study domain found around the latitudinal belt 30°–40° N extending to about 100° E showed a constant decrease of WPD from the first two decades (2021–2040) till the end of the century (2081–2100). Although the shape appeared to be the same, the size extended as the century progressed implying an increase in areas experiencing lesser WPD with the magnitude of the decrease also increasing. The reverse is the case for most of the coastal areas especially the Bay of Bengal and parts of the South China Sea coastline where WPD increased as the century progressed. Differences in shape and size of the peaks can also be observed for most of the areas. Consequently, it can be inferred that there are no significant changes in mean WPD over China in the future. Similar conclusions have been reported about future near-surface wind speeds based on the 4 RCP scenarios [15], and from CMIP3 models of extreme wind speed [44]. Notwithstanding, due to the frequency distribution properties of wind speed and its timescale variability, a more in-depth analysis on a seasonal timescale is conducted over the two regions with China’s largest wind power capacity.
The analysis results as presented in Figure 6 show that mean daily wind speed is higher in December-January-February (DJF) and least in June-July-August (JJA) for both regions (Rg. A and Rg. B) based on a Day of Year timeline. The probable annual cycle shows wind speed reduced from its peak values in winter through to lower values in spring and summer. This is followed by a gradual increase in autumn as the weather transitions to cooler wintertime temperatures. On the temporal scale, the first time slice 2021–2040 recorded the maximum wind speed for both regions and this is repeated for the 4 seasons although with lesser differences in magnitude in summer and autumn seasons. Also noteworthy is that despite the geographical proximity between both regions, wind speed was higher in region B than in region A. Details of the spread of wind speed in m/s for the ensemble mean over each region including the minimum, quartiles, and maximum are contained in Figure A7.
To compensate for wind spatial and temporal variability as well as potential future decrease in wind power, complementarity of energy sources in hybrid power systems has emerged. Such a system can be wind-hydro, wind-solar etc. This concept has a huge potential for balancing demand-supply mismatch and would be very effective for meeting demand-net-wind. Demand-net-wind is the amount of energy that can be supplied from non-wind sources to meet energy demand. Comprehensive details on hybrid systems as well as complementarity are available in the study by Jurasz et al. [45]. Furthermore, by evaluating using relative differences rather than absolute values (future–current), validity and applicability of the study results are retained despite using a constant α value for the wind speed extrapolation.

4. Summary and Conclusions

The aim of the study was to assess the ability of various CMIP5 models to skillfully replicate wind energy resources over China and apply that as a tool for future wind power generation projection. This was conducted by using ten models and a multi-model ensemble mean validated with ERA-Interim reanalysis data for a reference period of 1981–2005. Finally, future projections of wind power potential over the study domain and the two identified regions of largest installed wind power capacity were investigated in time slices of 20 years each following the RCP8.5 scenario.
The model bias were rather modest spatially, but also reflect that models BCC-CSM-1-1-M and CanESM2 had higher wind speeds while MPI-ESM-LR, MPI-ESM-MR, CMCC-CMS and IPSL-CM5A-LR failed to replicate the shape and size of peak wind speeds observed along the 30°–40° N belt in the reanalysis dataset. The ensemble mean skillfully captured the location, shape and size of the peaks, performing considerably better in the coastal areas as well as regions A and B. Future status of WPD from 2021–2100 presented using the ensemble mean projects mild increases in WPD in parts of the southeastern and southwestern offshore areas of the domain that intensified as the century progressed. Also observed were pockets of WPD decreases along the 30°–40° N in all the future time slices. Seasonal assessments showed higher wind speeds in DJF compared to the other seasons, with mean wind speed of 4.78 (3.29) m/s and 5.40 (4.78) m/s for regions A and B respectively in winter (summer).
Effectively, changes in future wind power potential are rather not sufficient to warrant a halt or reduction of wind power investment, nor pose a significant threat to the commercialization and marketability of the Chinese wind energy industry. Notwithstanding, the resulting patterns suggest that there may be significant changes in seasonal variability which would impact turbine power output management, distribution, and operational reserves. The contrasting pattern between the coastal and inland areas could also pose significant challenges in the geographical distribution of wind power peak areas in the future for China. There is an emerging risk of a different future scenario should warming continue at an even faster rate or at business-as-usual scenario. Technological improvements in turbine design and capacity may be sufficient to offset some of the aforementioned risk, thus further increasing productivity and reducing cost of wind power generated electricity. The typical 20–30-year life cycle of an operational wind turbine would inevitably allow for a systemic upgrade and replacement in favor of adapting to the said risks. Also, shortfalls in supply can be met from other renewable sources through spatio-temporal complementarity of power sources.
Ultimately, the results provided in our study offers significant insight for the planning, organization, and management of current and future wind power in China. It provides a valuable outlook tool for stakeholders involved in energy planning, energy policy, and power systems to optimize wind energy without compromising stability. One limitation of the study in its present form is the uncertainty introduced by using near-surface wind speeds extrapolated to hub-height as well as the value of Hellman exponent used. Also, the bias in models should be seriously considered when performing similar or advanced downscaling of CMIP5 models to increase the confidence of generated results. Future work should consider incorporating various values of Hellman exponent and explaining the possible mechanisms behind changes in wind speed.

Author Contributions

Conceptualization, A.T.A. and A.A.A.; methodology, A.T.A. and W.Z.; writing—original draft preparation, A.T.A.; writing—review and editing, A.T.A. and W.Z.; visualization, A.T.A., W.Z. and A.A.A. All authors have read and agreed to the published version of the manuscript.

Funding

This work is supported by National Nature Science Foundation of China Grant 41675062.

Conflicts of Interest

The authors declare no conflict of interest.

Appendix A

Figure A1. Spatial distribution of mean wind power density (WPD) in W/m2 based on 90 m above ground level extrapolated wind speed for the historical period of 1950–1980 for the CMIP5 models and their ensemble mean.
Energies 13 02417 g0a1
Figure A2. Spatial distribution of mean wind power density (WPD) in W/m2 based on 90 m above ground level extrapolated wind speed for the current period of 1981–2005 for the CMIP5 models, their ensemble mean, and ERA-Interim.
Energies 13 02417 g0a2
Figure A3. Spatial distribution of projected mean wind power density (WPD) in W/m2 based on 90 m above ground level extrapolated wind speed for the 2021–2040 for the CMIP5 models under RCP8.5 scenario.
Energies 13 02417 g0a3
Figure A4. Spatial distribution of projected mean wind power density (WPD) in W/m2 based on 90 m above ground level extrapolated wind speed for the 2041–2060 for the CMIP5 models under RCP8.5 scenario.
Energies 13 02417 g0a4
Figure A5. Spatial distribution of projected mean wind power density (WPD) in W/m2 based on 90 m above ground level extrapolated wind speed for the 2061–2080 for the CMIP5 models under RCP8.5 scenario.
Energies 13 02417 g0a5
Figure A6. Spatial distribution of projected mean wind power density (WPD) in W/m2 based on 90 m above ground level extrapolated wind speed for the 2081–2100 for the CMIP5 models under RCP8.5 scenario.
Energies 13 02417 g0a6
Figure A7. Boxplots of seasonal daily wind speed showing the spread including minimum values, maximum values, mean value, and quartiles for each time slice over Region A and Region B.
Energies 13 02417 g0a7

References

  1. The Wind Energy International. 2020. Available online: https://library.wwindea.org/global-statistics/ (accessed on 30 April 2020).
  2. Sherman, P.; Chen, X.; McElroy, M.B. Wind-generated electricity in China: Decreasing potential, inter-annual variability and association with changing climate. Sci. Rep. 2017, 7, 16294. [Google Scholar] [CrossRef] [PubMed] [Green Version]
  3. Enevoldsen, P.; Valentine, S.V.; Sovacool, B.K. Insights into wind sites: Critically assessing the innovation, cost, and performance dynamics of global wind energy development. Energy Policy 2018, 120, 1–7. [Google Scholar] [CrossRef]
  4. Chen, W.; Castruccio, S.; Genton, M.G.; Crippa, P. Current and Future Estimates of Wind Energy Potential Over Saudi Arabia. J. Geophys. Res. Atmos. 2018, 123, 6443–6459. [Google Scholar] [CrossRef]
  5. Abolude, A.; Zhou, W.; Leung, Y. Regional Impact Assessment of Monsoon Variability on Wind Power Availability and Optimization in Asia. Atmosphere 2017, 8, 219. [Google Scholar] [CrossRef] [Green Version]
  6. Sawadogo, W.; Abiodun, B.J.; Okogbue, E.C. Projected changes in wind energy potential over West Africa under the global warming of 1.5° C and above. Theor. Appl. Climatol. 2019, 1–13. [Google Scholar] [CrossRef]
  7. Evans, J.P.; Kay, M.; Prasad, A.; Pitman, A. The resilience of Australian wind energy to climate change. Environ. Res. Lett. 2018, 13, 024014. [Google Scholar] [CrossRef] [Green Version]
  8. Fan, J.L.; Hu, J.W.; Zhang, X. Impacts of climate change on electricity demand in China: An empirical estimation based on panel data. Energy 2019, 170, 880–888. [Google Scholar] [CrossRef]
  9. Jiang, Y.; Luo, Y.; Zhao, Z.; Tao, S. Changes in wind speed over China during 1956–2004. Theor. Appl. Climatol. 2010, 99, 421. [Google Scholar] [CrossRef]
  10. Archer, C.L.; Jacobson, M.Z. Evaluation of global wind power. J. Geophys. Res. Atmos. 2005, 110. [Google Scholar] [CrossRef] [Green Version]
  11. Yu, L.; Zhong, S.; Bian, X.; Heilman, W.E. Climatology and trend of wind power resources in China and its surrounding regions: A revisit using Climate Forecast System Reanalysis data. Int. J. Climatol. 2016, 36, 2173–2188. [Google Scholar] [CrossRef]
  12. Lu, X.; McElroy, M.B.; Kiviluoma, J. Global potential for wind-generated electricity. Proc. Natl. Acad. Sci. USA 2009, 106, 10933–10938. [Google Scholar] [CrossRef] [PubMed] [Green Version]
  13. Cannon, D.J.; Brayshaw, D.J.; Methven, J.; Coker, P.J.; Lenaghan, D. Using reanalysis data to quantify extreme wind power generation statistics: A 33 year case study in Great Britain. Renew. Energy 2015, 75, 767–778. [Google Scholar] [CrossRef] [Green Version]
  14. Wind Power Statistics. 2020. Available online: https://www.thewindpower.net/country_zones_en_9_china.php.Last (accessed on 30 April 2020).
  15. Chen, L.; Pryor, S.C.; Li, D. Assessing the performance of Intergovernmental Panel on Climate Change AR5 climate models in simulating and projecting wind speeds over China. J. Geophys. Res. Atmos. 2012, 117. [Google Scholar] [CrossRef] [Green Version]
  16. Niu, F.; Li, Z.; Li, C.; Lee, K.H.; Wang, M. Increase of wintertime fog in China: Potential impacts of weakening of the Eastern Asian monsoon circulation and increasing aerosol loading. J. Geophys. Res. Atmos. 2010, 115. [Google Scholar] [CrossRef]
  17. Lin, C.; Yang, K.; Qin, J.; Fu, R. Observed coherent trends of surface and upper-air wind speed over China since 1960. J. Clim. 2013, 26, 2891–2903. [Google Scholar] [CrossRef] [Green Version]
  18. Jiang, Y.; Luo, Y.; Zhao, Z. Maximum wind speed changes over China. Acta Meteorol. Sin. 2013, 27, 63–74. [Google Scholar] [CrossRef]
  19. Clark, R.T.; Philip, E.; Hazel, E.B.T.; Adam, A.S. Skilful seasonal predictions for the European energy industry. Environ. Res. Lett. 2017, 12, 024002. [Google Scholar] [CrossRef]
  20. Gao, M.; Ding, Y.; Song, S.; Lu, X.; Chen, X.; McElroy, M.B. Secular decrease of wind power potential in India associated with warming in the Indian Ocean. Sci. Adv. 2018, 4, 5256. [Google Scholar] [CrossRef] [Green Version]
  21. Carvalho, D.; Rocha, A.; Gómez-Gesteira, M.; Santos, C.S. Potential impacts of climate change on European wind energy resource under the CMIP5 future climate projections. Renew. Energy 2017, 101, 29–40. [Google Scholar] [CrossRef]
  22. Breslow, P.B.; Sailor, D.J. Vulnerability of wind power resources to climate change in the continental United States. Renew. Energy 2002, 27, 585–598. [Google Scholar] [CrossRef]
  23. Rahim, M.; Yoshino, J.; Doi, Y.; Yasuda, T. Effects of global warming on the average wind speed field in Central Japan. J. Sustain. Energy Environ. 2012, 3, 165–171. [Google Scholar]
  24. Tobin, I.; Vautard, R.; Balog, I.; Bréon, F.M.; Jerez, S.; Ruti, P.M.; Yiou, P. Assessing climate change impacts on European wind energy from ENSEMBLES high-resolution climate projections. Clim. Chang. 2015, 128, 99–112. [Google Scholar] [CrossRef]
  25. Pryor, S.C.; Barthelmie, R.J.; Clausen, N.E.; Drews, M.; MacKellar, N.; Kjellström, E. Analyses of possible changes in intense and extreme wind speeds over northern Europe under climate change scenarios. Clim. Dyn. 2012, 38, 189–208. [Google Scholar] [CrossRef]
  26. Hueging, H.; Haas, R.; Born, K.; Jacob, D.; Pinto, J.G. Regional changes in wind energy potential over Europe using regional climate model ensemble projections. J. Appl. Meteorol. Climatol. 2013, 52, 903–917. [Google Scholar] [CrossRef] [Green Version]
  27. Zheng, C.W.; Li, X.Y.; Luo, X.; Chen, X.; Qian, Y.H.; Zhang, Z.H.; Gao, Z.S.; Du, Z.B.; Gao, Y.B.; Chen, Y.G. Projection of Future Global Offshore Wind Energy Resources using CMIP Data. Atmos. Ocean 2019, 57, 134–148. [Google Scholar] [CrossRef]
  28. De Winter, R.C.; Sterl, A.; Ruessink, B.G. Wind extremes in the North Sea Basin under climate change: An ensemble study of 12 CMIP5 GCMs. J. Geophys. Res. Atmos. 2013, 118, 1601–1612. [Google Scholar] [CrossRef] [Green Version]
  29. Ren, D. Effects of global warming on wind energy availability. J. Renew. Sustain. Energy 2010, 2, 052301. [Google Scholar] [CrossRef] [Green Version]
  30. Zha, J.; Wu, J.; Zhao, D.; Fan, W. Future projections of the near-surface wind speed over eastern China based on CMIP5 datasets. Clim. Dyn. 2020, 54, 2361–2385. [Google Scholar] [CrossRef]
  31. Peters, G.P.; Andrew, R.M.; Boden, T.; Canadell, J.G.; Ciais, P.; Le Quéré, C.; Marland, G.; Raupach, M.R.; Wilson, C. The challenge to keep global warming below 2 C. Nat. Clim. Chang. 2012, 3, 4. [Google Scholar] [CrossRef]
  32. Dee, D.P.; Uppala, S.M.; Simmons, A.J.; Berrisford, P.; Poli, P.; Kobayashi, S.; Bechtold, P. The ERA-Interim reanalysis: Configuration and performance of the data assimilation system. Q. J. R. Meteorol. Soc. 2011, 137, 553–597. [Google Scholar] [CrossRef]
  33. Available online: https://portal.enes.org/data/enes-model-data/cmip5 (accessed on 30 April 2020).
  34. Available online: https://pcmdi.llnl.gov/mips/cmip5/data-portal.html (accessed on 30 April 2020).
  35. Jones, P.W. First-and second-order conservative remapping schemes for grids in spherical coordinates. Mon. Weather Rev. 1999, 127, 2204–2210. [Google Scholar] [CrossRef]
  36. Akinsanola, A.A.; Zhou, W. Projections of West African summer monsoon rainfall extremes from two CORDEX models. Clim. Dyn. 2019, 52, 2017–2028. [Google Scholar] [CrossRef]
  37. Abolude, A.T.; Zhou, W. A Comparative Computational Fluid Dynamic Study on the Effects of Terrain Type on Hub-Height Wind Aerodynamic Properties. Energies 2019, 12, 83. [Google Scholar] [CrossRef] [Green Version]
  38. Frank, C.W.; Pospichal, B.; Wahl, S.; Keller, J.D.; Hense, A.; Crewell, S. The added value of high resolution regional reanalyses for wind power applications. Renew. Energy 2020, 148, 1094–1109. [Google Scholar] [CrossRef]
  39. Kikumoto, R.H.; Ooka, H.; Sugawara, J. Lim Observational study of power law approximation of wind profiles within an urban boundary layer for various wind conditions. J. Wind Eng. Ind. Aerodyn. 2017, 164, 13–21. [Google Scholar] [CrossRef]
  40. Albani, A.; Ibrahim, M.Z. Wind Energy Potential and Power Law Indexes Assessment for Selected Near-Coastal Sites in Malaysia. Energies 2017, 10, 307. [Google Scholar] [CrossRef] [Green Version]
  41. Emeksiz, C.; Cetin, T. In case study: Investigation of tower shadow disturbance and wind shear variations effects on energy production, wind speed and power characteristics. Sustain. Energy Technol. Assess. 2019, 35, 148–159. [Google Scholar] [CrossRef]
  42. Liao, S.; Liu, K.; Li, Z. Estimation of grid based spatial distribution of wind energy resource in China. Geo Inf. Sci. 2008, 10, 551–556. [Google Scholar]
  43. Wang, Z.; Ding, Y.; He, J.; Yu, J. An updating analysis of the climate change in China in recent 50 years. Acta Meteorol. Sin. 2004, 62, 228–236. (In Chinese) [Google Scholar]
  44. Gastineau, G.; Soden, B.J. Model projected changes of extreme wind events in response to global warming. Geophys. Res. Lett. 2009, 36. [Google Scholar] [CrossRef] [Green Version]
  45. Jurasz, J.; Canales, F.A.; Kies, A.; Guezgouz, M.; Beluco, A. A review on the complementarity of renewable energy sources: Concept, metrics, application and future research directions. Sol. Energy 2020, 195, 703–724. [Google Scholar] [CrossRef]
Figure 1. Details of study area domain and locations of the two regions (i.e., Rg. A and Rg. B) in China. The shading indicates terrain elevation in meters while the boxes show the longitudinal and latitudinal extents of the selected regions.
Energies 13 02417 g001
Figure 2. Mean wind speed in m/s extrapolated to 90 m above ground level height for the historical period of 1950–1980 for the selected models and the ensemble mean.
Energies 13 02417 g002
Figure 3. Spatial distribution of mean wind speed (m/s) extrapolated to 90 m above ground level for the current period of 1981–2005 for the CMIP5 models, their ensemble mean, and ERA-Interim.
Energies 13 02417 g003
Figure 4. Spatial bias in 90 m hub-height mean wind speed (m/s) between the CMIP5 models, their ensemble mean and ERA-Interim from 1981–2005.
Energies 13 02417 g004
Figure 5. Projected multimidel meanchanges in mean WPD at 90 m hub-height in (W/m2) for four future time slices relative to the period 1981–2005 under the RCP8.5 scenario.
Energies 13 02417 g005
Figure 6. Seasonal mean wind speed for regions A and B from 2021–2040, 2041–2060, 2061–2080, and 2081–2100 in winter (DJF), spring (MAM), summer (JJA) and autumn (SON) from top right to bottom left respectively under RCP8.5 scenario.
Energies 13 02417 g006
Table 1. Details and characteristics of CMIP5 models used.
Model NameCountry/AffiliationHorizontal Resolution (°lat × °lon)
BCC_CSM 1.1(m)Beijing Climate Center, China2.79 × 2.81
BNU-ESMCollege of Global Change and Earth System Science, Beijing Normal University China2.79 × 2.81
CanESM2Canadian Centre for Climate Modelling and Analysis, Canada2.79 × 2.81
CMCC-CMSCentro Euro-Mediterraneo per I Cambiamenti Climatici, Italy3.71 × 3.75
CNRM-CM5Centre National de Recherches Meteorologiques/Centre Europeen de Recherche et Formation Avancees en Calcul Scientifique, France1.40 × 1.41
IPSL-CM5A-LRInstitut Pierre-Simon Laplace, France1.89 × 3.75
MIROC-ESM-CHEMAtmosphere and Ocean Research Institute (The University of Tokyo), National Institute for Environmental Studies, and Japan Agency for Marine-Earth Science and Technology, Japan2.79 × 2.81
MPI-ESM-MRMax Planck Institute for Meteorology, Germany1.87 × 1.88
MPI-ESM-LRMax Planck Institute for Meteorology, Germany1.87 × 1.88
MRI-CGCM3Meteorological Research Institute, Japan1.12 × 1.13

