Analysis of the Effect of Using External Venetian Blinds on the Thermal Comfort of Users of Highly Glazed Office Rooms in a Transition Season of Temperate Climate—Case Study


Abstract
1. Introduction
- How can solar gain affect thermal comfort conditions in highly glazed rooms in the transition season of temperate climates?
- Will the use of external shading devices in highly glazed rooms help to maintain conditions comfortable for users?
- What is the degree of thermal comfort improvement owing to user behaviour involving reduction in clothing insulation characteristics?
2. Materials and Methods
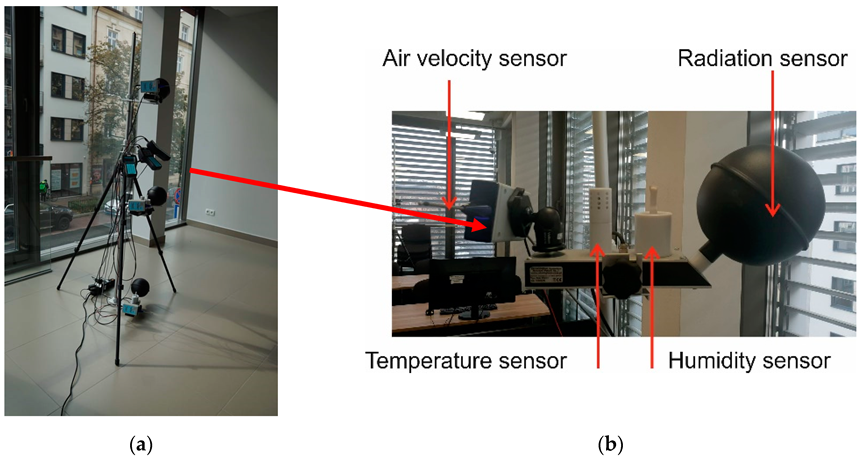
- ta
- ambient air temperature;
- tg
- temperature of blackened sphere (heat radiation meter)—the black sphere, according to the standards, should have a diameter of 15 cm;
- tnw
- natural wet-bulb temperature;
- RH
- relative air humidity;
- Va
- air flow rate.
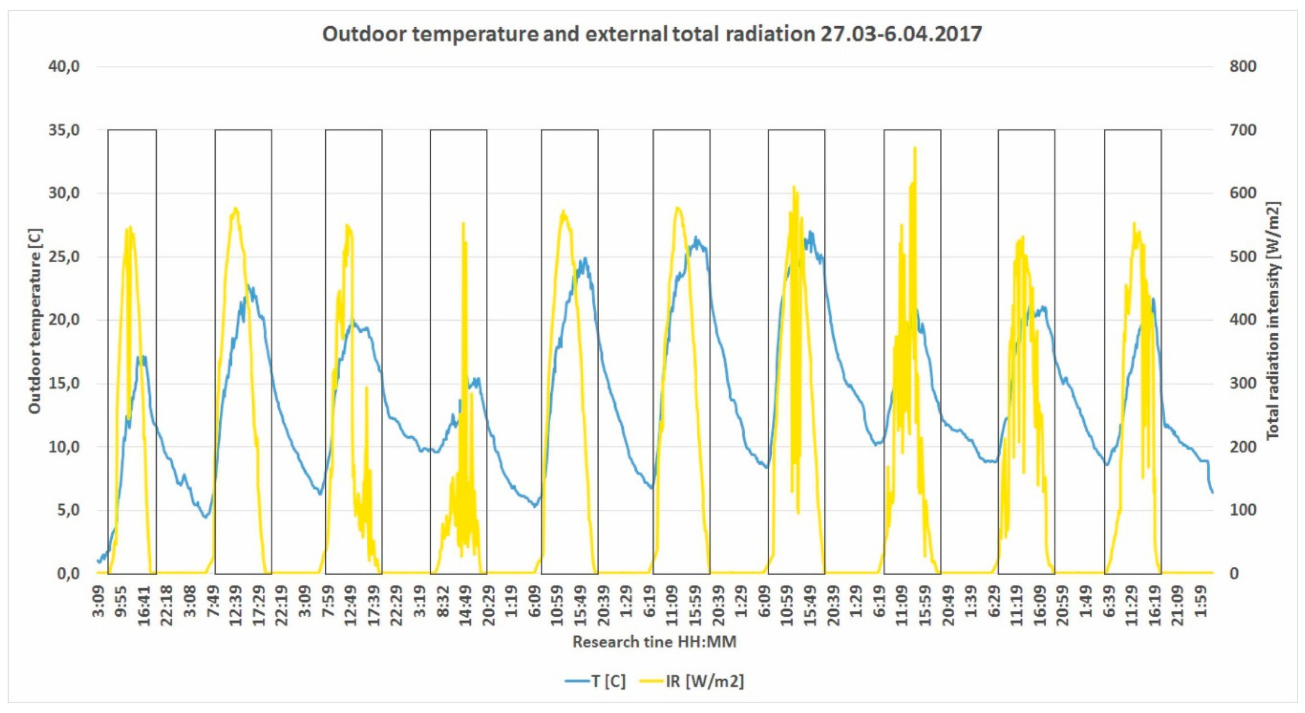
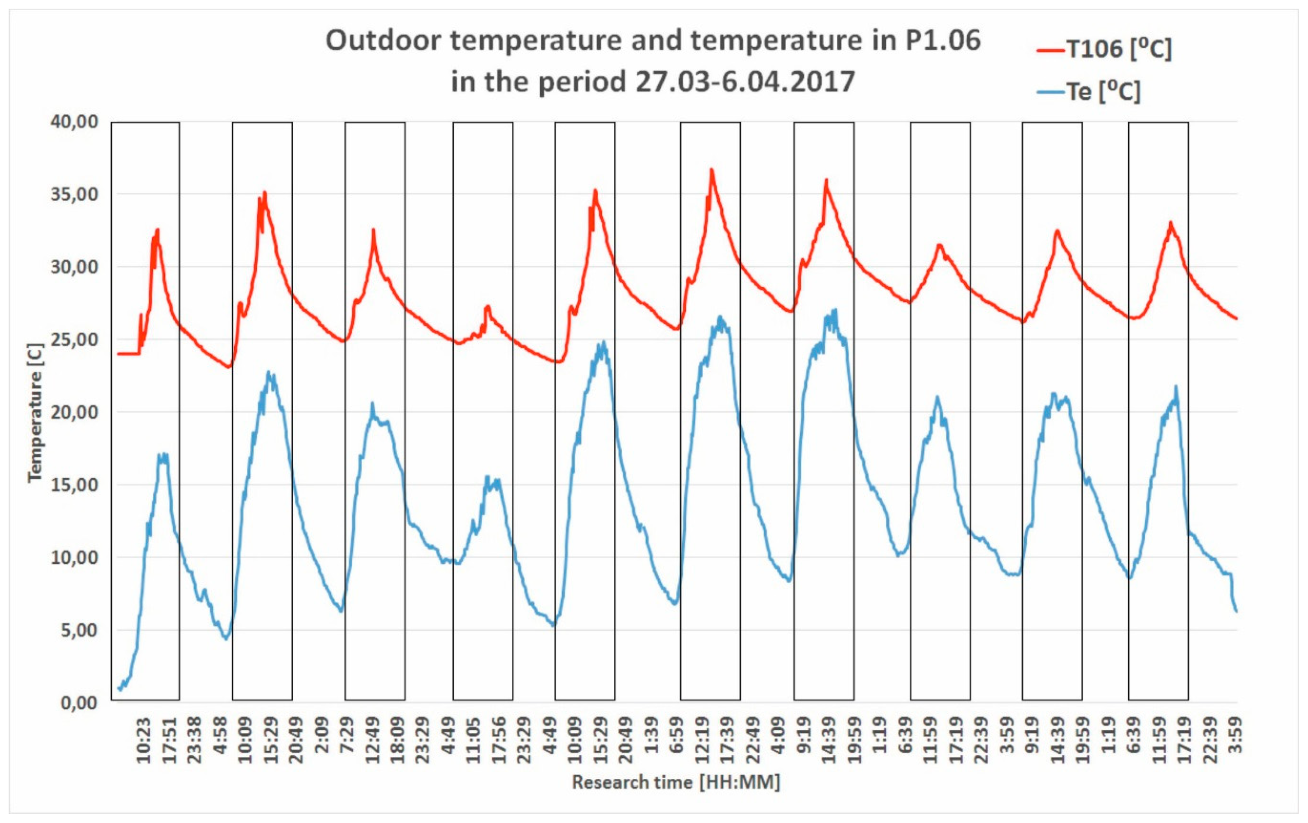
- Outdoor temperature Te °C
- Relative humidity (outdoor) RHe %
- Outdoor air velocity ae m/s
- Total outdoor radiation intensity Ie W/m2
3. Results
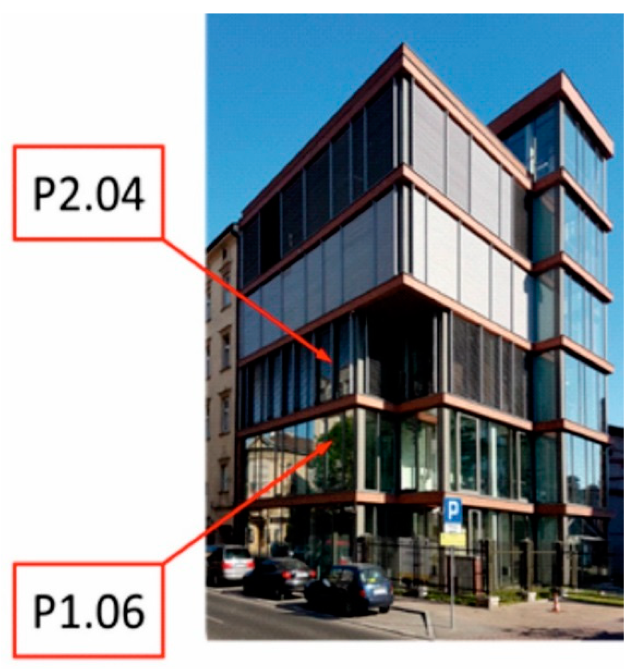
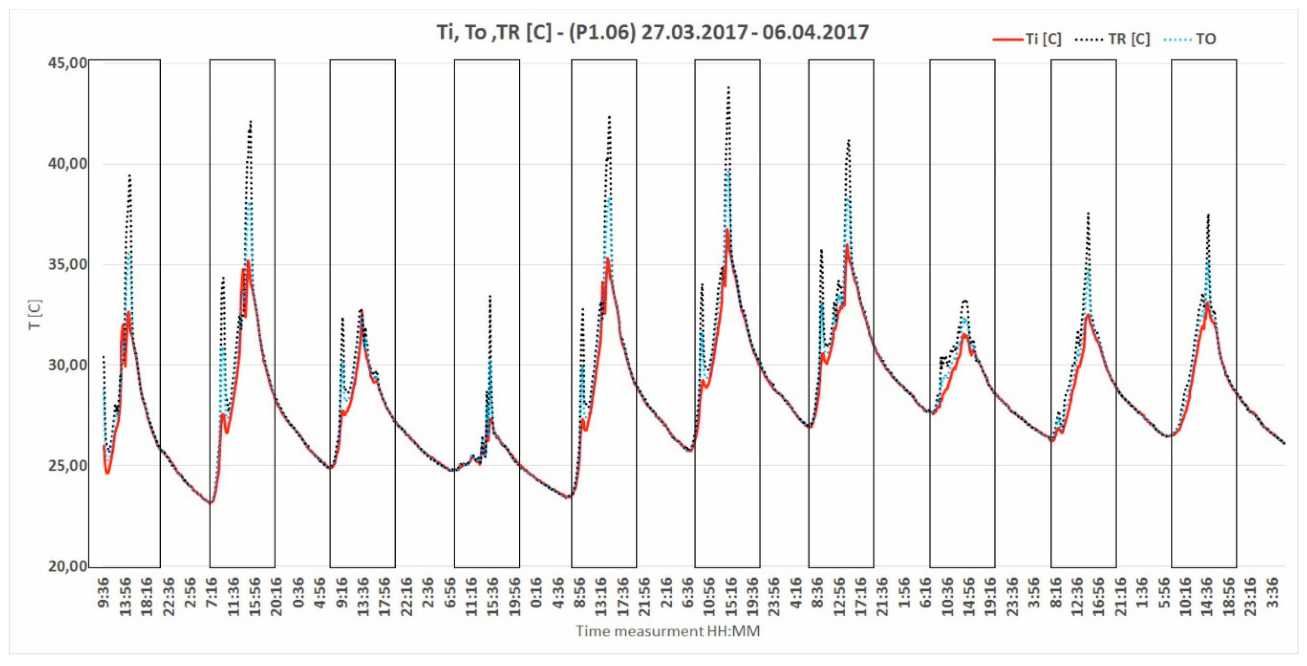
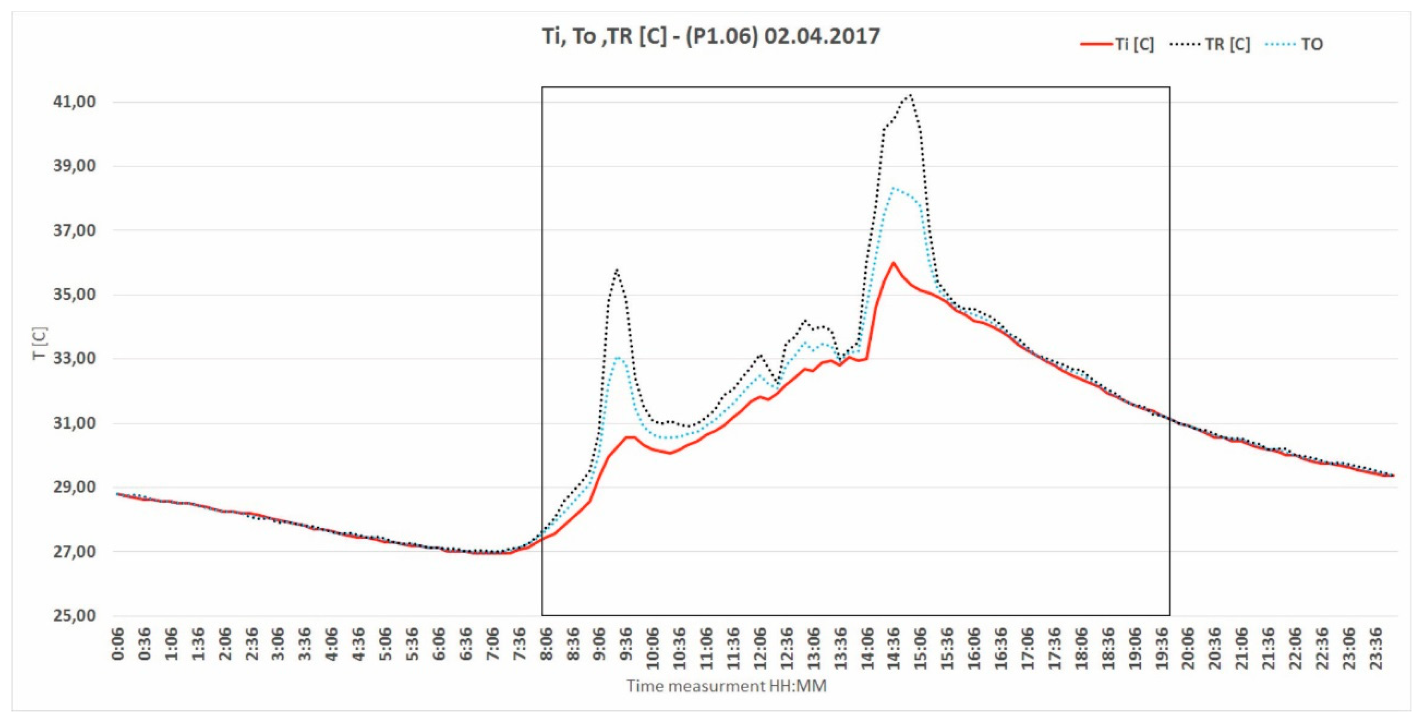
3.1. Room P1.06
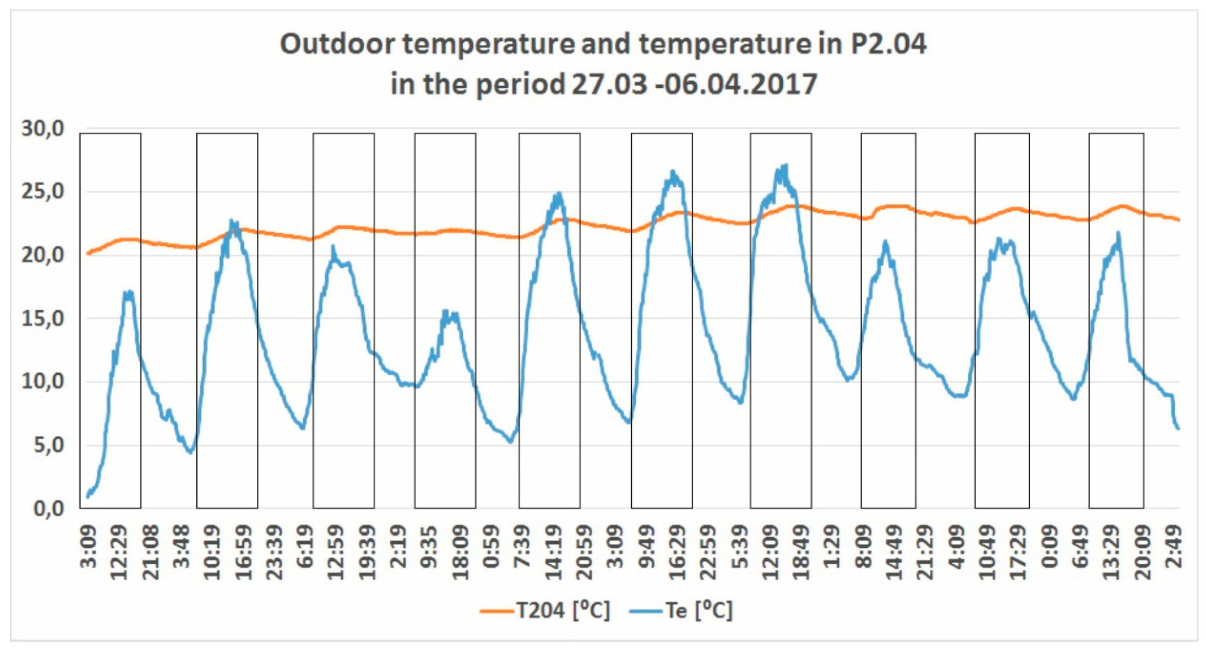
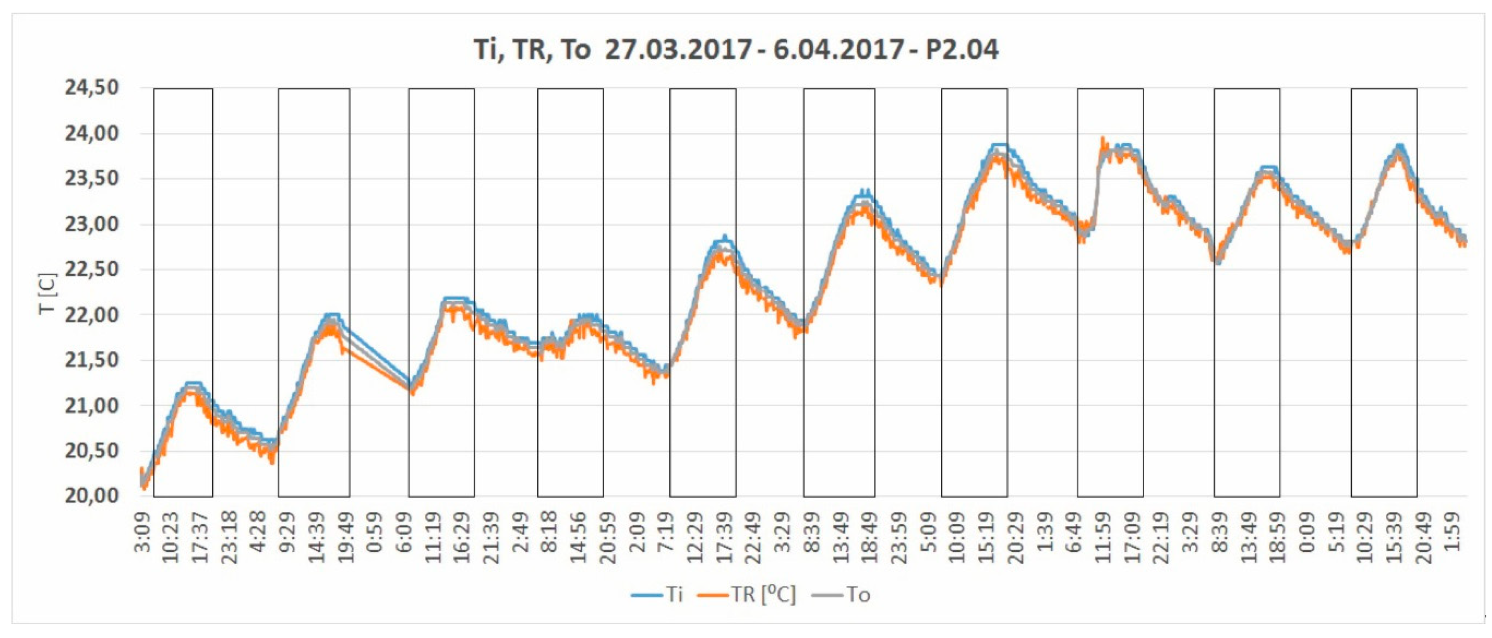
3.2. Room P2.04
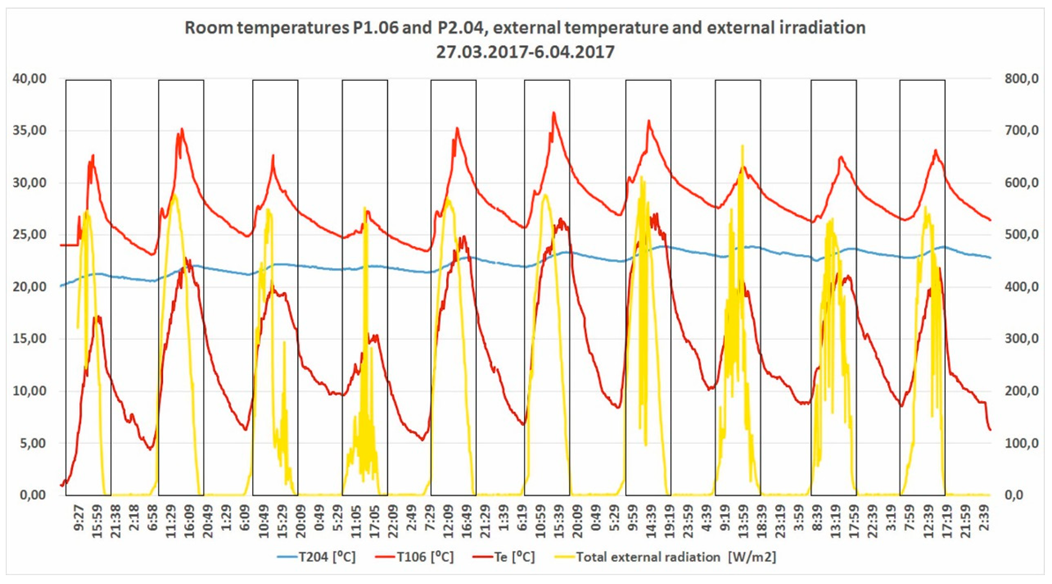
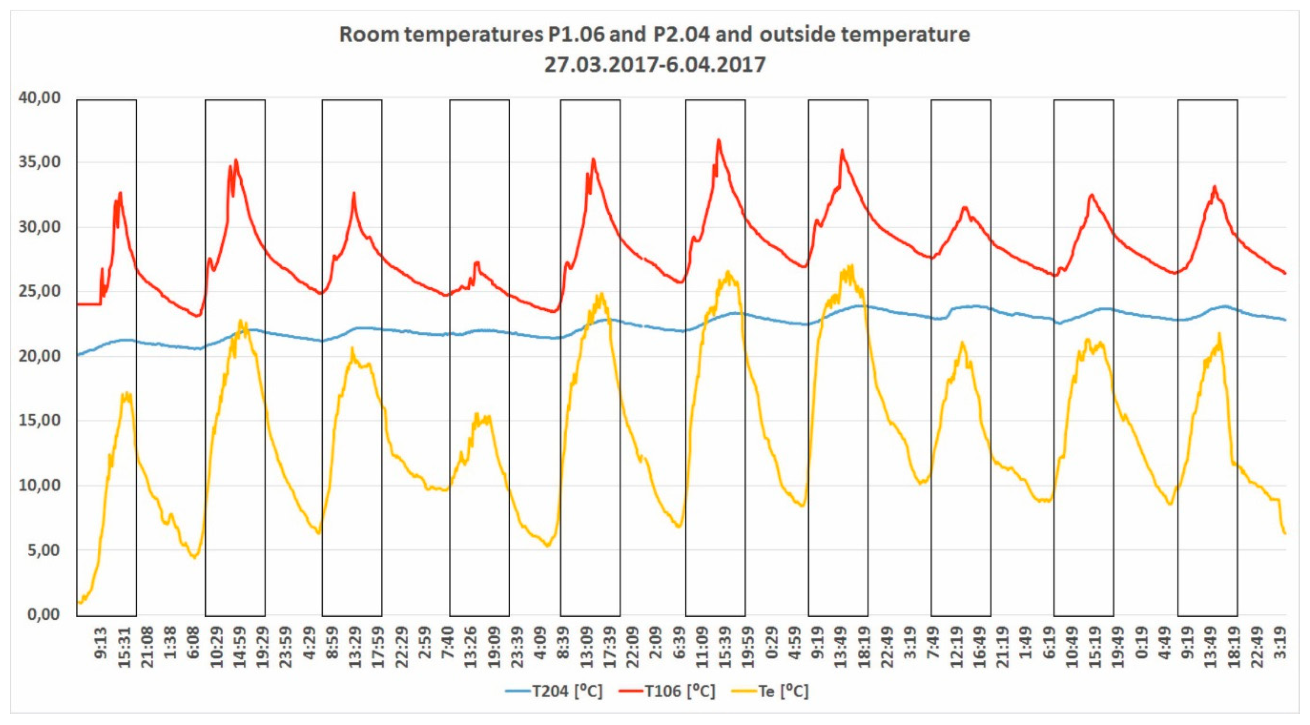
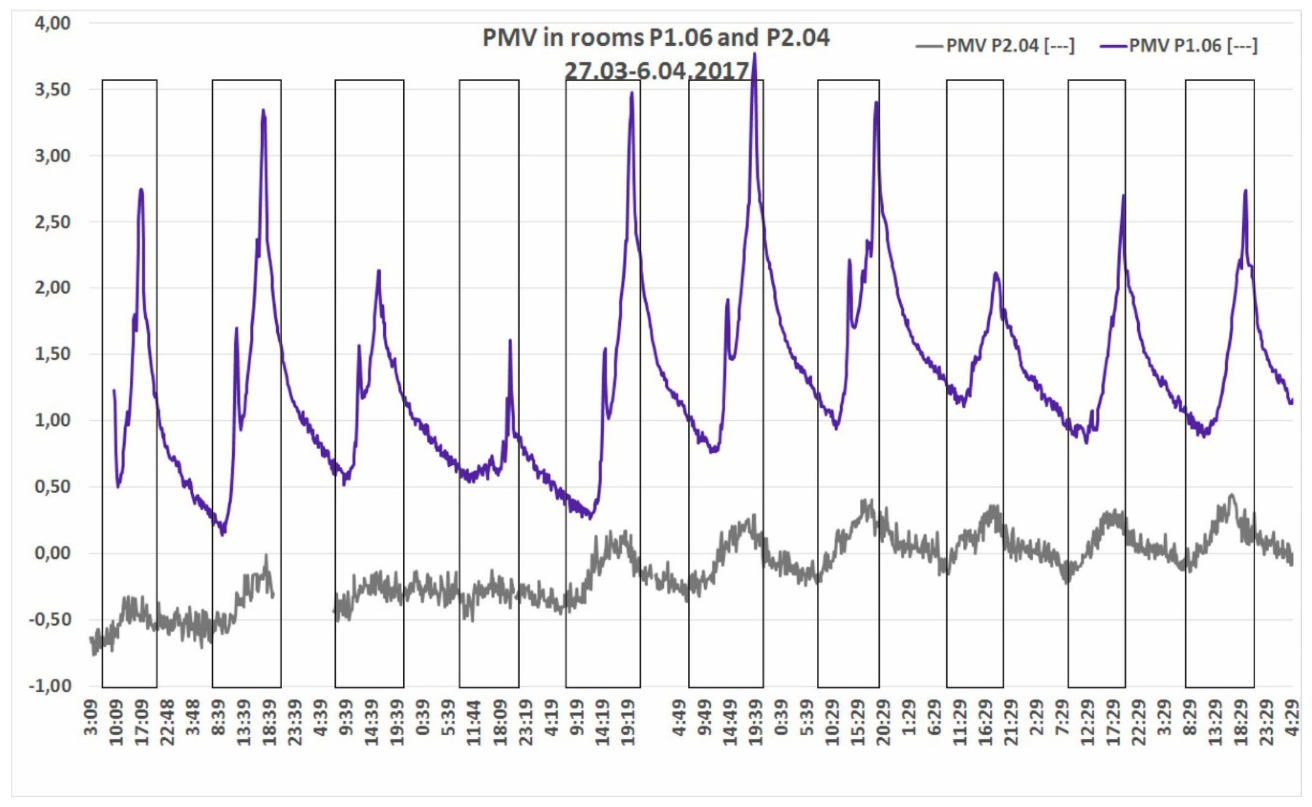
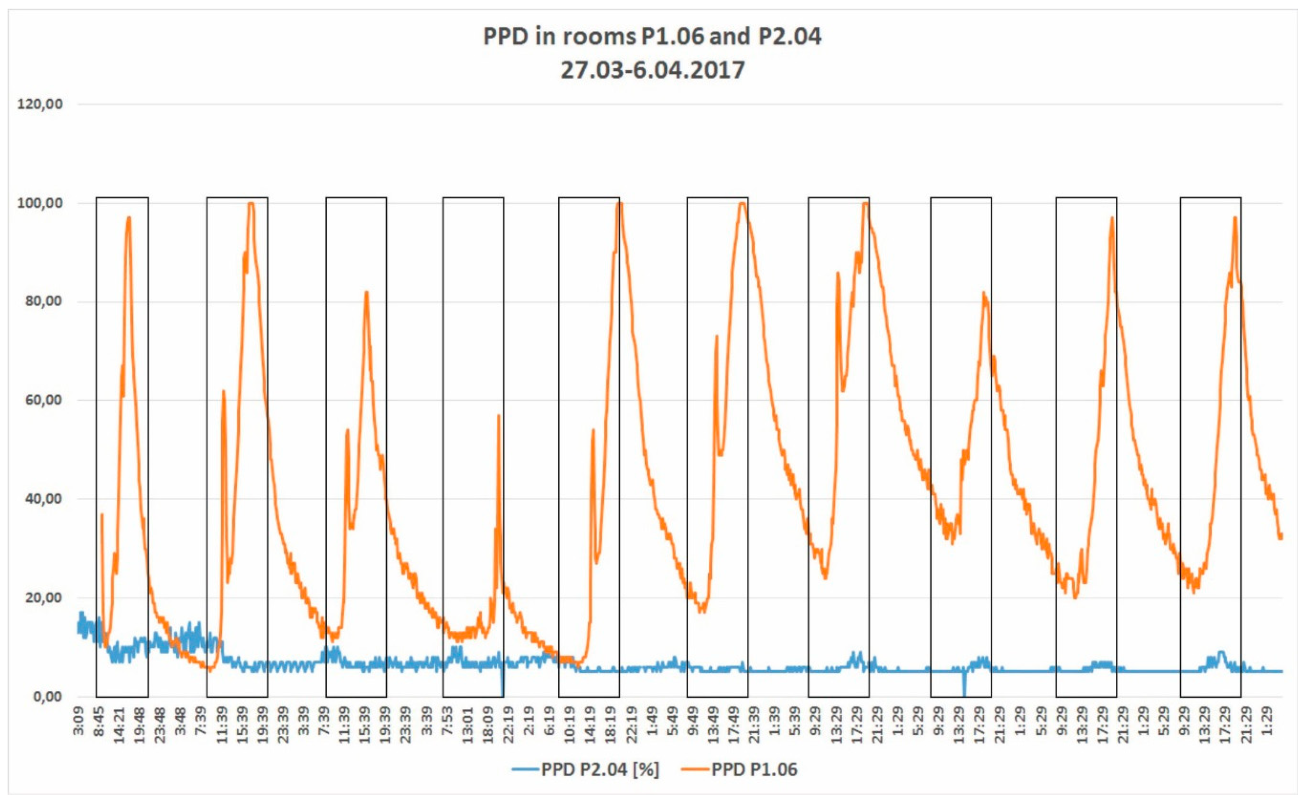
3.3. Comparison of Results
4. Discussion
5. Conclusions
Author Contributions
Funding
Acknowledgments
Conflicts of Interest
References
- Dyrective 2002/91/UE; DIRECTIVE 2002/91/EC of the European Parliament and of the Council of 16 December 2002 on the Energy Performance of Buildings. 2002. Available online: https://eur-lex.europa.eu/legal-content/PL/TXT/?uri=celex%3A32002L0091 (accessed on 19 December 2019).
- Directive 2010/31/EU of the European Parliament and of the Council of 19 May 2010 on the Energy Performance of Buildings. Available online: https://eur-lex.europa.eu/legal-content/EN/TXT/?uri=CELEX%3A32010L0031 (accessed on 19 December 2019).
- OBWIESZCZENIE MINISTRA INFRASTRUKTURY I RO ZWOJU1) z dnia 17 lipca 2015 r. w Sprawie ogłoszenia Jednolitego Tekstu Rozporządzenia Ministra Infrastruktury w Sprawie Warunków Technicznych, Jakim Powinny Odpowiadać Budynki i ich Usytuowanie. Available online: http://prawo.sejm.gov.pl/isap.nsf/DocDetails.xsp?id=WDU20150001422 (accessed on 19 December 2019).
- Wymagania Dla Budynków Pasywych. Available online: http://www.pibp.pl/ (accessed on 15 September 2019).
- Bao, X.; Tian, Y.; Yuan, L.; Cui, H.; Tang, W.; Fung, W.H.; Qi, H. Development of high performance PCM cement composites for passive solar buildings. Energy Build. 2019, 194, 33–45. [Google Scholar] [CrossRef]
- Kwasnowski, P.; Fedorczak-Cisak, M.; Knap, K. Problems of technology of energy-saving buildings and their impact on energy efficiency in buildings. In Proceedings of the 2017 IOP Conference Series: Materials Science and Engineering, Volume 245: World Multidisciplinary Civil Engineering-Architecture-Urban Planning Symposium—WMCAUS, Prague, Czech Republic, 12–16 June 2017; Available online: https://iopscience.iop.org/article/10.1088/1757-899X/245/7/072043/pdf (accessed on 19 December 2019). [CrossRef]
- Fanger, P.O. Thermal Comfort: Analysis and Applications in Environmental Engineering; McGraw-Hill: New York, NY, USA, 1972; ISBN 9780070199156. [Google Scholar]
- Fanger, P.O. Analysis and Applications in Environmental Engineering; McGraw-Hill Book Company: New York, NY, USA, 1970; ISBN 0070199159. [Google Scholar]
- ISO Standard 7730. Ergonomics of the Thermal Environment-Analytical Determination and Interpretation of Thermal Comfort Using Calculation of the PMV and PPD Indices and Local Thermal Comfort Criteria; International Organization for Standardizati: Geneva, Switzerland, 2005. [Google Scholar]
- PN-EN 15251:2012—Wersja Polska. Available online: http://sklep.pkn.pl/pn-en-15251-2012p.html (accessed on 19 September 2019).
- PN-EN 16798-1:2019-06—Wersja Angielska. Available online: http://sklep.pkn.pl/pn-en-16798-1-2019-06e.html (accessed on 19 September 2019).
- Yao, R.; Li, B.; Liu, J. A theoretical adaptive model of thermal comfort—Adaptive predicted mean vote (aPMV). Build. Environ. 2009, 44, 2089–2096. [Google Scholar] [CrossRef]
- Van Hoof, J.; Mazej, M.; Hensen, J.L.M. Thermal comfort: Research and practice. Front. Biosci. 2010, 15, 765–788. [Google Scholar] [CrossRef]
- Mıhlayanlar, E.; Öztuna, S.; Büyükakın, K. Investigation of thermal comfort conditions in higher education facilities: A case study for engineering faculty in edirne. TEM J. 2017, 6, 71–79. [Google Scholar]
- Yang, L.; Yan, H.; Lam, J.C. Thermal comfort and building energy consumption implications—A review. Appl. Energy 2014, 115, 164–173. [Google Scholar] [CrossRef]
- Lai, A.C.K.; Mui, K.W.; Wong, L.T.; Law, L.Y. An evaluation model for indoor environmental quality (IEQ) acceptance in residential buildings. Energy Build. 2009, 41, 930–936. [Google Scholar] [CrossRef]
- Piasecki, M.; Kostyrko, K.; Pykacz, S. Indoor environmental quality assessment: Part 1: Choice of the indoor environmental quality sub-component models. J. Build. Phys. 2017, 41, 264–289. [Google Scholar] [CrossRef]
- Piasecki, M.; Barbara Kostyrko, K. Indoor environmental quality assessment, part 2: Model reliability analysis. J. Build. Phys. 2018, 42, 288–315. [Google Scholar] [CrossRef]
- Nimlyat, P.S. Indoor environmental quality performance and occupants’ satisfaction [IEQPOS] as assessment criteria for green healthcare building rating. Build. Environ. 2018, 144, 598–610. [Google Scholar] [CrossRef]
- Damiati, S.A.; Zaki, S.A.; Wonorahardjo, S.; Ali, M.S.M.; Rijal, H.B. Thermal comfort survey in office buildings in Bandung, Indonesia. In Proceedings of the International Joint Conference SENVAR-iNTA-AVAN, Bahru, Malaysia, 24–26 November 2015; pp. 53–64. [Google Scholar]
- Zmeureanu, R.; Bessoudo, M.; Tzempelikos, A.; Athienitis, A. The impact of shading on thermal comfort conditions in perimeter zones with glass facades. In Proceedings of the 2nd PALENC Conference and 28th AIVC Conference on Building Low Energy Cooling and Advanced Ventilation Technologies in the 21st Century, Crete, Greece, 27–29 September 2007; pp. 1072–1077. [Google Scholar]
- Palmer, J.; Bennetts, H.; Pullen, S.; Zuo, J.; Ma, T.; Chileshe, N. Adaptation of Australian houses and households to future heat waves. In Proceedings of the 7th Australasian Housing Researchers’ Conference, AHRC 2013, Fremantle, Australia, 6–8 February 2013. [Google Scholar]
- Kisilewicz, T. Passive control of indoor climate conditions in low energy buildings. Energy Procedia 2015, 78, 49–54. [Google Scholar] [CrossRef][Green Version]
- Kajtár, L.; Erdősi, I.; Bakó-Bíró, Z. Thermal and air quality comfort of office buildings based on new principles of dimensioning in hungary. Periodica Polytechnica Ser. Mech. Eng. 2000, 44, 265–274. [Google Scholar]
- Kavgic, M.; Mumovic, D.; Stevanovic, Z.; Young, A. Analysis of thermal comfort and indoor air quality in a mechanically ventilated theatre. Energy Build. 2008, 40, 1334–1343. [Google Scholar] [CrossRef]
- Kisilewicz, T. Wpływ izolacyjnych, Dynamicznych i Spektralnych Właściwości Przegród na Bilans Cieplny Budynków Energooszczędnych; Cracow University of Technology Publisher: Kraków, Poland, 2008; ISSN 0860-097X. [Google Scholar]
- Alwetaishi, M. Impact of glazing to wall ratio in various climatic regions: A case study. J. King Saud Univ. Eng. Sci. 2019, 31, 6–18. [Google Scholar] [CrossRef]
- Lin, Y.; Zhou, S.; Yang, W.; Li, C.Q. Design optimization considering variable thermal mass, insulation, absorptance of solar radiation, and glazing ratio using a prediction model and genetic algorithm. Sustainability 2018, 10, 336. [Google Scholar] [CrossRef]
- Palmero-Marrero, A.I.; Oliveira, A.C. Effect of louver shading devices on building energy requirements. Appl. Energy 2010, 87, 2040–2049. [Google Scholar] [CrossRef]
- Bellia, L.; Marino, C.; Minichiello, F.; Pedace, A. An overview on solar shading systems for buildings. Energy Procedia 2014, 62, 309–317. [Google Scholar] [CrossRef]
- Atzeri, A.; Cappelletti, F.; Gasparella, A. Internal versus external shading devices performance in office buildings. Energy Procedia 2014, 45, 463–472. [Google Scholar] [CrossRef]
- Nowak, K.; Nowak-Dzieszko, K.; Rojewska-Warchal, M. Thermal comfort of the rooms in the designing of commercial buildings. In Research and Applications in Structural Engineering, Mechanics and Computation—Proceedings of the 5th International Conference on Structural Engineering, Mechanics and Computation (SEMC) 2013, Cape Town, South Africa, 2–4 September 2013; CRC Press Taylor&Francis Group: Boca Raton, FL, USA, 2013; pp. 1819–1824. [Google Scholar]
- PN-EN ISO 7726:2002 Ergonomics of the Thermal Environment—Instruments for Measuring Physical Quantities (ISO 7726:1998). Available online: https://www.sis.se/api/document/preview/615884/ (accessed on 19 December 2019).
- DIN EN 15251—European Standards. Indoor Environmental Input Parameters for Design and Assessment of Energy Performance of Buildings Addressing Indoor Air Quality, Thermal Environment, Lighting and Acoustics. Available online: https://www.en-standard.eu/din-en-15251-indoor-environmental-input-parameters-for-design-and-assessment-of-energy-performance-of-buildings-addressing-indoor-air-quality-thermal-environment-lighting-and-acoustics/ (accessed on 19 December 2019).
- PN-EN 16798-1:2019-06 Energy Performance of Buildings—Ventilation for Buildings—Part 1: Indoor Environmental Input Parameters for Design and Assessment of Energy Performance of Buildings Addressing Indoor Air Quality, Thermal Environment, Lighting a. 2019. Available online: https://shop.bsigroup.com/ProductDetail/?pid=000000000030297474 (accessed on 19 December 2019).
- Al-Tamimi, N.A.; Fadzil, S.F.S. The potential of shading devices for temperature reduction in high-rise residential buildings in the tropics. Procedia Eng. 2011, 21, 273–282. [Google Scholar] [CrossRef]
- Evola, G.; Gullo, F.; Marletta, L. The role of shading devices to improve thermal and visual comfort in existing glazed buildings. Procedia Eng. 2017, 134, 346–355. [Google Scholar] [CrossRef]
- Li, N.; Li, J.; Fan, R.; Jia, H. Probability of occupant operation of windows during transition seasons in office buildings. Renew. Energy 2015, 73, 84–91. [Google Scholar] [CrossRef]
- Tanner, R.A.; Henze, G.P. Stochastic control optimization for a mixed mode building considering occupant window opening behaviour. J. Build. Perform. Simul. 2014, 7, 427–444. [Google Scholar] [CrossRef]
- Ning, H.; Wang, Z.; Ren, J.; Ji, Y. Thermal comfort and thermal adaptation between residential and office buildings in severe cold area of China. Procedia Eng. 2015, 121, 365–373. [Google Scholar] [CrossRef]


| Type of Partition | MLBE Building U Parameters W/m2K | Effective Requirements in Poland WT2017 | Requirements for NZEB Buildings in Poland (Since 2021) WT2021 | Requirements for Passive Buildings |
|---|---|---|---|---|
| External walls: | 0.11 | 0.23 | 0.20 | 0.15 |
| Roofs and floors: | 0.12 | 0.18 | 0.15 | 0.15 |
| Floor on the ground | 0.11 | 0.30 | 0.30 | 0.15 |
| Windows | 0.8 | 1.10 | 0.90 | 0.80 |
| g = 0.6 [-] |
| Type of Sensor | Measurement Range | Scale | Accuracy |
|---|---|---|---|
| Temperature Sensors | −20 °C + 50 °C (wet thermometer 0 °C + 50 °C) | 0.01 °C | ±0.4 °C |
| Humidity Sensors | 0–100% | 0.1 RH (relative humidity) | ±2% RH (relative humidity) |
| Air Velocity Sensors | 0–5 m/s | 0.01 m/s | for 0–1 m/s +/0.05 + 0.05 × Va m/s, for 1–5 m/s ± 5% |
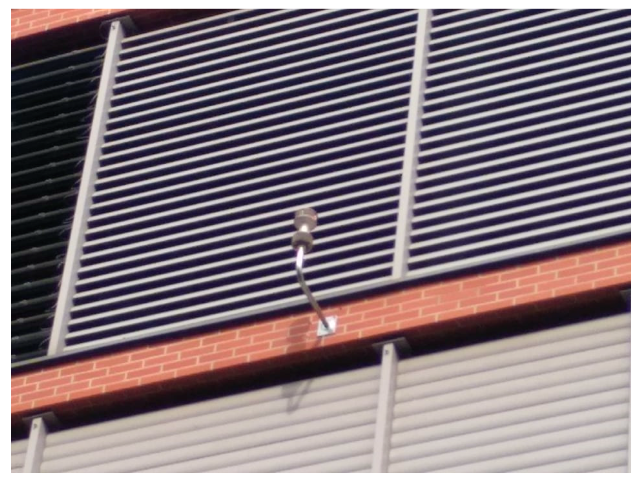
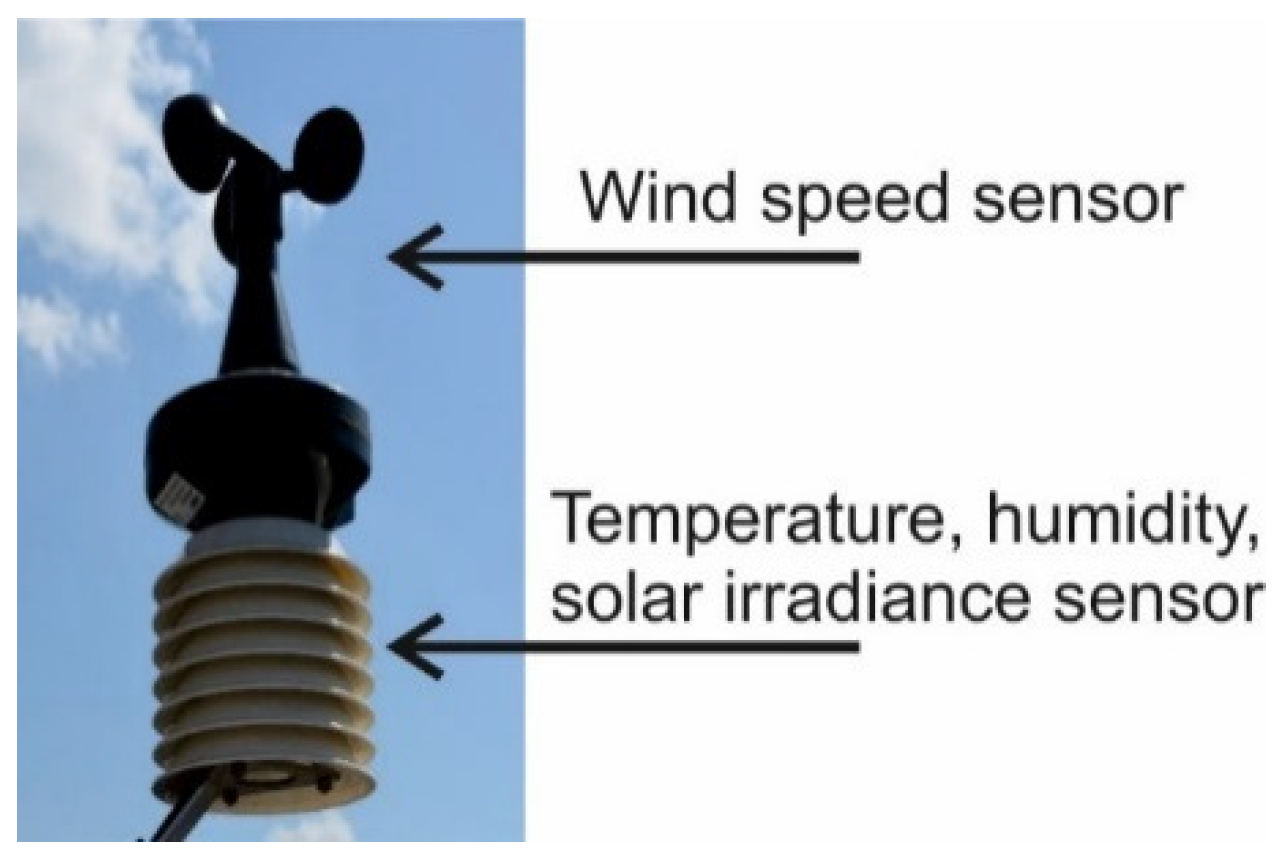
| No. | Location | Measured Parameter | Measurement Scope | Accuracy |
|---|---|---|---|---|
| 1 | Weather station on the southern façade | Wind speed ae m/s | 0.00–50.00 m/s (possible max. = 60) | +/−1.0 m/s or +/−5% |
| 2 | Relative humidity (outdoor) RHe % | 0 ÷ 90% | +/−3% | |
| 3 | Relative humidity (outdoor) RHe % | 90 ÷ 100% | +/−4% | |
| 4 | Outdoor temperature Te °C | −40 ÷ 60 °C | +/−0.5 °C | |
| 5 | Total solar radiation intensity ie W/m2 | 0 ÷ 1500 W/m2 (possible max. = 2000) | +/−5% |
| Room | Clothing Insulation Properties Clo | Metabolism Met |
|---|---|---|
| P1.06 | 1.0 | 1.21 |
| P2.04 | 1.0 | 1.21 |
© 2019 by the authors. Licensee MDPI, Basel, Switzerland. This article is an open access article distributed under the terms and conditions of the Creative Commons Attribution (CC BY) license (http://creativecommons.org/licenses/by/4.0/).
Share and Cite
Fedorczak-Cisak, M.; Nowak, K.; Furtak, M. Analysis of the Effect of Using External Venetian Blinds on the Thermal Comfort of Users of Highly Glazed Office Rooms in a Transition Season of Temperate Climate—Case Study. Energies 2020, 13, 81. https://doi.org/10.3390/en13010081
Fedorczak-Cisak M, Nowak K, Furtak M. Analysis of the Effect of Using External Venetian Blinds on the Thermal Comfort of Users of Highly Glazed Office Rooms in a Transition Season of Temperate Climate—Case Study. Energies. 2020; 13(1):81. https://doi.org/10.3390/en13010081
Chicago/Turabian StyleFedorczak-Cisak, Małgorzata, Katarzyna Nowak, and Marcin Furtak. 2020. "Analysis of the Effect of Using External Venetian Blinds on the Thermal Comfort of Users of Highly Glazed Office Rooms in a Transition Season of Temperate Climate—Case Study" Energies 13, no. 1: 81. https://doi.org/10.3390/en13010081
APA StyleFedorczak-Cisak, M., Nowak, K., & Furtak, M. (2020). Analysis of the Effect of Using External Venetian Blinds on the Thermal Comfort of Users of Highly Glazed Office Rooms in a Transition Season of Temperate Climate—Case Study. Energies, 13(1), 81. https://doi.org/10.3390/en13010081