Article

Analysis of the Failure Modes in the Polymer Electrolyte Fuel Cell Cold-Start Process—Anode Dehydration or Cathode Pore Blockage

1
AML, Department of Engineering Mechanics, Tsinghua University, Beijing 100084, China
2
School of Vehicle and Mobility, Tsinghua University, Beijing 100084, China
3
Dongfeng Motor Corporation Technical Center, Wuhan 430056, China
*
Author to whom correspondence should be addressed.
Energies 2020, 13(1), 256; https://doi.org/10.3390/en13010256
Submission received: 28 October 2019 / Revised: 16 December 2019 / Accepted: 1 January 2020 / Published: 4 January 2020

Abstract

:
In this study, the cold-start failure processes of a polymer electrolyte fuel cell have been investigated numerically for different initial membrane water content λ 0 and the startup current densities I 0 . The result shows that the failure of the cell cold-start process is mostly attributed to the anode dehydration when the cell operates with relatively large current density. However, the failure is dominated by the cathode pore blockage when the cell starts with relatively high initial membrane water content. Corresponding maps for the classification of startup failure modes are plotted on the λ 0 I 0 plane with different startup temperatures. Three zones, including the anode dehydration, the cathode pore blockage, and the ambiguous region, can be observed. They can be distinguished with different startup failure mechanisms. The anode dehydration zone is expanded as the cell startup temperature drops due to the weakening of the membrane water back-diffusion ability. In the ambiguous region, the startup failure phenomena may be either anode dehydration or cathode pore blockage, which depends on the stochastic freezing process of the supercooled water.

1. Introduction

Polymer electrolyte fuel cell (PEFC) is one of the most potential power supplies in the automotive industry due to its high-power density, high efficiency, low operating temperature, and zero-emissions [1]. However, the cell startup from subfreezing temperature (referred to as cold start) is still a significant issue. The electrochemical reaction would be stopped due to gas starvation if the cell temperature cannot grow above the freezing point before the catalyst layer (CL) is fully blocked by ice [1].
In the previous decade, the ice formation and heat transfer inside the PEFC during the cold-start process has been examined comprehensively by both experimental measurement and numerical simulation. In quite a few experimental investigations, the effects of operating conditions [2,3,4,5,6] (e.g., temperature, initial membrane water, and current density) and cell design parameters (e.g., ionomer-to-carbon ratio in CL [7], cathode Pt loading [8], pore diameter of gas diffusion layer (GDL) [9], and micro-porous layer (MPL) [10,11]) on the cell cold-start performance have been the main concern. It has been pointed out that the process of PEFC cold start can be divided into three stages, including the membrane hydration, the ice formation and the ice melting [12]. Based on this experimental evidence, a non-isothermal and multiphase model has been developed to describe the electrochemical and the mass/heat transfer phenomenon inside the PEFC during the cold-start process [13]. The ice formation and melting were both considered. The water vapor is generated in the cathode catalyst layer (CCL) and equilibrated with ionomer/membrane water instantly. Meanwhile, the water vapor can also be transported from CL into GDL and even into the gas channel (GC). When the water vapor is locally saturated, it will de-sublimate to ice [13,14,15,16,17,18,19]. According to the experimental results of the proton conductivity at low temperature [20], Jiao creatively classified the membrane water into the frozen and non-frozen state [21,22,23]. It has been claimed that the non-frozen water could change into the frozen water if it exceeded the membrane (MEM) maximum water content. In all the models mentioned above, the supercooled water, which would exist at subfreezing temperature, has been completely ignored.
Recently, visualization experiments have been carried out with an optical microscope [24,25], X-rays [26,27], and neutron imaging [28,29,30,31] to clarify the water behavior within the PEFC during the cold-start process. The produced water in the liquid state was firstly observed by Ishikawa [24] on the CCL surface with startup temperature at −10 °C. Besides, the liquid water was also observed in cathode GDL at −15 °C and even in cathode GC at −10 °C by Oberholzer [28]. Therefore, it can be concluded that the water inside PEFC is initially in the supercooled state and then freezes into ice due to its thermodynamic instability. The freezing process is more likely to happen due to the fiber breaks, the asperities, or the micro cracks. More than 700 isothermal cold-start experiments have been performed by Biesdorf and his/her collaborators [30,31,32]. The results indicate that for the cell with a small active area, the cold-start process has significant randomness. However, for the cell with a large active area, the cold-start process is reproducible. During the cold-start process, the water pathway from CL toward the flow channel can be created gradually. Once the water pathway is successfully created, the supercooled water can transport along this preferred way, and the cell will run for a long time [30]. This suggests that the existence of supercooled water is of benefit to the cold-start process. More recently, the performance of supercooled water has also been considered in the numerical models [33,34,35]. A one-dimensional model has been established by Yang [33] based on assuming a constant phase change rate between the supercooled water and the ice. The influence of MPL’s hydrophobicity on the cell cold-start performance was the main concern. In our recent work [35], the stochastic freezing process of supercooled water was modeled by introducing a freezing probability function. The cell cold-start processes with various initial and operating conditions have been investigated comprehensively.
Generally, it is well known that the PEFC cold-start process may fail when the pore blockage in CCL or CCL/MPL interface happens. This is the dominant failure mode of the cold-start process when the cell operating current density or current ramping is relatively small. However, it is necessary to increase the startup current density to start the PEFC from −20 °C within the 30 s and to reach 50% of the rated power (DOE targets in 2020) [36]. It has been observed that under the normal operating temperature, the ohmic resistance of the PEFC increased with the increase of operating current density ( I > 1.5   A / c m 2 ) [37]. The local dehydration of the membrane in the anode side has been believed to be responsible for this phenomenon [38]. Practically, for the cold-start process, gas purge is generally performed before the startup, and the inlet gas is usually not humidified. The PEFC would easily be suffered from anode dehydration when the startup current density is relatively large. This indicates that the anode dehydration could also be a failure mode during PEFC cold-start process apart from cathode pore blockage. This has rarely been considered in previous works in the literature.
In this study, based on the cold-start model in our previous literature [35], the failure modes of the PEFC cold-start process under various operating conditions are simulated numerically. We mainly focus on the influence of the startup current density and the initial membrane water content on the failure modes. The cell is assumed to be heated up by the heat generated by its reaction. A map is attempted to be established, which can be used to predict the failure mode of the fuel cell cold-start process. Moreover, it can also provide the reference values of the cell operating parameters. Based on these values, the fuel cell cold-start process might succeed. The paper is organized as follows. The numerical model is introduced briefly in the following next section. The classification of the failure modes caused by anode dehydration or cathode pore blockage is presented in Section 3, which is followed by the conclusions.

2. Numerical Model

In this study, following the previous literature [21,22,35], the PEFC with a single GC is considered. It includes all the major components, such as bipolar plates (BPs), GDLs, CLs, MPL, and MEM, as shown in Figure 1. The coolant channel is not considered, which indicates the exclusion of external heating during the cold-start process. The cell geometry and material parameters are given in Table 1. The simulation method is based on the cold-start model in our previous literature [35]. For the integrity of the article, the numerical model is briefly described, with the following assumptions being adopted.
(1)
The gas mixture is incompressible due to the small pressure gradient;
(2)
The gas flow in GCs and porous components (e.g., GDLs and CLs) is laminar due to the low flow Reynolds number;
(3)
The porous parts of the PEFC are isotropic and homogeneous, which can be characterized by the effective porosity and permeability;
(4)
The water diffusion caused by the concentration gradient in MEM is considered, which is irrespective of the hydraulic pressure gradient;
(5)
The electrochemical double-layer effect in CLs and the gravitational effect are both ignored.

2.1. Governing Equations

The governing equations include the conservation equations of mass, momentum, gas species, membrane water, liquid water, ice, charge, and energy. The corresponding formulas can be expressed as follows [35]:
  • Mass conservation
    t [ ε ( 1 s l s i ) ρ g ] + ( ρ g u g ) = S m
    where ε is the porosity of CLs, MPL, and GDLs. s l and s i indicate the volume fraction of liquid water and ice in the porous pore. ρ g and u g denote the density and flow velocity of the gas mixture, respectively.
  • Momentum conservation
    t ( ρ g u g ε ( 1 s l s i ) ) + ( ρ g u g u g ε 2 ( 1 s l s i ) 2 ) = p g 2 3 μ g ( ( u g ε ( 1 s l s i ) ) ) + μ g ( ( u g ε ( 1 s l s i ) ) + ( u g ε ( 1 s l s i ) ) t r ) + S u
    where p g and μ g denote the pressure and dynamic viscosity of the gas mixture.
  • Gas species conservation
    t [ ε ( 1 s l s i ) ρ g Y n ] + ( ρ g u g Y n ) = ( ρ g D n e f f Y n ) + S n
    where Y n is the mass fraction of the each species (including H2, O2, and H2O) in the gas mixture. D n e f f is the effective diffusivity. The density of gas mixture ρ g can be expressed as ρ g = ( n Y n ρ n 1 ) 1 .
  • Membrane water conservation
    ρ m e m E W ( ω λ ) t = ρ m e m E W ( ω 1.5 D m w λ ) + S m w
    where E W and ρ m e m denote the equivalent weight and the density of MEM. ω indicates the ionomer volume fraction in CLs. λ is the membrane water content. D m w is the membrane water diffusivity, which is defined as a function of temperature.
  • Liquid water conservation
    ( ε ρ l s l ) t = ( ρ l K l μ l p l ) + S l
    where ρ l is the density of liquid water, and μ l is the dynamic viscosity. K l is the permeability of liquid water in the porous components, and p l is the liquid pressure. The liquid water would exist in the form of supercooled water when the cell temperature is below the freezing point T f .
  • Ice conservation
    ( ε s i ρ i ) t = S i
    where ρ i is the density of ice.
  • Charge conservation
    ( κ e e f f ϕ e ) + S e = 0
    ( κ s e f f ϕ s ) + S s = 0
    where ϕ e and ϕ s denote the potential of the electrolyte and solid phase. κ e e f f and κ s e f f are effective ionic conductivity and electronic conductivity.
  • Energy conservation
    t [ ( ρ C p ) f l , s l e f f T ] + [ ( ρ C p ) f l e f f u g T ] = ( k f l , s l e f f T ) + S T
    where T denotes the cell temperature, ( ρ C p ) f l , s l e f f represents the effective volumetric heat capacities, and k f l , s l e f f represents thermal conductivity of fluid and solid phase. The source terms S m , S H 2 O , S mw , S l , S i , S T , S s , and S e in the conservation Equations (1) to (9) indicate the volumetric sources, which are closely related to the phase change process of water in the PEFC.

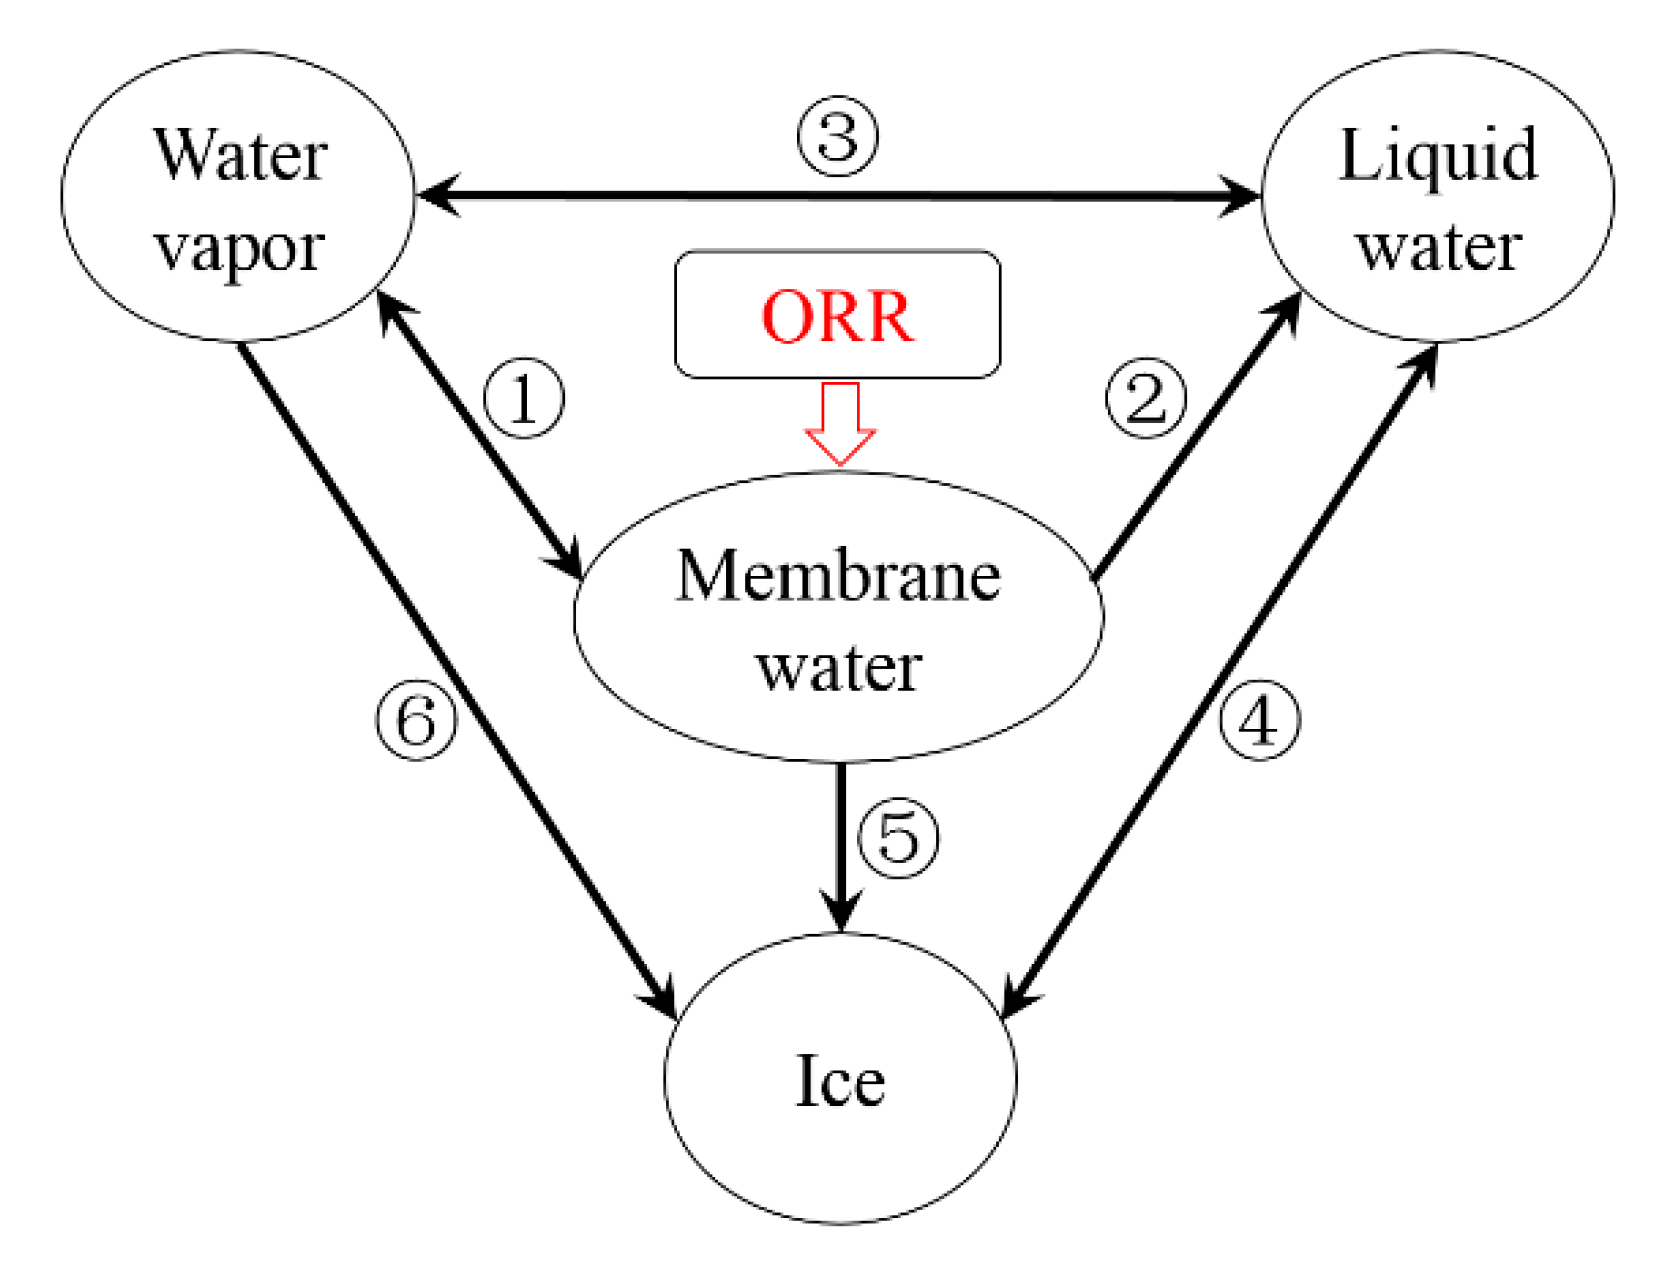
2.2. Modeling of the Water Phase Change Processes

During the cold-start process, as being mentioned in previous literature [24,35], the water inside the cell can exist in the form of vapor phase, liquid phase (supercooled water below freezing point T f ), membrane water or ice. Figure 2 illustrates the phase change processes in the PEFC [35]. During the operating period, the water in the ‘dissolved’ stage, which is considered as the membrane water, is produced in CCL due to the oxygen reduction reaction (ORR) [35]. Here, the mass transfer between the membrane water and water vapor is considered, as labeled with ①, which represents the hydration/dehydration process of the electrolyte. The corresponding expression of this process is given as
S m w v = α m w v ρ m e m E W ( λ λ e q u i l ) ( 1 s l s i )
Here, α m w v denotes the phase change rate between membrane water and water vapor. λ e q u i l indicates the equilibrium membrane water content. It is defined as a function of the water activity a with the following relationship [39]
λ e q u i l = { 0.043 + 17.81 a 39.85 a 2 + 36.0 a 3 0 < a 1 14.0 + 1.4 ( a 1 ) 1 < a 3 .
Here, the water activity a is expressed as [40]
a = p v p p s a t , l + 2 s l
where p v p is the partial pressure of water vapor in the gas mixture. The membrane water tends to be gradually promoted while ORR continues. As p v p equals to p s a t , l , the value of a is 1.0 . Liquid water will be desorbed from the electrolyte. This process, which is labeled with ② in Figure 2, can be expressed as
S mw-1 = { ( 1 ζ ) α mw-1 ρ m e m E W ( λ λ e q u i l ) a 1 0 a < 1
Here, α mw-1 is the desorption rate, and ζ is a switching function. It is set to be 1 when the freezing process occurs in the cell. Otherwise, ζ is 0. If the cell temperature is above T f , ζ is set to be 0 constantly since the freezing process does not happen. Meanwhile, the phase change process (condensation/evaporation) between the vapor and liquid water, which is labeled with ③ in Figure 2, can be expressed as
S v-1 = { ( 1 ζ ) α c o n ε ( 1 s l s i ) p v p p s a t , l R T M H 2 O p v p p s a t , l ( 1 ζ ) α e v a p ε s l p v p p s a t , l R T M H 2 O p v p < p s a t , l
Here, α c o n and α e v a p are the phase change rate of condensation and evaporation process.
As it has been mentioned previously, when the temperature is under the freezing point T f , the liquid water in the cell could be in the supercooled water form with unstable thermodynamic properties. Its freezing process depends on the stochastic appearance of ice nucleation particles [41,42]. When the presence of nuclei is assumed to be independent, the nucleation process can be evaluated based on the Poisson distribution [43]. According to the classical nucleation theory (CNT), after time interval Δ t , the freezing probability can be calculated according to the following expression [35]
f ( V d , T , Δ t ) = 1 exp [ C 0 V d Δ t exp ( C 1 T ( Δ T ) 2 ) ]
Here, V d indicates the volume of supercooled water. Δ T = T T f is the super-cooling temperature. C 0 and C 1 are parameters, which can be fitted according to the experimental results. In this study, according to the preliminary results of Dursch [44], we choose C 0 = 112.7 × 10 8 nuclei m−3 s−1 and C 1 = 40.3 × 10 4 K3. It is worthy to be noted that the supercooled water is assumed to be interconnected inside the cell, and the freezing process happens simultaneously [35]. Based on Equation (15), the occurrence of the freezing process can be estimated. The phase change process labeled with ④ in Figure 2 can be expressed as
S l-i = ζ α i c i n g ε s l ρ l
Here, α i c i n g denotes the phase change rate. In Figure 2, as labeled with ⑤, the desorbed membrane water will change into the ice rather than the supercooled water when the freezing process occurs. According to the X-ray diffraction [45] and neutron scattering [46] experiments, the ice crystals have been observed on the membrane surface. It implies that the water may crystallize in the porous pore of CL or GDL rather than inside the membrane/electrolyte. Meanwhile, as labeled with ⑥, the de-sublimation process between the water vapor and ice will occur. The partial pressure of water vapor p v p will decrease from p s a t , l to p s a t , i [35]. The membrane water desorption is then driven by the difference between p s a t , i outside the membrane and p s a t , l inside the membrane [47]. According to the ratio between p s a t , i and p s a t , l , the maximum membrane water content, which can also be recognized as the saturated membrane water content λ s a t , can be derived as a function of the cell temperature [35]. The desorption process from membrane water to ice labeled with ⑤ in Figure 2 can be expressed as
S mw-i = { ζ α mw-i ρ m e m E W ( λ λ s a t ) λ λ s a t 0 λ < λ s a t
Here, α mw-i denotes the desorption rate. The de-sublimation process from water vapor to ice labeled with ⑥ can be expressed as
S v-i = { ζ α de-sub ε ( 1 s l s i ) p v p p s a t , i R T M H 2 O p v p p s a t , i 0 p v p < p s a t , i
where α de-sub denotes the de-sublimation rate. Since the ORR in the CCL is an exothermic process, the cell temperature will grow as the cell keeps operating. When the cell temperature grows above the freezing point T f , the ice begins to melt. The melting process labeled with ④ can be expressed as
S l-i = α melting ε s i ρ i
where α melting is the melting rate from ice to liquid water. Clearly, the source terms S m , S H 2 O , S m w , S l , and S i in conservation equations include the phase change term S mw-v , S mw-l , S v-l , S l-i , S mw-i , and S v-i . The detailed expressions for each source term can be found in [35].

2.3. Numerical Method and Boundary Conditions

The governing equations are discretized and solved in the commercial CFD software package FLUENT 16.0 based on the finite volume method. The source terms are implemented by using user-defined functions (UDFs). The second-order upwind is chosen for spatial discretization. The grid independence study is carefully carried out. As shown in Figure 1, the total number of structured mesh used in the simulation is 204,000, which is refined in MEM, MPL, and CLs.
The stoichiometric mass flow rates of dry hydrogen and oxygen with relative humidity equaling zero are assigned at the anode and cathode inlets of the GC, respectively. The ambient temperature, which is treated as the startup temperature, is also set to be the inlet gas temperature. At the outlets of the GC, constant pressures equaling to 1 atm are prescribed. The potential of the solid phase on the end surface of anode BP is set to be zero. The constant current density is defined at the end surface of cathode BP for the galvanostatic condition. The symmetric boundary condition is applied on both sides of the computational domain. Since the cell is heated up by the heat generated by its reaction, the end surfaces of both anode and cathode BPs are assumed to be adiabatic. The specified boundary conditions are listed in Table 2.

3. Results and Discussion

The accuracy of the present cold-start model and the values of corresponding parameters are firstly evaluated against the experimental measurements [2]. Figure 3 shows the comparison of the simulated voltage curves and the experimental data [2]. The applied current density is an initial ramp of 0.04   Acm 2 for 80   s followed by constant 0.04   Acm 2 . The cell initial membrane water content in MEM and CLs is λ 0 = 6.2 , and the cell starts from −20 °C and −30 °C, respectively. For each situation, the calculation is repeated. Though the cell starts from the identical initial conditions, the freezing process may occur at a different time due to the stochastic freezing behavior of the supercooled water [35]. Here, only two representative results are given, and the numerical results are statistically in good agreement with the experimental data, as shown in Figure 3. The cell voltage tends to drop promptly when the freezing process occurs.
In this study, it is worthy to note that we are concerned about the effects of startup current density and initial membrane water content on the failure modes of the PEFC cold-start process. The cold-start processes of PEFC are simulated comprehensively with various operating conditions. The cell starts from −20 °C and −30 °C, respectively, with a constant current density, which is applied without the initial ramp (as presented in Figure 3). The simulation is suspended when the cell output voltage drops rapidly below 0.35 V, and the cell cold-start process is recognized as fail. The corresponding time is defined as the shutdown time. Here, the cell performance of the failed cold-start process is merely considered. Based on the simulation results, the classification maps of startup failure modes on the λ 0 I 0 plane are plotted with different startup temperatures (e.g., −20 °C and −30 °C).

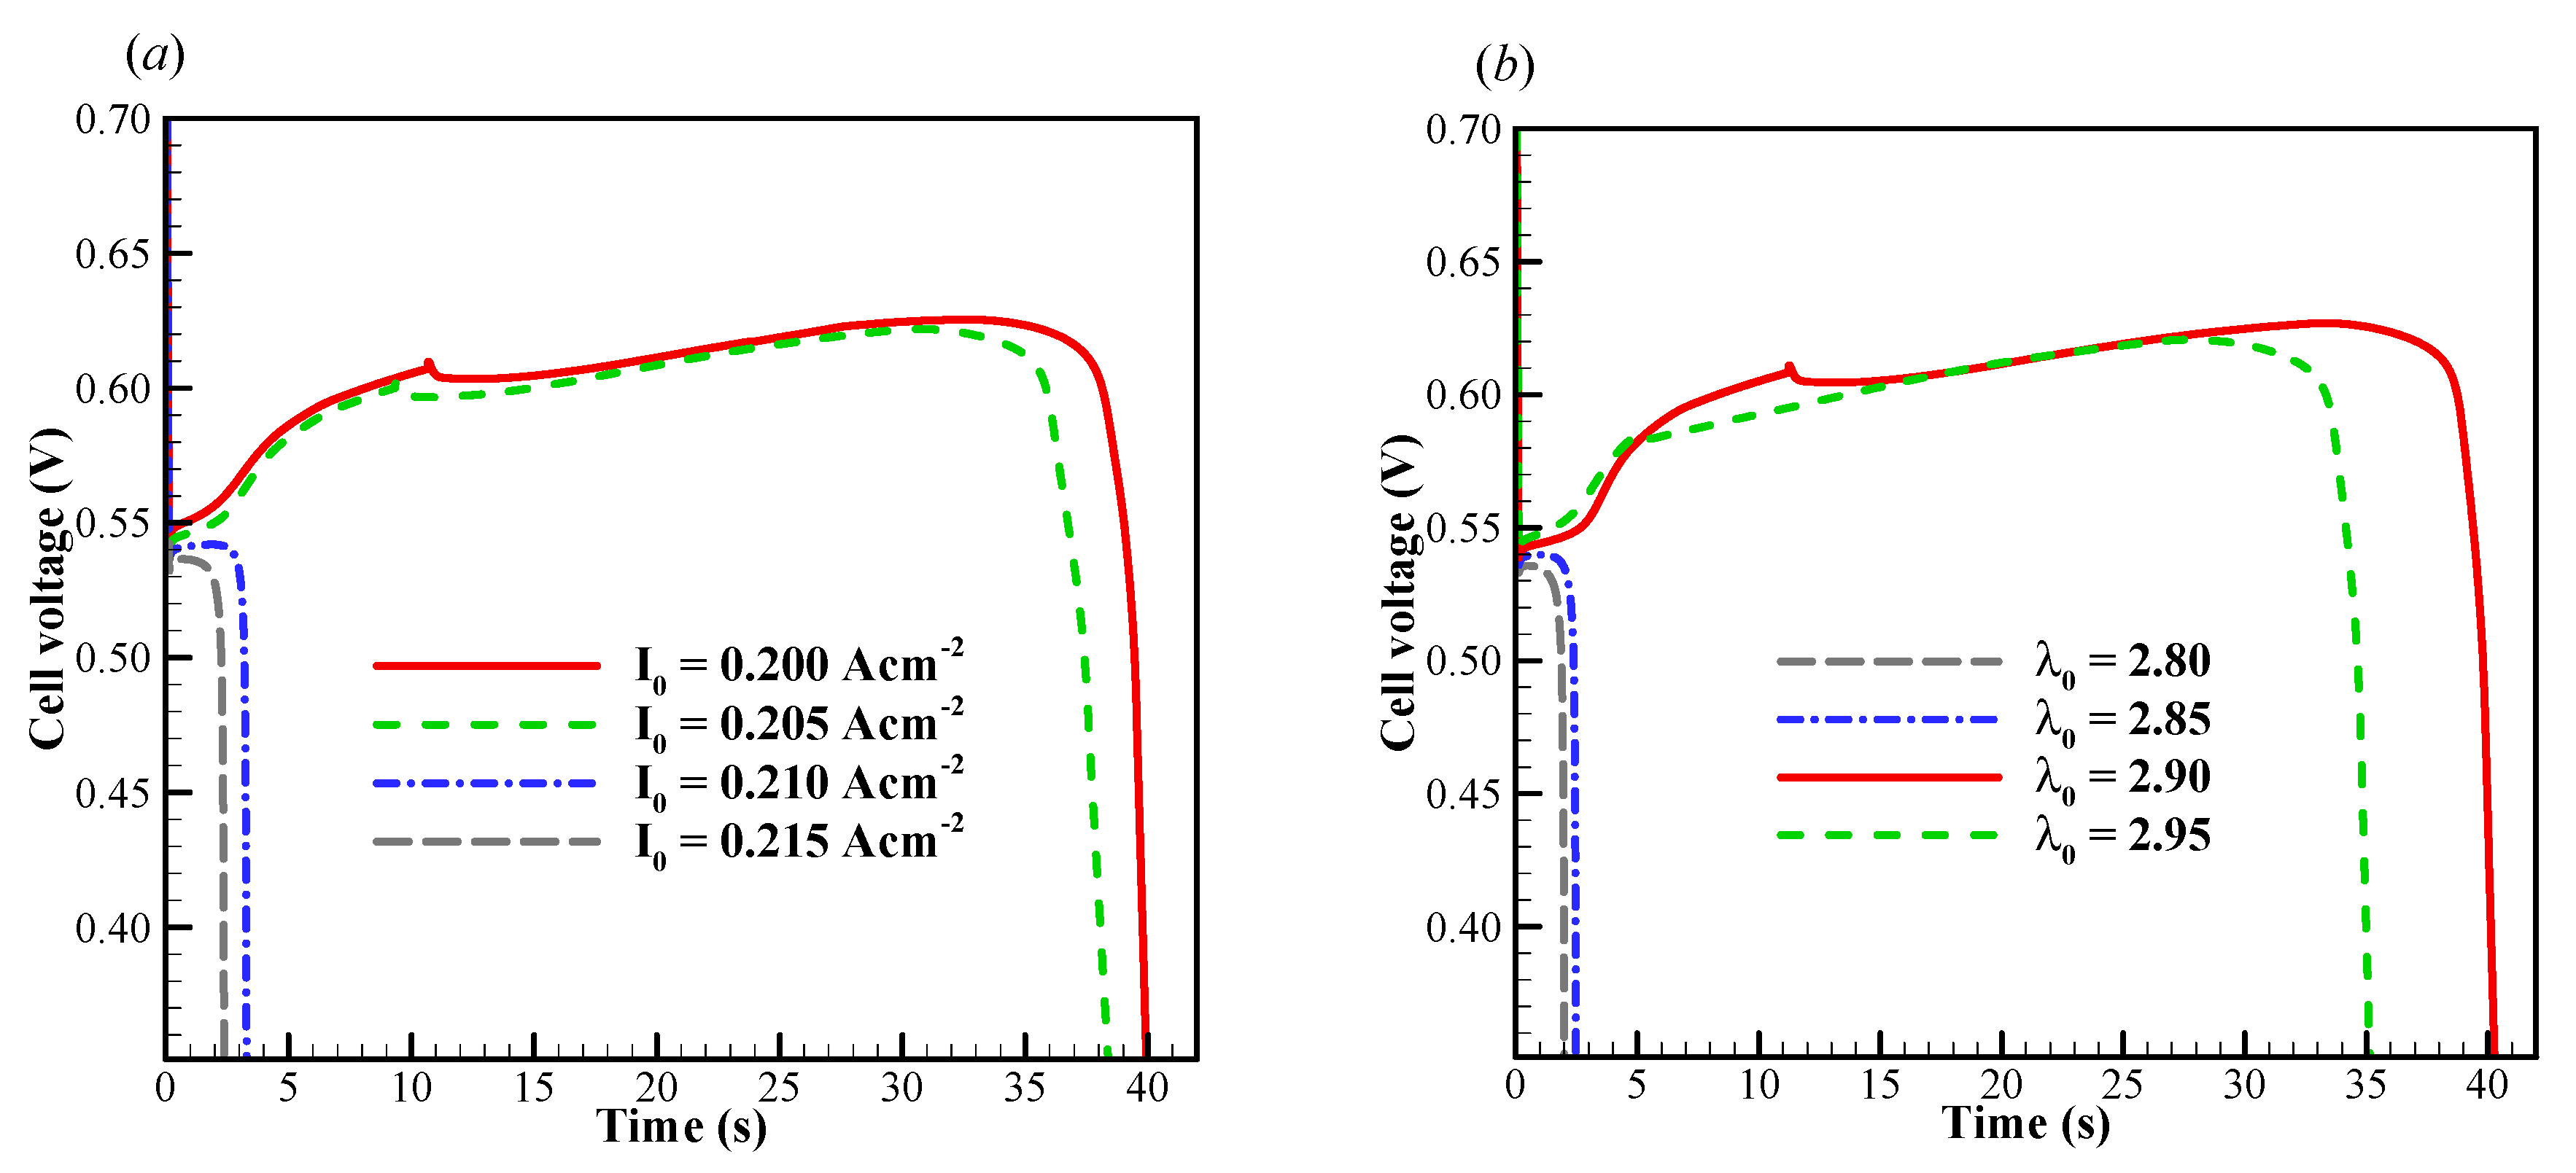
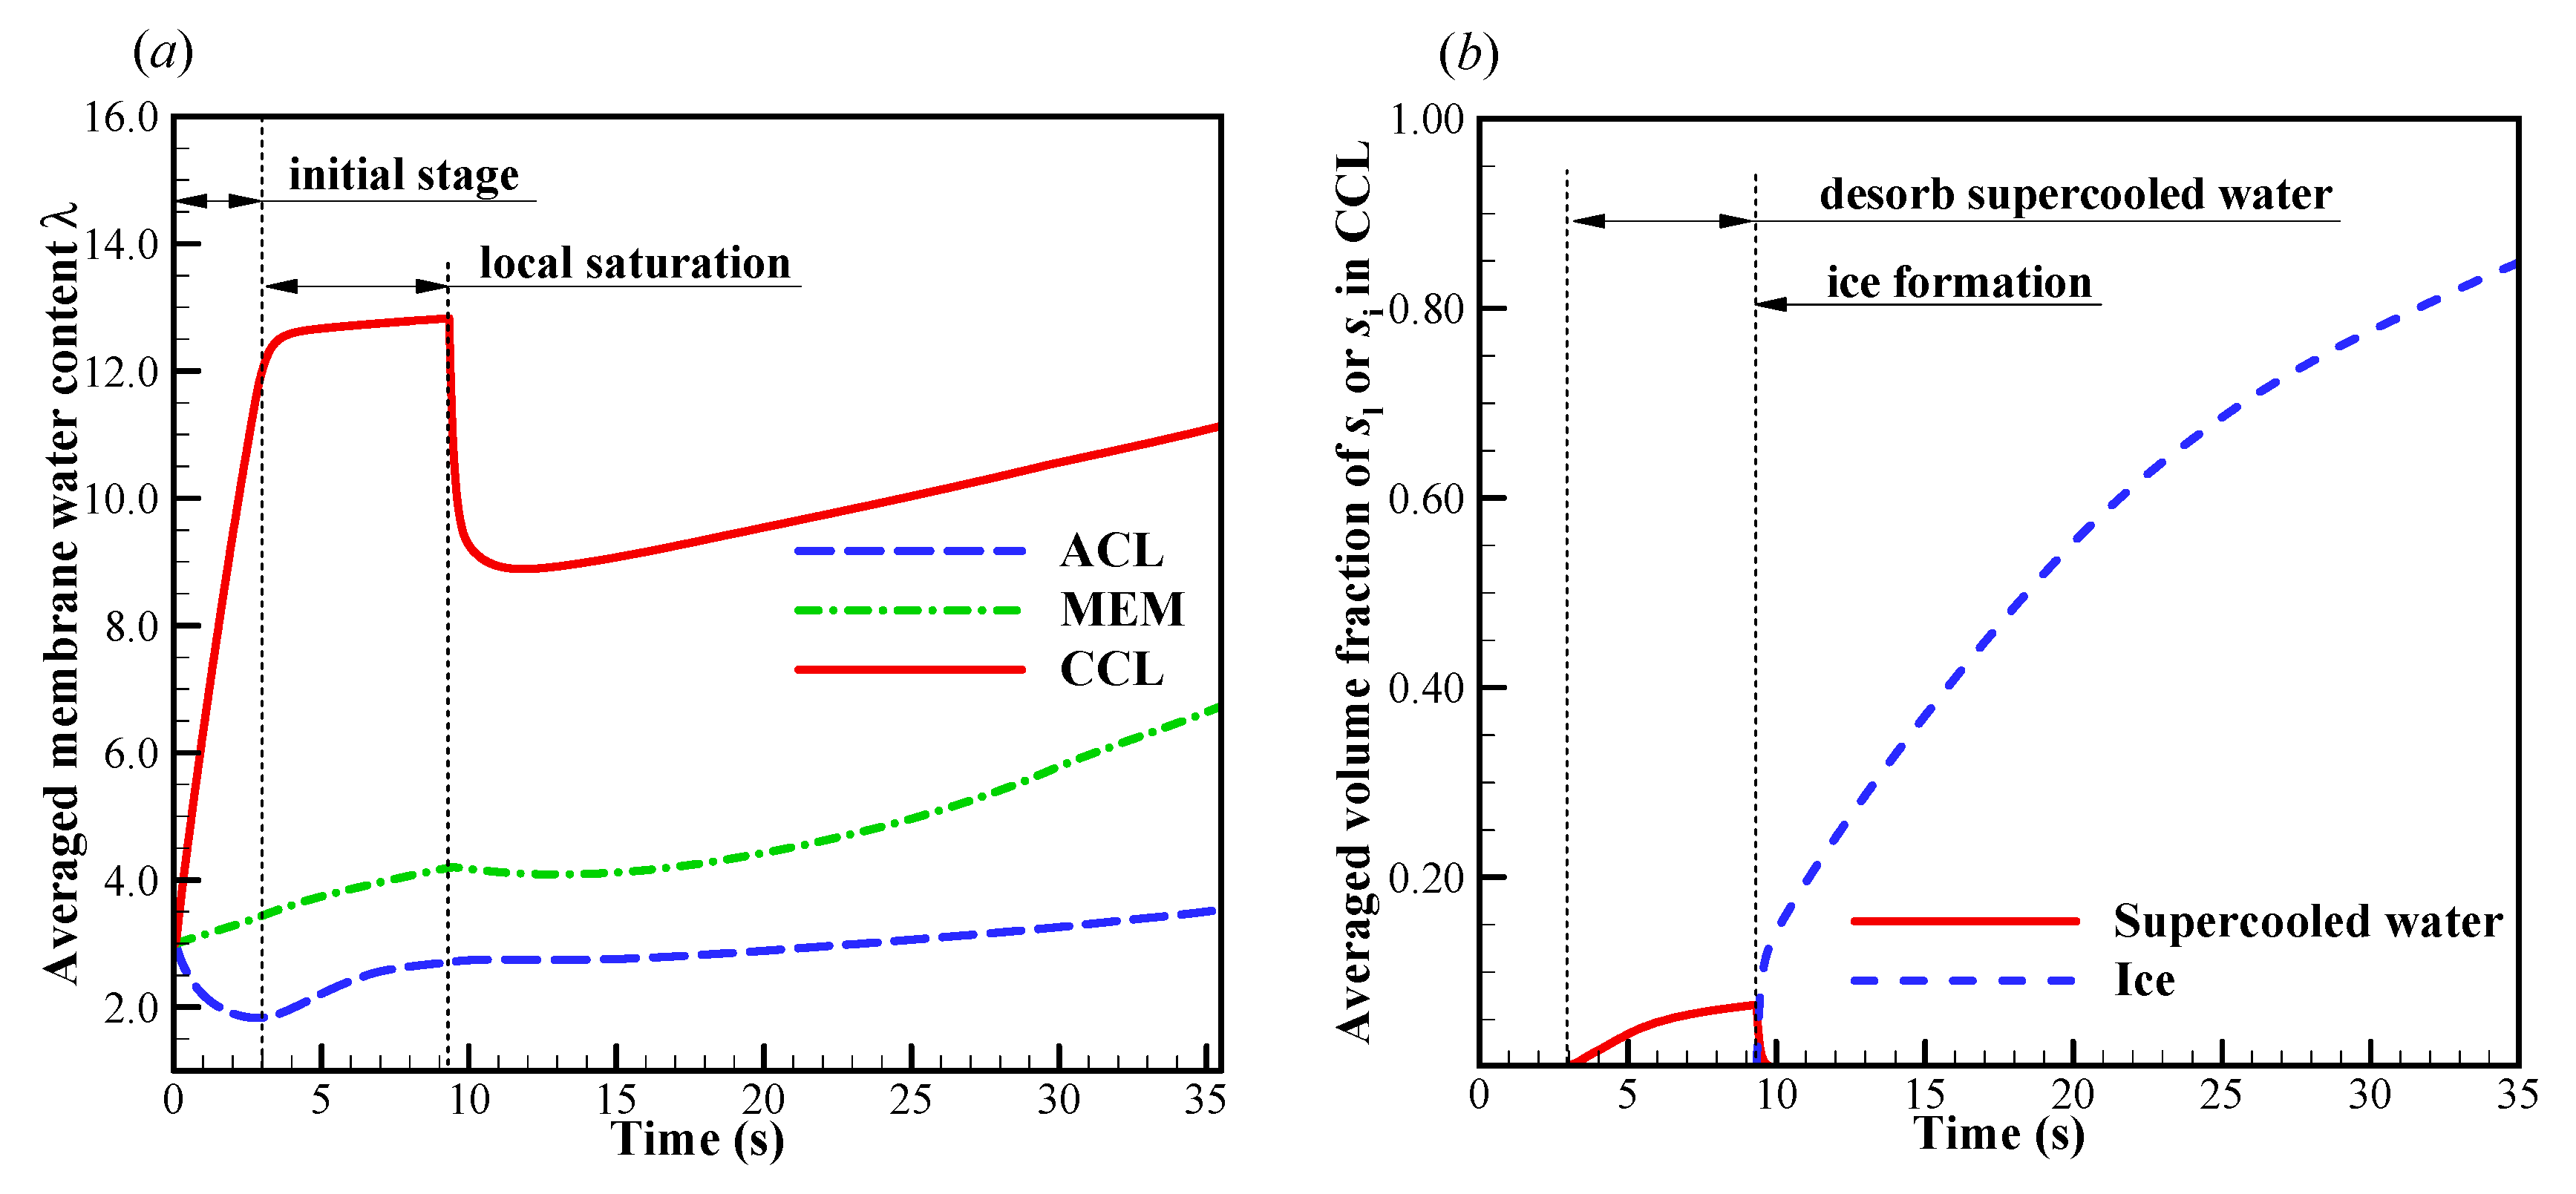
3.1. The Failure Modes in the Cold-Start Process
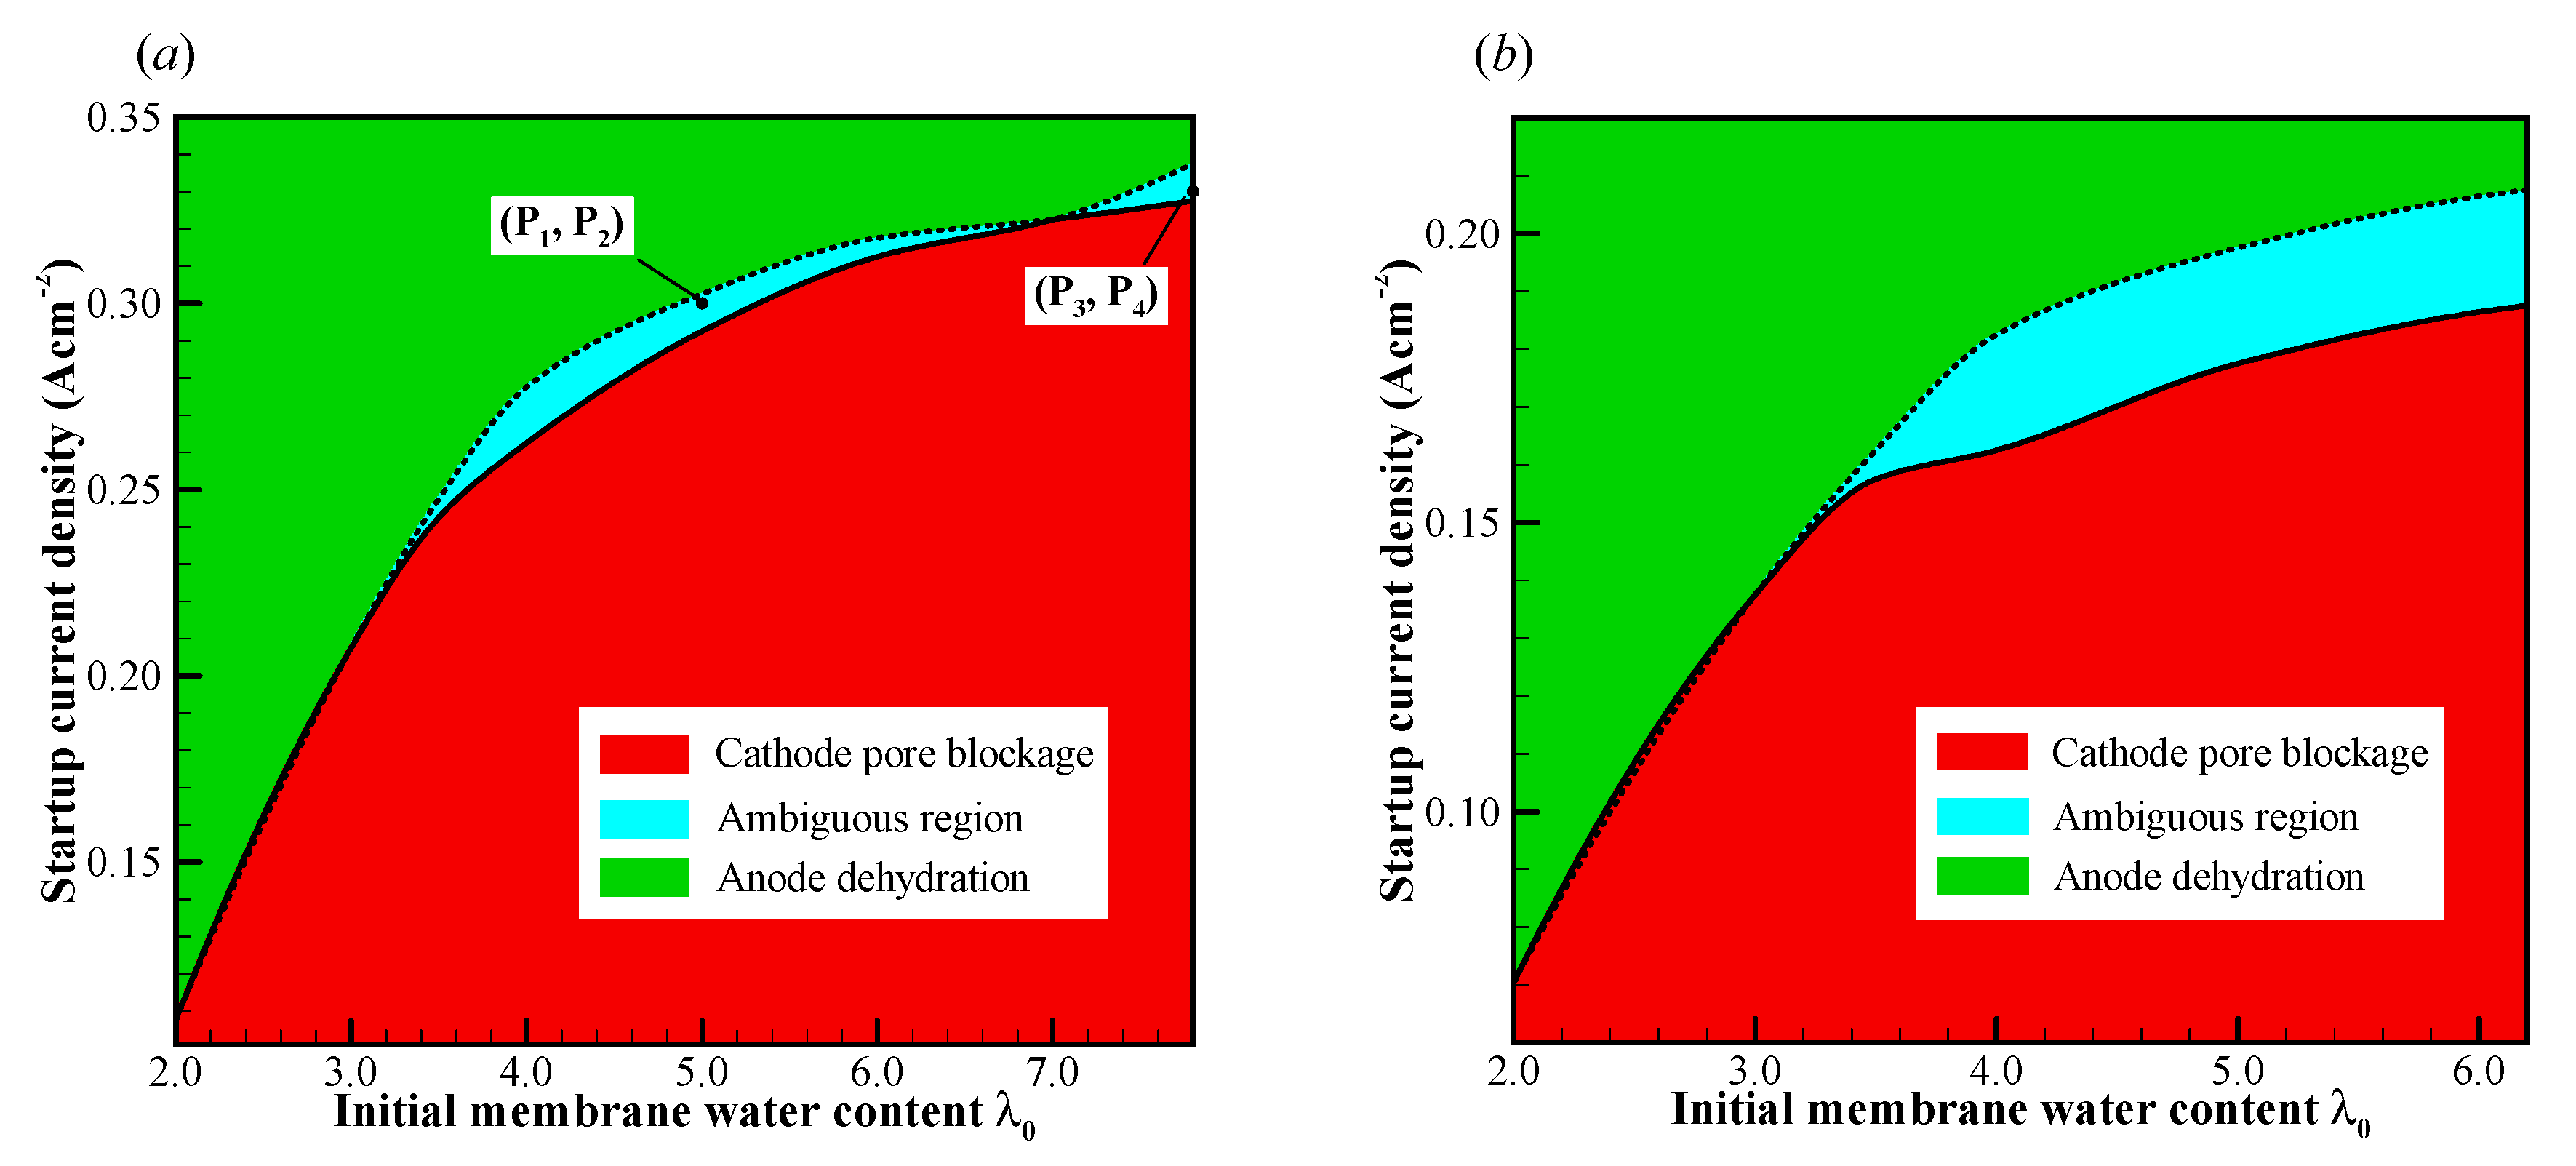
We now focus on the failure modes of the cell cold-start process. The cell starts from −20 °C, and the evolution of cell voltage with different startup current density and initial membrane water content is simulated repeatedly. Here, only one representative result is profiled without loss of generality. In Figure 4a, the effects of startup current density on the cell performance is presented. The initial membrane water content is λ 0 = 3.0 . When the startup current density is I 0 = 0.205   A / cm 2 or less (e.g., I 0 = 0.200   A / cm 2 ), the cell voltage grows during the initial stage. This is attributed to the hydration process of electrolyte in CCL and MEM, as well as the increase of cell temperature, as illustrated in Figure 5a. The volume-averaged membrane water in MEM increases slowly during the initial stage, whereas the membrane water content in CCL rises promptly. It means that the CCL electrolyte can absorb the product water effectively. However, during the initial startup stage, the volume-averaged membrane water content in the anode CL (ACL) decreases. This indicates that the transfer of membrane water in ACL is dominated by the electro-osmosis flux rather than the diffusion caused by the concentration gradient of membrane water. When the local saturation of the membrane water in CCL is achieved, the supercooled water begins to desorb. As shown in Figure 5b, the freezing process occurs at t = 9.3   s , and the supercooled water instantly freezes with rapid releasing of latent heat. This leads to an instantaneous rise of the CCL temperature [35]. As a result, a peak of cell voltage can be observed, as shown in Figure 4a. A similar phenomenon has also been caught in the experimental observation [30].
After the freezing process occurs, the membrane water in CCL is confined to the saturated content (e.g., λ s a t = 8.8 at −20 °C) [21,35,39]. The redundant membrane water in the electrolyte desorbs in the state of ice [35]. Additionally, the ice density is smaller than that of liquid water. As a result, the ice volume fraction is larger than the corresponding volume fraction of supercooled water, as shown in Figure 5b. According to Figure 4a and Figure 5b, when the averaged volume fraction of ice in CCL approaches 0.8, the cell voltage begins to drop quickly, and the cold-start process fails. The corresponding distribution of the ice volume fraction in CCL is shown in Figure 5c at t = 35.2 s. The local ice volume fraction si is almost larger than 0.9 in most CCL regions. This indicates that almost all the reaction sites in CCL are isolated from the oxidant. The failure of the cold-start process is physically attributed to the ice blockage of the cathode pore. This failure mode is the most common phenomenon in the failed cold-start process of PEFC. Moreover, as shown in Figure 5a, we know that the membrane water content in MEM does not reach saturation yet, even though the cell cold-start process failed. The membrane water keeps diffusing from the CCL into the MEM. As a result, the ice volume fraction near the CCL/MEM interface is relatively smaller than the rest part of the CCL. This can also be confirmed in Figure 5c.
In Figure 4a, when the startup current density increases to I 0 = 0.210 A/cm2, the initial cell voltage becomes lower than that in the previous situation, and the cell operating time shortens drastically. According to the previous simulation with I 0 = 0.205 A/cm2, we know that the CCL pores cannot be blocked completely by the product water or ice within 4s. Undoubtedly, there exists another mechanism, which leads to the rapid dropping of cell voltage. In Figure 6a, the evolution of the volume-averaged membrane water content in ACL, MEM, and CCL are presented. Similar to those in the previous situation, the membrane water content in CCL grows rapidly due to the initial hydration process. The membrane water content in MEM remains almost constant. Due to the role of the electro-osmotic drag (EOD), which dominates over the back-diffusion ability between the MEM and ACL, the ACL membrane water content drops permanently. This results in a dramatic increase in cell ohmic resistance and a rapid drop of the cell voltage, as shown in Figure 4a. In other words, the failure of the cell cold-start process is caused by the anode dehydration. Although this phenomenon has often been observed in the fuel cell with normal temperature and high current loads [48], it is rarely mentioned in the cold-start process in previous literature [49]. As shown in Figure 6a, the ACL volume-averaged membrane water content drops to less than 1.32 when the cell is shut down. The distribution of the membrane water content in ACL is presented in Figure 6b. The minimum membrane water content locates near the interface between ACL and MEM, and the corresponding proton conductivity will become very small. This indicates that the proton transfer from ACL to MEM will be impeded severely. In Figure 4b, it shows the effects of the initial membrane water content on cell cold-start performance. The startup current density is fixed at I 0 = 0.2 A/cm2. The cell is ceased in a short time when the initial membrane water content is relatively small, e.g., λ 0 = 2.80 or λ 0 = 2.85 . The failure of the cold-start process can be attributed to the anode dehydration. However, the cell shutdown time tends to increase significantly when the initial membrane water content is raised to λ 0 = 2.90 or λ 0 = 2.95 . This indicates that the failure mode of the cell cold-start process has changed from the anode dehydration to the cathode pore blockage.
According to the above analysis, it can be concluded that the failure of the cell cold-start process can be distinguished into two modes (the anode dehydration and the cathode pore blockage), which are attributed to different physical mechanisms. In principle, the dominant failure mode can be determined according to the cell startup current density and the initial membrane water content. When the cell starts with relatively large current density and low initial membrane water content, anode dehydration would be the dominant failure mode. However, the cell failure mode could be dominated by the cathode pore blockage, when the cell starts with high initial membrane water content and relatively small current density.

3.2. The Map of Failure Modes on the λ 0 I 0 Plane

In this section, the cell cold-start processes are simulated comprehensively with various initial membrane water contents λ 0 and startup current densities I 0 . The failure process and the corresponding failure mode are classified and profiled on the λ 0 I 0 plane, as illustrated in Figure 7. It exhibits the map of the failure mode for the cell starts from different startup temperatures (−20 °C and −30 °C) with various initial membrane water contents and current densities. The λ 0 I 0 plane can be distinguished into three conspicuous zones as follows: (i) the cathode pore blockage zone, which locates in the area with relatively high initial membrane water content and small startup current density; (ii) the anode dehydration zone, which locates in the area with relatively low initial membrane water content and large startup current density; and (iii) the ambiguous zone, which locates between the above two zones, and it narrows significantly when the initial membrane water becomes low (or the startup content density is relatively small). In the ambiguous zone, the cold-start failure mode may be either cathode pore blockage or anode dehydration. It is attributed to the stochastic freezing behavior of the supercooled water. For each initial membrane water content, two critical current densities can be identified, as distinguished by the solid and dashed lines, respectively. The critical current densities elevate with the increase of initial membrane water content, and the growth rate trend tends to decrease as well. Comparing Figure 7a,b, it shows that the ambiguous zone tends to expand, and the critical current densities decrease as the startup temperature drops from 20 °C to 30 °C. This is physically attributed to the fact that the back-diffusion ability of membrane water becomes weaker at the lower startup temperature. As a result, the failure modes may tend to fall in the anode dehydration zone even if the cell is started with relatively high initial membrane water content.
If the cell startup current density is larger than the critical current density denoted by the dashed line, the cell cannot be started successfully. The failure of the cold-start process is attributed to the anode dehydration. However, if the cell startup current density is smaller than the critical current density denoted by the solid line, the anode dehydration cannot be observed during the cell cold-start process, whether the startup process is successful or not. If the supercooled water does not freeze during the cold-start process, it can flow into the MPL, GDL, or even the GC [30]. The cell will continue to run for a long time, whose temperature keeps increasing, even above the freezing point. In this way, the cold-start process would be successful. Unfortunately, according to Equation (15), the lower the temperature at which the cell starts, the larger the probability that the supercooled water will freeze. This indicates that the freezing process often occurs during the cold-start process. The cell cold-start process usually fails when the cell starts from a relatively lower startup temperature. In this study, since we are only concerned with the failure modes in the cell cold-start process, the numerical simulation results of the successful cold-start processes are ignored.

3.3. The Failure Mode in the Ambiguous Zone

As we have mentioned, the cold-start failure mode may be either cathode pore blockage or anode dehydration in the ambiguous zone. In this section, the effects of the supercooled water stochastic freezing behavior on the cell cold-start failure modes are discussed in detail. Without loss of generality, the cell is assumed to start from 20 °C, and two typical cold-start process cases are mainly discussed. The corresponding initial membrane water contents are λ 0 = 5.0 and 7.8, respectively.

3.3.1. λ 0 = 5.0 and I 0 = 0.30   A / cm 2

In this case, the initial membrane water content is λ 0 = 5.0 , and the startup current density is set to be I 0 = 0.30   A / cm 2 . As shown in Figure 7a, we know that the cell startup condition falls in the ambiguous zone. Due to the stochastic freezing process of the supercooled water, the cell cold-start process is simulated repeatedly, and two representative processes (denoted by P1 and P2) are presented here. In Figure 8a, the difference of cell voltage between P1 and P2 seems to be significant after the freezing process happens. In P1, the supercooled water freezes at t = 5.1 s. After that, the cell voltage drops continuously. According to the previous discussion, we know that this might be caused by the increase of ice volume fraction in CCL together with the dropping of membrane water content in ACL. However, in Figure 8b, the averaged ice volume fraction in CCL is still less than 0.5 when the cell shuts down at t = 8.6 s. Therefore, we can conclude that in P1, the cell cold-start failure mode is dominated by the anode dehydration. This can also be confirmed in Figure 9, where the distribution of membrane water content along the thickness of CCL, MEM, and ACL is profiled. Generally, before the supercooled water freezes (e.g., t = 4.7 s), the membrane water content in CCL can reach as high as 14.0. But the membrane water contents in MEM and ACL are far less than that in CCL. After the freezing process occurs (e.g., t = 6.7 s), the membrane water content in CCL drops to the saturated level λ s a t = 9.5 , which corresponds to the lower saturated vapor pressure of the ice [35]. The gradient of the membrane water between CCL and MEM reduces, and the back-diffusion ability of the membrane water is enervated and even weaker than the EOD. As the cell keeps operating (e.g., t = 8.7 s), the membrane water content in ACL drops continuously, and the membrane water content near the interface between ACL and MEM becomes even lower than 1.0. As a result, the proton conductivity becomes very small, and the cell cold-start process fails with the voltage dropping to almost zero rapidly, as shown in Figure 8a.
In P2, the supercooled water freezes at t = 7.1 s, which is later than that in P1. In Figure 8a, it shows that the cell voltage does not keep dropping after the freezing process occurs. In Figure 8b, the averaged ice volume fraction in CCL tends to increase continuously as the cell keeps operating. When the averaged ice volume fraction goes up to more than 0.9, the cell voltage begins to drop rapidly, and the cell cold-start process fails. Unlike P1, the failure mode of P2 is attributed to the cathode pore blockage. Figure 10 gives the distribution of temperature, membrane water content, and diffusivity in the middle plane of CCL at the time, which is 1.6 s later than the occurrence of freezing. Since the freezing of supercooled water in P2 occurs later than that in P1, the corresponding amount of supercooled water in P2 is more substantial than that in P1. When the freezing process happens, more latent heat is released in P2, and the corresponding cell temperature is higher than that in P1, as shown in Figure 10a. Moreover, the membrane water content and diffusivity in P2 are higher than those in P1, as illustrated in Figure 10b,c. Thus, the anode dehydration can be avoided even if the freezing process occurs.

3.3.2. λ 0 = 7.8 and I 0 = 0.33   A / cm 2

In this case, we set the startup current density I 0 = 0.33   A / cm 2 when the initial membrane water content increases to λ 0 = 7.8 . As illustrated in Figure 7a, the cell startup condition also falls in the ambiguous zone. Similar to the previous section, the numerical simulation is repeated, and in Figure 11 only two representative processes (denoted by P3 and P4) with the corresponding freezing time of supercooled water at 3.6 s and 9.5 s are presented. In Figure 11a, though the freezing time is different, the differences of the cell shutdown time are relatively small. In Figure 11b, it can be found that in P3, the averaged ice volume fraction in CCL tends to approach 1.0 when the cell voltage drops rapidly. Thus, the failure of the cell cold-start process is attributed to the cathode pore blockage. However, in P4, though the freezing process happens later than that in P3, the averaged ice volume fraction only approaches to 0.56 when the cell shuts down. The anode dehydration will be the principal reason to cause the failure of the cold-start process. This is different from those phenomena observed in P1 and P2, where the cell cold-start failure process is attributed to the cathode pore blockage if the occurrence of the freezing process is postponed.
In previous literature [30], it has been mentioned that the supercooled water can transport through the water pathway from CL to GDL and even GC. It can be expected that if the supercooled water freezes later, the more supercooled water will be expelled from the CCL into the MPL, GDL or GC. Thus, during the cell cold-start process more produced water or ice can be stored in the MPL and GDL. On the other hand, since the solid ice cannot flow, more produced water or ice will accumulate in the CCL if the supercooled water freezes earlier. Therefore, the CCL is more likely to be blocked by ice if the supercooled water freezes more prior. In P3, the freezing process occurs at 3.6 s. It is much earlier than that in P4, where the freezing process occurs at 9.5 s. The corresponding ice volume fraction in CCL at t = 11.9 s is contoured in Figure 12a. In P3, the ice volume fraction in CCL is more significant than that in P4. It means that more pores in CCL are blocked in P3 than those in P4. In Figure 12b, the membrane water content distribution along the thickness of CCL, MEM, and ACL at t = 11.9 s is presented. Since the freezing of supercooled water has occurred, the membrane water content in CCL approaches to the saturated content ( λ s a t = 10.6 ). However, the MEM is still unsaturated, and it can keep absorbing the product membrane water continuously. In the region of CCL close to the CCL/MEM interface, the membrane water content is distinctively lower than the saturated value, and the cathode pores keep unblocking. Since the cell cold-start process is operated in the galvanostatic state, it is expectable that the electrochemical reaction is mainly located in this unblocked region. This results in the relatively high local temperature and membrane water content in the part of CCL close to the CCL/MEM interface. The gradient of membrane water content across the CCL/MEM interface in P3 is prospected to be higher than that in P4, as illustrated in Figure 12b with Δ λ P 3 > Δ λ P 4 . This will promote more product water in CCL diffusing back into MEM and ACL. As the cell keeps operating, the ice volume fraction in CCL increases continuously as well as the membrane water content in ACL, as shown in Figure 13 with the solid line. Thus, in P3, the failure of cell cold-start process is caused by the cathode pore blockage instead of the anode dehydration.
According to the above P1 to P4 processes, we know that the cold-start failure mode in the ambiguous zone mainly depends on the occurrence of the stochastic freezing process. When the initial membrane water content is relatively small, as listed in Table 3, the failure mode is dominated by anode dehydration if the freezing process occurs earlier. Otherwise, the failure mode is attributed to the cathode pore blockage. However, the opposite is exact for the situation with high initial membrane water content. In this section, the cell started from −20 °C is considered in detail. It is worth noting that similar results can also be obtained for the cell started from −30 °C. Due to the presence of the ambiguous zone, the phenomena that may occur during the cell cold-start process, become complicated and unpredictable.

4. Conclusions

In this study, a numerical model has been introduced to simulate the cold-start process of PEFC. The stochastic freezing process of supercooled water is included. The validation results of the model are consistent with the experimental data in previous literature. Based on this model, the cold-start failure processes of PEFC are studied numerically. The influences of initial membrane water content and startup current density on the failure processes are mainly concerned with various startup temperatures. The results show that the failure of the cell cold-start process can be distinguished into two modes, which are physically attributed to the anode dehydration and cathode pore blockage. The dominant failure mode can be determined according to the startup current density and the initial membrane water content. The predominant failure mode is mainly attributed to the anode dehydration if the cell startup current density is large. However, the cell failure mode is dominated by the cathode pore blockage if the cell’s initial membrane water content is high. On the λ 0 I 0 plane, the map of startup failure mode has been plotted with various startup temperatures. According to the map, the anode dehydration failure mode can be avoided by choosing the relatively high initial membrane water content and small startup current density. However, it is a pity that the value of initial membrane water and startup current density, at which the cold-start process could be successful, is still unreachable. Due to the stochastic freezing behavior of the supercooled water, an ambiguous zone can be observed, where the cold-start failure mode is uncertain. It mainly depends on the stochastic occurrence of the freezing process.
It is worthy to note that we focus on the failure mode of the cell cold-start process, and only the simulation results of failed cold-start processes are presented. The above phenomena and corresponding critical values of initial membrane water and startup current density are predicted only by numerical simulation. They may rely on the cell material and structure properties, such as the ionomer volume fraction, the membrane thickness, the porosity of CL, and the contact angle of CL/MPL/GDL. Frankly, the exact values of these property parameters are hard to determine, and the uncertainty of these values do influence the accuracy of the model. However, the presence of the failure mode and the corresponding physical explanation is reasonable. We hope that these phenomena can be observed in future experimental research.

Author Contributions

Conceptualization, L.Y. and J.P.; formal analysis, L.Y. and F.M.; data curation, Y.Z. and J.S.; writing—original draft preparation, L.Y. and F.M.; writing—review and editing, J.P.; funding acquisition, J.Z.; supervision, J.P. All authors have read and agreed to the published version of the manuscript.

Funding

This research was funded by the National Key Research and Development Program of China, grant number 2016YFE0118600.

Conflicts of Interest

The authors declare no conflict of interest.

Nomenclature

C p Specific heat, J kg−1 K−1 μ Viscosity, Pa s
D Diffusivity, m2 s−1 ρ Density, kg m−3
E W Equivalent weight, kg kmol−1 ϕ Potential, V
I Current density, A m−2 ω Ionomer volume fraction
k Thermal conductivity, W m−1 K−1 ζ Switching function
K Permeability, m2Subscripts and Superscripts
p Pressure, Pa 0 Initial
s Volume fraction e Electrolyte
S , S Source term e f f Effective
t Time, s f l Fluid phase
Δ t Time step, s g Gas phase
T Temperature, K i Ice
Δ T Super-cooling temperature, K l Liquid water
u Velocity, m s−1 m Mass, for source term
Y Mass fraction m e m Membrane
Greek m w Membrane water
α Phase transfer rate, s−1 n The nth gas species
δ Thickness, mm s Solid phase
ε Porosity s l Solid phase
θ Contact angle, ° T Energy, for source term
κ Conductivity, S m−1 u Momentum, for source term
λ Membrane water content ϕ Charge, for source term

References

  1. Tajiri, K.; Tabuchi, Y.; Wang, C.Y. Isothermal cold-start of polymer electrolyte fuel cells. J. Electrochem. Soc. 2007, 154, B147–B152. [Google Scholar] [CrossRef]
  2. Tajiri, K.; Tabuchi, Y.; Kagami, F.; Takahashi, S.; Yoshizawa, K.; Wang, C.H. Effects of operating and design parameters on PEFC cold-start. J. Power Sour. 2007, 165, 279–286. [Google Scholar] [CrossRef]
  3. Ge, S.; Wang, C.Y. Characteristics of subzero startup and water/ice formation on the catalyst layer in a polymer electrolyte fuel cell. Electrochim. Acta 2007, 52, 4825–4835. [Google Scholar] [CrossRef]
  4. Jiao, K.; Alaefour, I.E.; Karimi, G.; Li, X. Cold-start characteristics of proton exchange membrane fuel cells. Int. J. Hydrog. Energy 2011, 36, 11832–11845. [Google Scholar] [CrossRef]
  5. Lin, R.; Weng, Y.; Li, Y.; Lin, X. Internal behavior of segmented fuel cell during cold-start. Int. J. Hydrogen Energy 2014, 39, 16025–16035. [Google Scholar] [CrossRef]
  6. Tabe, Y.; Saito, M.; Fukui, K.; Chikahisa, T. Cold-start characteristics and freezing mechanism dependence on start-up temperature in a polymer electrolyte membrane fuel cell. J. Power Sour. 2012, 208, 366–373. [Google Scholar] [CrossRef] [Green Version]
  7. Hiramitsu, Y.; Mitsuzawa, N.; Okada, K.; Hori, M. Effects of ionomer content and oxygen permeation of the catalyst layer on proton exchange membrane fuel cell cold-start-up. J. Power Sour. 2010, 195, 1038–1045. [Google Scholar] [CrossRef]
  8. Thompson, E.L.; Jorne, J.; Gu, W.; Gasteiger, H.A. PEM fuel cell operation at −20° CI Electrode and membrane water (charge) storage. J. Electrochem. Soc. 2008, 155, B625–B634. [Google Scholar] [CrossRef]
  9. Hirakata, S.; Mochizuki, T.; Uchida, M.; Uchida, H. Investigation of the effect of pore diameter of gas diffusion layers on cold-start behavior and cell performance of polymer electrolyte membrane fuel cells. Electrochim. Acta 2013, 108, 304–312. [Google Scholar] [CrossRef]
  10. Xie, X.; Wang, R.; Jiao, K.; Zhang, G.; Zhou, J.; Du, Q. Investigation of the effect of micro-porous layer on PEM fuel cell cold-start operation. Renew. Energy 2018, 117, 125–134. [Google Scholar] [CrossRef]
  11. Wakatake, N.; Tabe, Y.; Chikahisa, T. Water transport in ionomer and ice formation during cold-startup with supercooled state in PEFC. ECS Trans. 2016, 75, 623–630. [Google Scholar] [CrossRef]
  12. Wang, Y.; Mukherjee, P.P.; Mishler, J.; Mukundan, R.; Borup, R.L. Cold-start of polymer electrolyte fuel cells: Three-stage startup characterization. Electrochim. Acta 2010, 55, 2636–2644. [Google Scholar] [CrossRef]
  13. Mao, L.; Wang, C.Y.; Tabuchi, Y. A multiphase model for cold-start of polymer electrolyte fuel cells. J. Electrochem. Soc. 2007, 154, B341–B351. [Google Scholar] [CrossRef]
  14. Jiang, F.; Fang, W.; Wang, C.Y. Non-isothermal cold-start of polymer electrolyte fuel cells. Electrochim. Acta 2007, 53, 610–621. [Google Scholar] [CrossRef]
  15. Meng, H. Numerical analyses of non-isothermal self-start behaviors of PEM fuel cells from subfreezing startup temperatures. Int. J. Hydrogen Energy 2008, 33, 5738–5747. [Google Scholar] [CrossRef]
  16. Meng, H. A PEM fuel cell model for cold-start simulations. J. Power Sources 2008, 178, 141–150. [Google Scholar] [CrossRef]
  17. Gwak, G.; Ko, J.; Ju, H. Numerical investigation of cold-start behavior of polymer-electrolyte fuel-cells from subzero to normal operating temperatures–effects of cell boundary and operating conditions. Int. J. Hydrogen Energy 2014, 39, 21927–21937. [Google Scholar] [CrossRef]
  18. Ko, J.; Ju, H. Comparison of numerical simulation results and experimental data during cold-start of polymer electrolyte fuel cells. Appl. Energy 2012, 94, 364–374. [Google Scholar] [CrossRef]
  19. Gwak, G.; Ju, H. A rapid start-up strategy for polymer electrolyte fuel cells at subzero temperatures based on control of the operating current density. Int. J. Hydrogen Energy 2015, 40, 11989–11997. [Google Scholar] [CrossRef]
  20. Thompson, E.L.; Capehart, T.W.; Fuller, T.J.; Jorne, J. Investigation of low-temperature proton transport in Nafion using direct current conductivity and differential scanning calorimetry. J. Electrochem. Soc. 2006, 153, A2351–A2362. [Google Scholar] [CrossRef]
  21. Jiao, K.; Li, X. Three-dimensional multiphase modeling of cold-start processes in polymer electrolyte membrane fuel cells. Electrochim. Acta 2009, 54, 6876–6891. [Google Scholar] [CrossRef]
  22. Jiao, K.; Li, X. Cold-start analysis of polymer electrolyte membrane fuel cells. Int. J. Hydrogen Energy 2010, 35, 5077–5094. [Google Scholar] [CrossRef]
  23. Jiao, K.; Li, X. Effects of various operating and initial conditions on cold-start performance of polymer electrolyte membrane fuel cells. Int. J. Hydrogen Energy 2009, 34, 8171–8184. [Google Scholar] [CrossRef]
  24. Ishikawa, Y.; Morita, T.; Nakata, K.; Shiozawa, M. Behavior of water below the freezing point in PEFCs. J. Power Sour. 2007, 163, 708–712. [Google Scholar] [CrossRef]
  25. Ishikawa, Y.; Hamada, H.; Uehara, M.; Shiozawa, M. Supercooled water behavior inside polymer electrolyte fuel cell cross-section below freezing temperature. J. Power Sour. 2008, 179, 547–552. [Google Scholar] [CrossRef]
  26. Mayrhuber, I.; Marone, F.; Stampanoni, M.; Schmidt, T.J.; Büchi, F.N. Fast X-ray tomographic microscopy: Investigating mechanisms of performance drop during freeze starts of polymer electrolyte fuel cells. ChemElectroChem 2015, 2, 1551–1559. [Google Scholar] [CrossRef]
  27. Roth, J.; Zurbrügg, M.R.; Irvine, S.; Marone, F. Investigation of PEFC freeze start by X-ray tomographic microscopy. ECS Trans. 2013, 58, 453–462. [Google Scholar] [CrossRef]
  28. Oberholzer, P.; Boillat, P.; Siegrist, R.; Perego, R.; Kästner, A.; Lehmann, E.; Scherer, G.G.; Wokaun, A. Cold-start of a PEFC visualized with high resolution dynamic in-plane neutron imaging. J. Electrochem. Soc. 2012, 159, B235–B245. [Google Scholar] [CrossRef]
  29. Stahl, P.; Biesdorf, J.; Boillat, P.; Friedrich, K.A. An investigation of PEFC sub-zero startup: Evidence of local freezing effects. J. Electrochem. Soc. 2016, 163, F1535–F1542. [Google Scholar] [CrossRef]
  30. Biesdorf, J.; Forner-Cuenca, A.; Siegwart, M.; Schmidt, T.J.; Boillat, P. Statistical analysis of isothermal cold-starts of PEFCs: Impact of gas diffusion layer properties. J. Electrochem. Soc. 2016, 163, F1258–F1266. [Google Scholar] [CrossRef] [Green Version]
  31. Stahl, P.; Biesdorf, J.; Boillat, P.; Friedrich, K.A. An investigation of PEFC sub-zero startup: Influence of initial conditions and residual water. Fuel Cells 2017, 17, 778–785. [Google Scholar] [CrossRef]
  32. Biesdorf, J.; Stahl, P.; Siegwart, M.; Schmidt, T.J. When size matters: Active area dependence of PEFC cold-start capability. J. Electrochem. Soc. 2015, 162, F1231–F1235. [Google Scholar] [CrossRef] [Green Version]
  33. Yang, Z.; Du, Q.; Huo, S.; Jiao, K. Effect of membrane electrode assembly design on the cold-start process of proton exchange membrane fuel cells. Int. J. Hydrogen Energy 2017, 42, 25372–25387. [Google Scholar] [CrossRef]
  34. Huo, S.; Jiao, K.; Park, J.W. On the water transport behavior and phase transition mechanisms in cold-start operation of PEM fuel cell. Appl. Energy 2019, 233, 776–788. [Google Scholar] [CrossRef]
  35. Yao, L.; Peng, J.; Zhang, J.; Zhang, Y. Numerical investigation of cold-start behavior of polymer electrolyte fuel cells in the presence of supercooled water. Int. J. Hydrogen Energy 2018, 43, 15505–15520. [Google Scholar] [CrossRef]
  36. U.S. Department of Energy. DOE Technical Targets for Fuel Cell Systems and Stacks for Transportation Applications. Available online: https://www.energy.gov/eere/fuelcells/doe-technical-targets-fuel-cell-systems-and-stacks-transportation-applications (assessed on 27 February 2019).
  37. Ge, N.; Banerjee, R.; Muirhead, D.; Lee, J.; Liu, H.; Shrestha, P.; Wong, A.K.C.; Jankovic, J.; Tam, M.; Susac, D.; et al. Membrane dehydration with increasing current density at high inlet gas relative humidity in polymer electrolyte membrane fuel cells. J. Power Sour. 2019, 422, 163–174. [Google Scholar] [CrossRef]
  38. Cheah, M.J.; Kevrekidis, I.G.; Benziger, J. Effect of interfacial water transport resistance on coupled proton and water transport across Nafion. J. Phys. Chem. B 2011, 115, 10239–10250. [Google Scholar] [CrossRef]
  39. Springer, T.E.; Zawodzinski, T.A.; Gottesfeld, S. Polymer electrolyte fuel cell model. J. Electrochem. Soc. 1991, 138, 2334–2342. [Google Scholar] [CrossRef]
  40. Gallagher, K.G.; Pivovar, B.S.; Fuller, T.F. Electro-osmosis and water uptake in polymer electrolytes in equilibrium with water vapor at low temperatures. J. Electrochem. Soc. 2009, 156, B330–B338. [Google Scholar] [CrossRef]
  41. Bertolini, D.; Cassettari, M.; Salvetti, G. Nucleation process and solidification rate of super-cooled water. Phys. Scr. 1988, 38, 404. [Google Scholar] [CrossRef]
  42. Alpert, P.A.; Knopf, D.A. Analysis of isothermal and cooling-rate-dependent immersion freezing by a unifying stochastic ice nucleation model. Atmos. Chem. Phys. 2016, 16, 2083–2107. [Google Scholar] [CrossRef] [Green Version]
  43. Jiang, S.; ter Horst, J.H. Crystal nucleation rates from probability distributions of induction times. Cryst. Growth Des. 2010, 11, 256–261. [Google Scholar] [CrossRef]
  44. Dursch, T.J.; Trigub, G.J.; Lujan, R.; Liu, J.F.; Radke, R.M.C.J.; Weber, A.Z. Ice-crystallization kinetics in the catalyst layer of a proton-exchange-membrane fuel cell. J. Electrochem. Soc. 2014, 161, F199–F207. [Google Scholar] [CrossRef]
  45. Pineri, M.; Gebel, G.; Davies, R.J.; Diat, O. Water sorption–desorption in Nafion® membranes at low temperature, probed by micro X-ray diffraction. J. Power Sour. 2007, 172, 587–596. [Google Scholar] [CrossRef]
  46. Plazanet, M.; Sacchetti, F.; Petrillo, C.; Demé, B.; Bartolini, P.; Torre, R. Water in a polymeric electrolyte membrane: Sorption/desorption and freezing phenomena. J. Membr. Sci. 2014, 453, 419–424. [Google Scholar] [CrossRef] [Green Version]
  47. Guillermo, A.; Gebel, G.; Mendil-Jakani, H.; Pinton, E. NMR and pulsed field gradient NMR approach of water sorption properties in Nafion at low temperature. J. Phys. Chem. B 2009, 113, 6710–6717. [Google Scholar] [CrossRef]
  48. Schmittinger, W.; Vahidi, A. A review of the main parameters influencing long-term performance and durability of PEM fuel cells. J. Power Sour. 2008, 180, 1–14. [Google Scholar] [CrossRef]
  49. Chacko, C.; Ramasamy, R.; Kim, S.; Khandelwal, M.; Mench, M. Characteristic behavior of polymer electrolyte fuel cell resistance during cold-start. J. Electrochem. Soc. 2008, 155, B1145–B1154. [Google Scholar] [CrossRef]
Figure 1. (a) Configuration of the Polymer electrolyte fuel cell (PEFC), and (b) the computational mesh.
Energies 13 00256 g001
Figure 2. The phase change and mass transfer process of water in PEFC [35].
Energies 13 00256 g002
Figure 3. Comparison between the present model and the experimental data 2 (denoted with symbols) with different cold-start temperatures. The dash-dot line denotes the variation of cell operating current density. The corresponding variation of cell voltage at different cold-start temperature is shown with the solid and dashed lines, respectively.
Energies 13 00256 g003
Figure 4. Evolution of cell voltage with various (a) startup current densities and (b) initial membrane water content. The cell is supplied with dry hydrogen and oxygen. The stoichiometry ratio of the mass flow rate is 2.0 for both anode and cathode sides. The cell starts from −20 °C and the background pressure is 1.0 atm at both the anode and cathode outlets.
Energies 13 00256 g004
Figure 5. Evolution of (a) the volume-averaged membrane water content and (b) the averaged volume fraction of supercooled water and ice in CCL; (c) the contour of ice volume fraction on midway cross section (Z = 25 mm) of CCL at time t = 35.2   s . The cell starts from −20 °C and the startup current density is 0.205 A/cm2. The cell is supplied with dry hydrogen and oxygen. The stoichiometry ratio of the mass flow rate is 2.0 for both anode and cathode sides. The background pressure is 1.0 atm at both the anode and cathode outlets.
Energies 13 00256 g005aEnergies 13 00256 g005b
Figure 6. (a) Evolution of the volume-averaged membrane water content and (b) the contour of membrane water content on midway cross section (Z = 25 mm) of ACL when the cell shuts down. The cell starts from −20 °C and the startup current density is 0.210 A/cm2. The cell is supplied with dry hydrogen and oxygen. The stoichiometry ratio of the mass flow rate is 2.0 for both anode and cathode sides. The background pressure is 1.0 atm at both the anode and cathode outlets.
Energies 13 00256 g006
Figure 7. The map of failure modes for the cell starts from (a) −20 °C and (b) −30 °C. The cell is supplied with dry hydrogen and oxygen. The stoichiometry ratio of the mass flow rate is 2.0 for both anode and cathode sides. The background pressure is 1.0 atm at both the anode and cathode outlets.
Energies 13 00256 g007
Figure 8. Evolution of (a) the cell voltage, and (b) the volume-averaged ice volume fraction in CCL. The cell starts from −20 °C with initial membrane water content λ 0 = 5.0 and current density I 0 = 0.30   A / cm 2 . The cell is supplied with dry hydrogen and oxygen. The stoichiometry ratio of the mass flow rate is 2.0 for both anode and cathode sides. The background pressure is 1.0 atm at both the anode and cathode outlets.
Energies 13 00256 g008
Figure 9. In process P1, the distribution of the membrane water content along the thickness of CCL, MEM and ACL at different time. The cell starts from −20 °C with initial membrane water content λ 0 = 5.0 and current density I 0 = 0.30   A / cm 2 . The cell is supplied with dry hydrogen and oxygen. The stoichiometry ratio of the mass flow rate is 2.0 for both anode and cathode sides. The background pressure is 1.0 atm at both the anode and cathode outlets.
Energies 13 00256 g009
Figure 10. Contours of (a) temperature, (b) membrane water content, and (c) membrane water diffusivity in the middle plane of CCL (XZ plane with Y = −0.01 mm) for the process P1 and P2 at the time 1.6 s later than the occurrence of freezing. The cell starts from −20 °C with initial membrane water content λ 0 = 5.0 and current density I 0 = 0.30   A / cm 2 . The cell is supplied with dry hydrogen and oxygen. The stoichiometry ratio of the mass flow rate is 2.0 for both anode and cathode sides. The background pressure is 1.0 atm at both the anode and cathode outlets.
Energies 13 00256 g010
Figure 11. Evolution of (a) the cell voltage, (b) the volume-averaged ice volume fraction in CCL. The cell starts from −20 °C with initial membrane water content λ 0 = 7.8 and current density I 0 = 0.33   A / cm 2 . The cell is supplied with dry hydrogen and oxygen. The stoichiometry ratio of the mass flow rate is 2.0. The background pressure is 1.0 atm at both the anode and cathode outlets.
Energies 13 00256 g011
Figure 12. The distribution of (a) ice volume fraction in CCL for the processes P3 and P4 at t = 11.9 s, and (b) membrane water content along the thickness of CCL, MEM, and ACL. The cell starts from −20 °C with initial membrane water content λ 0 = 7.8 and current density I 0 = 0.33   A / cm 2 . The cell is supplied with dry hydrogen and oxygen. The stoichiometry ratio of the mass flow rate is 2.0 for both anode and cathode sides. The background pressure is 1.0 atm at both the anode and cathode outlets.
Energies 13 00256 g012
Figure 13. The evolution of the ACL volume-averaged membrane water content in process P3 and P4. The cell starts from −20 °C with initial membrane water content λ 0 = 7.8 and current density I 0 = 0.33   A / cm 2 . The cell is supplied with dry hydrogen and oxygen. The stoichiometry ratio of the mass flow rate is 2.0 for both anode and cathode sides. The background pressure is 1.0 atm at both the anode and cathode outlets.
Energies 13 00256 g013
Table 1. Geometry and material parameters of the cell [35].
DescriptionSymbolValueUnit
Length, width and height of GC-50/1.0/1.0mm
Thickness of BP/GDL/MPL/CL/MEM δ 2.0/0.2/0.03/0.01/0.01mm
Porosity of GDL/MPL/CL ε 0.78/0.6/0.43-
Contact angle of GDL/MPL/CL θ 140/100/100 °
Permeability of GDL/MPL/CL K 10−12/10−13/10−13m2
Ionomer volume fraction in CL ω 0.15-
Equivalent weight of MEM E W 1100kg kmol−1
Density of BP/GDL/MPL/CL/MEM ρ 2230/1230/1230/1230/1980kg m−3
Specific heat of BP/GDL/MPL/CL/MEM C p 1071/462/568/2683/833J kg−1K−1
Thermal conductivity of BP/GDL/MPL/CL/MEM k 20/1.5/1.0/1.2/0.95Wm−1K−1
Electronic conductivity of BP/GDL/MPL/CL κ s 20000/300/300/300S m−1
Table 2. The boundary conditions.
DescriptionType/ValueUnit
Anode/cathode inletmass flow inletKg s−1
Stoichiometry ratios of anode/cathode inlet2.0-
Relative humidity of anode/cathode inlet0.0-
Temperature of anode inlet−20/−30°C
Temperature of cathode inlet−20/−30°C
Pressure of anode/cathode outlet1.0atm
Potential of solid phase on anode BP end surfaces ϕ s 0V
Potential of solid phase on cathode BP end surfacesgalvanostatic
Potential of electrolyte phase on BPs end surfaces ϕ e / n 0-
Heat transfer characteristics of BP end surfacesadiabatic-
Sides of the computational domainsymmetric-
Table 3. The failure modes in the ambiguous zone with startup temperature −20 °C.
Startup ConditionFreezing Occurs EarlierFreezing Occurs Later
λ 0 = 5.0 , I 0 = 0.30   A / c m 2 Anode dehydration (Process P1)Cathode pore blockage (Process P2)
λ 0 = 7.8 , I 0 = 0.33   A / c m 2 Cathode pore blockage (Process P3)Anode dehydration (Process P4)

