1. Introduction
Combined heat and power (CHP) accounts for approximately 50% of the heat sources in northern China. It can efficiently generate heat and electricity simultaneously, which is considered the most efficient heating method. With the development of flue gas treatment, a CHP plant can achieve nearly zero emission of pollutants, making it also an environmentally friendly system [
1]. CHP has been widely used in the era of energy conservation and emission reduction, and thus, it is the main energy resource in northern China. However, owing to the current situation that heat and most of the power are locally used, the characteristics of heat and electricity consumption in the cities sometimes do not match those of the CHP supply. For example, the Chinese government has promoted the coal-to-gas transition in Beijing during these years. Coal-fired CHPs have been gradually replaced by gas-fired ones. Gas-fired CHPs have higher generation efficiency than that of coal-fired ones. Hence, to guarantee the heating supply, more electricity has been generated, which intensifies the power excess. Besides, the power transmission capacity between regions in China is limited, which has caused huge problems in the energy system. Furthermore, the electricity-regulating ability of CHP is weak in wintertime owing to the operation of CHP systems based on heat demand. The relative amount of heat and electricity generated in CHP can only change within a limited range. Given that the amount of demand for heat and electricity varies from city to city, it is necessary to research the characteristics of the demand and supply sides of urban systems, which can help guide energy planning in the future. To describe the relative amount of heat and electricity through a simple, intuitive, and quantitative way, the urban demand or supply heat-to-power ratio is adopted as the ratio of heat demand to electricity demand or the ratio of heat supply to electricity supply. This paper discusses the matching of the demand and supply sides of a city based on this parameter.
Kevin Brown pointed out that the CHP capacity declined from the 1950s to the 1980s in the UK because the changes in the process operations of the industry led to a decrease in the heat-to-power ratio [
2]. The increase in the power-generation efficiency of CHP and power savings in industrial production boosted a revival of interest in CHP in the 1990s. Vincenzo Liso investigated the capability of a micro-CHP (mCHP) system, which comprised an mCHP unit solid oxide fuel cell (SOFC), boiler, and storage tank, to cover the heat and electricity demand of a single-family residence [
3]. He concluded that the mCHP system’s heat-to-power ratio range of 0.5–1.5 shows good agreement with the hot water and electricity demand but is not sufficient to cover the space heating demand over the whole year; an auxiliary boiler and a hot water storage tank must be coupled with it. Yoshida compared the optimal operation between polymer electrolyte membrane fuel cell co-generation system and a reference system (a conventional combination of a condensing gas boiler and electricity purchased from the grid) [
4]. The results showed that the heat-to-power ratio of demand would affect the primary energy saving of the co-generation system, while the calculation only considered the electricity and domestic hot water demand. Then, J. Lamas proposed a residential heat and power cogeneration system using an SOFC with a variable ratio of hydrogen added to natural gas [
5]. With respect to the seasonal power and heat demands, the heat-to-power ratio can be regulated by changing the hydrogen addition ratio. Cho analyzed a CHP system connected to the power grid, to thermal storage, and to an auxiliary boiler. He pointed out that the amounts of power and heat produced by a CHP unit are coupled and do not necessarily match the corresponding demand. He therefore concentrated more on finding an economic installation of CHP [
6]. Ko proposed a new optimization model of generation expansion planning for an integrated energy system considering the feasible operation region and efficiency of a combined heat and power (CHP) resource [
7]. Heat-to-power ratio and generation efficiency were chosen as the two important parameters to verify that the proposed model could provide a cost-effective expansion plan. Feidt also used heat-to-power ratio as a parameter to do the energy and exergy analysis and optimization of CHP systems [
8].
As for the supply side of the urban energy system, CHP has been used in industrial applications, buildings, and waste disposal systems in industrialized countries since the nineteenth century. Various fuels have been used for CHP: natural gas, refinery gas, gas extracted from landfill sites, oil, coal, peat, coke, waste, and biomass [
9]. Researchers have already made efforts to improve the energy efficiency of CHP. As for power generation, a higher pressure of the main steam can rapidly increase the power-generation efficiency. Therefore, supercritical and ultra-supercritical CHP power plants have been developed and the gas-steam combined cycle uses gas and steam turbines together to achieve an even higher power-generation efficiency. Today, the power-generation efficiency of coal-fired or gas-fired power plants can reach 45% or 59%, respectively. With the increase in power-generation efficiency, the power plants produce more electricity and less heat, which means that the heat-to-power ratio decreases. Regarding the heating efficiency, heat recovery is the key point. As for the coal-fired CHP, many researchers have concentrated on the waste heat from the exhausted steam. Because the temperature of the exhausted steam is 30–40 °C, it is important to reduce the return water temperature. Fu has proposed a new heating method to realize a low return temperature by absorption heat pumps (AHPs) associated with the municipal network, which helps to save energy by 23–46% compared to the conventional district heating (DH) system [
10] After analyzing a new method similar in terms of both thermodynamics and economics, Sun found that it increased the heating capacity of CHP through waste heat recovery by 31%, enhanced the heat transmission capacity of the existing primary side district heating network by 75%, and reduced the irreversible heat loss in the process of heat transfer [
11]. Sun then showed experimental data of the absorption heat exchanger [
12] and a real project [
13] in Datong, which has also been introduced by Li [
14], to confirm the decrease in return water temperature and the heat recovery from CHP power plants. For the gas-fired CHP, in addition to heat recovery from the exhausted steam, heat recovery from the flue gas is another important aspect. Fu has suggested an innovative natural-gas CHP system that comprises an internal combustion engine (ICE), exhaust-gas-driven AHP, and flue gas condensation heat exchanger (CHE), which could recover both the sensible and latent heat of the flue gas [
15]. It can increase the heat utilization efficiency by 10% compared to conventional CHP systems, and with it the system has much more thermal inertia than the electricity-generation component. Maolin Wei described an open-cycle AHP, which could also recover the waste heat of the flue gas and increase the heat supply by 11% [
16]. Zhao introduced a flue gas recovery system with distributed peak-shaving heat pumps, which can achieve a 40% increase in heating at the peak stage [
17]. Furthermore, Sun has also designed a new type of evaporator to condense the exhausted steam directly, which can avoid an additional heat exchange process. The CHP can provide more electricity with the help of all these heat recovery methods [
18]. Meanwhile, the heat-to-power ratio can be increased.
As for the demand side of the urban energy system, Liso, etc., have already introduced the characteristics of the demand side in their research systems. Many standards for energy saving have been released to reduce the energy demand of each sector. Some researchers, like Mazin, have already studied the demand response to help optimize the structure of the demand side of a power system [
19].
As can be observed, many important studies have already been performed. They concentrate more on small-scale CHPs, for a single building or industry plant. In these studies, the CHP heat-to-power ratio is not well-suited in the referenced systems. However, the heating and power generation efficiency of the CHP can be improved in many ways. Moreover, it is still necessary to know what will happen in the holistic urban energy system. Therefore, this study performs an analysis of the characteristic heat-to-power ratios from the supply and demand sides of cities in northern China.
2. Methodology
2.1. Definition of Urban Heat-to-Power Ratio
Two types of urban heat-to-power ratios can be defined: supply heat-to-power ratio and demand heat-to-power ratio.
The supply heat-to-power ratio is defined for various heating methods. It represents the relative ability to supply heat and electricity. If the value of the supply heat-to-power ratio is negative, it means that the method consumes electricity and supplies heat, as a heat pump.
In this study, the demand heat-to-power ratio is defined for a city. It represents the relative amount of heat and electricity demand of a city. Unlike foreign countries, district heating only includes space heating and does not include domestic hot water. Therefore, “heat demand” here just means space heating, and the domestic hot water demand is not included. Then, the use of this system only makes sense during the heating season.
The calculation method of the heat-to-power ratio is introduced in the following sections.
2.2. Maximum Supply Heat-to-Power Ratio
The calculation formula of the urban supply heat-to-power ratio
for the ith heating method is shown as Equation (1), where
is the heat supply for the ith heating method and
is the electricity supply for the ith heating method. Specially,
will be negative if the ith heating method consumes electricity.
When = 0, the heating method neither consumes nor supplies electricity, and only supplies heat. Then, and combined with CHP, the supply heat-to-power ratio of CHP system will increase.
When , the heating method consumes electricity and supplies heat, which can help increase the heat-to-power ratio of the supply side.
When , the heating method can supply heat and electricity together, as a CHP plant. It can regulate the heat and power generation, so the supply heat-to-power ratio can be changed, and if the maximum supply heat-to-power ratio is greater than the maximum demand heat-to-power ratio, the demand can be satisfied. Therefore, only the maximum supply heat-to-power ratio is considered in the following sections.
The supply heat-to-power ratio can be obtained from actual products or engineering projects. Then, the estimation can be done for each type of heating method.
2.3. Maximum Demand Heat-to-Power Ratio
The calculation formula of the urban demand heat-to-power ratio
for
city A is given by Equation (2), where
is the heat demand for
city A and
is the electricity demand for
city A.
The demand heat-to-power ratio varies in the heating season because the electricity demand is almost the same, but the heat demand depends on the outside temperature. However, as was mentioned before, the maximum demand heat-to-power ratio is the most important factor. Hence, only the maximum demand heat-to-power ratio is calculated.
Since electricity demand is almost the same during the heating season, the maximum demand heat-to-power ratio occurs in the maximum heat-demand day, which is the coldest day of the year.
Next, the statistics of the building area and the electricity demand are from the China City Statistical Yearbook and its relevant reports. The heat demand is calculated as following, where
is the heat demand for
city A,
is the building area for
city A, and
is the peak heat load per m
2 for
city A.
can be obtained from the actual projects.
After the estimation, the maximum demand heat-to-power ratio of each city can be calculated with Equation (2). Then, according to the calculation, the characteristics of the demand side of the urban energy system can be analyzed.
3. Results
3.1. Maximum Supply Heat-to-Power Ratio
The heat-to-power ratios of eight main heating methods have been calculated: coal-fired CHP, gas-fired CHP, biomass CHP and waste-to-energy, boilers and industrial surplus heat, electric heat pumps, and electric boilers.
3.1.1. Coal-Fired CHP
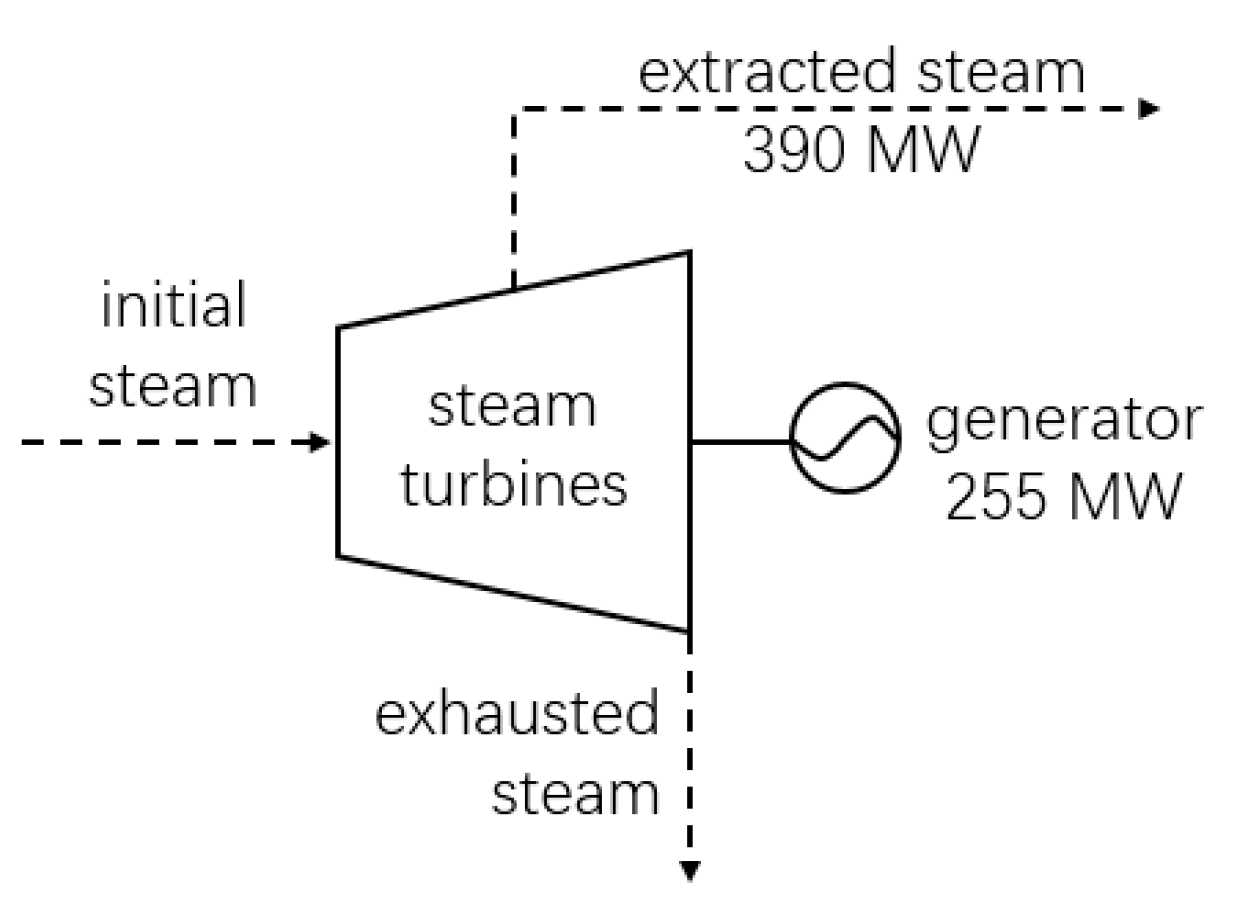
A typical-scale 300-MW-class CHP is chosen for the calculation. Many CHP systems run in an extraction–condensing mode to guarantee the flexible regulation of the plant. They extract steam from the outlet of the intermediate pressure cylinder to supply heat. As shown in
Figure 1, the CHP can supply 390 MW of heat and 255 MW of electricity at the same time, which means that the supply heat-to-power ratio of this configuration is 1.5.
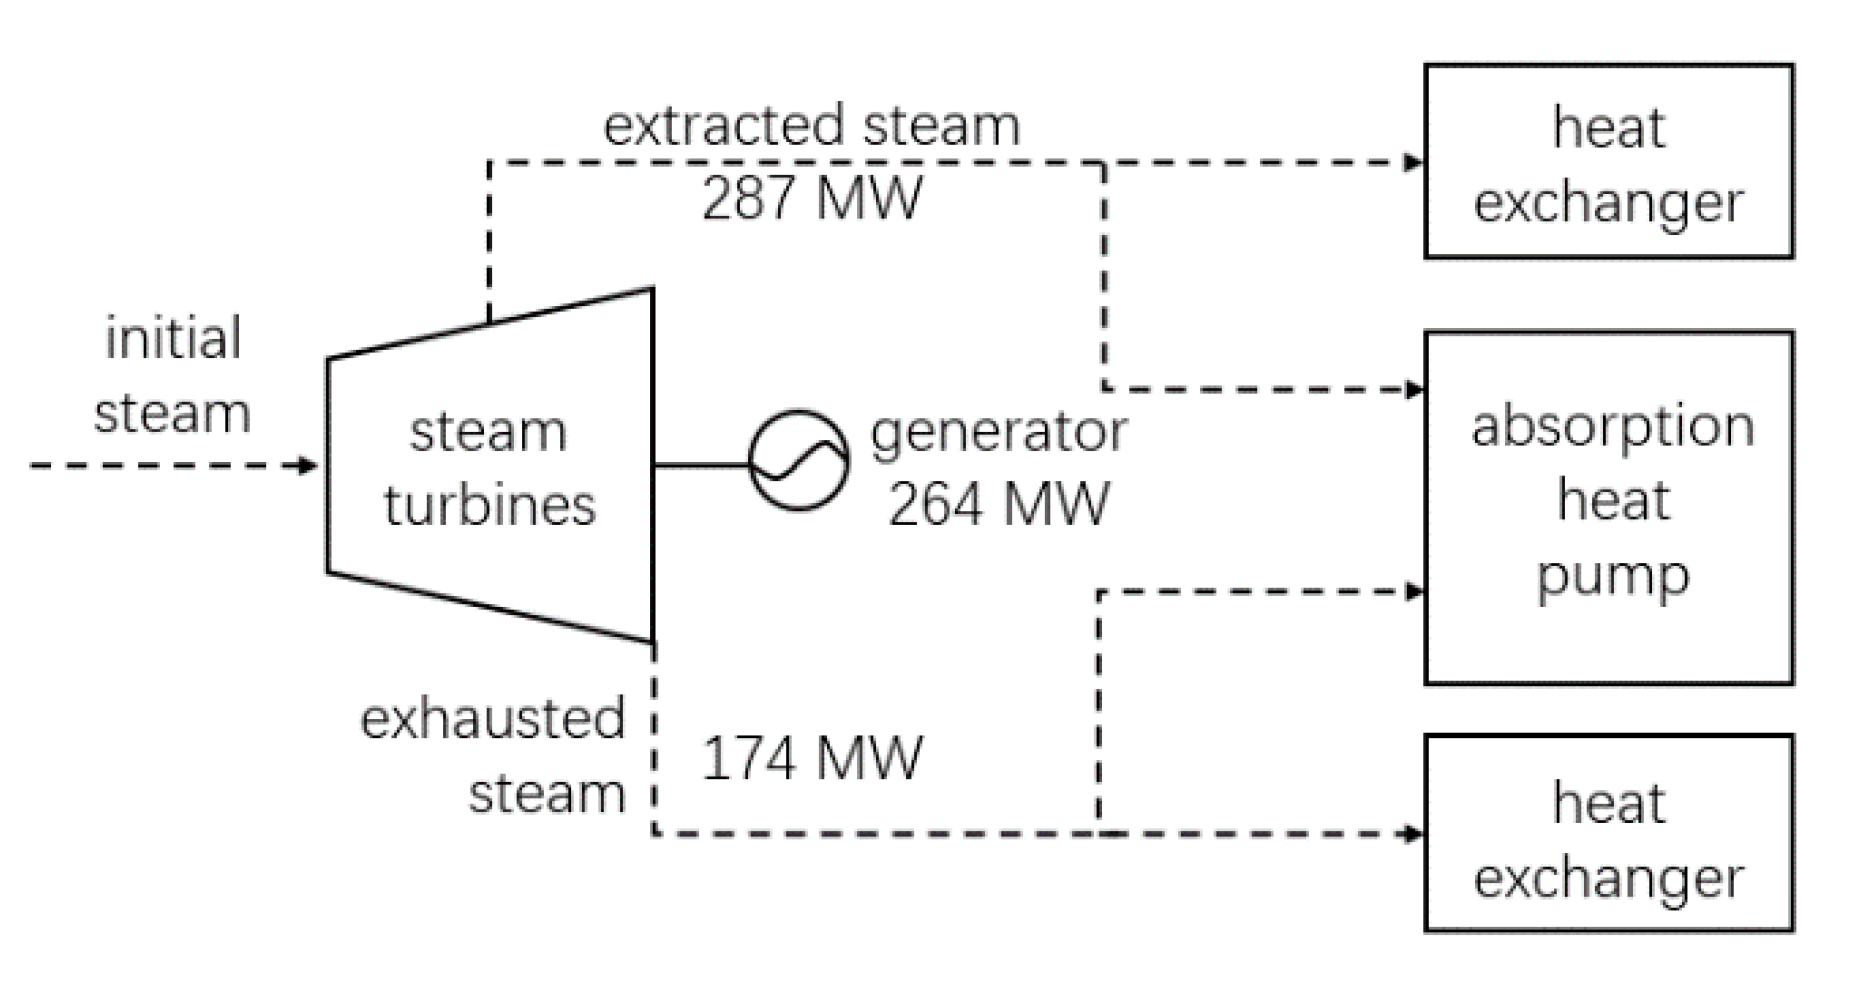
In this normal configuration, there is a large amount of heat in the exhausted steam. There are other two configurations to recover heat: one is to recover the excess heat with an AHP, as shown in
Figure 2. The CHP can supply 461 MW of heat and 264 MW electricity simultaneously, which means the supply heat-to-power ratio of this configuration is 1.75.
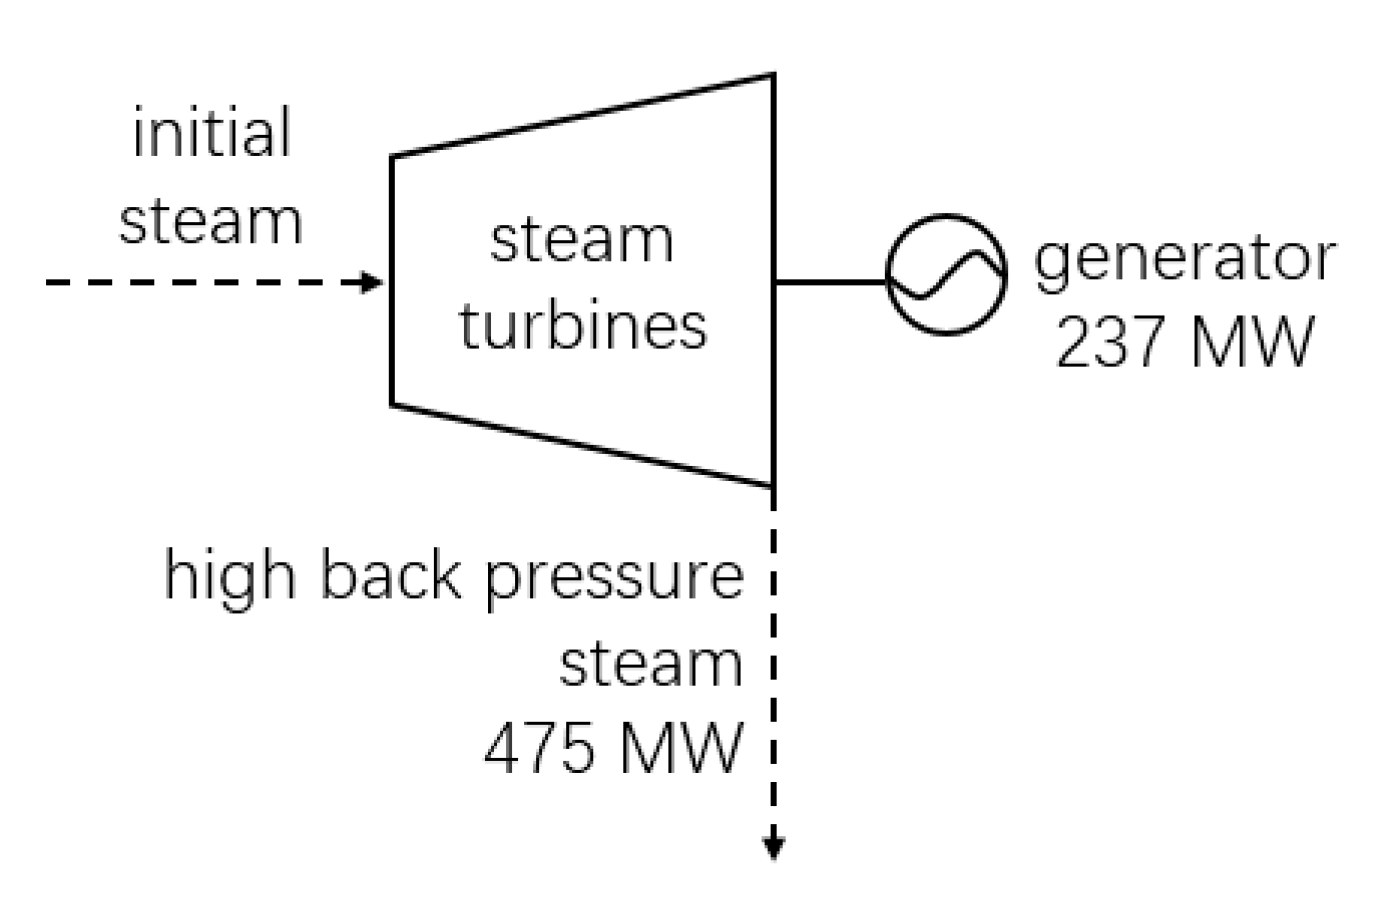
The other configuration changes from an extraction–condensing mode into a back-pressure mode, as shown in
Figure 3. The CHP can supply 475 MW of heat and 237 MW of electricity simultaneously, which means that the supply heat-to-power ratio of this configuration is 2.
Liao has also performed some calculations [
20] and it can conclude that the supply heat-to-power ratio is 1.5–1.8 for the coal-fired CHP without heat recovery and 1.8–2 for the coal-fired CHP with heat recovery.
3.1.2. Gas-Fired CHP
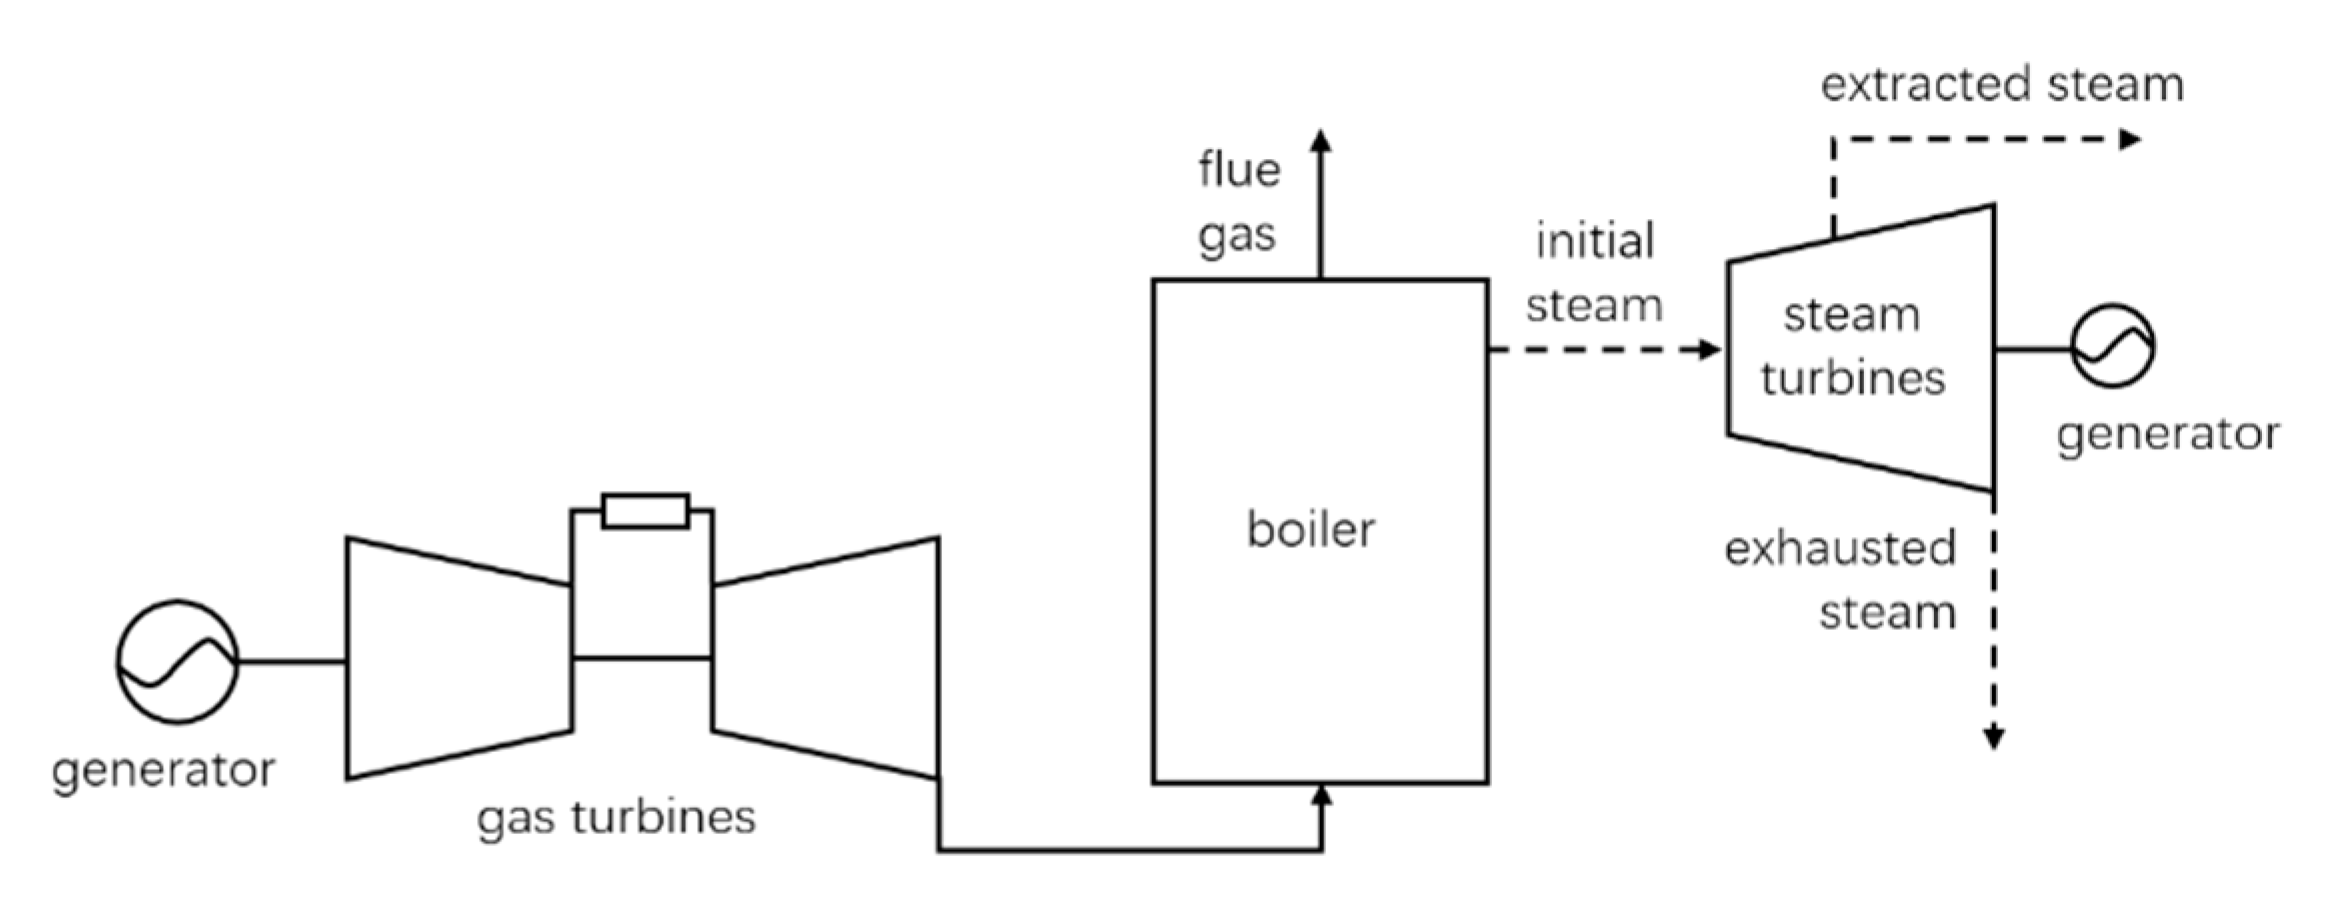
A typical type of 9F gas-fired power plant is chosen, and the calculation is similar to that of the coal-fired CHP. The normal configuration is shown in
Figure 4.
In the normal configuration, the CHP can supply 795 MW of electricity and 529 MW of heat, which means that the supply heat-to-power ratio is 0.67. The excess heat can also be recovered from the exhausted steam. If so, 790 MW of electricity and 628 MW of heat are gained, which means that the supply heat-to-power ratio increases to 0.8. The difference from the coal-fired CHP is that burning natural gas can produce much more water in the flue gas, and thus, the excess heat of the flue gas is significant. After recovering the excess heat of the flue gas with the adsorption heat pump, it can achieve 782 MW of electricity and 748 MW of heat, which means that the supply heat-to-power ratio can be raised to almost 1.
Therefore, it can be concluded that the supply heat-to-power ratio is approximately 0.6–0.7 for the gas-fired CHP without heat recovery and 0.8–1 for the gas-fired CHP with heat recovery.
3.1.3. Biomass CHP and Waste-to-Energy
Today, biomass CHP and waste-to-energy are developing rapidly [
21]. These CHP plants use biomass and waste as fuels, but still use a steam turbine to generate power. Even though the pressure of the initial steam is lower, the principle of heating and power generation is similar. Most of these plants are running in back-pressure mode, and thus, the configuration is similar to that in
Figure 3. The power generation efficiency is mainly between 20% to 30% [
22], which means that the supply heat-to-power ratio is approximately 2.3–4 with a total heat recovery.
3.1.4. Boilers and Industrial Surplus Heat
Boilers and industrial surplus heat are two heating methods that only supply heat and have no relation with electricity. Therefore, the supply heat-to-power ratio of these methods is .
Although they have the same supply heat-to-power ratio, they are completely different heating methods. Industrial surplus heat is the most efficient heating method because it just recovers the surplus heat to supply heat without consuming any other valuable energy resource. Boilers directly burn fuels to supply heat for space heating, which, to some degree, is a waste of energy with low efficiency. However, in some conditions, the boilers are needed to supply heat, and the evaluation of the boiler depends on its fuel; biomass boilers are better than gas- and coal-fired boilers.
3.1.5. Electric Heat Pump
This type of heating method consumes electricity and supplies heat. Therefore, these methods have a negative supply heat-to-power ratio. Comparing the definition of the supply heat-to-power ratio and the COP of the heat pump, it is known that the absolute values of these two parameters are the same. The term electric heat pump refers to all types of heat pumps, such as the ground-source, air-source, and water-source heat pumps. Their COP is in the range of 3–4. Therefore, the supply heat-to-power ratio for an electric heat pump range from −4 to −3.
3.1.6. Electric Boilers
The electric boiler is a type of heating method that converts electricity directly into heat. However, its efficiency is very low. Electric boilers can be used effectively only in areas where the temperature is so low that an electric heat pump could not operate. The supply heat-to-power ratio is −1.
To conclude, the supply heat-to-power ratios of different heating methods are summarized in
Table 1.
3.2. Maximum Demand Heat-to-Power Ratio
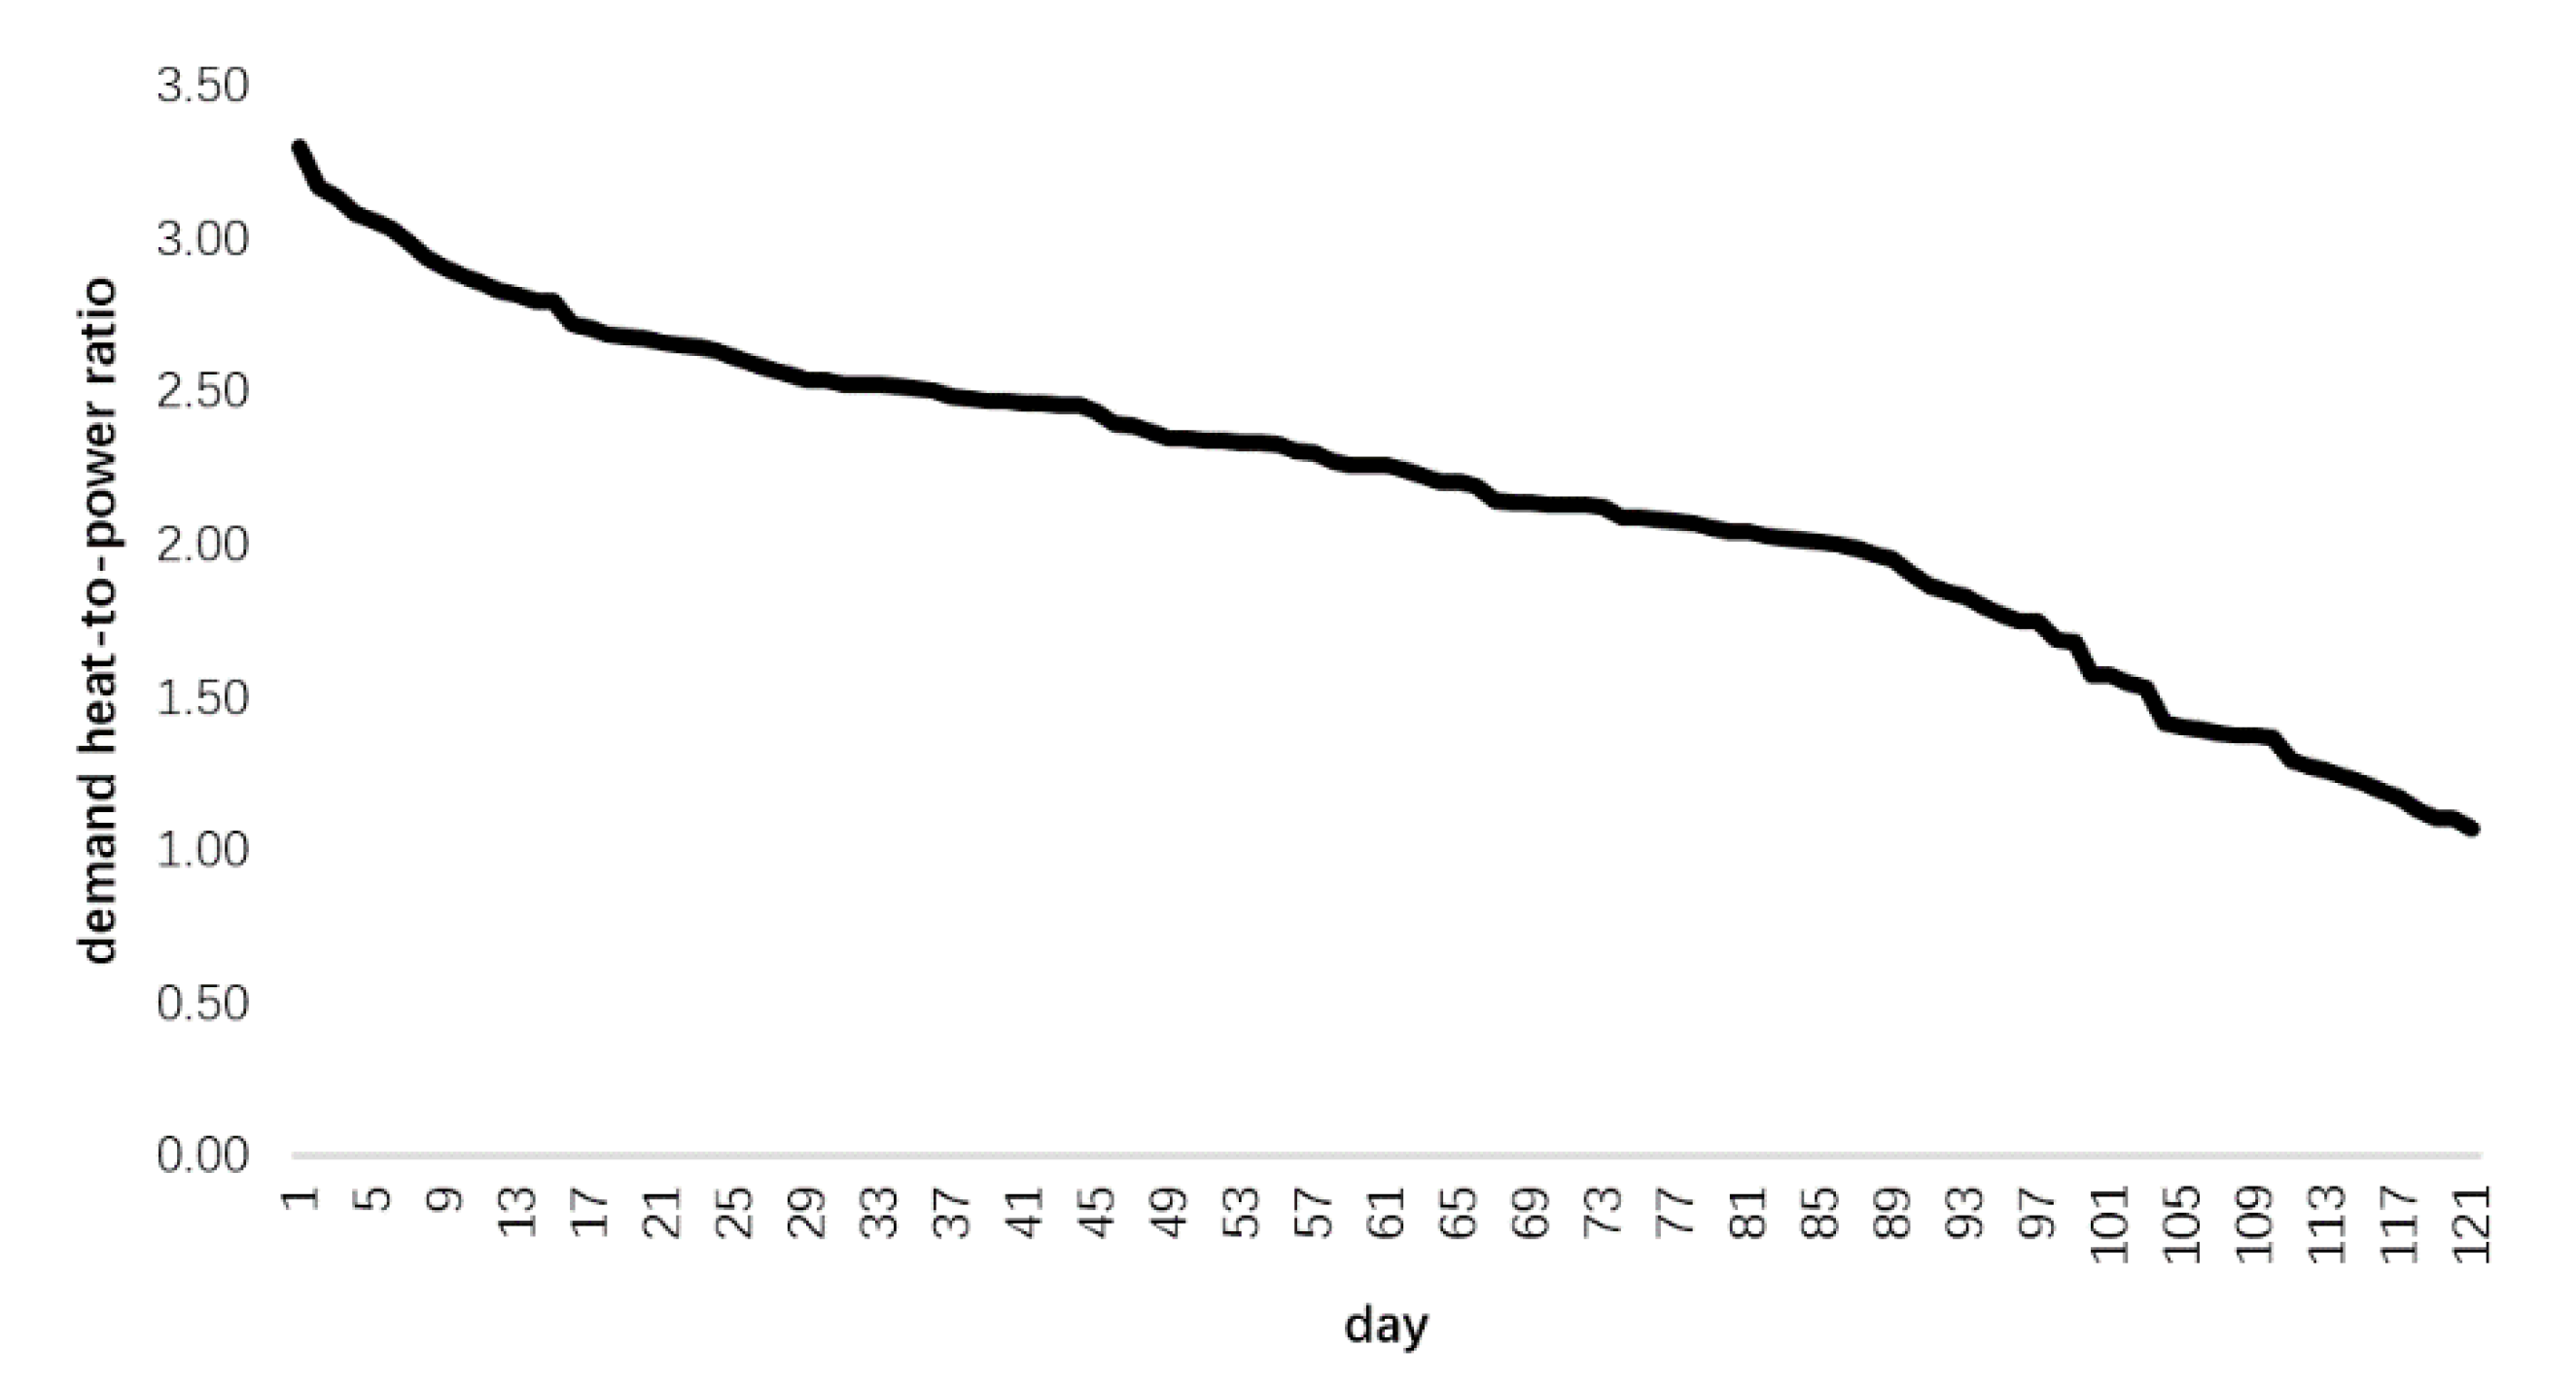
First, the maximum heat-to-power ratio duration diagram for Beijing,
Figure 5, shows that different cities have different annual maximum heat-to-power ratios and the daily heat-to-power ratio truly varies during the heating season.
Then, 19 typical cities are chosen across northern China for the calculation using the method mentioned in the previous section, and the results are listed in
Table 2. Most of them are capital cities of the provinces in northern China, and they can represent the status of energy demand in most cities.
As can be observed, the maximum demand heat-to-power ratio varies from 1.0 to 5.9 between different cities. After the analysis, it can be concluded in two aspects.
First, location. Harbin and Changchun are in the northern part of China, hence, the climate is colder, and they have higher demand heat-to-power ratios, as shown in
Figure 5. For these cities, the heat demand is dominant.
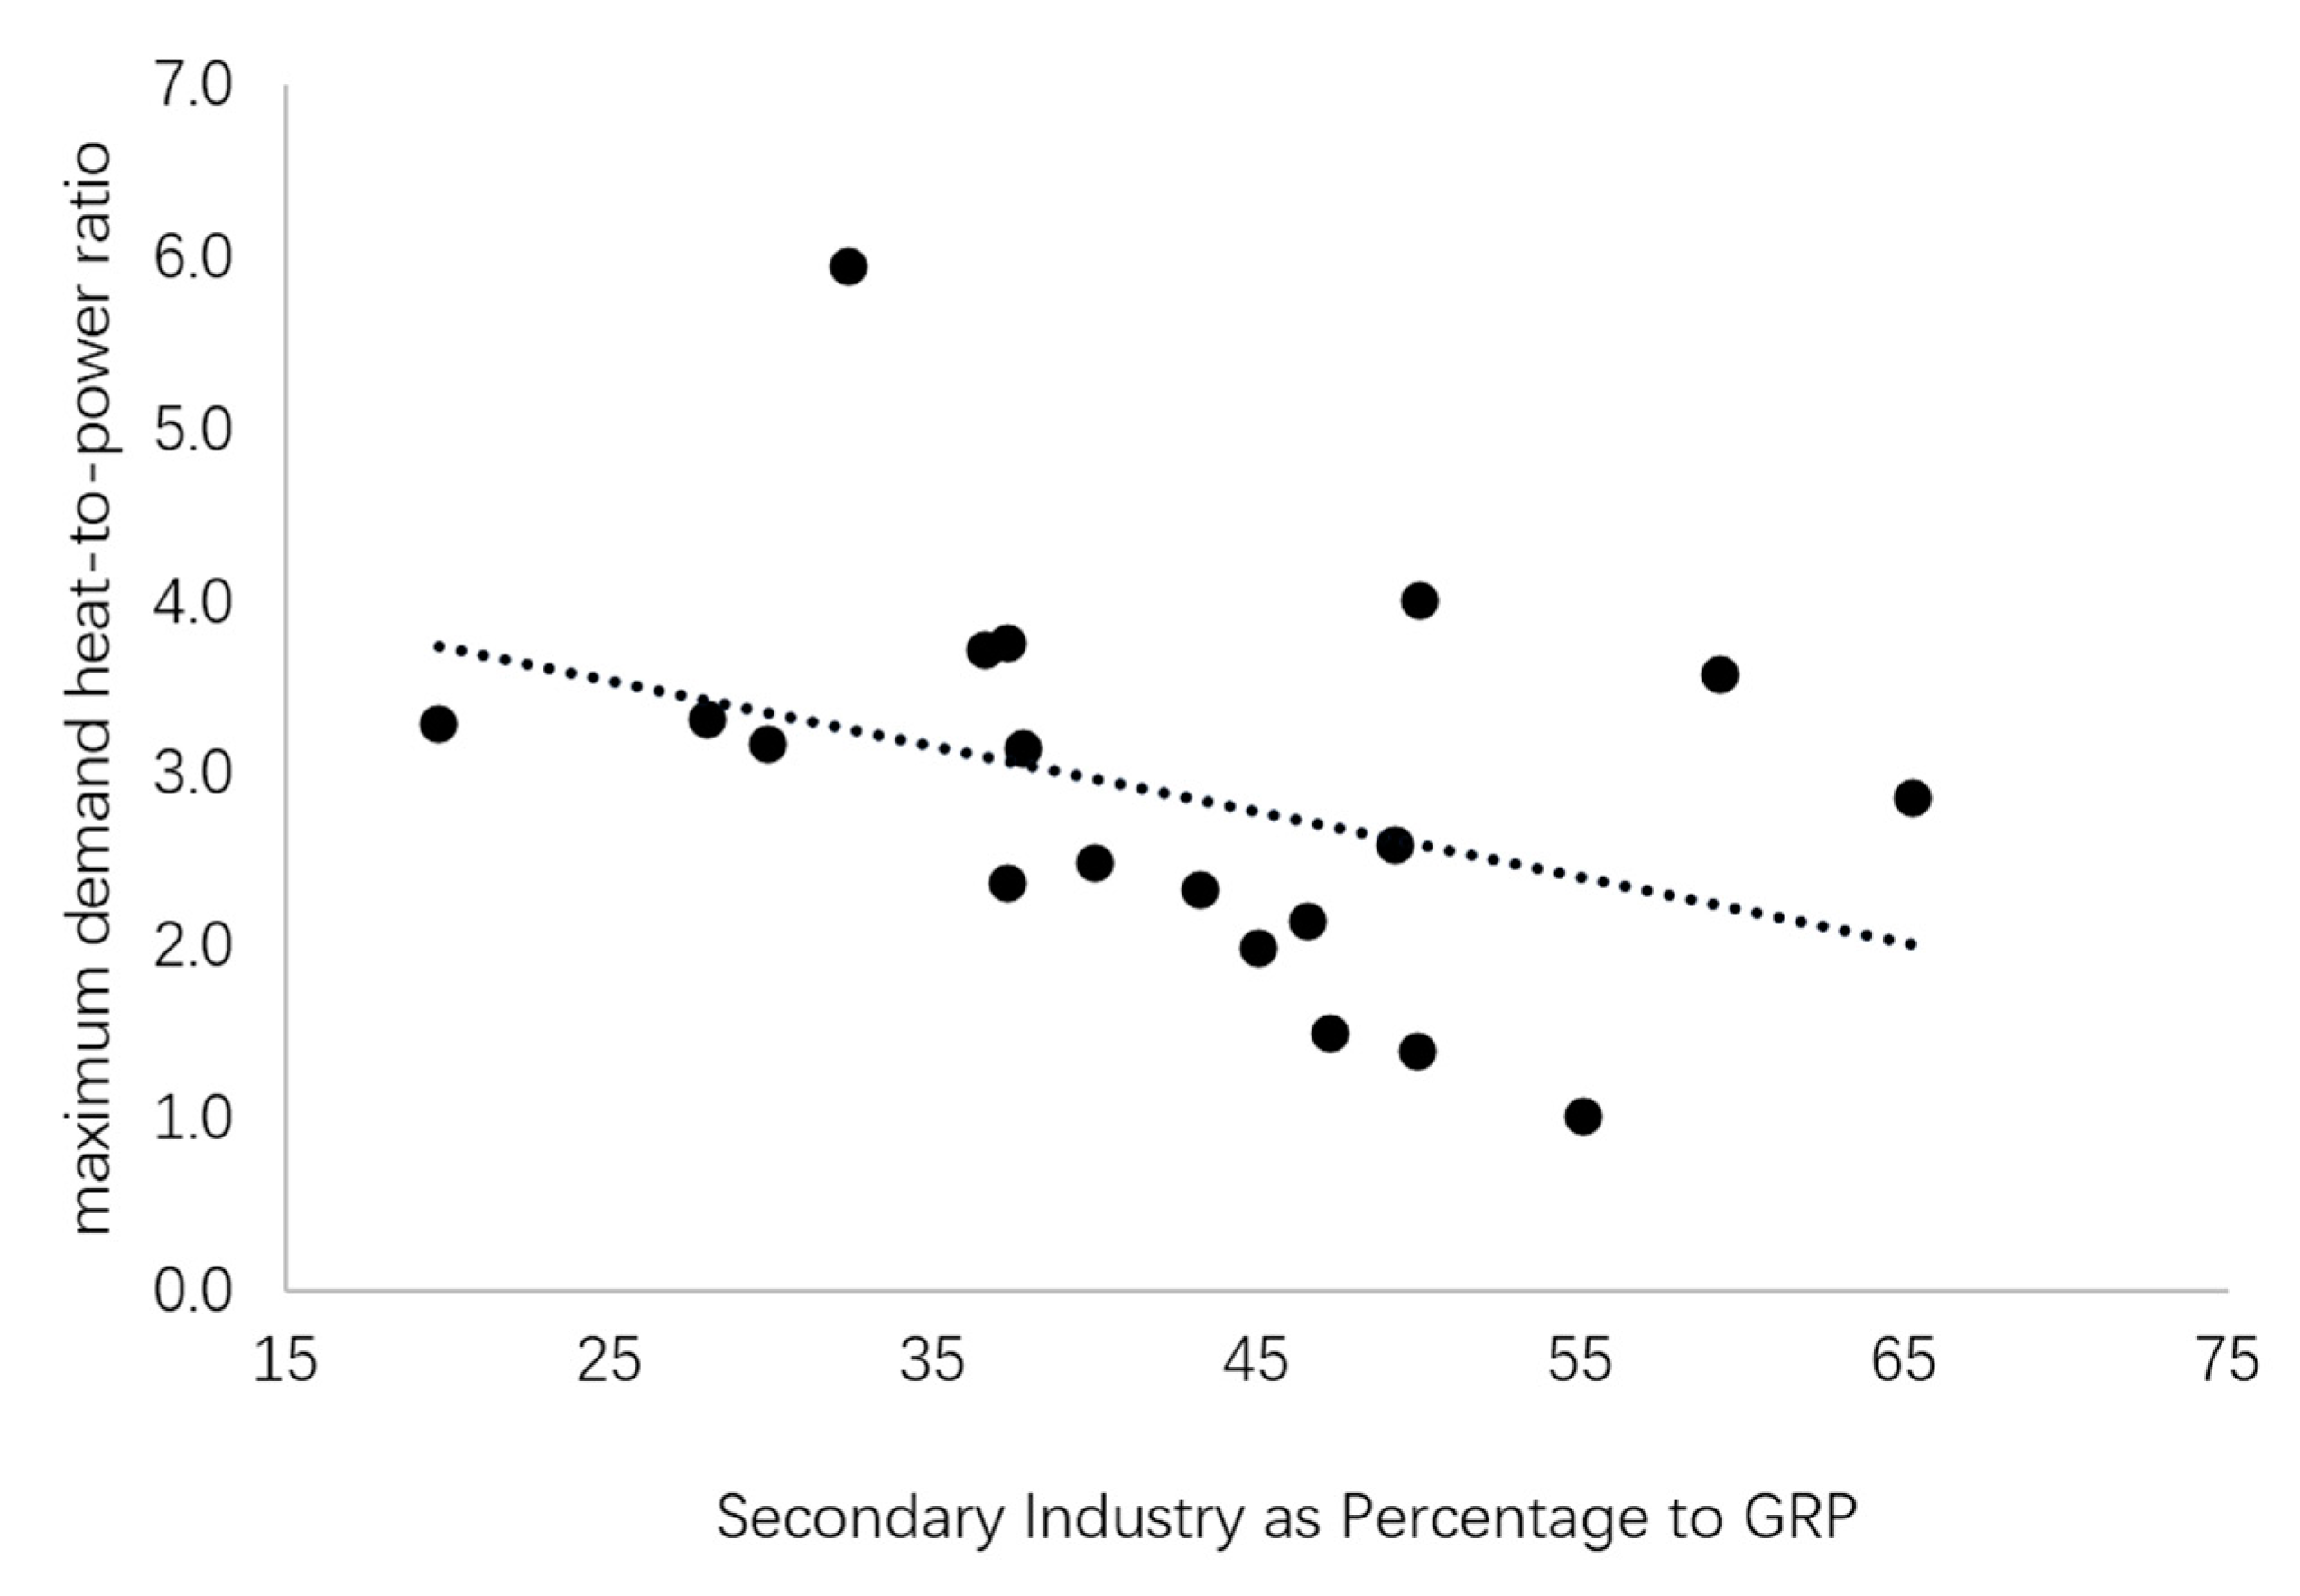
Second, the demand heat-to-power ratio is also related to the industrial structure. The data of the proportion of the primary, secondary, and tertiary industries in the gross regional product (GRP) for each city can be obtained from the China City Statistical Yearbook, as listed in
Table 2.
It can be observed that the proportion of the secondary industry closely represents the relative electricity demand level of each city. Moreover, if the secondary industry is dominant, it is called an industrial production city. Otherwise, it is called a consumer city. It is shown that almost all the industrial production cities, which have a high proportion of the secondary industry, have a low demand heat-to-power ratio, as shown in
Figure 6.
Tongchuan and Hebi have also a high proportion of secondary industry but a high demand heat-to-power ratio. After further investigation, it is found that they have a high proportion of power generation. Thus, even though the proportion of secondary industry is high, they still have a high demand heat-to-power ratio.
By comparing the results from the supply and demand sides of the urban energy system, it is found that, in most cities, the demand heat-to-power ratio is higher than the supply heat-to-power ratio, which reveals a mismatch between the supply and demand sides of the urban energy system.
Furthermore, the main fuel for the main heating method, CHP, is still coal. The trend for the development of CHP in China is to enlarge its size. The 300-MW-class CHP has become a typical type. Meanwhile, the gas-fired CHP, biomass CHP, and waste-to-energy have begun to develop in recent years. However, the development of gas-fired CHP in Beijing has encountered problems. Beijing started the coal-to-gas initiative in 2013, and the four main coal-fired CHP centers have been gradually replaced by gas-fired CHP centers. CHP plants in Beijing were all gas-fired for the first time in 2017, but the heating system broke down several times during the heating season in 2016–2017. Because of their higher power-generation efficiency, gas-fired CHP plants generate more electricity and less heat. This results in a significant decrease in heat-to-power ratio, which exacerbates the current situation of power surplus. To reduce the electricity generation, some gas-fired CHP plants were shut down, which also led to the reduction in heat. Not only could the heating not be guaranteed, but the heating pipes also burst because of sudden changes in the water temperature. The person in charge from the Beijing District Heating Group told us that the reduction in power generation happened no less than five times during that heating season. The gas-fired CHP has a higher power-generation efficiency and a more flexible regulation. But if the gas-fired CHP cannot help balance the energy demand and supply, it can result in a severe problem. The biomass CHP and waste-to-energy plants are of a small scale, and the fuel for these plants is sometimes insufficient.
To conclude, it is necessary to research a method to develop the CHP and determine the type of CHP that can be promoted to find a suitable way to balance the supply and demand sides.
4. Discussion
As was explained in the previous part, the demand heat-to-power ratio of most cities is higher than the corresponding supply heat-to-power ratio. If the demand heat-to-power ratio is greater and given that the heat demand must be guaranteed, an excess of electricity will arise and the export of electricity can help reduce the excess. In the Nordic countries, the excess electricity can be easily exported to adjacent cities or even neighboring countries, which can help overcome the electricity excess and make CHP a stable heat source. In China, generation is distributed in the western and northeastern parts of the nation, and there is also a significant heat demand in these areas. The southeast may be the best option to receive the exported electricity. However, large-scale, long-distance transmission is not easy to realize in China in the current situation, and the construction of power infrastructure needs to be improved in the following years.
The balance of the supply and demand sides of the urban energy system cannot be achieved only by electricity export [
23]. Changes are still needed in both sides, and the key point is to increase the supply heat-to-power ratio and decrease the demand heat-to-power ratio. This is not the only goal for the urban energy system, as being more efficient and cleaner are also important targets. Hence, the CHP should also be the main heating method for its high efficiency. Based on this premise, probable methods are raised to achieve the stated target.
For increasing the supply heat-to-power ratio, the following seven aspects should be considered:
The development of gas-fired CHP for heating in northern China needs to be restricted because its low supply heat-to-power ratio will intensify the excess of electricity. The effect of gas-fired power plants on reducing PM2.5 is not obvious, and the emission of the key factor NOx is not clearly reduced [
24].
Heat recovery should be setup in all the CHP plants. As presented in
Table 1, for both coal- or gas-fired CHP, heat recovery can help improve the supply heat-to-power ratio by approximately 30–40%.
The industrial surplus heat should be widely adopted to help increase the supply heat-to-power ratio. The potential of industrial surplus heat in northern China is huge [
25], and it is technically available and economically acceptable.
Highly efficient electric heating, such as the heat pump, can be adopted. When combined with CHP, it can reduce the entire electricity supply and increase the heat supply to match the supply heat-to-power ratio. Owing to their low efficiency, electric boilers are not recommended.
Although biomass CHP and waste-to-energy have a low power-generation efficiency, they are very appropriate for heating because their supply heat-to-power ratio suits the demand side well.
Boilers can be considered to participate in the peak load regulation. Biomass boilers have development priority, and then gas-fired boilers can be considered. In particular, the flue gas treatment should receive special attention.
Energy storage devices, such as batteries, can help store electricity to reduce the output of power. Then, the supply heat-to-power ratio can be raised. However, the investment would be very high.
The demand heat-to-power should be decreased to improve the electricity demand and decrease the heat demand. Here, two aspects are involved:
The heat demand should be reduced by controlling the quality of the retrofit and construction of buildings. As for the existing buildings, a planned energy saving retrofit needs to be achieved. For newly built buildings, the construction should meet the GB/T 51161-2016 Standard for energy consumption of buildings.
The level of electrification should be improved. Cooking and transportation can easily be electrified these days. This will help increase the electricity demand in the city. Furthermore, renewable energy, such as wind power, solar power, and wave power, is also a form of electric energy. Thus, improving the proportion of electricity in the terminal energy system will also help accommodate renewable energy. This will be an inevitable trend.
5. Case study of a New Area in Northern China
Here, a new area,
City X, in northern China as a case study is chosen to demonstrate how to balance the heat-to-power ratio from the supply and demand sides of cities in northern China.
City X has a population of 3 million and a construction area of 220 million m
2, as presented in
Table 3.
First,
is calculated with the method described in
Section 2, the maximum demand heat-to-power ratio of
City X with the current energy consumption level. As for heating, the peak heat load per m
2 for
City X in the urban area and the towns is 35 W/m
2 and 40 W/m
2 for the villages. Therefore, the peak heat load for
City X is 7748 MW. As for power, there is no industry in
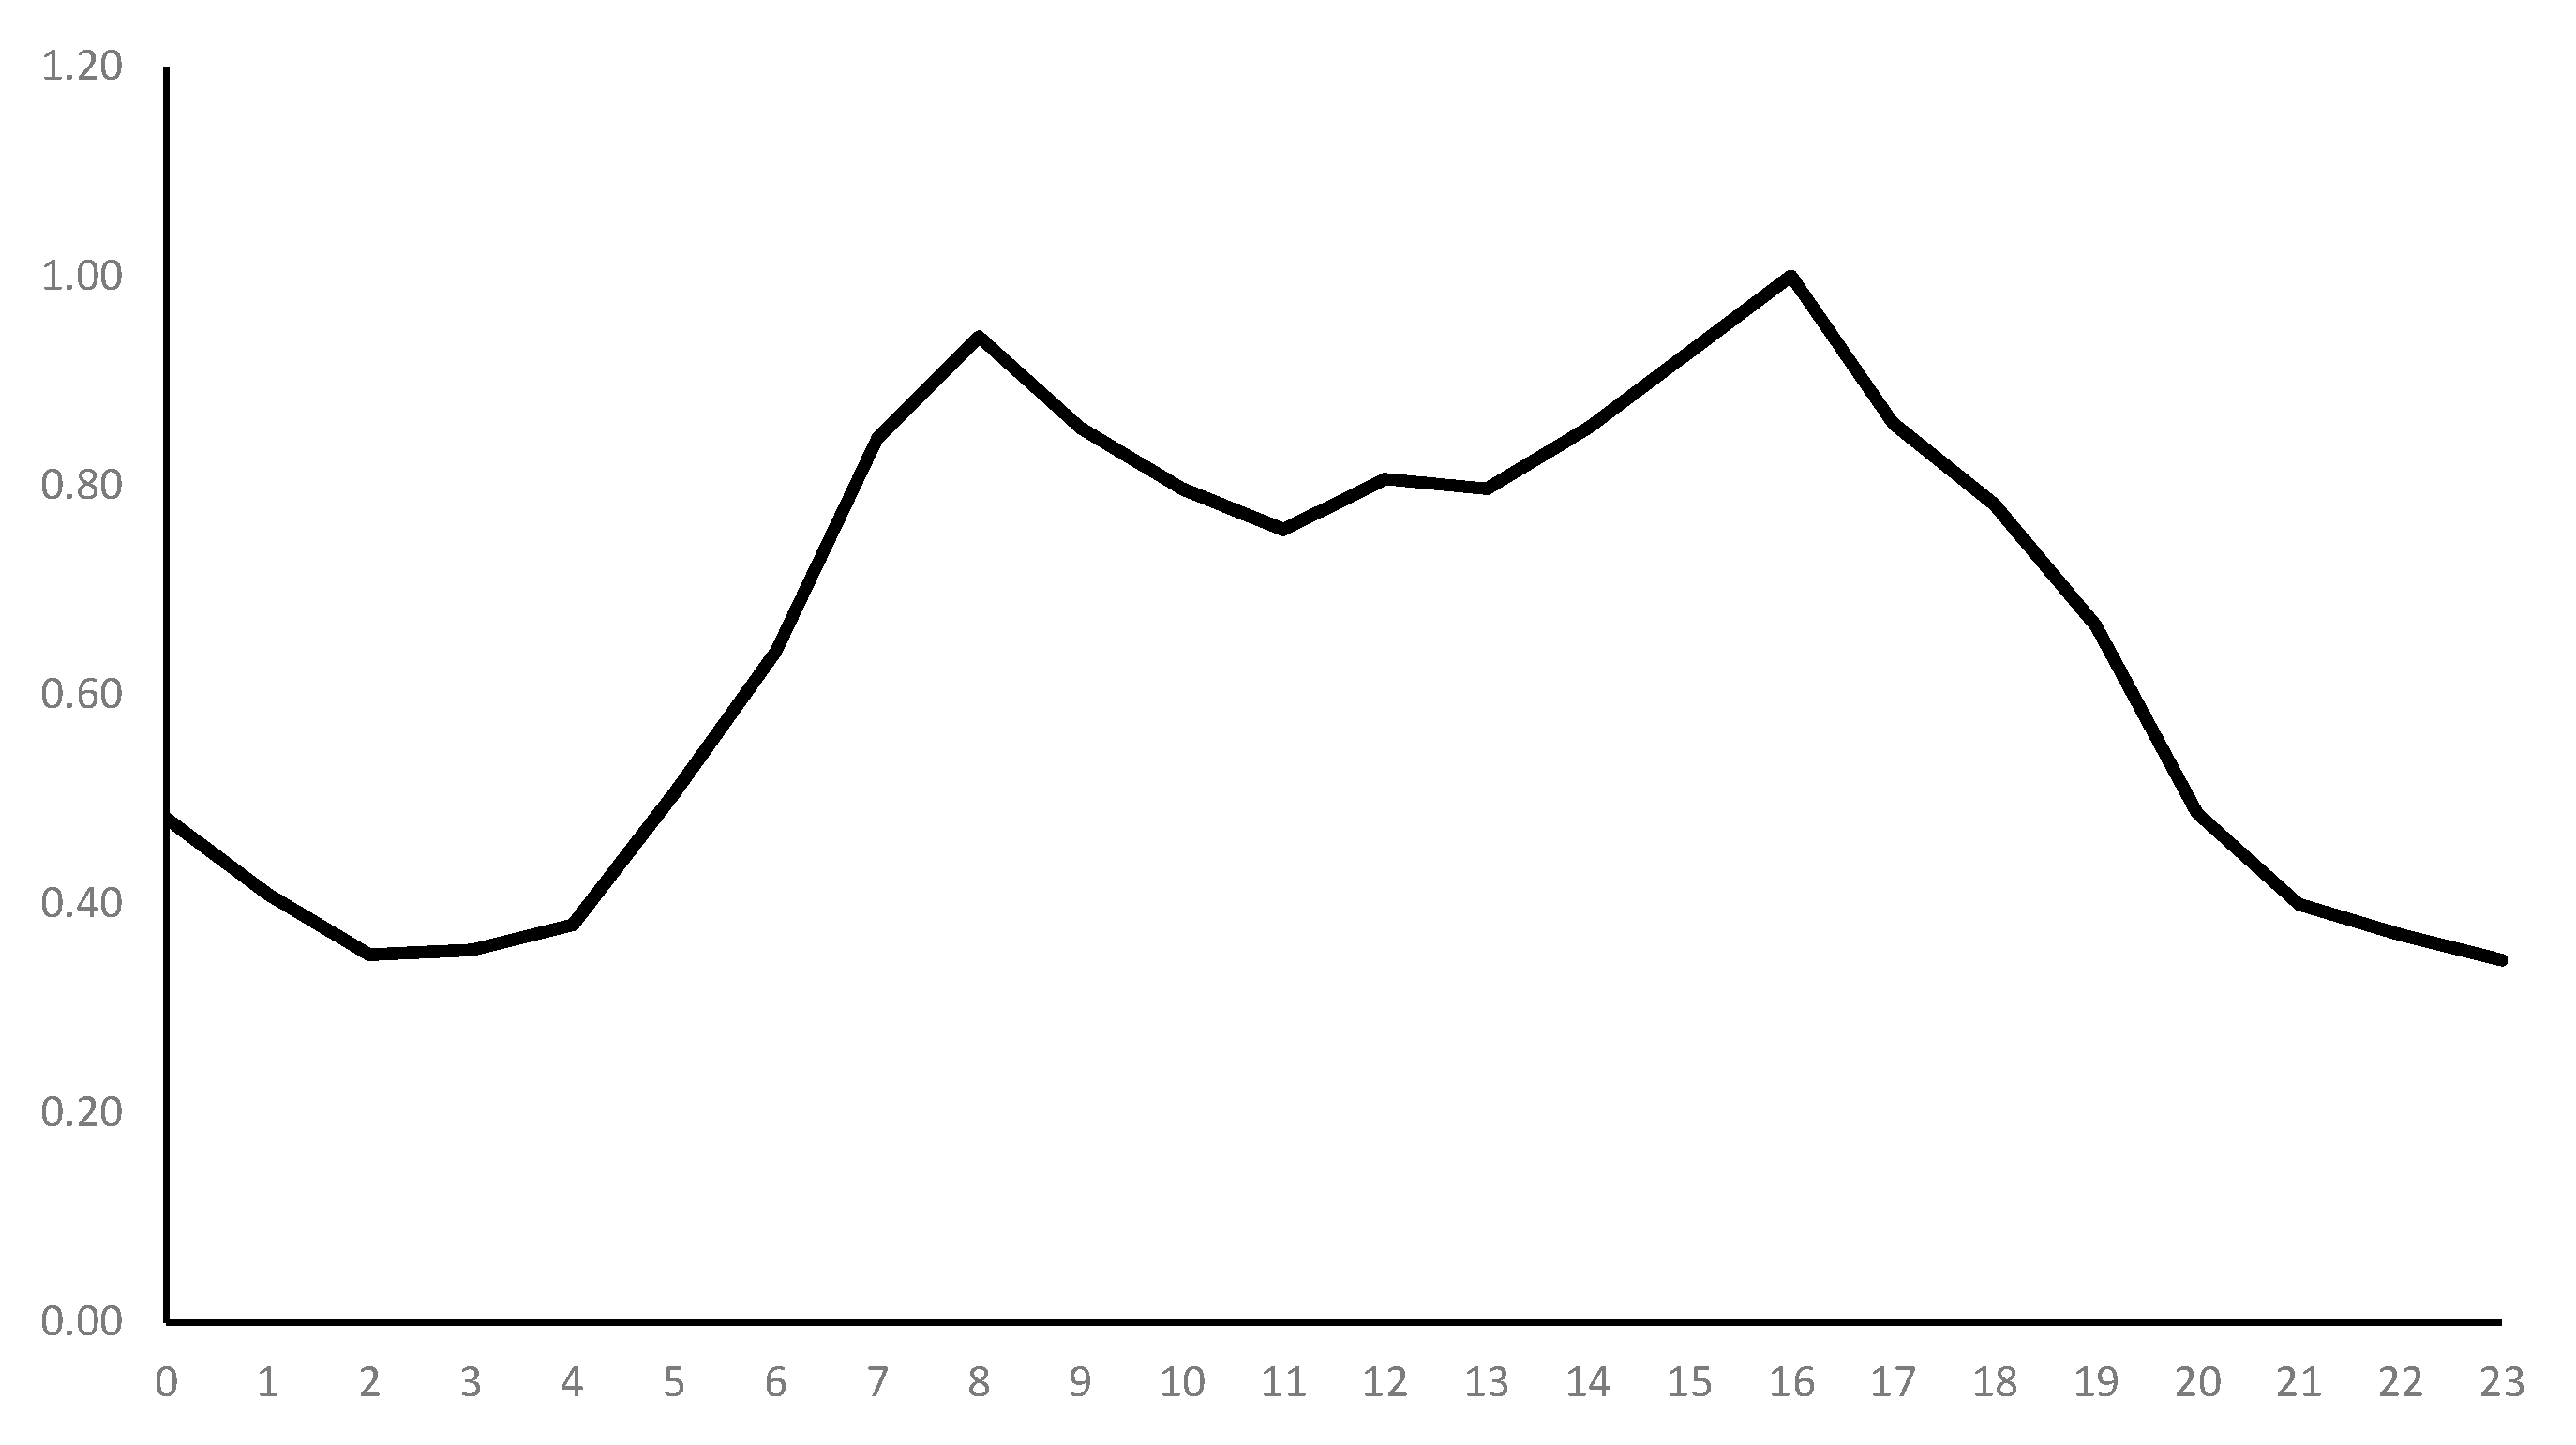
City X. After analyzing the power consumption of the residential, commercial, municipal, and transportation activities, the total amount is 17.4 TWh. A typical daily power load factor curve of the North China Grid is also obtained from the State Grid Corporation, and the basically stable industrial production consumes 70% of the power. Therefore, adjustment to the curve is done to eliminate the impact of industry on it, which makes it a typical daily power load factor curve for
City X, as shown in
Figure 7. According to the industrial structure characteristics of
City X and the related research [
26], it can be assumed that the annual maximum load utilization hours are 3000 h. Thus, the peak electricity load is 5800 MW and the valley electricity load is 2030 MW. Then,
is 3.8. As discussed in
Section 4, the maximum demand heat-to-power ratio is higher than most of the supply heat-to-power ratios of the different heating methods.
Then, the different methods mentioned in
Section 4 are adopted to decrease the maximum demand heat-to-power ratio:
- (1)
The heat demand should be reduced by controlling the quality of the retrofit and construction of buildings. According to the GB/T 51161-2016 Standard for energy consumption of buildings, the peak heat load is reduced to 20 W/m2 in the urban area and towns. The peak heat load can be reduced accordingly to 30 W/m2. Therefore, the peak heat load for City X will be 4496 MW. After the calculation, a new maximum heat-to-power ratio is calculated, , which is reduced to 2.2.
- (2)
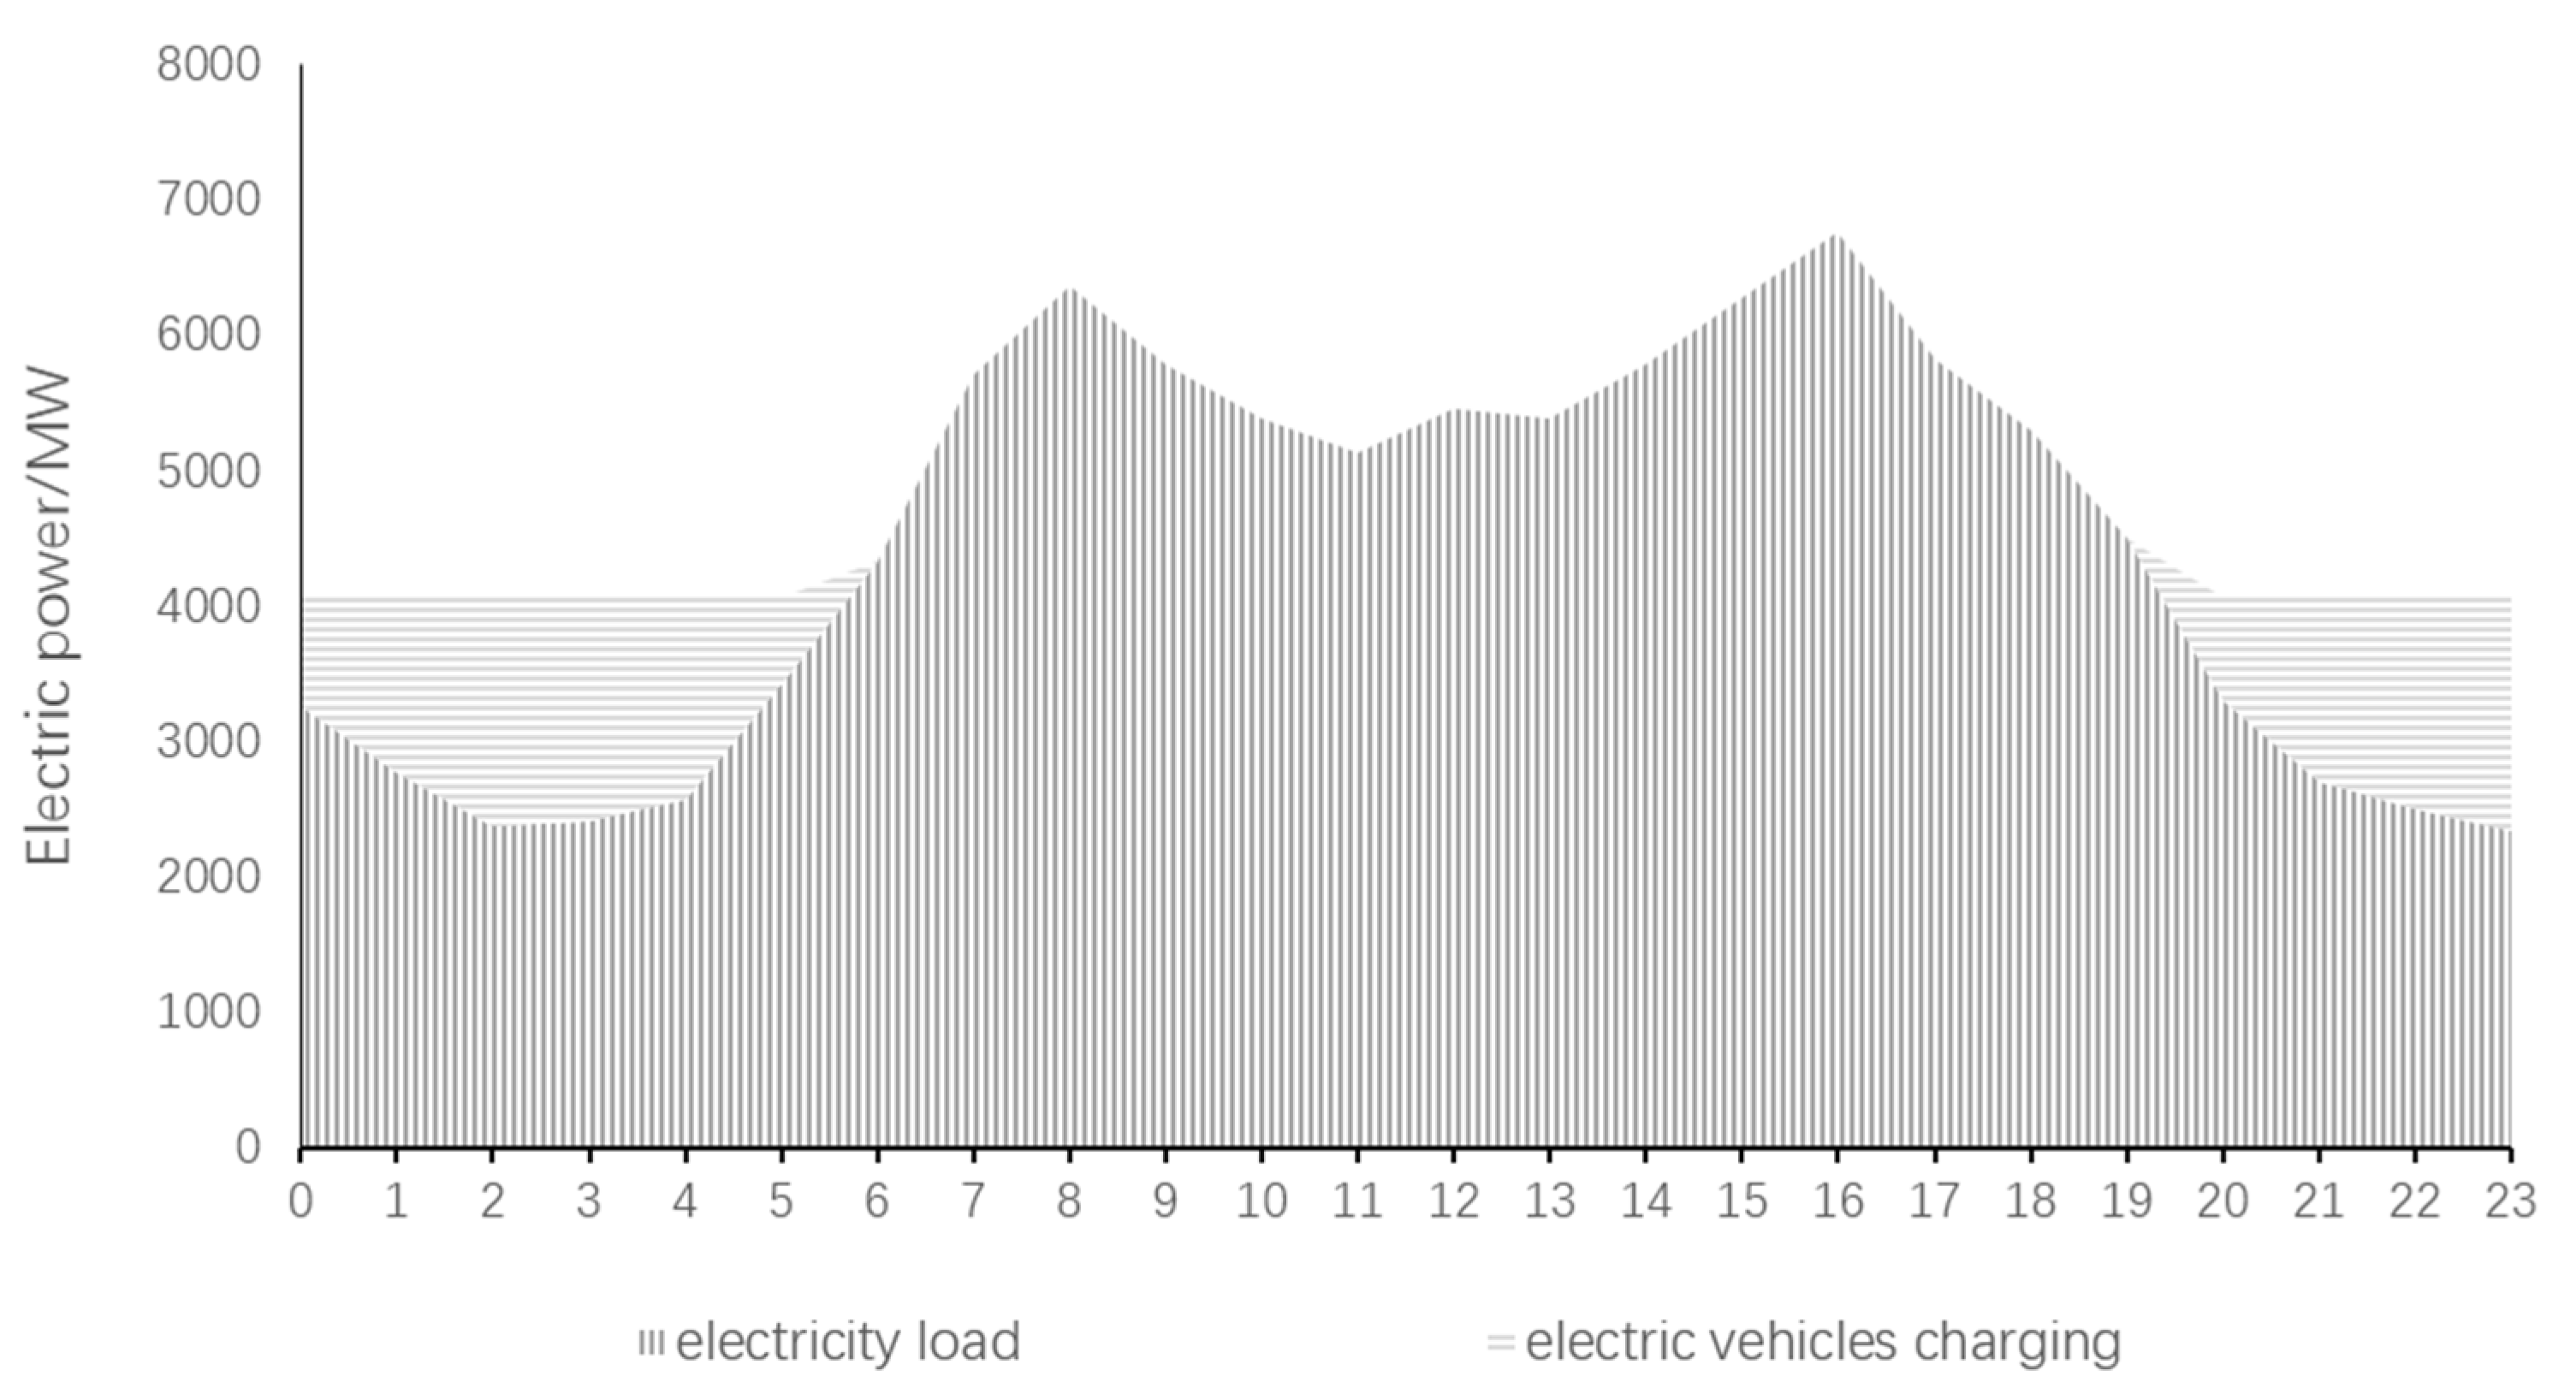
The level of electrification should be improved. Half of the residents will use electric cookers and all the transportation will be electrified in
City X. The electricity consumption will rise by 2.9 TWh, the total electricity consumption will be 20.3 TWh, and the peak electricity load will be 6767 MW. Moreover, electric vehicles could almost always be charged in the power valley, which can help increase the valley load [
27]. In this case, it can raise to 60% of the peak load, as shown in
Figure 8. Thus, the new valley load will be 4060 MW. After the calculation, another new maximum heat-to-power ratio,
, is obtained, which is reduced to 1.1.
Therefore, the maximum demand heat-to-power ratio can be reduced from 3.8 to 1.1. As presented in
Table 1,
Section 3, it matches most of the methods. For example, the coal-fired CHP and industrial surplus heat can be planned to cover the basic heat load, and the gas-fired or biomass boiler can be planned to cover the peak heat load. Moreover, the electric heat pump and renewable energy power distribution can also be adopted to help build a clean and efficient city.


