Energy Performance Comparison between Liquid-Desiccant-Assisted Air Conditioning System and Dedicated Outdoor Air System in Different Climatic Regions


Abstract
:1. Introduction
2. System Overview
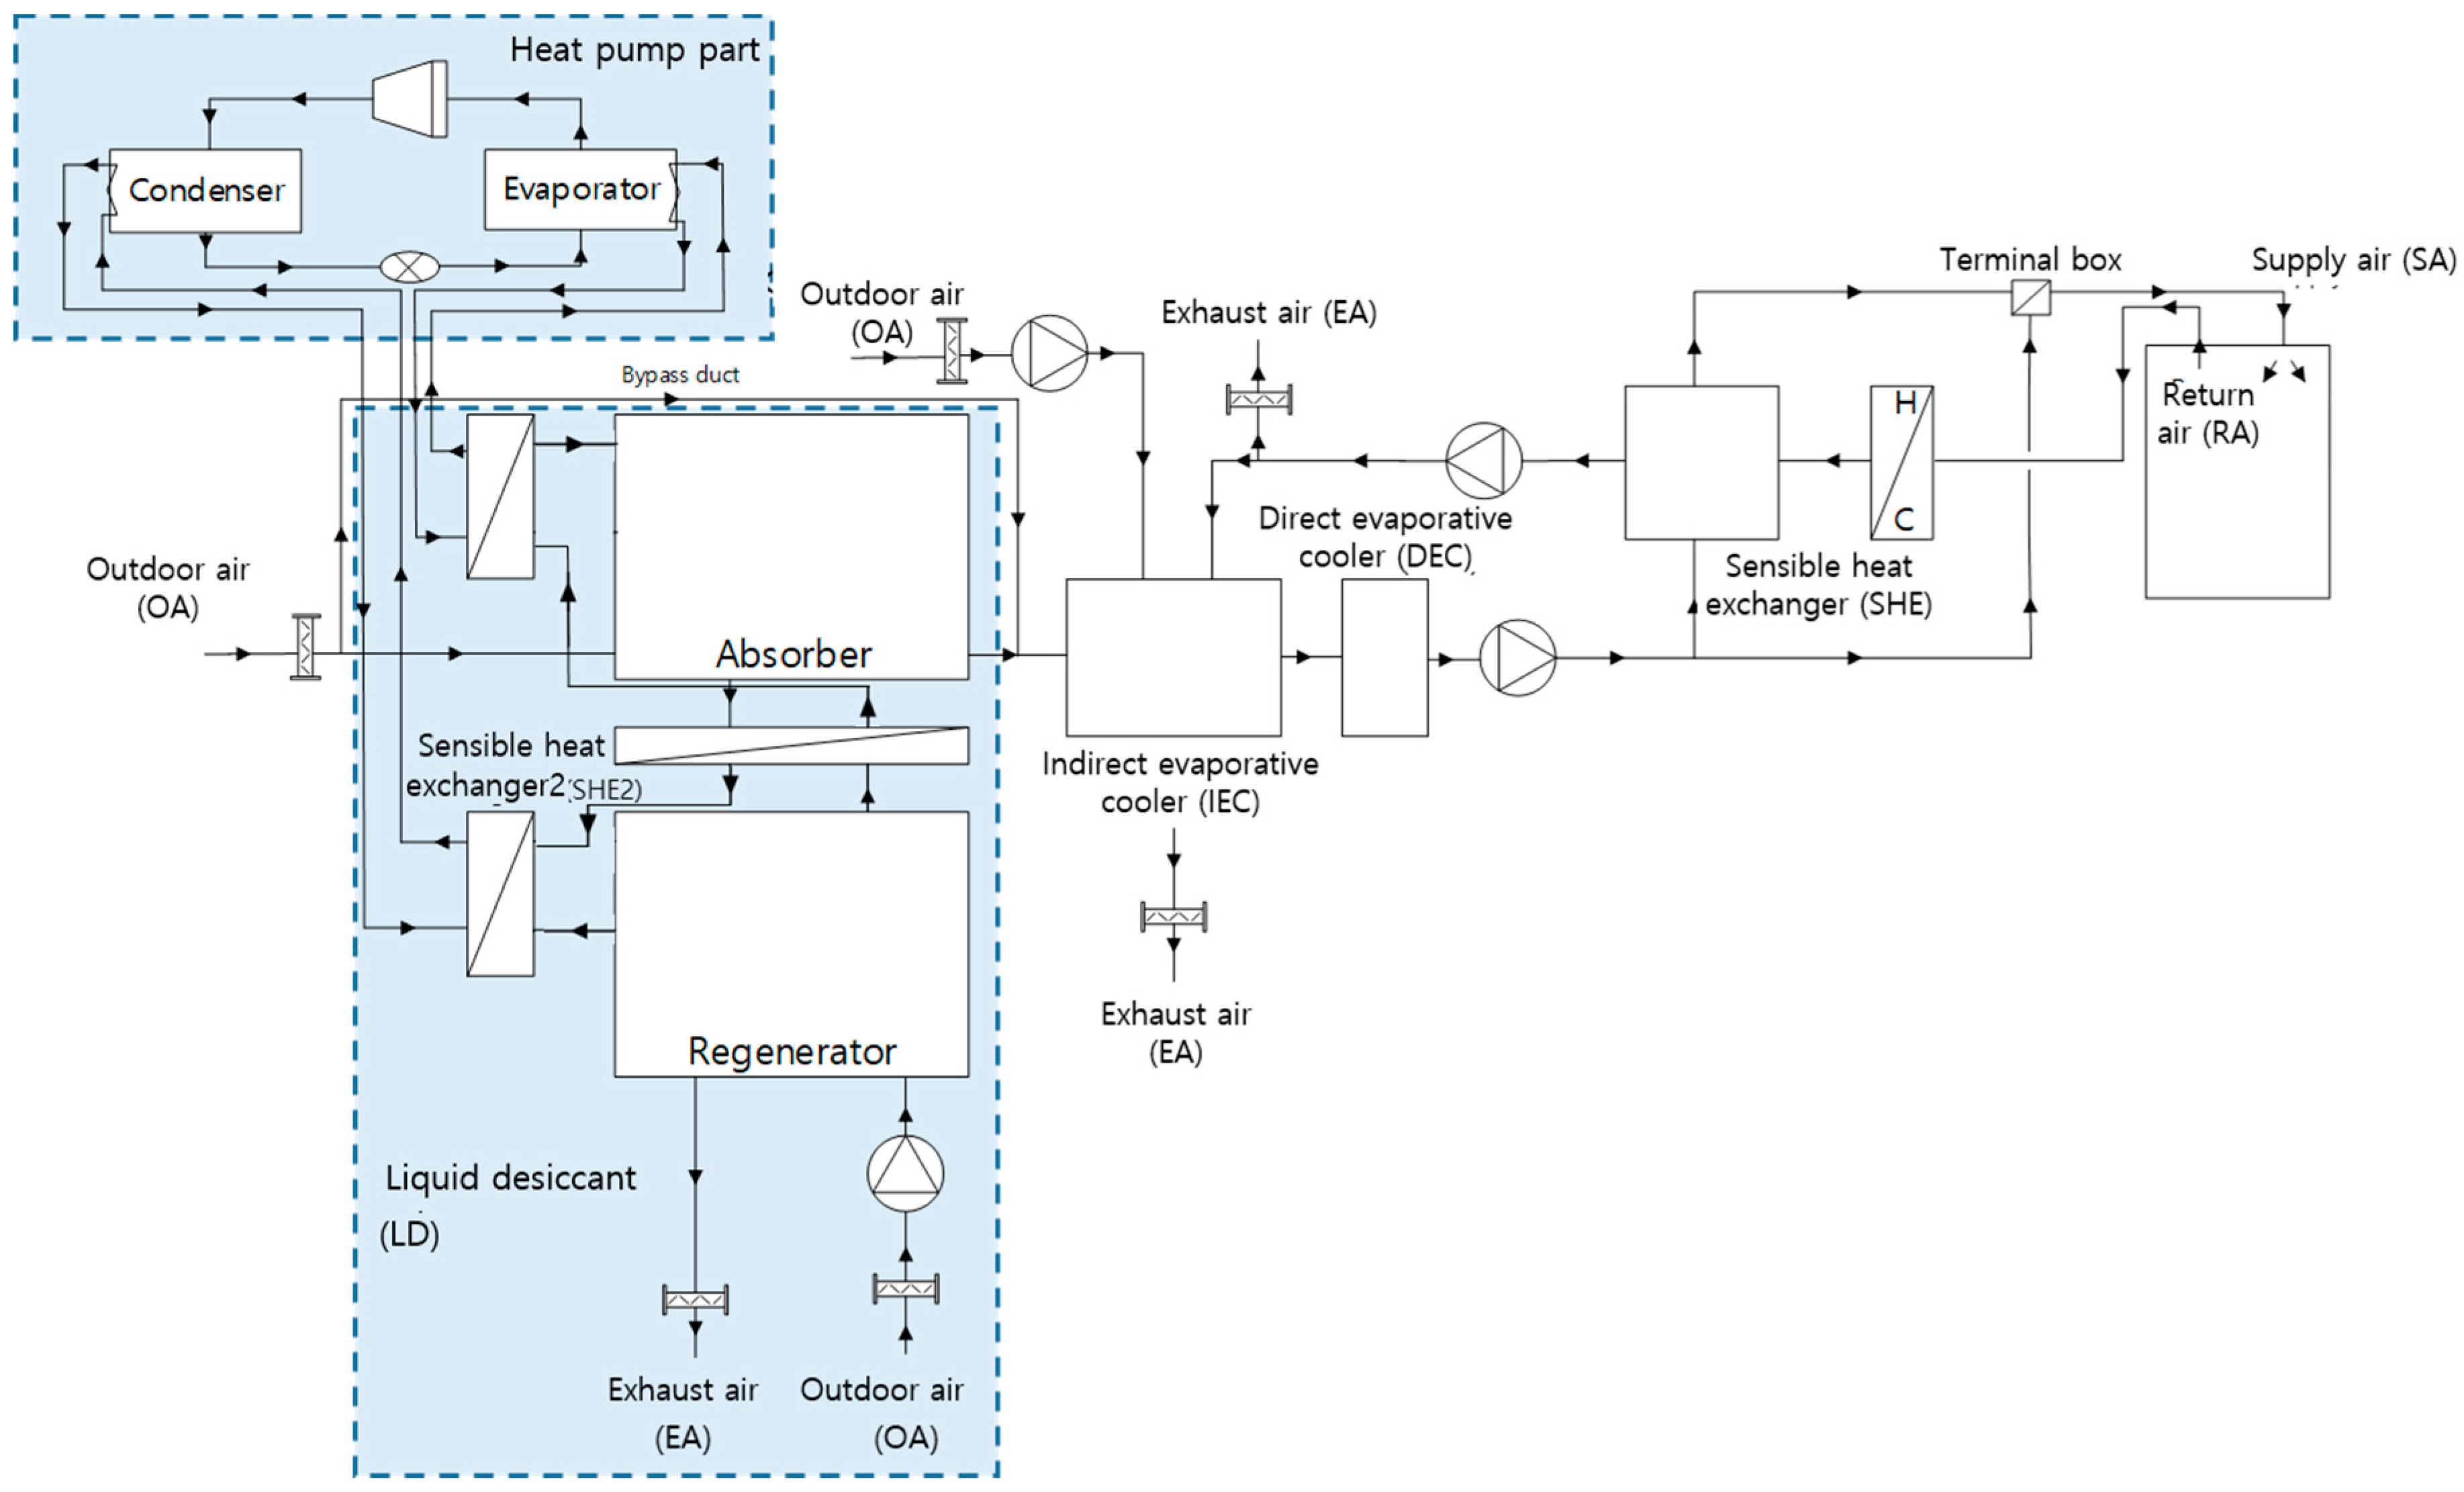
2.1. HPLD-IDECOAS System Overview
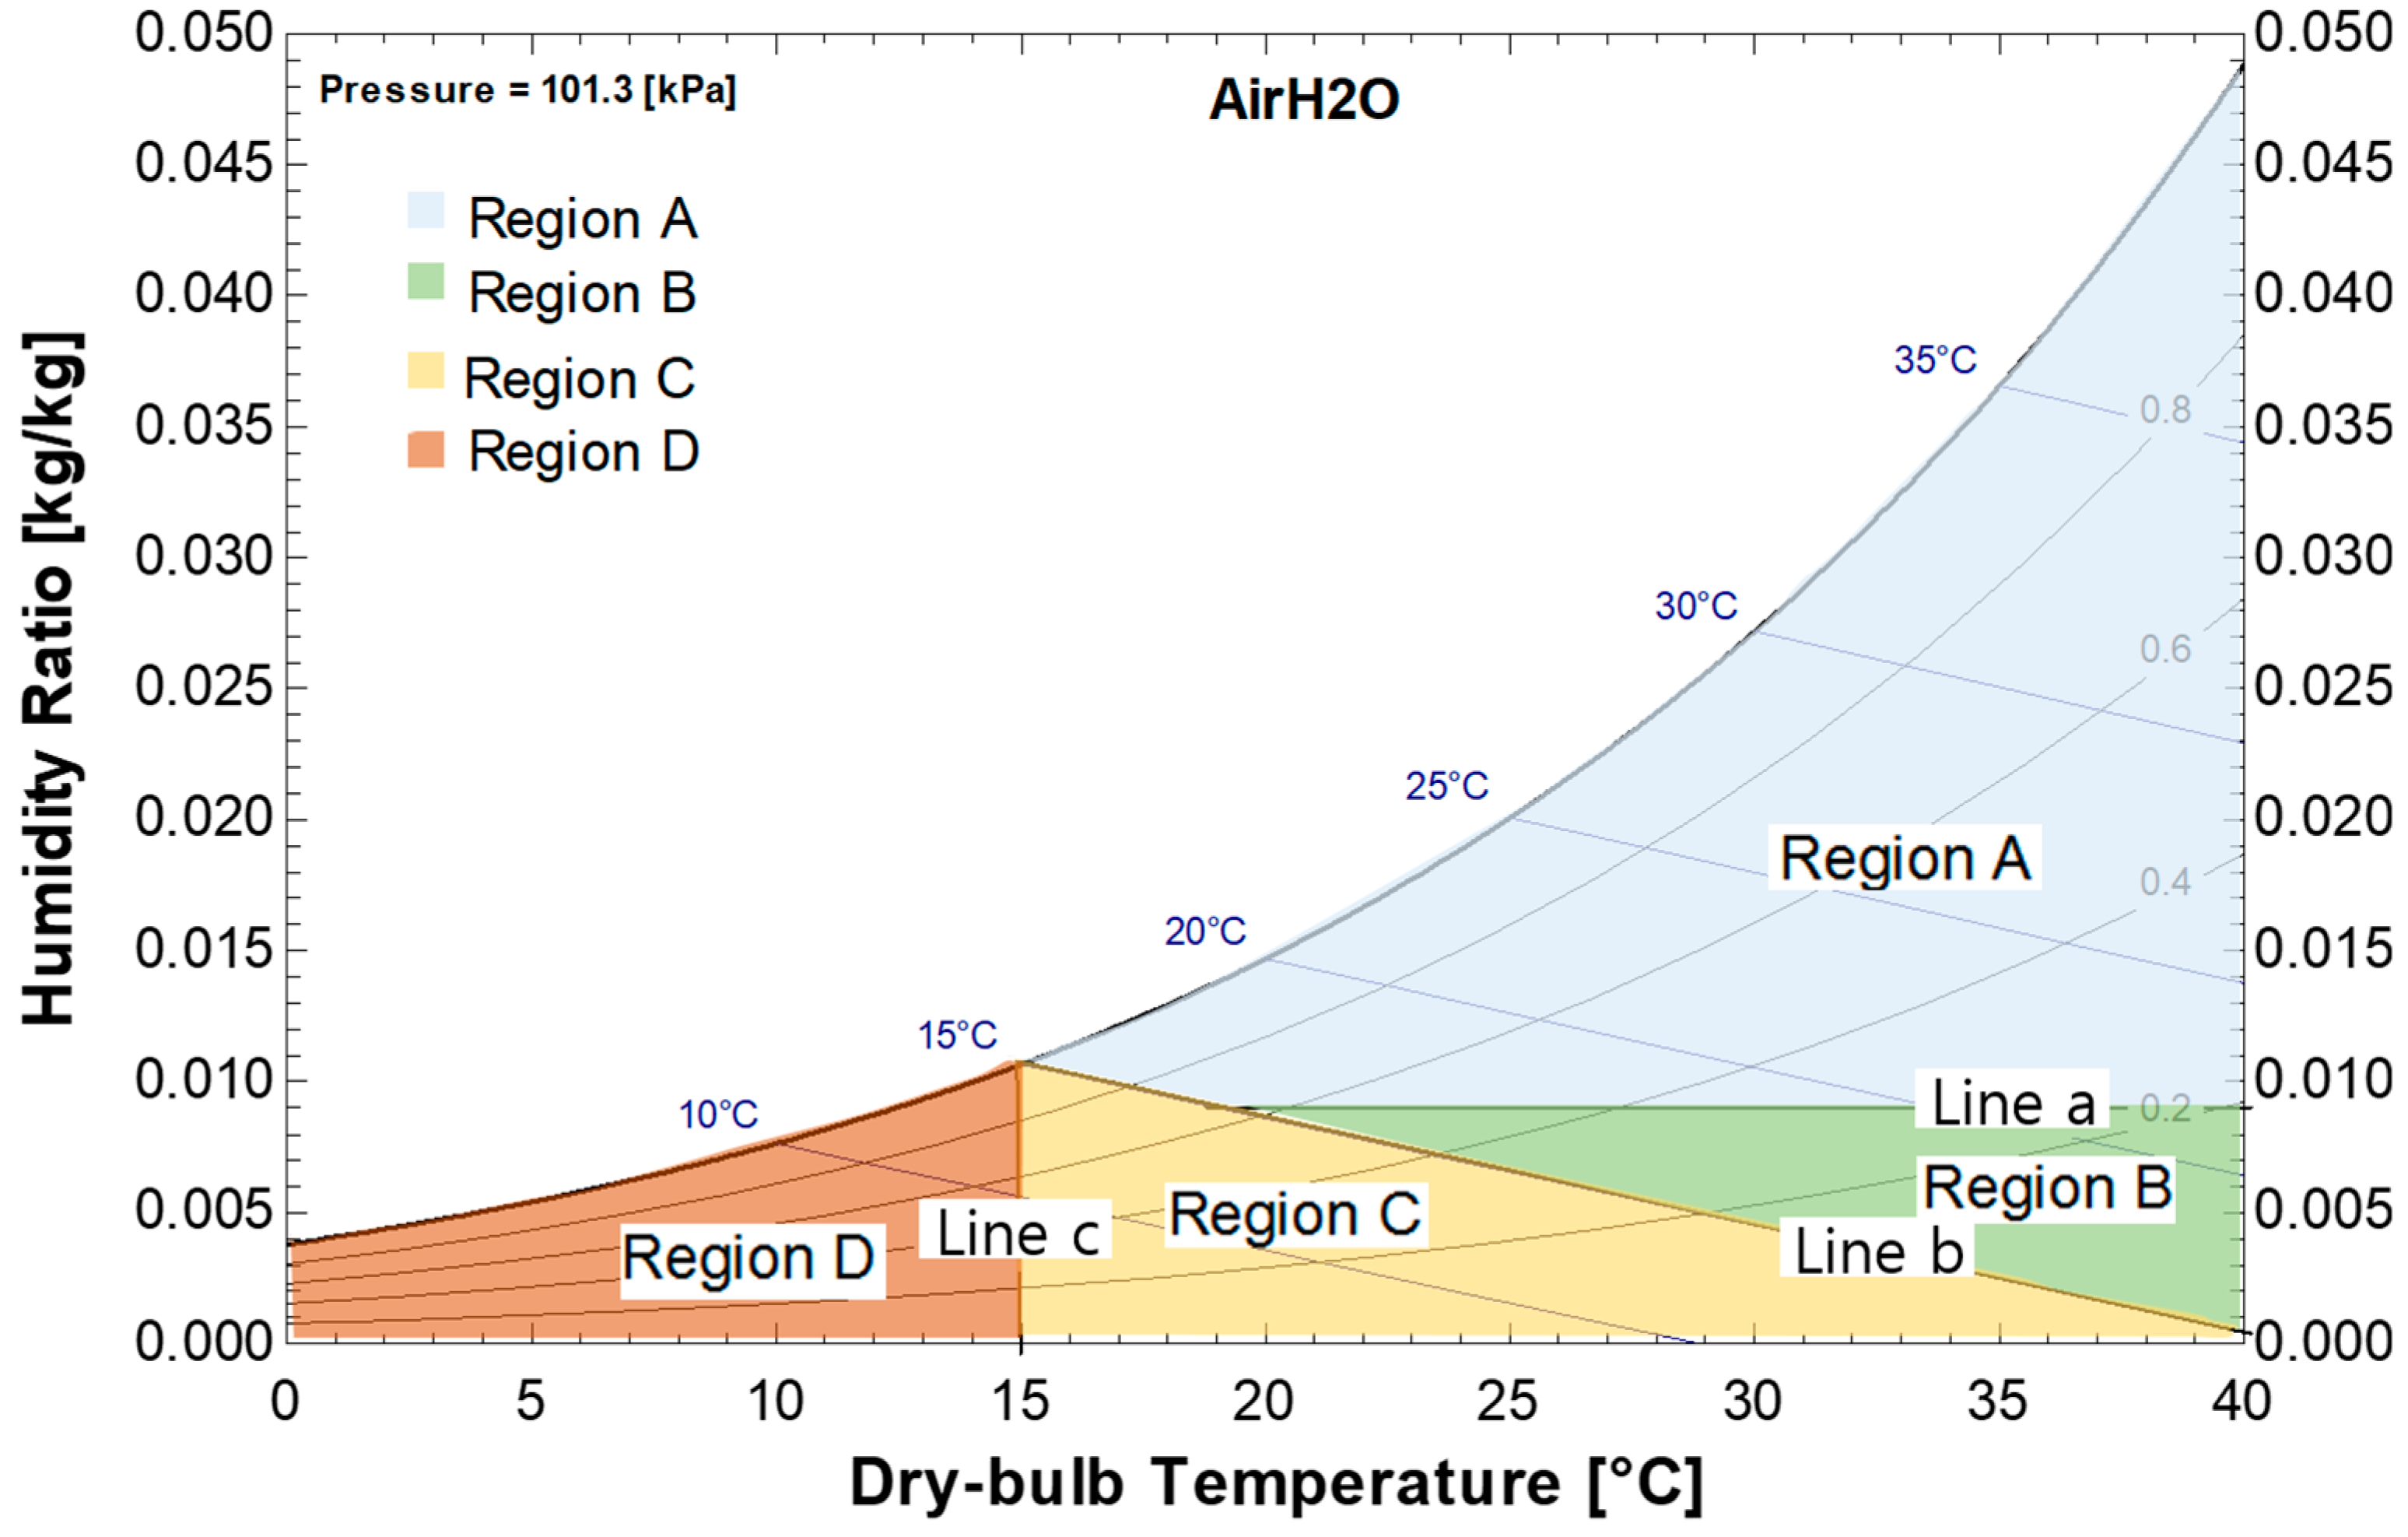
2.1.1. HPLD-IDECOAS Operation Modes
2.1.2. Heat-Pump-Driven Liquid-Desiccant (HPLD) Unit
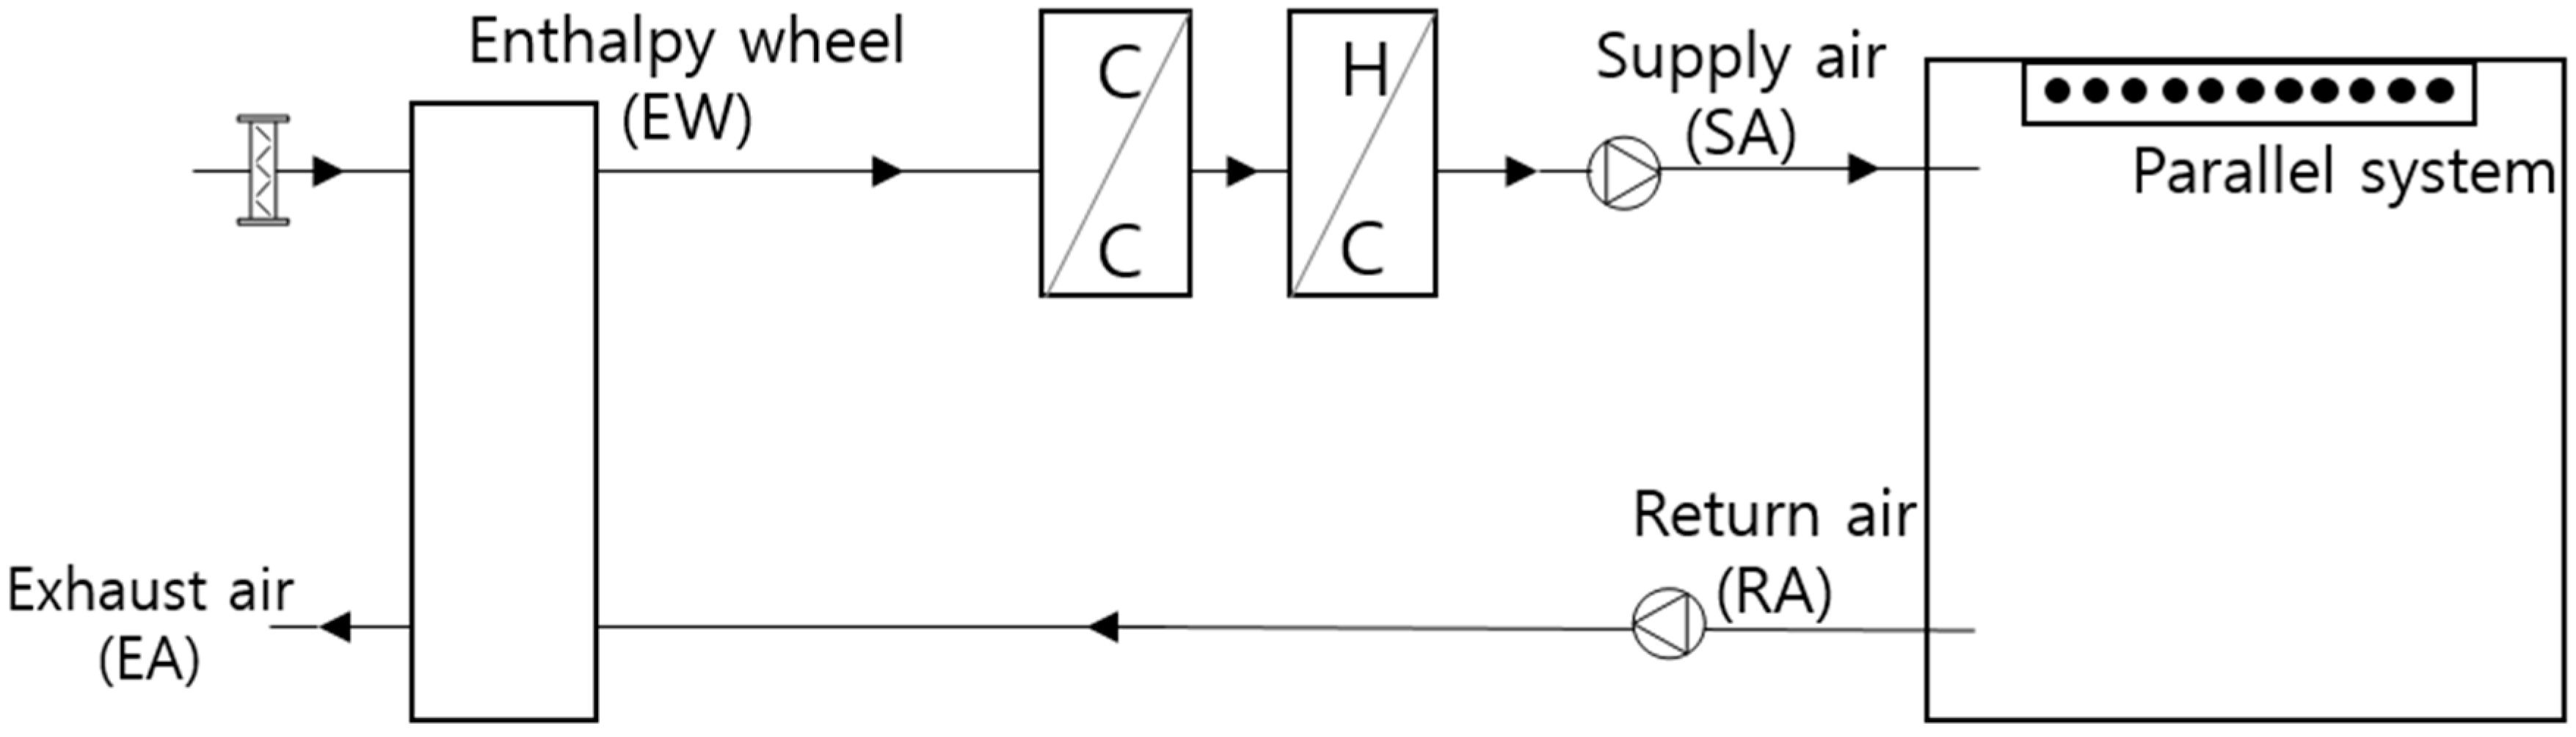
2.2. DOAS with Parallel System Overview
DOAS with Parallel System Operation Modes
3. Experiments Simulation
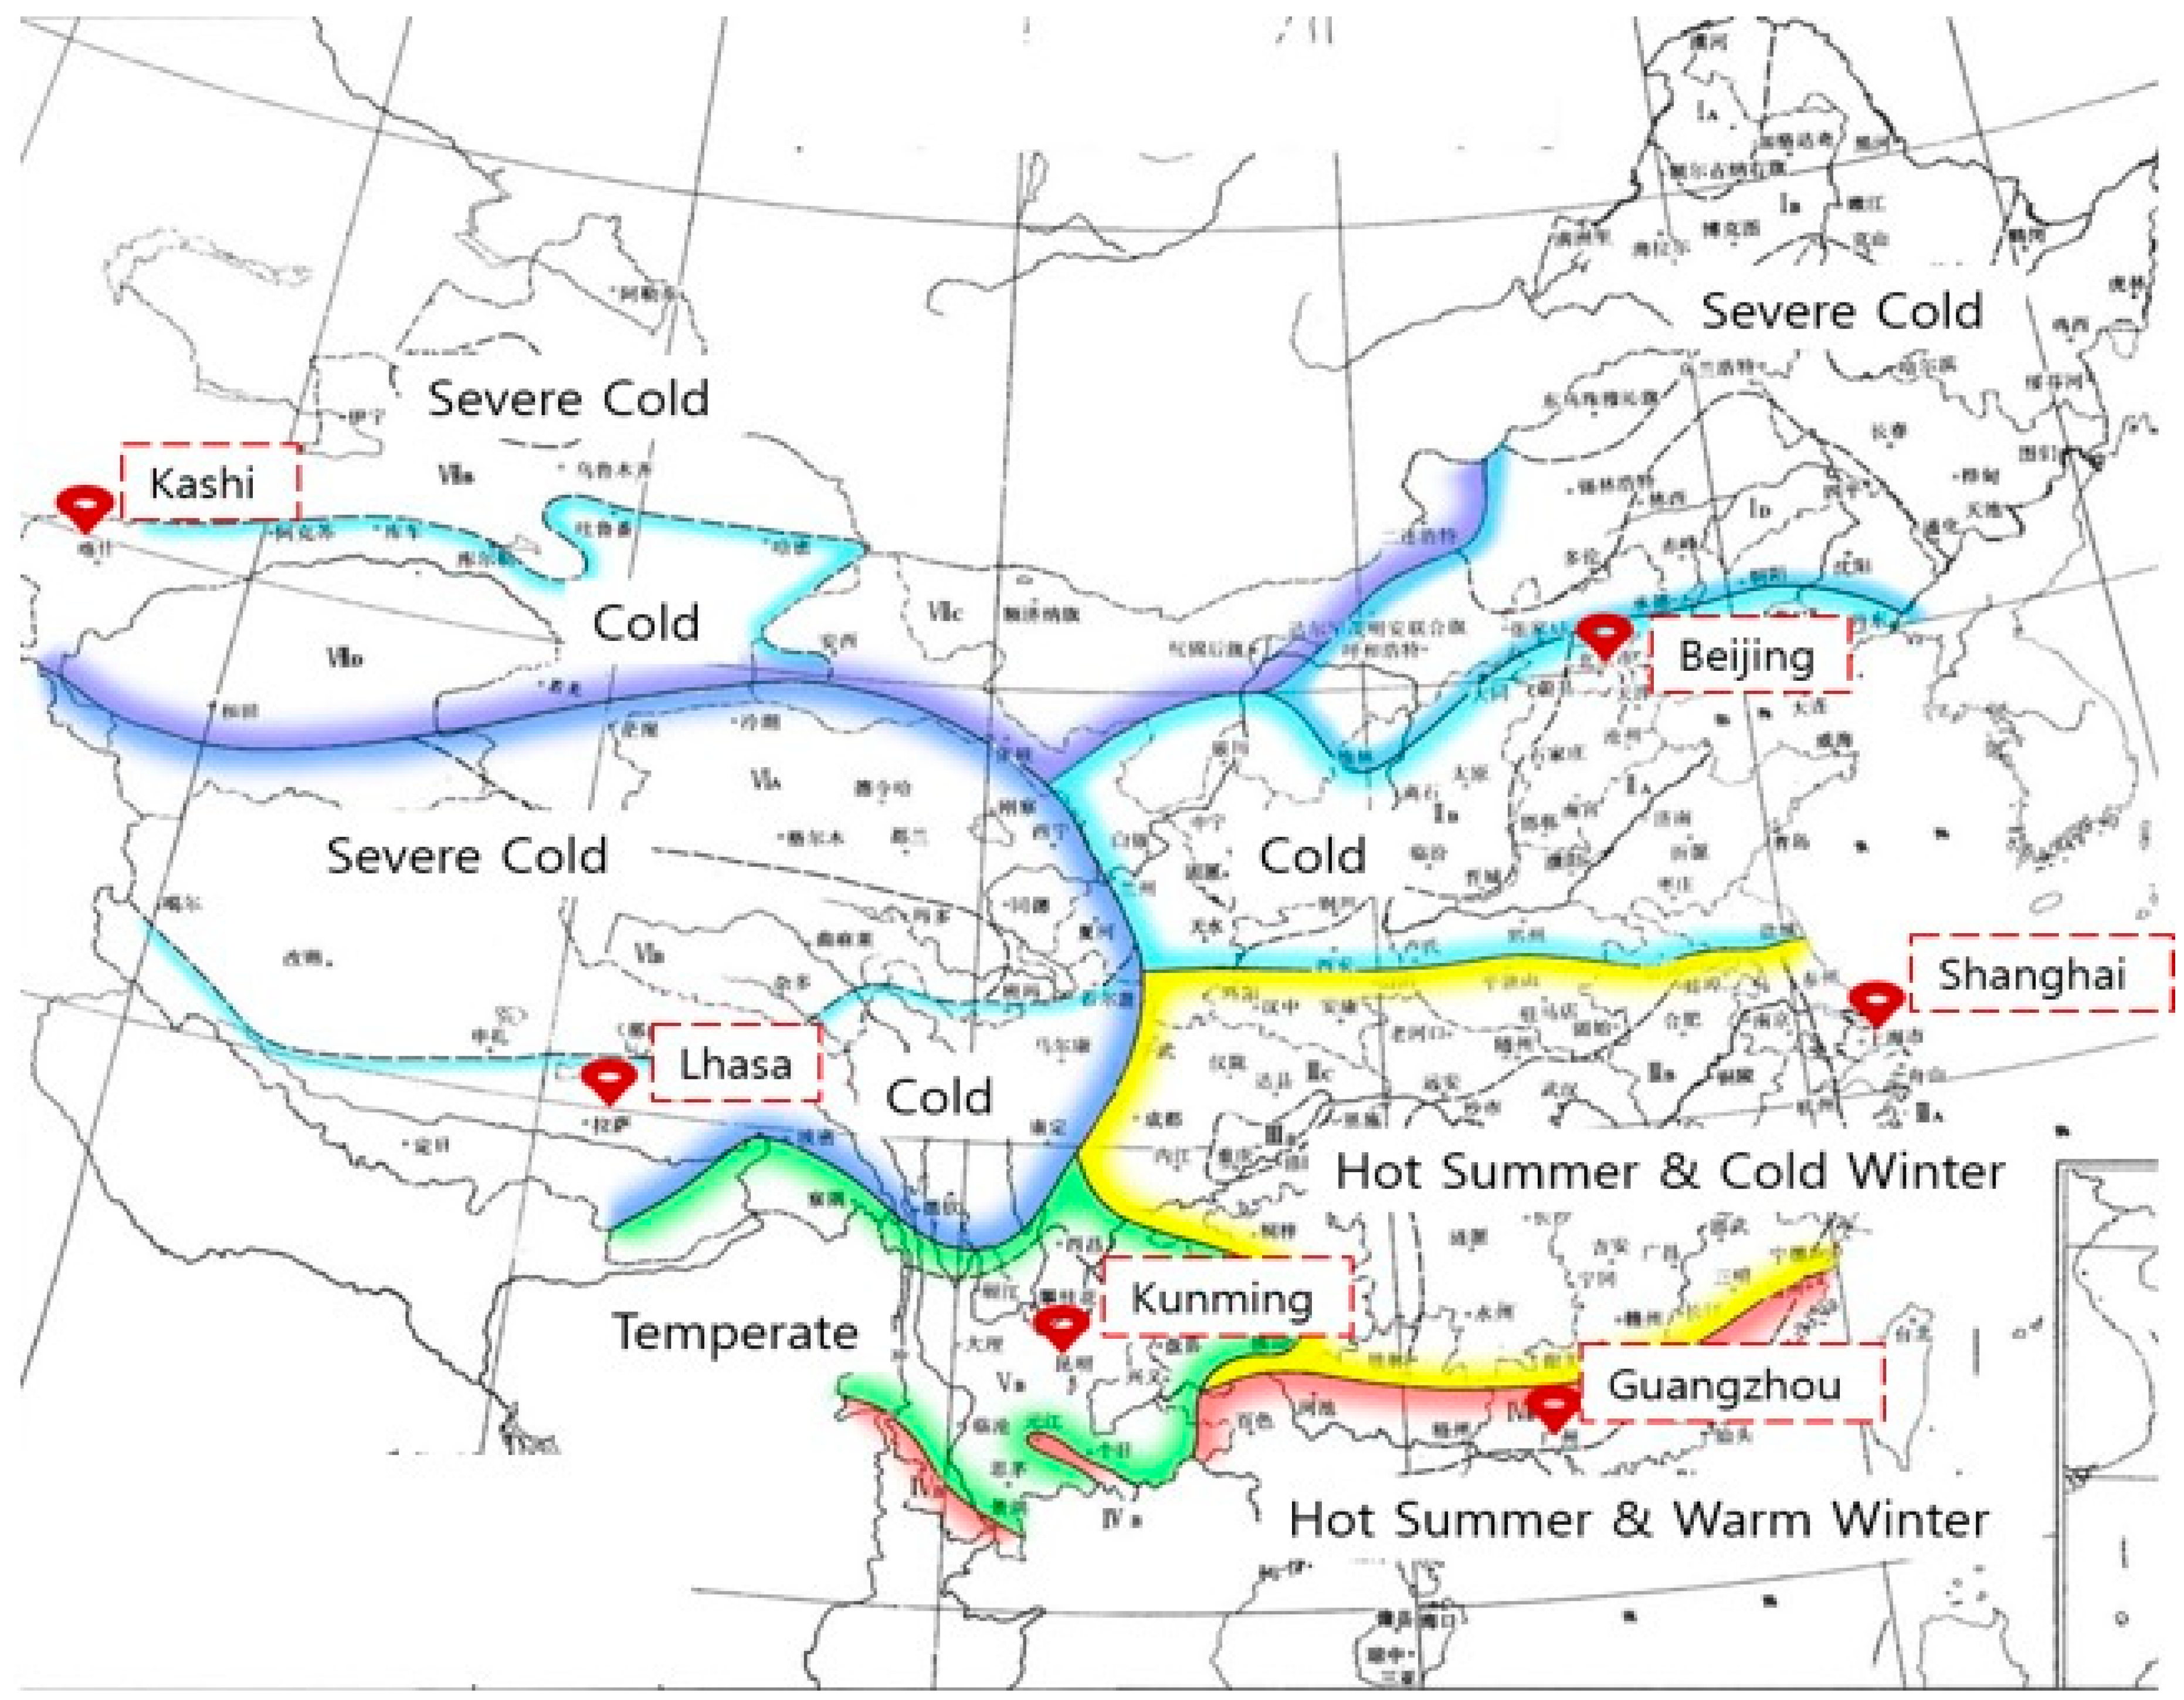
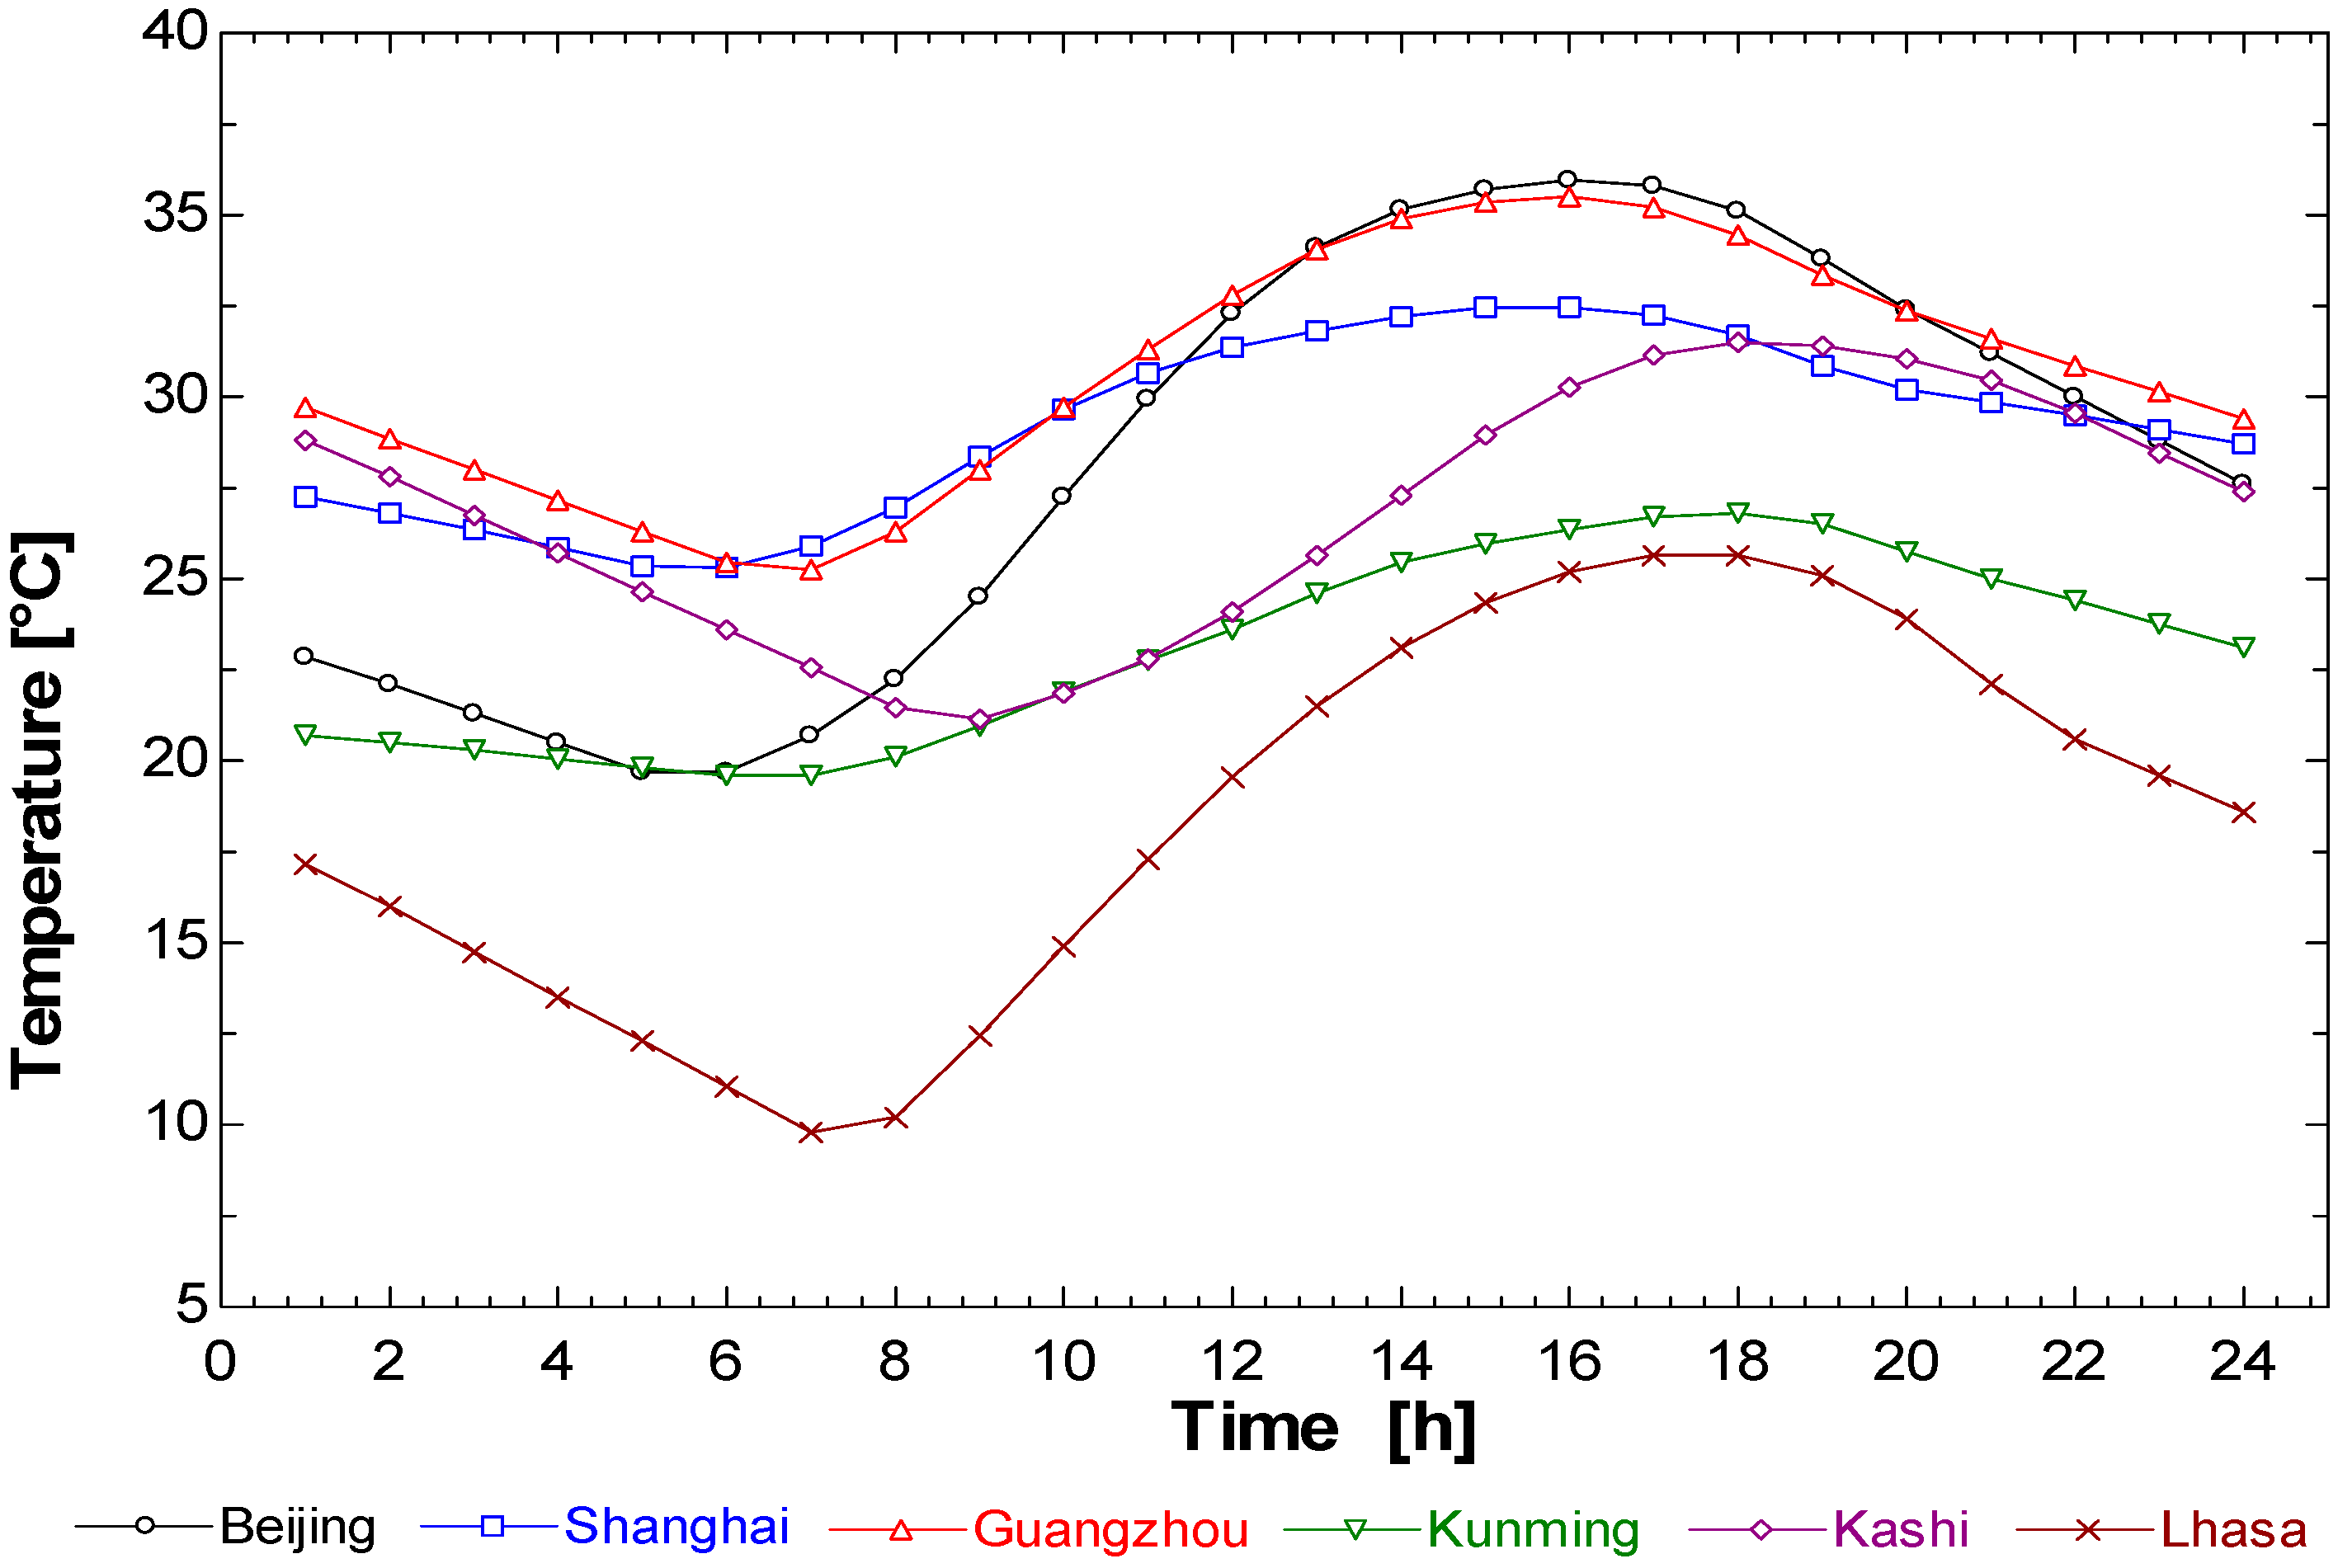
3.1. Selection of the Region
3.2. Building Model Overview
3.3. Simulation Overview
3.3.1. HPLD-IDECOAS Simulation Overview
Liquid-Desiccant Unit Model
IEC and DEC Unit Models
Target Air Conditions
Heat Pump Model
3.3.2. DOAS with Parallel Simulation Overview
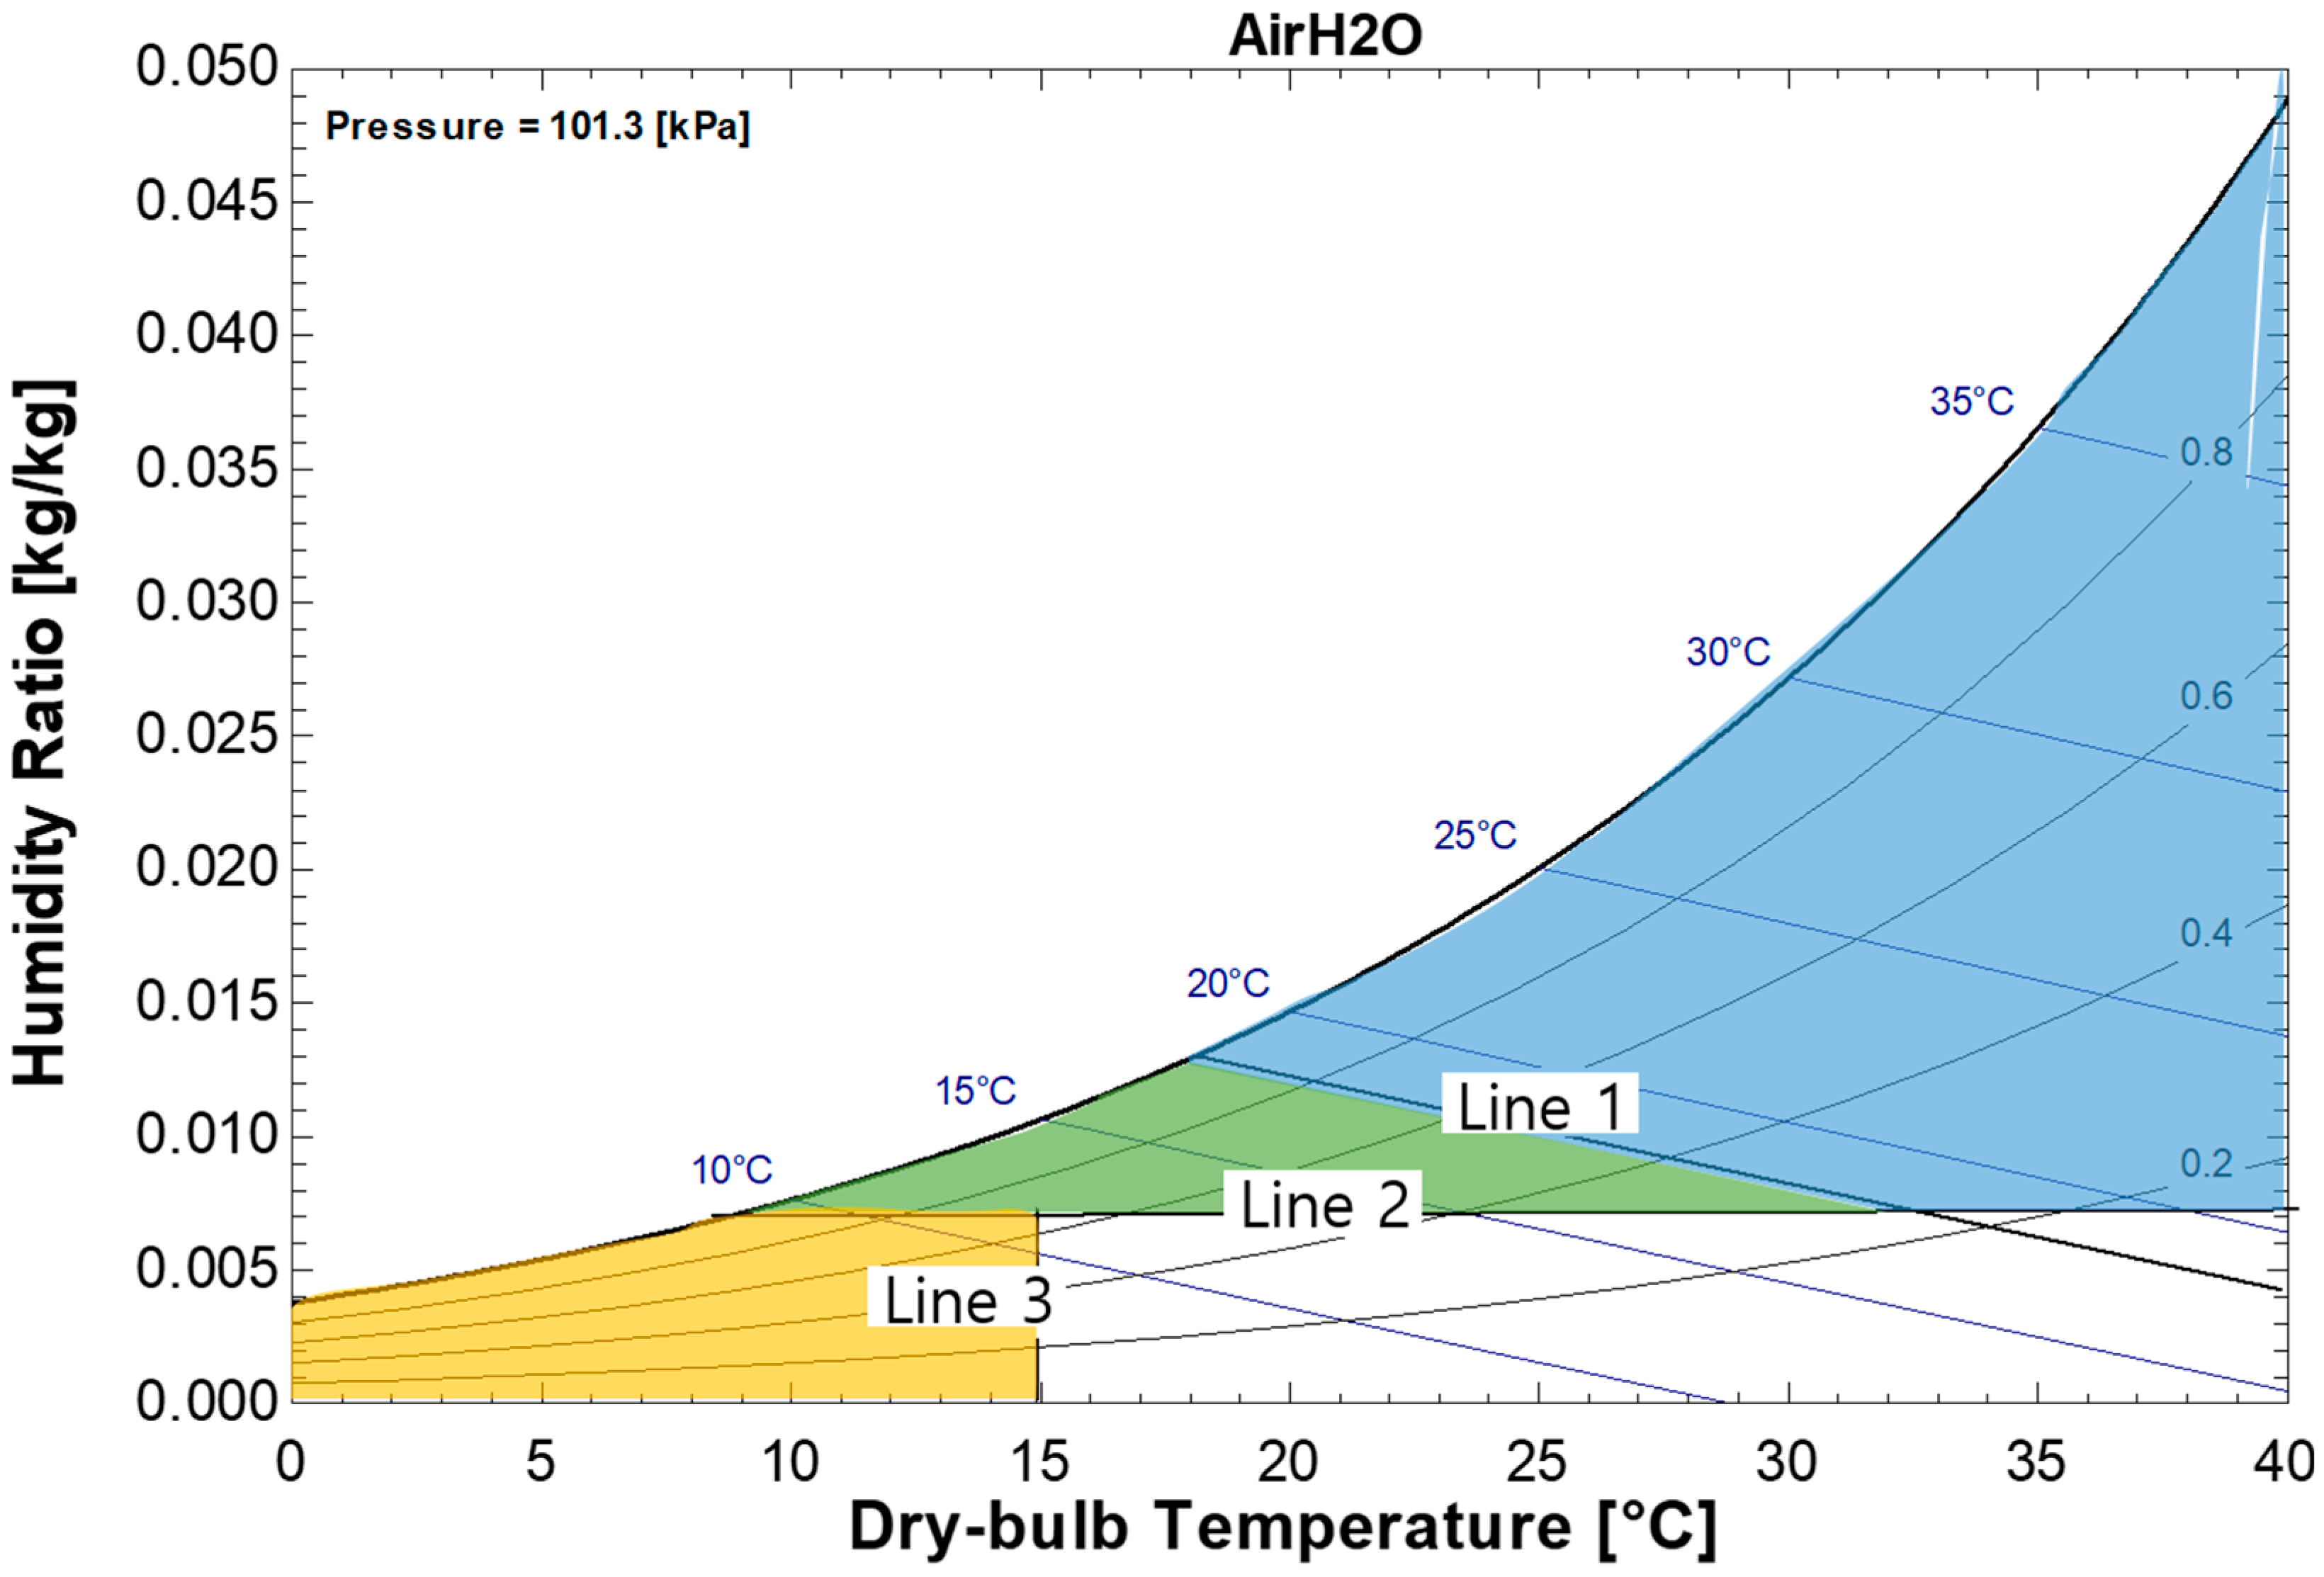
Enthalpy Wheel Control
4. Simulation Results and Discussion
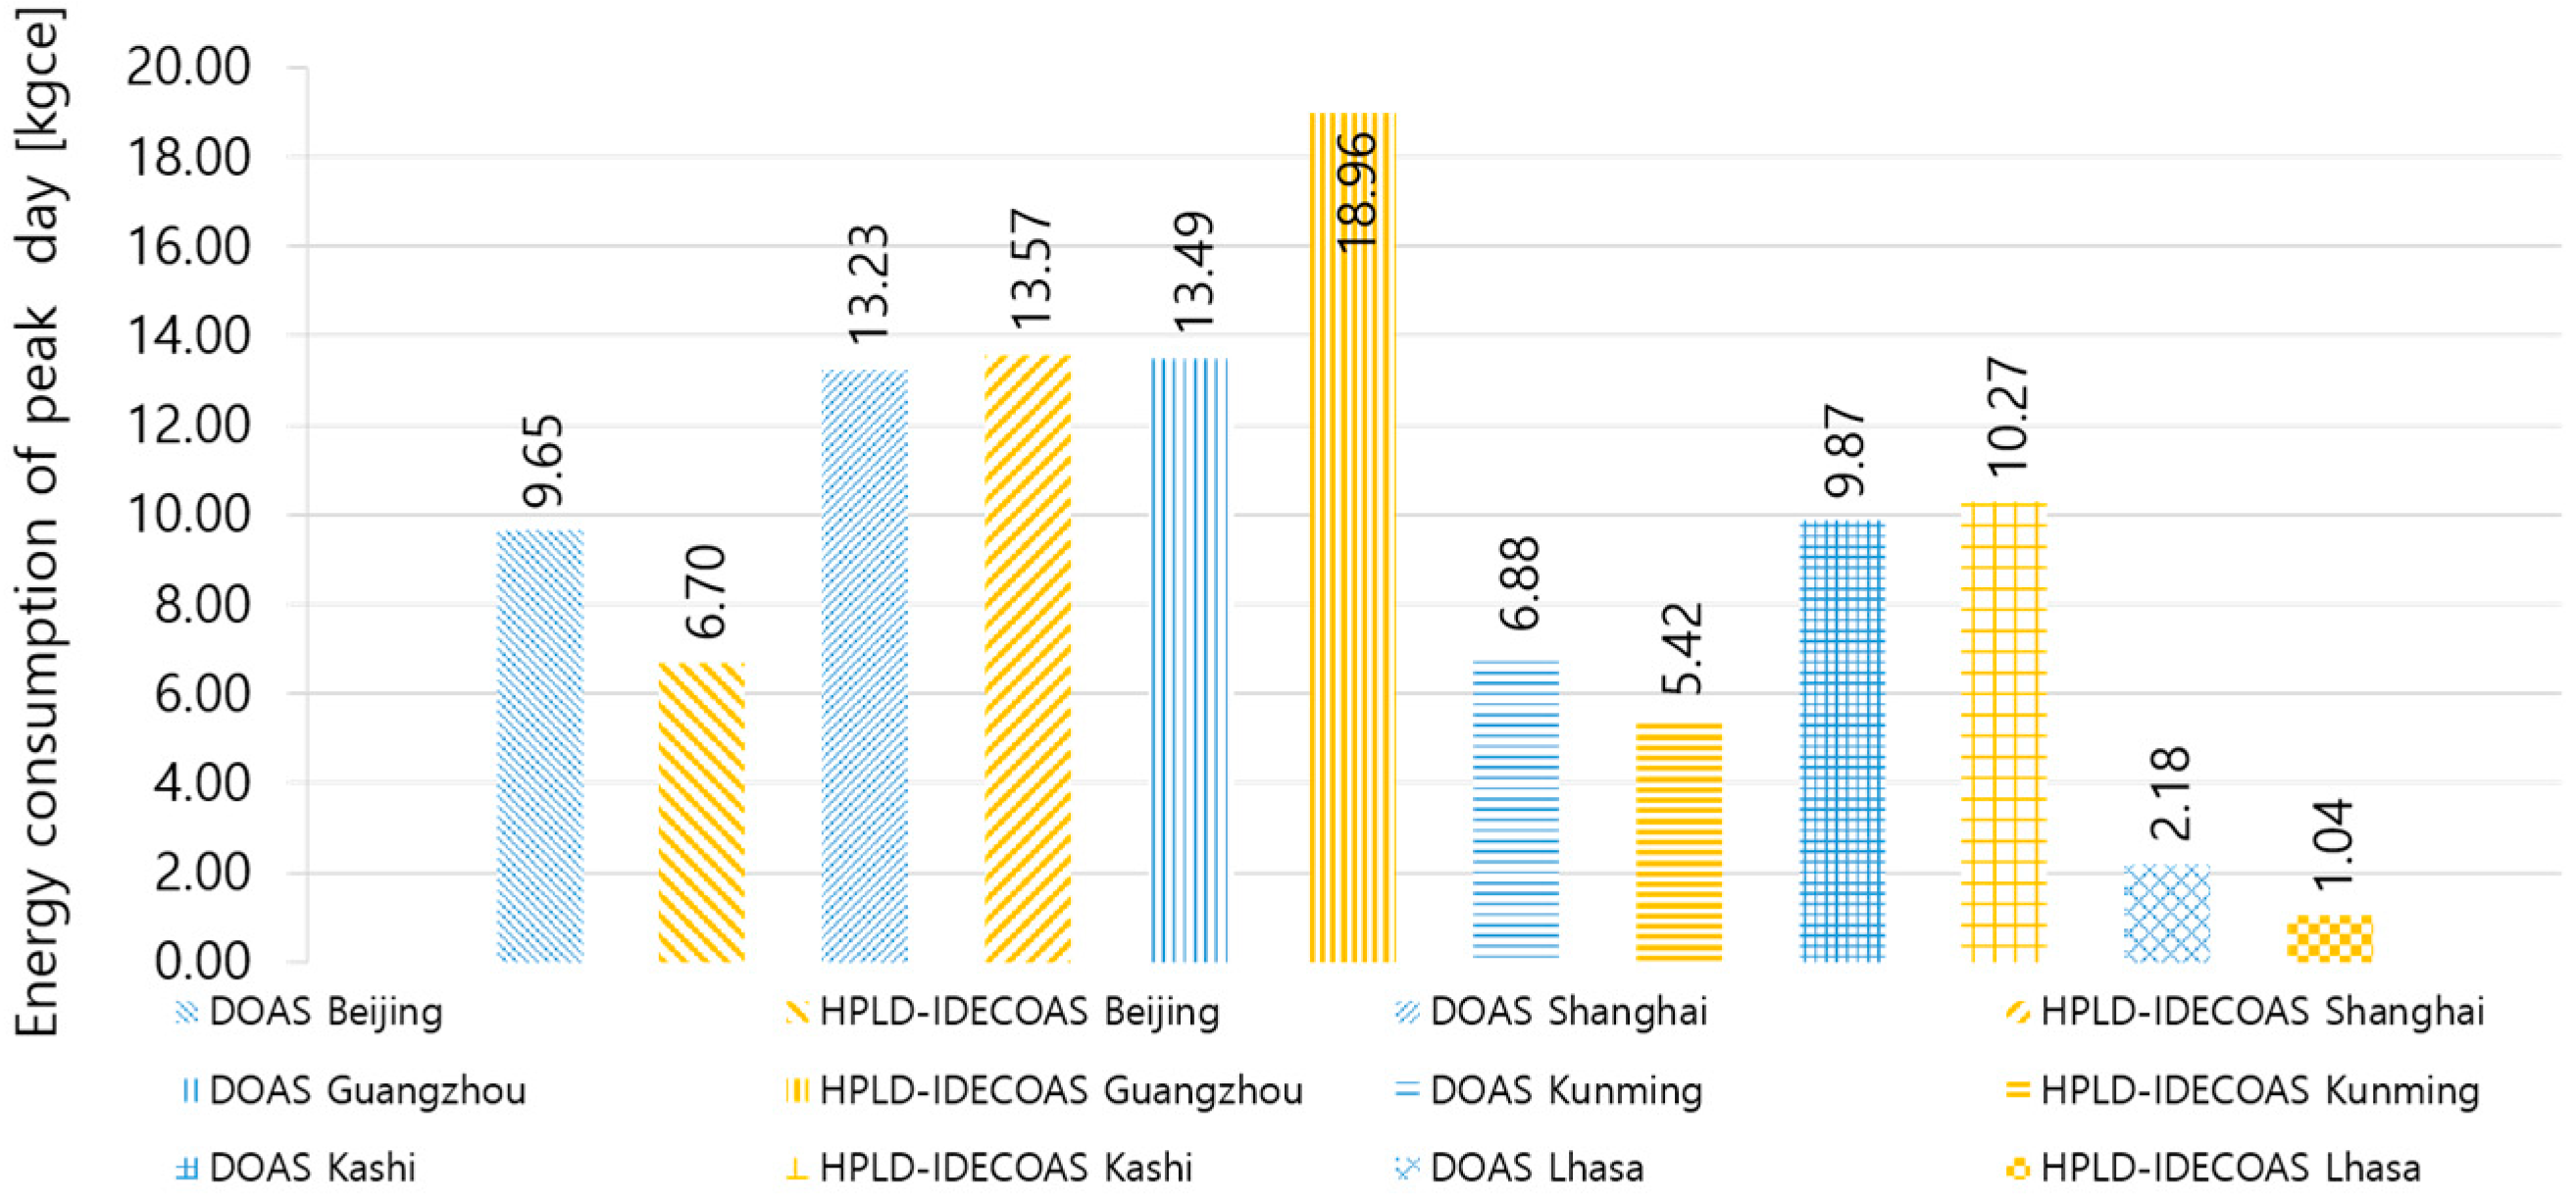
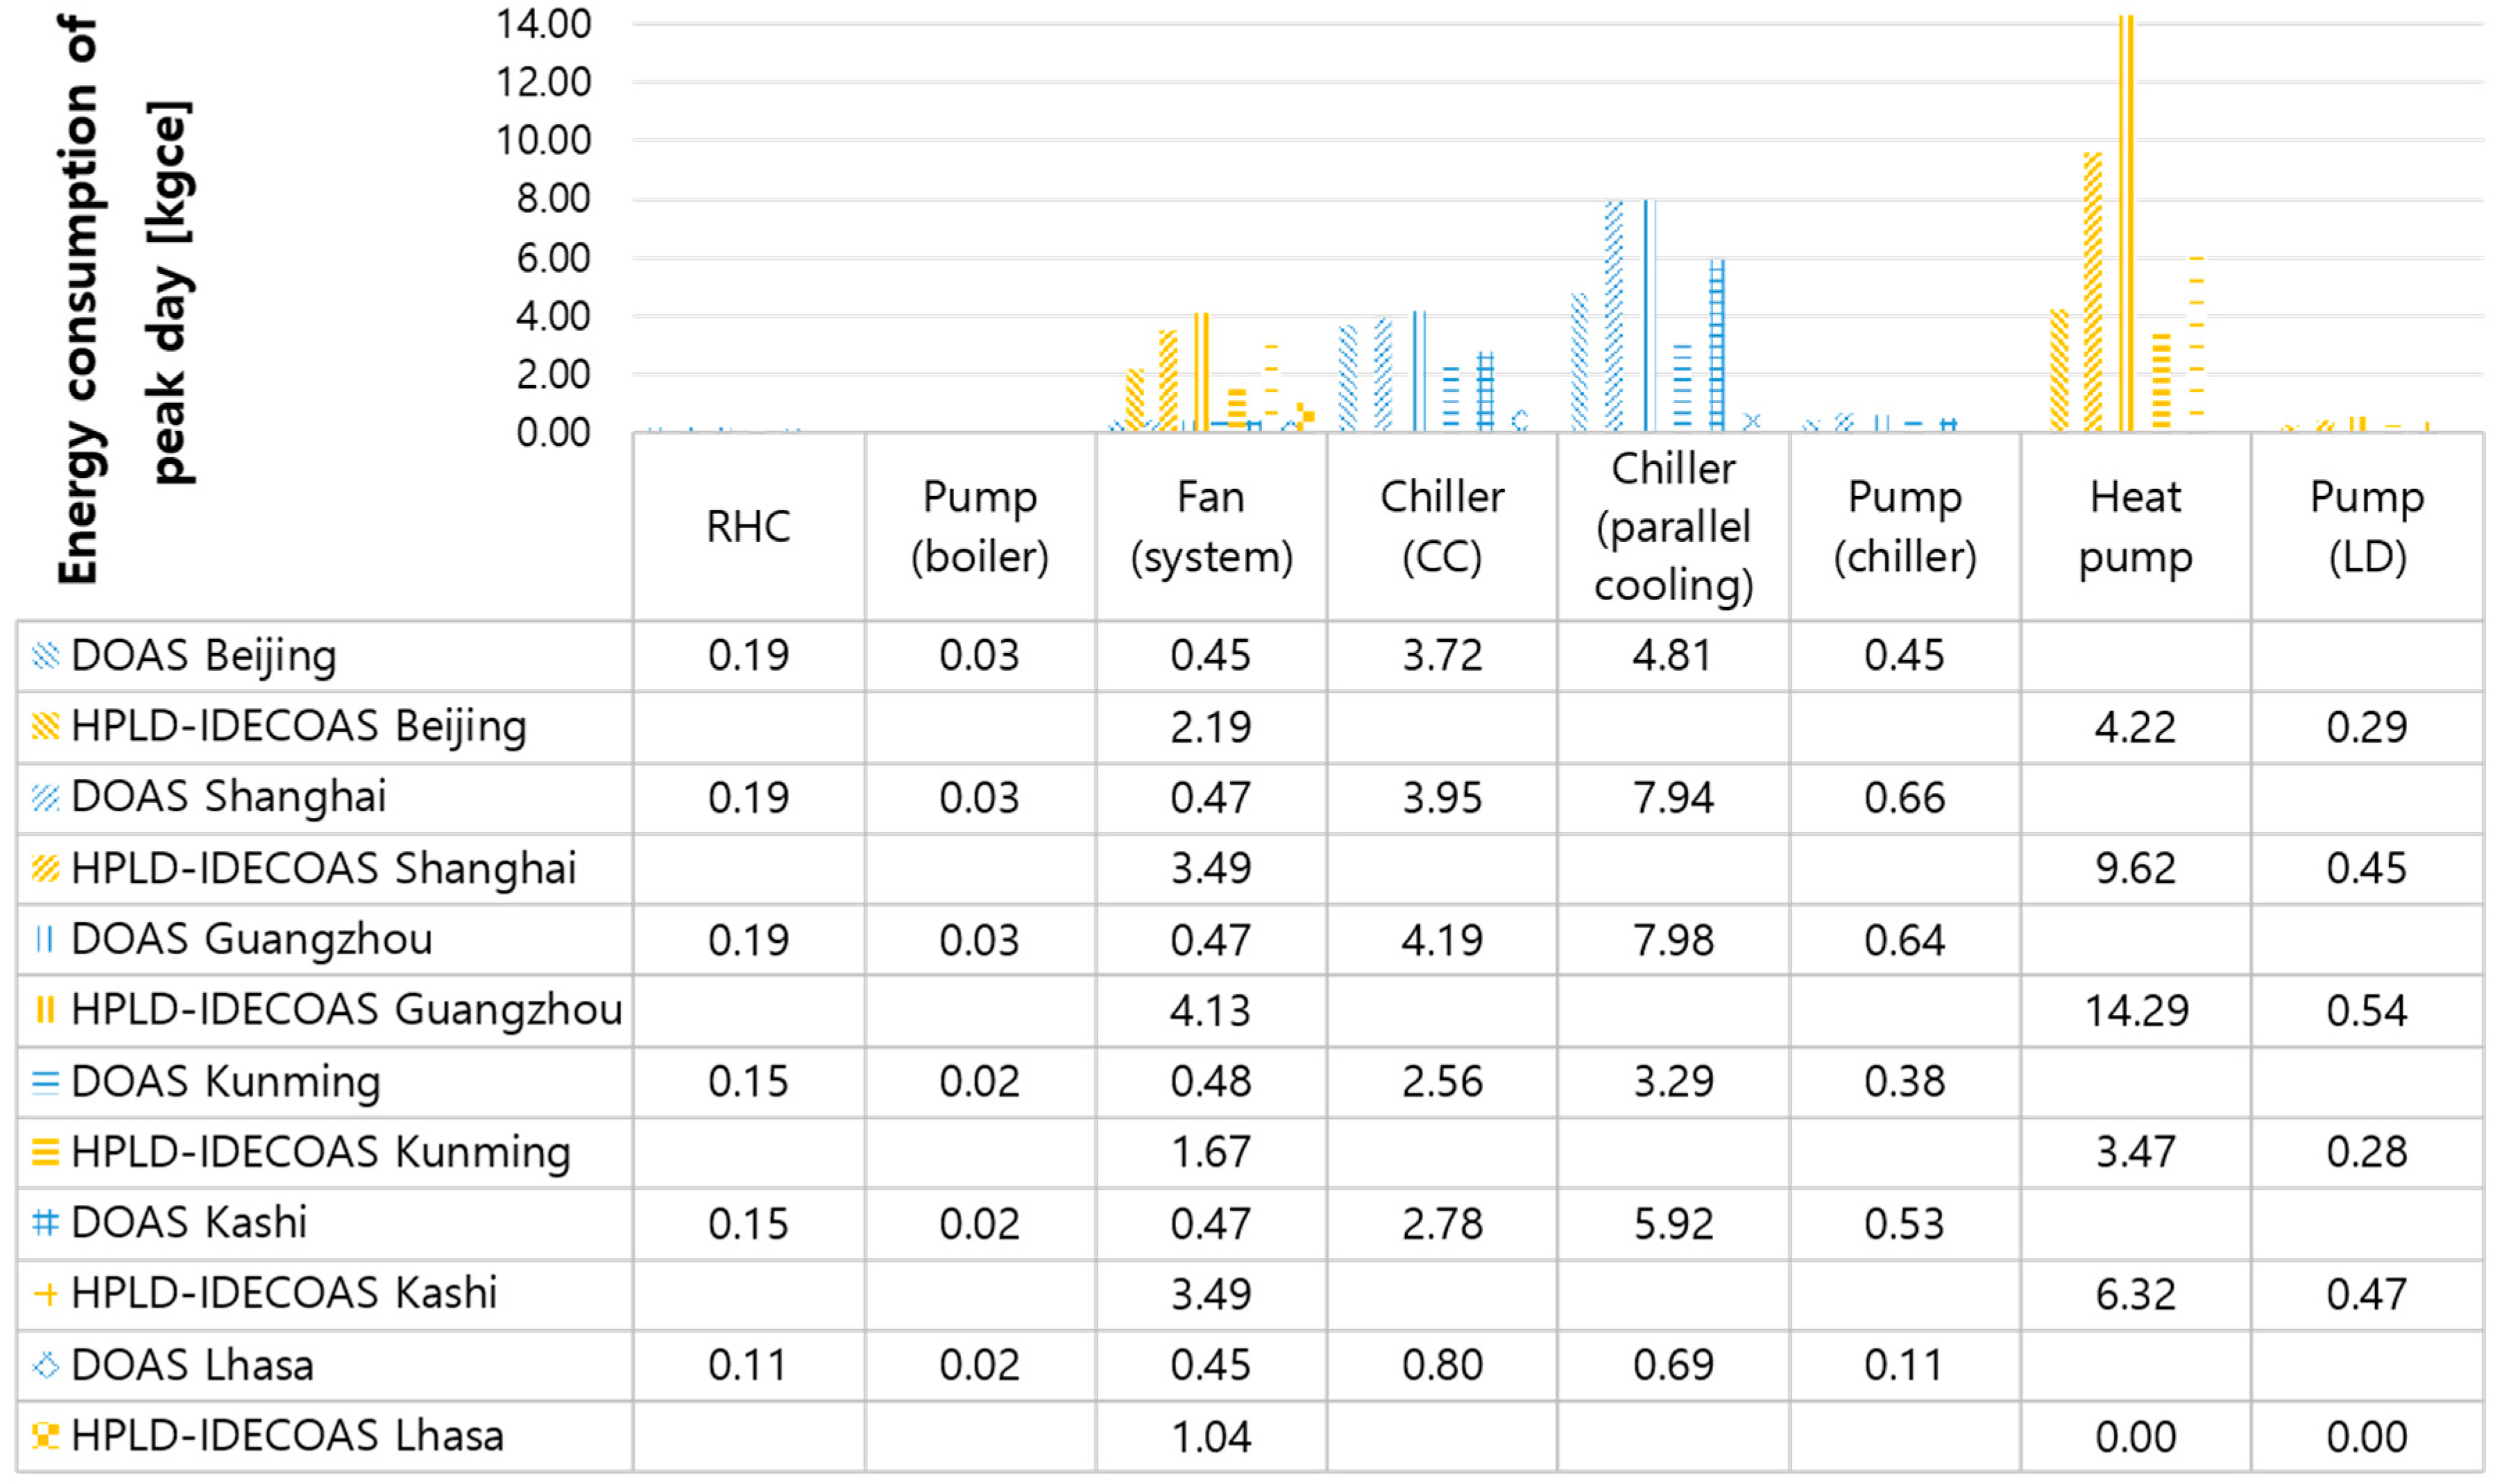
4.1. Comparison of Peak Day Energy Consumption
- (1)
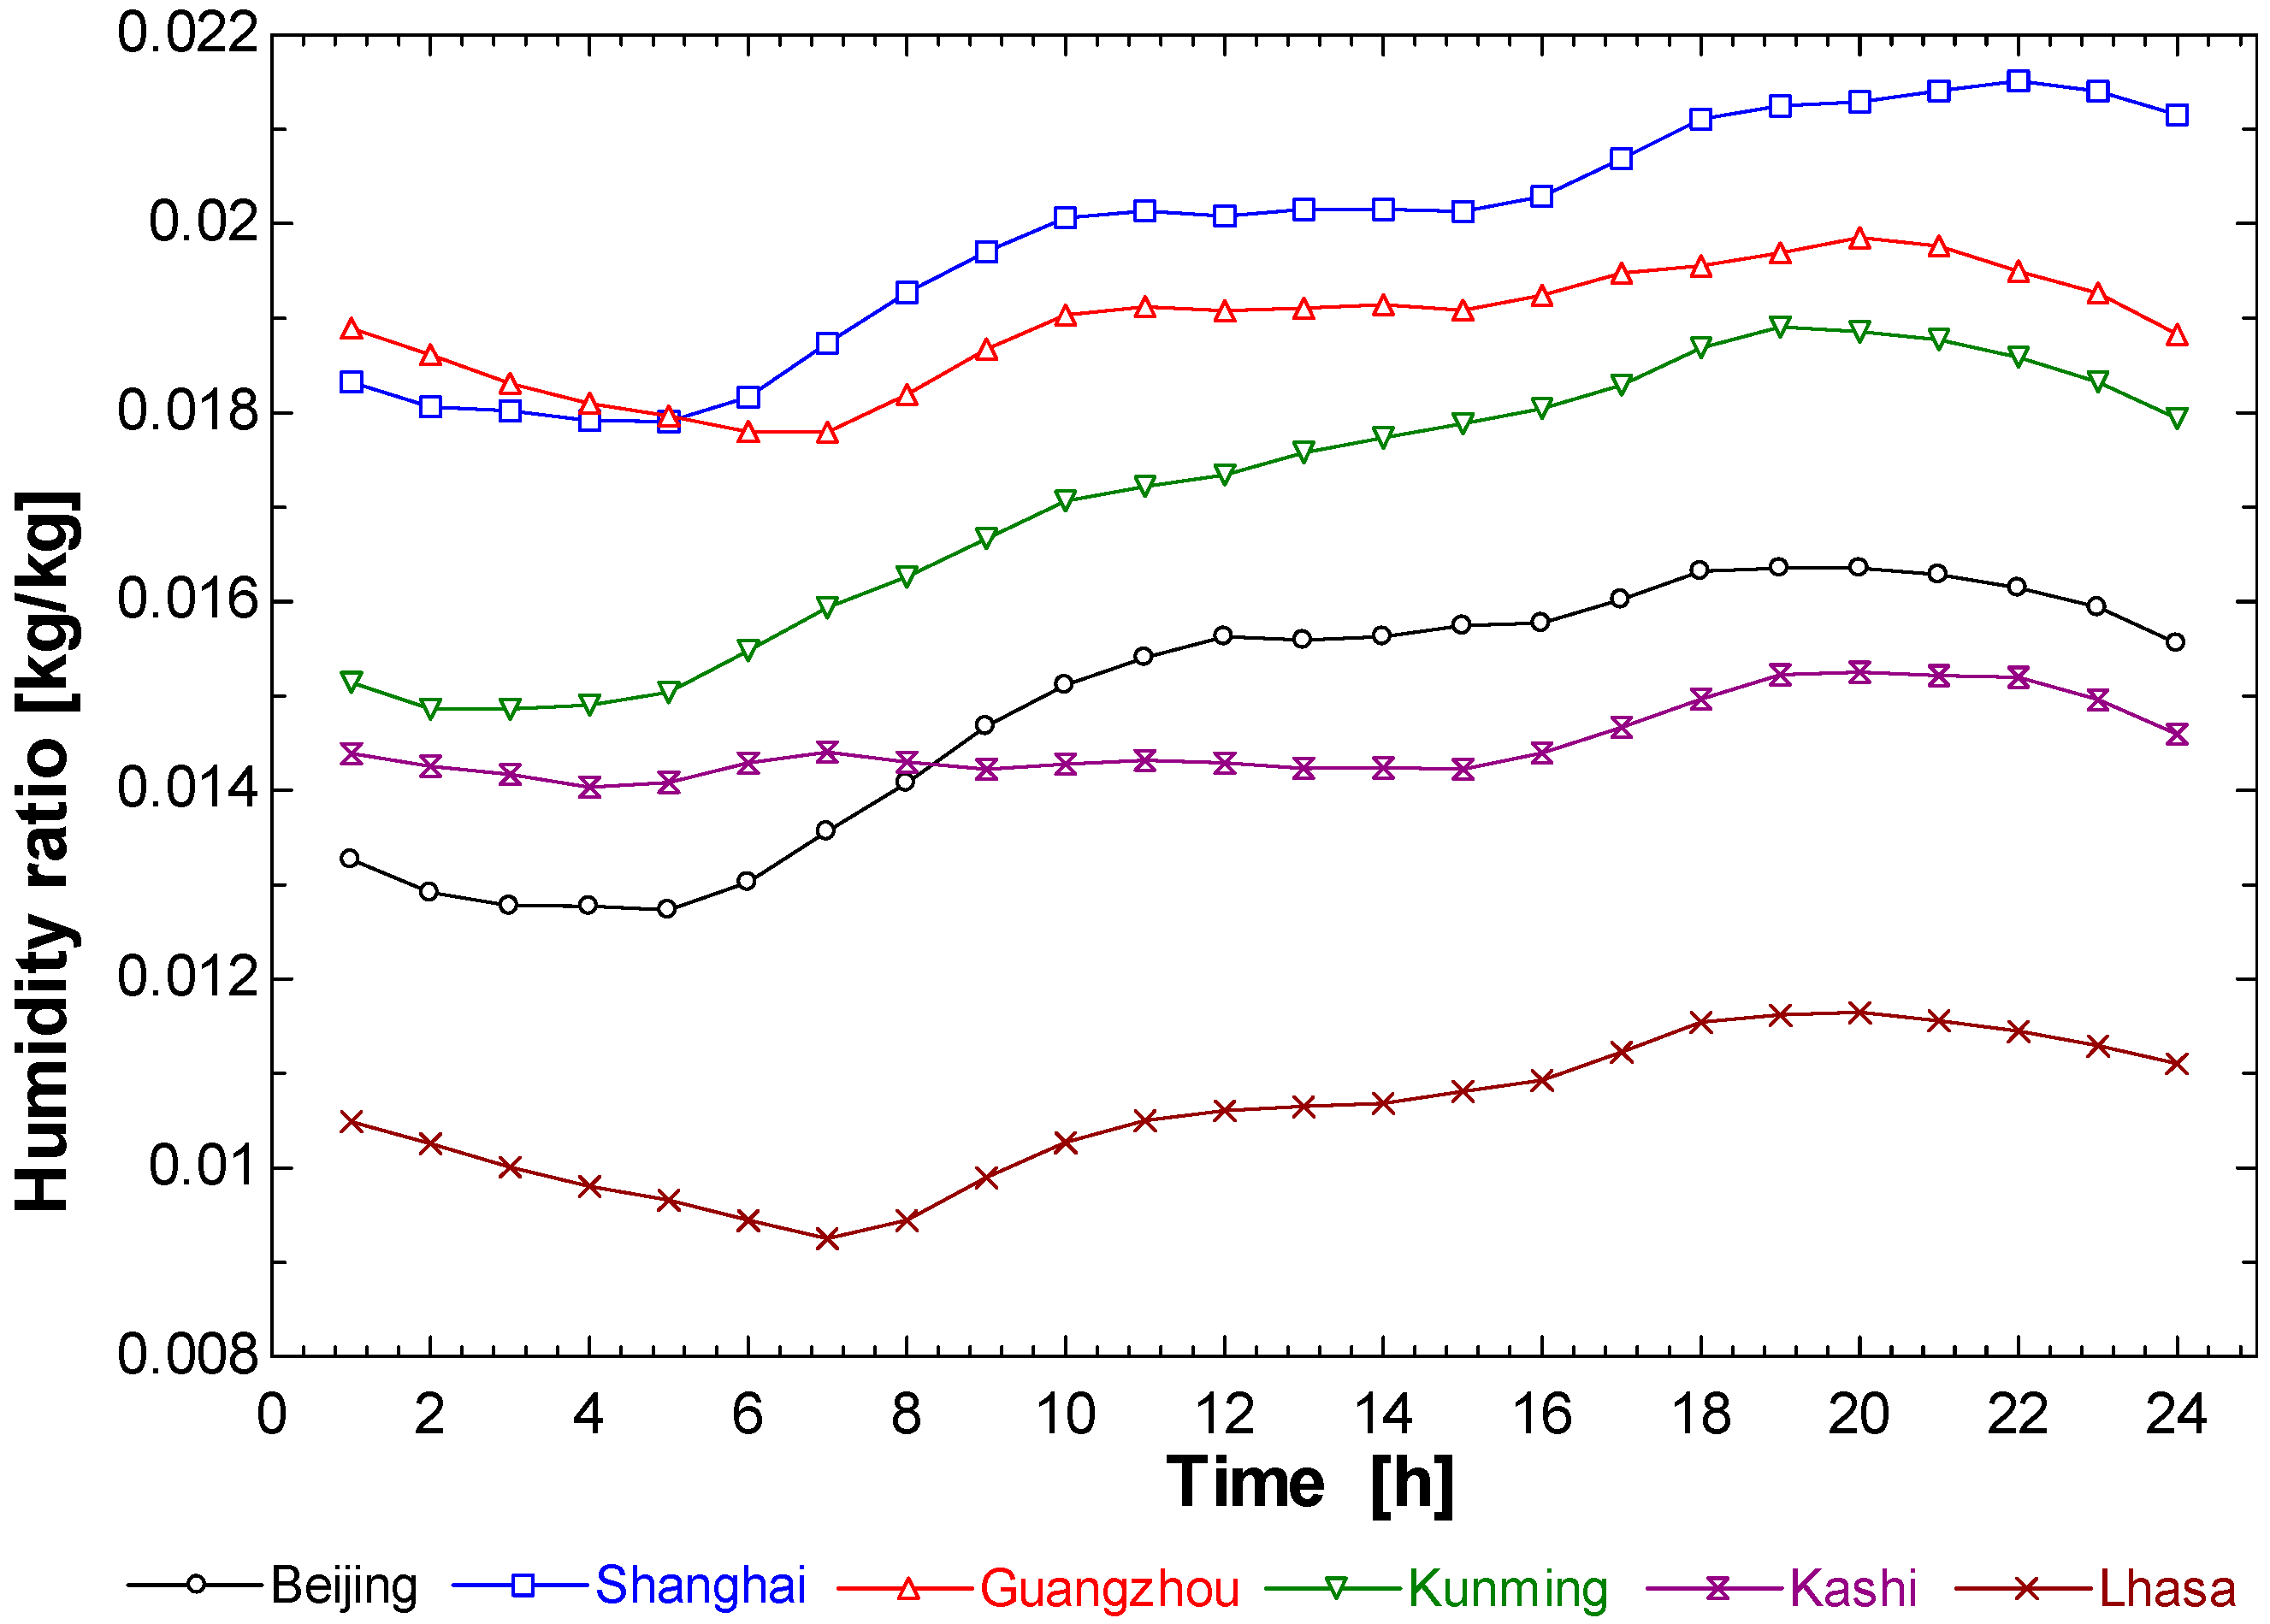
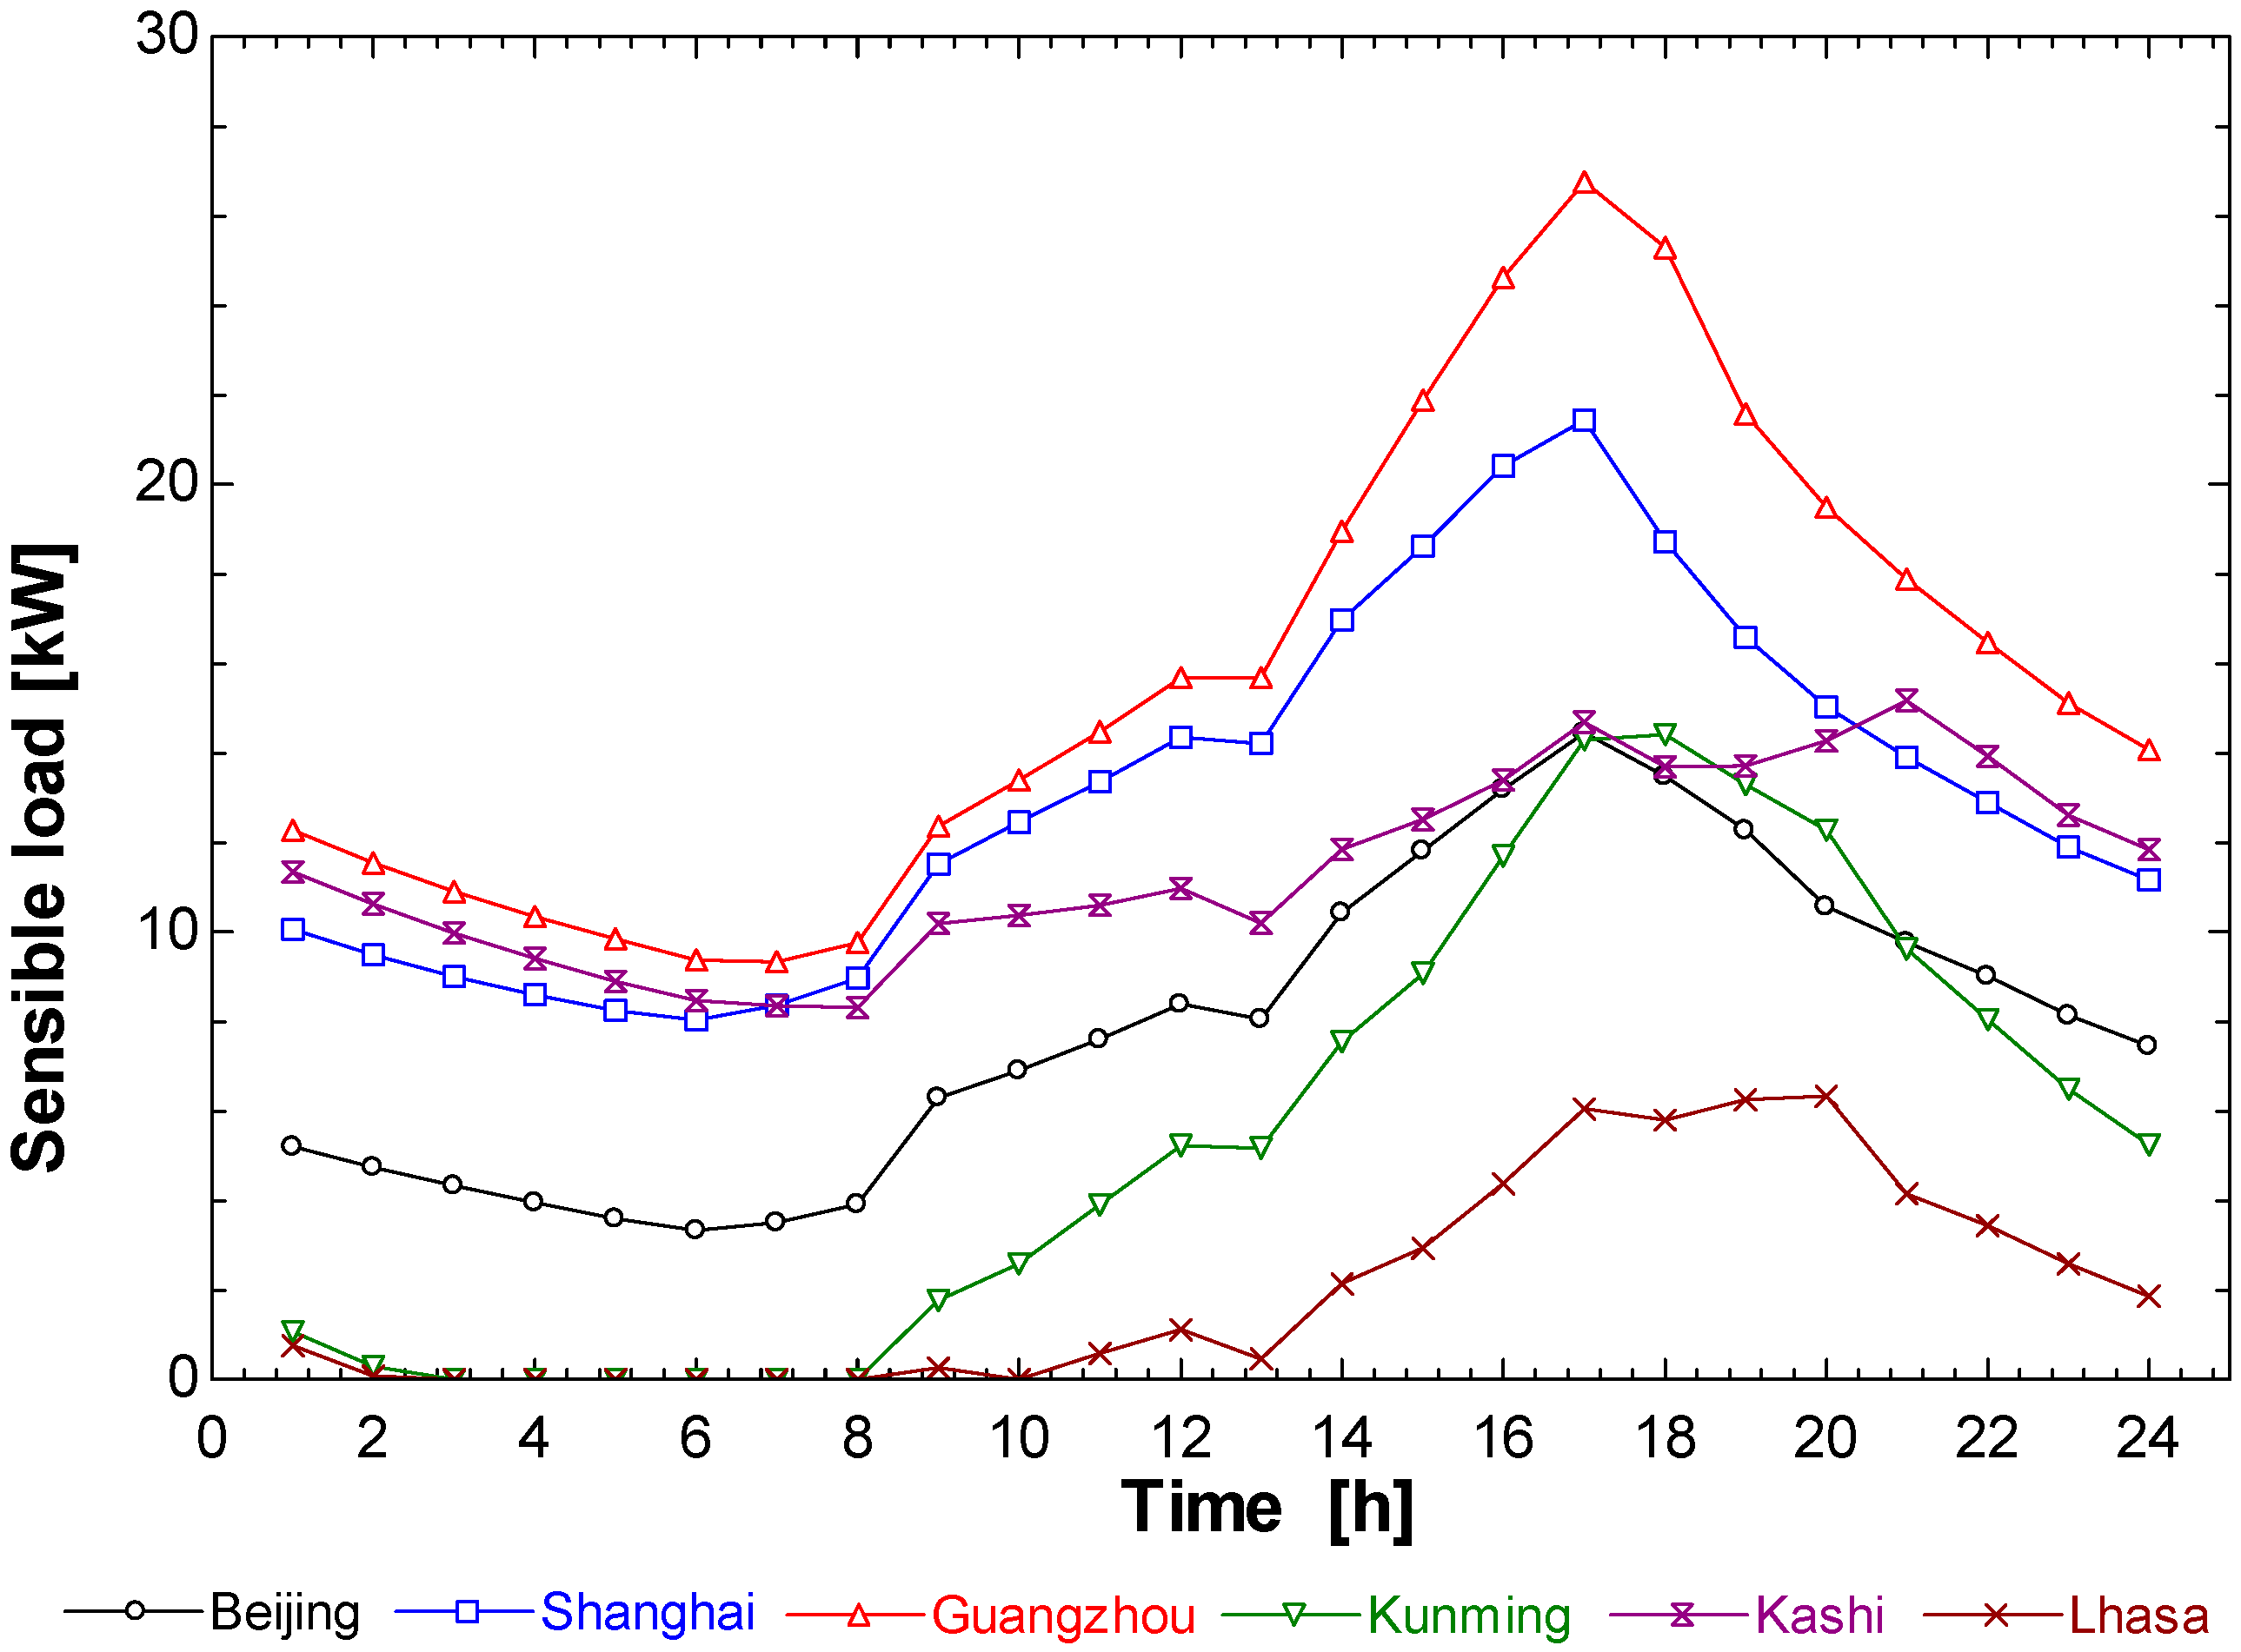
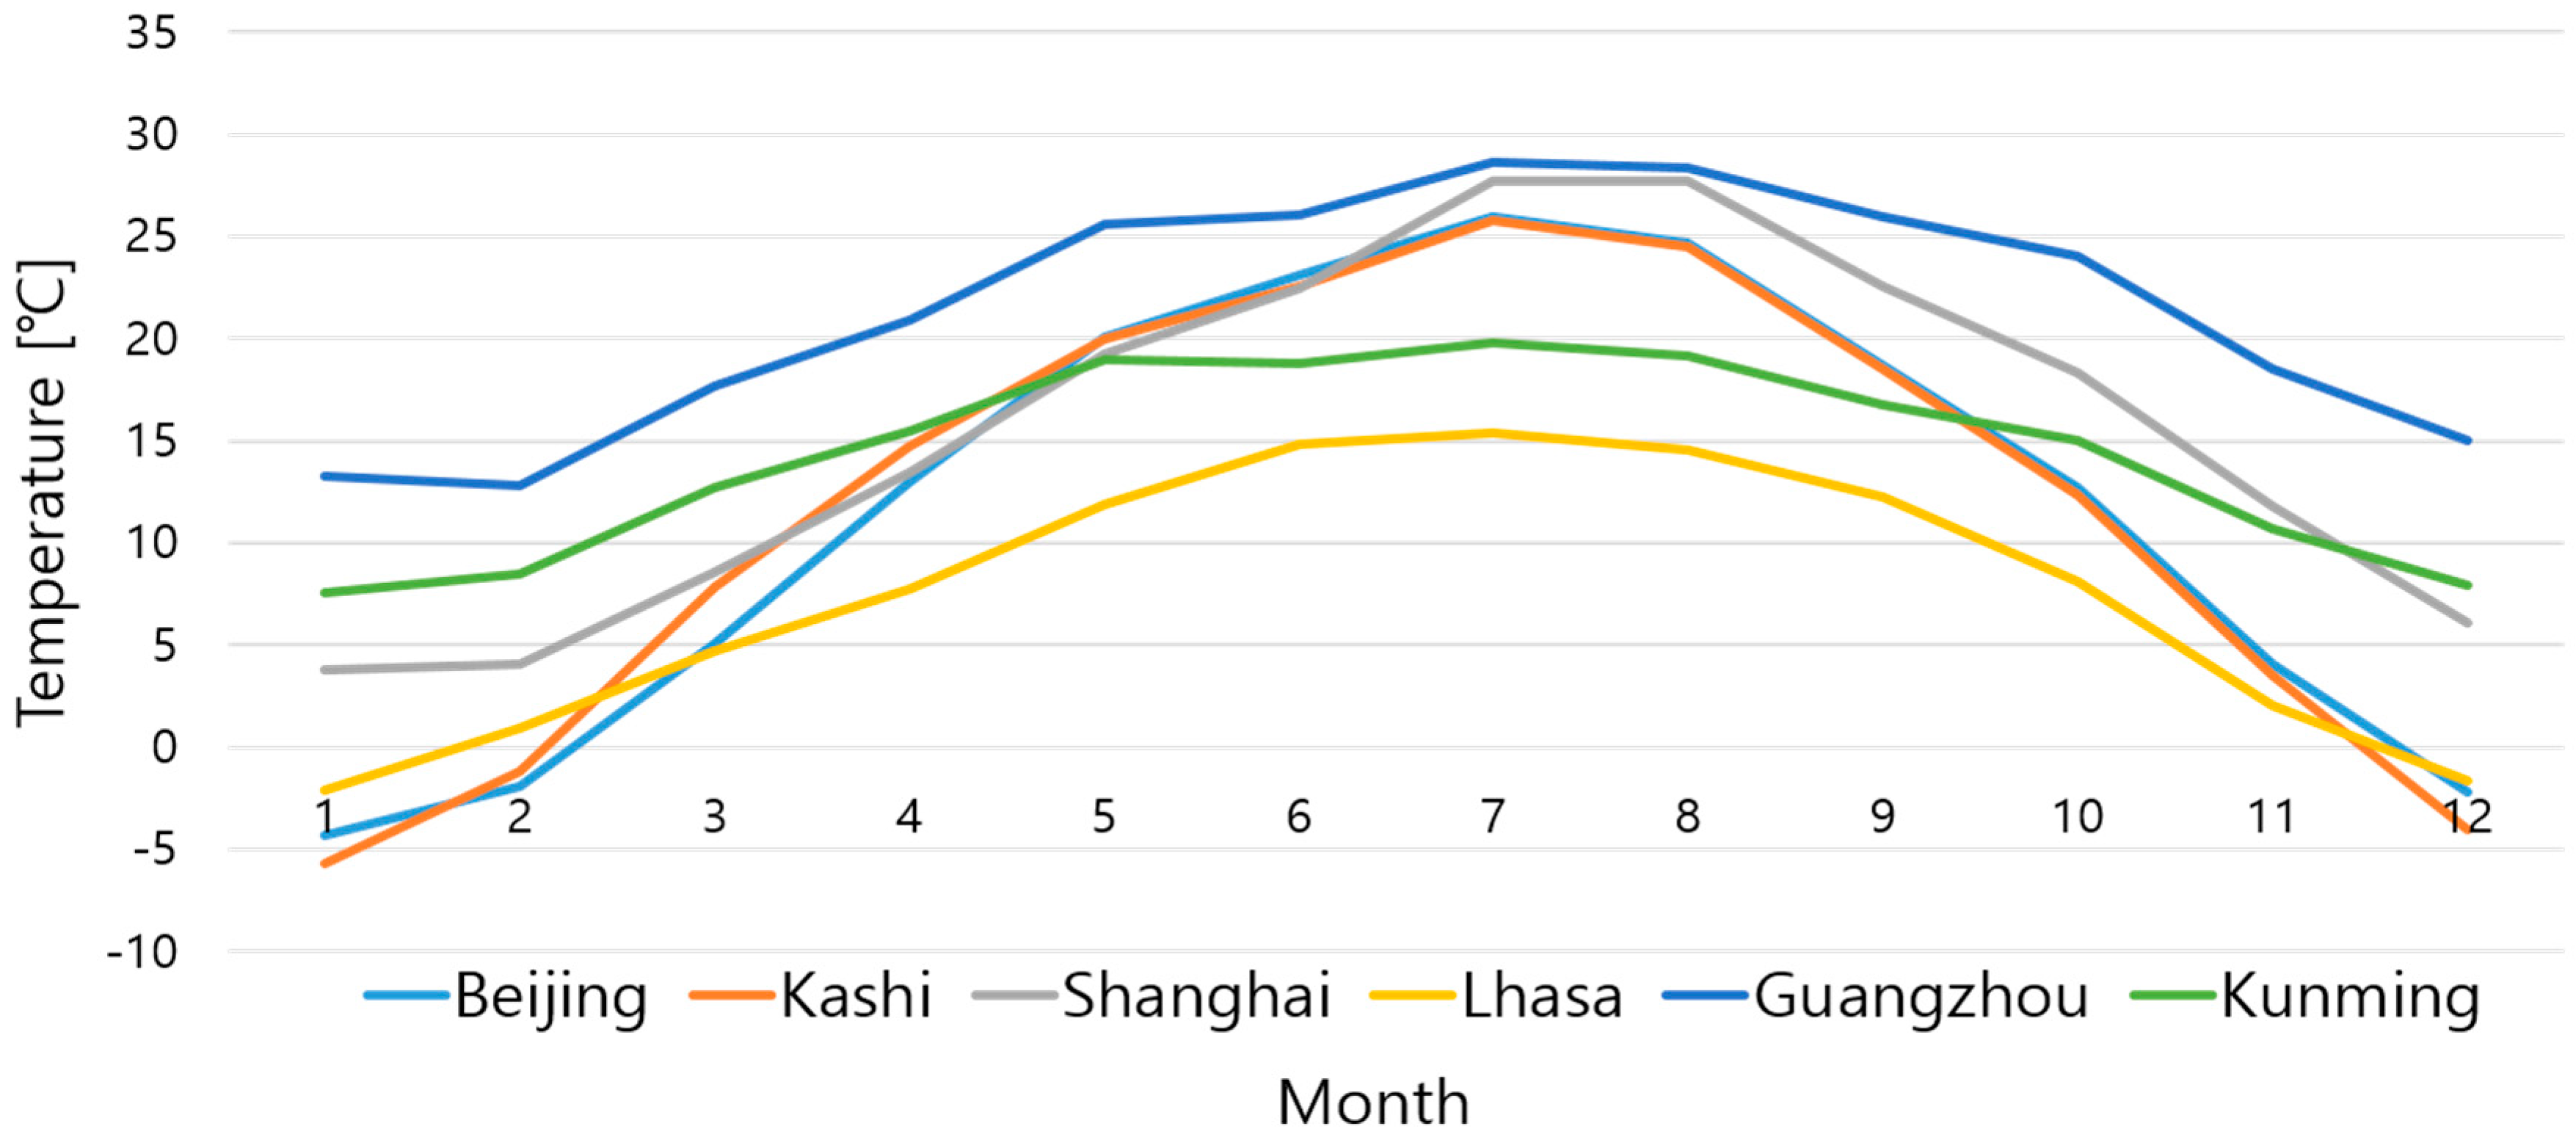
- The energy-saving potential of the HPLD-IDECOAS is most affected by the sensible load that needs to be eliminated from the room. For example, the energy-saving potential of Lhasa is greater than those of Beijing, Kashi, Shanghai, and Guangzhou in turn.
- (2)
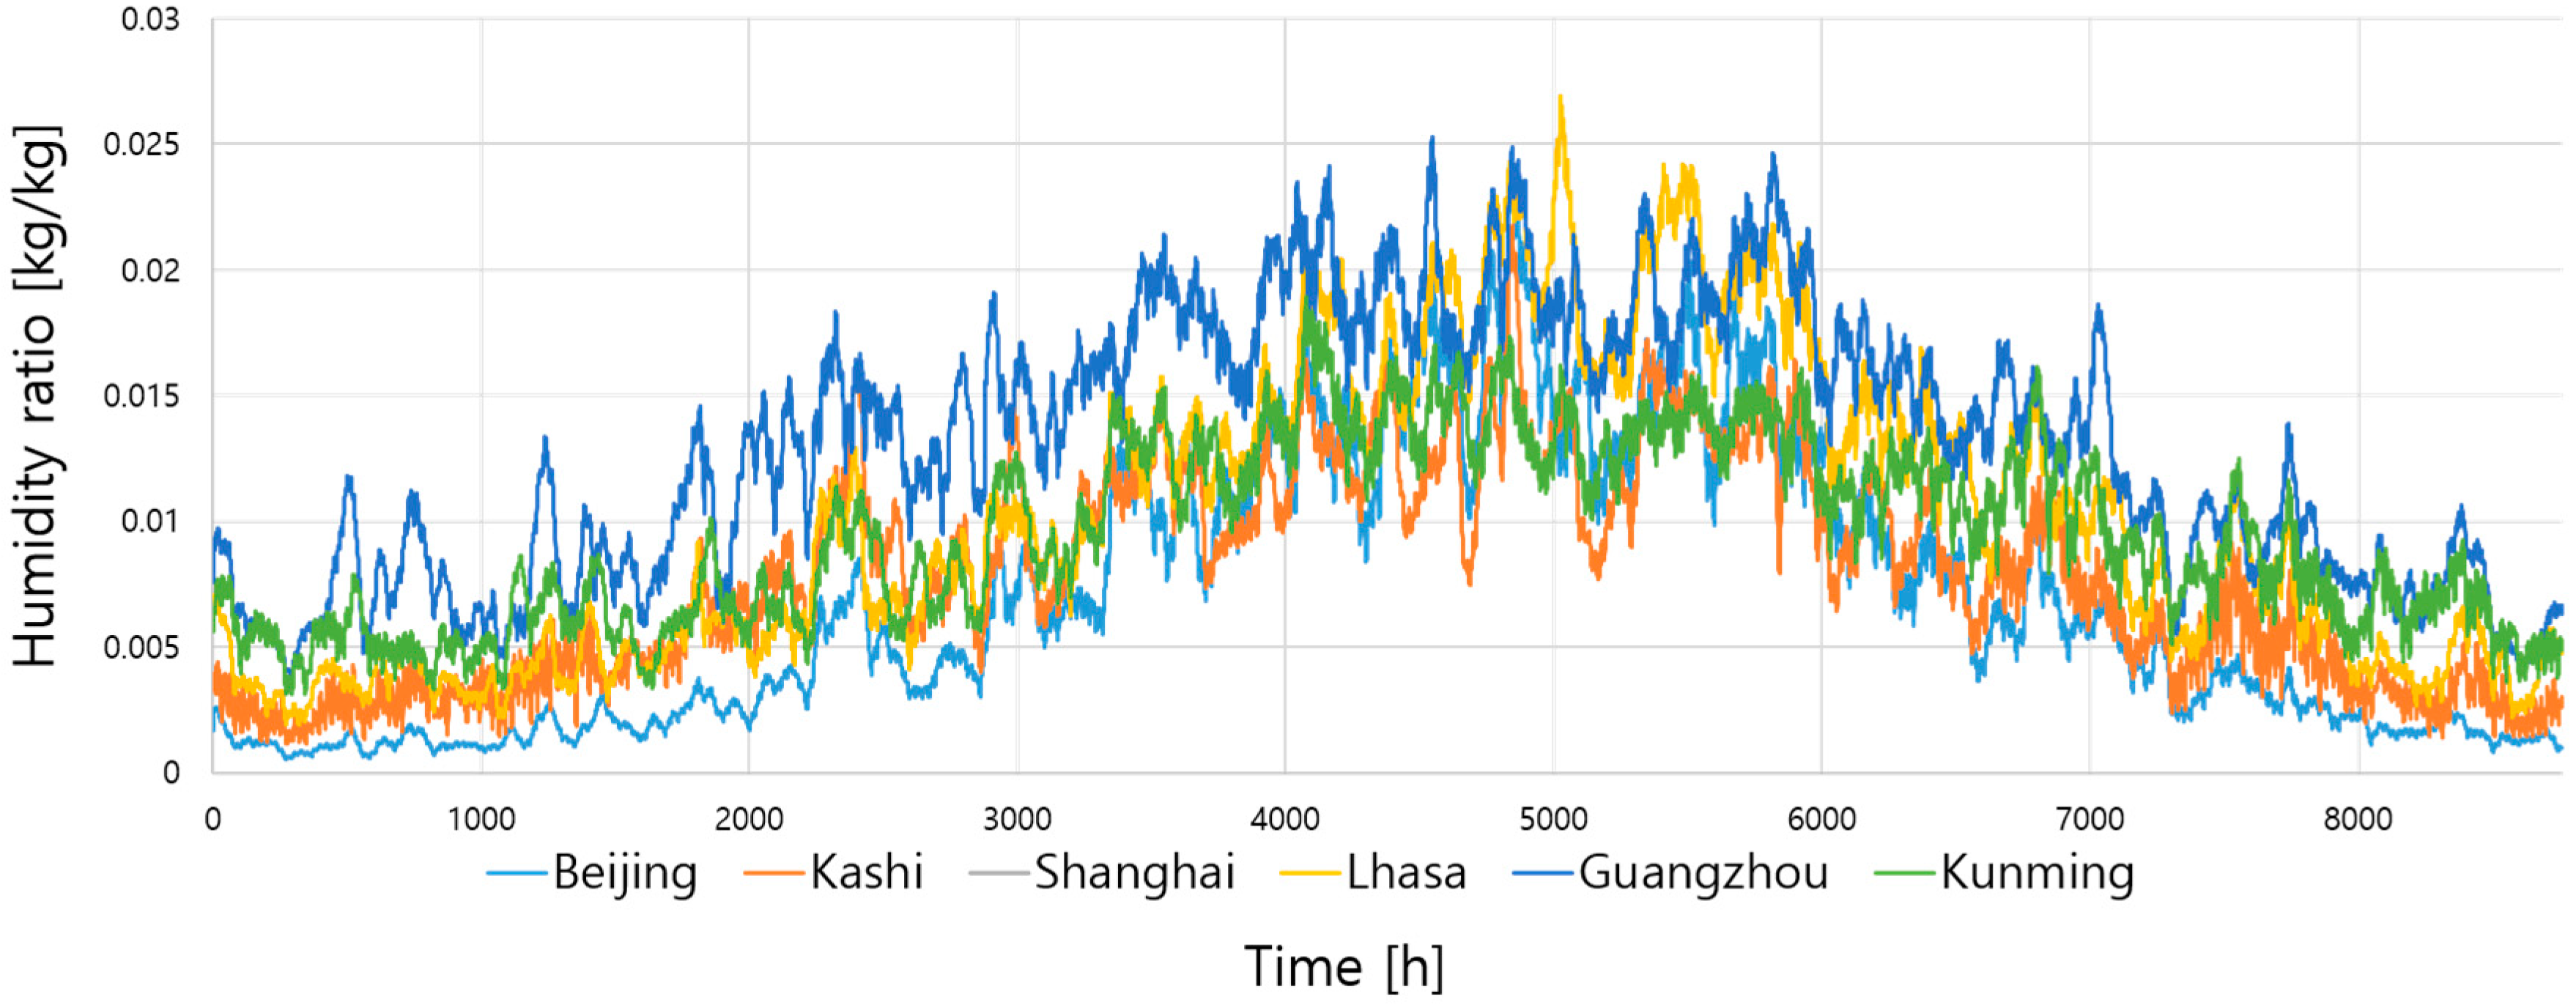
- When the difference in the HR is large, the energy-saving potential of the HPLD-IDECOAS is more affected by the HR, such as is Beijing and Kunming.
- (3)
- The energy performance of the DOAS in each representative city is opposite to that of the HPLD-IDECOAS. For example, when there is too much sensible load eliminated from the room, the energy-saving effect is significantly higher than the HPLD-IDECOAS, and at other times, the energy consumption is much higher than the HPLD-IDECOAS.
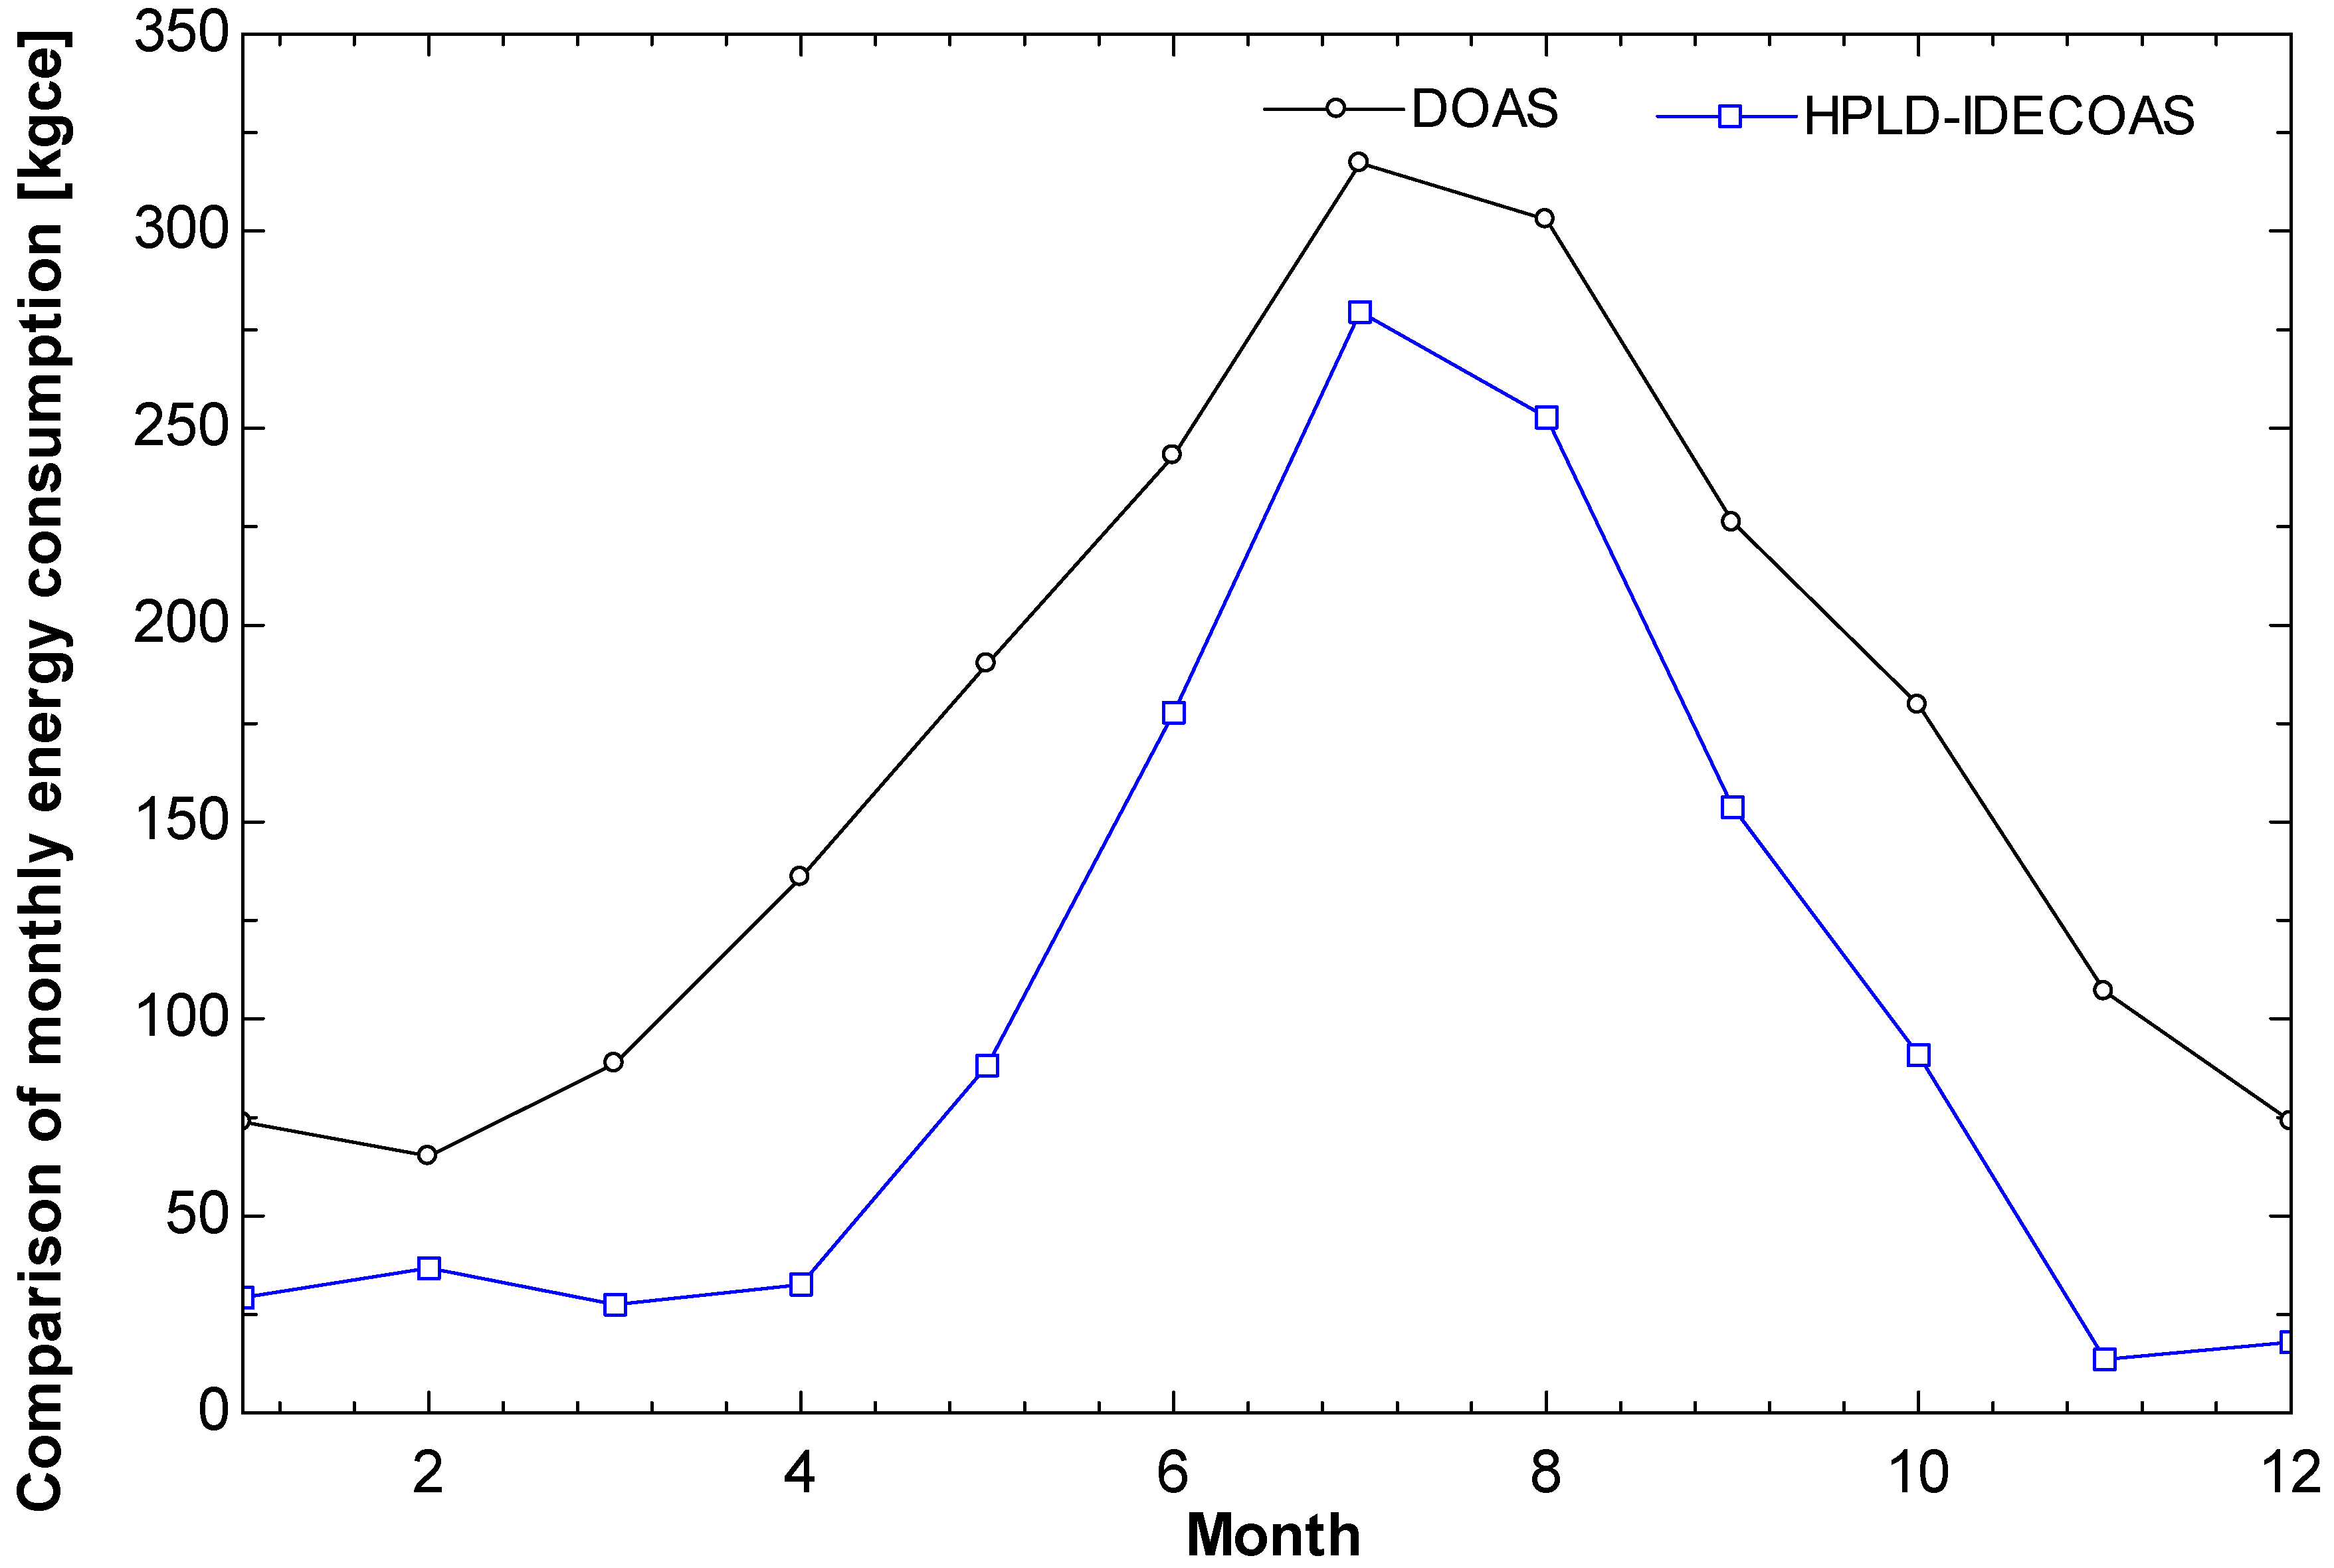
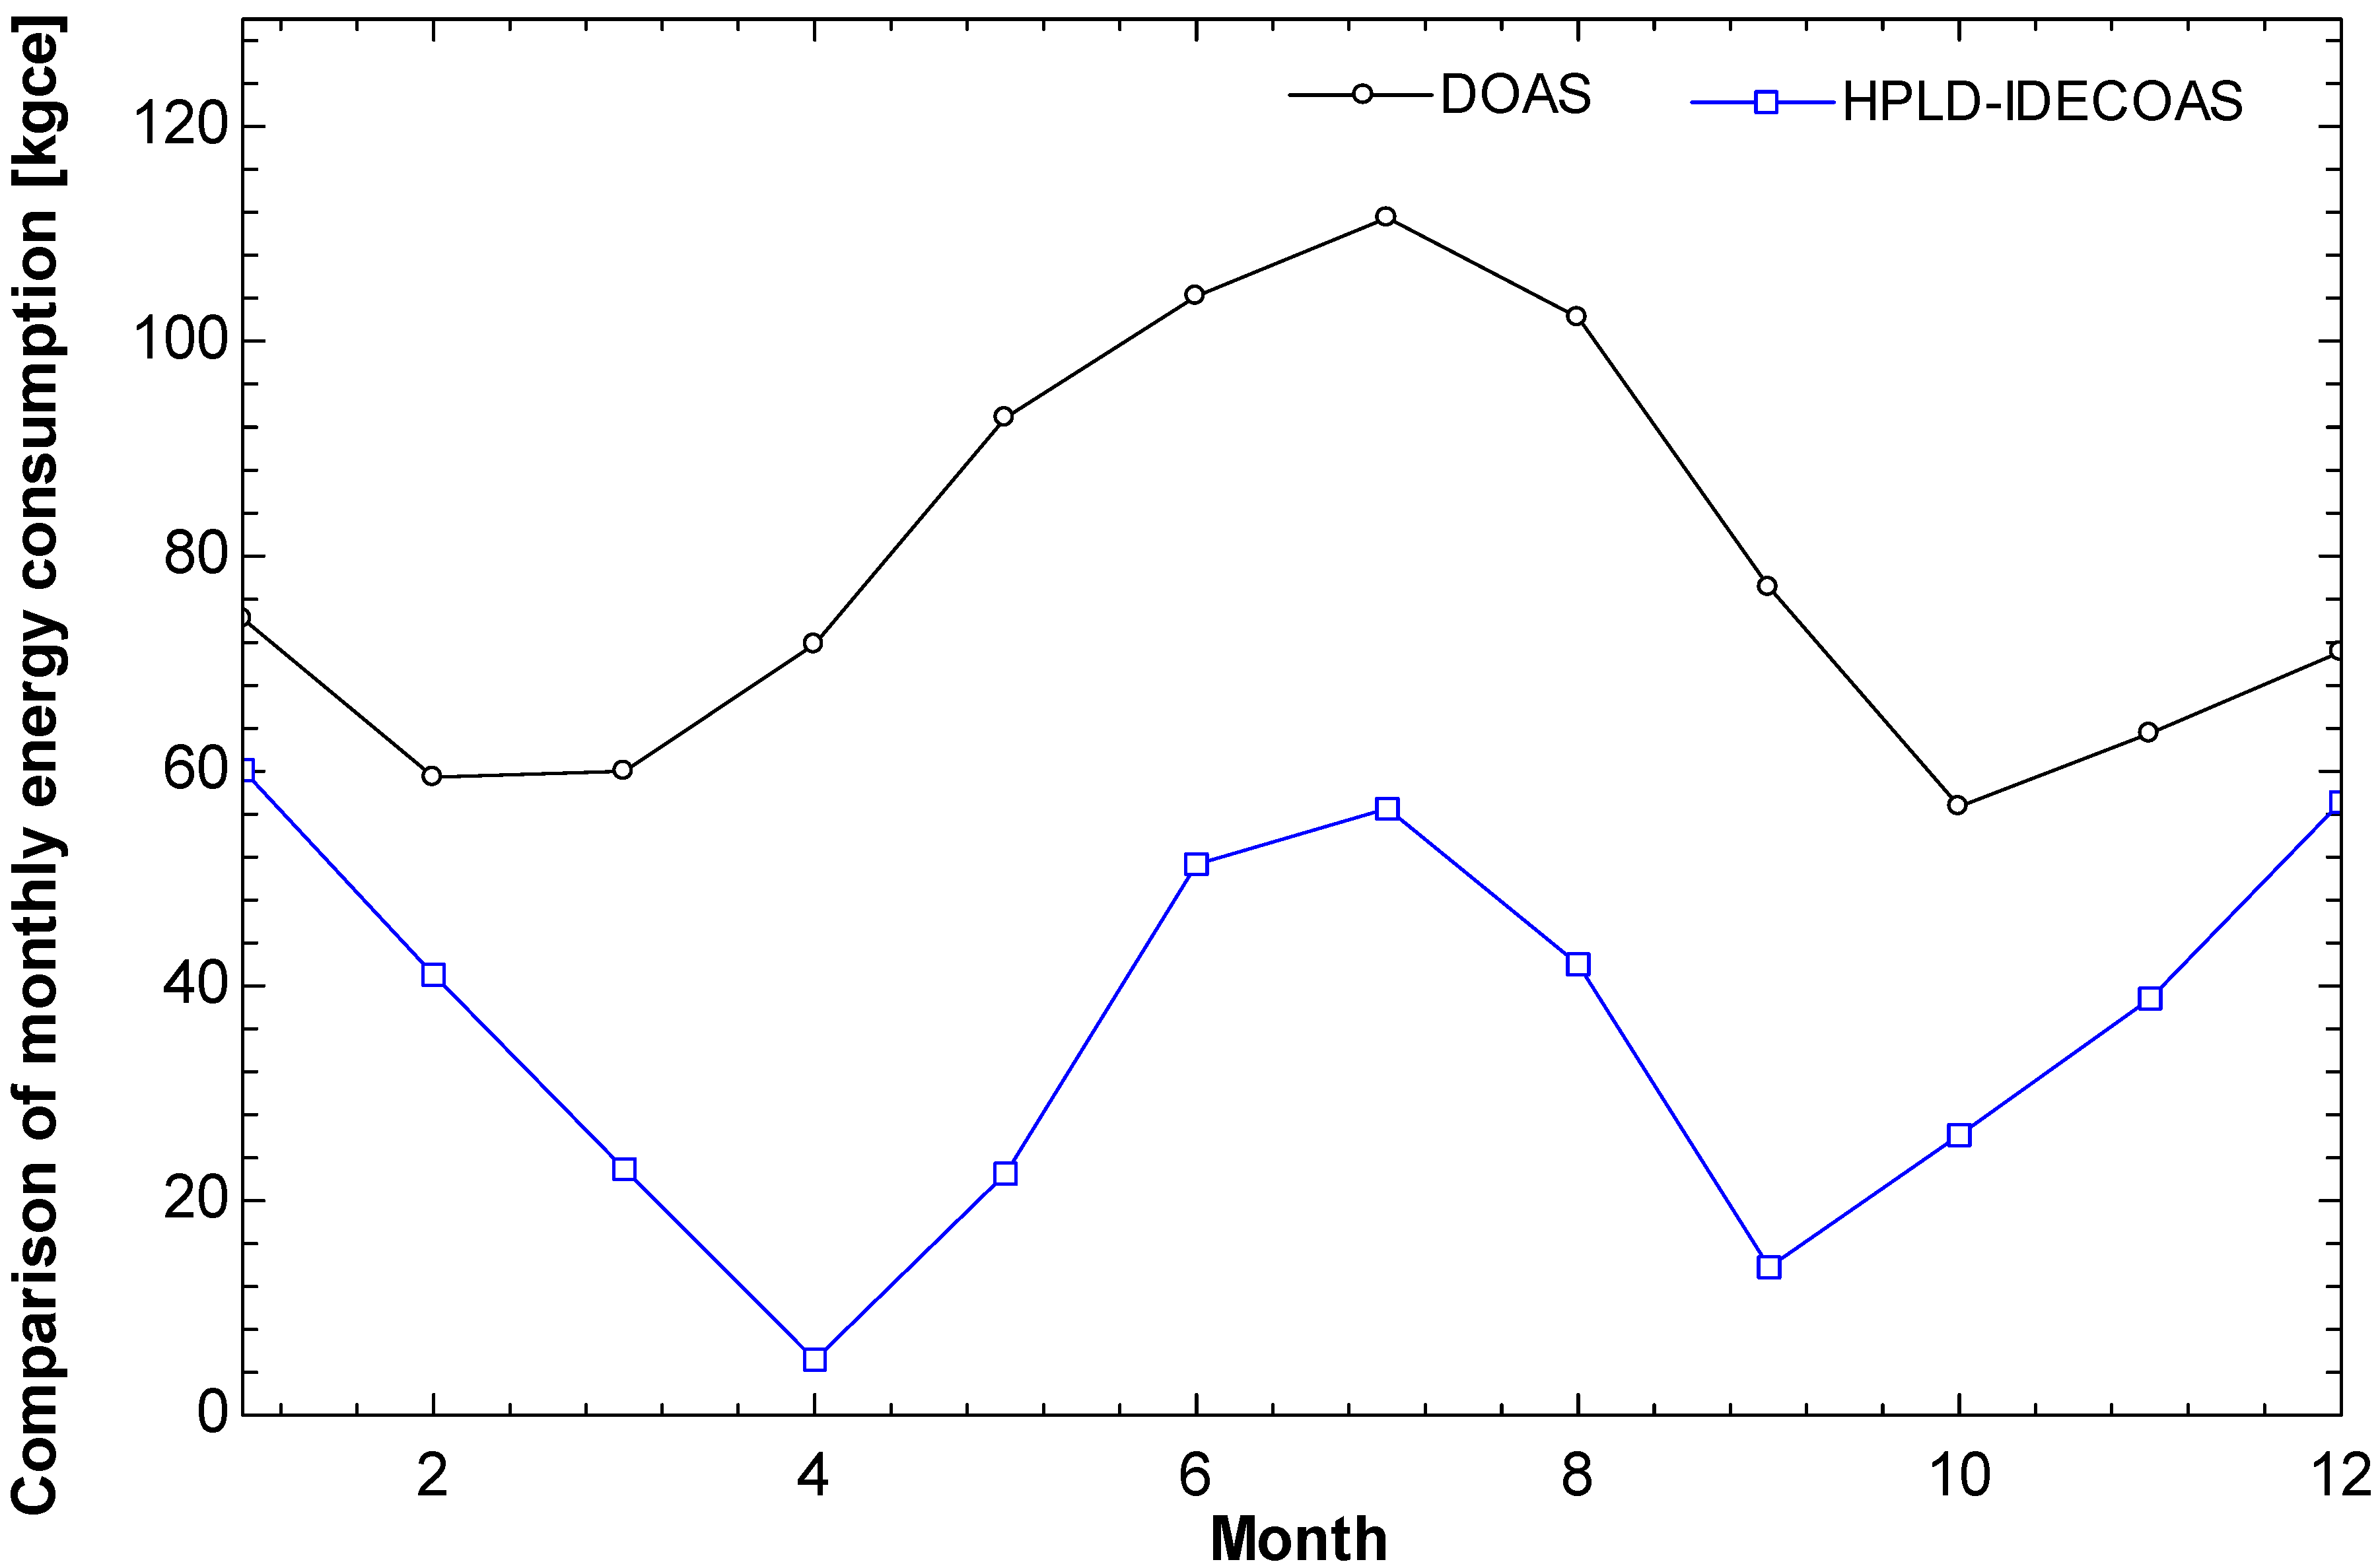
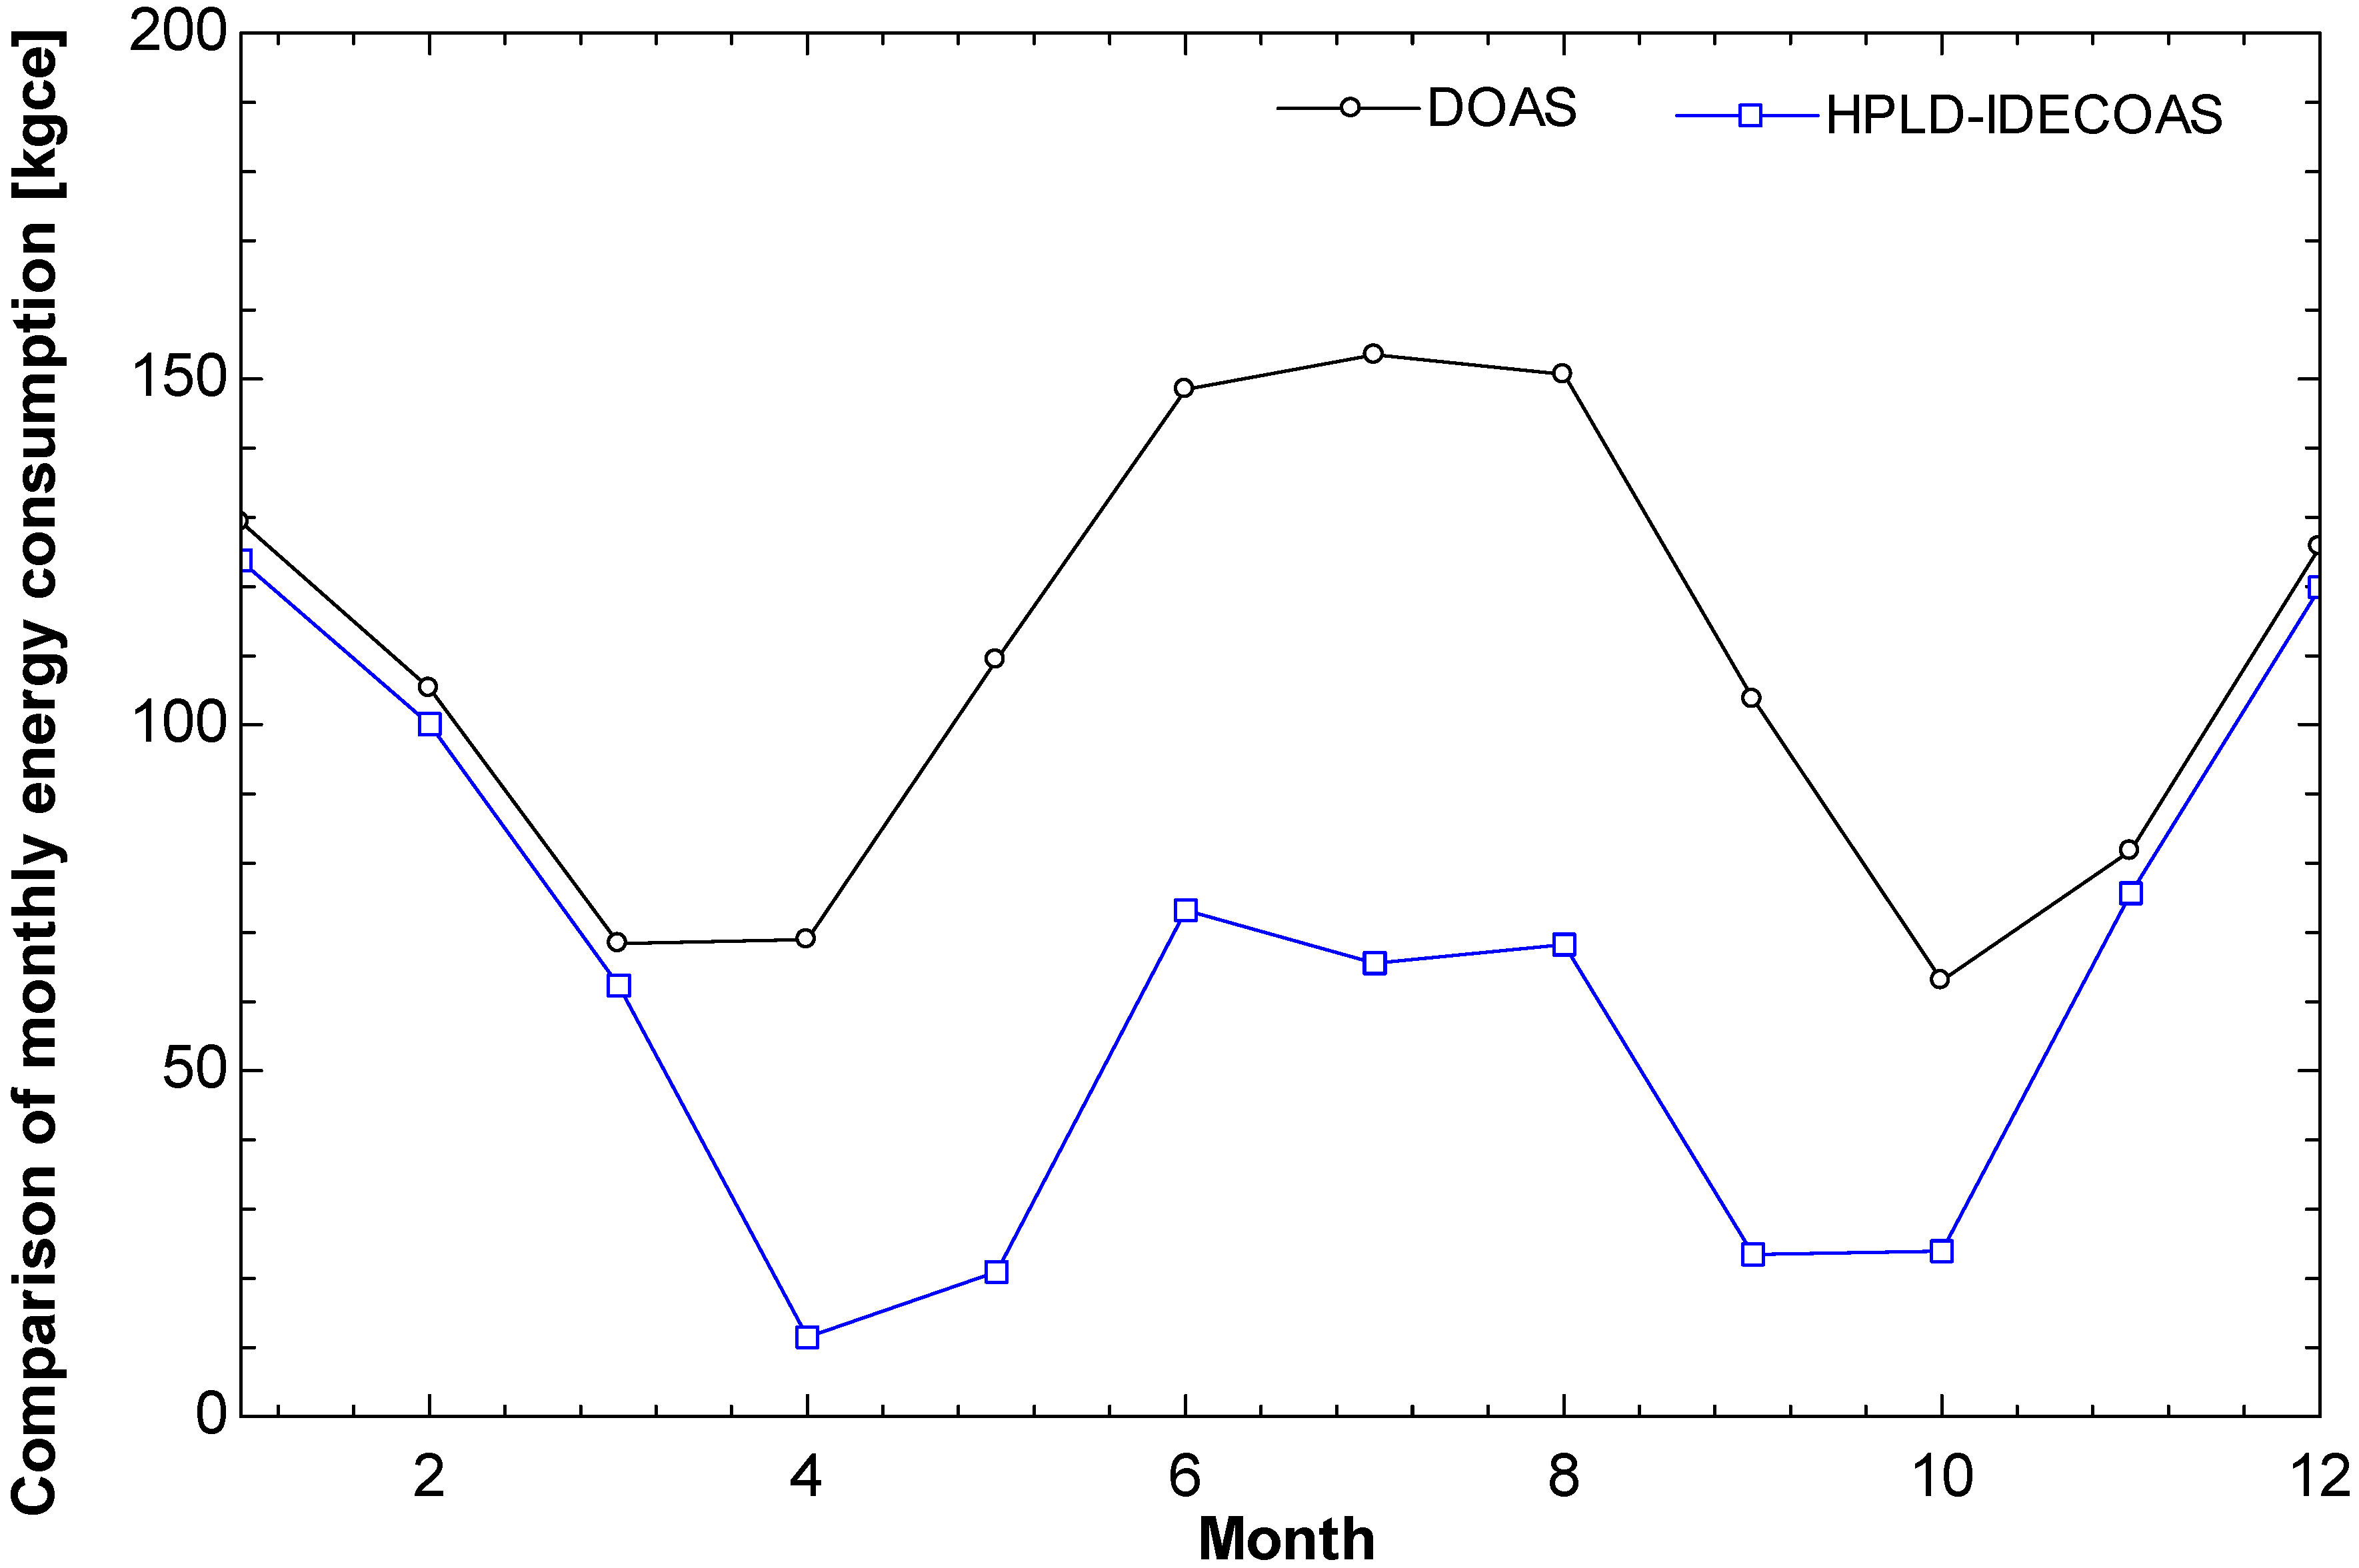
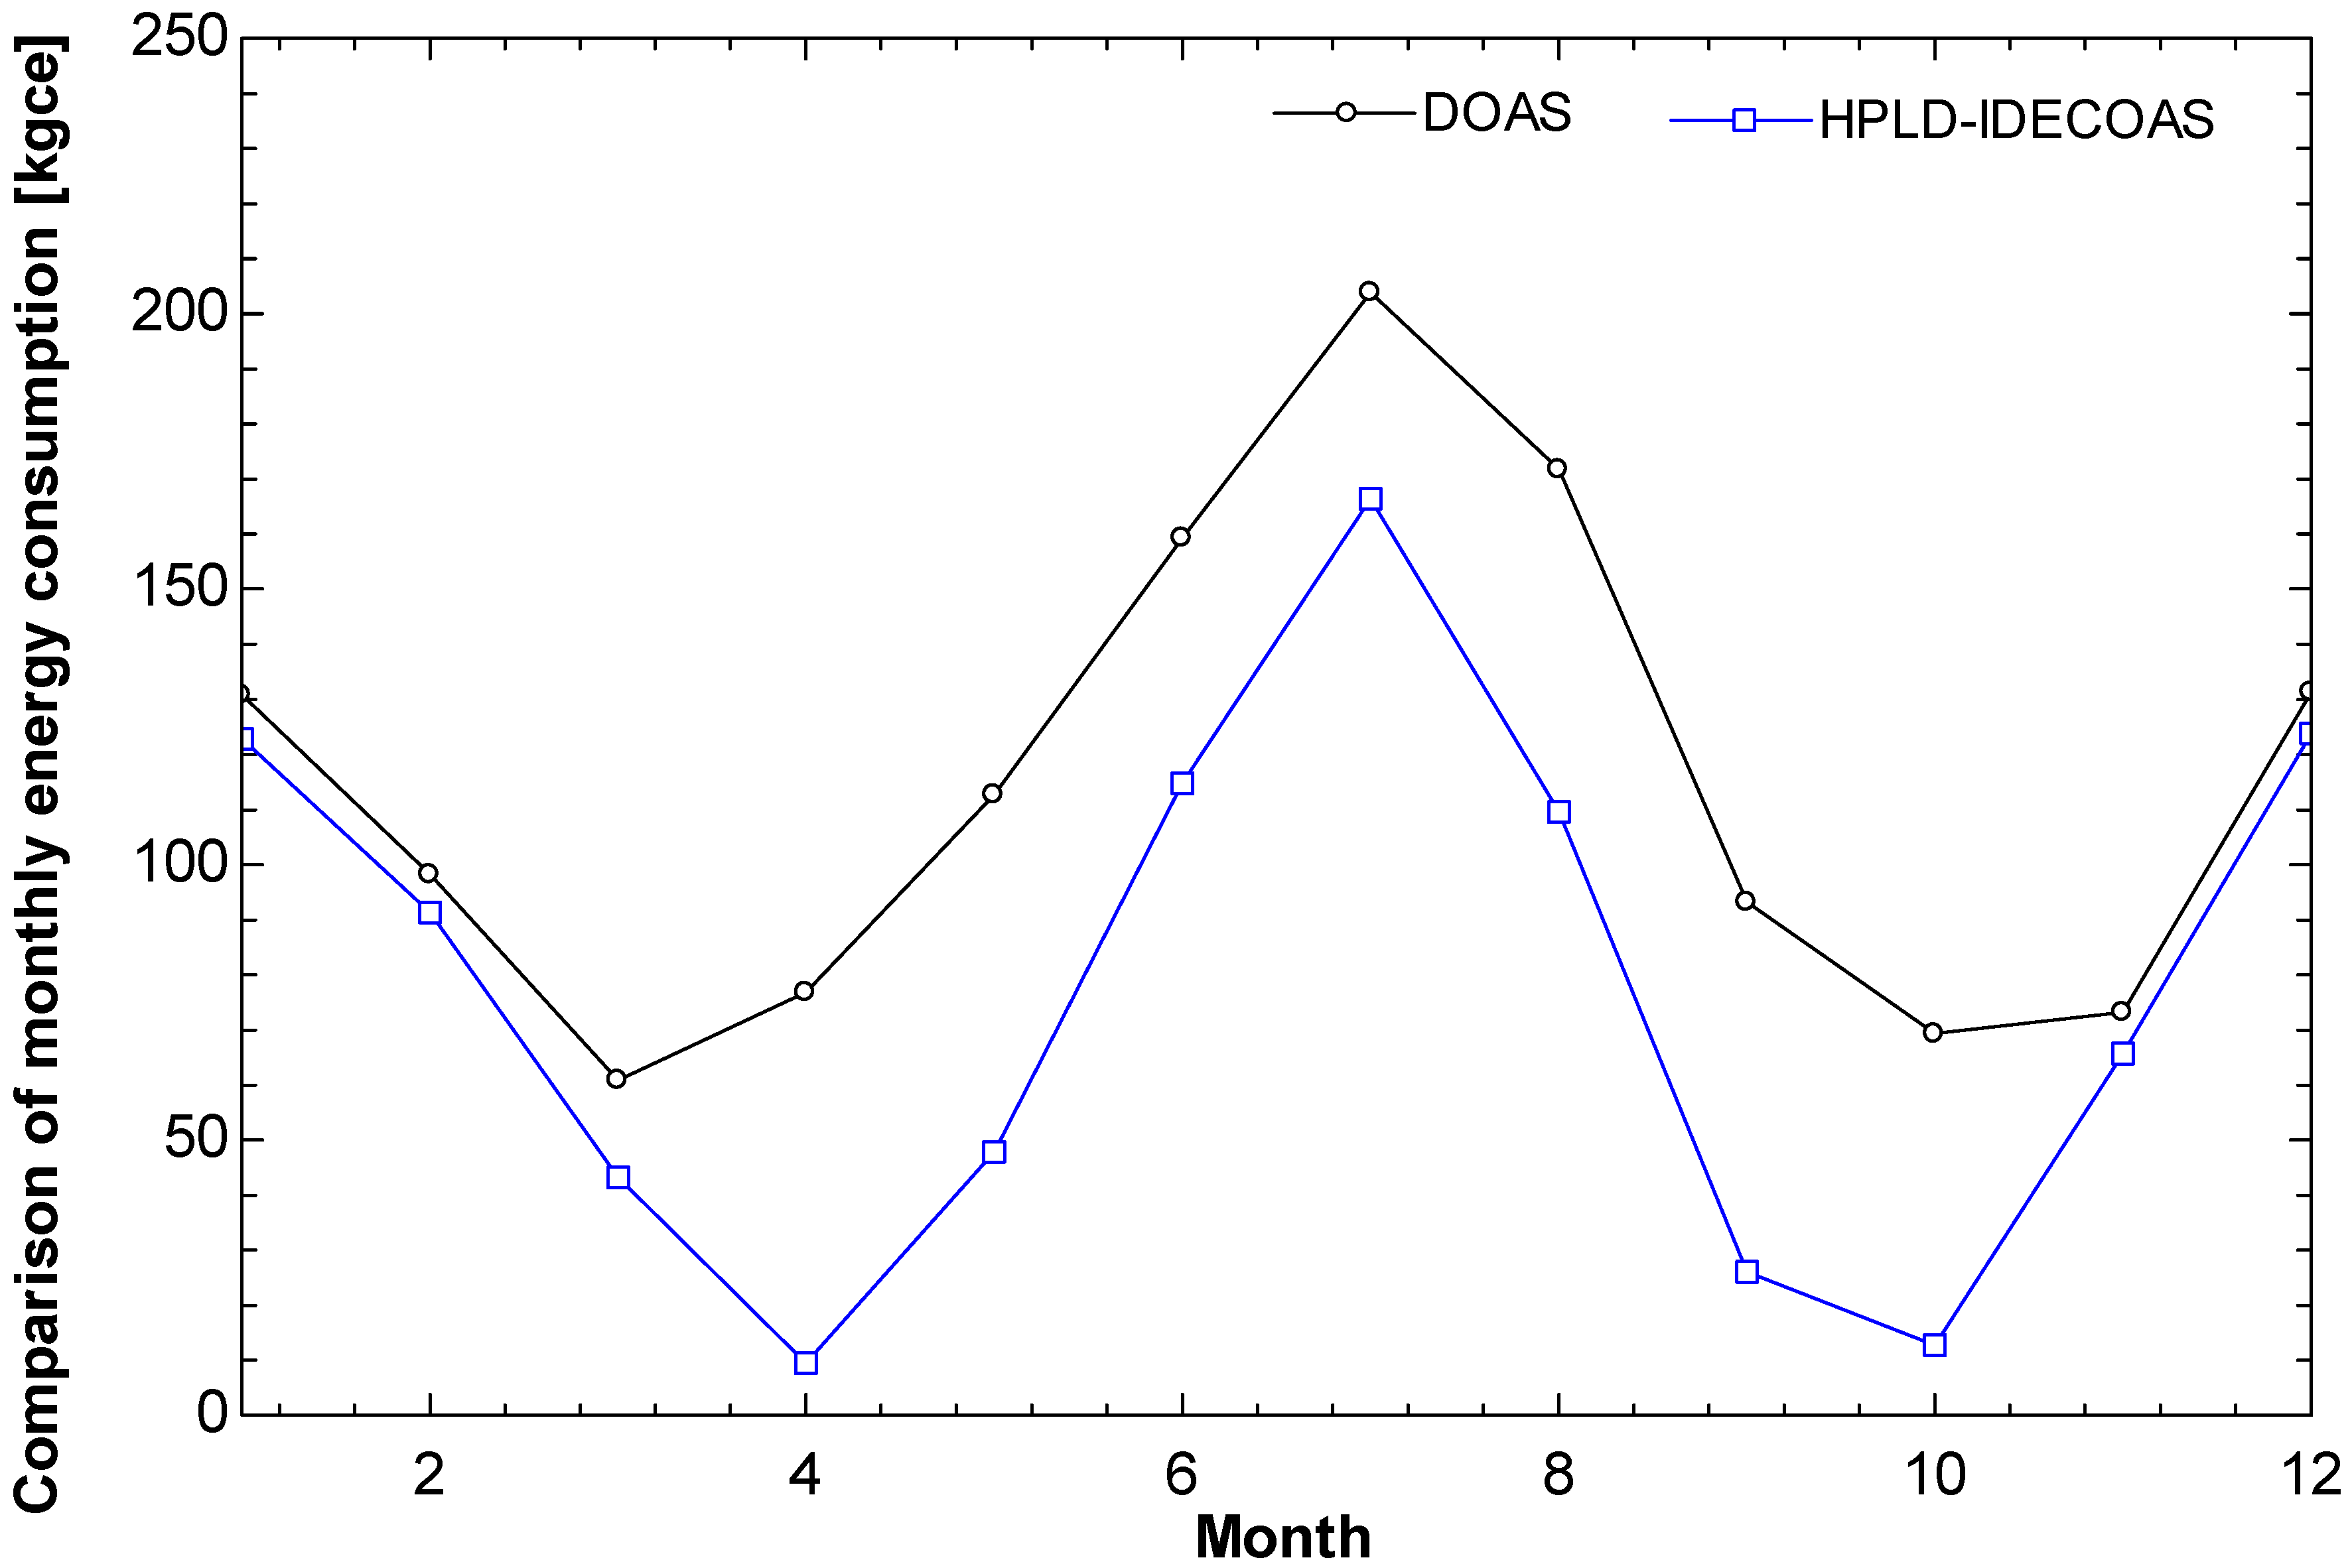
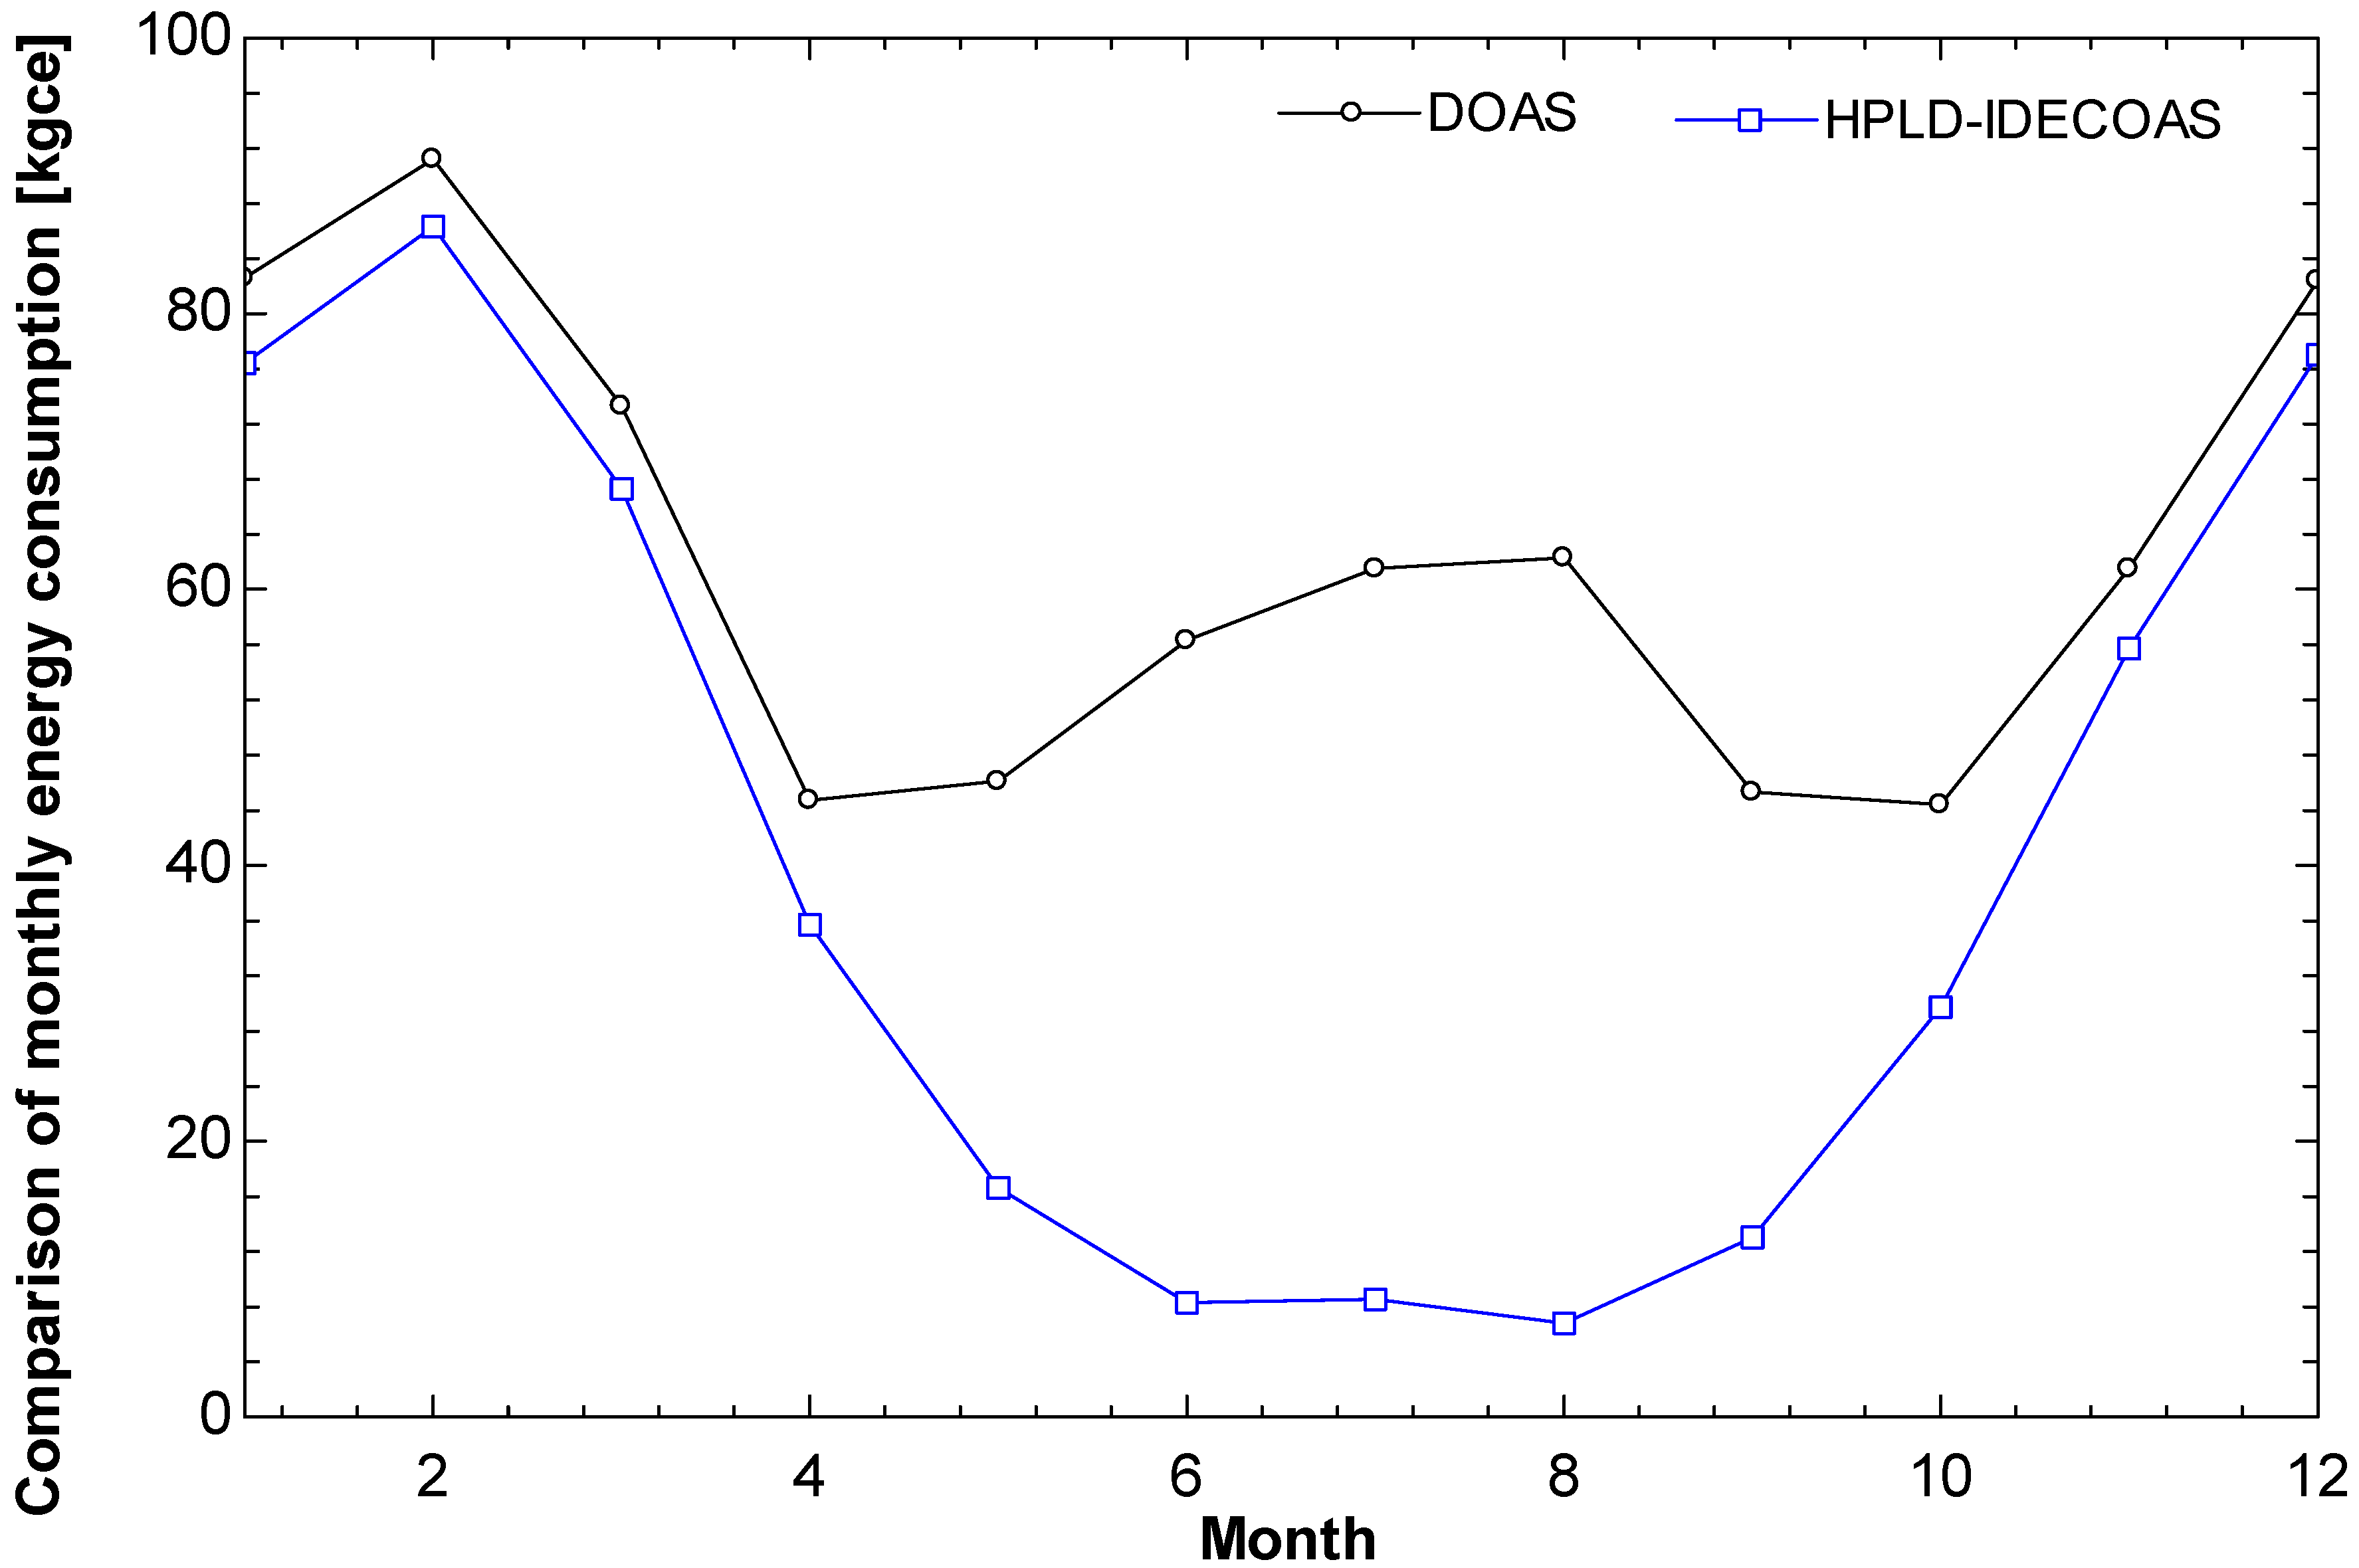
4.2. Comparison of Monthly Energy Consumption
- (1)
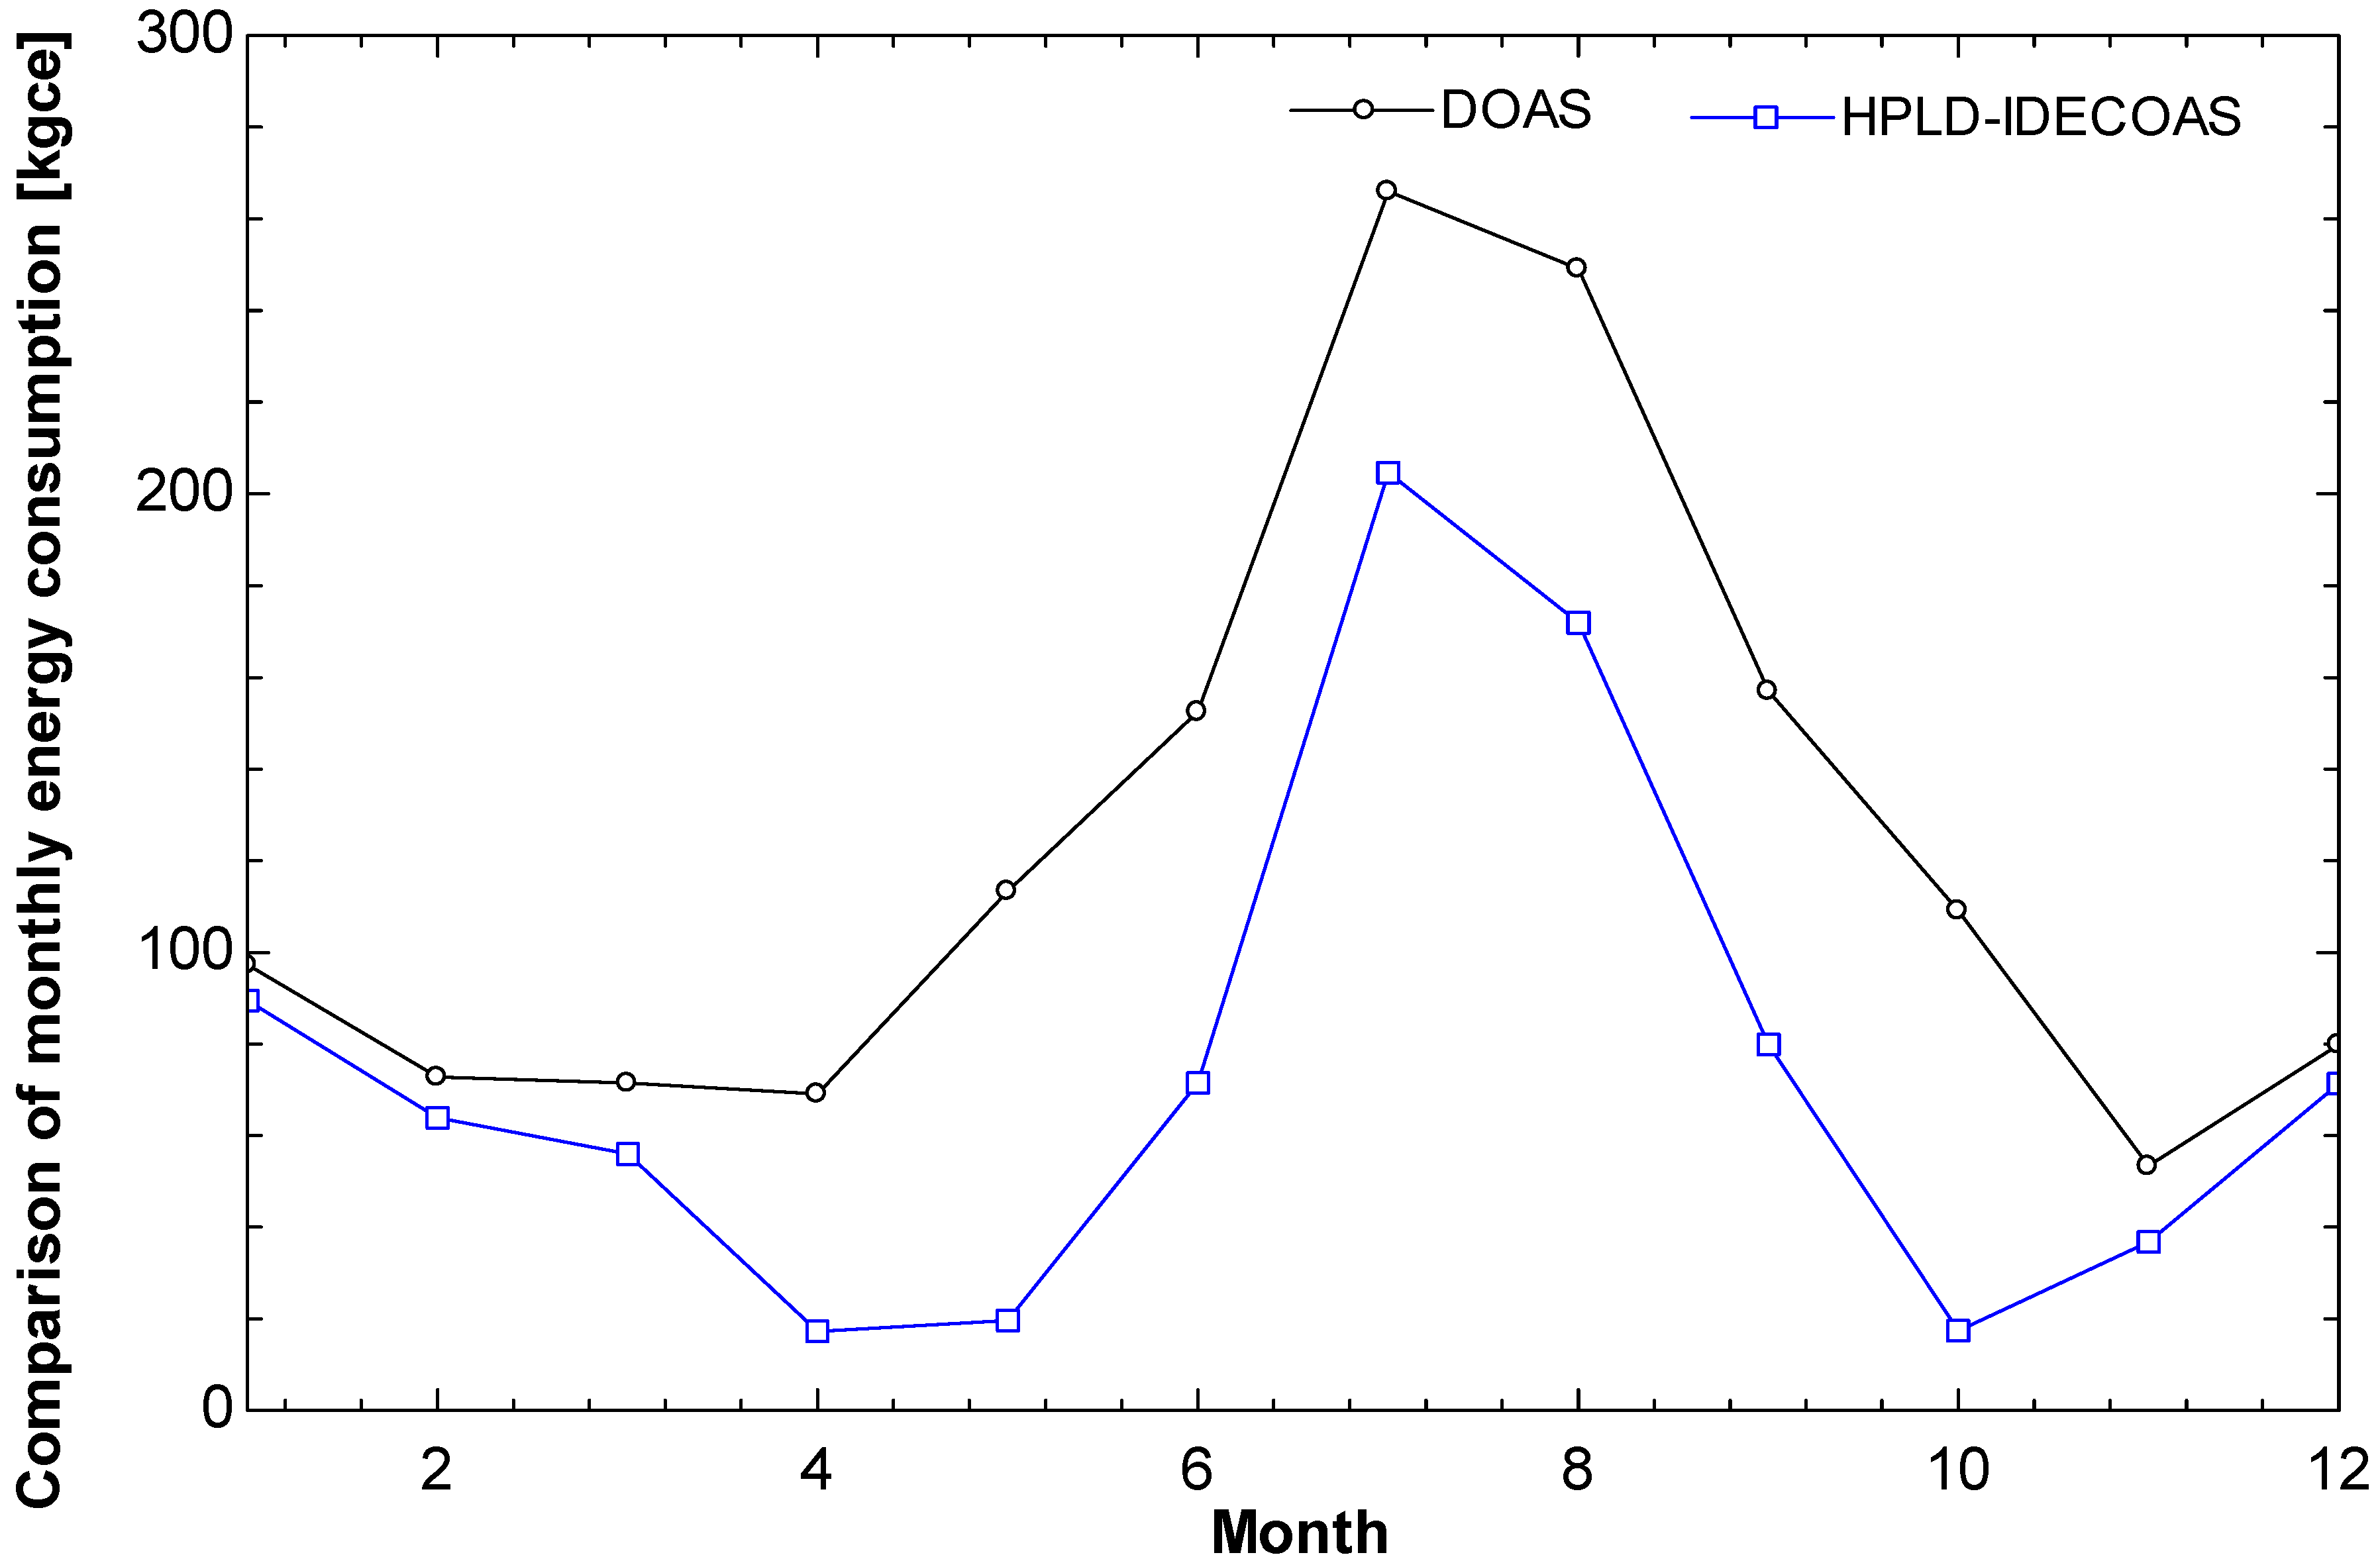
- In the cooling season and heating season, the energy consumption of the HPLD-IDECOAS running in each city is lower than that of the DOAS operating in the same environment every month.
- (2)
- In the heating season, except for Guangzhou and Kunming that are not cold in winter, there is no signification different in the monthly energy consumption between the two system.
- (3)
- It is concluded that in places with higher temperature and HR, in months of higher temperature and HR, the HPLD-IDECOAS has better energy-saving potential than the DOAS.
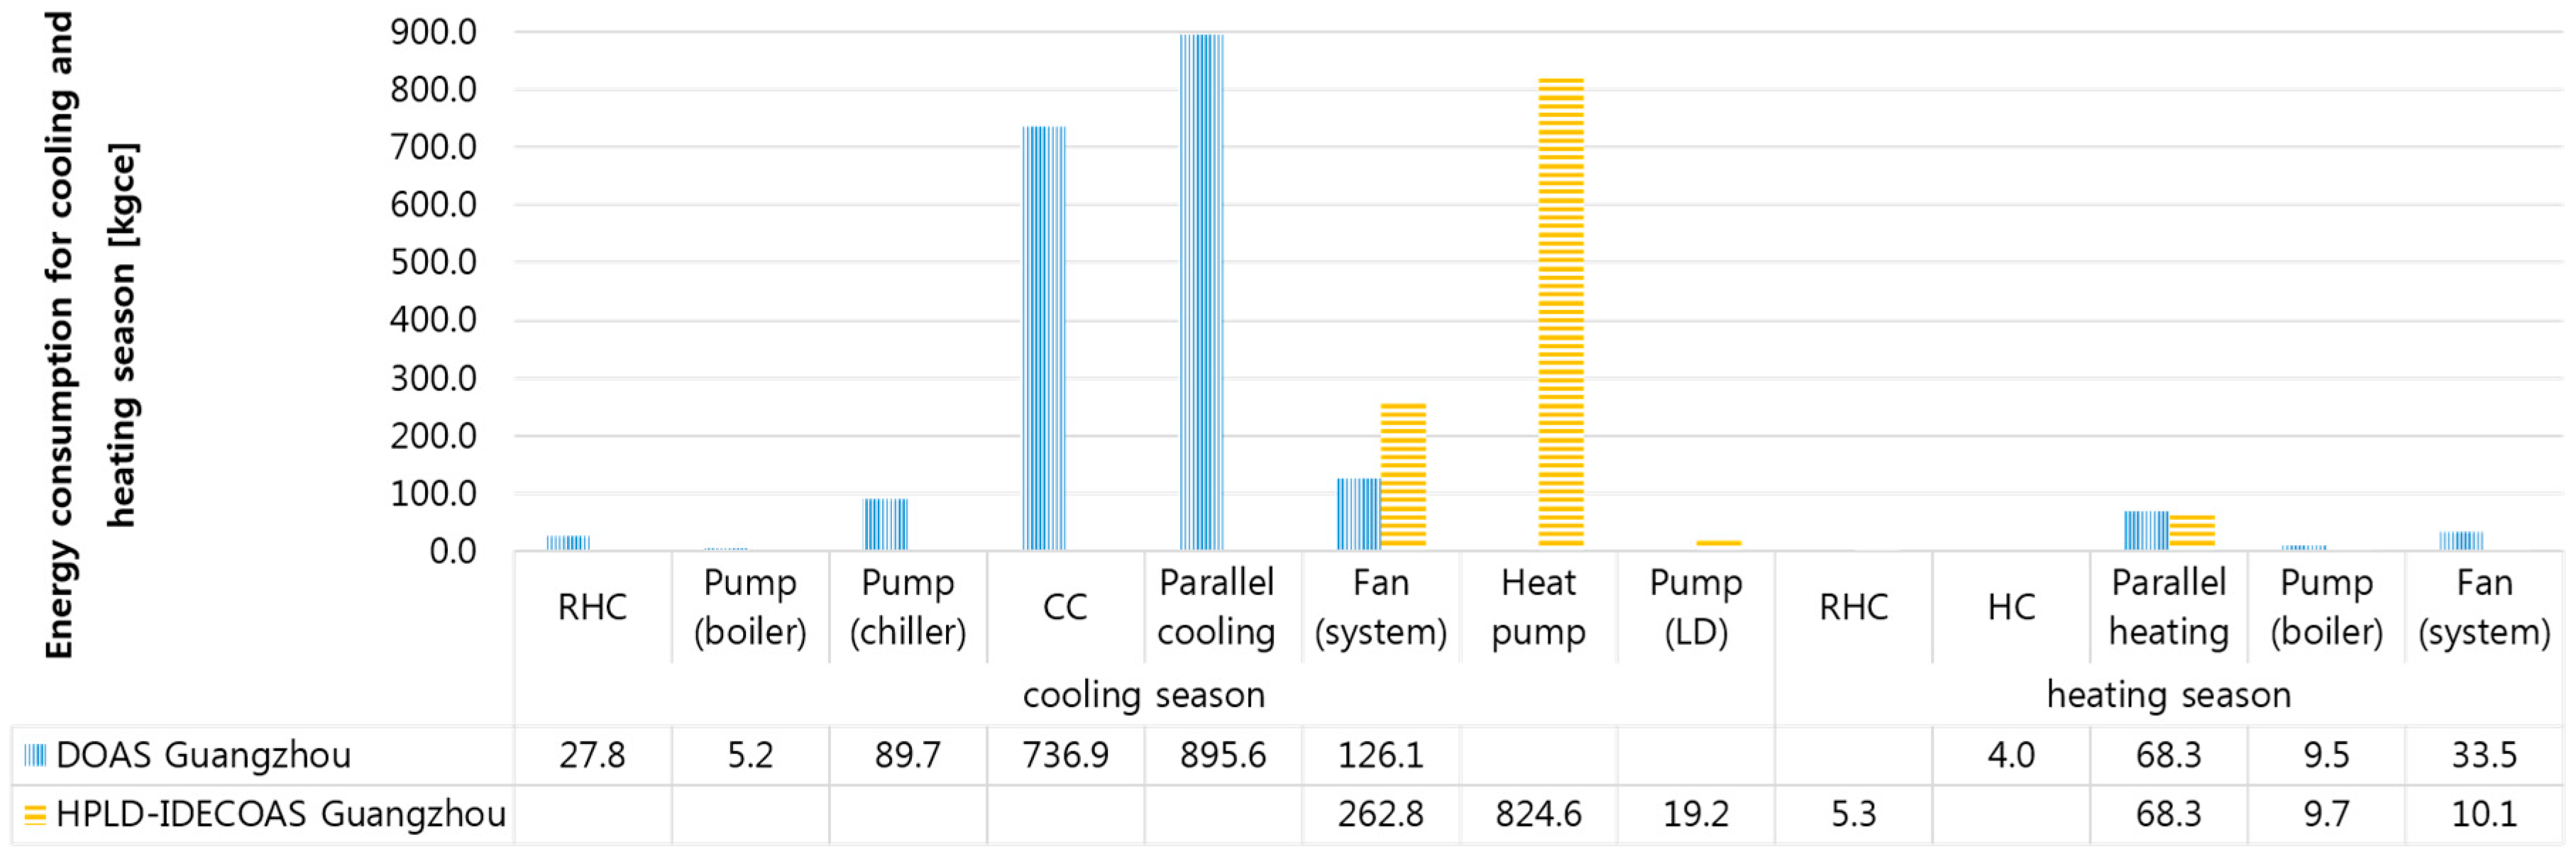
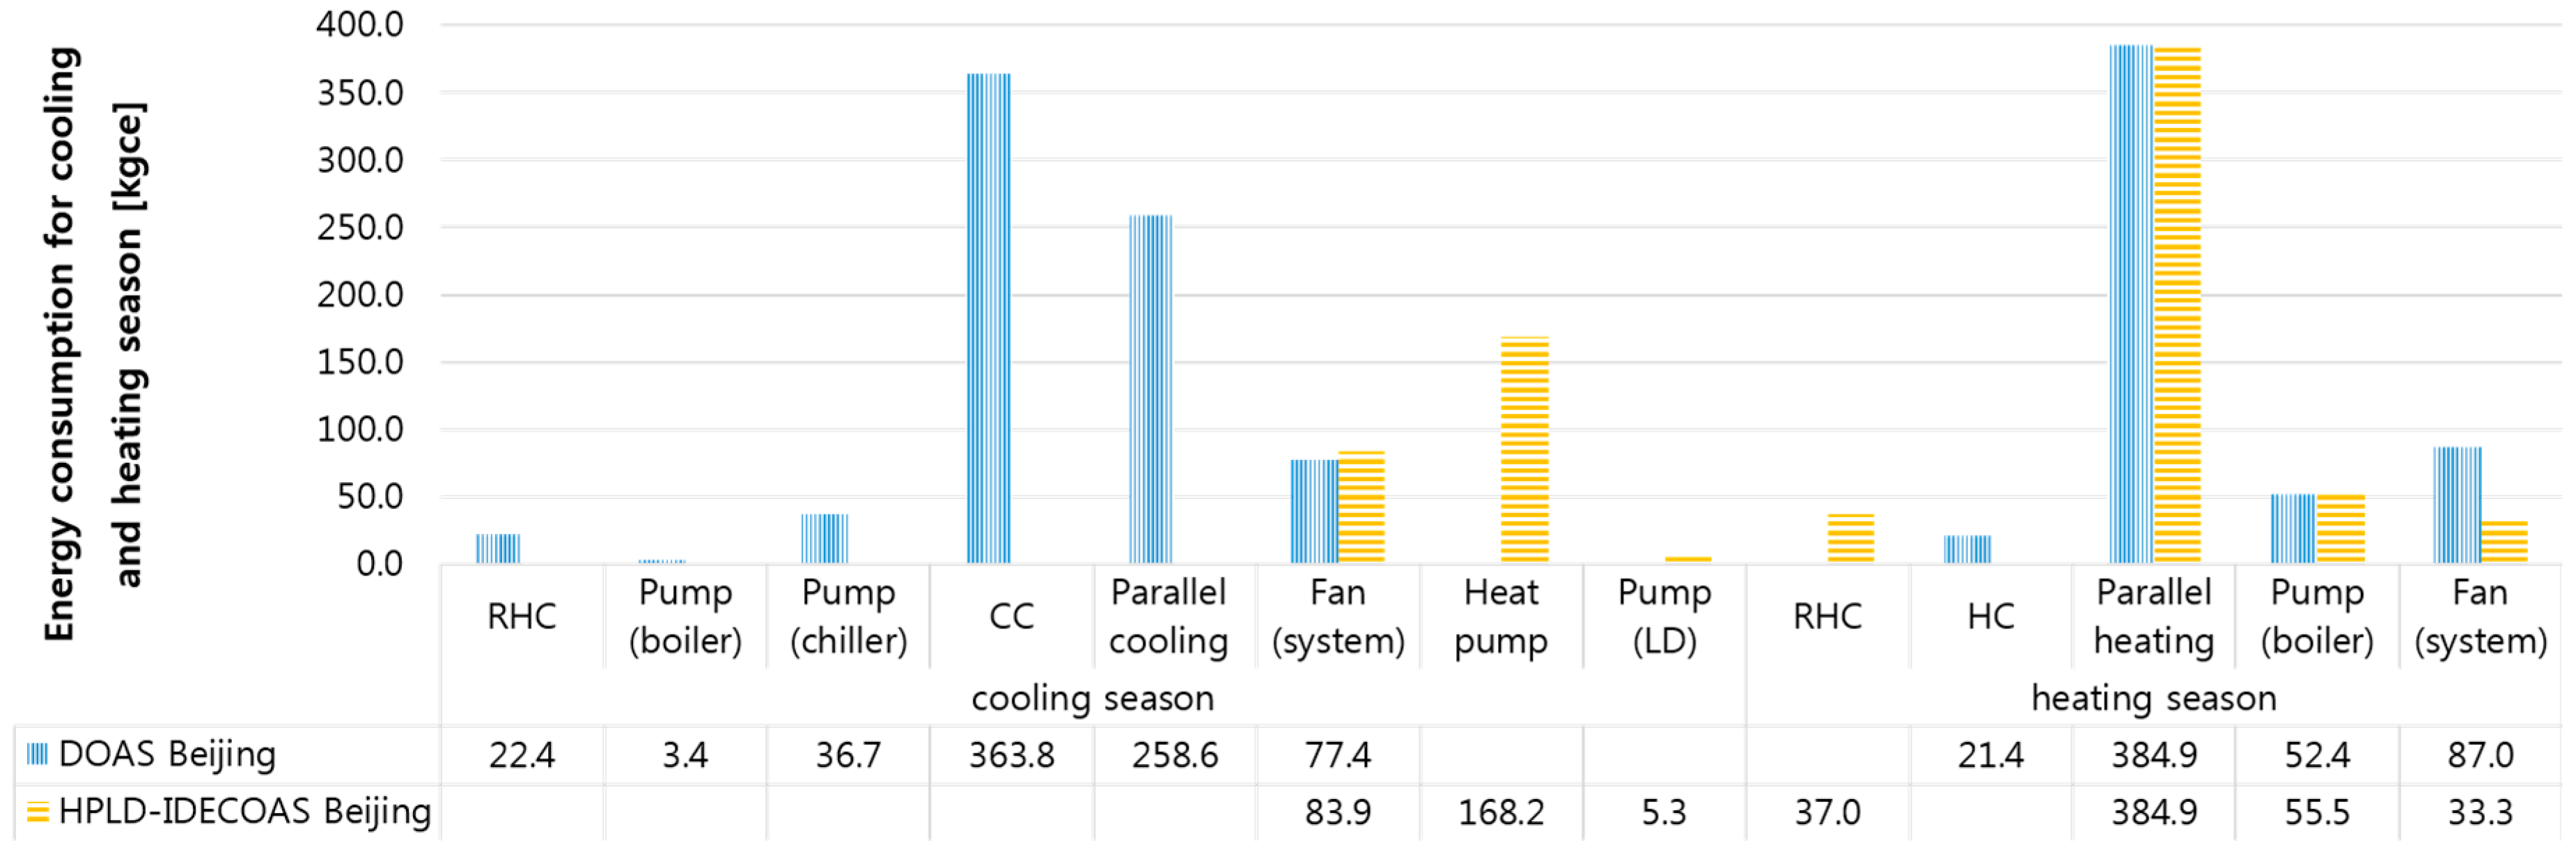
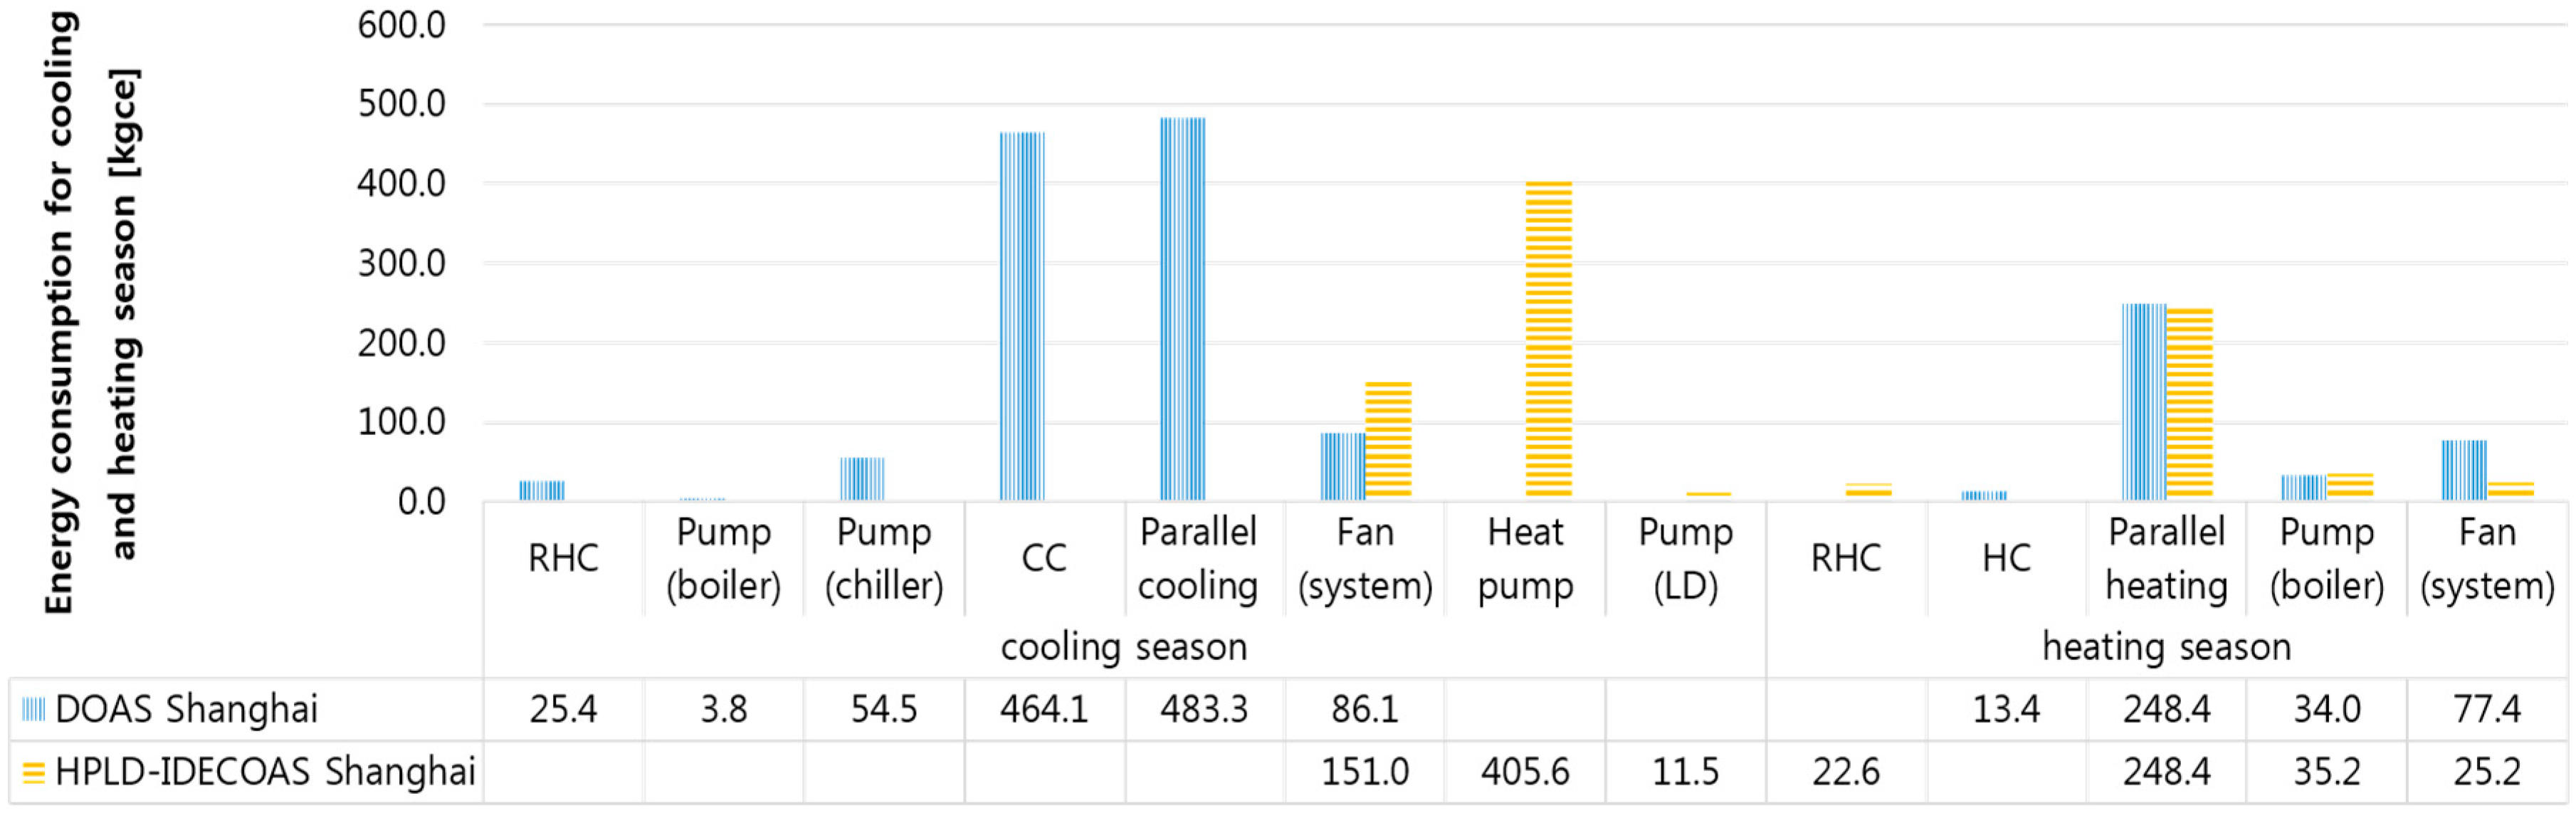
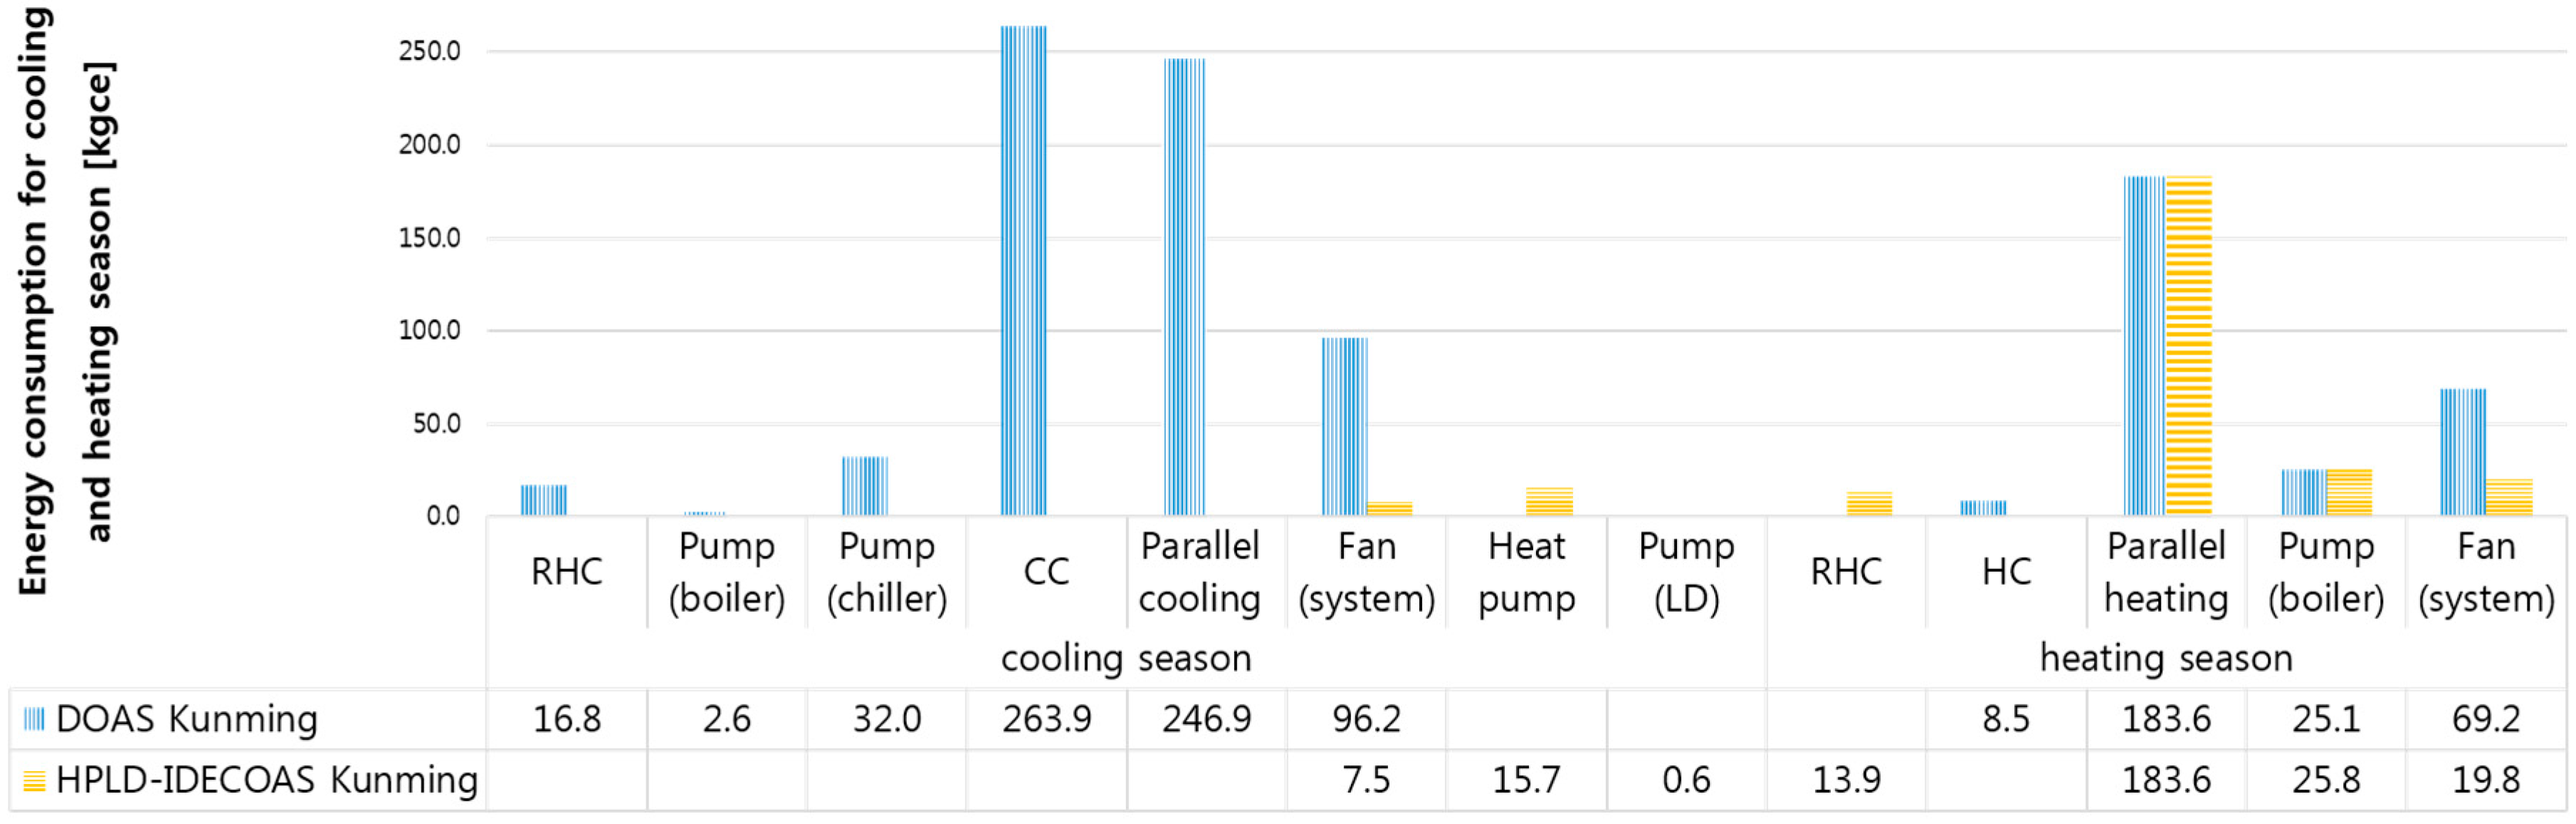
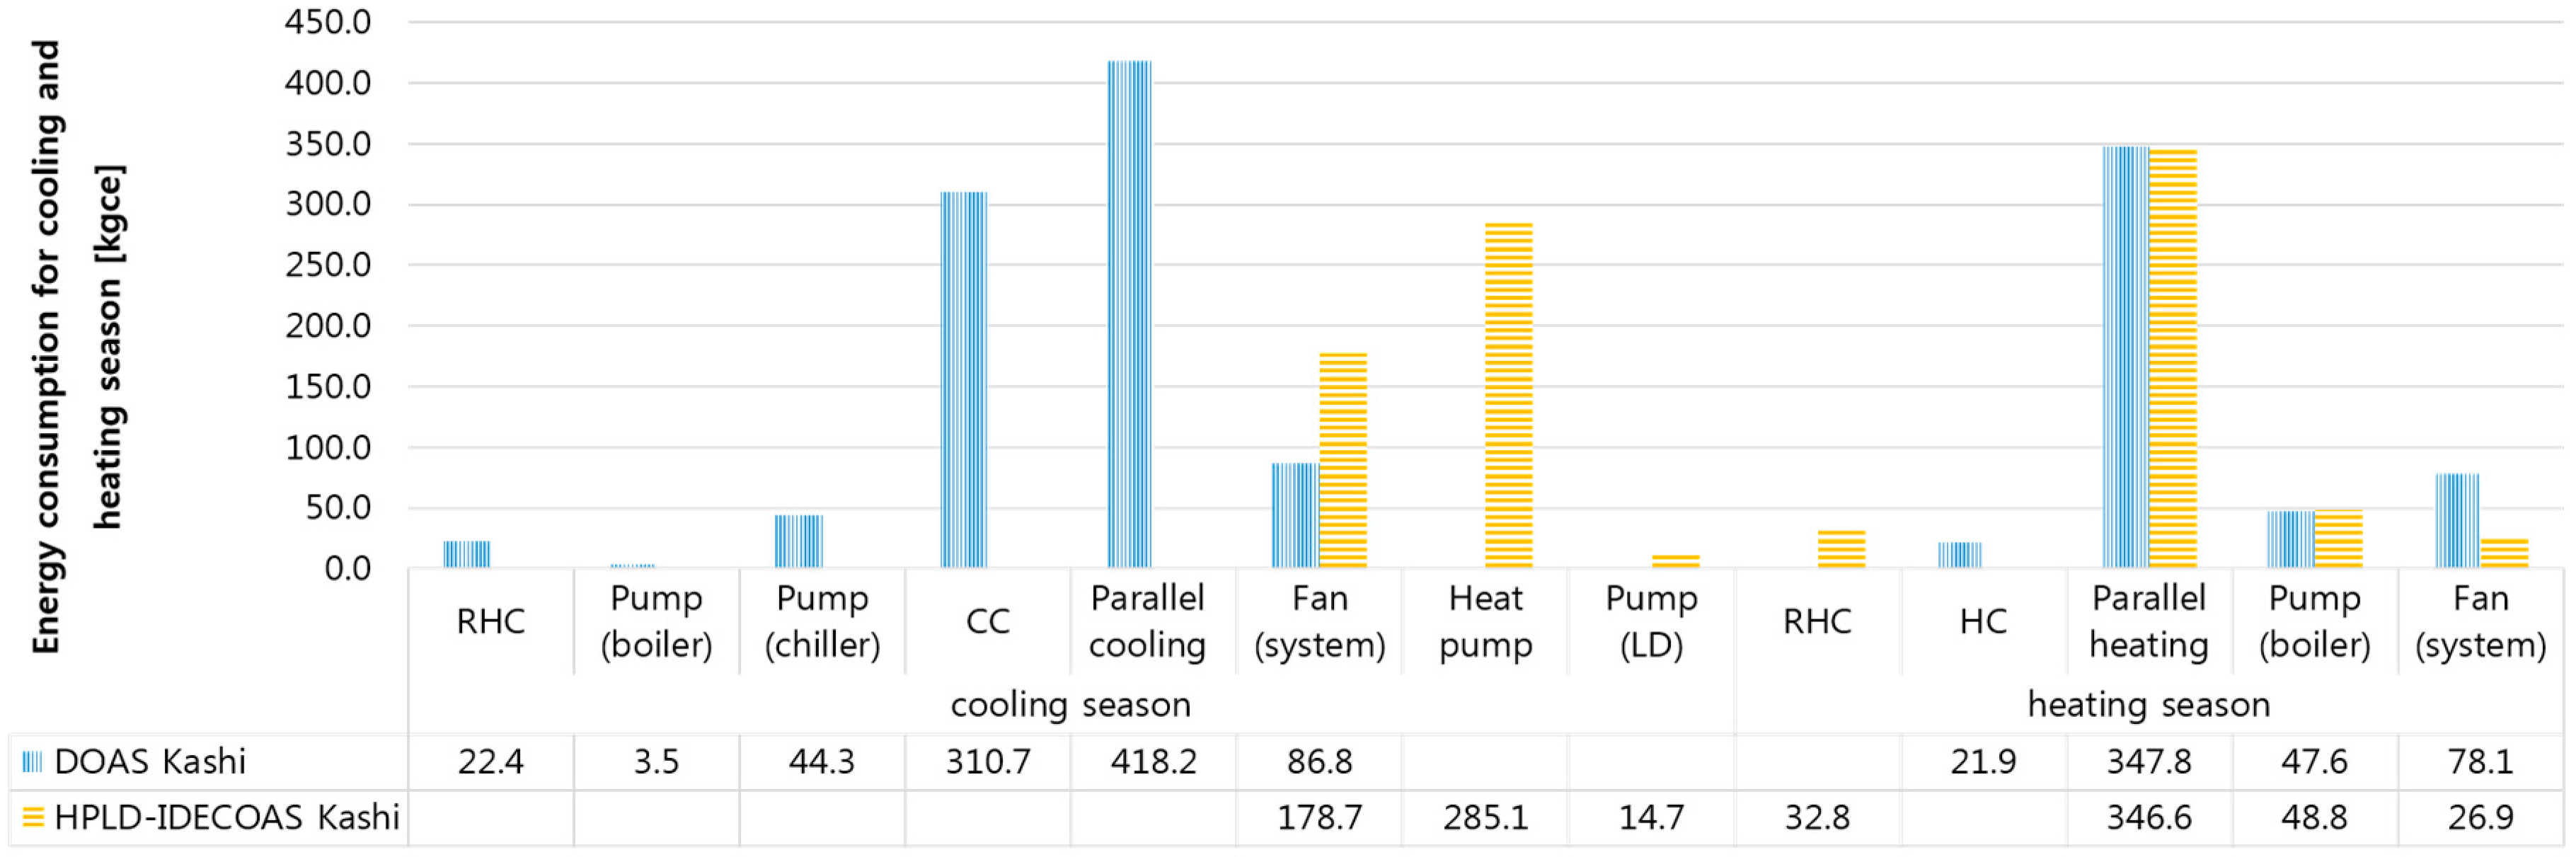
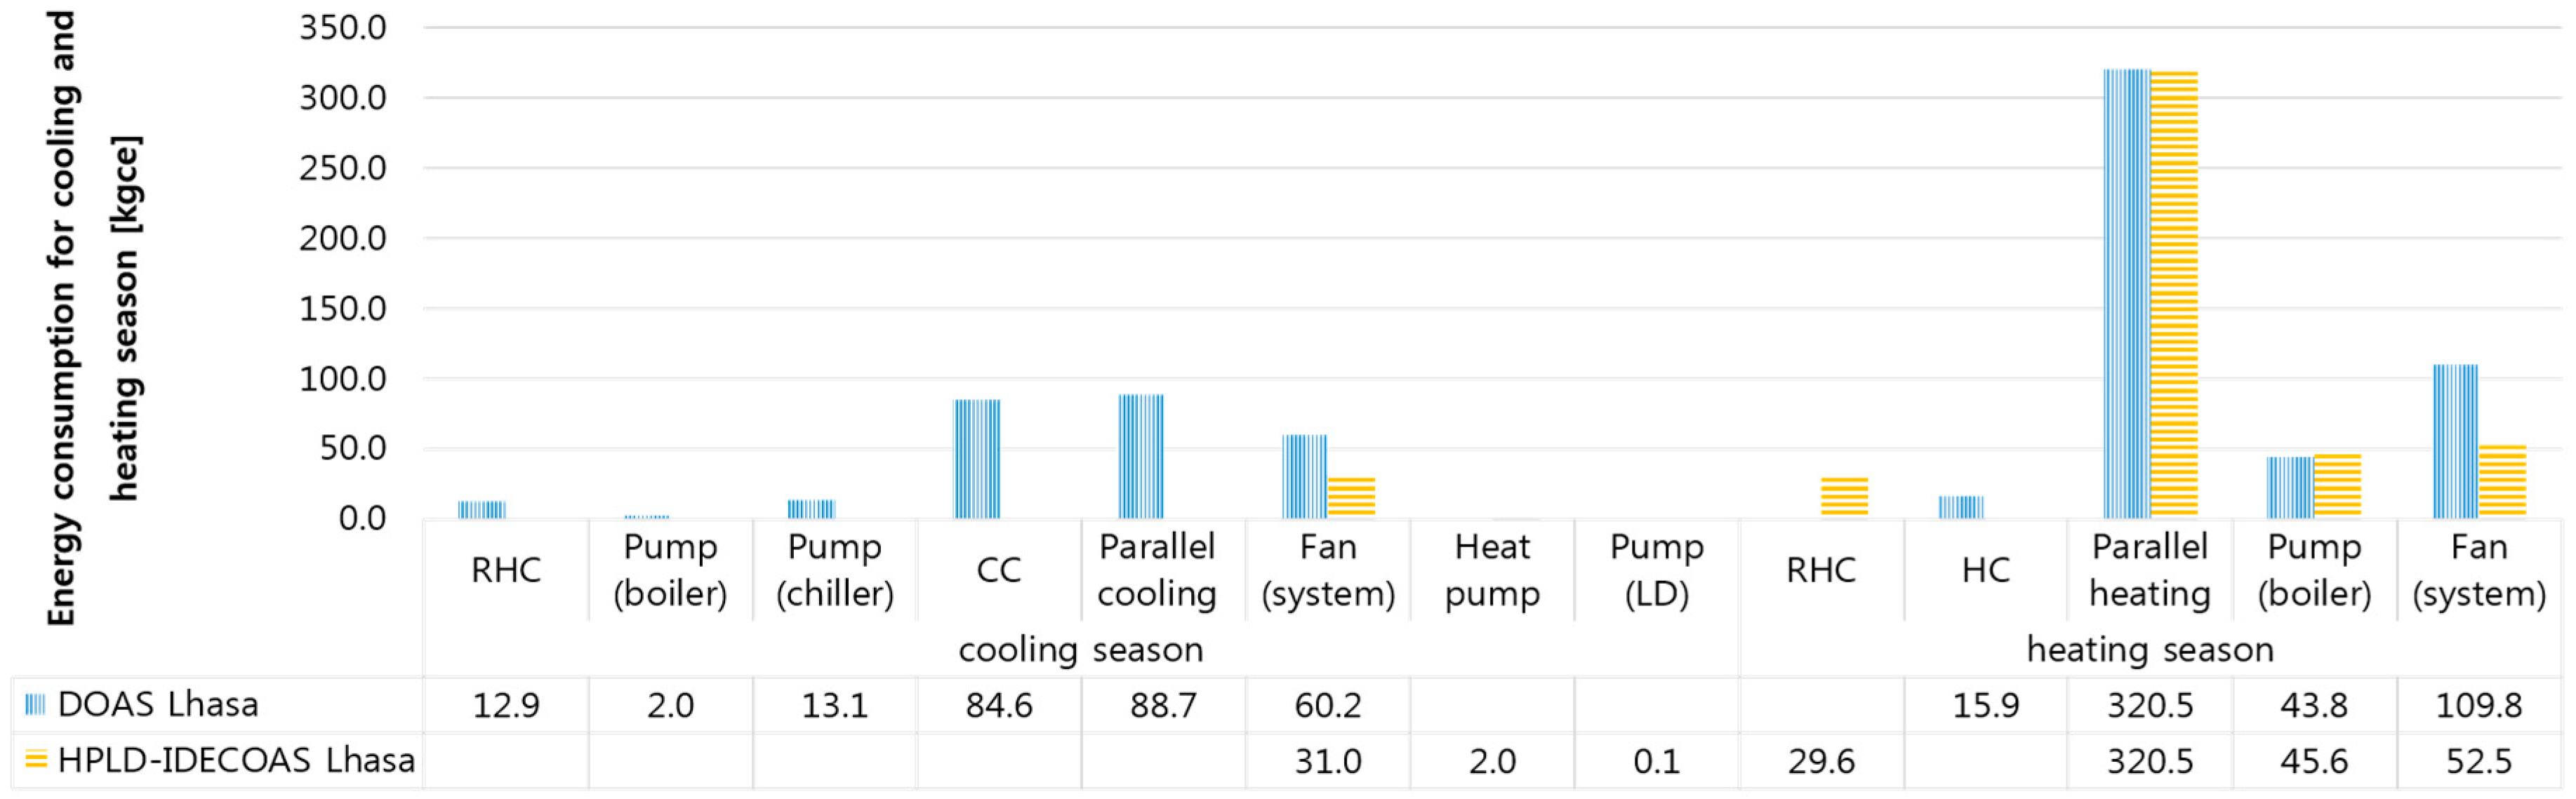
4.3. Comparison of Seasonal Energy Consumption (Cooling Season and Heating Season)
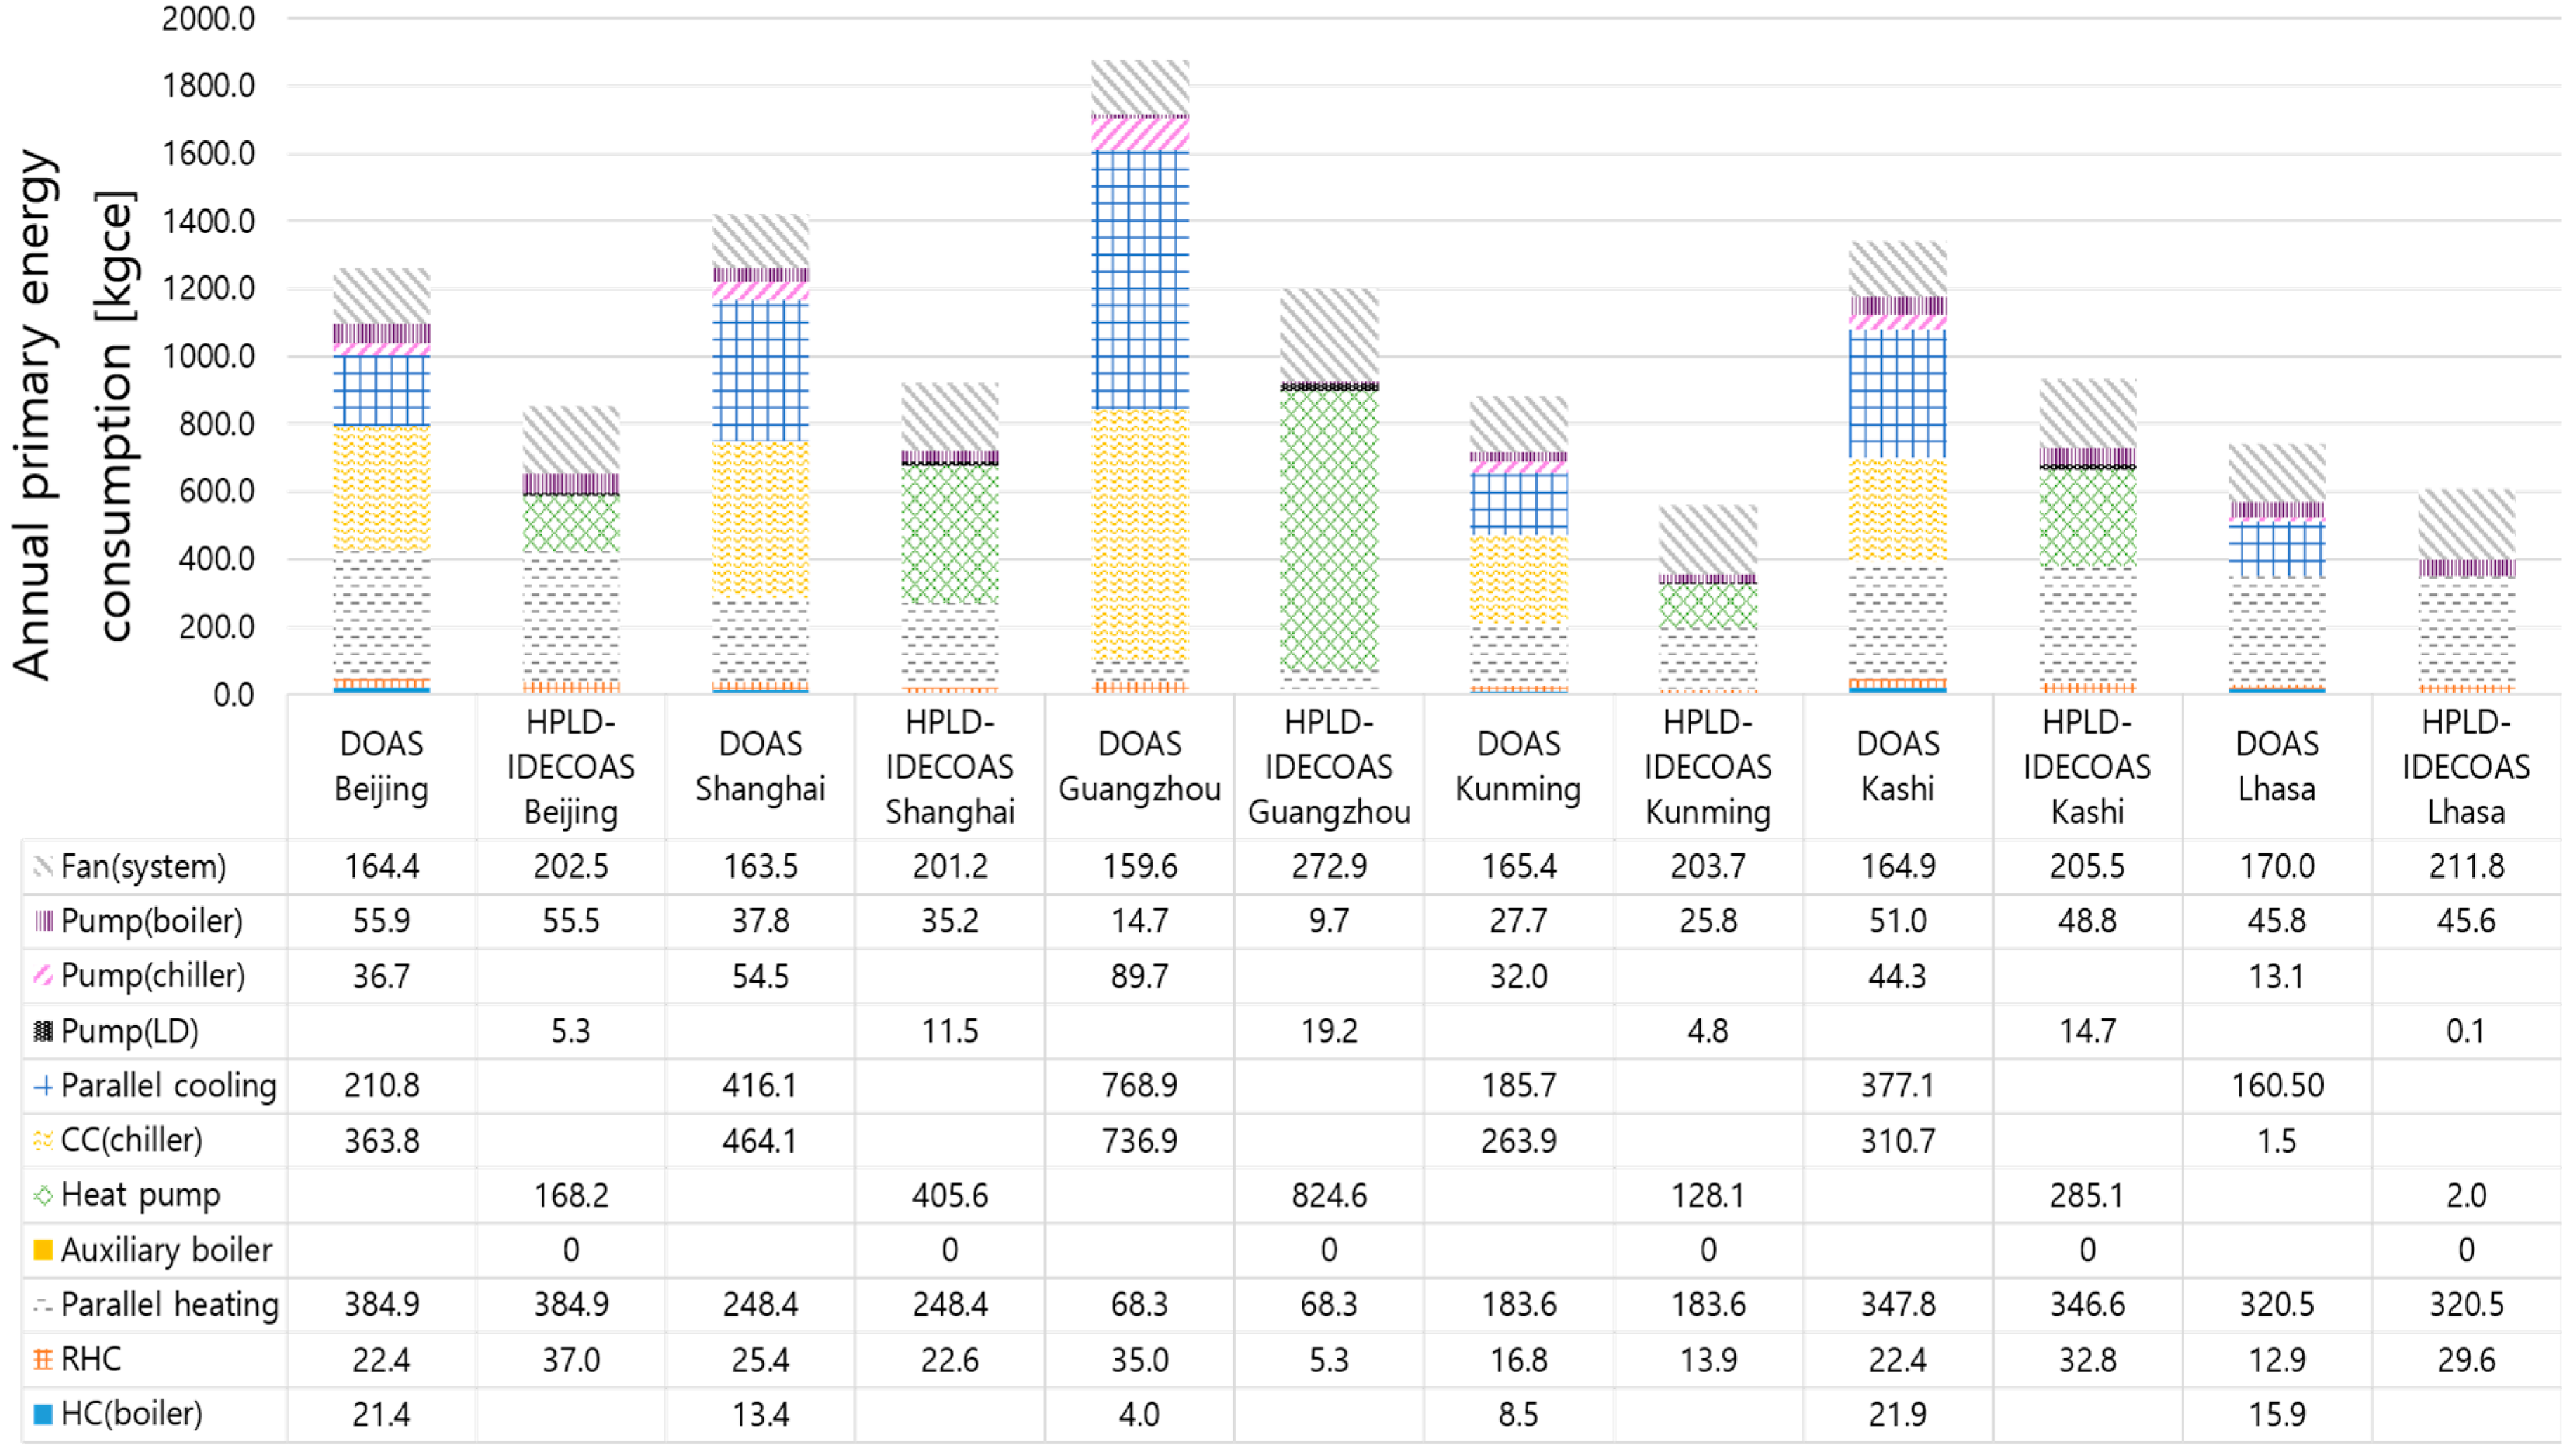
4.4. Comparison of Annual Energy Consumption
4.5. Discussion
5. Conclusions
- The higher the humidity, the higher the energy-saving potential of the HPLD-IDECOAS compared to that of the DOAS. According to the humidity change chart (Figure 9) of the peak day, in Guangzhou as the wettest city, the annual energy-saving potential between the selected systems is 36%. As the second wettest city, Shanghai has an annual energy-saving potential of 35%, and as the relatively cold and dry cities in the six cities, Beijing, Kashi, and Lhasa, the annual energy-saving potential is 32%, 30%, and 18%.
- The HPLD-IDECOAS has more energy-saving potential in the selected cities than the DOAS, because of the use of an HP instead of a chiller. Compared with the DOAS, the city that uses the HPLD-IDECOAS, which has the most annual energy-saving potential, saving 37% of energy, is Kunming, due to the use of the IEC and the DEC.
- In dry regions with high altitudes, the difference in annual energy consumption between the two systems is small at 18%, such as the performance of the two systems in Lhasa.
- Compared to the DOAS, the HPLD-IDECOAS has higher energy-saving potential in warmer regions, which is shown from the comparison of the energy-saving potential of the two systems in wet regions (36% in Guangzhou, 37% in Kunming, and 35% in Shanghai) and relatively dry regions (32% in Beijing, 30% in Kashi, and 18% in Lhasa).
Author Contributions
Funding
Conflicts of Interest
Abbreviations
| DOAS | Dedicated outdoor air system |
| HPLD-IDECOAS | Heat-pump-integrated liquid-desiccant and evaporative-cooling-assisted 100% outdoor air system |
| HPLD | Heat-pump-integrated liquid-desiccant system |
| IDECOAS | Indirect and direct evaporative-cooler-assisted 100% outdoor air system |
| LD | Liquid desiccant |
| LD-IDECOAS | Liquid-desiccant and indirect and direct evaporative-cooler-assisted 100% outdoor air system |
| EES | Engineering equation solver |
| HVAC | Heating ventilation and air conditioning |
| VAV | Variable air volume |
| RA | Return air |
| SA | Supply air |
| OA | Outdoor air |
| EA | Exhausted air |
| DEC | Direct evaporative cooler |
| IEC | Indirect evaporative cooler |
| WBT | Wet-bulb temperature (°C) |
| HC | Heating coil |
| CC | Cooling coil |
| RHC | Reheat coil |
| SHE | Sensible heat exchanger |
| HR | Humidity ratio |
| EW | Enthalpy wheel |
| DBT | Dry-bulb temperature (°C) |
| RH | Relative humidity (%) |
| DFR | Driving force ratio |
| SE | Sensible efficiency |
| LE | Latent efficiency |
Nomenclature
| a | Surface area-to-volume ratio of the packing (m2/m3) |
| Z | Packing height (m) |
| T | Temperature (°C) |
| Indoor air temperature (°C) | |
| Vapor pressure of desiccant solution (kPa) | |
| C | Solution concentration (-) |
| Specific heat capacity (kJ/kg⋅K) | |
| Water-vapor partial pressure (Pa) | |
| Q | Load (kW) |
| Heat of water vaporization (=2257 kJ/kg) | |
| Mass flow rate (kg/s) | |
| Minimum | |
| Function of the part-load ratio | |
| Compressor frequency | |
| Volumetric flow rate (m3/s) | |
| W | Effective mechanical power (W/m2) |
Greek Symbols
| Effectiveness (-) | |
| ω | Humidity ratio (kg/kga) |
| π | Function of the vapor-pressure depression of the desiccant solution to the vapor pressure of pure water ((pa − ps)/pa) |
Subscripts
| air | Air |
| out | Outlet |
| in | Inlet |
| sol | Desiccant solution |
| sen | Space sensible |
| lat | Space latent |
| eq | Equilibrium |
| reg | Regenerator |
| pri | Primary side |
| sec | Secondary side |
| deh | Dehumidification |
| Spd | Speed |
References
- China Association of Building Energy Efficiency. The Overall Situation of China’s Building Energy Consumption. 2019, pp. 26–31. Available online: https://berc.bestchina.org/Files/CBEU2018.pdf (accessed on 5 March 2019).
- Kim, M.H.; Park, J.S.; Jeong, J.W. Application of desiccant systems for improving the performance of an evaporative cooling-assisted 100% outdoor air system in hot and humid climates. Energy 2013, 59, 726–736. [Google Scholar] [CrossRef]
- Kim, M.; Park, J.; Sung, M.; Choi, A.; Jeong, J. Annual operating energy savings of liquid desiccant and evaporative-cooling-assisted 100% outdoor air system. Energy Build. 2014, 76, 538–550. [Google Scholar] [CrossRef]
- Kim, M.H.; Park, J.Y.; Park, J.S.; Jeong, J.W. Application of desiccant systems for improving the performance of an evaporative cooling-assisted 100% outdoor air system in hot and humid climates. J. Build. Perform. Simul. 2015, 8, 173–190. [Google Scholar] [CrossRef]
- Li, S.; Jeong, J.W. Energy performance of liquid desiccant and evaporative cooling-assisted 100% outdoor air systems under various climatic conditions. Energies 2018, 11, 1377. [Google Scholar] [CrossRef]
- Mumma, S.A. Dedicated OA Systems. ASHRAE Trans. 2001, 104, 1232. [Google Scholar]
- Gommed, K.; Grossman, G. Experimental investigation of a liquid desiccant system for solar cooling and dehumidification. Sol. Energy 2007, 81, 131–138. [Google Scholar] [CrossRef]
- Jain, S.; Tripathi, S.; Das, R.S. Experimental performance of a liquid desiccant dehumidification system under tropical climates. Energy Convers. Manag. 2011, 52, 2461–2466. [Google Scholar] [CrossRef]
- Katejanekarn, T.; Chirarattananon, S.; Kumar, S. An experimental study of a solar-regenerated liquid desiccant ventilation pre-conditioning system. Sol. Energy 2009, 83, 920–933. [Google Scholar] [CrossRef]
- Alizadeh, S. Performance of a solar liquid desiccant air conditioner—An experimental and theoretical approach. Sol. Energy 2008, 82, 563–572. [Google Scholar] [CrossRef]
- Bergero, S.; Chiari, A. Performance analysis of a liquid desiccant and membrane contactor hybrid air-conditioning system. Energy Build. 2010, 42, 1976–1986. [Google Scholar] [CrossRef]
- Shin, J.H.; Park, J.Y.; Jo, M.S.; Jeong, J.W. Impact of heat pump-driven liquid desiccant dehumidification on the energy performance of an evaporative cooling-assisted air conditioning system. Energies 2018, 11, 345. [Google Scholar] [CrossRef]
- Jeong, J.W.; Mumma, S.A.; Bahnfleth, W.P. Energy conservation benefits of a dedicated outdoor air system with parallel sensible cooling by ceiling radiant panels. ASHRAE Trans. 2003, 109 Pt 2, 627–636. [Google Scholar]
- Stanke, D.A.; Danks, R.A.; Muller, C.O.; Hedrick, R.L.; Fisher, F.J.; Osborn, J.E.; Butler, D.S.; Gallo, F.M.; Rasmussen, R.D.; Alevantis, L.E.; et al. Ventilation for acceptable indoor air quality. ASHRAE Stand. 2010, 2007, 1–70. [Google Scholar]
- Kim, M.H.; Kim, J.K.; Lee, K.H.; Baek, N.C.; Park, D.Y.; Jeong, J.W. Performance investigation of an independent dedicated outdoor air system for energy-plus houses. Appl. Therm. Eng. 2019, 146, 306–317. [Google Scholar] [CrossRef]
- Cheon, S.-Y.; Lim, H.; Jeong, J.-W. Applicability of thermoelectric heat pump in a dedicated outdoor air system. Energy 2019, 173, 244–262. [Google Scholar] [CrossRef]
- Standards, C.N. Code for Design of Civil Buildings GB 50352-2005. Available online: www.gbstandards.org (accessed on 5 March 2019).
- Standards, C.N. Design Standard for Energy Efficiency of Public Buildings GB50189-2015. Available online: www.gbstandards.org (accessed on 5 March 2019).
- Pacific Northwest National Laboratory ANSI/ASHRAE/IES Standard 90.1-2010 Performance Rating Method Reference Manual. Pnnl-255130 2016. Available online: https://www.pnnl.gov/main/publications/external/technical_reports/PNNL-25130.pdf (accessed on 5 March 2019).
- Standards, C.N. Thermal Environmental Conditions for Human Occupancy GB/T5701-2008. Available online: www.gbstandards.org (accessed on 5 March 2019).
- Standards, C.N. Code for Design of Heating, Ventilation and Air Conditioning for Civil Buildings GB50736-2012. Available online: www.gbstandards.org (accessed on 5 March 2019).
- Katejanekarn, T.; Kumar, S. Performance of a solar-regenerated liquid desiccant ventilation pre-conditioning system. Energy Build. 2008, 40, 1252–1267. [Google Scholar] [CrossRef]
- Chung, T.W.; Luo, C.M. Vapor pressures of the aqueous desiccants. J. Chem. Eng. Data 1999, 44, 1024–1027. [Google Scholar] [CrossRef]
- Goswami, D.Y.; Fumo, N. Study of an aqueous lithium chloride desiccant system: Air dehumidification and desiccant regeneration. Sol. Energy 2002, 72, 351–361. [Google Scholar]
- Jin, H.; Spitler, J.D. A parameter estimation based model of water-to-water heat pumps for use in energy calculation programs. ASHRAE Trans. 2002, 108 Pt 1, 3–17. [Google Scholar]
- Madani, H.; Claesson, J.; Ahmadi, N.; Lundqvist, P. Experimental Analysis of a Variable Capacity Heat Pump System Focusing on the Compressor and Inverter Loss Behavior. In Proceedings of the International Refrigeration and Air Conditioning Conference, West Lafayette, IN, USA, 12–15 July 2010. [Google Scholar]
- Mumma, S.A.; Shank, K.M. Achieving dry outside air in an energy-efficient manner. ASHRAE Trans. 2001, 107, 553–561. [Google Scholar]
- Mumma, S.A. Dedicated outdoor air-dual wheel system control requirements. ASHRAE Trans. 2001, 107, 147–155. [Google Scholar]
- Standards, C.N. General Principles for Caculation of Total Production Energy Consumption Gb/T 2589-2008. Available online: www.gbstandards.org (accessed on 5 March 2019).


| Weather Data | Type15-2 weather data (TRNSYS18) | |||||||
| Building Type | Office building (400 m2) (20 m × 20 m) | |||||||
| Schedules | Office occupants and HVAC schedules in ASHRAE90.1 | |||||||
| Room Set Point | Cooling season | Temperature 26 °C Relative humidity 50% | ||||||
| Heating season | Temperature 20 °C Relative humidity 50% | |||||||
| Supply Air Set Point | Cooling season | Temperature 15 °C | ||||||
| Heating season | Temperature 20 °C | |||||||
| Internal Heat Gain | Number of occupants | 20 occupants (100 m2/occupant) | ||||||
| Computer | 20 kJ/h (TRNSYS18) | |||||||
| Lighting | 17 W/m2 (TRNSYS18) | |||||||
| City | Beijing | Lhasa | Kashi | Shanghai | Guangzhou | Kunming | ||
| Atmospheric Pressure (kPa) | 99.4 | 66.9 | 86.5 | 99.9 | 99.9 | 81.1 | ||
| U-Values (W/m2‧K) | Roof | 0.4 | 0.4 | 0.4 | 0.4 | 0.5 | 0.5 | |
| Exterior Wall | 0.45 | 0.45 | 0.45 | 0.6 | 0.8 | 0.8 | ||
| Window | 2.8 | 2.8 | 2.8 | 3.5 | 5.2 | 5.2 | ||
| Window-to-Wall Ratio | 0.2 | |||||||
| Group 0 | Group 1 | Group 2 |
|---|---|---|
| 4.582 | −0.159 | 0.007 |
| −18.382 | 0.567 | −0.019 |
| 21.312 | −0.666 | 0.013 |
| Reference Values | |||||
| (m3/s) | 5.678 × 10⁻⁴ | ||||
| (m3/s) | 5.678 × 10⁻⁴ | ||||
| (nominal capacity) (W) | 14,215.35 | ||||
| (K) | 283.00 | ||||
| Model Coefficients | |||||
| A1 | A2 | A3 | A4 | A5 | |
| −2.8581 × 100 | 4.3425 × 100 | −9.6592 × 10⁻¹ | 1.0978 × 10⁻¹ | 4.6779 × 10⁻² | |
| LE | C1 | C2 | C3 | C4 |
| <50% | 2.344 | −3.714 | 1.444 | −0.005421 |
| ≥50% | −21.28 | 4.652 | 28.5 | 0.6905 |
| C5 | C6 | C7 | C8 | C9 |
| 0.002286 | 0.05852 | −0.0431 | −0.001676 | 0.0006397 |
| −0.00218 | −0.4167 | −0.8788 | 0.004481 | 0.006532 |
© 2019 by the authors. Licensee MDPI, Basel, Switzerland. This article is an open access article distributed under the terms and conditions of the Creative Commons Attribution (CC BY) license (http://creativecommons.org/licenses/by/4.0/).
Share and Cite
Liu, S.; No, S.-T.; Jeong, J.-W. Energy Performance Comparison between Liquid-Desiccant-Assisted Air Conditioning System and Dedicated Outdoor Air System in Different Climatic Regions. Energies 2019, 12, 1798. https://doi.org/10.3390/en12091798
Liu S, No S-T, Jeong J-W. Energy Performance Comparison between Liquid-Desiccant-Assisted Air Conditioning System and Dedicated Outdoor Air System in Different Climatic Regions. Energies. 2019; 12(9):1798. https://doi.org/10.3390/en12091798
Chicago/Turabian StyleLiu, Su, Sang-Tae No, and Jae-Weon Jeong. 2019. "Energy Performance Comparison between Liquid-Desiccant-Assisted Air Conditioning System and Dedicated Outdoor Air System in Different Climatic Regions" Energies 12, no. 9: 1798. https://doi.org/10.3390/en12091798
APA StyleLiu, S., No, S.-T., & Jeong, J.-W. (2019). Energy Performance Comparison between Liquid-Desiccant-Assisted Air Conditioning System and Dedicated Outdoor Air System in Different Climatic Regions. Energies, 12(9), 1798. https://doi.org/10.3390/en12091798