1. Introduction
As wireless communication technology is entering its 5th generation (5G) [
1,
2], there has been an increase in the number of Internet of Things (IoT) applications. With this increase in IoT applications, the number of physical devices is also continuously growing [
3]. To enable these IoT applications, there have been a lot of studies mainly covering two aspects of communication technologies and networking technologies. Some known examples of communication technologies for IoT applications include Bluetooth, Bluetooth Low Energy (BLE), ZigBee, and radio-frequency identifiers (RFIDs). On the other hand, some examples for networking technologies include IPv6 over Low Power Wireless Personal Area Network (6LowPAN), low power and lossy networks (RPL), and others [
4,
5]. As the above-mentioned technologies have their own protocols and distinct features, their use is based on the type of application.
BLE, commercially known as Bluetooth Smart, is an evolving low-power wireless technology for short-range communication. It has been developed by Special Interest Group (SIG). BLE operates on the Industrial Scientific Medical (ISM) band of
[
6]. A newer version of BLE [
7] aims to make it even better for IoT because it provides low power internet connectivity. This is achieved through the use of IPv6/6LoWPAN. BLE is well suited for systems running on small batteries, as the key feature of this technology is lower power consumption [
8]. Hence the devices running on BLE can use a coin-cell as their power source and run for years. Its characteristics, like low power consumption and low cost, make it an ideal choice for power sensitive sensor devices. BLE can be incorporated in a wide range of applications such as sensor-enabled environmental and healthcare monitoring [
9,
10,
11,
12], smart home and automation [
13], indoor localization [
14,
15], tagging, and proximity-based services such as near-field communication (NFC) or RFID [
16], and others [
17].
In BLE applications, multiple BLE slave devices, known as advertisers, can connect to a master BLE devices, known as a scanner. The topology is usually a star topology piconet. To associate a slave device to a master device, a neighbor discovery process (NDP) is usually initiated. The NDP is defined in both BLE 4.2 and 5.1. The process of NDP is very simple, it sends advertisement packets over three advertisement channels periodically to its scanner for a certain BLE-enabled service. Because BLE uses an ISM band, it can be freely operated in crowded environments to establish a network [
18]. As the number of BLE devices to be connected to a specific network increases, the number of collisions will also increase. This, in turn, reduces the battery life and increases the time for discovery of individual advertisers [
19]. Due to this factor, the fast discovery of advertisers is a challenging problem in BLE.
The BLE specifications allow a wide range of parameters that can be adjusted according to the mode and scenario that it is deployed for. Amongst these parameters, there are also a few parameters which can be adjusted for the BLE NDP process [
8]. Utilizing this freedom granted in the BLE specifications, there have been many studies which have analyzed the discovery time performances using simulators [
20,
21], and analytical models [
18,
19,
22,
23,
24,
25]. In [
18,
22,
23,
24], the authors have presented an analytical model for the discovery time taken by a scanner to discover a targeted advertiser with a probability model. The authors of [
25], used power consumption models based on [
26] for the discovery process. The authors in [
25] analyzed the trade-off between discovery time and power consumption. A back-off strategy of BLE devices is proposed in [
19], it reduces the collision probability and enhances the discovery latency performance during the NDP stage. These studies usually only focus on the advertiser and have tried to reduce the power consumption and discovery time at the advertiser only. It is described in [
25], that the optimal setting of the BLE devices to minimize the discovery time is essential for the development and smooth operations of BLE-enabled IoT infrastructure.
Lowing the energy consumption of BLE-enabled IoT applications is also one of an important design requirement. With multiple operation modes available in BLE-enabled devices, the standard itself is very energy efficient. But due to certain network scenarios the energy efficiency sometimes goes down. The energy consumption parameters directly affect the lifetime of the BLE-enabled IoT devices. Hence, it is a very important topic to discuss when dealing with BLE. A power consumption model was proposed in [
26], which analyzed the energy consumption during the NDP phase. A performance model was proposed in [
25] which evaluated the trade-off between the BLE discovery time and energy consumption. The authors of [
27] proposed a study on the power consumption model of BLE NDP process based on different advertising parameters of BLE. A back off strategy for BLE devices based on the number of collision probability was analyzed in [
19] to enhance the BLE NDP performance.
In this paper, an algorithm is proposed in which BLE scan interval time and scan window times are adjusted for optimal discovery time of advertisers. The BLE specification allows some protocol data unit (PDUs) to send information. The advertiser can use this feature and send information to the scanner regarding its current parameters. Based on the information the scanner adjusts the scan interval and the scan window times so that the overall advertiser discovery time is reduced and hence energy is saved. The proposed algorithm is different from the existing work in the manner that it utilizes the freedom of setting the parameters range according to the current network situation. It also uses the option to send user data in PDU from advertiser to scanner. Using this option, the algorithm presented in this paper utilizes the runtime information exchanged between the advertiser and scanner, to adjust the scan interval and scan window time. The energy consumption of the proposed method is also analyzed. To the best of the authors’ knowledge, this work has not been done before.
The rest of the paper is organized as follows: the background and the NDP process in BLE are described in
Section 2. In
Section 3, the proposed solution is described. The simulation results are presented in
Section 4, while
Section 5 will conclude the paper.
3. Proposed Efficient BLE Advertiser Discovery Solution
In this section, the problem statement is formulated, and the proposed solution is explained. For this section, we will assume that there is one scanner and there are N advertisers. All of the N advertisers lie in the discovery range of the scanner. We also assume that only undirected advertising events from advertisers are sent. As mentioned in the previous section,
Section 2, there is no significant difference in advertising and scanner events in BLE NDP. For the proposed solution it is also assumed that there is fair contention for the discovery and each advertiser is independent of other.
3.1. Problem Statement
Discovering of the advertiser by a scanner and the initiator is of paramount importance in BLE communication. Before the setup of the connection, the initiator needs to discover the advertising device. Similarly, given the condition that there is no connection required, if two BLE devices want to communicate, it is only possible if the advertising device is discovered by the scanner in the appropriate time and the information is sent using the payload of advertising PDUs.
There are many devices that have BLE technology enabled for them and the number is increasing day by day. In a denser environment, this discovery can take more time. Especially if the devices are not familiar with each other, in other words, not previously discovered by each other. BLE devices do not only suffer due to more devices of BLE in nature but also other technologies can influence the time consumed to be discovered and connection setup time. This is because BLE shares the ISM band with many other technologies.
BLE has dealt with this issue by incorporating frequency hopping schemes on the channels. But unfortunately, this is only applicable to the data channels [
5]. This leaves the 3 advertising channels more prone to interference and contention. Carrier Sense Multiple Access (CSMA) is also not available in BLE.
In a dense environment, there can be a high probability of broadcasting conflicts. The performance of BLE deteriorates if the number of devices in the vicinity is increased. But what is of more concern is that if the parameters like the timing of PDUs are not set appropriately there is more probability of service degradation in terms of latency.
The scanning device may scan continuously, but this is highly discouraged as it consumes a lot of energy and cuts down the battery time of the host device. And even then, the scanning device is not familiar with the conditions or the settings at the advertising end. This can result in completely out of synchronization communication and inefficient discovery in terms of latency and energy.
When the number of devices increases then the issue becomes more severe and average discovery time increases with a great extent [
29]. Considering a scenario where there are numerous BLE devices waiting to be discovered, there is no way they can be efficiently discovered unless the network conditions are considered and then worked upon. Considering applications like iBeacon, where the communication actions occur only through advertising channels and packets, the traffic on advertising channels becomes dense.
Considering all these issues, this paper proposes an algorithm as a solution. The main task of the algorithm is to dynamically adjust the window size of the scanner so that the advertiser discovery time is reduced thus increasing the efficiency of BLE network.
3.2. Proposed Solution
An algorithm is proposed to make the scanner or initiator aware of the conditions of the network by sending very small information to them. By exploiting this information, parameters like scan window size and scan interval are adjusted accordingly. The information is sent by encapsulating it into the advertising PDUs. There are four available PDUs, namely , , and .
Some of the PDUs have the capability of sending data even without connection establishment. Only PDU type cannot contain data in it. On the other hand, the rest of the three PDUs can encapsulate data in their packets. PDU does not allow the advertiser to scan the advertising channels after the PDU is sent. If the advertising PDU type is a non-connectable undirected event, then it would not receive and . It only sends advertising PDUs continuously on the advertising channel indices.
This leaves us with two advertising PDUs in which data can be encapsulated and a response can be received. We use and PDU types to accommodate a variable from each advertiser and deliver it to scanner and initiator.
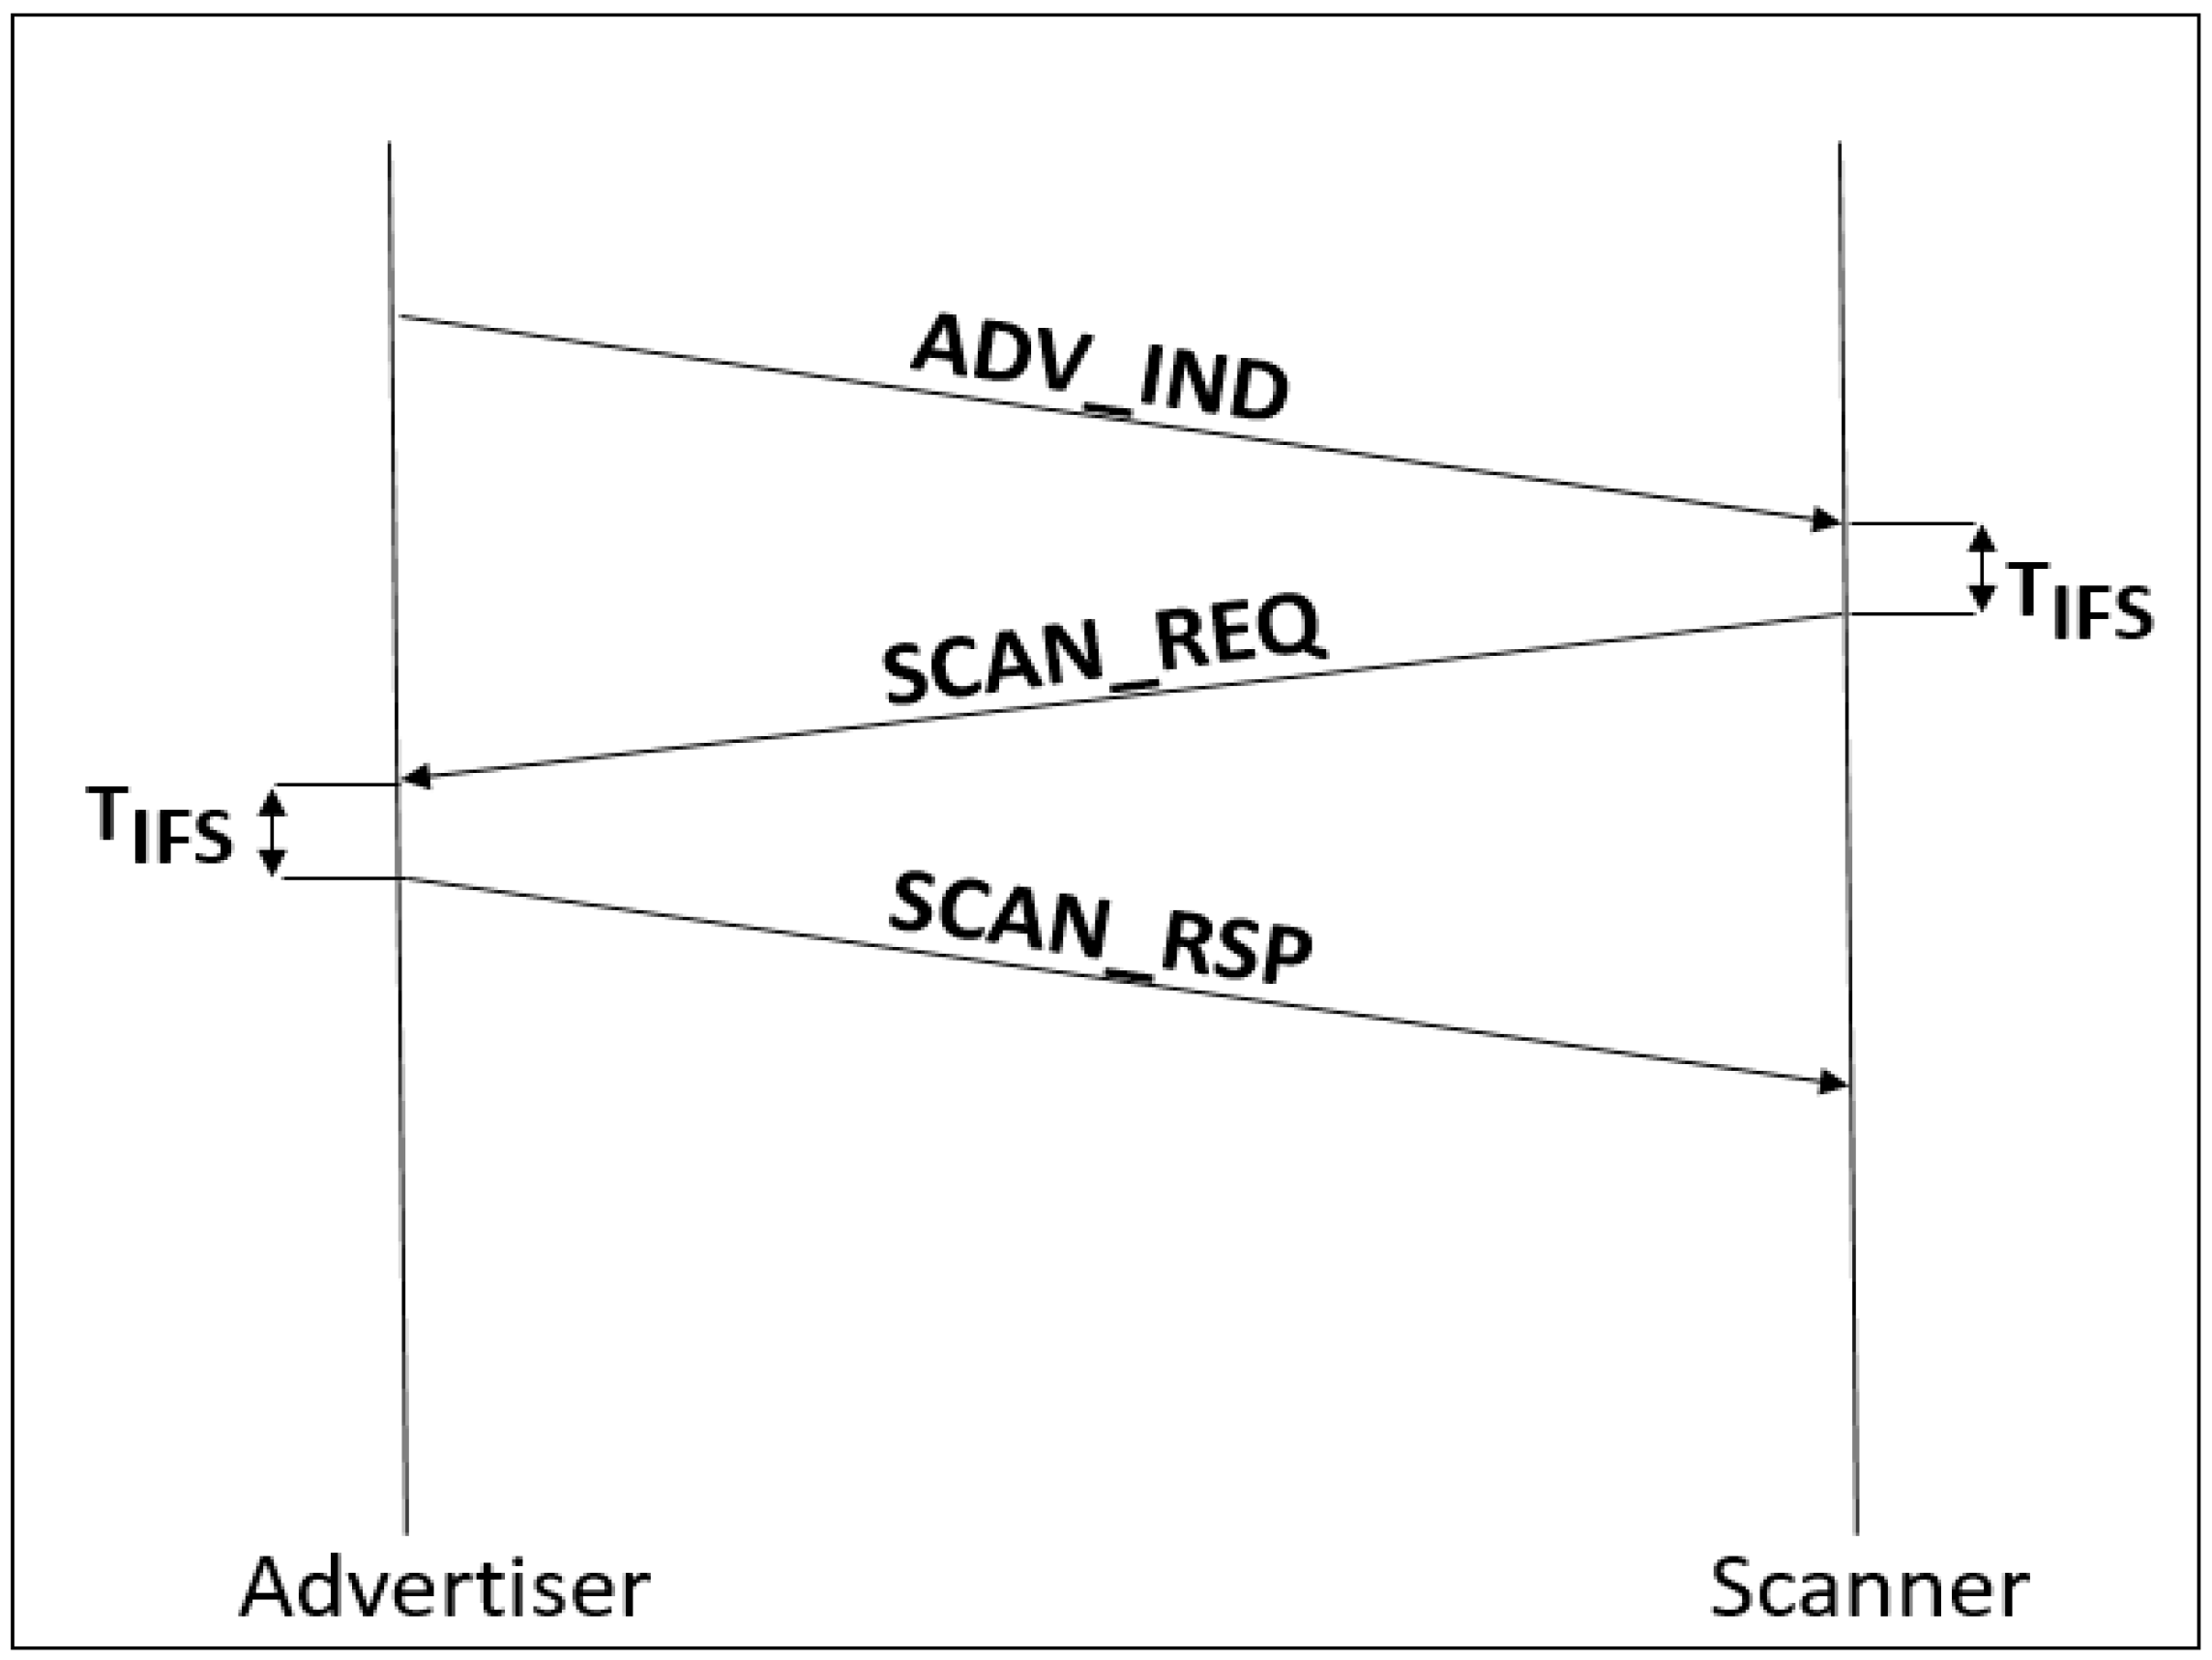
When
is sent to a scanner, the scanner responds with
. As a response to
, the advertiser sends
as shown in
Figure 3. When the
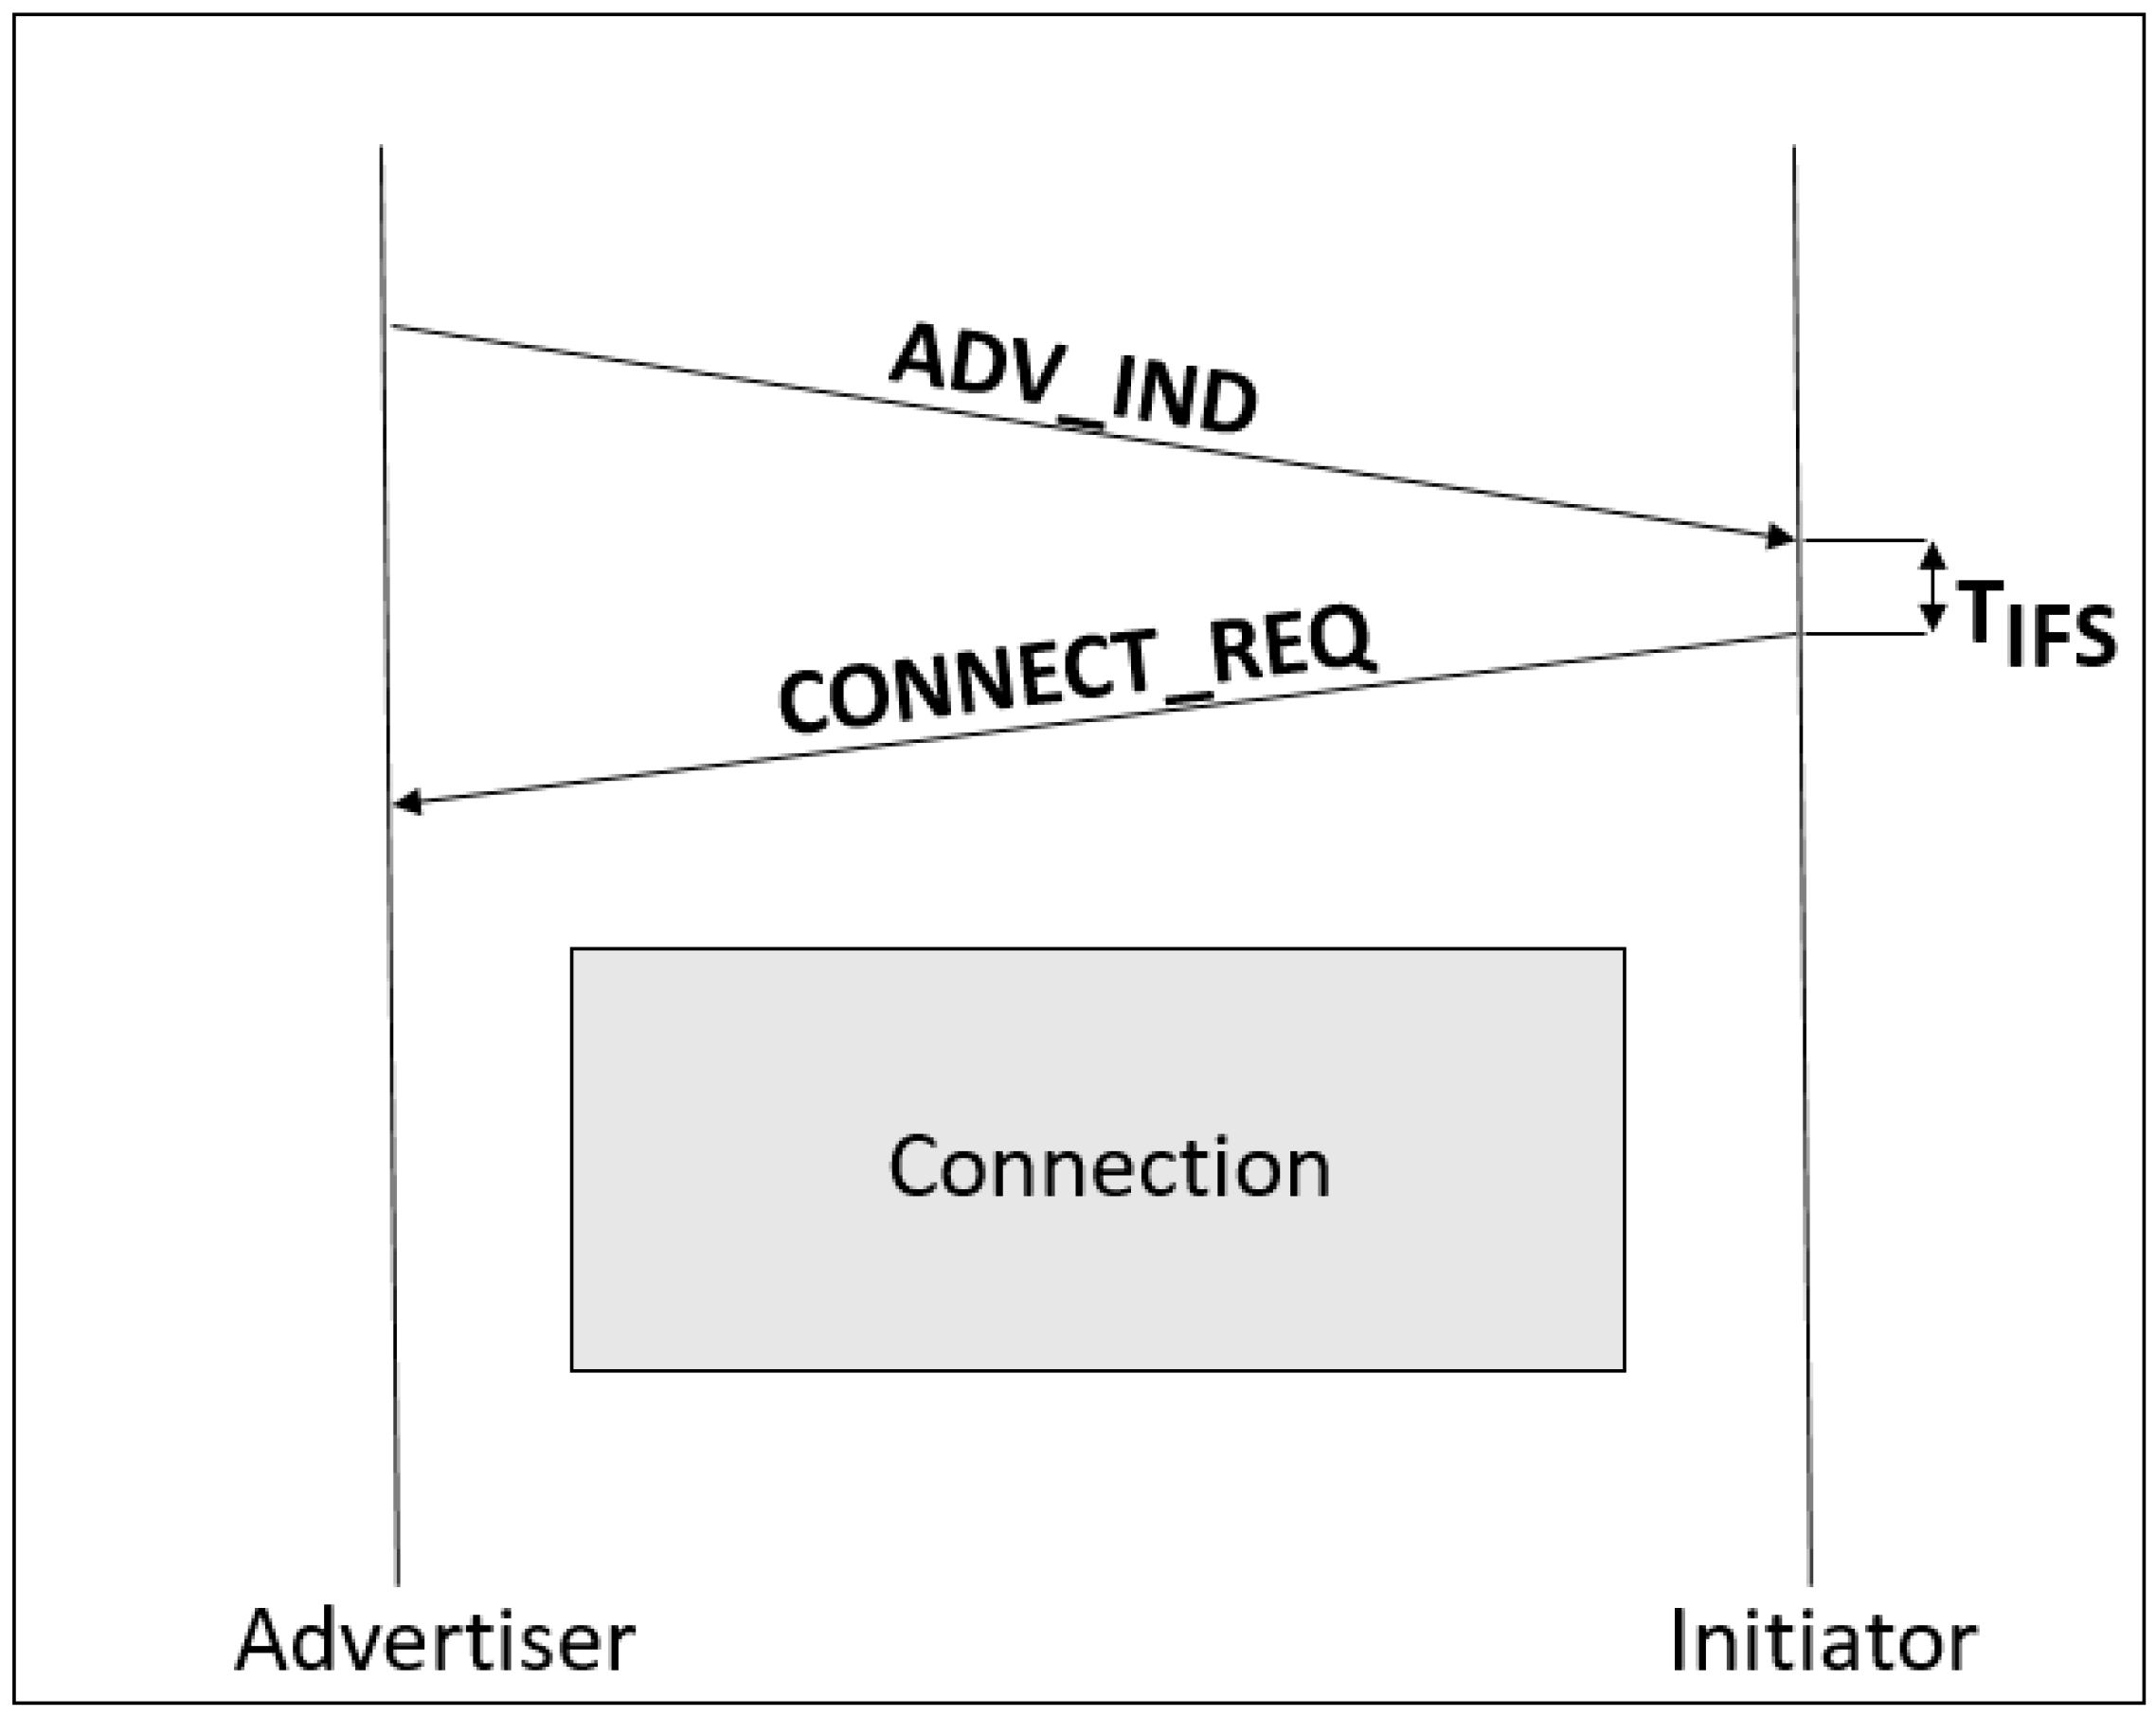
is sent to an initiator, the initiator responds with
. After the successful exchange of these packets, the connection is established. The advertiser and initiator both go into their connection state, as shown in the
Figure 4.
We define the latency of advertiser to be discovered by the scanner, as the time when advertiser went into advertising state to the time when is received by the advertiser. We also define the latency of advertiser to be discovered by the initiator as, the time when the advertiser went into advertising state to the time when is received by the advertiser.
As per BLE specifications, there is an inter-frame space () that is defined as the time interval between two consecutive packets on the same channel index. is equal to .
3.3. Algorithm
The proposed Algorithm 1, is formulated around an indicator sent by the advertiser. The indicator is denoted as . After the advertiser enters its advertising state, initially the value of is set to zero and it is incremented after every passing advertising interval. This value is set to zero when a response is received from either a scanner or an initiator. The value of is sent in the payload of and PDUs. These PDUs are received at the scanner or initiator. The scanner accesses that, after how many tries of sending PDUs, the advertiser was successfully discovered by the scanner. This systematic approach implies that if the value of is very high then it took several attempts to reach the scanner or initiator. In turn, the scanner (or initiator) readjusts its scan window () and scan interval () accordingly.
A threshold is set for the maximum value of
; this is termed as
. The changes in the value of
and
are based upon the ratio of
to
i.e.,
.
If the value of is equal to or greater than then the value of is decreased with a factor of . If the value of is less than then is decreased with a factor of and is increased by a factor of .
The value of is saved in the scanner and becomes . When this value is received for a new advertiser, and are compared, if the value for new advertiser is greater than one previously stored. Then the is again decreased with a factor of and is increased with a factor of .
Lower thresholds are set for both and and if they are decreased beyond these thresholds then the values are set to and respectively. In the case of new value scan window being greater than the scan interval, scan interval gets the value of scan window. And the scan window is adjusted with respect to . The upper limit of both and is set to be as per the BLE 4.2 specifications.
Another condition considered is that the value of delta is never 1, because this means that the scanner is scanning continuously. Continuous scanning is allowed as per BLE specification but it costs energy, this algorithm avoids continuous scanning by never letting the value of to be 1.
| Algorithm 1. Proposed Algorithm |
Function (ADV_IND, ADV_SCAN_IND, , , , ).
Input: Payload from advertiser; ADV_IND or ADV_SCAN_IND, Indicator from advertiser; , value of scan interval; , value of scan window; , previous value of indicator .
Output: refined value of scan interval; and refined value of scan window; .
1 get from PDUs.
←
3 if ( >= ) then
4 ← is decreased by a factor of
5 else if ( > ) then
6 ← is decreased by a factor of
7 ← is increased by a factor of
8 else if ( < ) then
9 ← is decreased by a factor of
10 ← is increased by a factor of
11 else if ( > ) then
12 ←
13 ← -
14 return ,
15 end |
3.4. Parameter Calculations
The total size of the BLE packet is
, this is shown in
Figure 5. The overall packet structure for both advertising and data packets is the same, with the difference lying in the PDU field. The length of advertising PDU depends upon the length field in 2 octet header. Considering PDUs
and
, the maximum size of these packets will be
. As per specifications, the maximum packet size of
is
. Similarly, the packet size of
is calculated to be
. It is to be noted that the packet
is most prone to error due to the presence of crucial data in LLData field. If it gets corrupt then the probability of discovery is reduced thus adding to the latency.
The transmission time of
and
is denoted by
. The transmission time of
and
are denoted by
and
respectively. Because the transmission rate for BLE is
the transmission times are calculated as;
Keeping in view the value of inter-frame space, the minimum time required by the advertiser to be discovered
is:
Similarly, the latency of advertiser to be discovered by the initiator can be stated as:
These calculations are used in the simulation to simulate a realistic scenario of BLE network, which is also in accordance with the BLE specifications.
3.5. Energy Consumption
The calculation of the energy consumption is depended on multiple parameters. Since the scope of this paper is limited to the advertiser discovery we will only deal with the calculation of this event. The advertiser discovery is usually denoted by
. To carry on with the calculation we are assuming that the operational voltage of a particular advertiser is constant throughout the discovery event. The energy consumption is defined by the elapsed time (
) multiplied by the electric current (m.A). The research published by the authors in [
25,
26] are considered to be the most accurate work done for Bluetooth advertiser discovery energy consumption. Based on the model proposed in these researches, the energy consumption of an advertiser in a single advertisement period is
.
Using the value of
, the expected energy consumption of an advertiser during the interval
is given as:
The total expected energy consumption for all
advertiser is computed using the following equation:
4. Simulation and Results
To test the results of the proposed algorithm, a BLE simulating program was developed. The simulation program was developed using C language and Matlab. The choice of using C language was to avoid additional software delays during the simulation process. The simulation results were imported to Matlab for further analysis. The simulation complies with all the requirements of the BLE 4.2 specifications document. In order to highlight the improvement made by the proposed algorithm, the simulation is compared with scenarios of standard BLE. It is assumed that the BLE-enabled IoT devices are based indoor and they are usually static. Since a small home office scenario is considered it is also assumed that all the BLE-enabled IoT devise are within the operating range of the BLE standard having good RSSI levels.
The number of advertisers used for the simulation are 10, 30, 50, 70, 90, and 100. Simulation for each distinct scenario has been run 100 times and the results have been averaged out. This is done to achieve more accurate results. As a vast number of devices are being considered in the scenario, there is a big variation in results as the number of devices increase. The results have been plotted on a logarithmic scale.
The simulation was run separately for four scenarios. First, the scenario of one scanner with a multiple number of advertisers is considered. Here the advertising devices enter their advertising state randomly and wait to be discovered by the scanner. Similarly, the scenario of one initiating device with a multiple number of advertisers was considered. Here the advertising devices started the transmission of their packets randomly and waited to be discovered by the initiator.
The time taken for an advertiser to be discovered by a scanner and an initiator is different. This difference is due to the different natures of exchanged packets. The
is sent to the advertiser as a response to its PDUs. While
is sent by the initiator. Lengths of both these packets are different. Moreover
contains data, this data if not received correctly can lead to the case of non-discovery. Simulation parameters are stated in
Table 1.
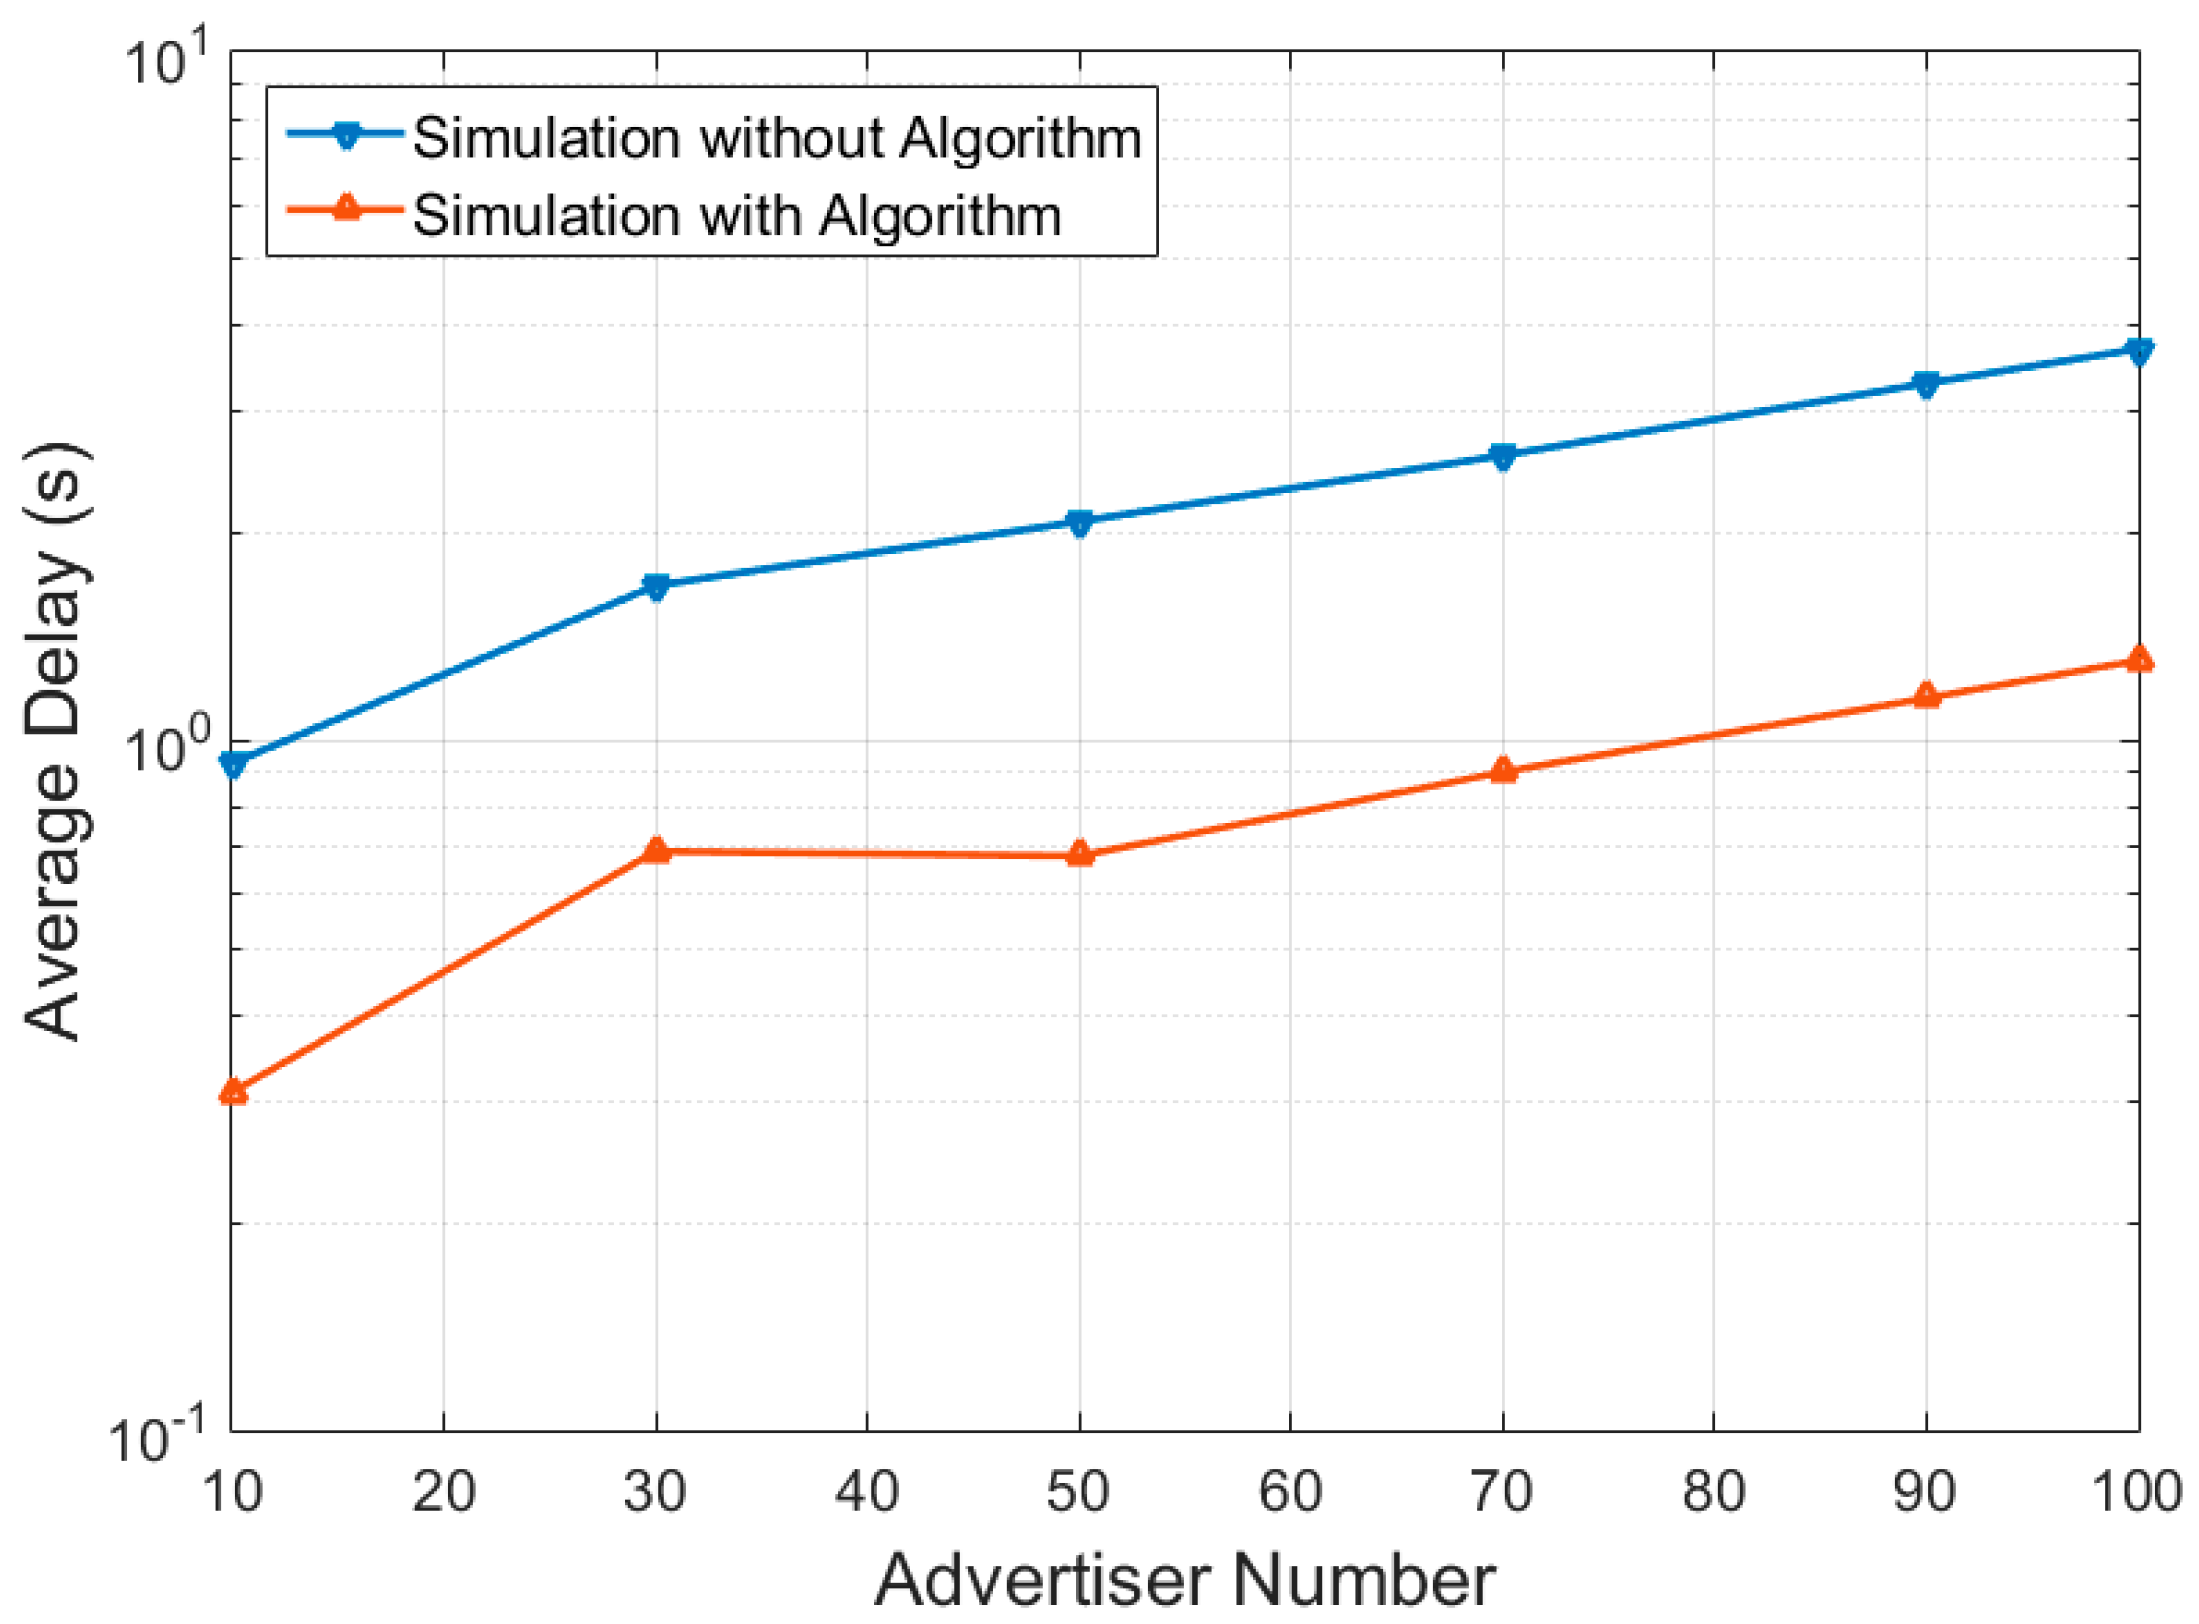
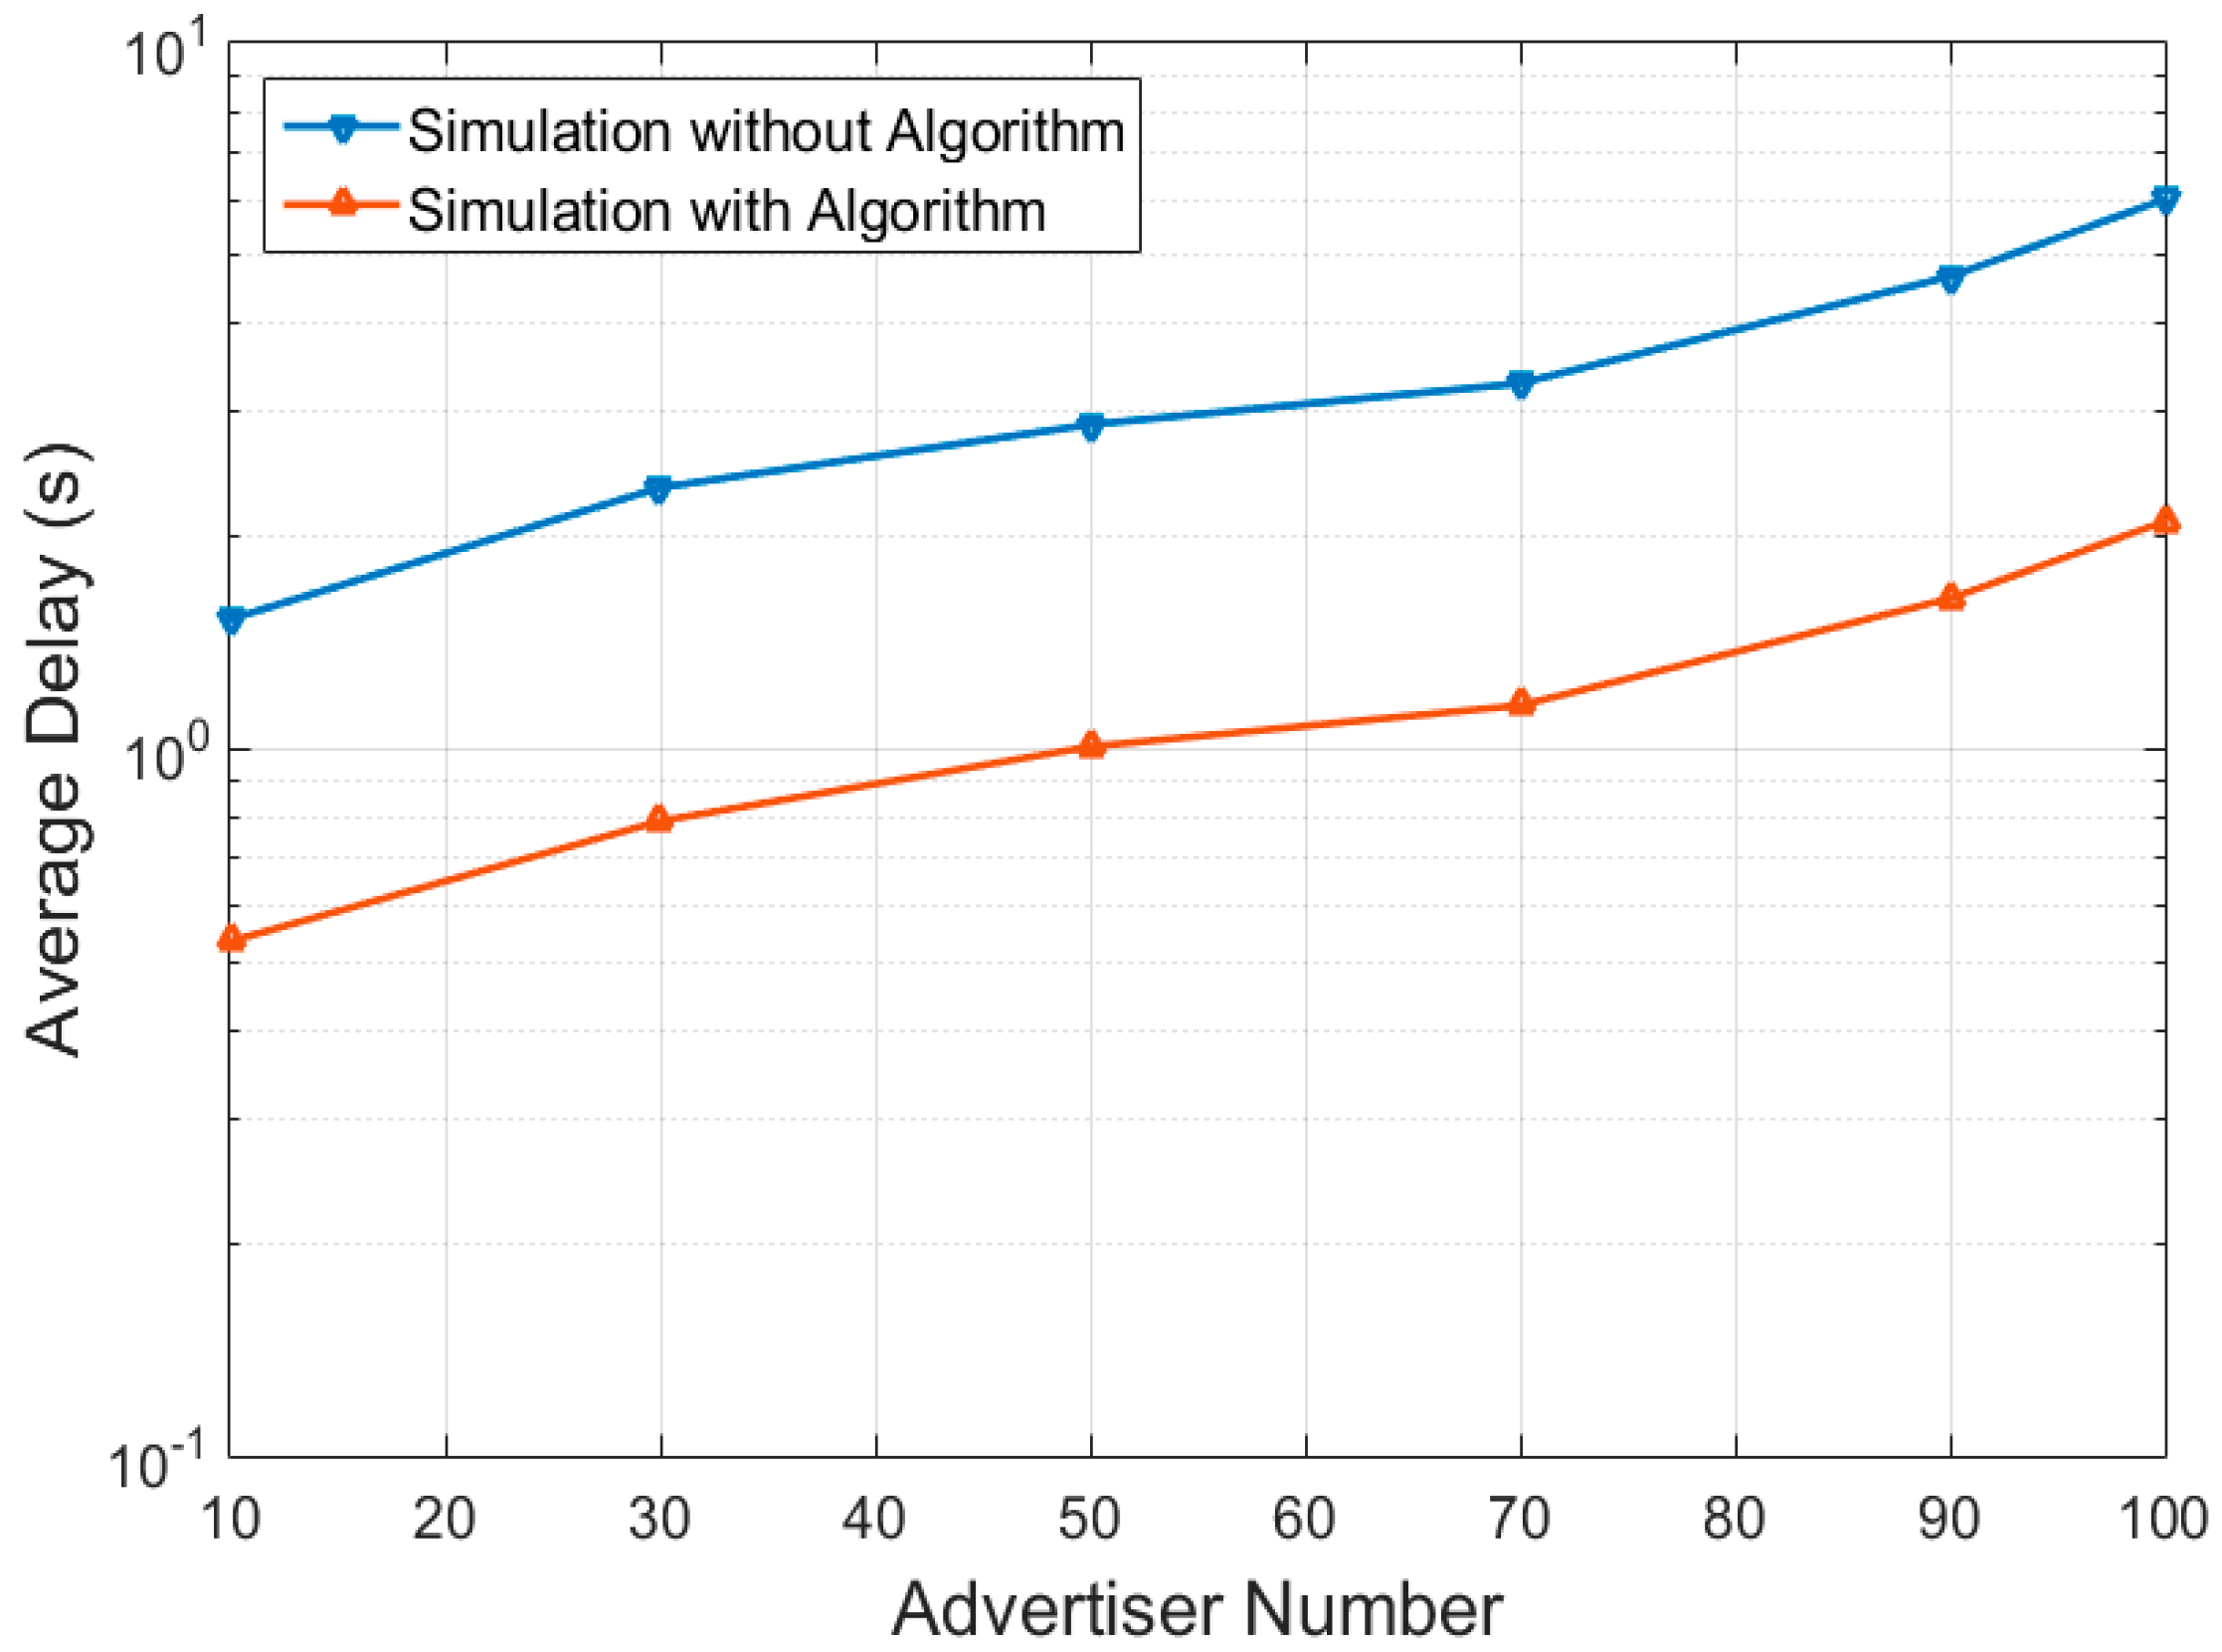
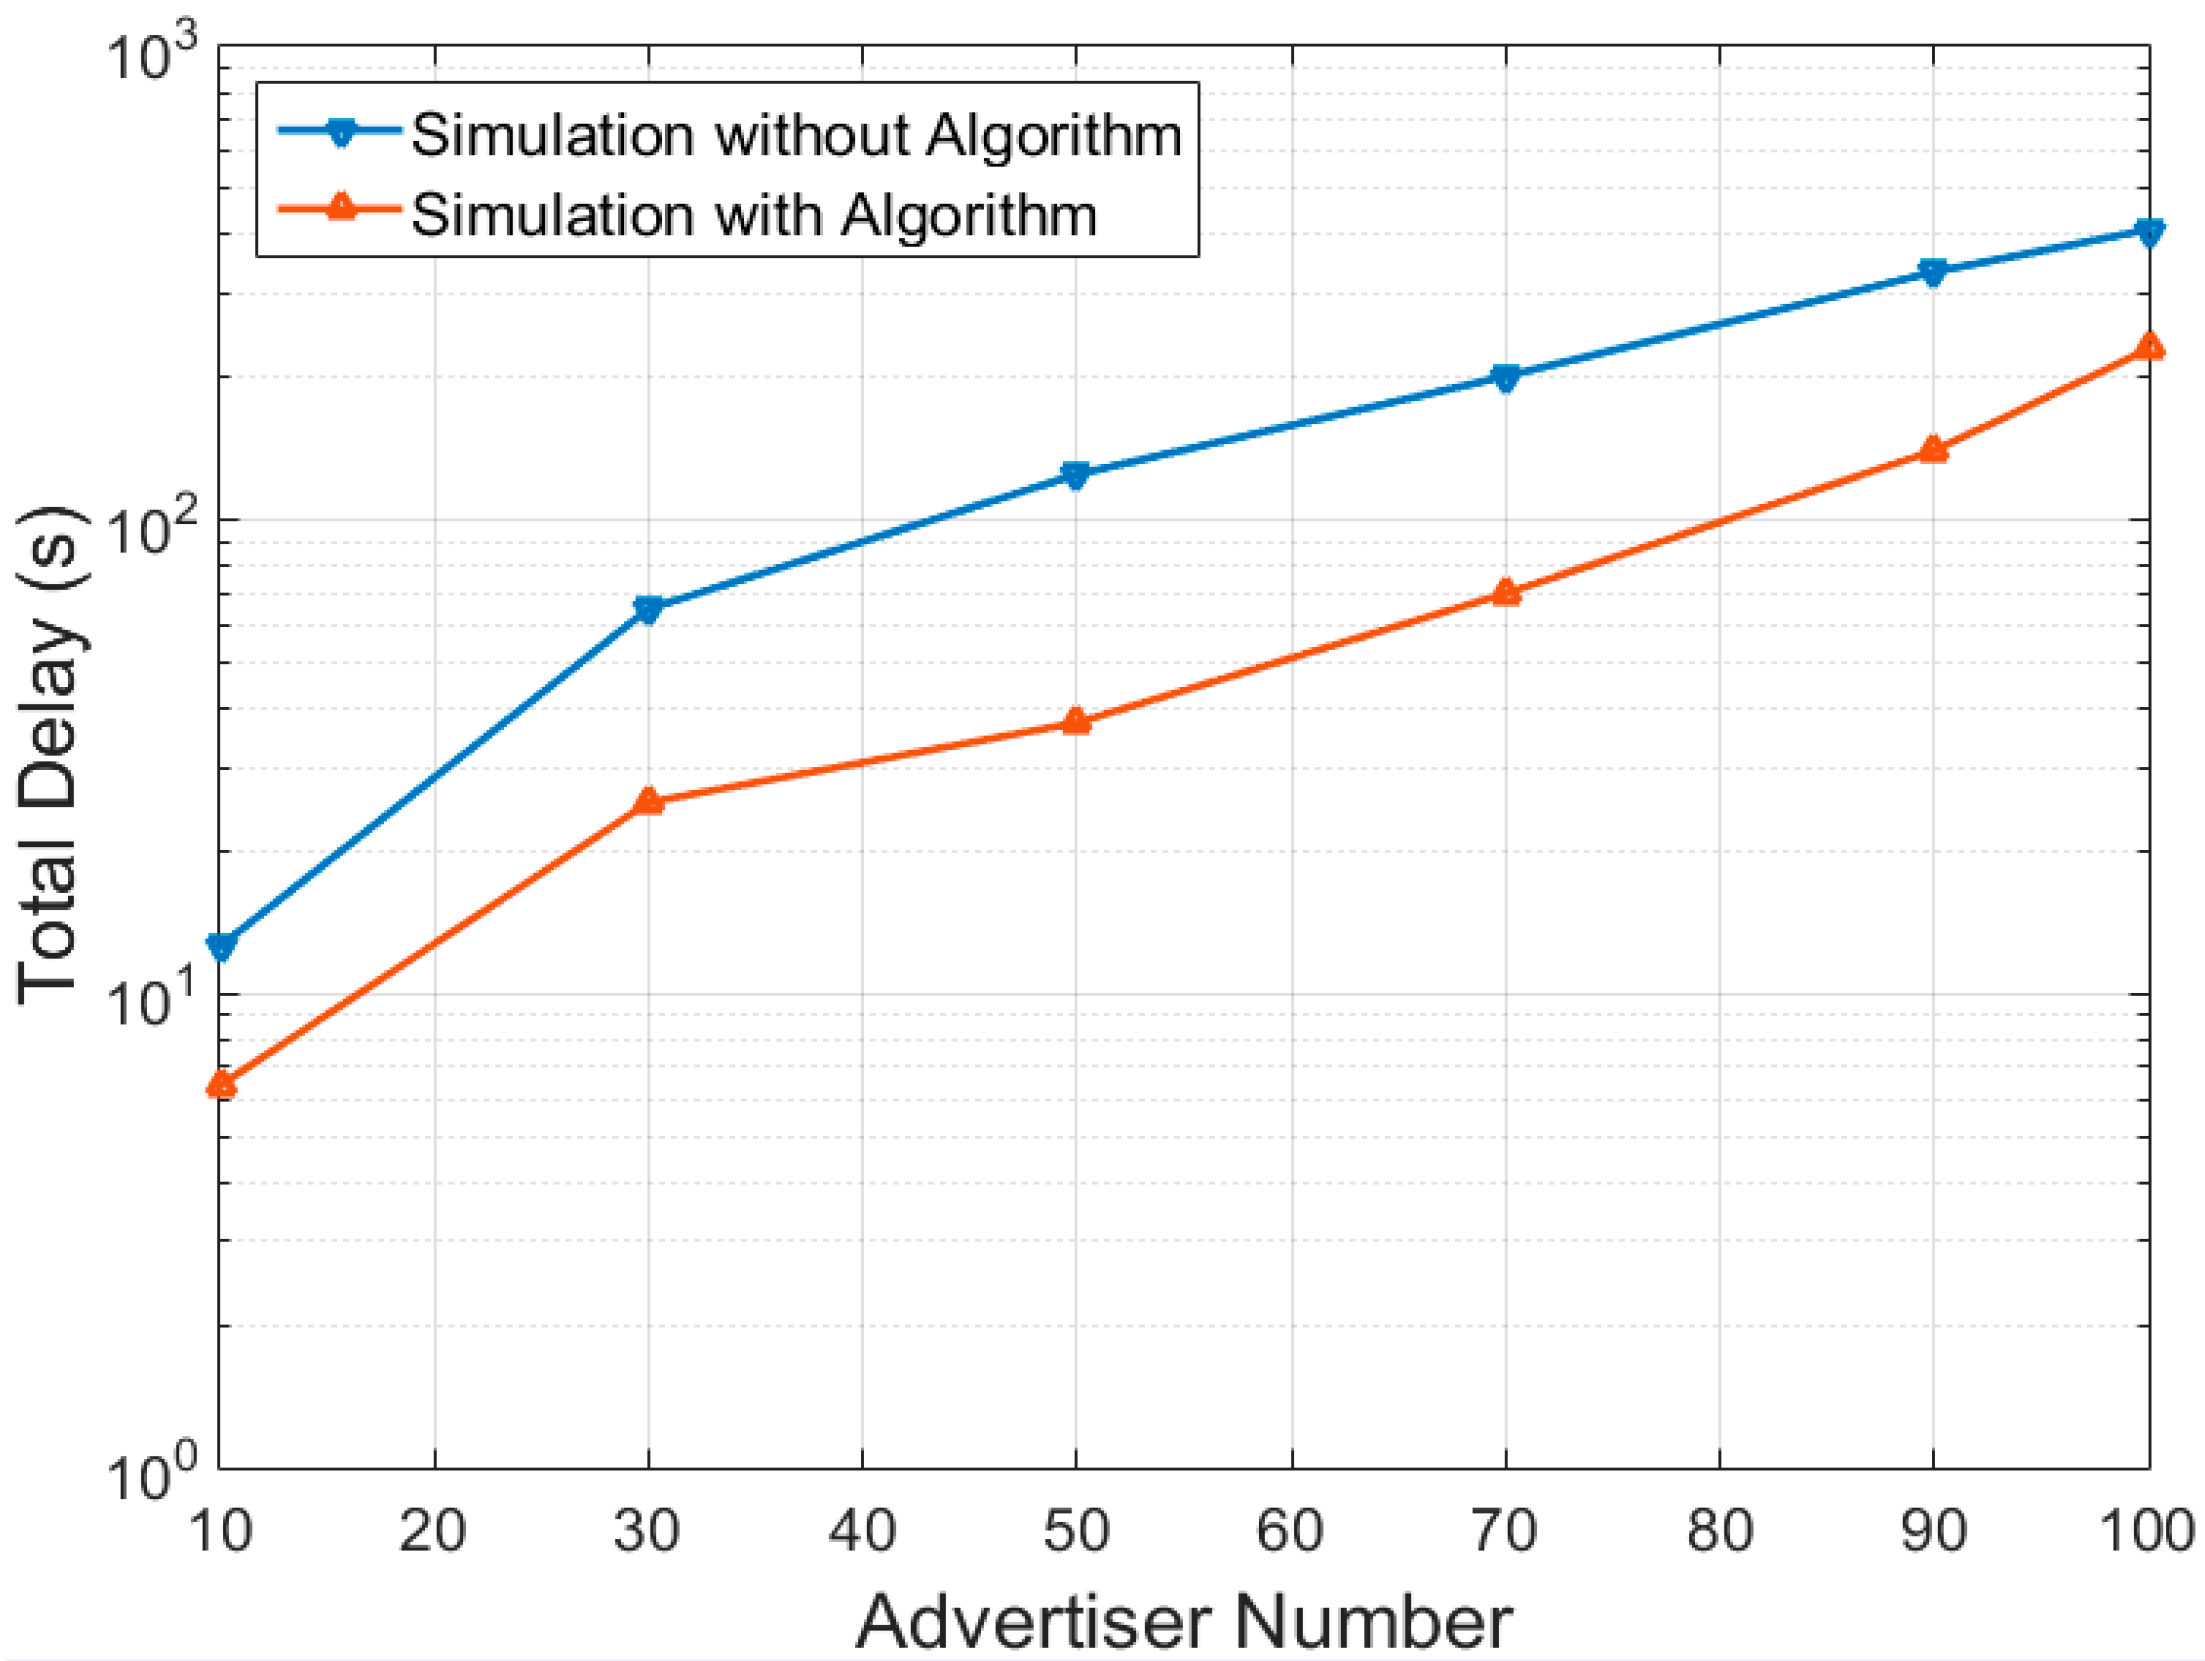
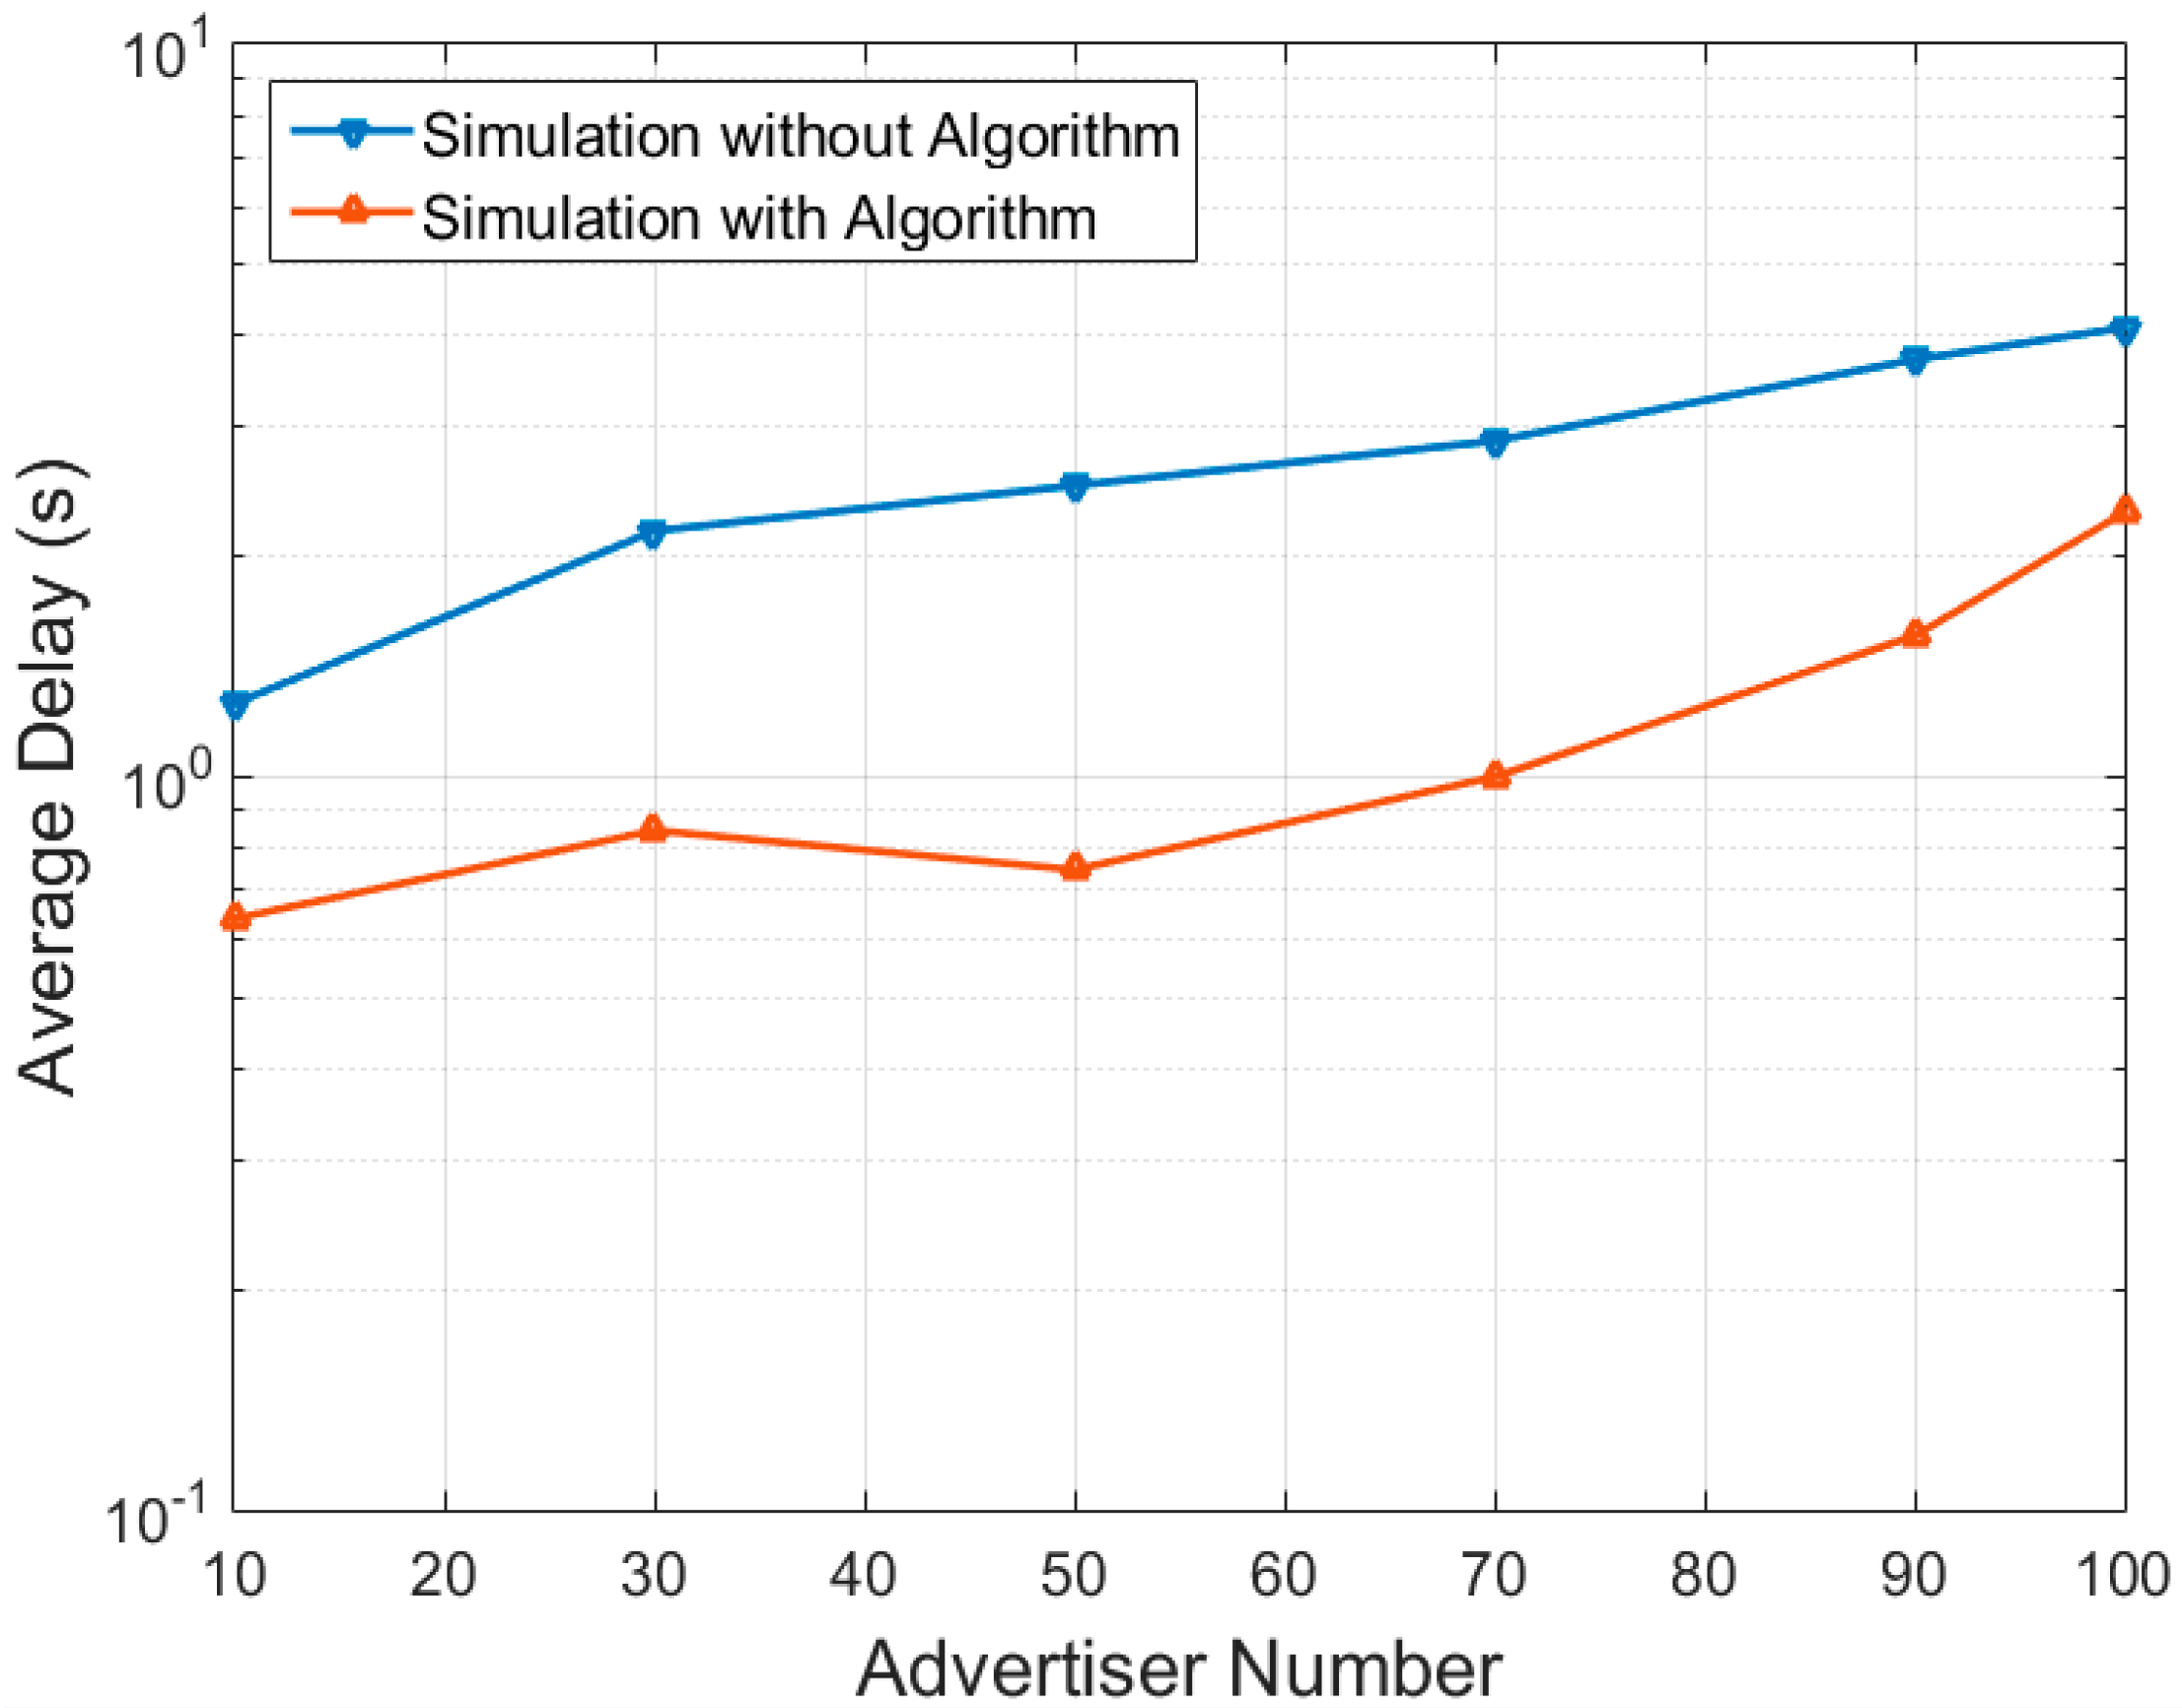
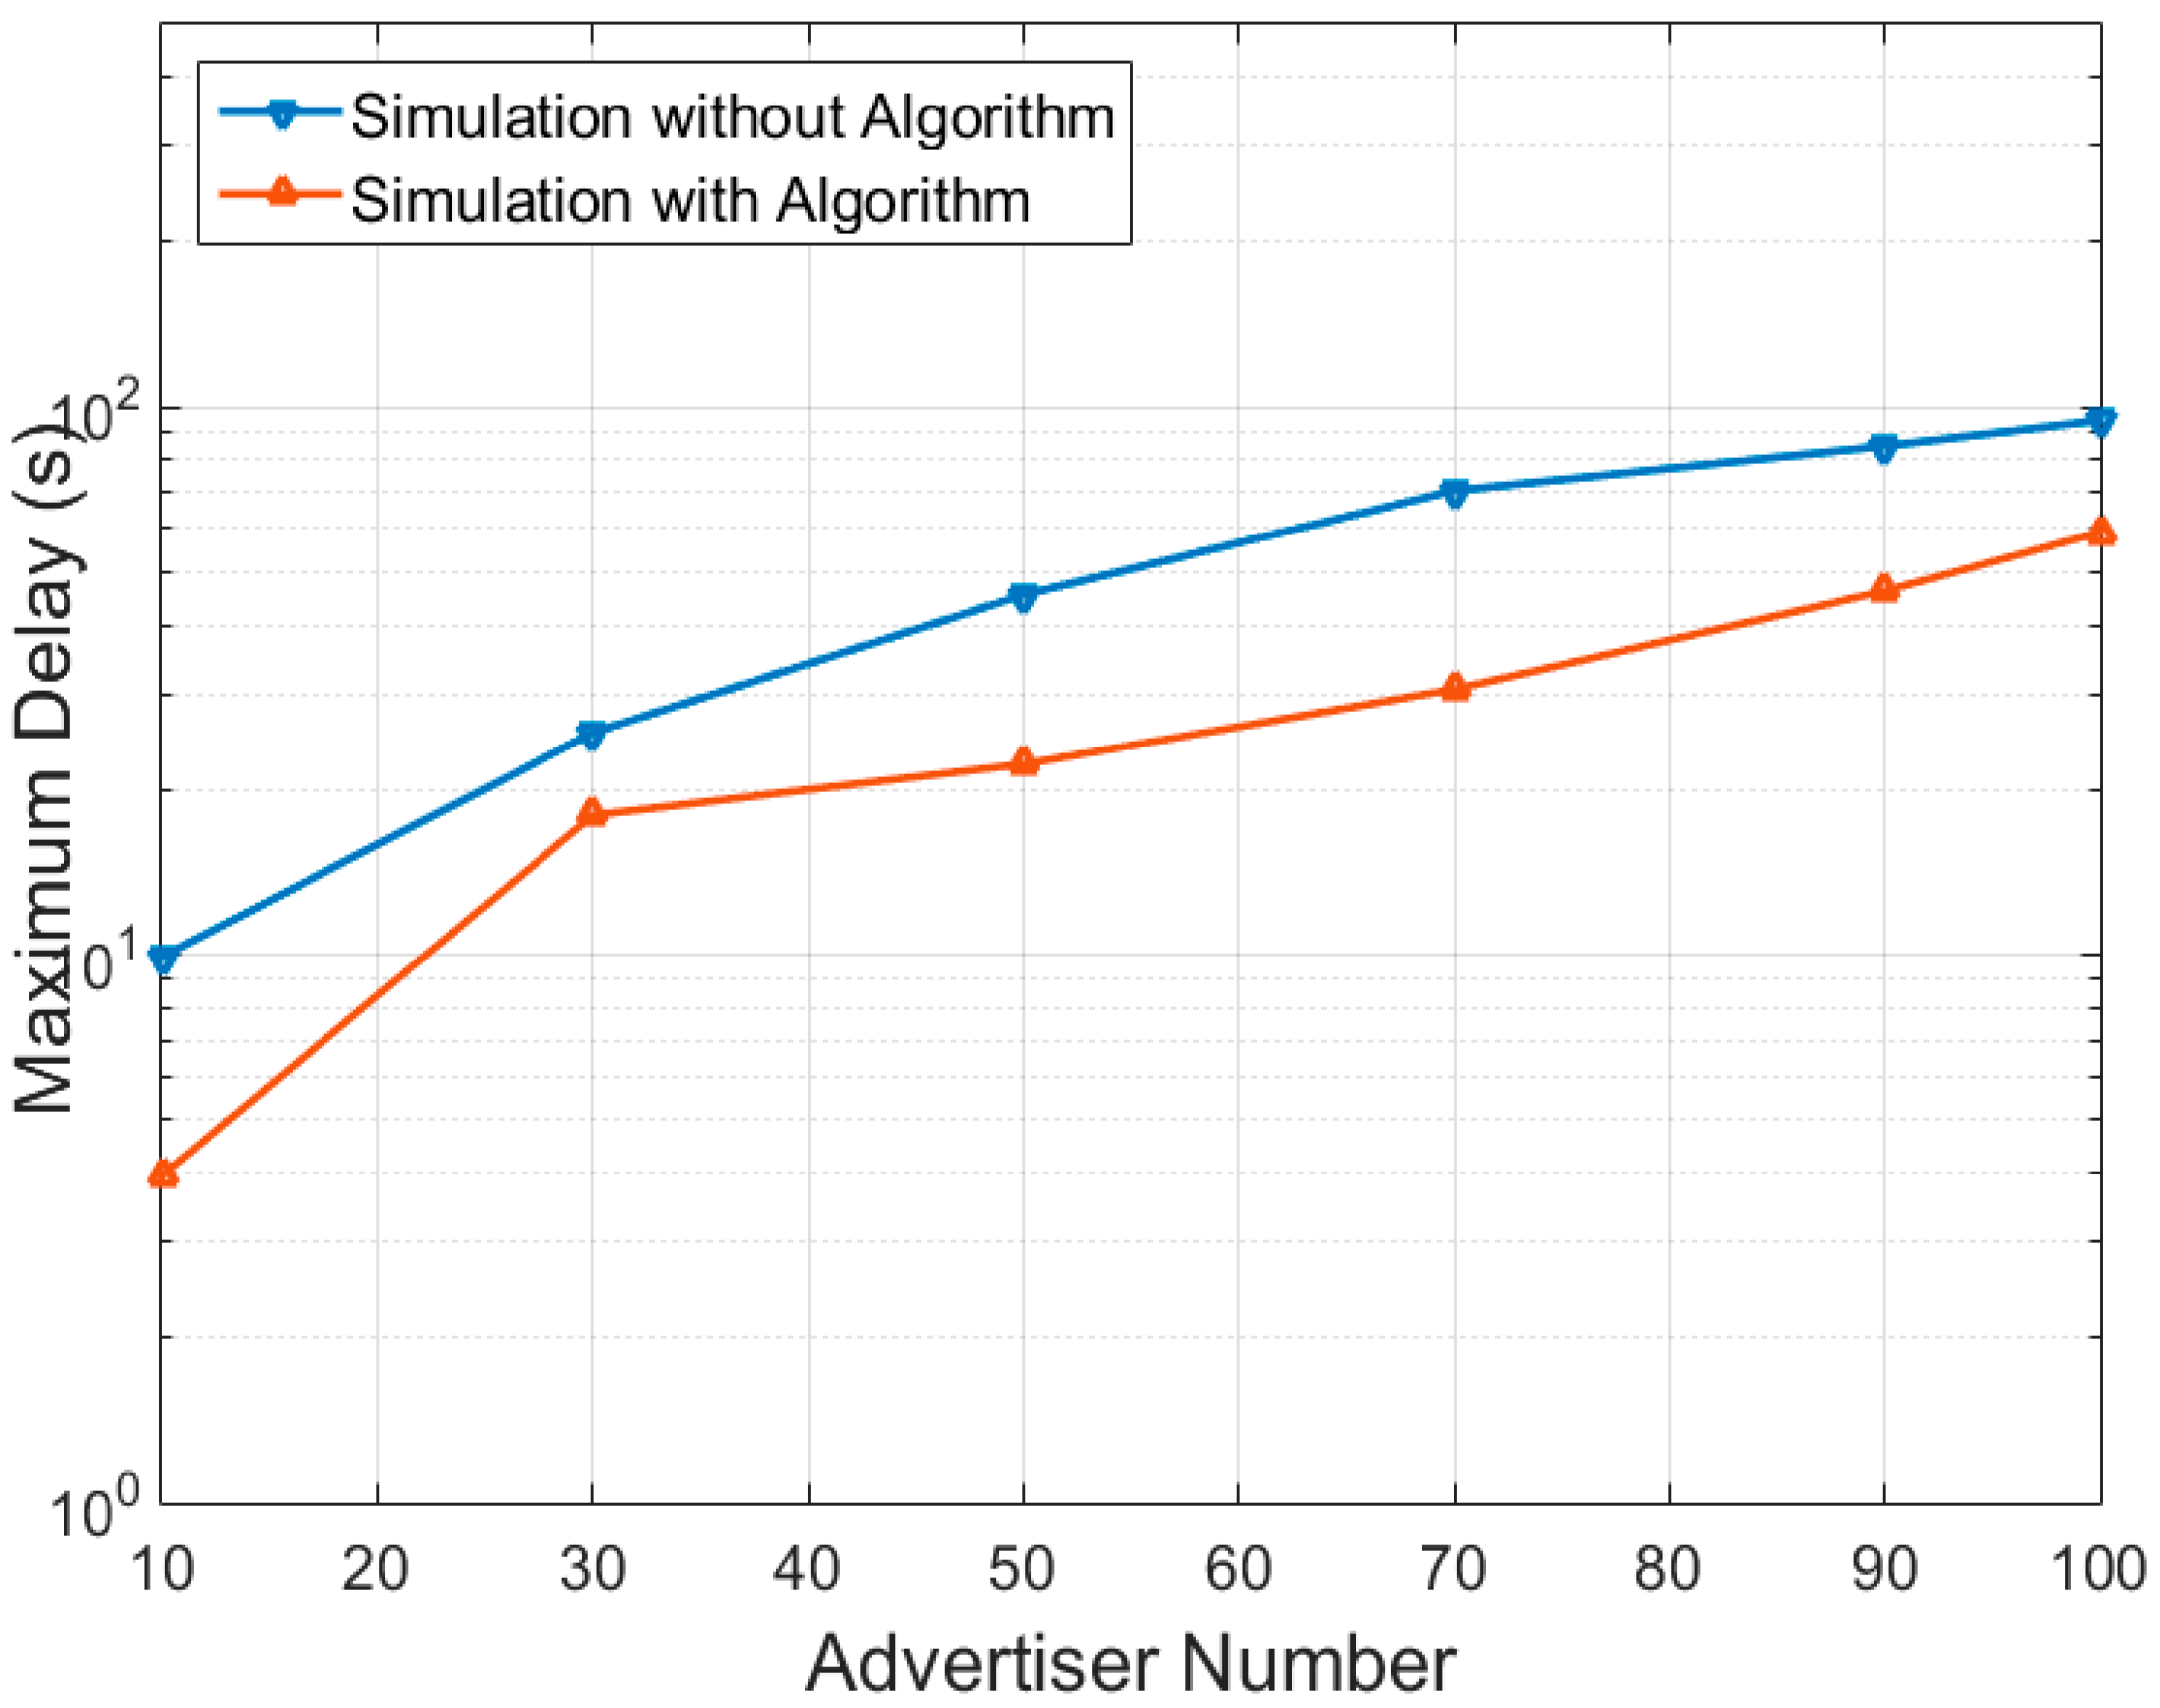
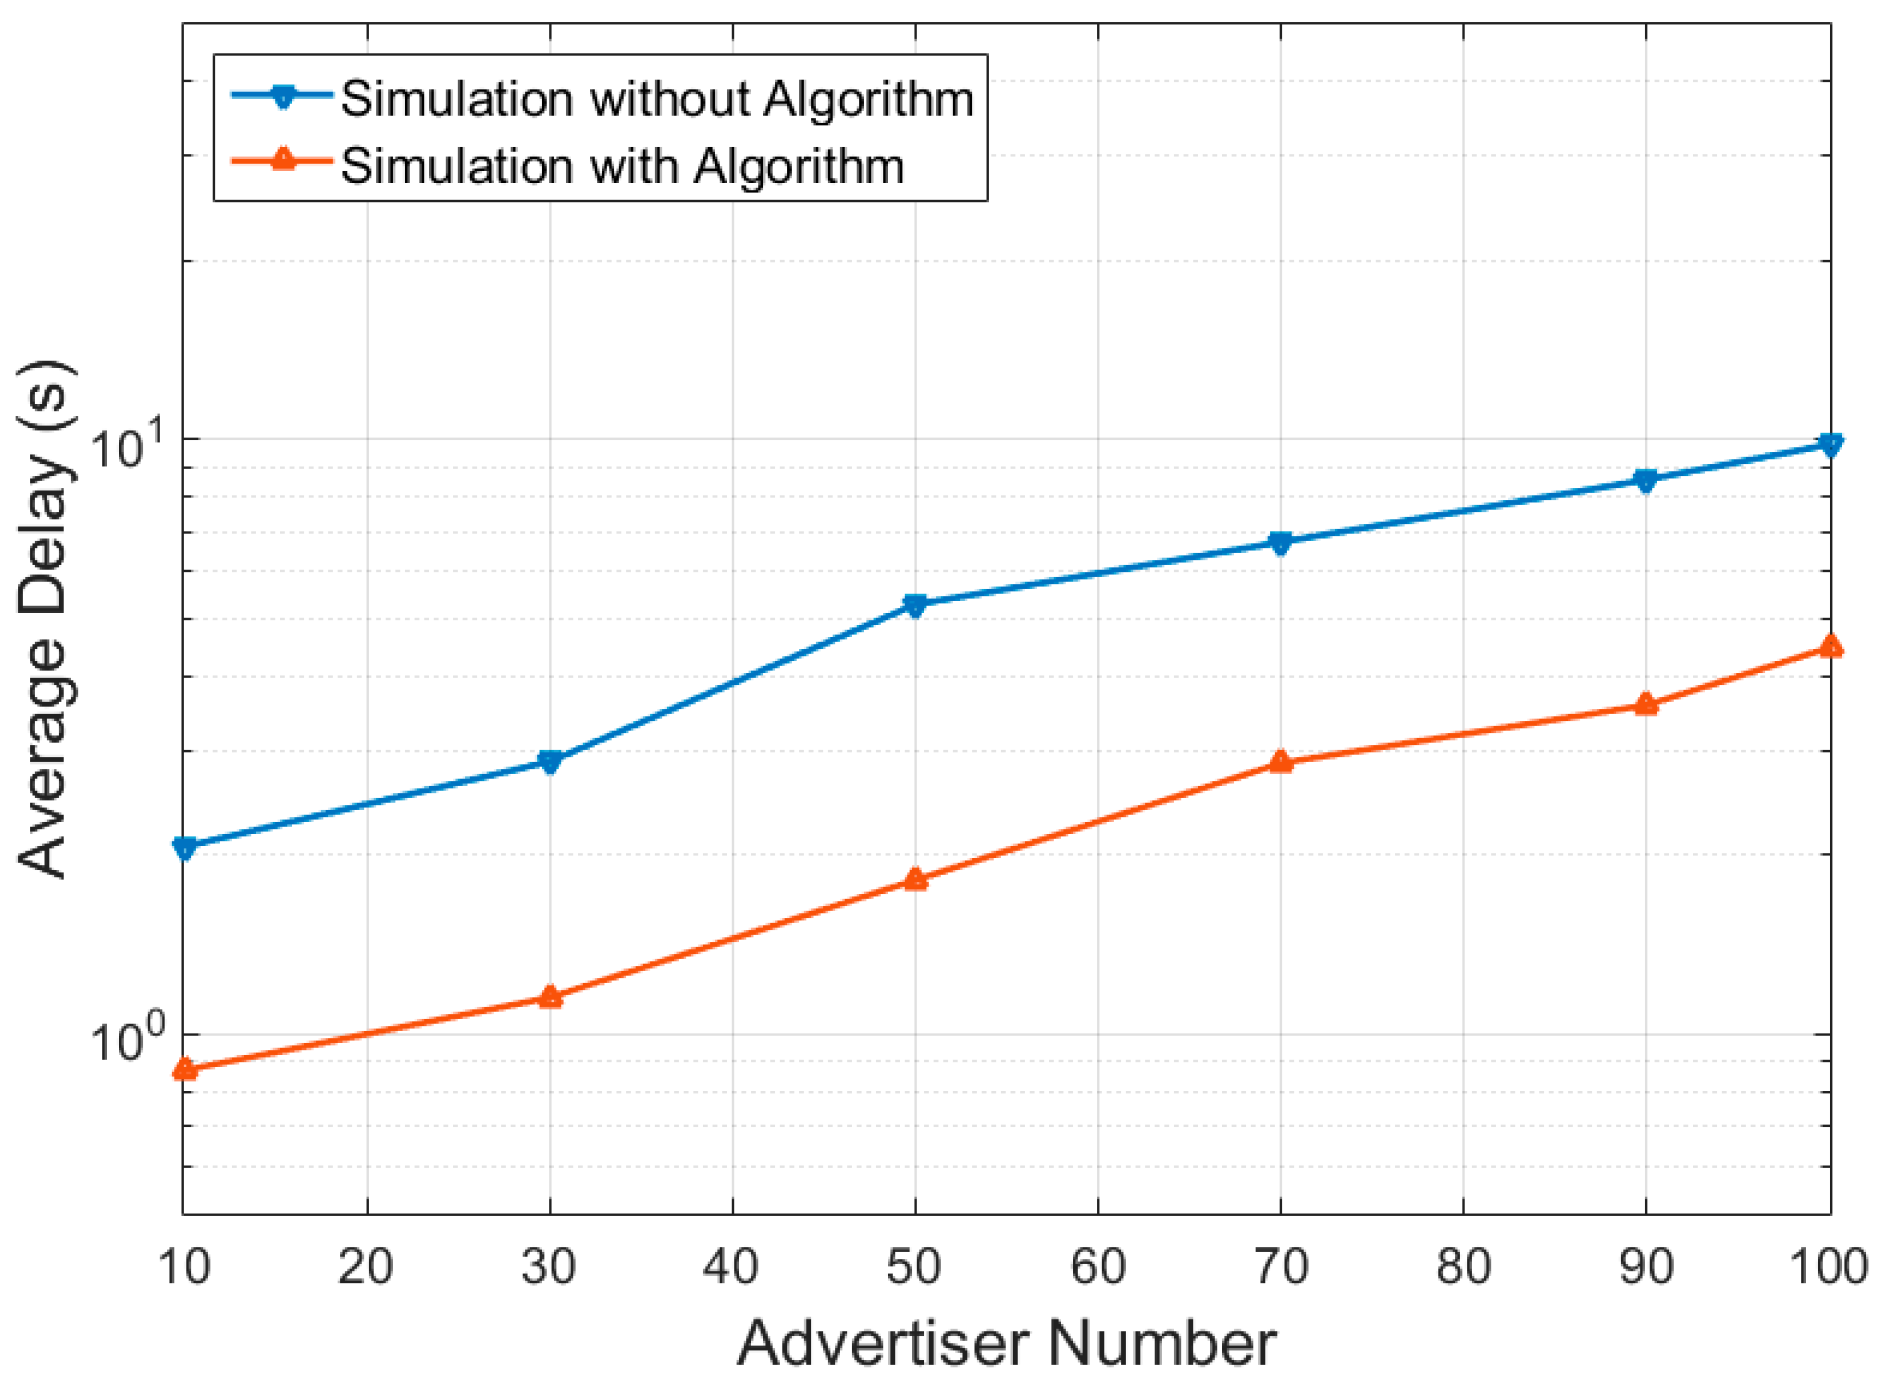
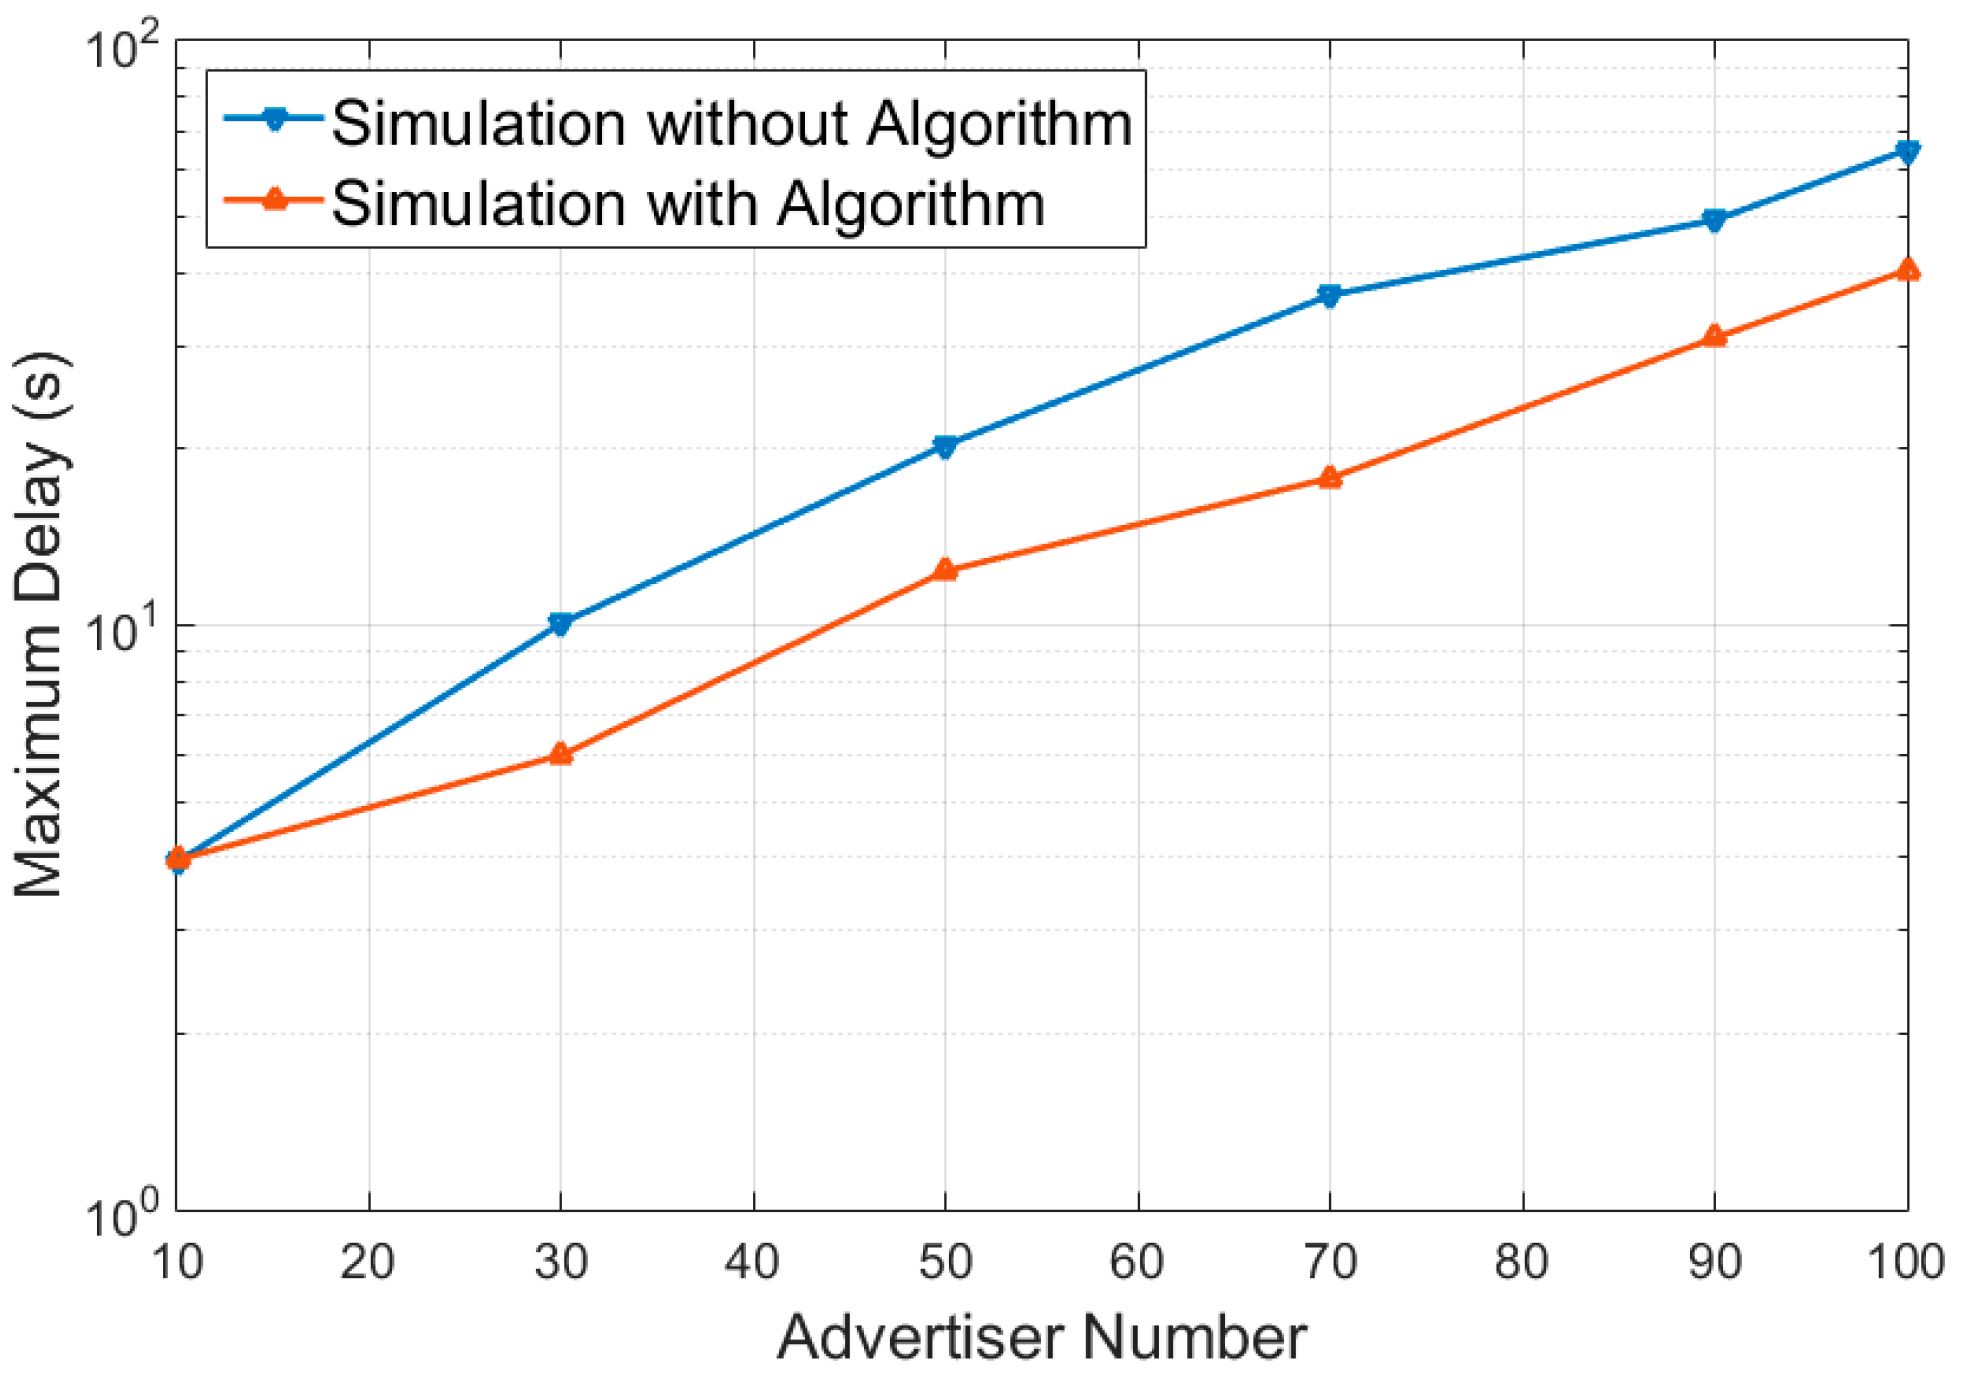
The latency of a number of advertisers to be discovered by the scanner and initiator are shown in different graphs. For the discussion of the results, the average delay means the average time in seconds it took for one advertiser to be discovered by the scanner or initiator. The total delay means the total time it took for all the advertisers to be discovered. This value is the aggregated time of all the advertisers from the moment they individually entered the advertising state to the moment they received the response from scanner or initiator. Another parameter that is discussed in the results is the maximum time one advertiser had to wait to be discovered. All three of these parameters show the efficiency of our algorithm in comparison to an ordinary scenario with no algorithm applied.
The worst-case scenario was simulated for both the scanning device and the initiating device. In this simulated scenario, all the advertising devices start transmission at the same time. This increases the average waiting time per advertiser and the maximum waiting time drastically.
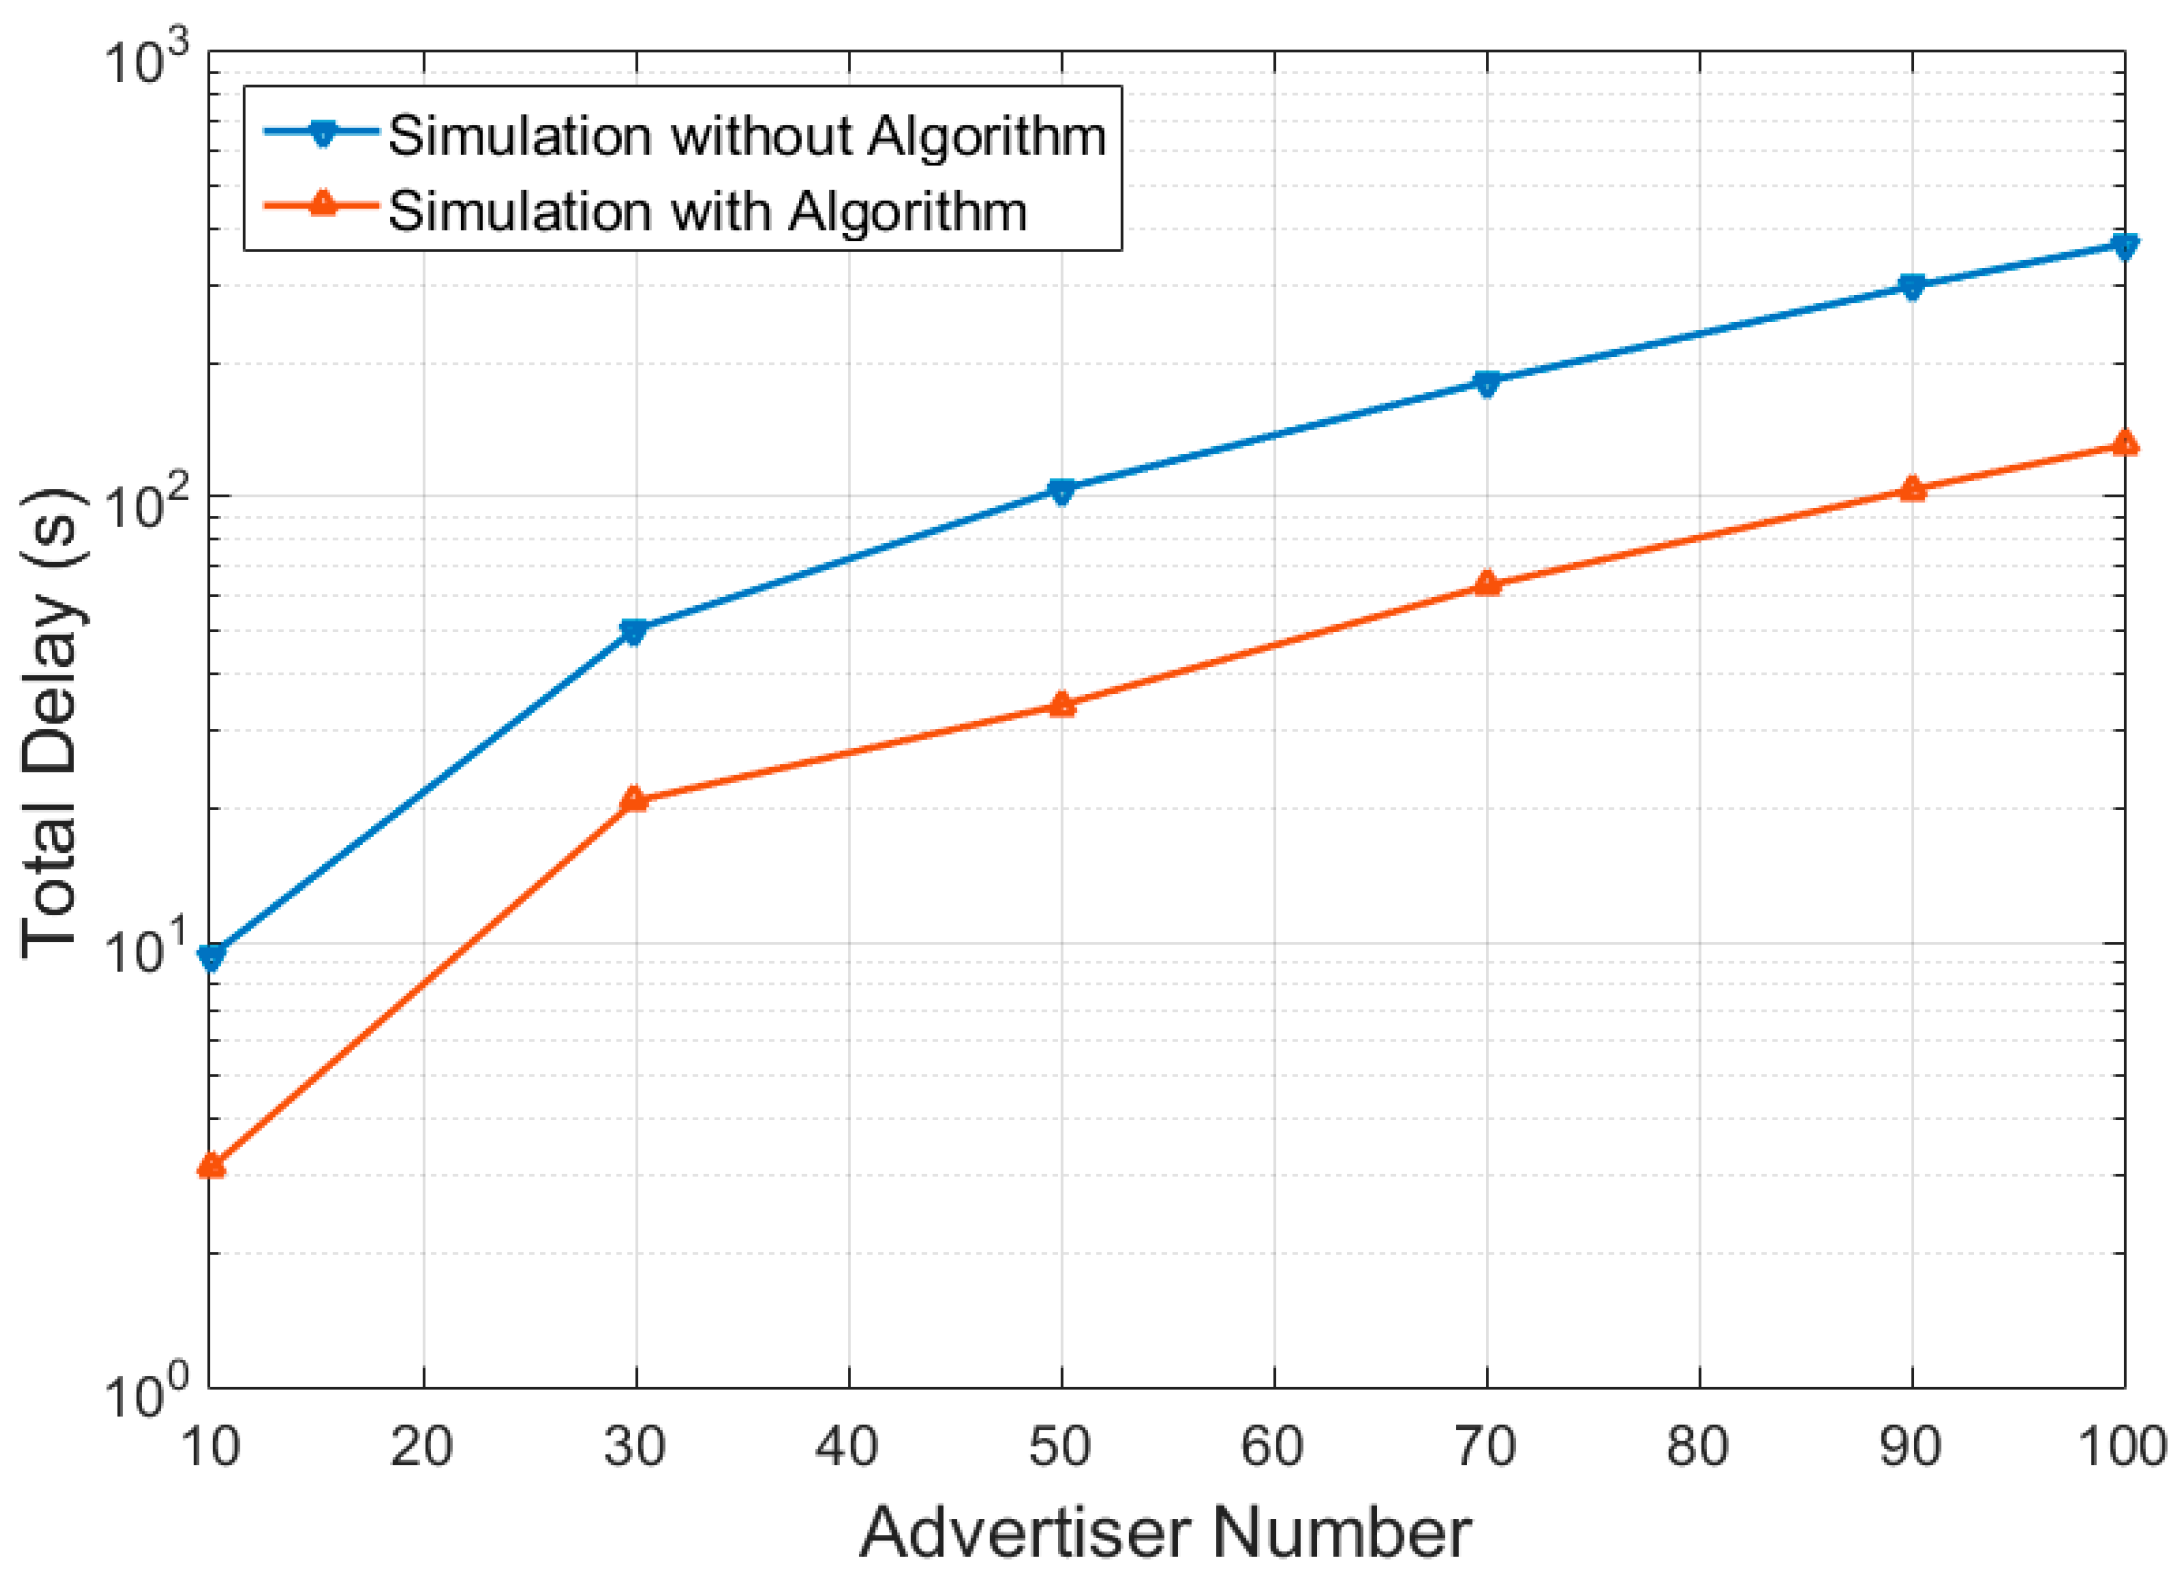
Firstly, we discuss the scenario where the scanning device is scanning multiple number of advertisers. As the number of devices increase, the total time taken by all the advertisers, from the time when they entered their advertising state till the time they receive SCAN_REQ from the scanner, is observed to be increasing.
Figure 6 shows the total time taken by 10 to 100 advertising devices to be discovered by the scanning device. Here, the advertisers start transmission at a random time. This graph shows the comparison of total time taken without the algorithm application and with the algorithm application.
The total time it took for devices was in the ordinary scenario. It took for devices. These values have been decreased to and respectively after the application of the proposed algorithm. The total time taken by all the advertisers to be discovered by the scanner is decreased by in the case of devices.
In
Figure 7, the graph shows the improvement in the average discovery time for
to
devices. The average discovery delay for
devices was decreased from
to
after the application of the proposed algorithm.
The same scenario was also simulated for an initiator. The advertising devices randomly enter their advertising state and start the transmission of packets. The results of this scenario can be seen in
Figure 8 and
Figure 9.
Figure 8 shows the total time taken for all the advertisers to be discovered by the initiator. The value increases as the number of advertising devices are increased. On average the improvement in total delay is
for total time taken for all the advertisers to be discovered. As per the results of the average delay, from
Figure 9, the average delay for an advertiser to be discovered has been decreased from
to
.
The worst-case scenario was also simulated considering that all the advertising devices start their transmission at one time. This showed a drastic increase in the average discovery delay. The maximum waiting time was also computed for these advertisers. In
Figure 10,
Figure 11 and
Figure 12 the total delay, the average delay and the maximum time an advertiser had to wait before being discovered are shown. Total time taken by
advertisers to be discovered by a scanner is improved by
when the algorithm was applied. The average discovery delay per advertiser was reduced from
to
. This result can be seen in
Figure 11.
The maximum delay is the worst delay an advertiser had to experience, from the time it started transmission till the time it was discovered. This value increased as the number of advertisers increased. As per the simulation results, for the worst-case scenario if
advertisers started transmission at the same time then the maximum waiting time an advertiser had to experience was
and this time was reduced to
. The comparison of maximum delay with and without algorithm application can be seen in
Figure 12.
The scenario where all the advertising devices enter their advertising state to transmit advertising PDUs to an initiator in a dense environment was simulated. This result depicts that if all advertising devices have an intention of connection setup then how long will they have to wait. This delay truly has an impact on the overall BLE connection setup latency.
Figure 13 shows the results of the comparison of the total discovery time of all the advertisers in a dense environment when the discovery is done by the initiator. After the implementation of the algorithm, on average this value was decreased by
.
Figure 14 shows the comparison of average delay latency. For
devices, in the ordinary scenario, the average value of an advertiser to be discovered by an initiator was
, and after the implementation of the algorithm, this value was reduced to
. In
Figure 15, the comparison of maximum waiting time is done for before and after the algorithm implementation. For
devices the maximum time an advertiser had to wait before it received CONNECT_REQ was observed to be
. This value was reduced to
after the algorithm was applied.
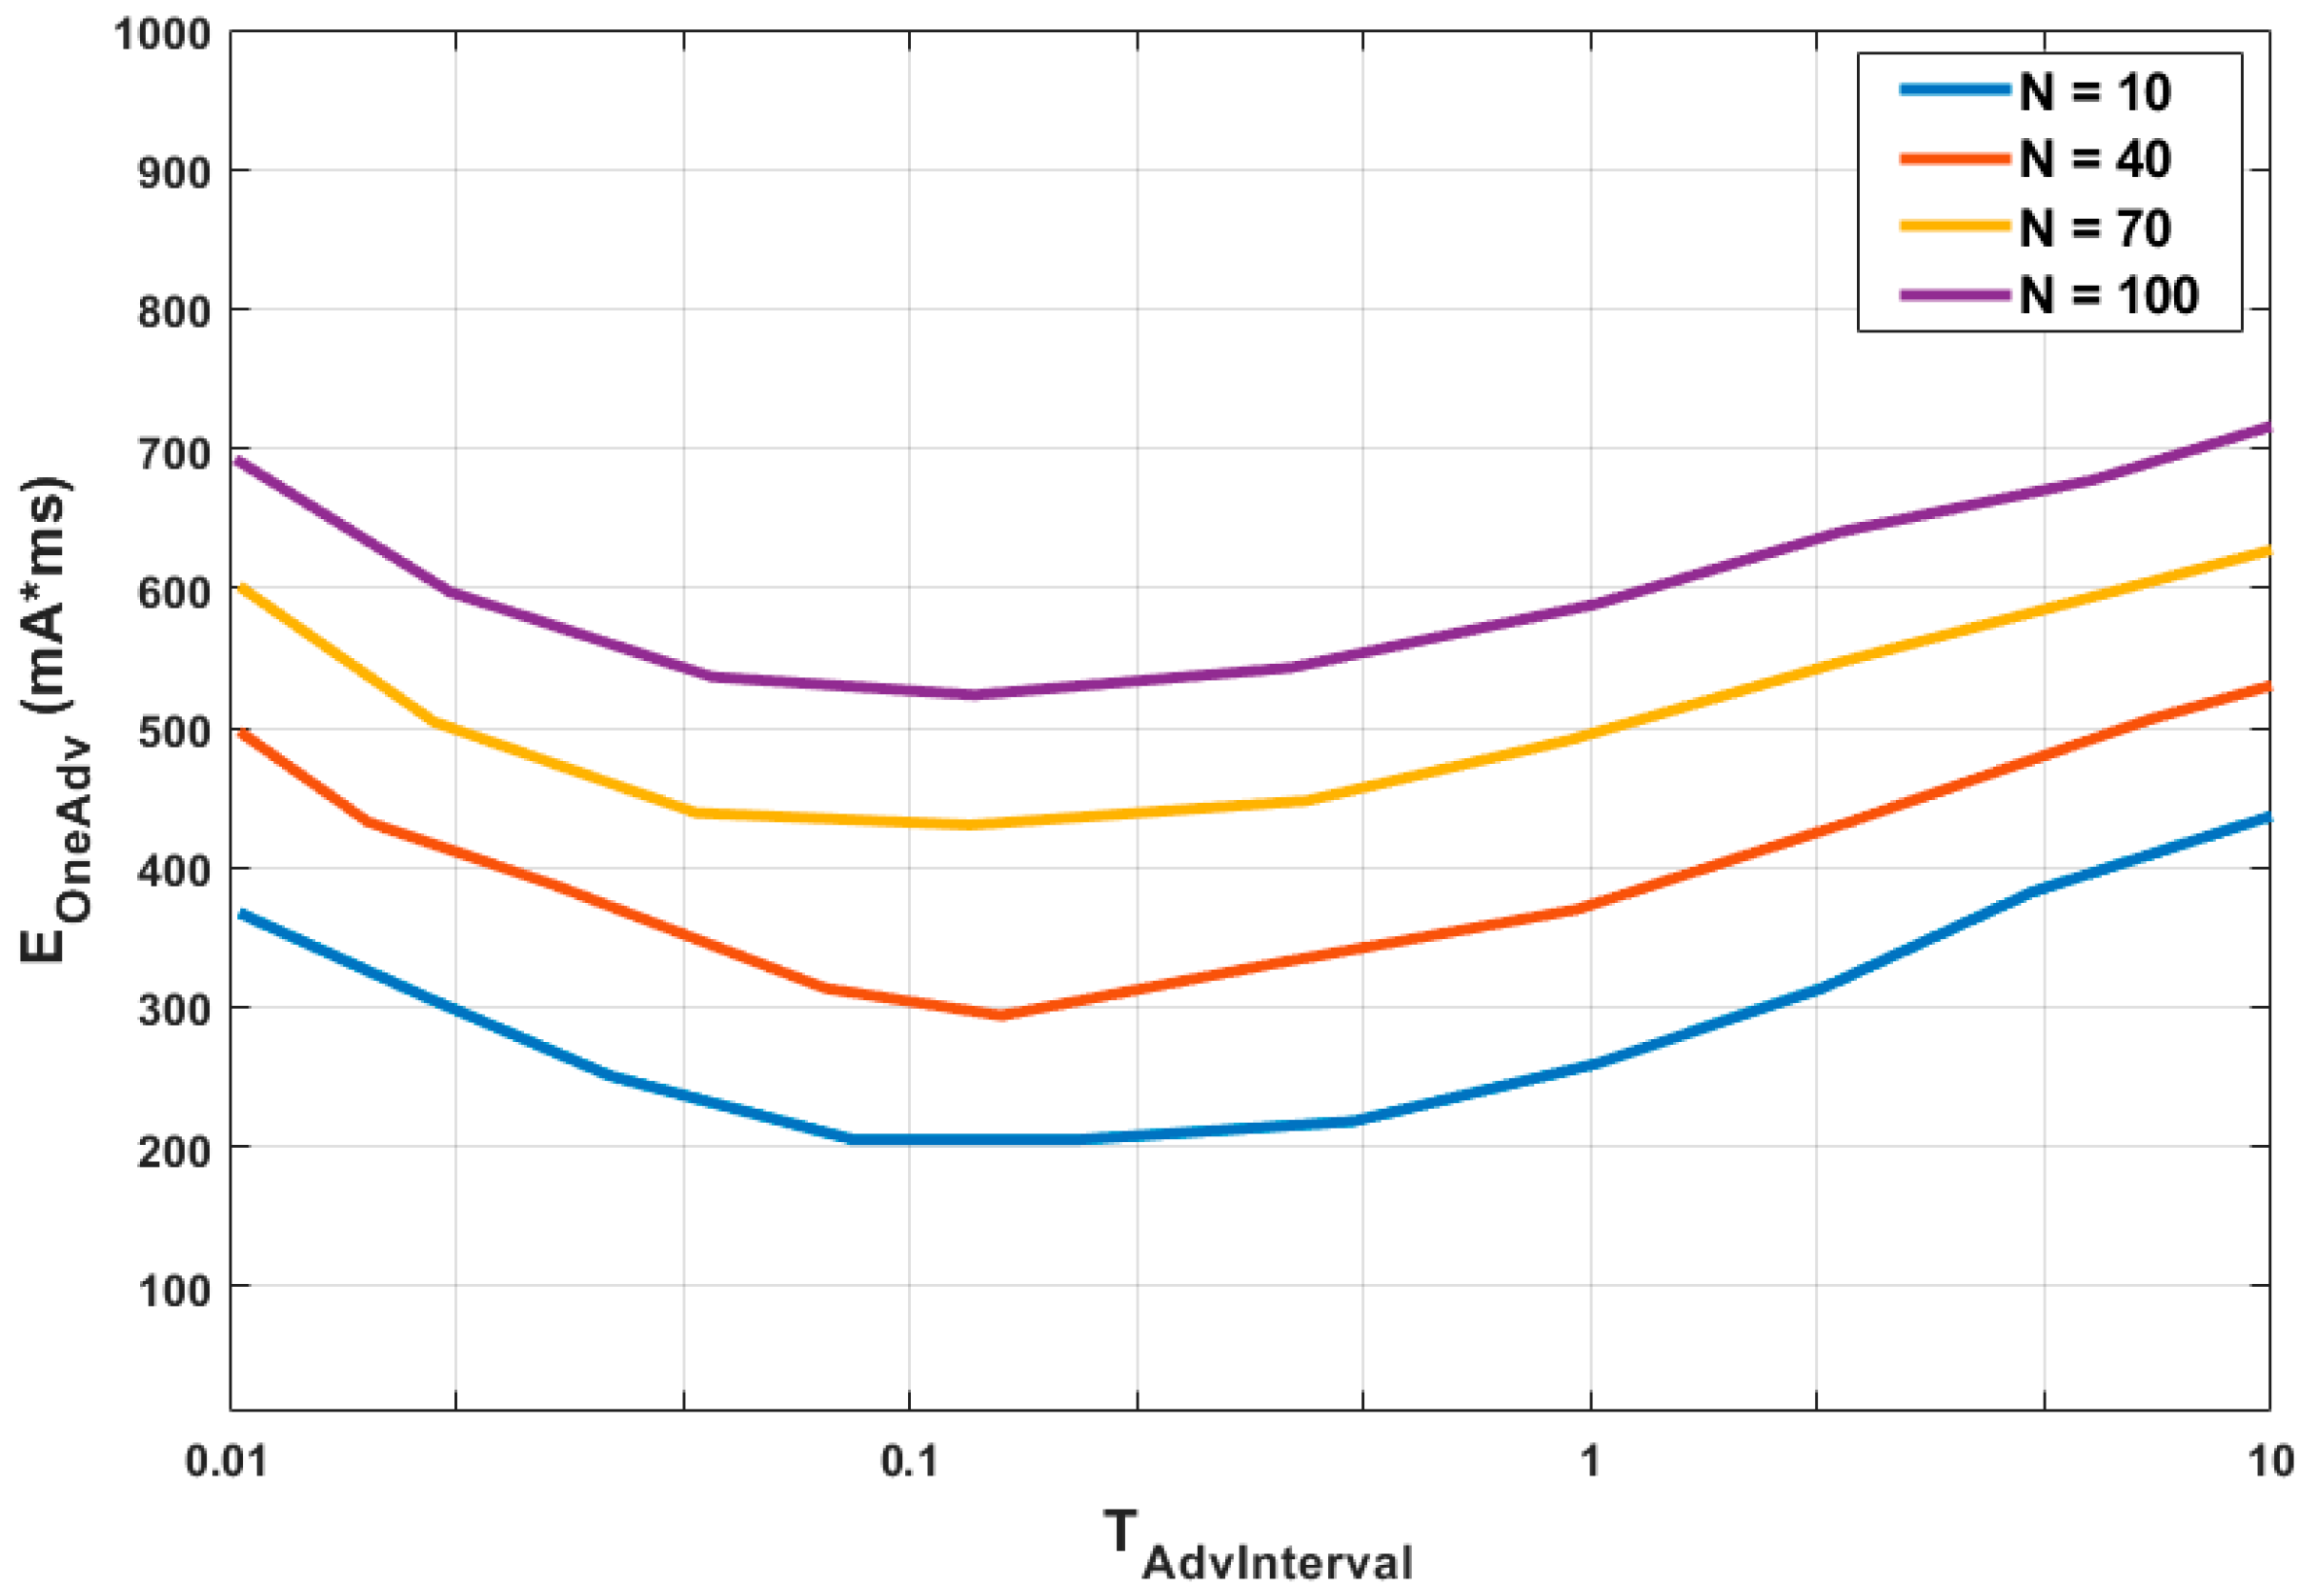
The energy consumption calculation is summarized in
Figure 16. The result shows the energy consumption profile by varying
for different values of
. As mentioned earlier for the energy consumption the model proposed in [
25] was used. According to this model the energy consumption of an advertiser for one advertisement interval is given as
. In
Figure 16 the energy consumption for the selected value of
is observed as the minima. According to the results it can be inferred that when
, the energy consumption is maximum. As the algorithm proceeds and arrives at the best value of
the energy consumption decreases. The reason for high energy consumption for
is the fact that when there is large number of
, more collisions will occur and hence the discovery process will take longer time and the energy consumption will increase. But as the best value of
is achieved we observe the reduction in the energy consumption. After this we again can see there is a rise in the energy consumption until the maximum value of
is reached which is
.
From all the results presented in this section, it can be concluded that the algorithm improved the delay of discovery in multiple setups. Depending upon the type of scanning device (i.e., scanner or initiator) and the density of devices in the vicinity, the improvement in average latency ranges from to . If the latency is improved, it implies that the system will end up being more energy efficient. Because the devices would have to spend lesser time in scanning and looking for other devices. These results are also promising for applications where advertising devices and scanning devices are expected to exchange information without any prior knowledge of each other’s existence.


