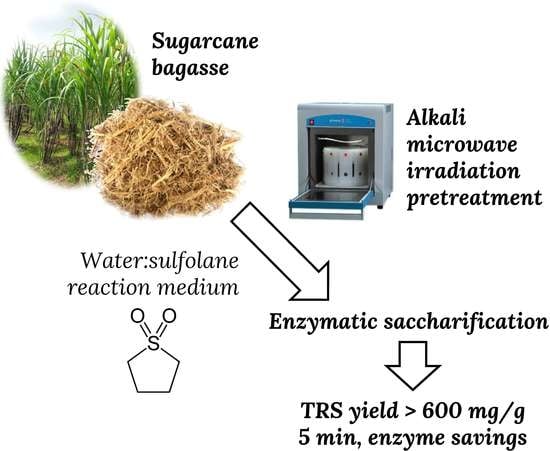
Sugarcane Bagasse Hydrolysis Enhancement by Microwave-Assisted Sulfolane Pretreatment

 ,
,  and
and 
Abstract
1. Introduction
2. Materials and Methods
2.1. Raw Materials and Reagents
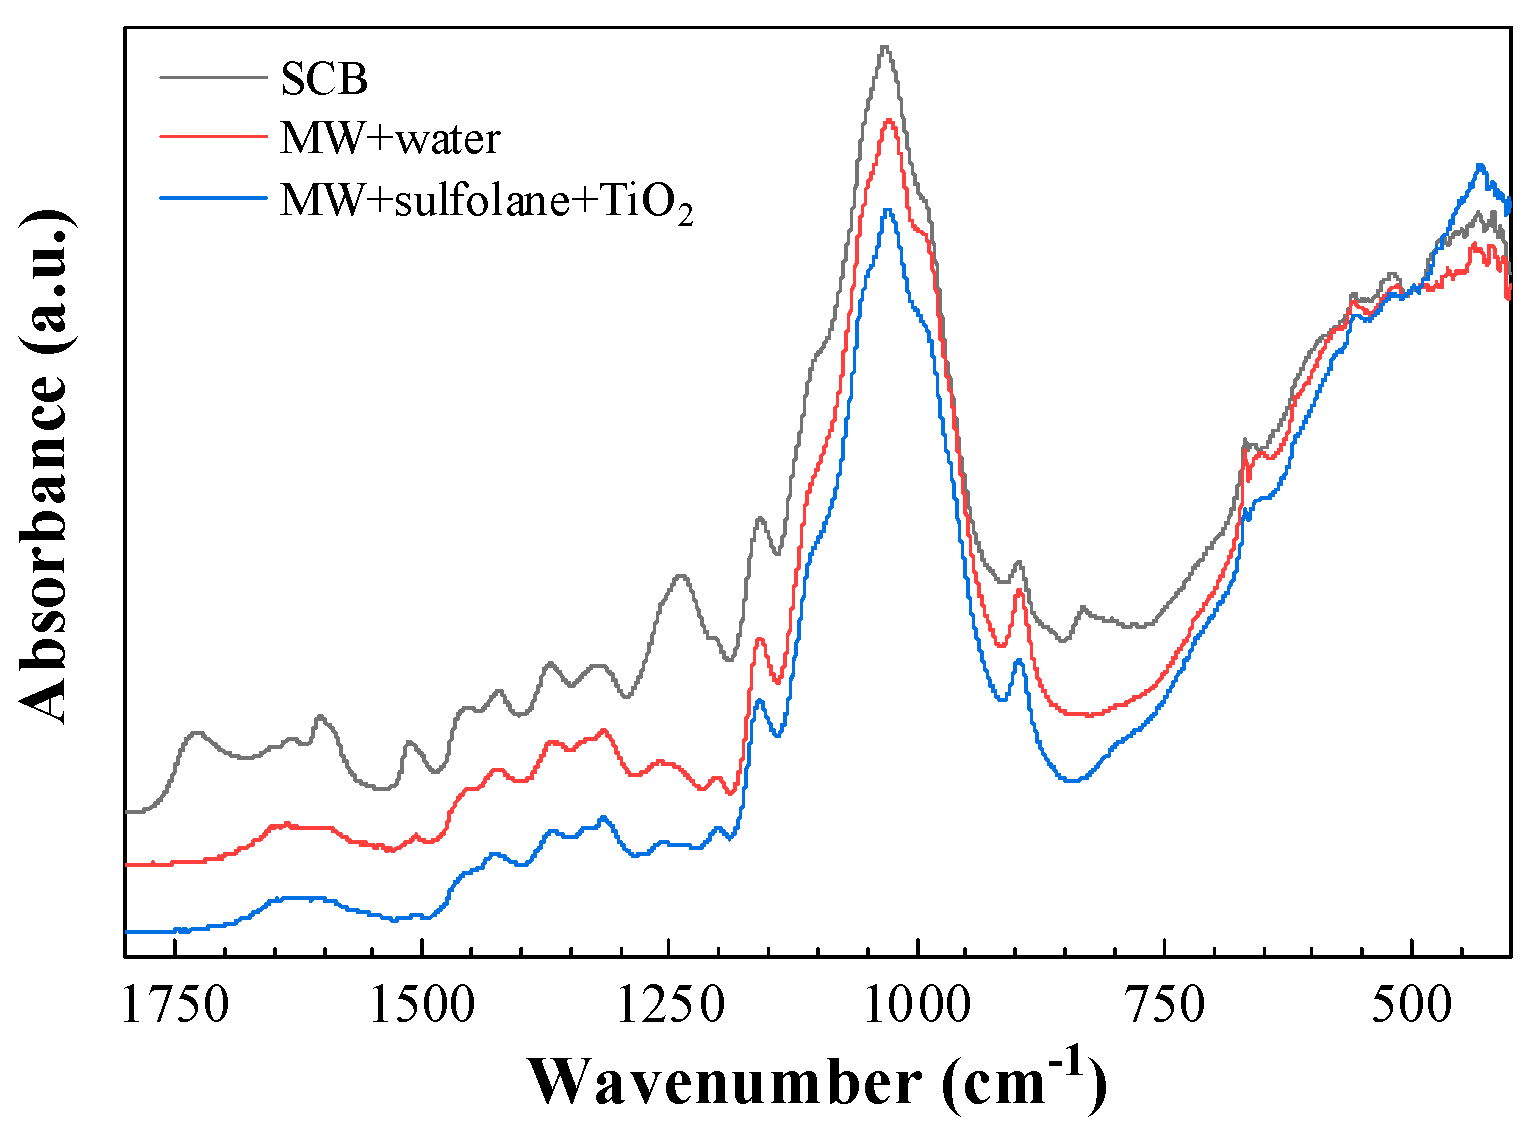
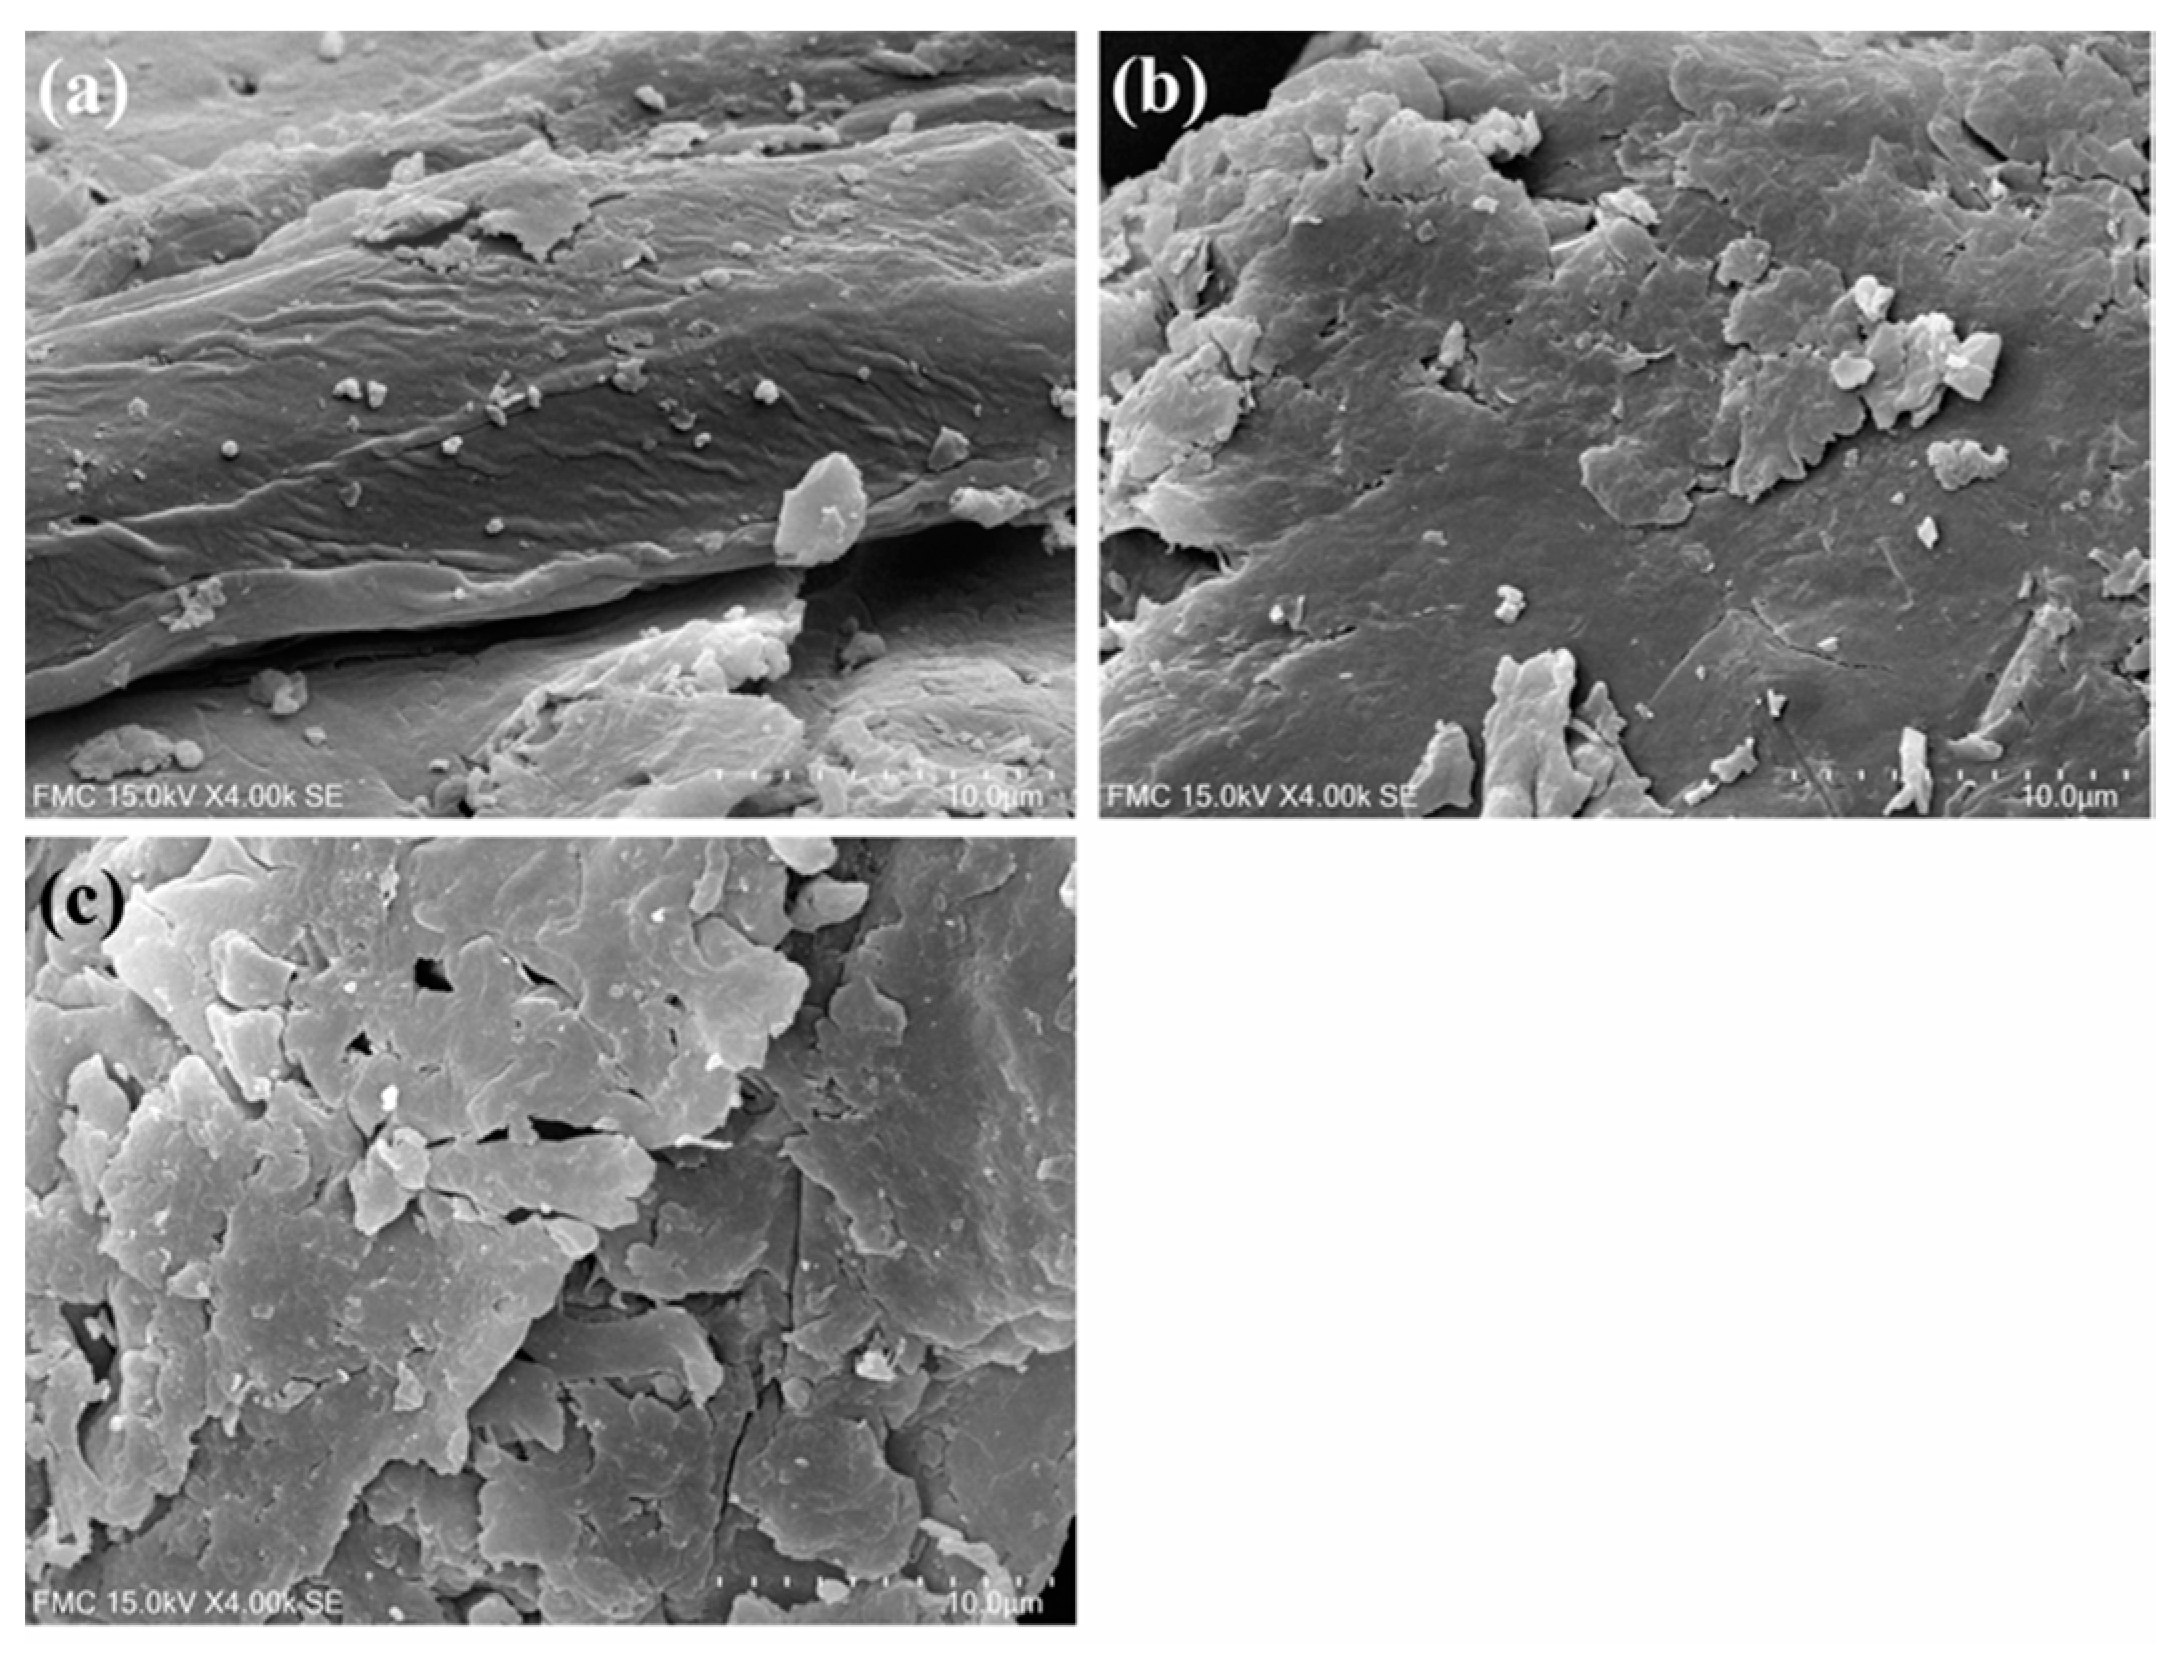
2.2. Vibrational and SEM Characterization
2.3. Organosolv on Alkali Microwave-Assisted Pretreatment
2.4. Enzymatic Hydrolysis
2.5. Total Reducing Sugars Measurements
2.6. Saccharinic Acid Measurements
2.7. Statistical Analysis
3. Results and Discussion
3.1. Vibrational and SEM Characterization
3.2. Influence of Sodium Hydroxide Concentration, Temperature and Reaction Time on TRS Yield
3.2.1. NaOH Concentration
3.2.2. Temperature
3.2.3. Reaction Time
3.3. Influence of Sodium Hydroxide Concentration, Temperature and Reaction Time on Saccharinic Acids Yield
3.3.1. NaOH Concentration
3.3.2. Temperature
3.3.3. Reaction Time
3.4. Effect of the Pretreatment Reaction Medium
3.4.1. TRS Yield
3.4.2. Saccharinic Acids
3.5. Comparison with Other Pretreatment Conditions Reported in the Literature
4. Conclusions
Author Contributions
Funding
Conflicts of Interest
Appendix A

| T (°C) | LS Means | Standard Error | Lower Bound (95%) | Upper Bound (95%) | Groups | ||||
| 120 | 42.921 | 0.159 | 42.608 | 43.235 | A | ||||
| 130 | 45.797 | 0.159 | 45.484 | 46.111 | B | ||||
| 140 | 47.656 | 0.159 | 47.343 | 47.969 | C | ||||
| NaOH (% w/v) | LS Means | Standard Error | Lower Bound (95%) | Upper Bound (95%) | Groups | ||||
| 0.5 | 32.602 | 0.183 | 32.240 | 32.964 | A | ||||
| 1 | 39.566 | 0.183 | 39.204 | 39.928 | B | ||||
| 3 | 52.956 | 0.183 | 52.594 | 53.318 | C | ||||
| 5 | 56.709 | 0.183 | 56.347 | 57.071 | D | ||||
| Time (min) | LS Means | Standard Error | Lower Bound (95%) | Upper Bound (95%) | Groups | ||||
| 15 | 44.471 | 0.205 | 44.066 | 44.875 | A | ||||
| 5 | 44.436 | 0.205 | 44.031 | 44.841 | A | ||||
| 30 | 45.453 | 0.205 | 45.049 | 45.858 | B | ||||
| 45 | 46.321 | 0.205 | 45.916 | 46.726 | C | ||||
| 60 | 46.610 | 0.205 | 46.205 | 47.015 | C | ||||
| T (°C) | LS Means | Standard Error | Lower Bound (95%) | Upper Bound (95%) | Groups | |||
| 120 | 3.188 | 0.015 | 3.160 | 3.217 | A | |||
| 130 | 4.902 | 0.015 | 4.874 | 4.931 | B | |||
| 140 | 5.978 | 0.015 | 5.949 | 6.007 | C | |||
| NaOH (% w/v) | LS Means | Standard Error | Lower Bound (95%) | Upper Bound (95%) | Groups | |||
| 0.5 | 2.945 | 0.017 | 2.911 | 2.978 | A | |||
| 1 | 3.827 | 0.017 | 3.794 | 3.860 | B | |||
| 3 | 4.661 | 0.017 | 4.627 | 4.694 | C | |||
| 5 | 7.326 | 0.017 | 7.293 | 7.359 | D | |||
| Time (min) | LS Means | Standard Error | Lower Bound (95%) | Upper Bound (95%) | Groups | |||
| 5 | 3.046 | 0.019 | 3.008 | 3.083 | A | |||
| 15 | 3.184 | 0.019 | 3.147 | 3.221 | B | |||
| 30 | 5.699 | 0.019 | 5.661 | 5.736 | C | |||
| 45 | 5.743 | 0.019 | 5.706 | 5.780 | C | |||
| 60 | 5.777 | 0.019 | 5.740 | 5.815 | ||||
References
- Rastogi, M.; Shrivastava, S. Recent advances in second generation bioethanol production: An insight to pretreatment, saccharification and fermentation processes. Renew. Sustain. Energy Rev. 2017, 80, 330–340. [Google Scholar] [CrossRef]
- Han, X.; Guo, Y.; Liu, X.; Xia, Q.; Wang, Y. Catalytic conversion of lignocellulosic biomass into hydrocarbons: A mini review. Catal. Today 2019, 319, 2–13. [Google Scholar] [CrossRef]
- Karimi, K.; Taherzadeh, M.J. A critical review on analysis in pretreatment of lignocelluloses: Degree of polymerization, adsorption/desorption, and accessibility. Bioresour. Technol. 2016, 203, 348–356. [Google Scholar] [CrossRef] [PubMed]
- Zabed, H.; Sahu, J.N.; Boyce, A.N.; Faruq, G. Fuel ethanol production from lignocellulosic biomass: An overview on feedstocks and technological approaches. Renew. Sustain. Energy Rev. 2016, 66, 751–774. [Google Scholar] [CrossRef]
- Robak, K.; Balcerek, M. Review of Second Generation Bioethanol Production from Residual Biomass. Food Technol. Biotechnol. 2018, 56, 174–187. [Google Scholar] [CrossRef]
- Mosier, N.; Wyman, C.; Dale, B.; Elander, R.; Lee, Y.Y.; Holtzapple, M.; Ladisch, M. Features of promising technologies for pretreatment of lignocellulosic biomass. Bioresour. Technol. 2005, 96, 673–686. [Google Scholar] [CrossRef] [PubMed]
- Sarker, T.C.; Azam, S.M.G.G.; Bonanomi, G. Recent Advances in Sugarcane Industry Solid By-Products Valorization. Waste Biomass Valoriz. 2017, 8, 241–266. [Google Scholar] [CrossRef]
- Kumar, M.; Olajire Oyedun, A.; Kumar, A. A review on the current status of various hydrothermal technologies on biomass feedstock. Renew. Sustain. Energy Rev. 2018, 81, 1742–1770. [Google Scholar] [CrossRef]
- Zhang, X.; Yuan, Q.; Cheng, G. Deconstruction of corncob by steam explosion pretreatment: Correlations between sugar conversion and recalcitrant structures. Carbohydr. Polym. 2017, 156, 351–356. [Google Scholar] [CrossRef] [PubMed]
- Aguilar-Reynosa, A.; Romaní, A.; Ma. Rodríguez-Jasso, R.; Aguilar, C.N.; Garrote, G.; Ruiz, H.A. Microwave heating processing as alternative of pretreatment in second-generation biorefinery: An overview. Energy Convers. Manag. 2017, 136, 50–65. [Google Scholar] [CrossRef]
- Liyakathali, N.A.M.; Muley, P.D.; Aita, G.; Boldor, D. Effect of frequency and reaction time in focused ultrasonic pretreatment of energy cane bagasse for bioethanol production. Bioresour. Technol. 2016, 200, 262–271. [Google Scholar] [CrossRef]
- Nair, R.B.; Kalif, M.; Ferreira, J.A.; Taherzadeh, M.J.; Lennartsson, P.R. Mild-temperature dilute acid pretreatment for integration of first and second generation ethanol processes. Bioresour. Technol. 2017, 245, 145–151. [Google Scholar] [CrossRef]
- Kim, J.S.; Lee, Y.Y.; Kim, T.H. A review on alkaline pretreatment technology for bioconversion of lignocellulosic biomass. Bioresour. Technol. 2016, 199, 42–48. [Google Scholar] [CrossRef]
- Zhang, Q.; Hu, J.; Lee, D.-J. Pretreatment of biomass using ionic liquids: Research updates. Renew. Energy 2017, 111, 77–84. [Google Scholar] [CrossRef]
- Chen, H.; Zhao, J.; Hu, T.; Zhao, X.; Liu, D. A comparison of several organosolv pretreatments for improving the enzymatic hydrolysis of wheat straw: Substrate digestibility, fermentability and structural features. Appl. Energy 2015, 150, 224–232. [Google Scholar] [CrossRef]
- Jönsson, L.J.; Martín, C. Pretreatment of lignocellulose: Formation of inhibitory by-products and strategies for minimizing their effects. Bioresour. Technol. 2016, 199, 103–112. [Google Scholar] [CrossRef]
- Moodley, P.; Kana, E.B.G. Development of a steam or microwave-assisted sequential salt-alkali pretreatment for lignocellulosic waste: Effect on delignification and enzymatic hydrolysis. Energy Convers. Manag. 2017, 148, 801–808. [Google Scholar] [CrossRef]
- Li, H.; Qu, Y.; Yang, Y.; Chang, S.; Xu, J. Microwave irradiation—A green and efficient way to pretreat biomass. Bioresour. Technol. 2016, 199, 34–41. [Google Scholar] [CrossRef]
- Mitani, T. Recent Progress on Microwave Processing of Biomass for Bioenergy Production. J. Jpn. Pet. Inst. 2018, 6, 113–120. [Google Scholar] [CrossRef]
- Zhu, Z.; Rezende, C.A.; Simister, R.; McQueen-Mason, S.J.; Macquarrie, D.J.; Polikarpov, I.; Gomez, L.D. Efficient sugar production from sugarcane bagasse by microwave assisted acid and alkali pretreatment. Biomass Bioenergy 2016, 93, 269–278. [Google Scholar] [CrossRef]
- Santo, M.E.; Rezende, C.A.; Bernardinelli, O.D.; Pereira, N.; Curvelo, A.A.S.; deAzevedo, E.R.; Guimarães, F.E.G.; Polikarpov, I. Structural and compositional changes in sugarcane bagasse subjected to hydrothermal and organosolv pretreatments and their impacts on enzymatic hydrolysis. Ind. Crops Prod. 2018, 113, 64–74. [Google Scholar] [CrossRef]
- Zhou, Z.; Lei, F.; Li, P.; Jiang, J. Lignocellulosic biomass to biofuels and biochemicals: A comprehensive review with a focus on ethanol organosolv pretreatment technology. Biotechnol Bioeng. 2018, 115, 2683–2702. [Google Scholar] [CrossRef] [PubMed]
- Borand, M.N.; Karaosmanoğlu, F. Effects of organosolv pretreatment conditions for lignocellulosic biomass in biorefinery applications: A review. J. Renew. Sustain. Energy 2018, 10, 33104. [Google Scholar] [CrossRef]
- Zhang, K.; Pei, Z.; Wang, D. Organic solvent pretreatment of lignocellulosic biomass for biofuels and biochemicals: A review. Bioresour. Technol. 2016, 199, 21–33. [Google Scholar] [CrossRef] [PubMed]
- Clark, E. Sulfolane and Sulfones. Kirk-Othmer Encycl. Chem. Technol. 2000. [Google Scholar] [CrossRef]
- Almond, M.; Suleiman, M.G.; Hawkins, M.; Winder, D.; Robshaw, T.; Waddoups, M.; Humphreys, P.N.; Laws, A.P. Developing cellulosic waste products as platform chemicals: Protecting group chemistry of α-glucoisosaccharinic acid. Carbohydr. Res. 2018, 455, 97–105. [Google Scholar] [CrossRef]
- Almond, M.; Belton, D.; Humphreys, P.N.; Laws, A.P. A study of the metal binding capacity of saccharinic acids formed during the alkali catalysed decomposition of cellulosic materials: Nickel complexation by glucoisosaccharinic acids and xyloisosaccharinic acids. Carbohydr. Res. 2016, 427, 48–54. [Google Scholar] [CrossRef]
- Popa, V. Biorefining as a possibility to increase the efficiency of pulp and paper. Celul. Şi Hârtie 2014, 63, 3–17. [Google Scholar]
- Teng, N.; Ni, J.; Chen, H.; Ren, Q.; Na, H.; Liu, X.; Zhang, R.; Zhu, J. Initiating Highly Effective Hydrolysis of Regenerated Cellulose by Controlling Transition of Crystal Form with Sulfolane under Microwave Radiation. ACS Sustain. Chem. Eng. 2016, 4, 1507–1511. [Google Scholar] [CrossRef]
- Ko, A.M.Y.; Somers, P.J. An improved method for the automated determination of meta- and iso-saccharinic acids. Carbohydr. Res. 1974, 33, 281–285. [Google Scholar] [CrossRef]
- Li, K.; Kobayashi, T. Applied Environmental Materials Science for Sustainability; IGI Global: Hershey, PA, USA, 2016; Chapter 15; pp. 327–346. [Google Scholar]
- Pan, G.X.; Bolton, J.L.; Leary, G.J. Determination of Ferulic and p-Coumaric Acids in Wheat Straw and the Amounts Released by Mild Acid and Alkaline Peroxide Treatment. J. Agric. Food Chem. 1998, 4, 5283–5288. [Google Scholar] [CrossRef]
- Saw, S.K.; Sarkhel, G.; Choudhury, A. Surface modification of coir fibre involving oxidation of lignins followed by reaction with furfuryl alcohol: Characterization and stability. Appl. Surf. Sci. 2011, 257, 3763–3769. [Google Scholar] [CrossRef]
- Xu, C.; Ferdosian, F. Conversion of Lignin into Bio-Based Chemicals and Materials; Springer: Berlin/Heidelberg, Germany, 2017; p. 164. [Google Scholar]
- Hoareau, W.; Trindade, W.G.; Siegmund, B.; Castellan, A.; Frollini, E. Sugar cane bagasse and curaua lignins oxidized by chlorine dioxide and reacted with furfuryl alcohol: Characterization and stability. Polym. Degrad. Stab. 2004, 86, 567–576. [Google Scholar] [CrossRef]
- Xie, W.-H.; Hu, B.-B.; Zhang, X.-B.; Yi, X.-M.; Tan, W.-X.; Zhu, M.-J. Enhanced Enzymatic Digestibility of Sugarcane Bagasse Pretreated by Ionic Liquids. J. Biobased Mater. Bioenergy 2015, 9, 493–501. [Google Scholar] [CrossRef]
- Chang, M.; Li, D.; Wang, W.; Chen, D.; Zhang, Y.; Hu, H.; Ye, X. Comparison of sodium hydroxide and calcium hydroxide pretreatments on the enzymatic hydrolysis and lignin recovery of sugarcane bagasse. Bioresour. Technol. 2017, 244, 1055–1058. [Google Scholar] [CrossRef]
- Singh, R.; Shukla, A.; Tiwari, S.; Srivastava, M. A review on delignification of lignocellulosic biomass for enhancement of ethanol production potential. Renew. Sustain. Energy Rev. 2014, 32, 713–728. [Google Scholar] [CrossRef]
- Hoşgün, E.Z.; Berikten, D.; Kıvanç, M.; Bozan, B. Ethanol production from hazelnut shells through enzymatic saccharification and fermentation by low-temperature alkali pretreatment. Fuel 2017, 196, 280–287. [Google Scholar] [CrossRef]
- Ostovareh, S.; Karimi, K.; Zamani, A. Efficient conversion of sweet sorghum stalks to biogas and ethanol using organosolv pretreatment. Ind. Crops Prod. 2015, 66, 170–177. [Google Scholar] [CrossRef]
- Koo, B.-W.; Kim, H.-Y.; Park, N.; Lee, S.-M.; Yeo, H.; Choi, I.-G. Organosolv pretreatment of Liriodendron tulipifera and simultaneous saccharification and fermentation for bioethanol production. Biomass Bioenergy 2011, 35, 1833–1840. [Google Scholar] [CrossRef]
- Wang, B.; Shen, X.-J.; Wen, J.-L.; Xiao, L.; Sun, R.-C. Evaluation of organosolv pretreatment on the structural characteristics of lignin polymers and follow-up enzymatic hydrolysis of the substrates from Eucalyptus wood. Int. J. Biol. Macromol. 2017, 97, 447–459. [Google Scholar] [CrossRef]
- Peng, H.; Chen, H.; Qu, Y.; Li, H.; Xu, J. Bioconversion of different sizes of microcrystalline cellulose pretreated by microwave irradiation with/without NaOH. Appl. Energy 2014, 117, 142–148. [Google Scholar] [CrossRef]
- Peng, H.; Li, H.; Luo, H.; Xu, J. A novel combined pretreatment of ball milling and microwave irradiation for enhancing enzymatic hydrolysis of microcrystalline cellulose. Bioresour. Technol. 2013, 130, 81–87. [Google Scholar] [CrossRef]
- Lai, L.W.; Idris, A. Comparison of steam-alkali-chemical and microwave-alkali pretreatment for enhancing the enzymatic saccharification of oil palm trunk. Renew. Energy 2016, 99, 738–746. [Google Scholar] [CrossRef]
- Podschun, J.; Saake, B.; Lehnen, R. Catalytic demethylation of organosolv lignin in aqueous medium using indium triflate under microwave irradiation. React. Funct. Polym. 2017, 119, 82–86. [Google Scholar] [CrossRef]
- Mithra, M.G.; Padmaja, G. Strategies for enzyme saving during saccharification of pretreated lignocellulo-starch biomass: Effect of enzyme dosage and detoxification chemicals. Heliyon 2017, 3, 384. [Google Scholar] [CrossRef][Green Version]
- Brondi, M.G.; Vasconcellos, V.M.; Giordano, R.C.; Farinas, C.S. Alternative Low-Cost Additives to Improve the Saccharification of Lignocellulosic Biomass. Appl. Biochem. Biotechnol. 2019, 187, 461–473. [Google Scholar] [CrossRef]
- Zhang, H.; Zhang, S.; Yuan, H.; Lyu, G.; Xie, J. FeCl3-catalyzed ethanol pretreatment of sugarcane bagasse boosts sugar yields with low enzyme loadings and short hydrolysis time. Bioresour. Technol. 2018, 249, 395–401. [Google Scholar] [CrossRef]
- You, Y.; Li, P.; Lei, F.; Xing, Y.; Jiang, J. Optimization of Enzymatic Hydrolysis on Sugarcane Bagasse Pretreated with Soda-Green Liquor and Methanol. J. Biobased Mater. Bioenergy 2017, 11, 433–440. [Google Scholar] [CrossRef]
- Xue, W.; Lei, F.; Li, P.; Jiang, J. Cellulose Accessibility and Zeta potentials of Sugarcane Bagasse Pretreated by Green Liquor and Ethanol for High Hydrolysis Efficiency. BioResources 2018, 13, 1510–1524. [Google Scholar] [CrossRef]
- Zhang, Z.; Doherty, W.O.S.; O’Hara, I.M. Integration of Salt-Induced Phase Separation with Organosolv Pretreatment for Clean Fractionation of Lignocellulosic Biomass. ACS Sustain. Chem. Eng. 2017, 5, 5284–5292. [Google Scholar] [CrossRef]
- Suriyachai, N.; Champreda, V.; Kraikul, N.; Techanan, W.; Laosiripojana, N. Fractionation of lignocellulosic biopolymers from sugarcane bagasse using formic acid-catalyzed organosolv process. 3 Biotech 2018, 8, 221. [Google Scholar] [CrossRef] [PubMed]
- Gurgel, L.V.A.; Pimenta, M.T.B.; Curvelo, A.A.d.S. Ethanol–water organosolv delignification of liquid hot water (LHW) pretreated sugarcane bagasse enhanced by high–pressure carbon dioxide (HP–CO2). Ind. Crops Prod. 2016, 94, 942–950. [Google Scholar] [CrossRef]
- Suriyachai, N.; Champreda, V.; Sakdaronnarong, C.; Shotipruk, A.; Laosiripojana, N. Sequential organosolv fractionation/hydrolysis of sugarcane bagasse: The coupling use of heterogeneous H3PO4-activated carbon as acid promoter and hydrolysis catalyst. Renew. Energy 2017, 113, 1141–1148. [Google Scholar] [CrossRef]
- Timung, R.; Deshavath, N.N.; Goud, V.V.; Dasu, V.V. Effect of Subsequent Dilute Acid and Enzymatic Hydrolysis on Reducing Sugar Production from Sugarcane Bagasse and Spent Citronella Biomass. J. Energy 2016, 2016, 1–12. [Google Scholar] [CrossRef]
- Lv, X.; Lin, J.; Luo, L.; Zhang, D.; Lei, S.; Xiao, W.; Xu, Y.; Gong, Y.; Liu, Z. Enhanced enzymatic saccharification of sugarcane bagasse pretreated by sodium methoxide with glycerol. Bioresour. Technol. 2018, 249, 226–233. [Google Scholar] [CrossRef] [PubMed]
- Wei, W.; Wu, S.; Xu, S. Enhancement of enzymatic saccharification of bagasse by ethanol-based organosolv auto-catalyzed pretreatment. J. Chem. Technol. Biotechnol. 2017, 92, 580–587. [Google Scholar] [CrossRef]
- Rabelo, S.C.; Filho, R.M.; Costa, A.C. A comparison between lime and alkaline hydrogen peroxide pretreatments of sugarcane bagasse for ethanol production. Appl. Biochem. Biotechnol. 2008, 144, 87–100. [Google Scholar] [CrossRef] [PubMed]


| Pretreatment | T (°C) | NaOH Concentration (% w/v) | TRS Yield (%) | ||||
|---|---|---|---|---|---|---|---|
| 5 min | 15 min | 30 min | 45 min | 60 min | |||
| MW-A only (without sulfolane-TiO2) | 120 | 0.5 | 29.7 ± 1.08 | 29.5 ± 2.13 | 30.0 ± 0.92 | 30.7 ± 1.28 | 31.0 ± 2.43 |
| 1 | 35.2 ± 1.21 | 35.3 ± 0.33 | 36.4 ± 1.02 | 36.9 ± 1.34 | 37.4 ± 1.11 | ||
| 3 | 49.0 ± 2.47 | 49.3 ± 0.51 | 50.9 ± 1.50 | 52.0 ± 0.58 | 52.2 ± 1.04 | ||
| 5 | 53.5 ± 1.99 | 53.0 ± 2.36 | 54.4 ± 0.19 | 55.8 ± 0.92 | 56.1 ± 0.51 | ||
| 130 | 0.5 | 31.5 ± 0.42 | 31.5 ± 1.81 | 32.1 ± 0.58 | 32.6 ± 0.92 | 32.9 ± 1.02 | |
| 1 | 39.1 ± 0.63 | 39.5 ± 0.98 | 40.7 ± 1.36 | 41.8 ± 0.73 | 42.0 ± 0.67 | ||
| 3 | 52.4 ± 1.79 | 53.0 ± 1.51 | 53.3 ± 1.79 | 54.7 ± 1.06 | 55.0 ± 2.39 | ||
| 5 | 56.1 ± 1.58 | 56.0 ± 2.37 | 57.0 ± 0.54 | 57.2 ± 1.51 | 57.4 ± 1.42 | ||
| 140 | 0.5 | 35.0 ± 1.27 | 35.0 ± 1.20 | 35.4 ± 1.67 | 35.7 ± 0.19 | 36.2 ± 0.26 | |
| 1 | 40.8 ± 0.73 | 40.6 ± 0.70 | 41.9 ± 0.98 | 42.6 ± 0.33 | 43.3 ± 1.04 | ||
| 3 | 53.3 ± 0.51 | 53.0 ± 0.17 | 54.2 ± 0.75 | 55.7 ± 0.60 | 56.3 ± 1.44 | ||
| 5 | 58.0 ± 0.26 | 57.6 ± 0.29 | 59.0 ± 0.35 | 60.0 ± 0.98 | 59.5 ± 1.60 | ||
| MW-A + Sulfolane-TiO2 | 120 | 0.5 | 30.4 ± 1.75 | 30.6 ± 1.94 | 31.2 ± 0.67 | 31.6 ± 0.77 | 32.0 ± 2.07 |
| 1 | 36.9 ± 0.70 | 36.8 ± 0.42 | 37.9 ± 0.19 | 38.3 ± 0.79 | 38.5 ± 0.26 | ||
| 3 | 52.4 ± 0.77 | 52.0 ± 0.51 | 53.4 ± 0.60 | 54.7 ± 0.88 | 55.0 ± 0.17 | ||
| 5 | 55.3 ± 0.67 | 56.7 ± 0.48 | 57.8 ± 0.33 | 58.0 ± 0.96 | 57.8 ± 0.88 | ||
| 130 | 0.5 | 33.9 ± 0.84 | 33.6 ± 0.35 | 34.7 ± 1.44 | 35.0 ± 0.92 | 35.3 ± 0.86 | |
| 1 | 42.3 ± 0.88 | 42.0 ± 1.17 | 42.7 ± 0.75 | 44.1 ± 2.81 | 44.4 ± 1.64 | ||
| 3 | 55.3 ± 1.18 | 55.7 ± 0.92 | 56.8 ± 1.21 | 57.0 ± 1.11 | 57.6 ± 1.18 | ||
| 5 | 61.1 ± 0.44 | 60.8 ± 1.07 | 62.1 ± 0.48 | 63.6 ± 0.79 | 63.9 ± 1.37 | ||
| 140 | 0.5 | 35.9 ± 0.95 | 36.2 ± 0.92 | 36.5 ± 0.60 | 37.1 ± 0.77 | 37.8 ± 1.34 | |
| 1 | 44.2 ± 0.92 | 43.7 ± 0.63 | 44.1 ± 0.63 | 45.1 ± 0.39 | 44.9 ± 0.86 | ||
| 3 | 56.1 ± 0.19 | 56.5 ± 0.77 | 57.6 ± 0.93 | 58.0 ± 0.60 | 61.1 ± 0.79 | ||
| 5 | 62.9 ± 0.77 | 62.8 ± 0.77 | 64.1 ± 0.58 | 64.6 ± 0.87 | 64.8 ± 0.35 | ||
| T (°C) | LS Means | Standard Error | Lower Bound (95%) | Upper Bound (95%) | Groups | |||
| 120 | 44.865 | 0.139 | 44.590 | 45.140 | A | |||
| 130 | 49.094 | 0.139 | 48.819 | 49.369 | B | |||
| 140 | 50.702 | 0.139 | 50.427 | 50.977 | C | |||
| NaOH (% w/v) | LS Means | Standard Error | Lower Bound (95%) | Upper Bound (95%) | Groups | |||
| 0.5 | 34.116 | 0.161 | 33.799 | 34.434 | A | |||
| 1 | 41.729 | 0.161 | 41.412 | 42.047 | B | |||
| 3 | 55.951 | 0.161 | 55.633 | 56.268 | C | |||
| 5 | 61.085 | 0.161 | 60.768 | 61.403 | D | |||
| Time (min) | LS Means | Standard Error | Lower Bound (95%) | Upper Bound (95%) | Groups | |||
| 5 | 47.226 | 0.180 | 46.871 | 47.581 | A | |||
| 15 | 47.285 | 0.180 | 46.930 | 47.640 | A | |||
| 30 | 48.241 | 0.180 | 47.886 | 48.596 | B | |||
| 45 | 48.924 | 0.180 | 48.568 | 49.279 | B | C | ||
| 60 | 49.427 | 0.180 | 49.072 | 49.782 | C | |||
| Pretreatment | T (°C) | NaOH Concentration (% w/v) | Saccharinic Acids (g/L) | ||||
|---|---|---|---|---|---|---|---|
| 5 min | 15 min | 30 min | 45 min | 60 min | |||
| MW-A only (without sulfolane-TiO2) | 120 | 0.5 | 1.19 ± 0.04 | 1.41 ± 0.10 | 2.44 ± 0.17 | 2.51 ± 0.17 | 2.42 ± 0.12 |
| 1 | 1.75 ± 0.18 | 2.12 ± 0.09 | 2.93 ± 0.22 | 3.01 ± 0.04 | 3.05 ± 0.16 | ||
| 3 | 2.18 ± 0.14 | 2.34 ± 0.07 | 3.44 ± 0.07 | 3.52 ± 0.14 | 3.56 ± 0.08 | ||
| 5 | 3.86 ± 0.04 | 3.82 ± 0.14 | 6.05 ± 0.04 | 5.99 ± 0.07 | 6.20 ± 0.04 | ||
| 130 | 0.5 | 2.02 ± 0.10 | 2.16 ± 0.06 | 3.95 ± 0.10 | 4.07 ± 0.00 | 4.15 ± 0.05 | |
| 1 | 2.10 ± 0.11 | 2.32 ± 0.13 | 5.57 ± 0.10 | 5.65 ± 0.14 | 5.61 ± 0.07 | ||
| 3 | 2.30 ± 0.07 | 2.77 ± 0.05 | 6.60 ± 0.13 | 6.38 ± 0.06 | 6.64 ± 0.12 | ||
| 5 | 6.34 ± 0.15 | 6.30 ± 0.06 | 7.64 ± 0.18 | 7.70 ± 0.10 | 7.76 ± 0.12 | ||
| 140 | 0.5 | 2.34 ± 0.04 | 2.26 ± 0.10 | 4.35 ± 0.14 | 4.47 ± 0.09 | 4.43 ± 0.03 | |
| 1 | 2.50 ± 0.15 | 2.44 ± 0.08 | 6.08 ± 0.10 | 6.12 ± 0.10 | 6.16 ± 0.10 | ||
| 3 | 2.93 ± 0.04 | 3.09 ± 0.05 | 8.02 ± 0.09 | 8.10 ± 0.06 | 8.06 ± 0.10 | ||
| 5 | 7.05 ± 0.14 | 7.19 ± 0.11 | 11.31 ± 0.10 | 11.39 ± 0.09 | 11.29 ± 0.29 | ||
| MW-A + sulfolane-TiO2 | 120 | 0.5 | 2.81 ± 0.21 | 2.91 ± 0.48 | 4.57 ± 0.12 | 4.37 ± 0.18 | 4.49 ± 0.02 |
| 1 | 3.03 ± 0.17 | 3.17 ± 0.15 | 4.98 ± 0.31 | 5.08 ± 0.22 | 4.94 ± 0.32 | ||
| 3 | 3.22 ± 0.13 | 3.36 ± 0.10 | 5.61 ± 0.18 | 5.67 ± 0.19 | 5.71 ± 0.12 | ||
| 5 | 5.73 ± 0.12 | 5.85 ± 0.20 | 8.04 ± 0.09 | 8.18 ± 0.18 | 8.14 ± 0.30 | ||
| 130 | 0.5 | 2.89 ± 0.21 | 3.22 ± 0.08 | 5.20 ± 0.10 | 5.22 ± 0.00 | 5.32 ± 0.19 | |
| 1 | 3.13 ± 0.22 | 3.30 ± 0.16 | 6.54 ± 0.16 | 6.64 ± 0.31 | 6.68 ± 0.14 | ||
| 3 | 3.54 ± 0.28 | 3.88 ± 0.28 | 7.45 ± 0.25 | 7.60 ± 0.21 | 7.56 ± 0.29 | ||
| 5 | 7.66 ± 0.15 | 7.86 ± 0.34 | 10.52 ± 0.22 | 10.48 ± 0.21 | 10.68 ± 0.10 | ||
| 140 | 0.5 | 3.32 ± 0.26 | 3.56 ± 0.19 | 5.85 ± 0.08 | 5.81 ± 0.12 | 5.93 ± 0.20 | |
| 1 | 3.64 ± 0.08 | 3.88 ± 0.20 | 7.13 ± 0.16 | 7.27 ± 0.16 | 7.17 ± 0.14 | ||
| 3 | 3.88 ± 0.09 | 3.95 ± 0.12 | 8.93 ± 0.15 | 9.00 ± 0.13 | 9.14 ± 0.08 | ||
| 5 | 8.25 ± 0.14 | 8.41 ± 0.26 | 15.08 ± 0.11 | 14.92 ± 0.07 | 15.24 ± 0.19 | ||
| T (°C) | LS Means | Standard Error | Lower Bound (95%) | Upper Bound (95%) | Groups | |||
| 120 | 4.992 | 0.025 | 4.942 | 5.042 | A | |||
| 130 | 6.268 | 0.025 | 6.218 | 6.318 | B | |||
| 140 | 7.518 | 0.025 | 7.468 | 7.568 | C | |||
| NaOH (% w/v) | LS Means | Standard Error | Lower Bound (95%) | Upper Bound (95%) | Groups | |||
| 0.5 | 4.364 | 0.029 | 4.306 | 4.421 | A | |||
| 1 | 5.104 | 0.029 | 5.046 | 5.162 | B | |||
| 3 | 5.901 | 0.029 | 5.843 | 5.958 | C | |||
| 5 | 9.669 | 0.029 | 9.612 | 9.727 | D | |||
| Time (min) | LS Means | Standard Error | Lower Bound (95%) | Upper Bound (95%) | Groups | |||
| 5 | 4.259 | 0.033 | 4.194 | 4.323 | A | |||
| 15 | 4.446 | 0.033 | 4.382 | 4.511 | B | |||
| 30 | 7.490 | 0.033 | 7.426 | 7.555 | C | |||
| 45 | 7.520 | 0.033 | 7.455 | 7.584 | C | |||
| 60 | 7.582 | 0.033 | 7.518 | 7.647 | C | |||
| Contrast | Difference | Standardized Difference | Critical Value | Pr > Diff | Significant | |
| 2 vs. 1 | −2.762 | −20.155 | 1.967 | <0.0001 | Yes | |
| Tukey’s d critical value: | 2.781 | |||||
| Category | LS Means | Standard Error | Lower Bound (95%) | Upper Bound (95%) | Groups | |
| 2 | 45.458 | 0.097 | 45.268 | 45.649 | A | |
| 1 | 48.220 | 0.097 | 48.030 | 48.411 | B | |
| Contrast | Difference | Standardized Difference | Critical Value | Pr > Diff | Significant | |
| 2 vs. 1 | −1.570 | −63.626 | 1.969 | <0.0001 | Yes | |
| Tukey’s d critical value: | 2.785 | |||||
| Category | LS Means | Standard Error | Lower Bound (95%) | Upper Bound (95%) | Groups | |
| 2 | 4.690 | 0.017 | 4.655 | 4.724 | A | |
| 1 | 6.259 | 0.017 | 6.225 | 6.294 | B | |
| Pretreatment | Saccharification Conditions | Yield | Reference | |||
|---|---|---|---|---|---|---|
| Reaction Medium and Catalysts | T (°C) | Time (min) | Glucose (%) | TRS (mg/g) | ||
| Methanol (65% w/v) + soda-green liquor (1.5 mL/g substrate) | 120 | 180 | Enzymatic hydrolysis with 18 FPU cellulases/g biomass, at 50 °C for 72 h | 95.7 | 747.4 * | [50] |
| Ethanol:H2O (60:40, v/v) + FeCl3 (0.025 mol·L−1) | 160 | 60 | Enzymatic hydrolysis with 20 FPU cellulase/g dried substrate, at 50 °C for 72 h | 93.8 | 732.6 * | [49] |
| Enzymatic hydrolysis with 20 FPU cellulase/g dried substrate + Tween-80 (150 mg/g substrate), at 50 °C for 6 h | 92.5 | 722.4 * | ||||
| Ethanol:water (50:50, v/v) + green liquor (mainly sodium carbonate and sodium hydroxide, 0.5–1.5 mL/g dry substrate) + anthraquinone (0.1% w/v) | 120 | 180 | Enzymatic hydrolysis with 12 FPU cellulases/g biomass + 18 CBU cellobiase/g biomass, 48 °C, 72 h | 94.6 | 738.8 * | [51] |
| Biphasic solution of n-propanol (588 g/kg), water (400 g/kg) and H2SO4 (12 g/kg) + (NH4)2SO4 (400 g/kg) to promote formation of a biphasic solution | 140 | 90 | Enzymatic hydrolysis with 20 FPU cellulases/g biomass, at 50 °C for 72 h | 86.1 | 672.4 * | [52] |
| Water/ethanol/ethyl acetate/formic acid (43:20:16:21% v/v) | 160 | 40 | Enzymatic hydrolysis with 15 FPU cellulases/g biomass, at 50 °C for 72 h | 84.5 | 659.9 * | [53] |
| Water:sulfolane (1:1 v/v) + TiO2 (0.2% w/v), NaOH 5% | 140 | 5 | Enzymatic hydrolysis with 10 FPU cellulase/g dried substrate, at 50 °C for 72 h | 80.5 * | 629.0 | This study |
| Water, NaOH 5% | 74.3 * | 580.0 | ||||
| Ethanol: Water (1:1, v/v) + high-pressure CO2 (6.8 MPa) + additional liquid hot water pretreatment at 180 °C for 20 min. | 112 | 45 | Enzymatic hydrolysis with 10 FPU of cellulases/g biomass + 20 IU β-glucosidase/g biomass, at 50 °C for 72 h | 63.7 | 497.5 * | [54] |
| Methyl isobutyl ketone (MIBK): Methanol: Water (16:68:16, v/v) + H3PO4 (5% w/w) activated carbon | 180 | 60 | Hot compressed water at 225 °C, 10 min | 58.3 | 455.3 * | [55] |
| H2SO4 (0.1 M) | 120 | 120 | Enzymatic hydrolysis with 10 FPU cellulases/g biomass, at 50 °C for 48 h | 57.9 * | 452.3 | [56] |
| CH3ONa (0.6% w/w) + 80% glycerol | 130 | 60 | Enzymatic hydrolysis with 6 FPU cellulases/g biomass + 6.3 U of xylanase/g biomass, at 45 °C for 72 h | 48.0 | 374.9 * | [57] |
| Ethanol: Water (40:60, v/v) | 195 | 30 | Enzymatic hydrolysis with 10 FPU cellulases/g biomass, at 50 °C for 60 h | 40.3 | 314.7 * | [58] |
© 2019 by the authors. Licensee MDPI, Basel, Switzerland. This article is an open access article distributed under the terms and conditions of the Creative Commons Attribution (CC BY) license (http://creativecommons.org/licenses/by/4.0/).
Share and Cite
Portero-Barahona, P.; Carvajal-Barriga, E.J.; Martín-Gil, J.; Martín-Ramos, P. Sugarcane Bagasse Hydrolysis Enhancement by Microwave-Assisted Sulfolane Pretreatment. Energies 2019, 12, 1703. https://doi.org/10.3390/en12091703
Portero-Barahona P, Carvajal-Barriga EJ, Martín-Gil J, Martín-Ramos P. Sugarcane Bagasse Hydrolysis Enhancement by Microwave-Assisted Sulfolane Pretreatment. Energies. 2019; 12(9):1703. https://doi.org/10.3390/en12091703
Chicago/Turabian StylePortero-Barahona, Patricia, Enrique Javier Carvajal-Barriga, Jesús Martín-Gil, and Pablo Martín-Ramos. 2019. "Sugarcane Bagasse Hydrolysis Enhancement by Microwave-Assisted Sulfolane Pretreatment" Energies 12, no. 9: 1703. https://doi.org/10.3390/en12091703
APA StylePortero-Barahona, P., Carvajal-Barriga, E. J., Martín-Gil, J., & Martín-Ramos, P. (2019). Sugarcane Bagasse Hydrolysis Enhancement by Microwave-Assisted Sulfolane Pretreatment. Energies, 12(9), 1703. https://doi.org/10.3390/en12091703