Virtual Prototyping of Axial Piston Machines: Numerical Method and Experimental Validation


Abstract
1. Introduction
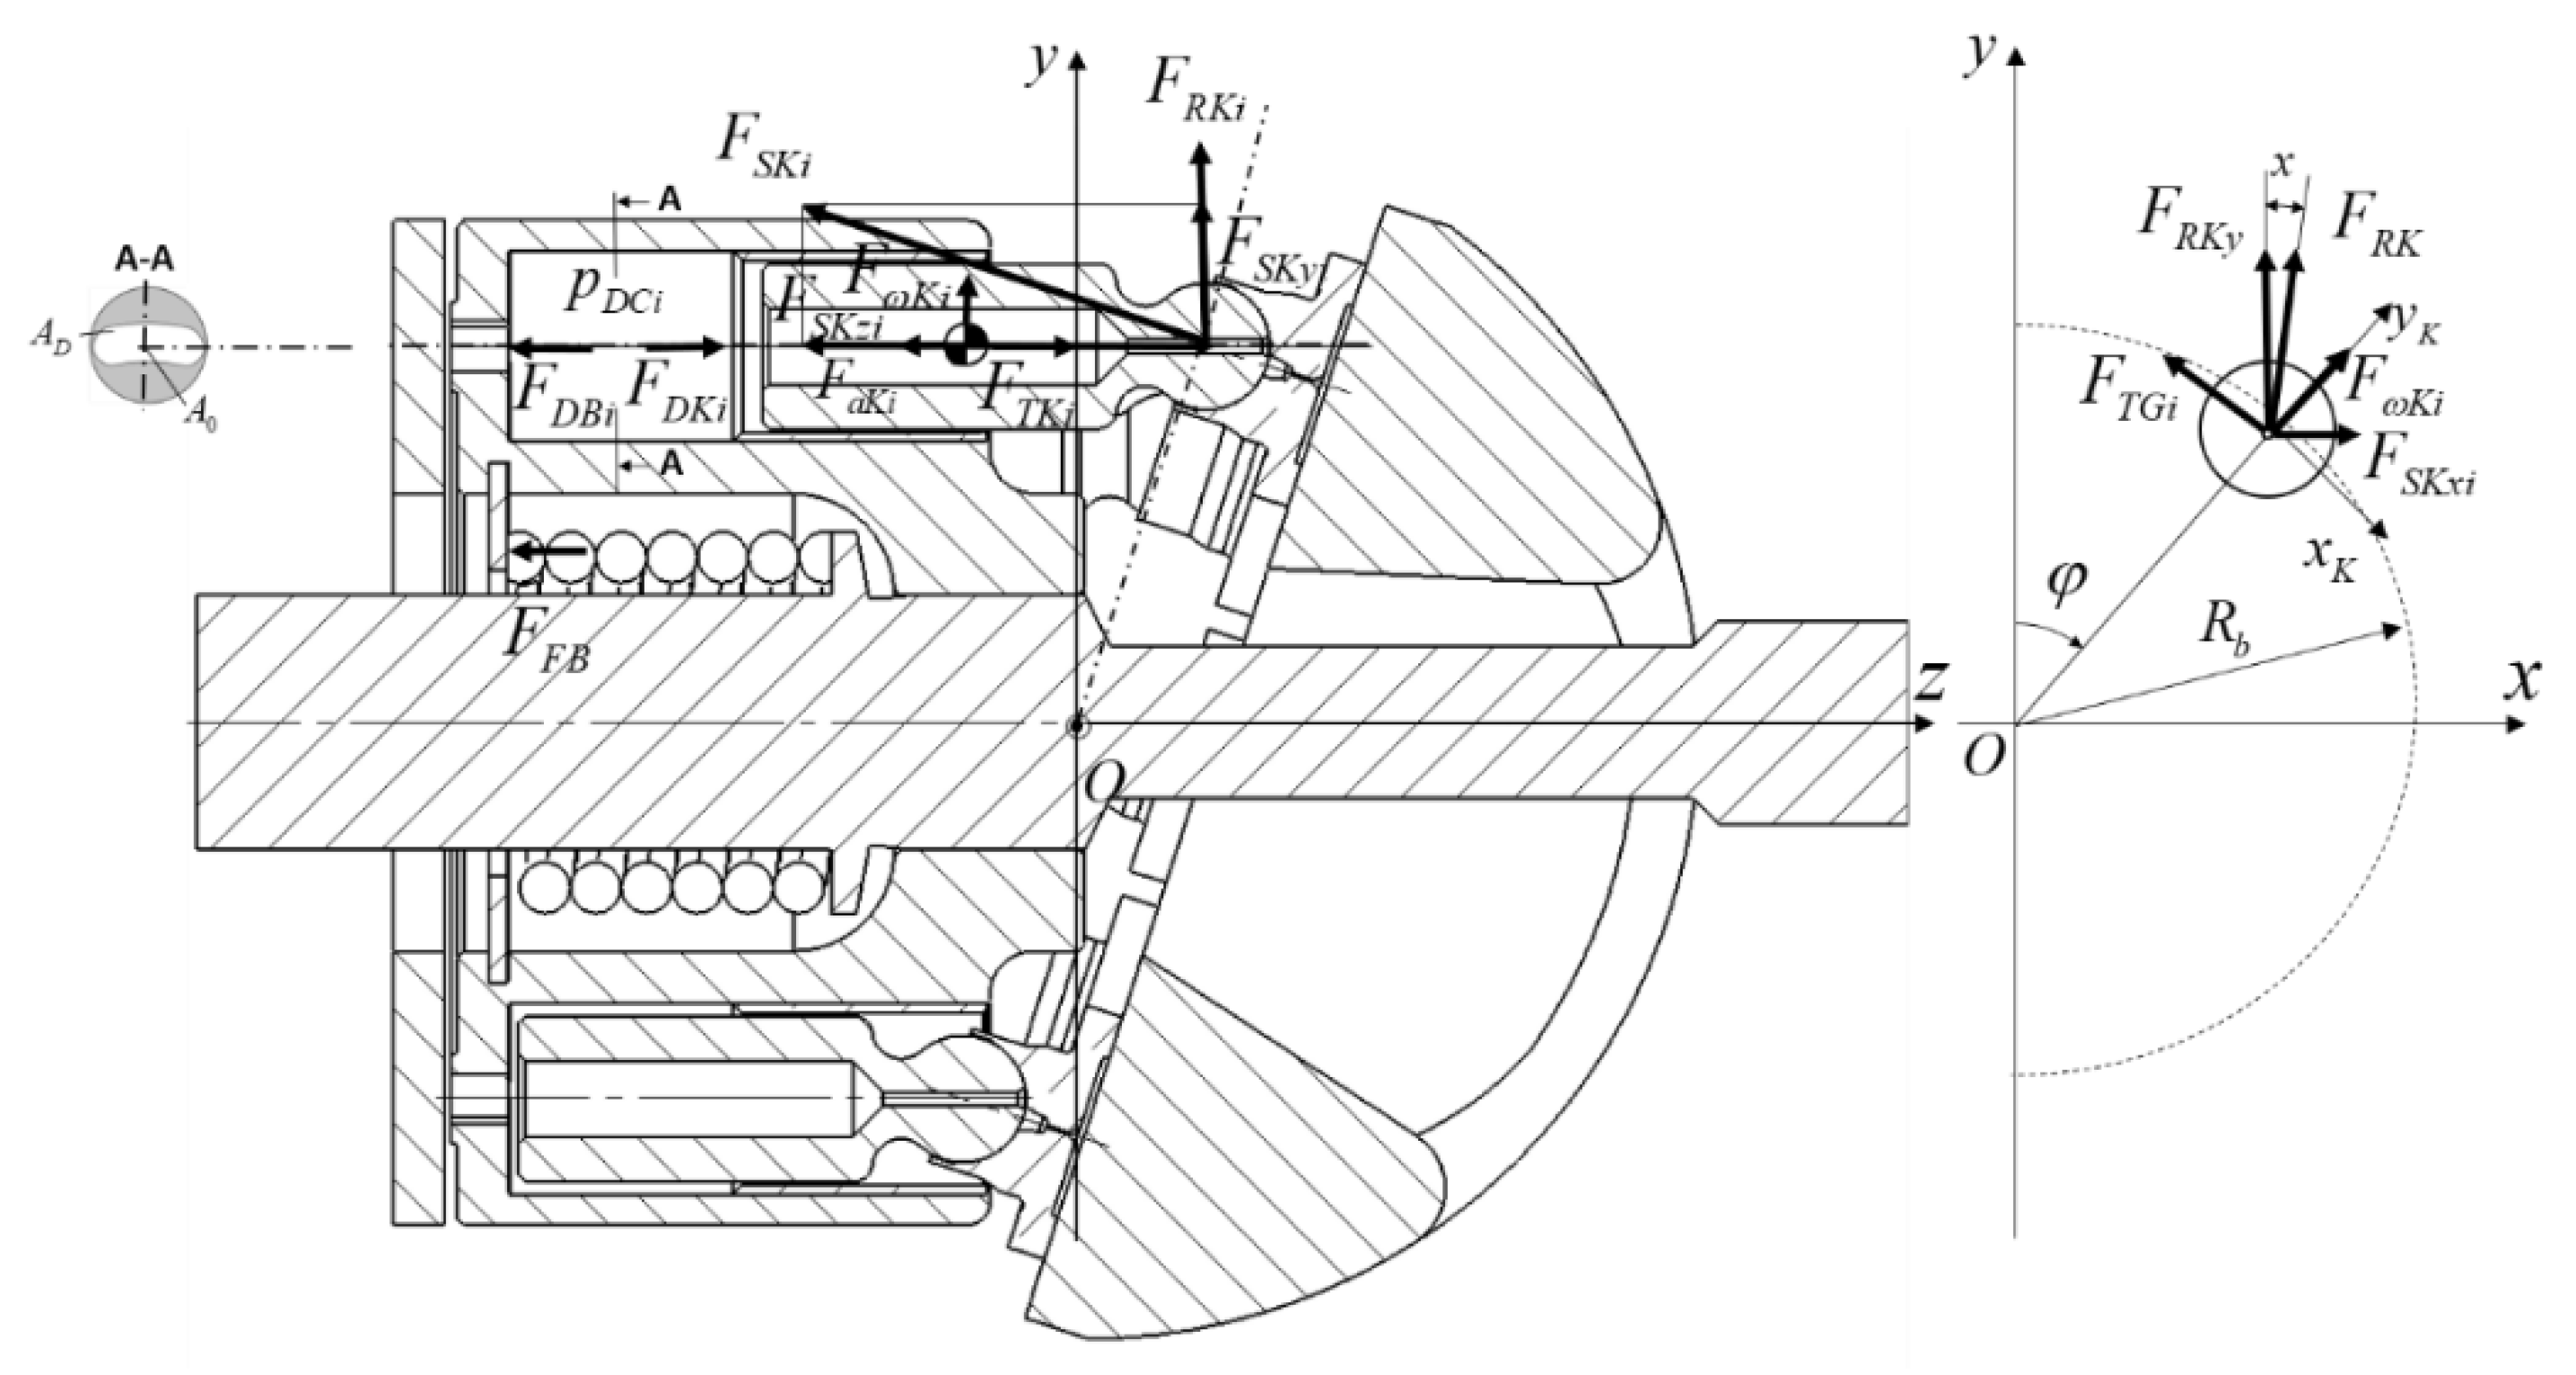
1.1. External Loads on the Rotating Group
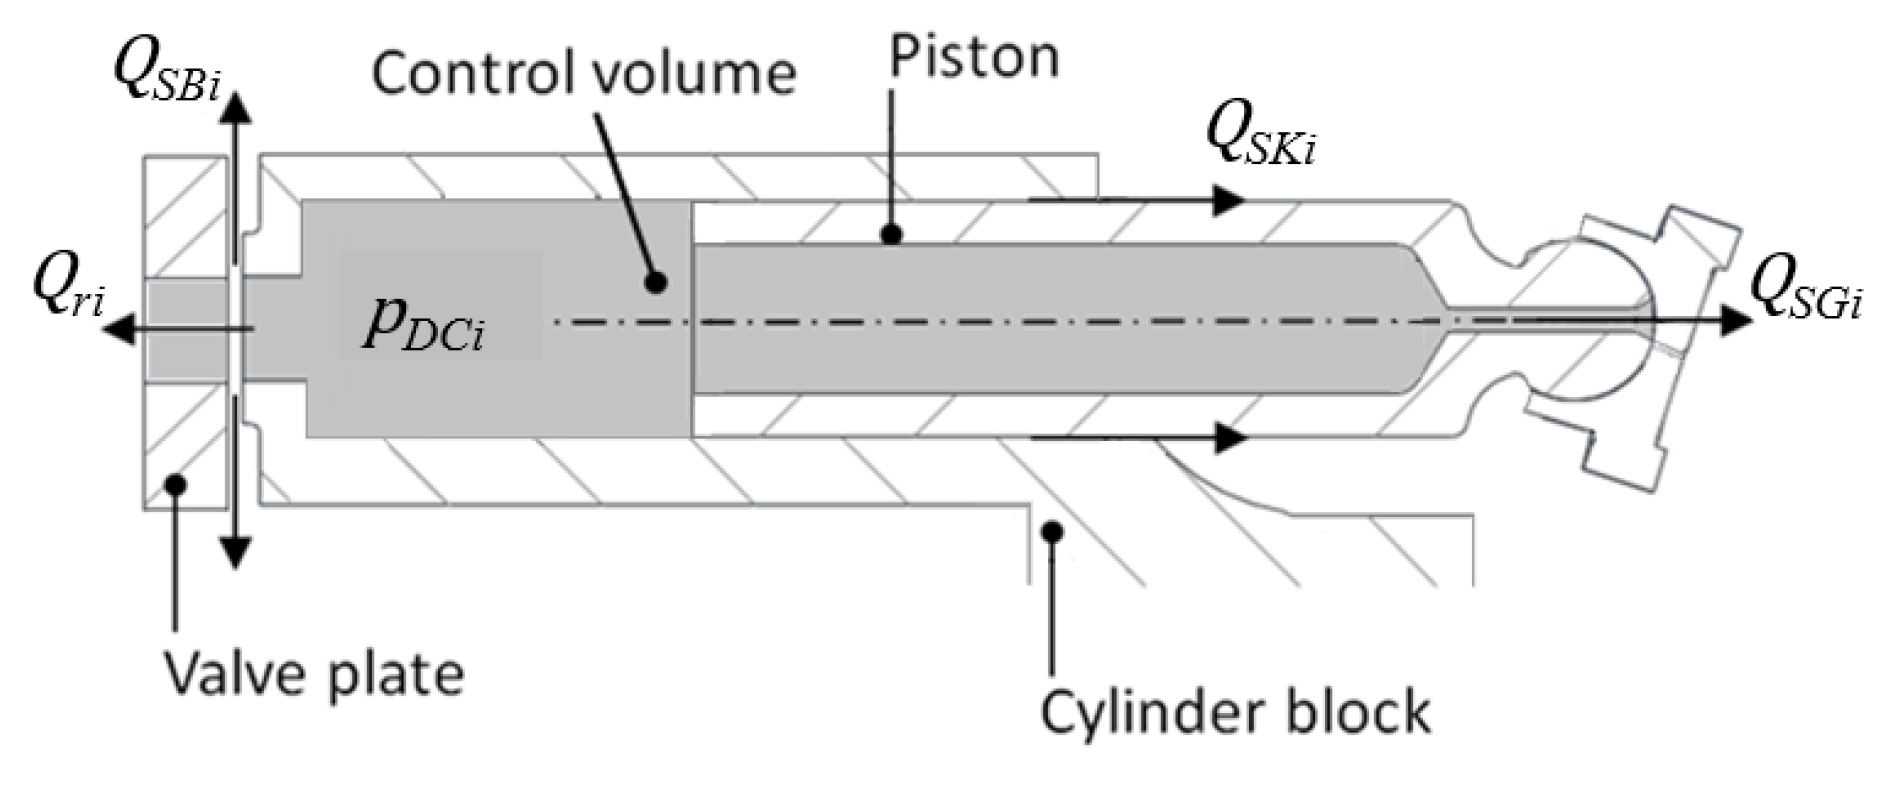
1.2. Pressure Module
- Swash plate moments
- Flow and pressure ripple
- Volumetric efficiency (due to internal leakage and compressibility)
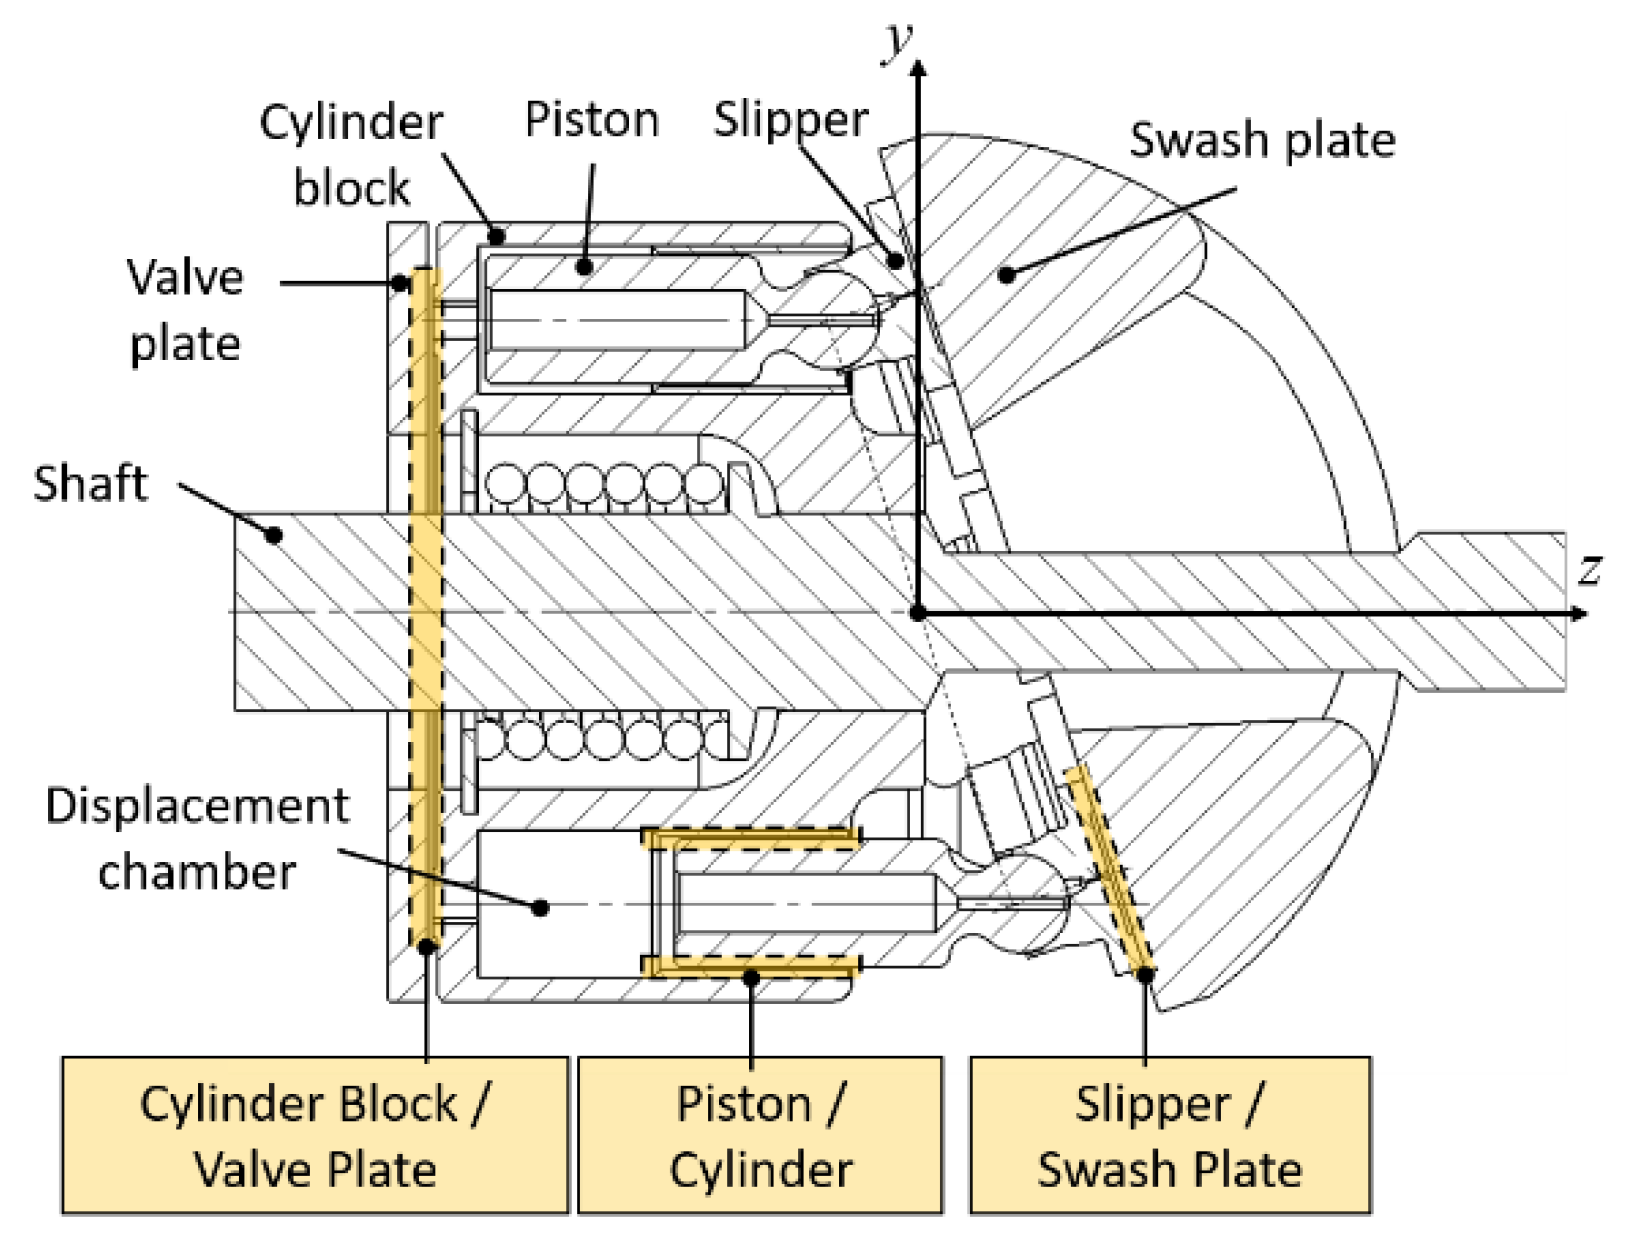
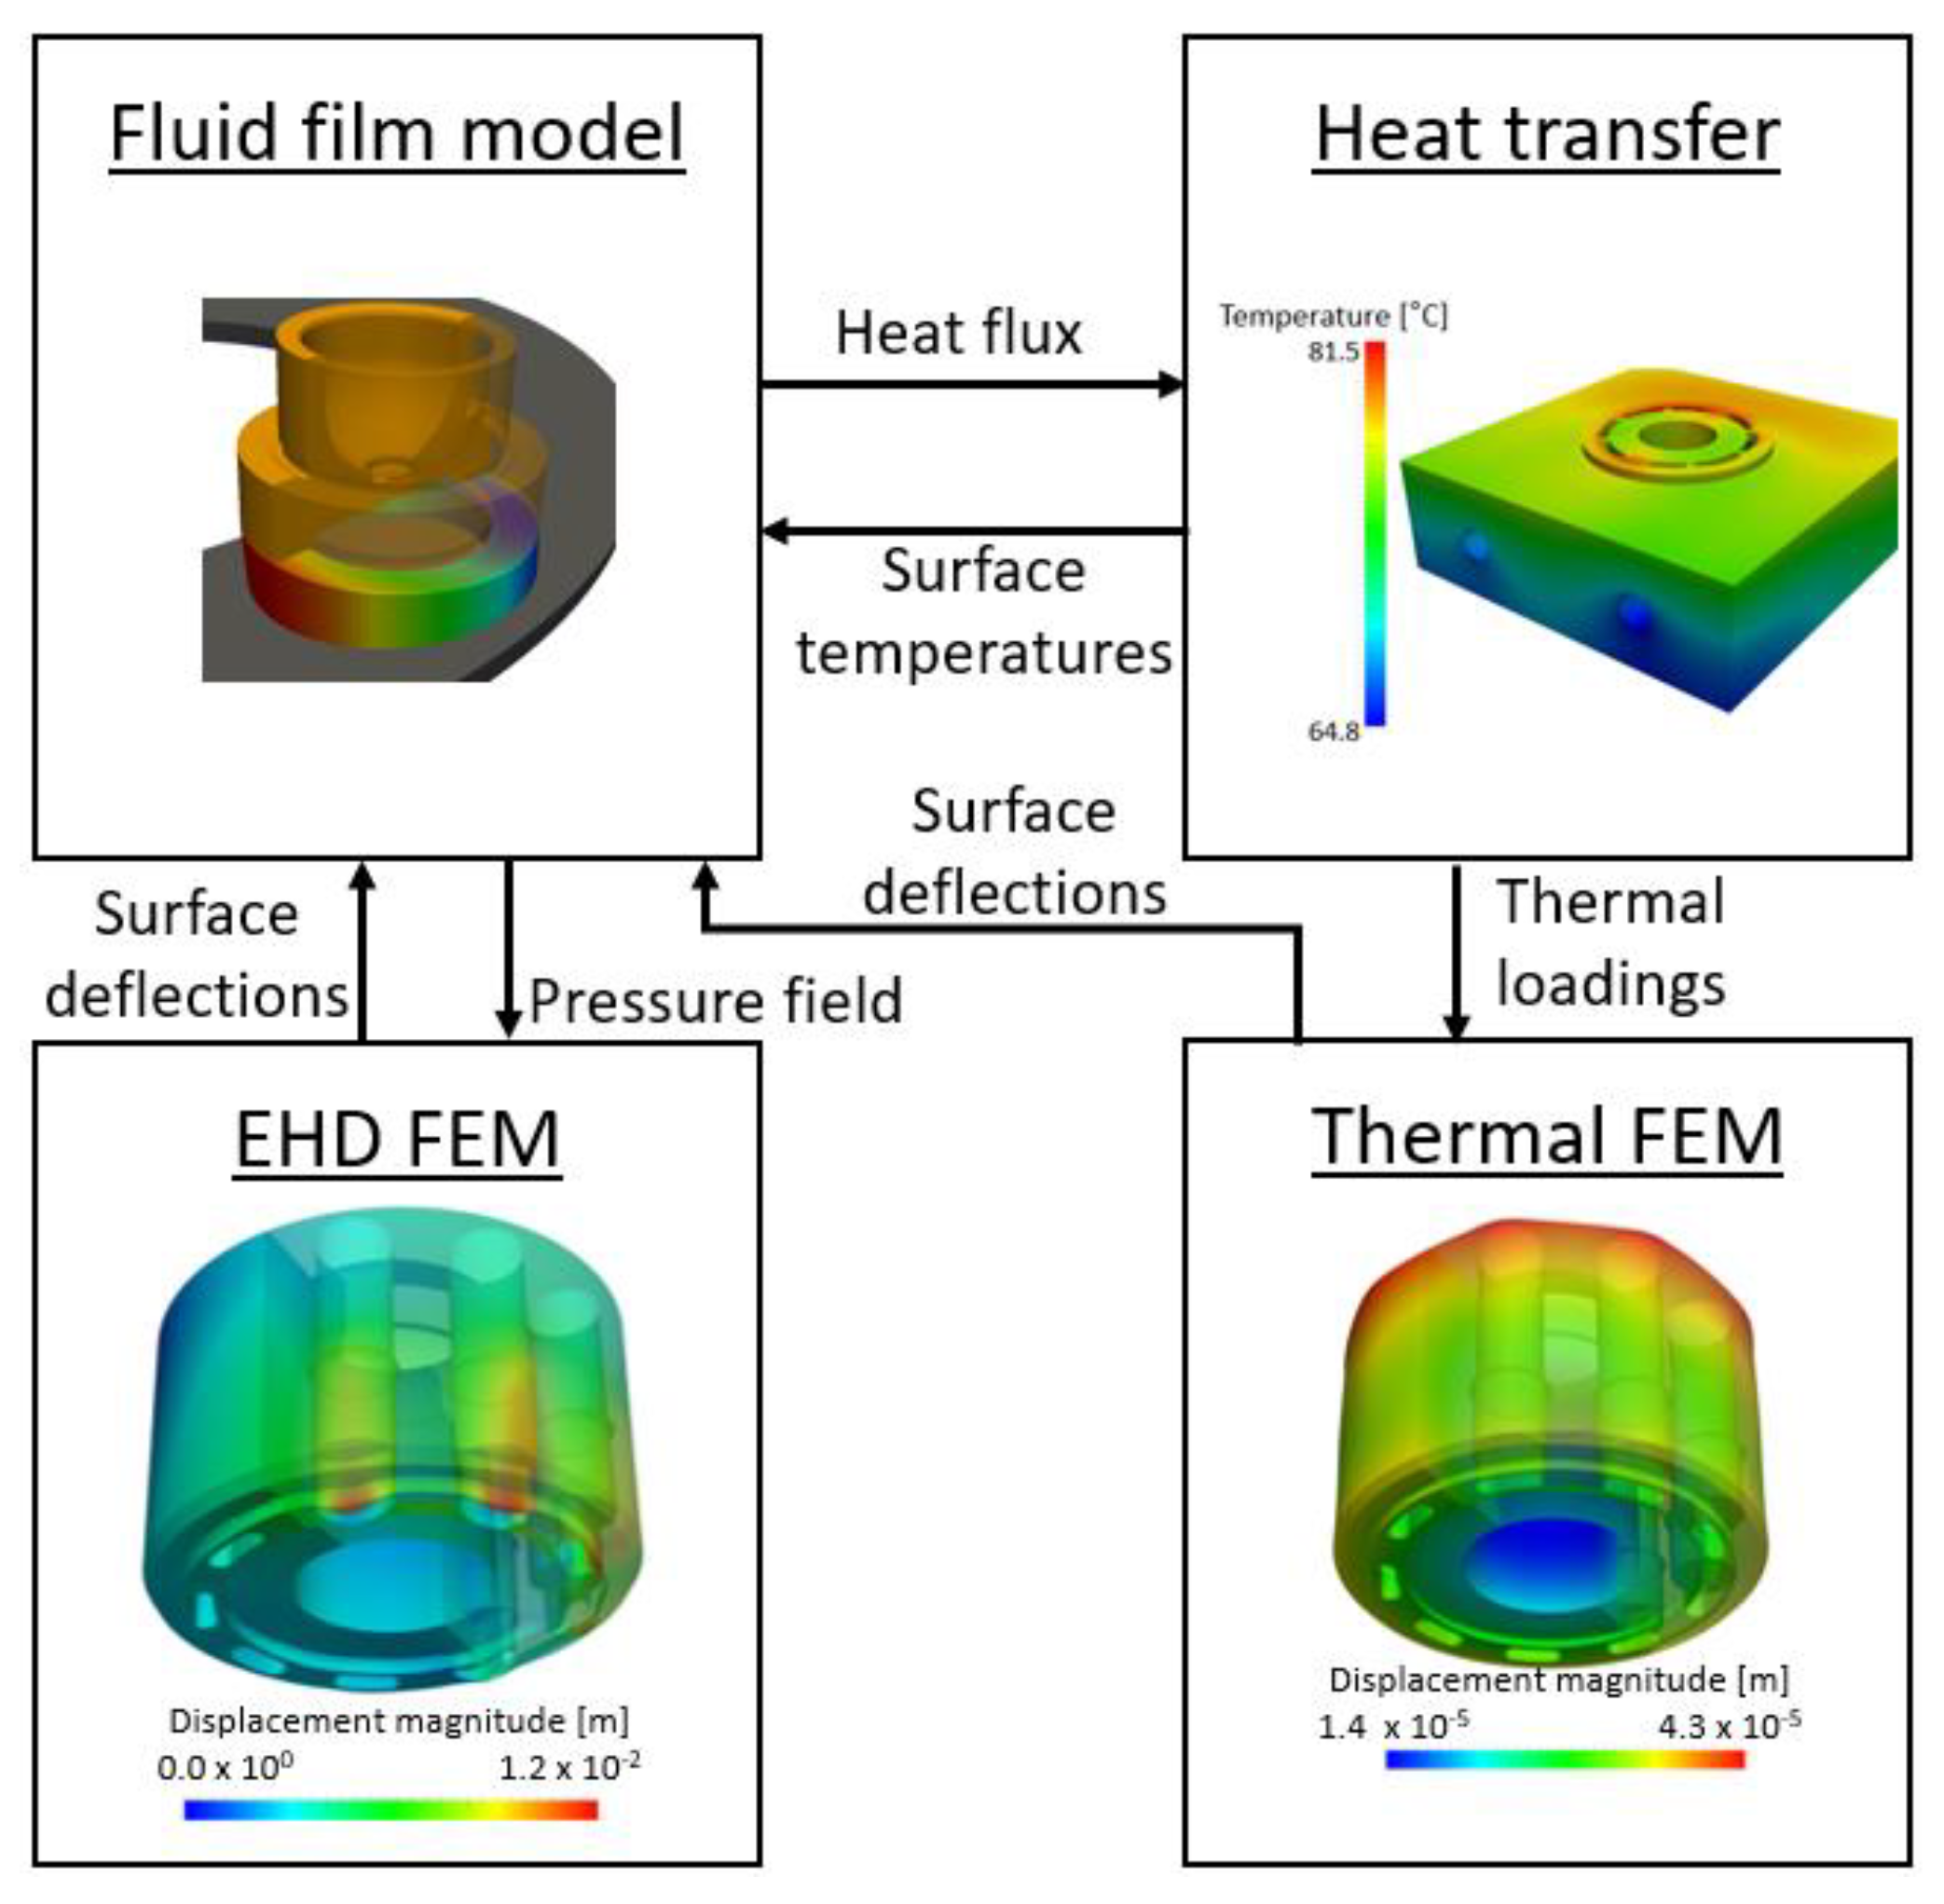
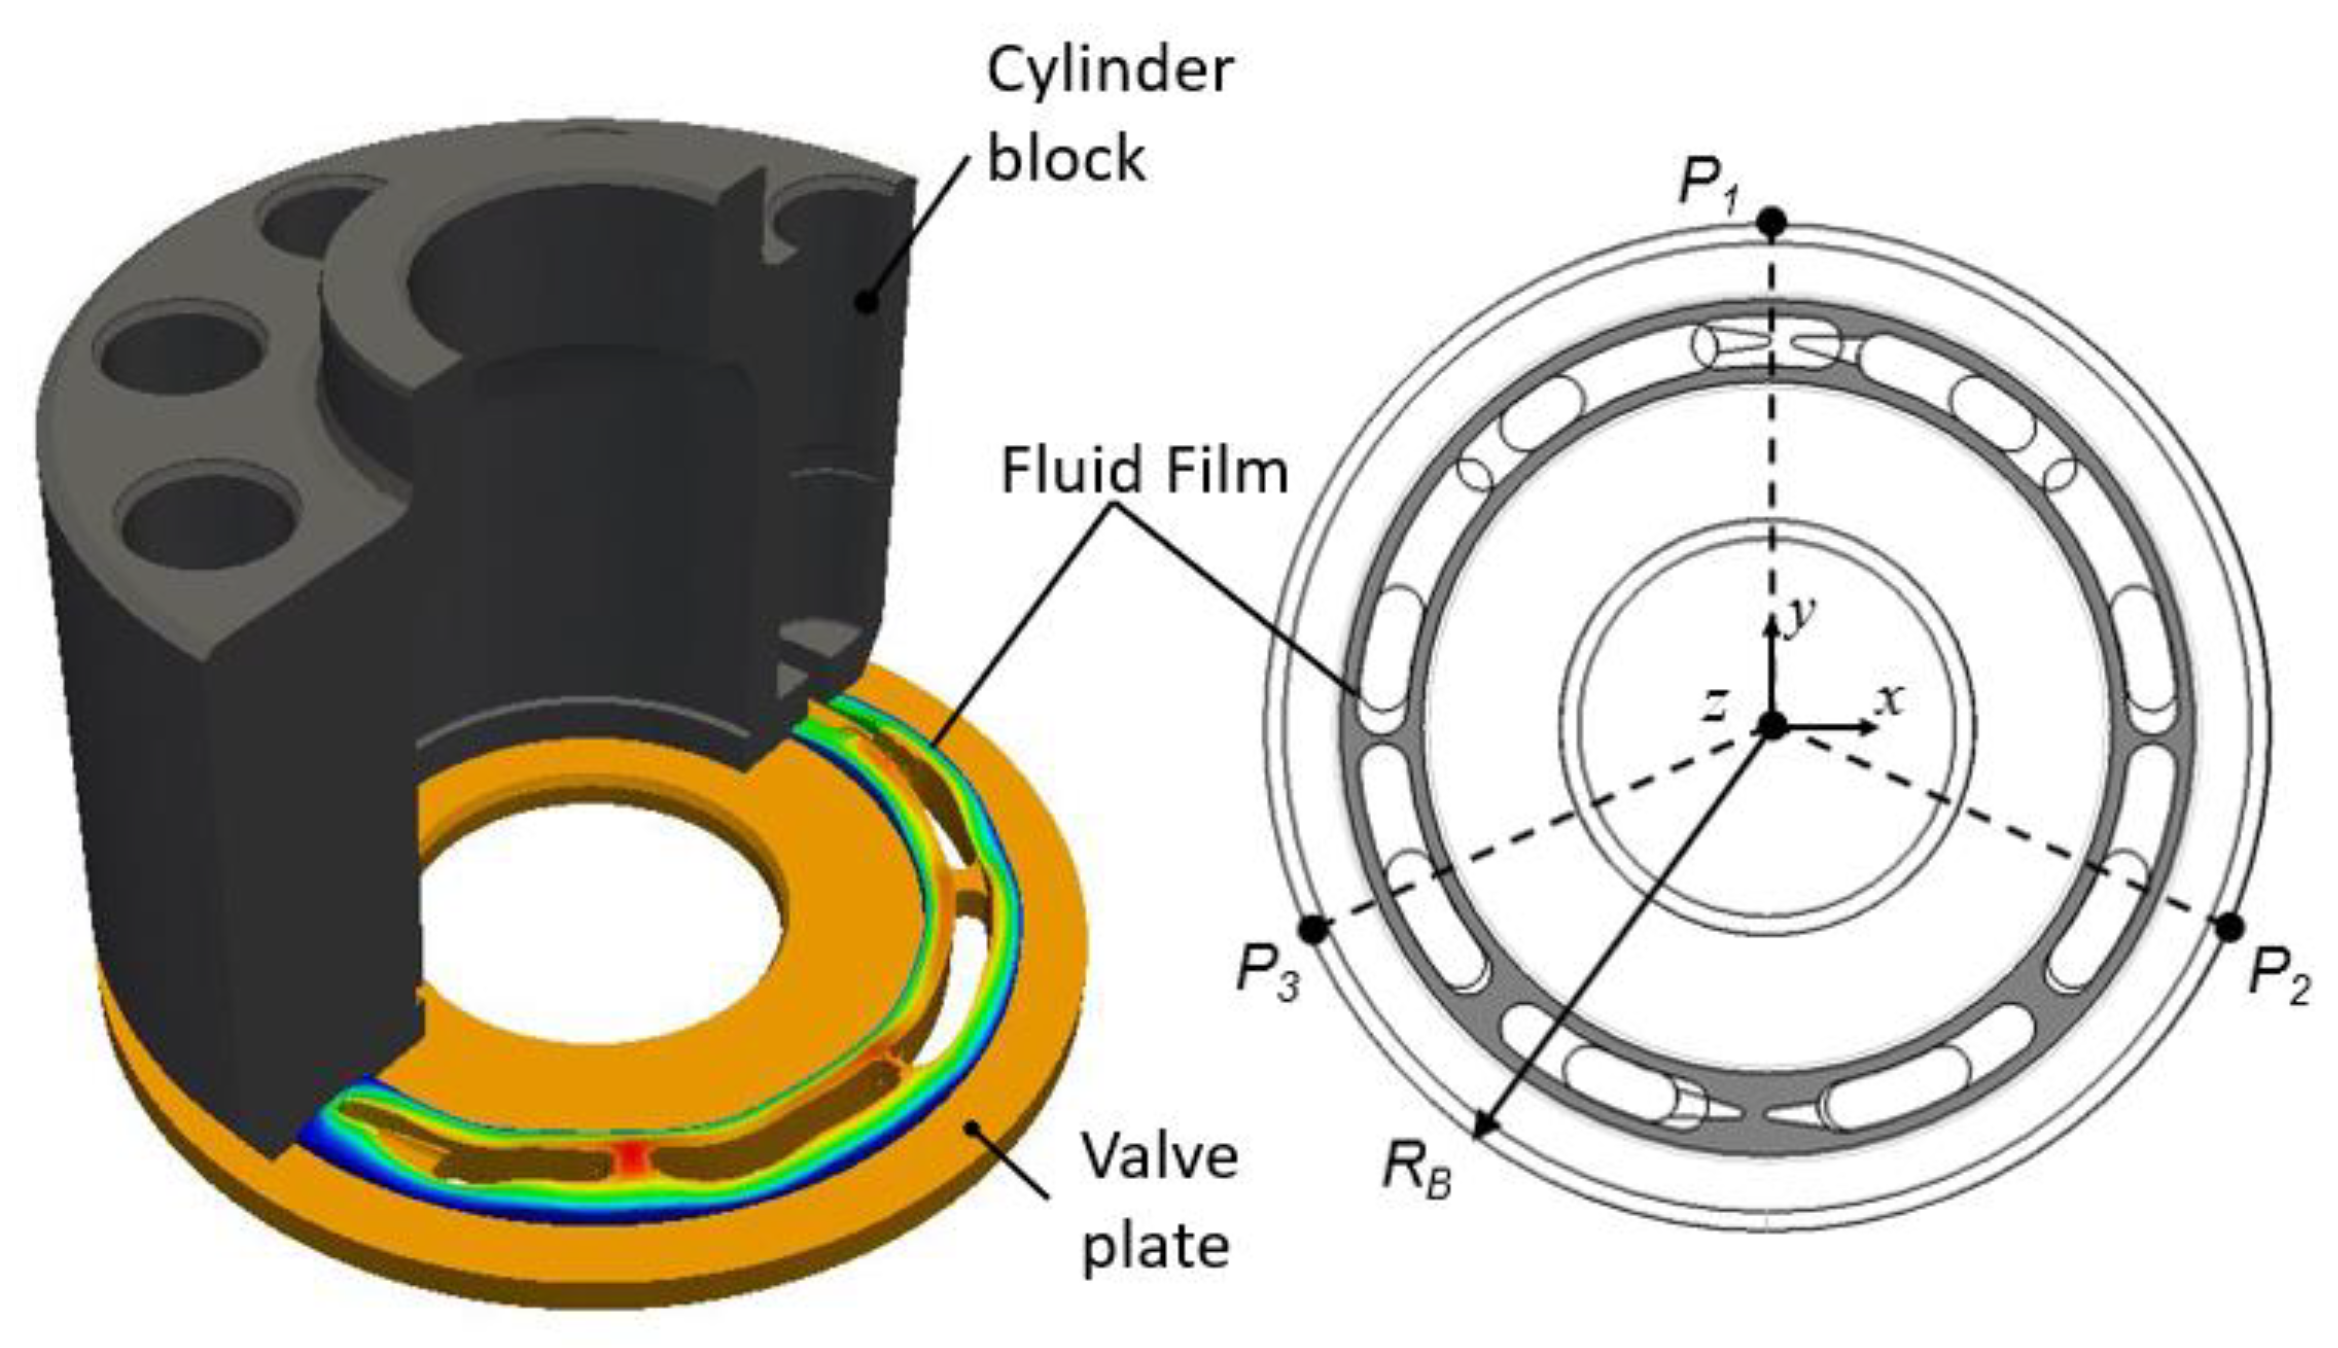
1.3. Thermo-Elastohydrodynamic Model for the Lubricating Interfaces
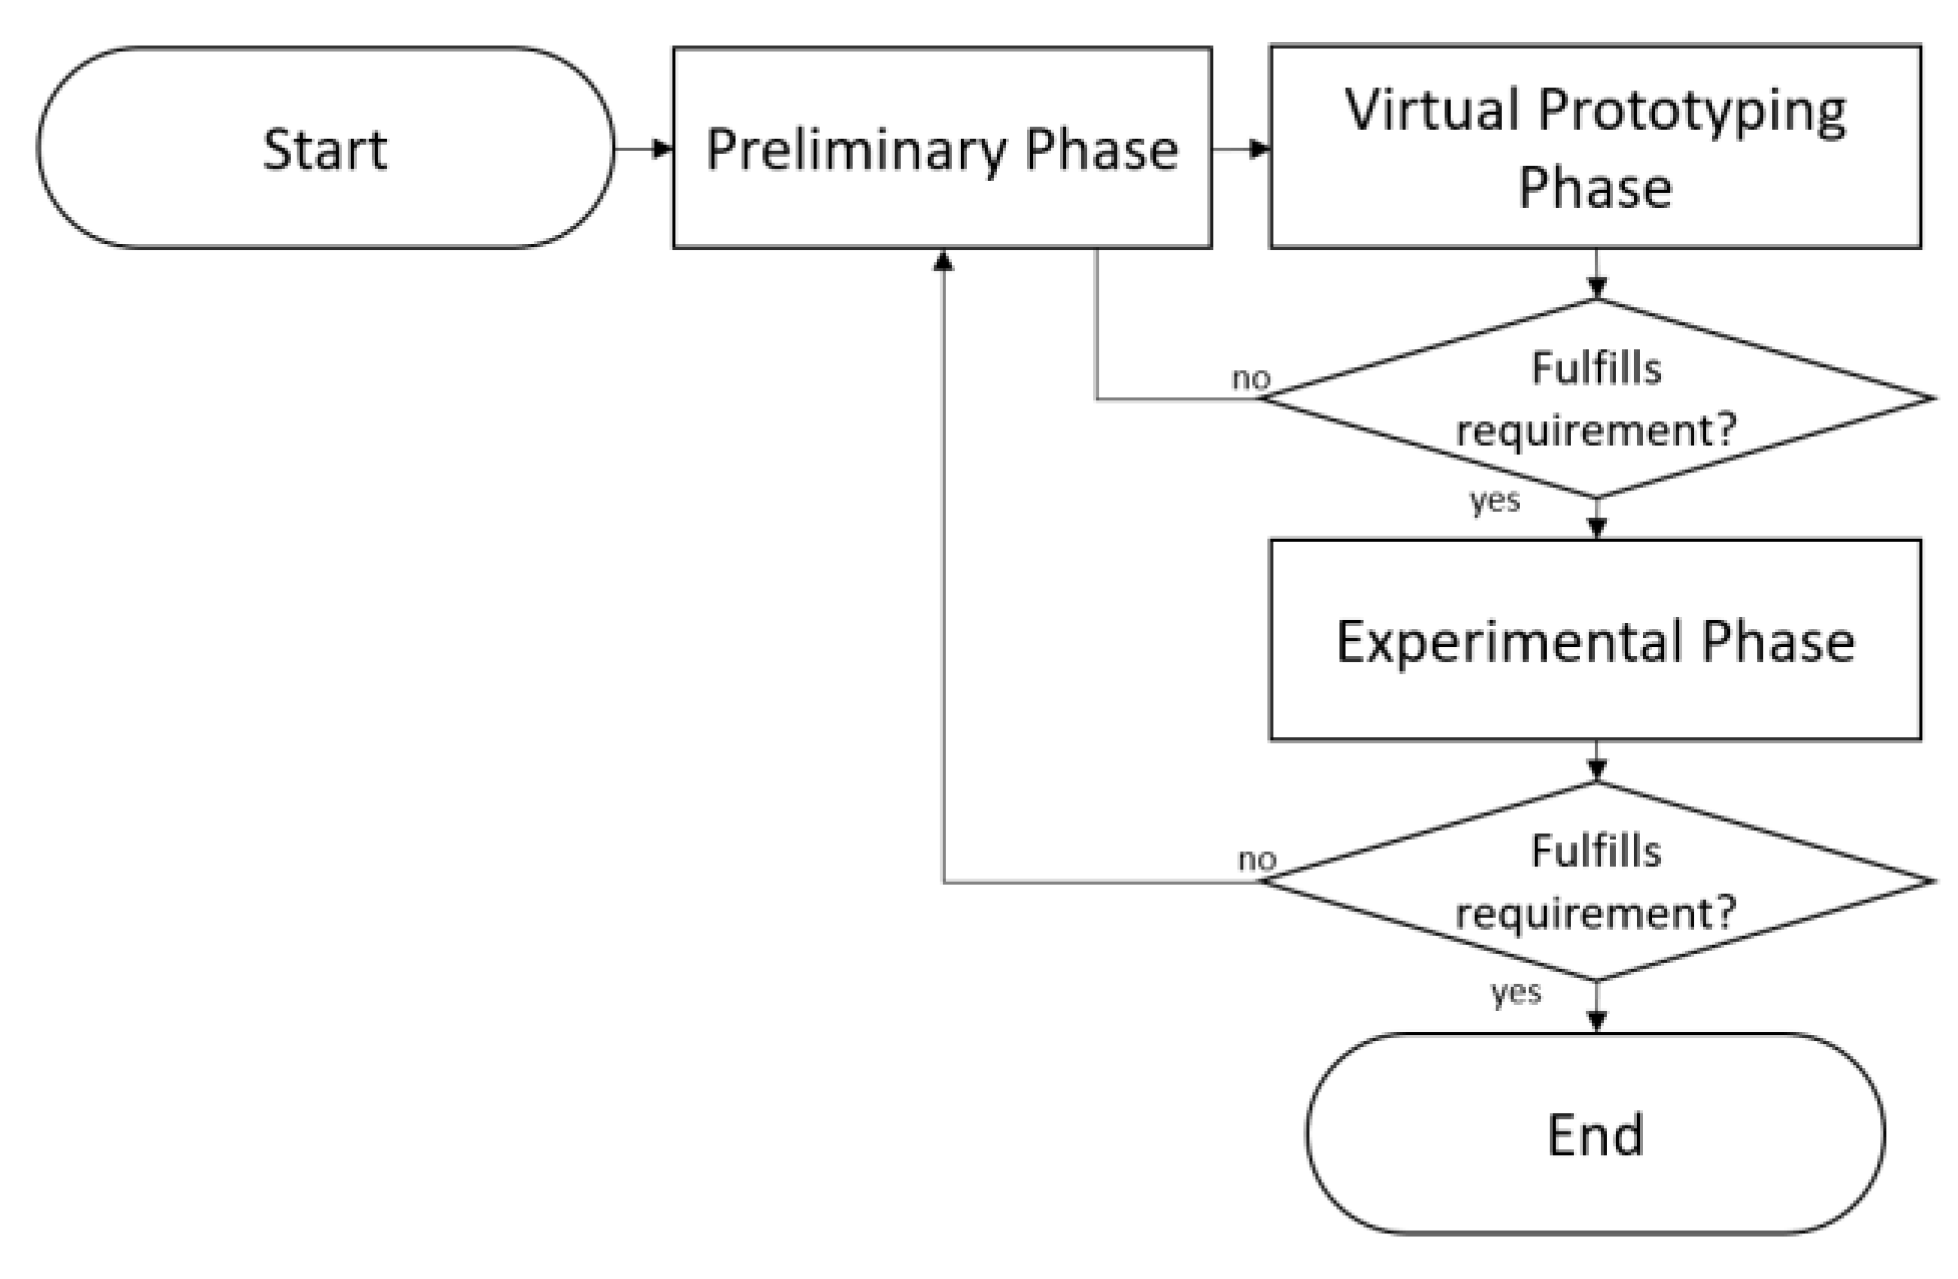
2. Virtual Prototyping Axial Piston Machines Methodology
- Fluid film thickness between the piston and the cylinder bore, the cylinder block and the valve plate, and the slipper and the swash plate.
- Pressure fields in the fluid film in the lubricating interfaces.
- Leakage flows in all three lubricating interfaces.
- Energy dissipation due to viscous flow in all three lubricating interfaces.
- Temperature distributions in the fluid film and main pump parts (cylinder block, piston, valve plate, slipper, swash plate, and end case).
- Surface deformations of the cylinder block, piston, valve plate, slipper, and swash plate due to pressure and thermal loading of these parts.
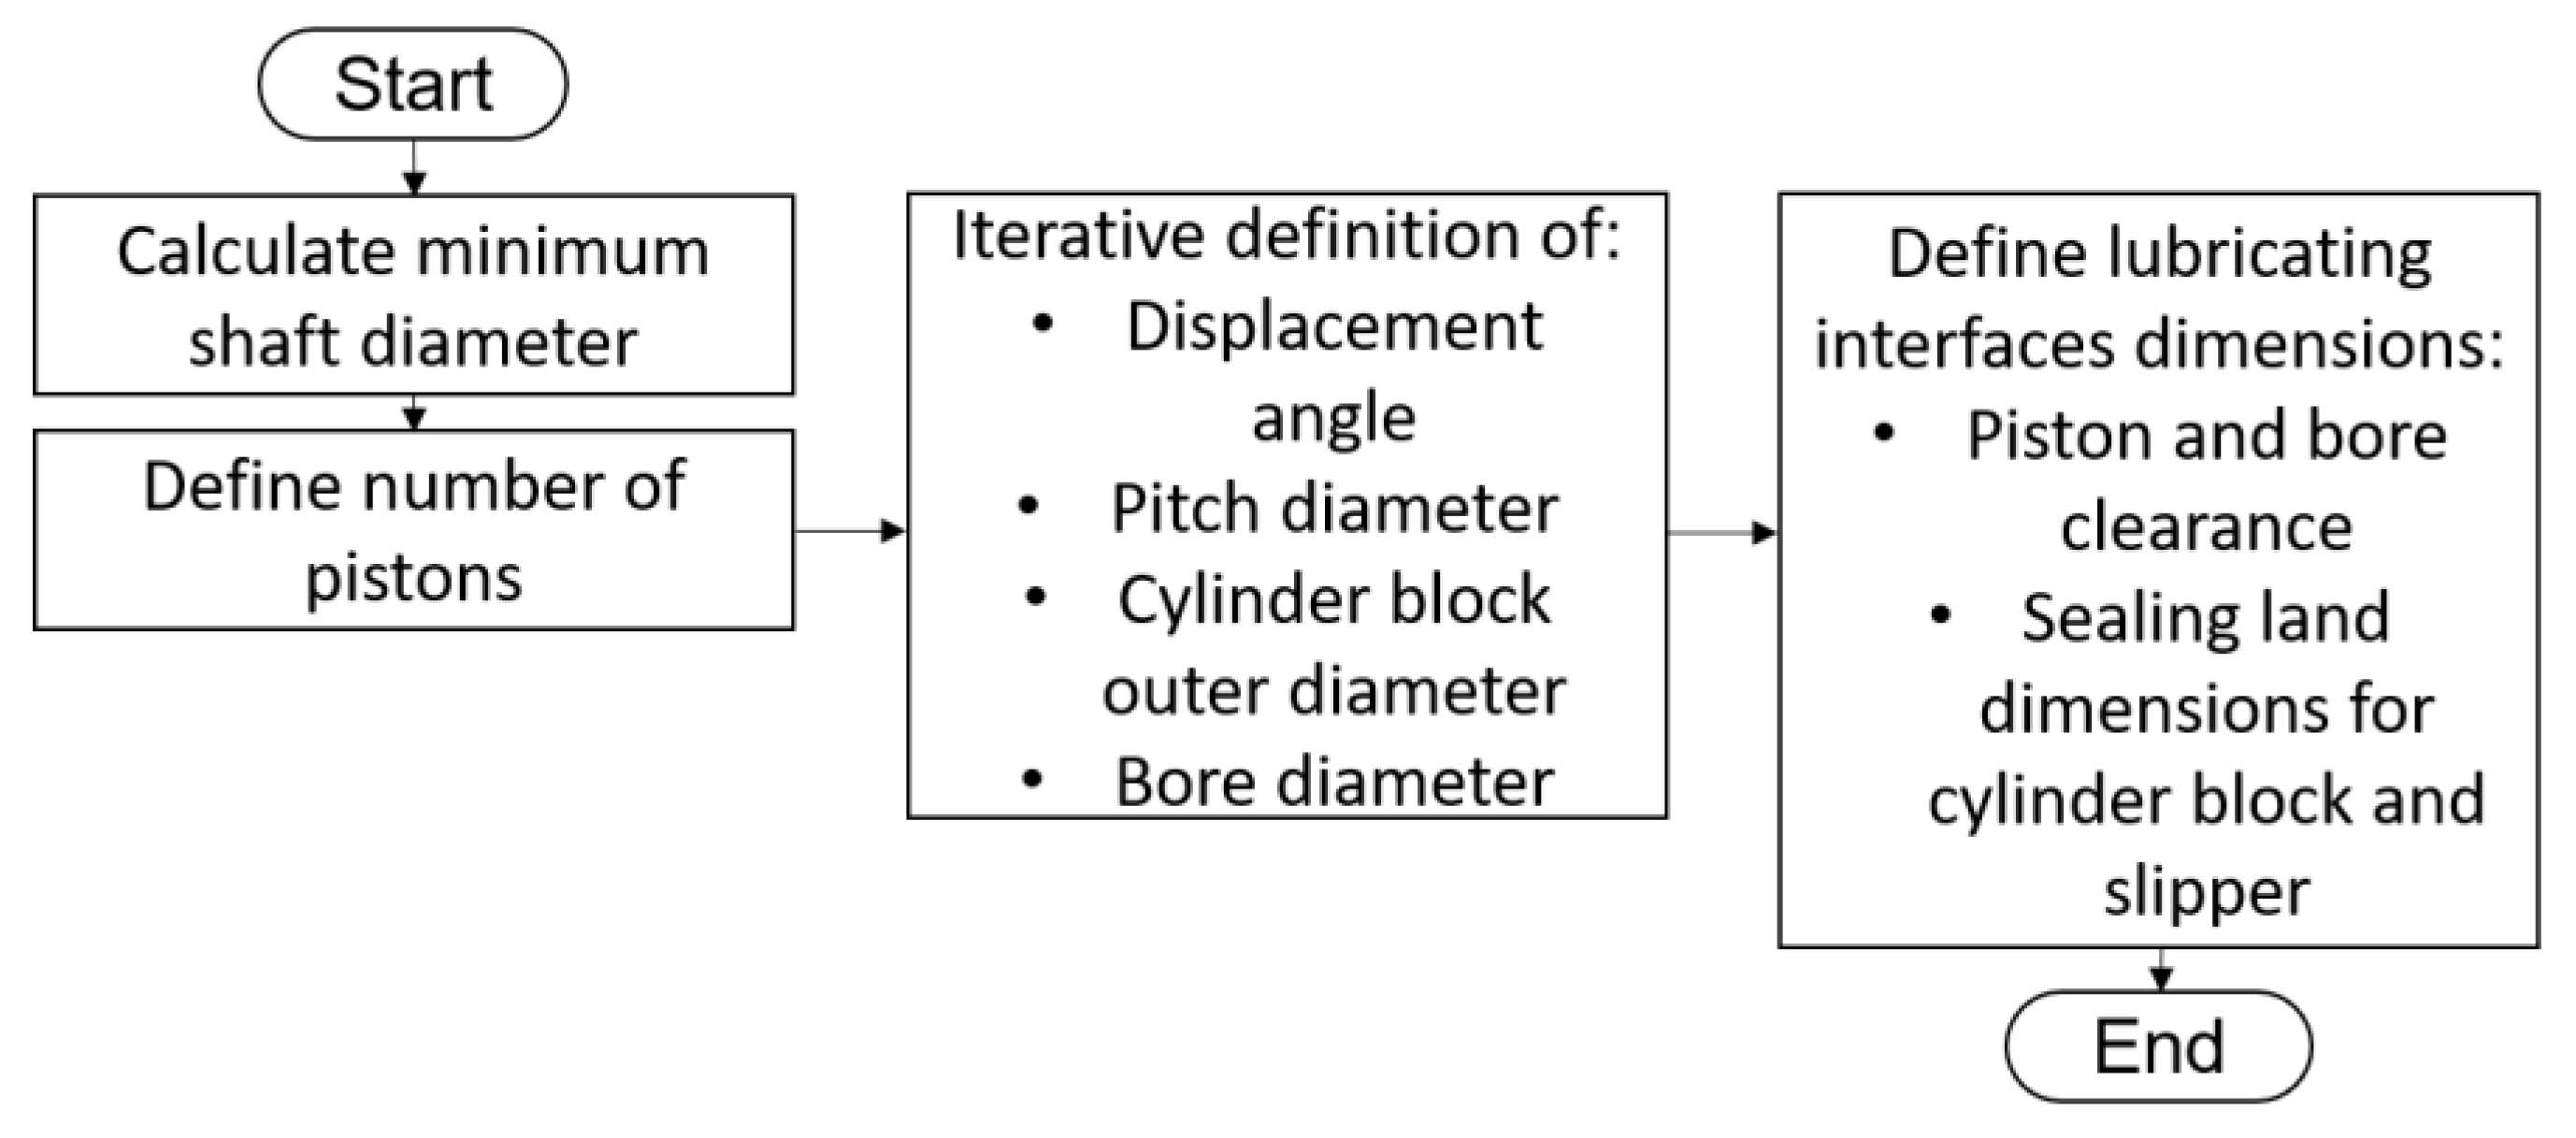
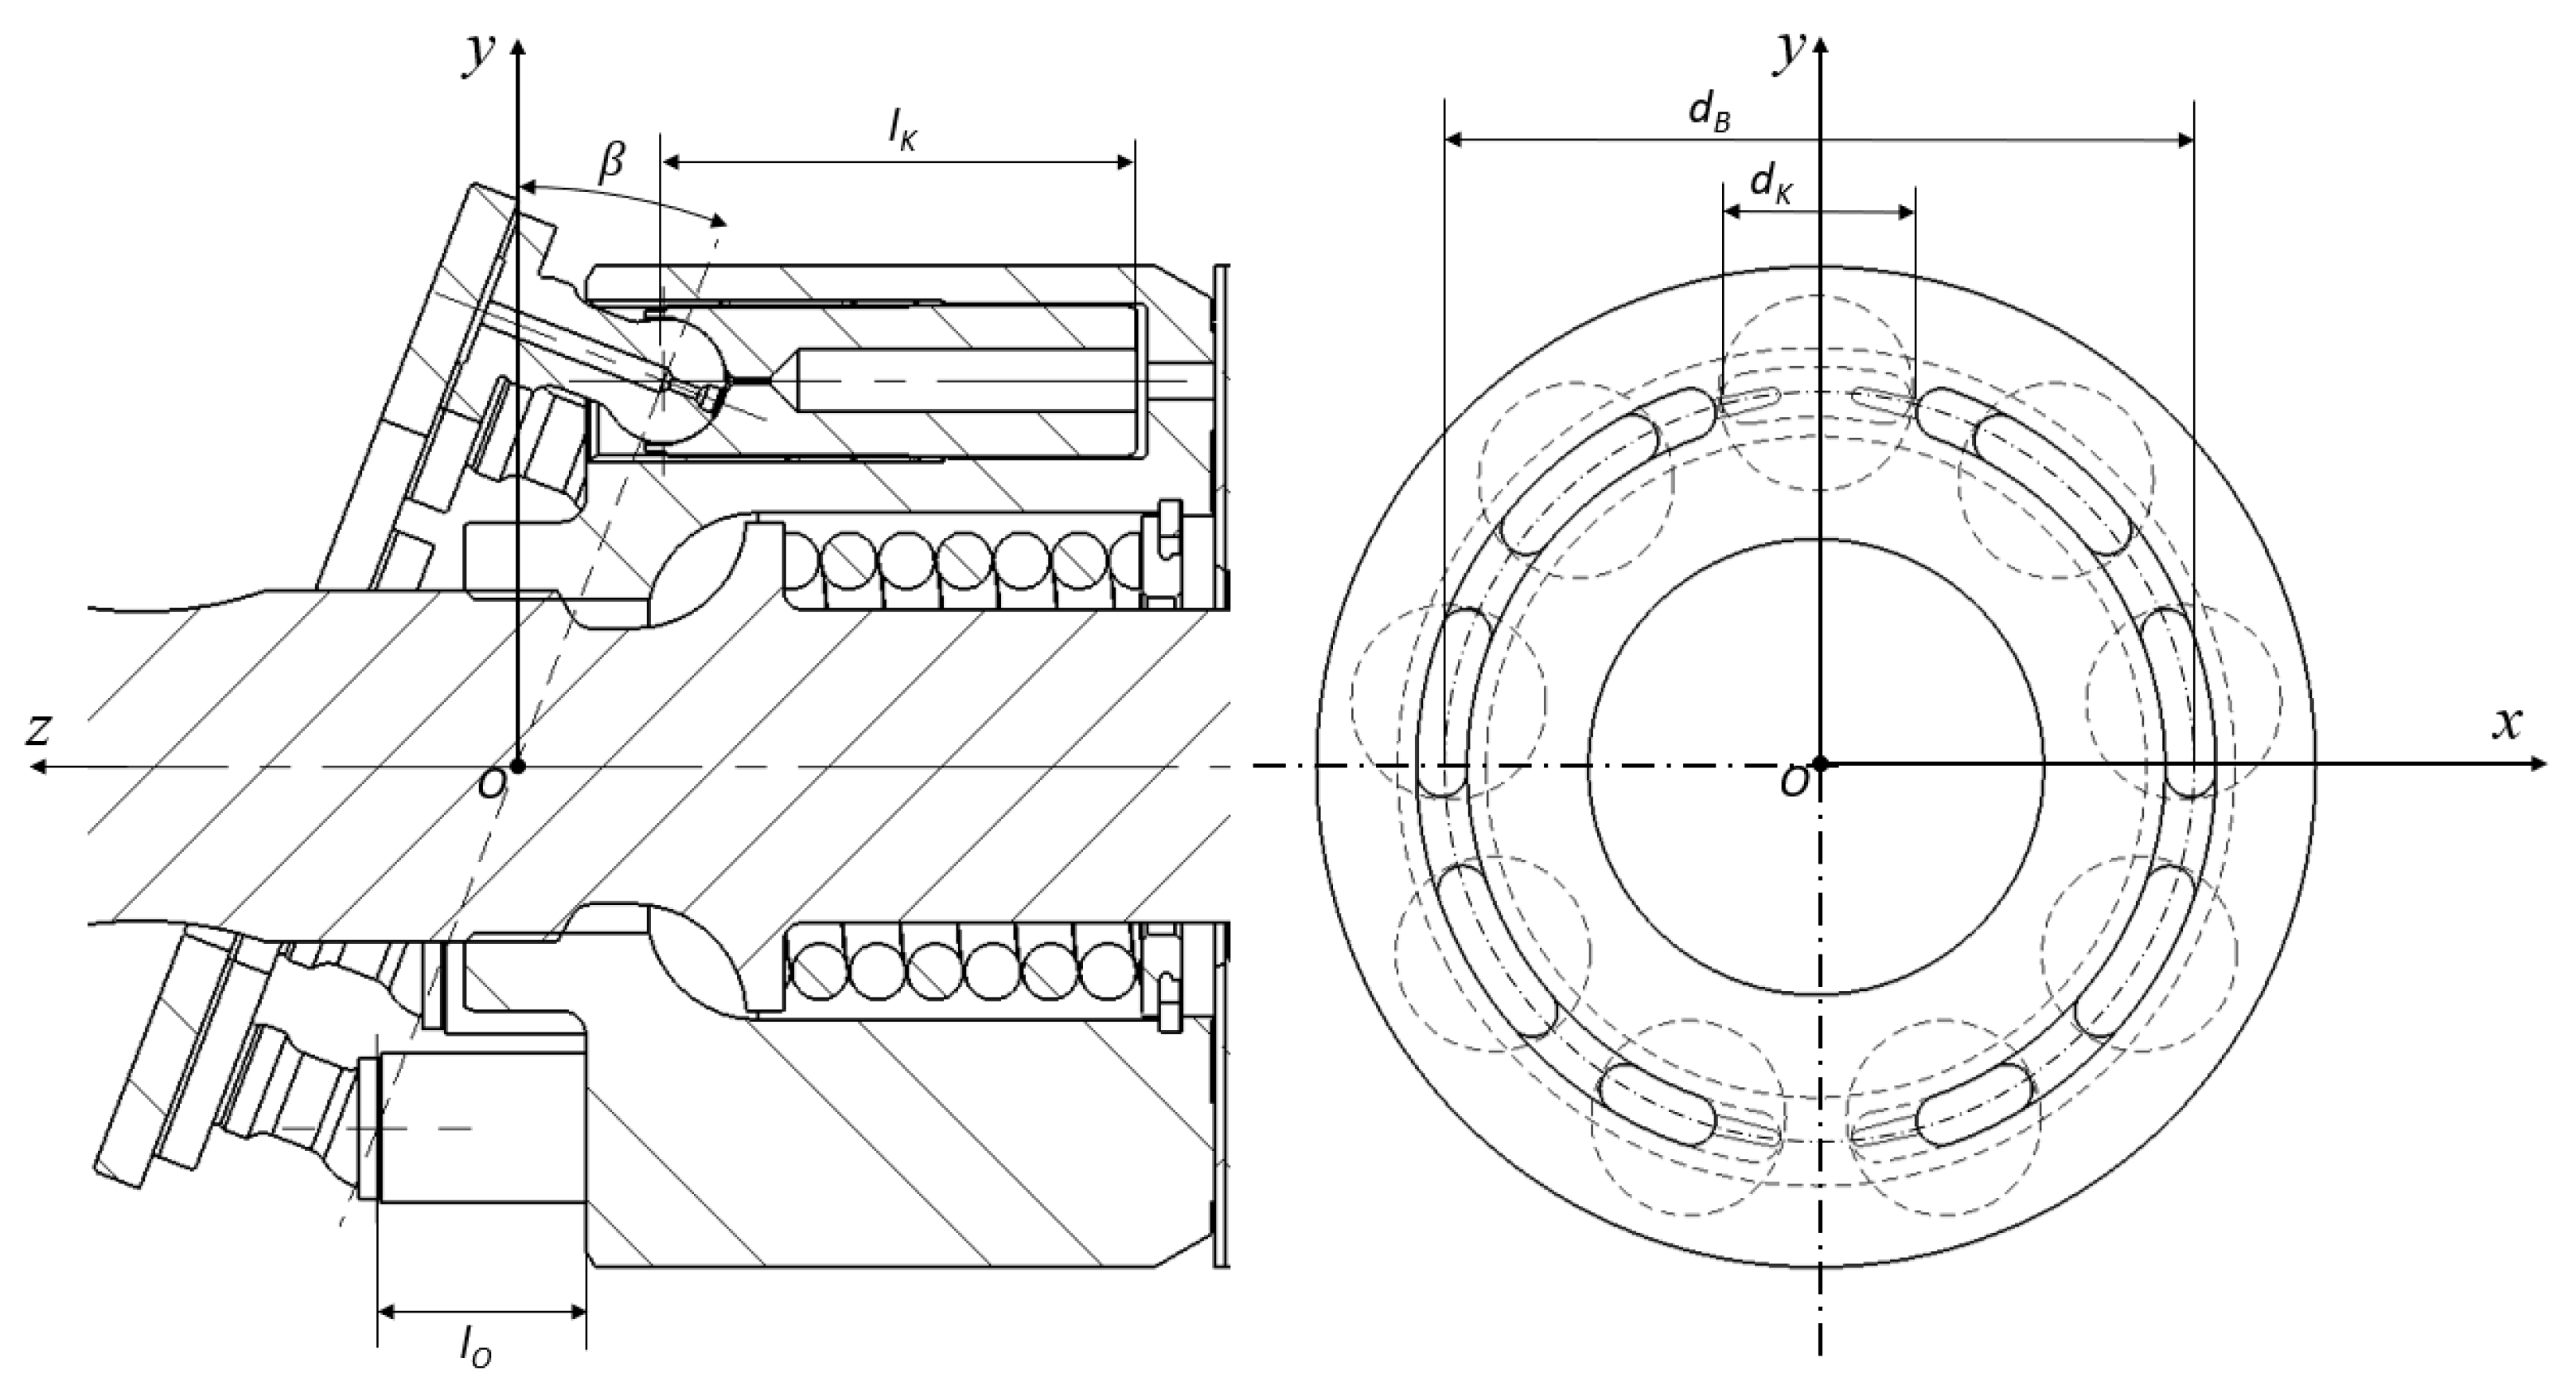
2.1. Preliminary Design
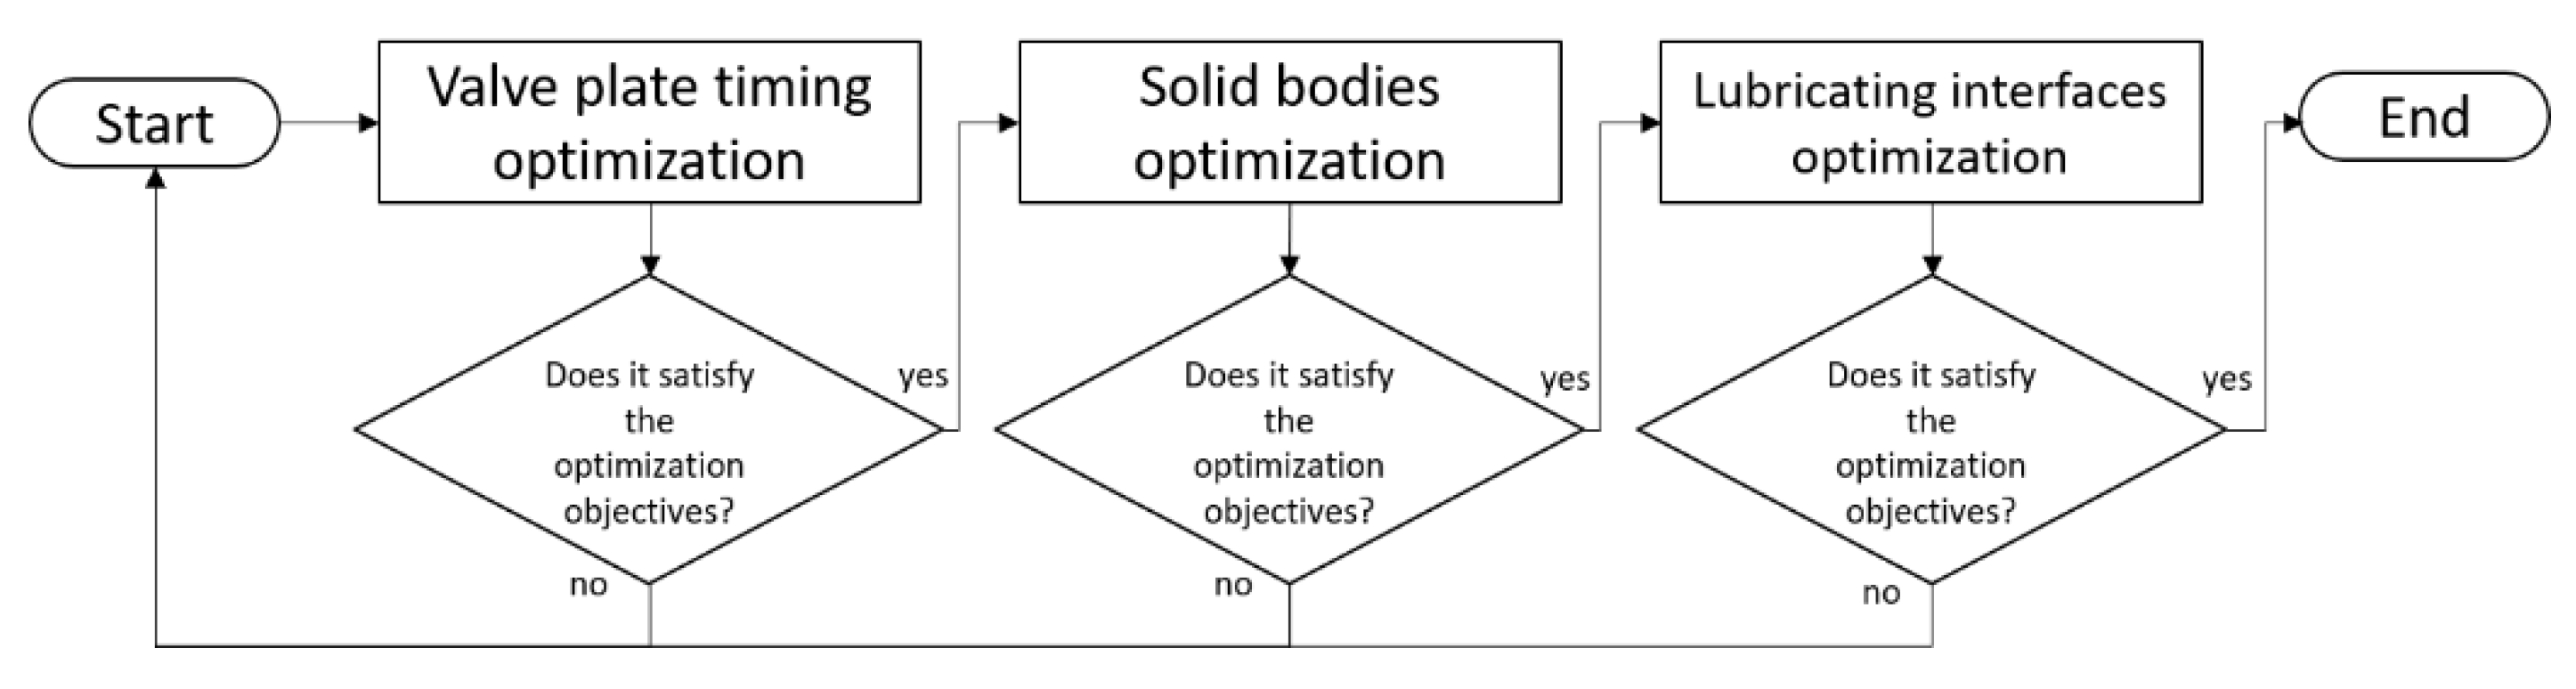
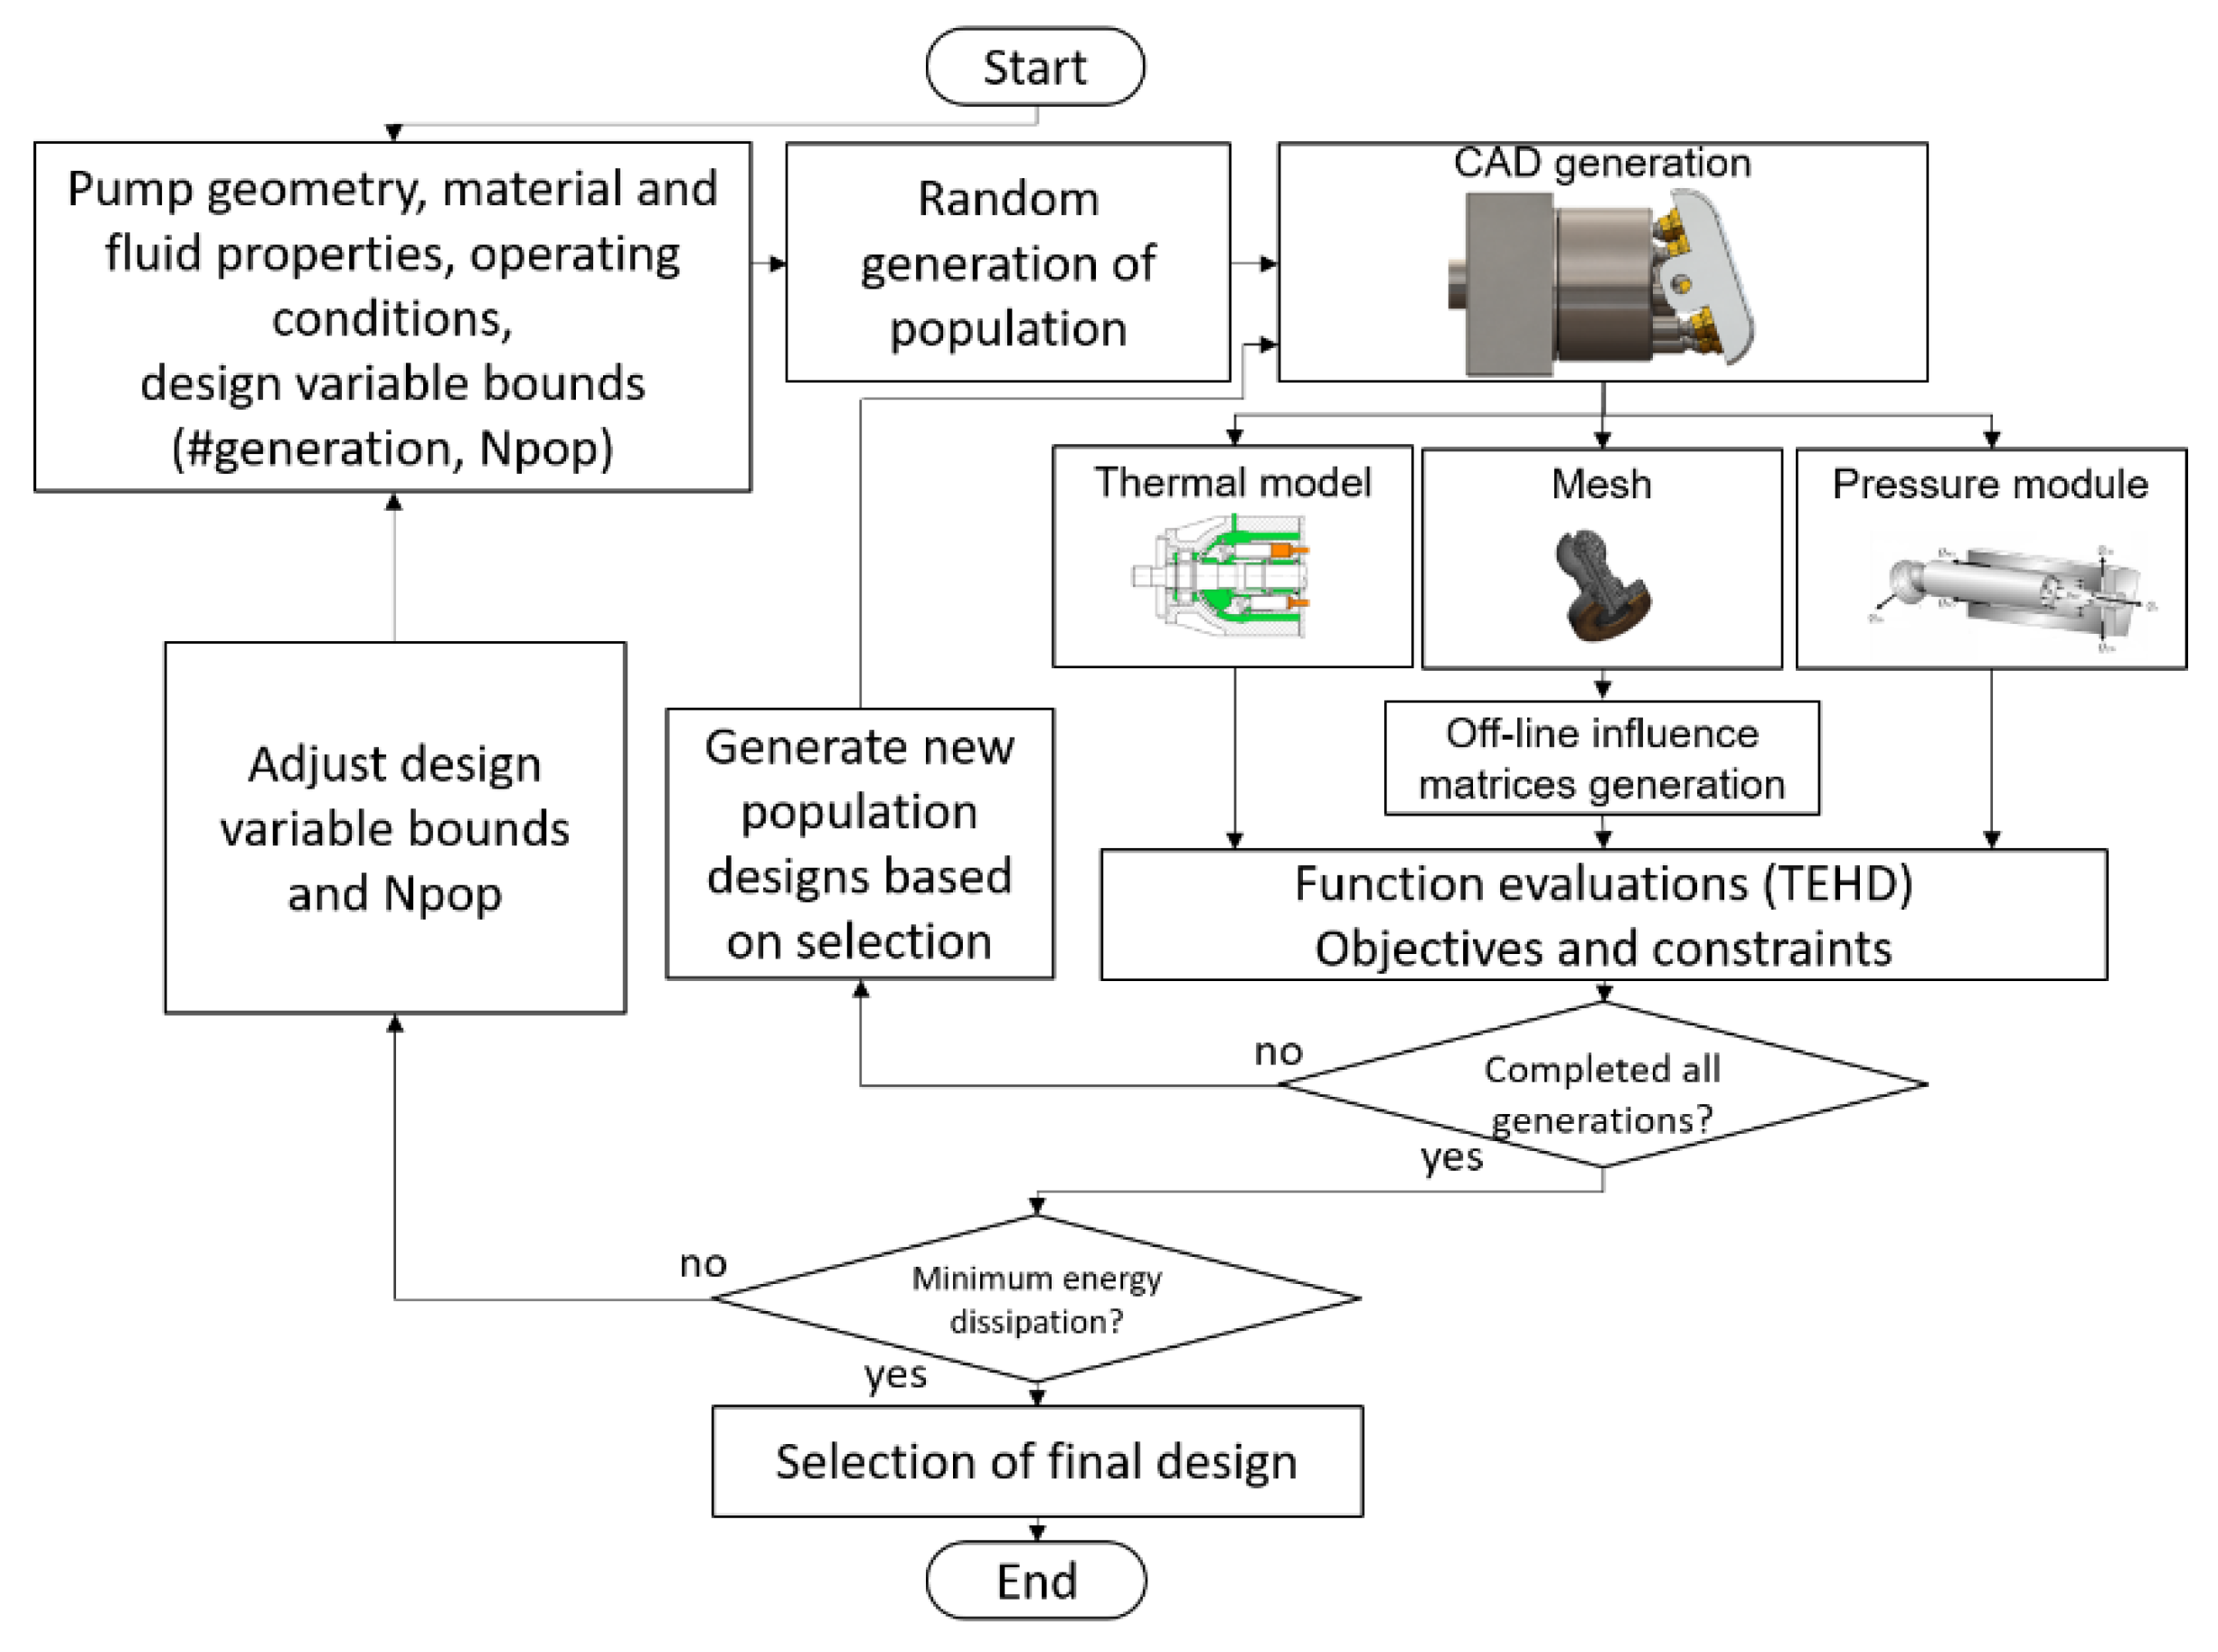
2.2. Virtual Prototyping
- Lowest energy dissipation in the given range of operating conditions.
- A stable fluid film with sufficient load carrying ability.
- Low flow and torque ripple.
- No cavitation or incomplete filling
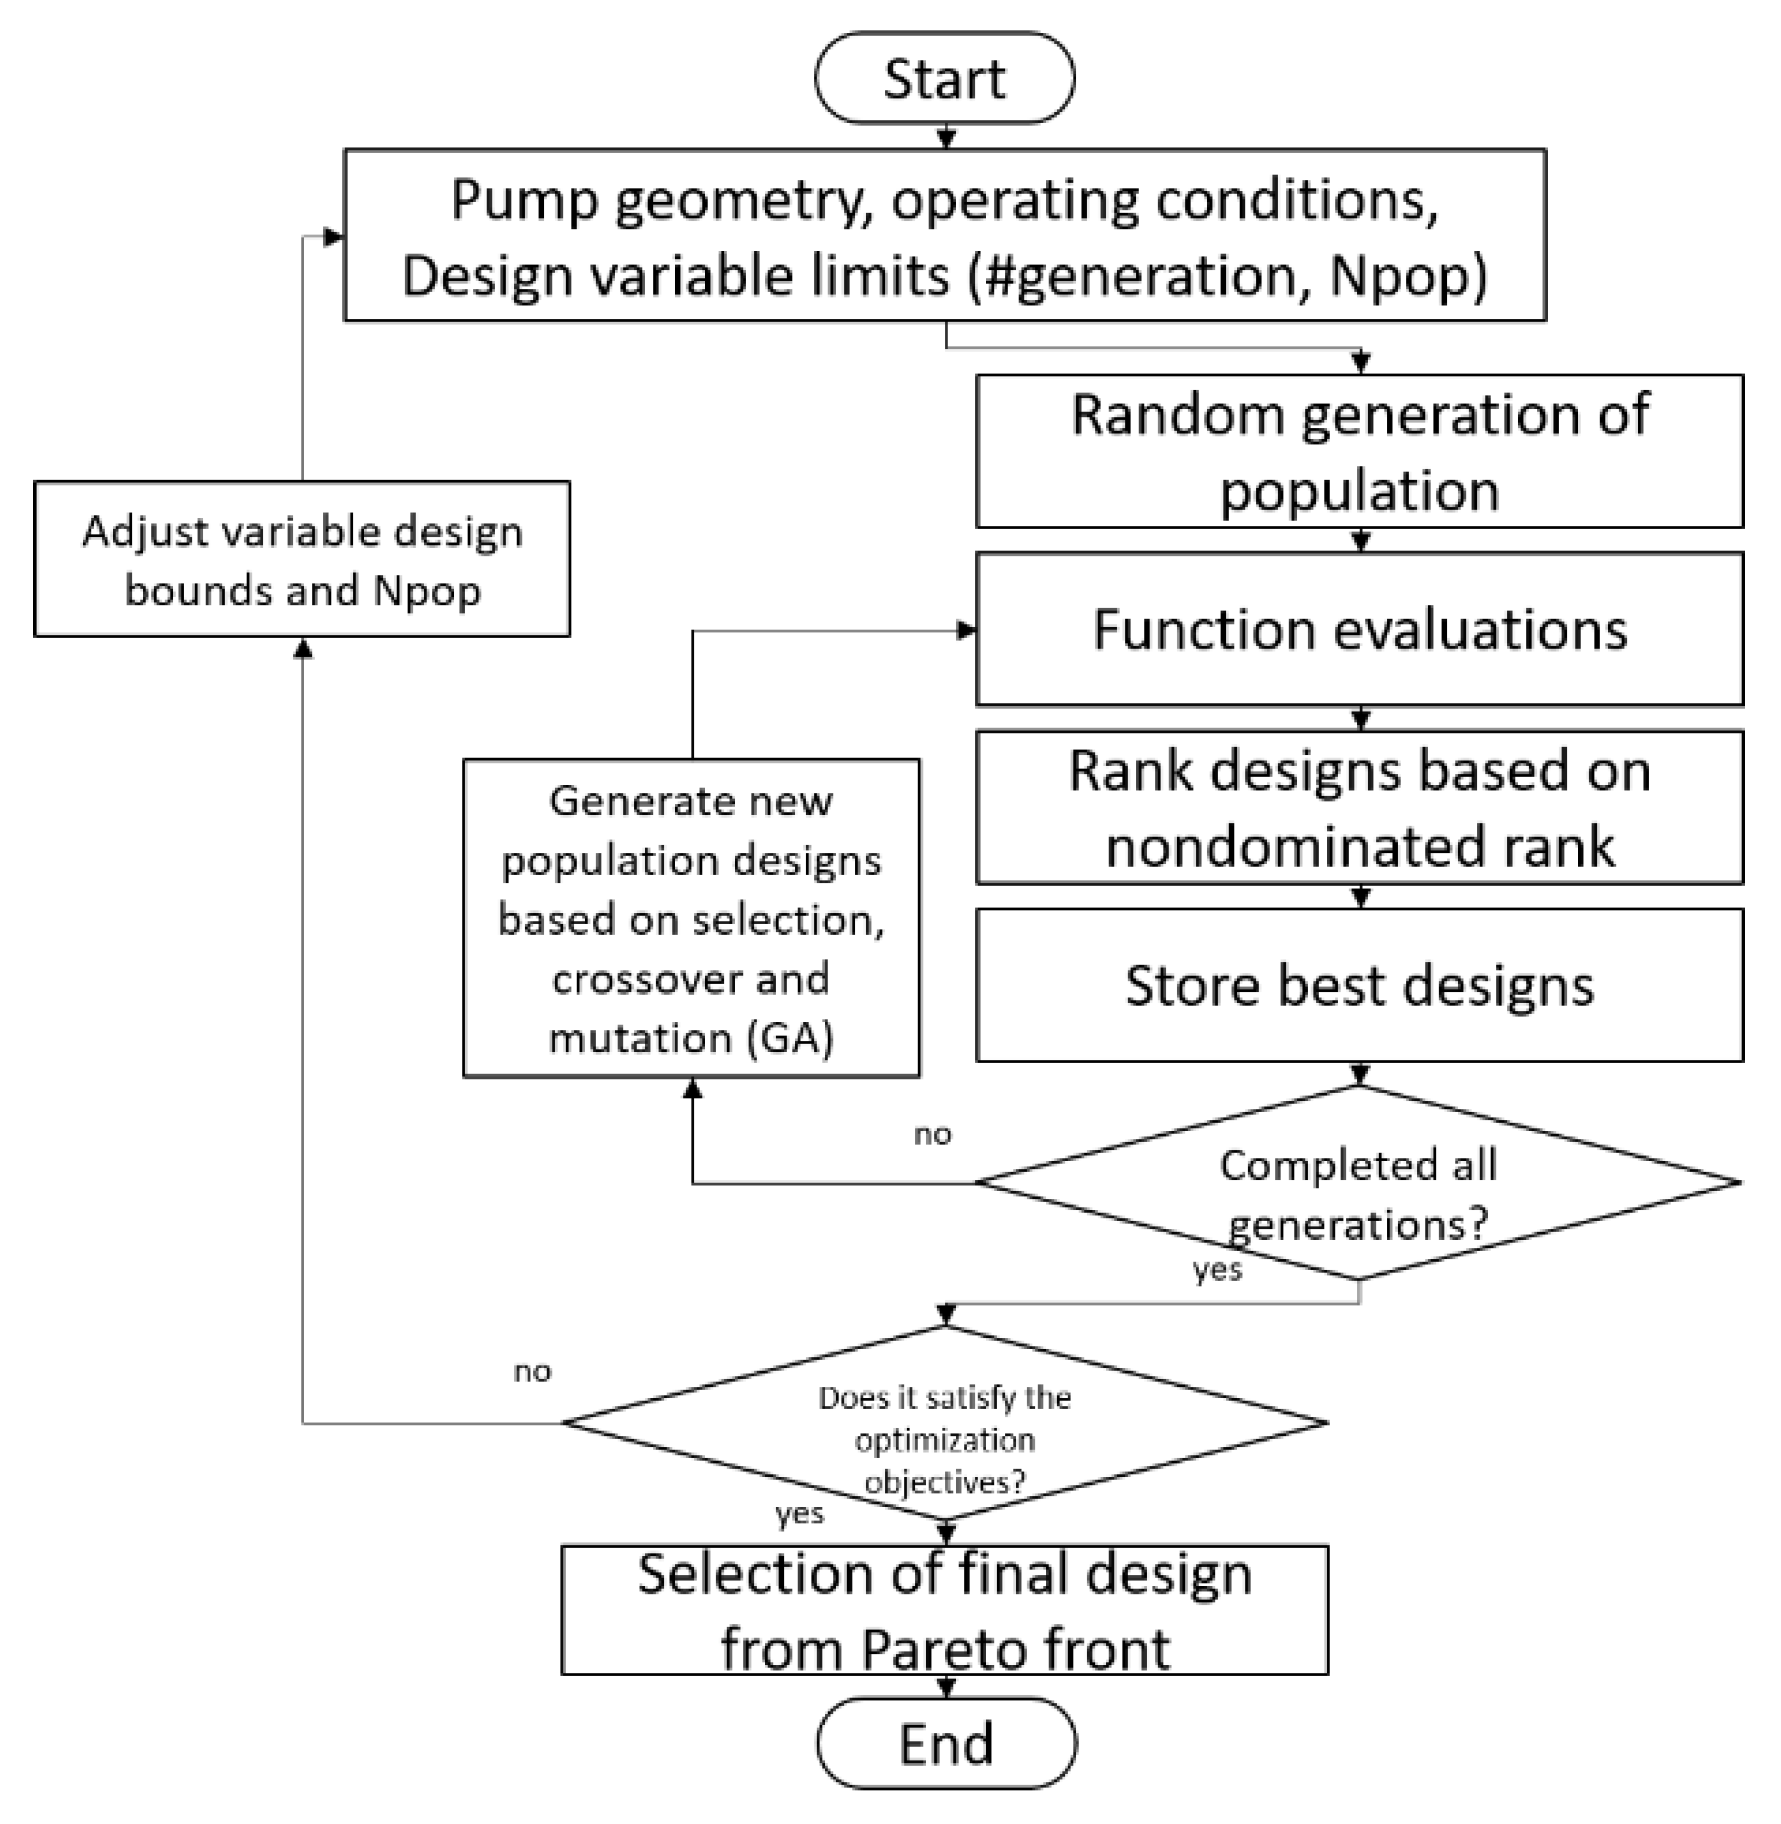
3. Valve Plate Timing Optimization
- Optimize pressure orifice in the displacement chamber to avoid cavitation.
- High volumetric efficiency.
- Low flow ripple.
- Low control effort on the swash plate.
- Low moment pulsation (∆Mx and ∆My).
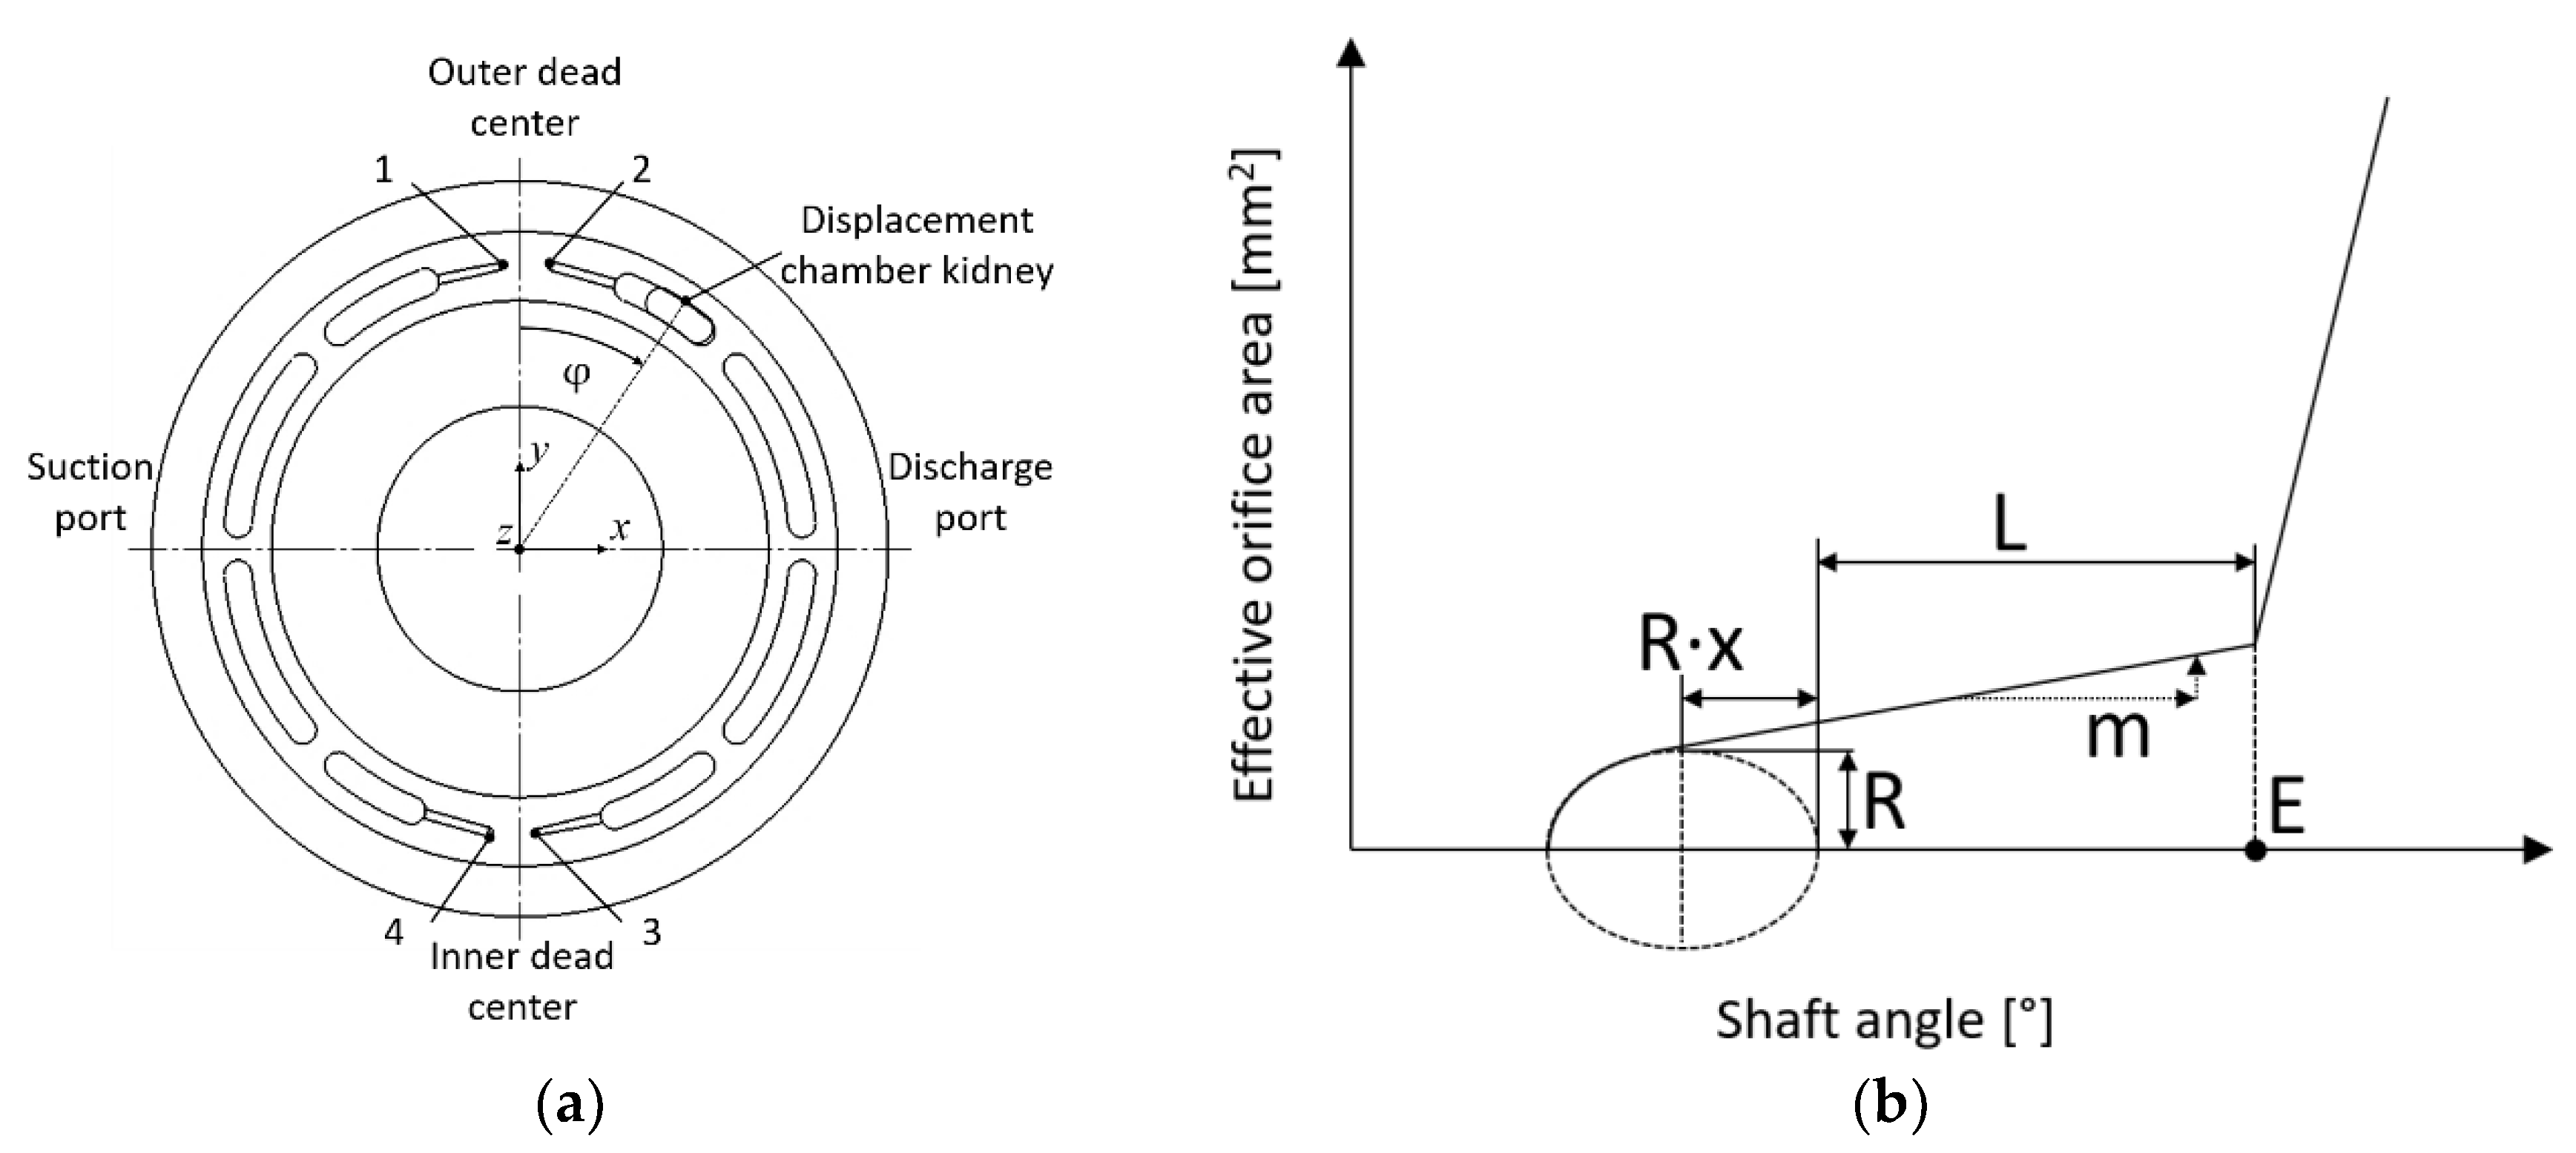
3.1. Valve Plate Optimization Design Parameters
3.2. Optimization Results Example
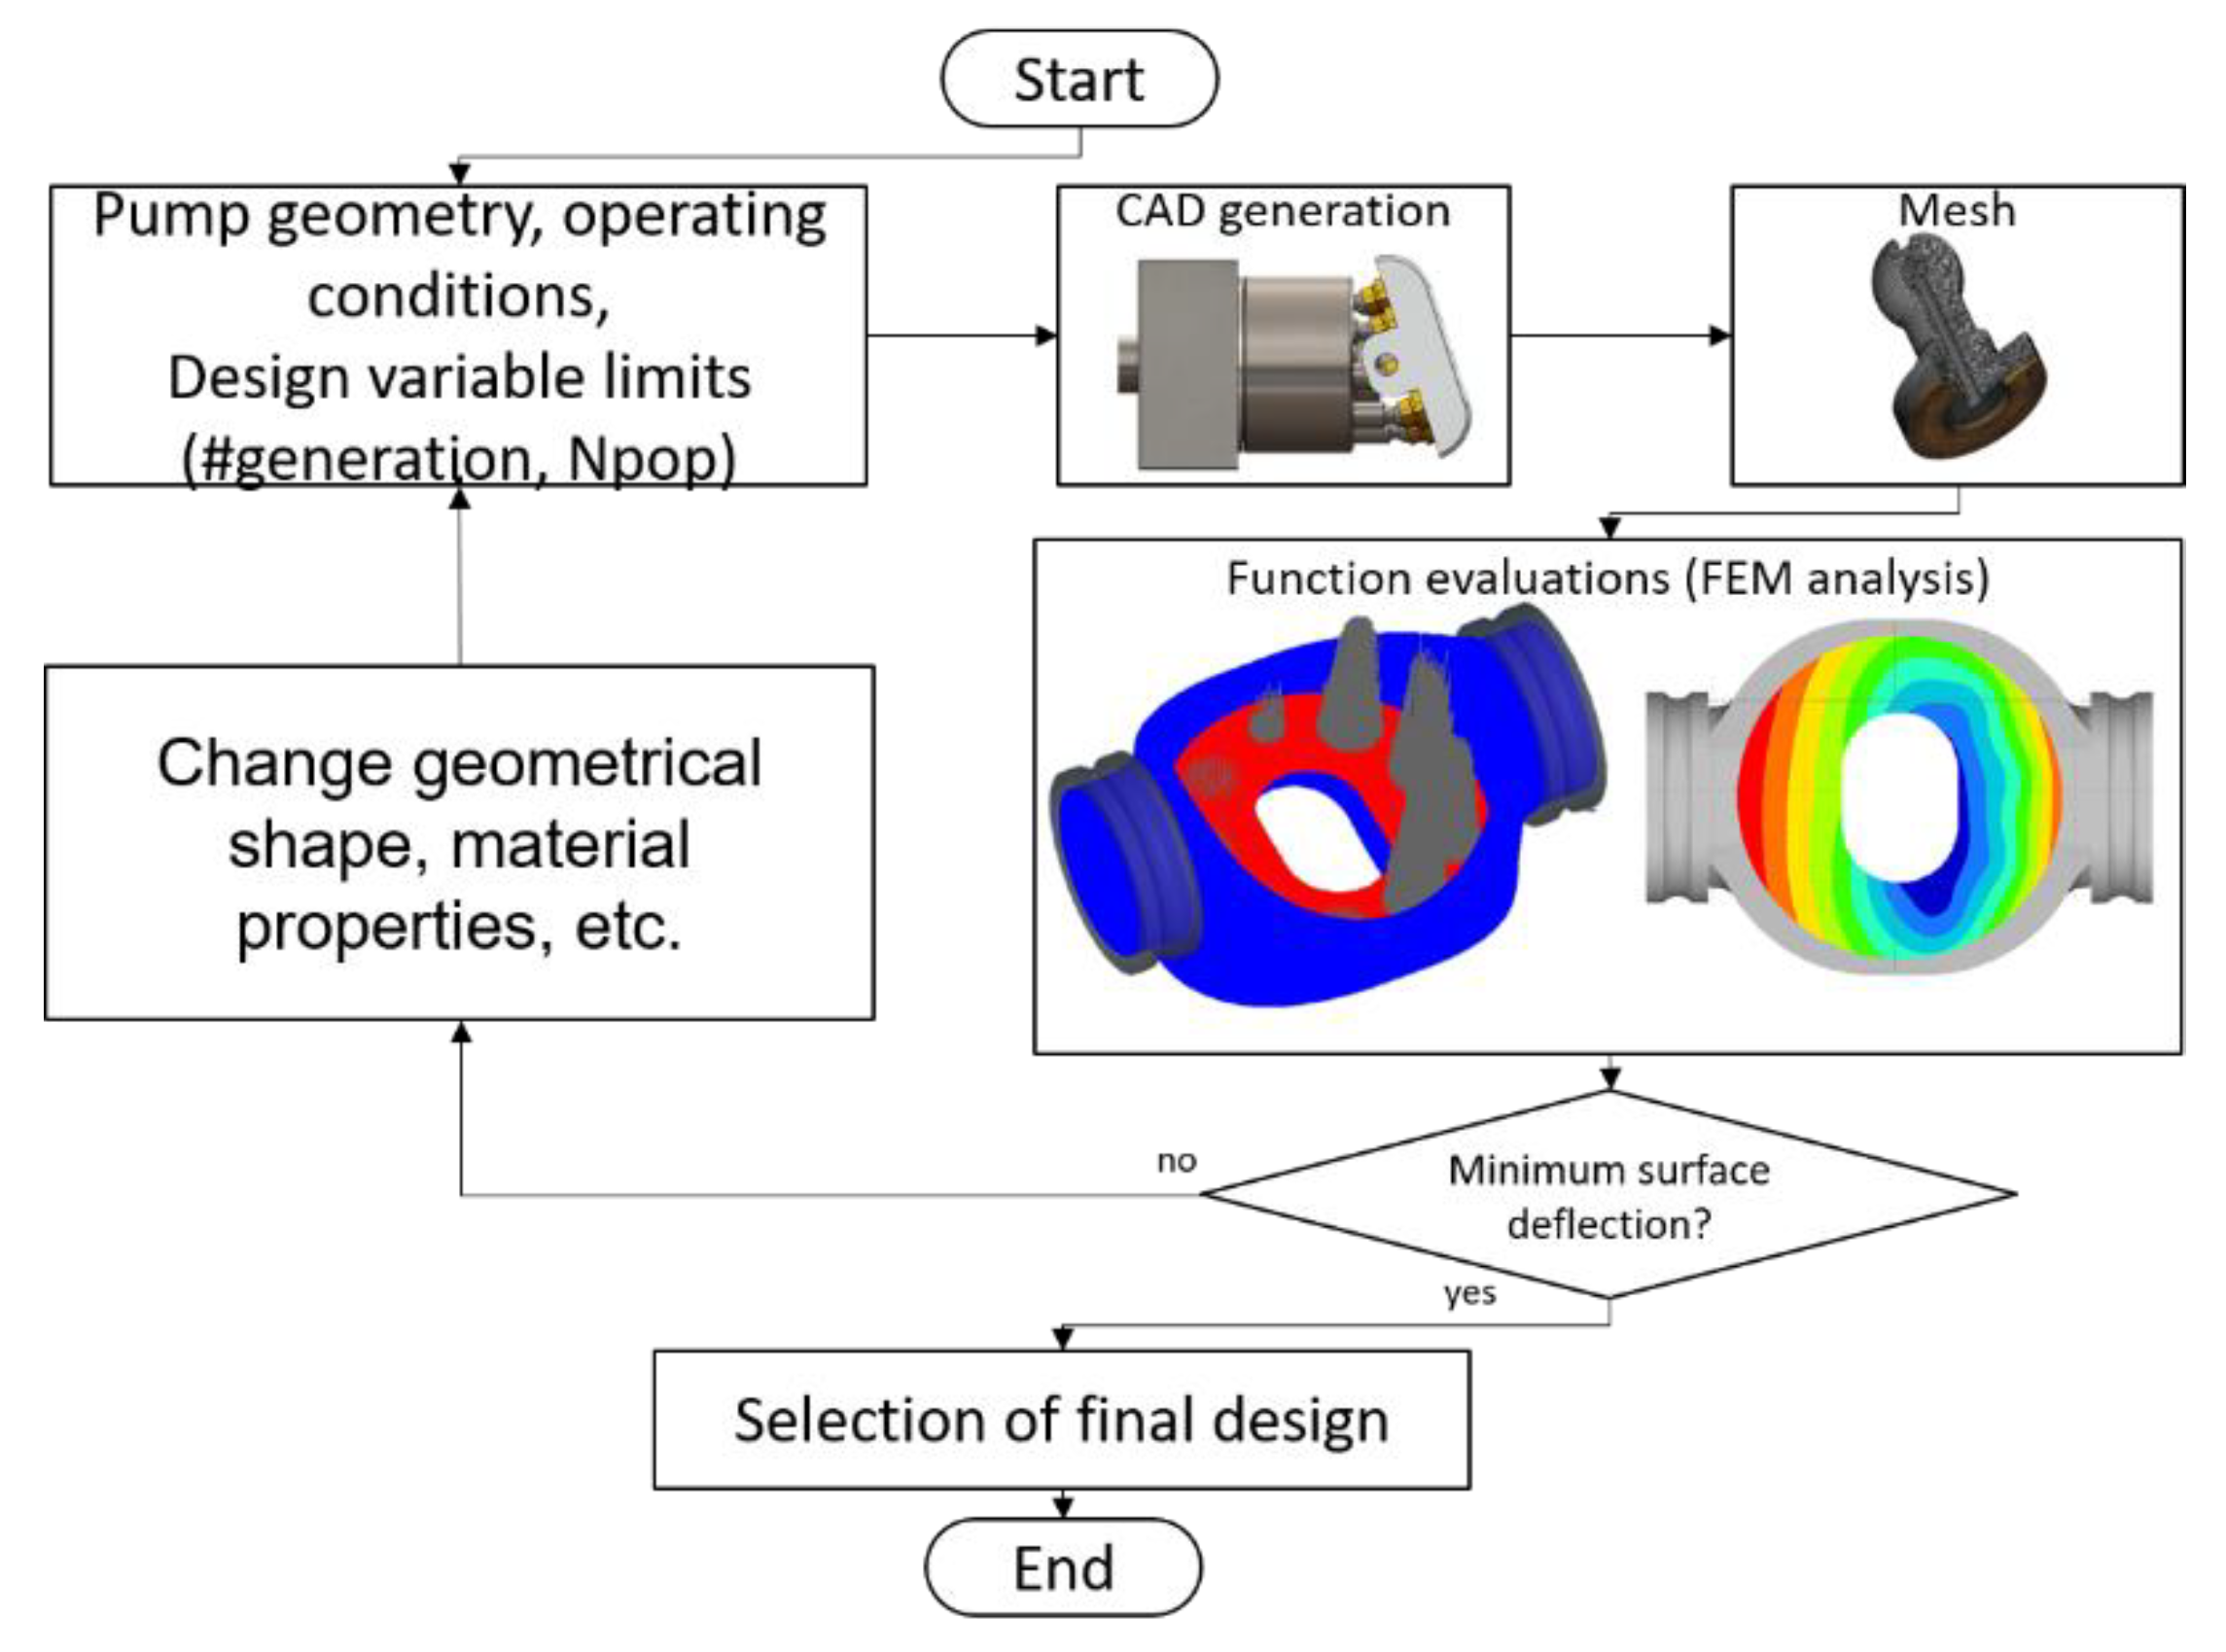
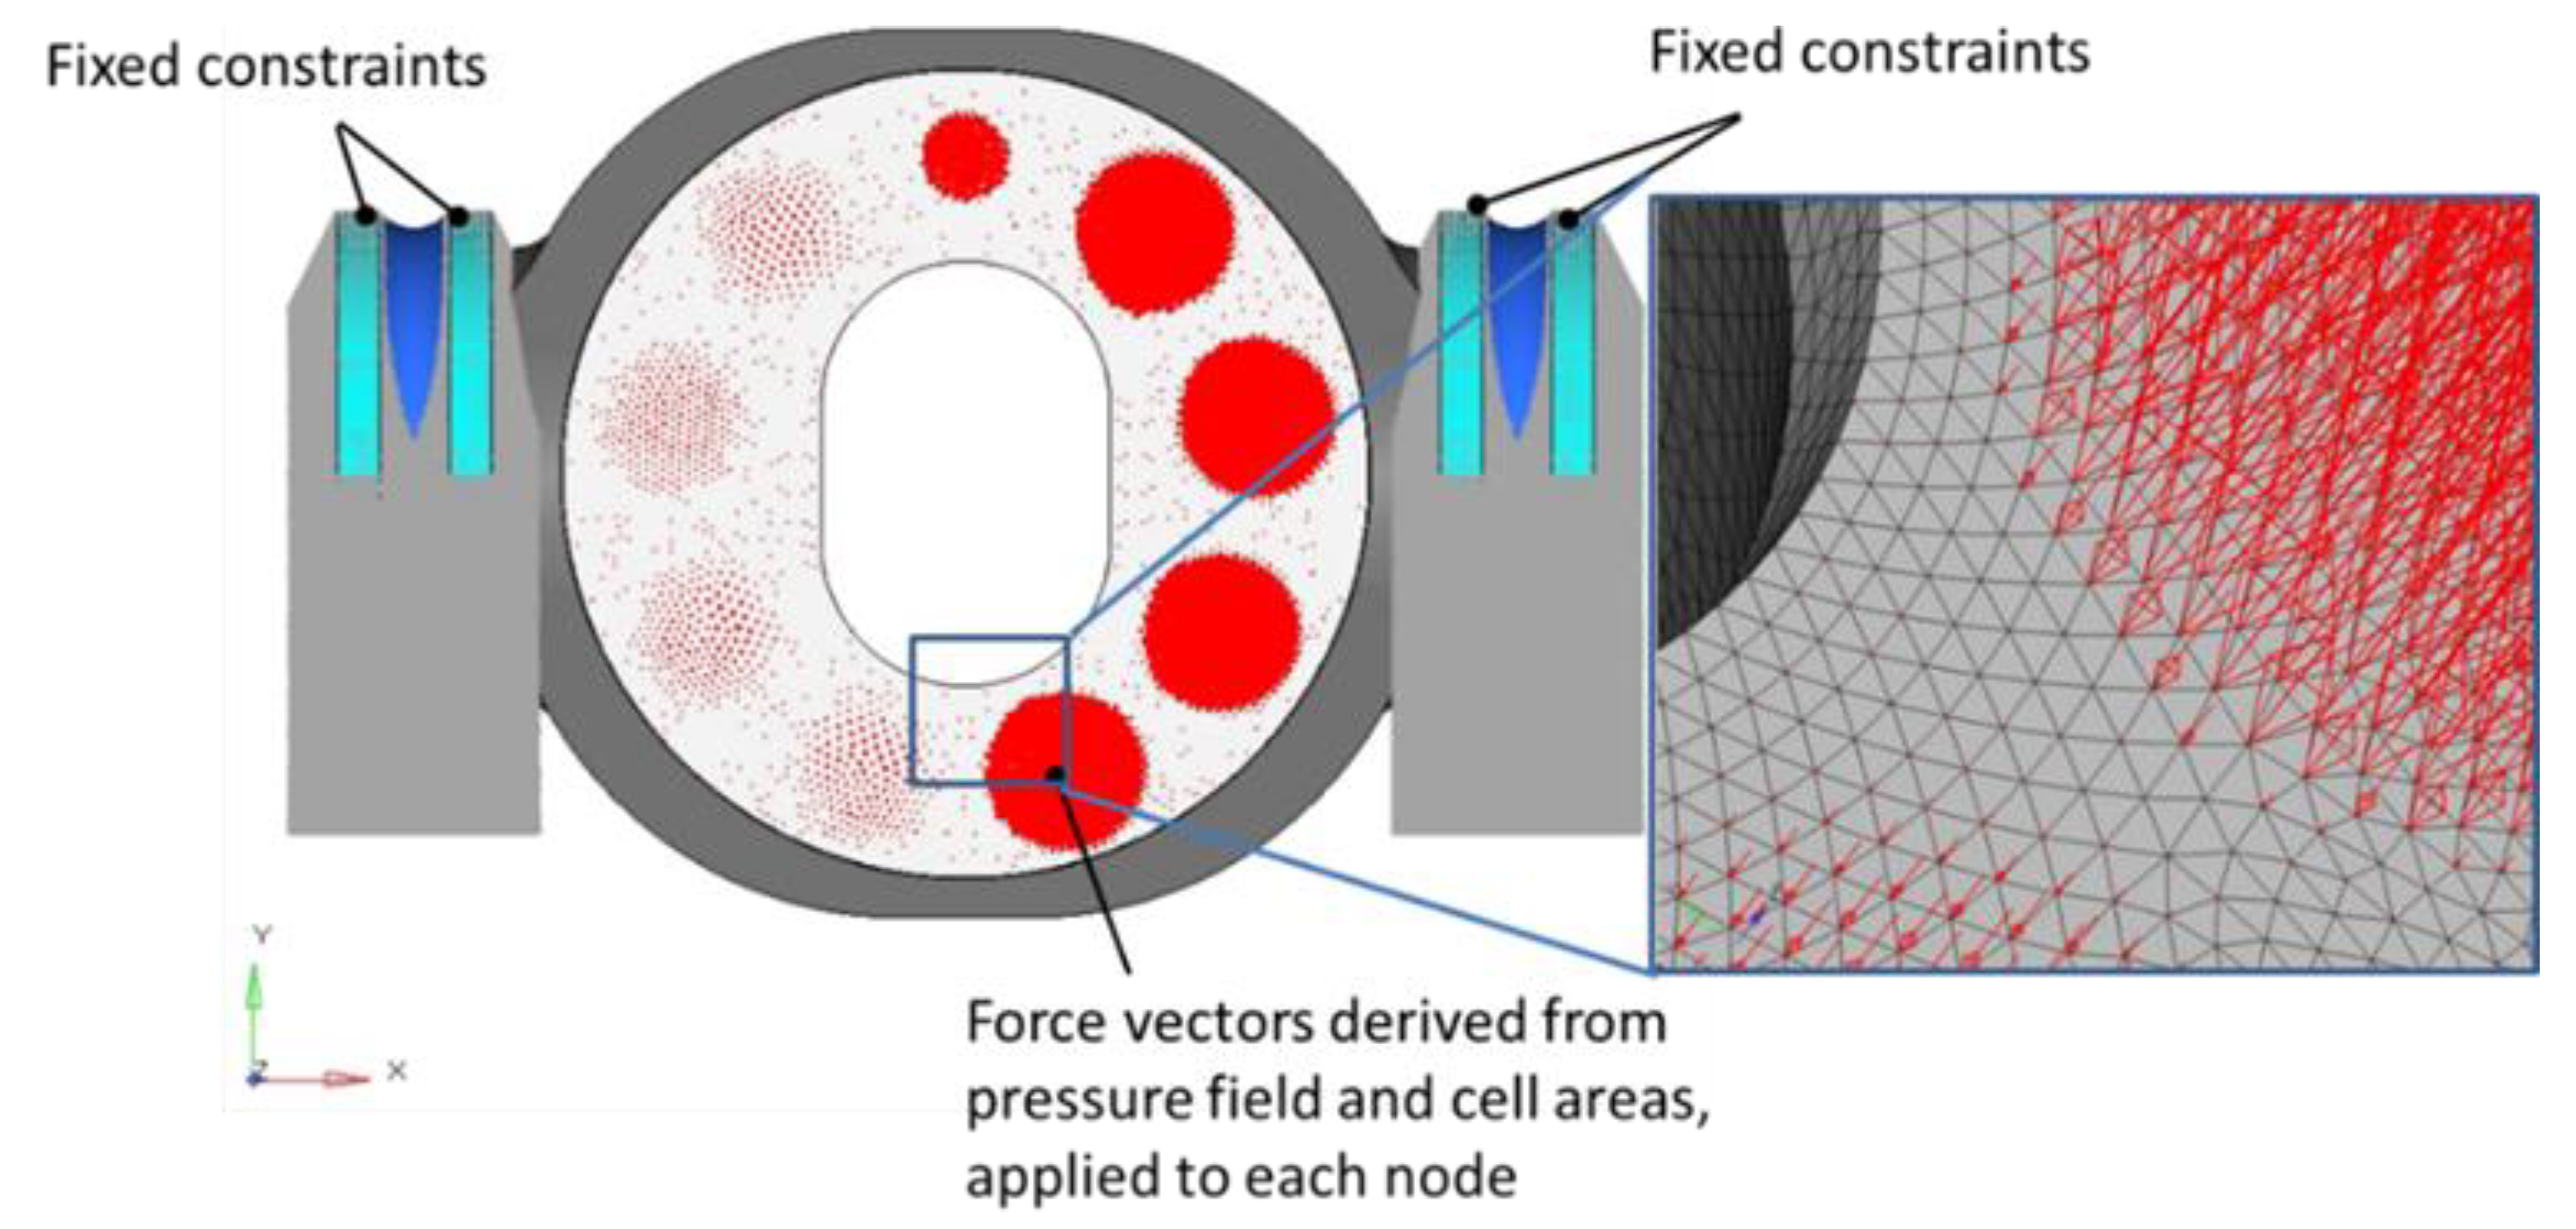
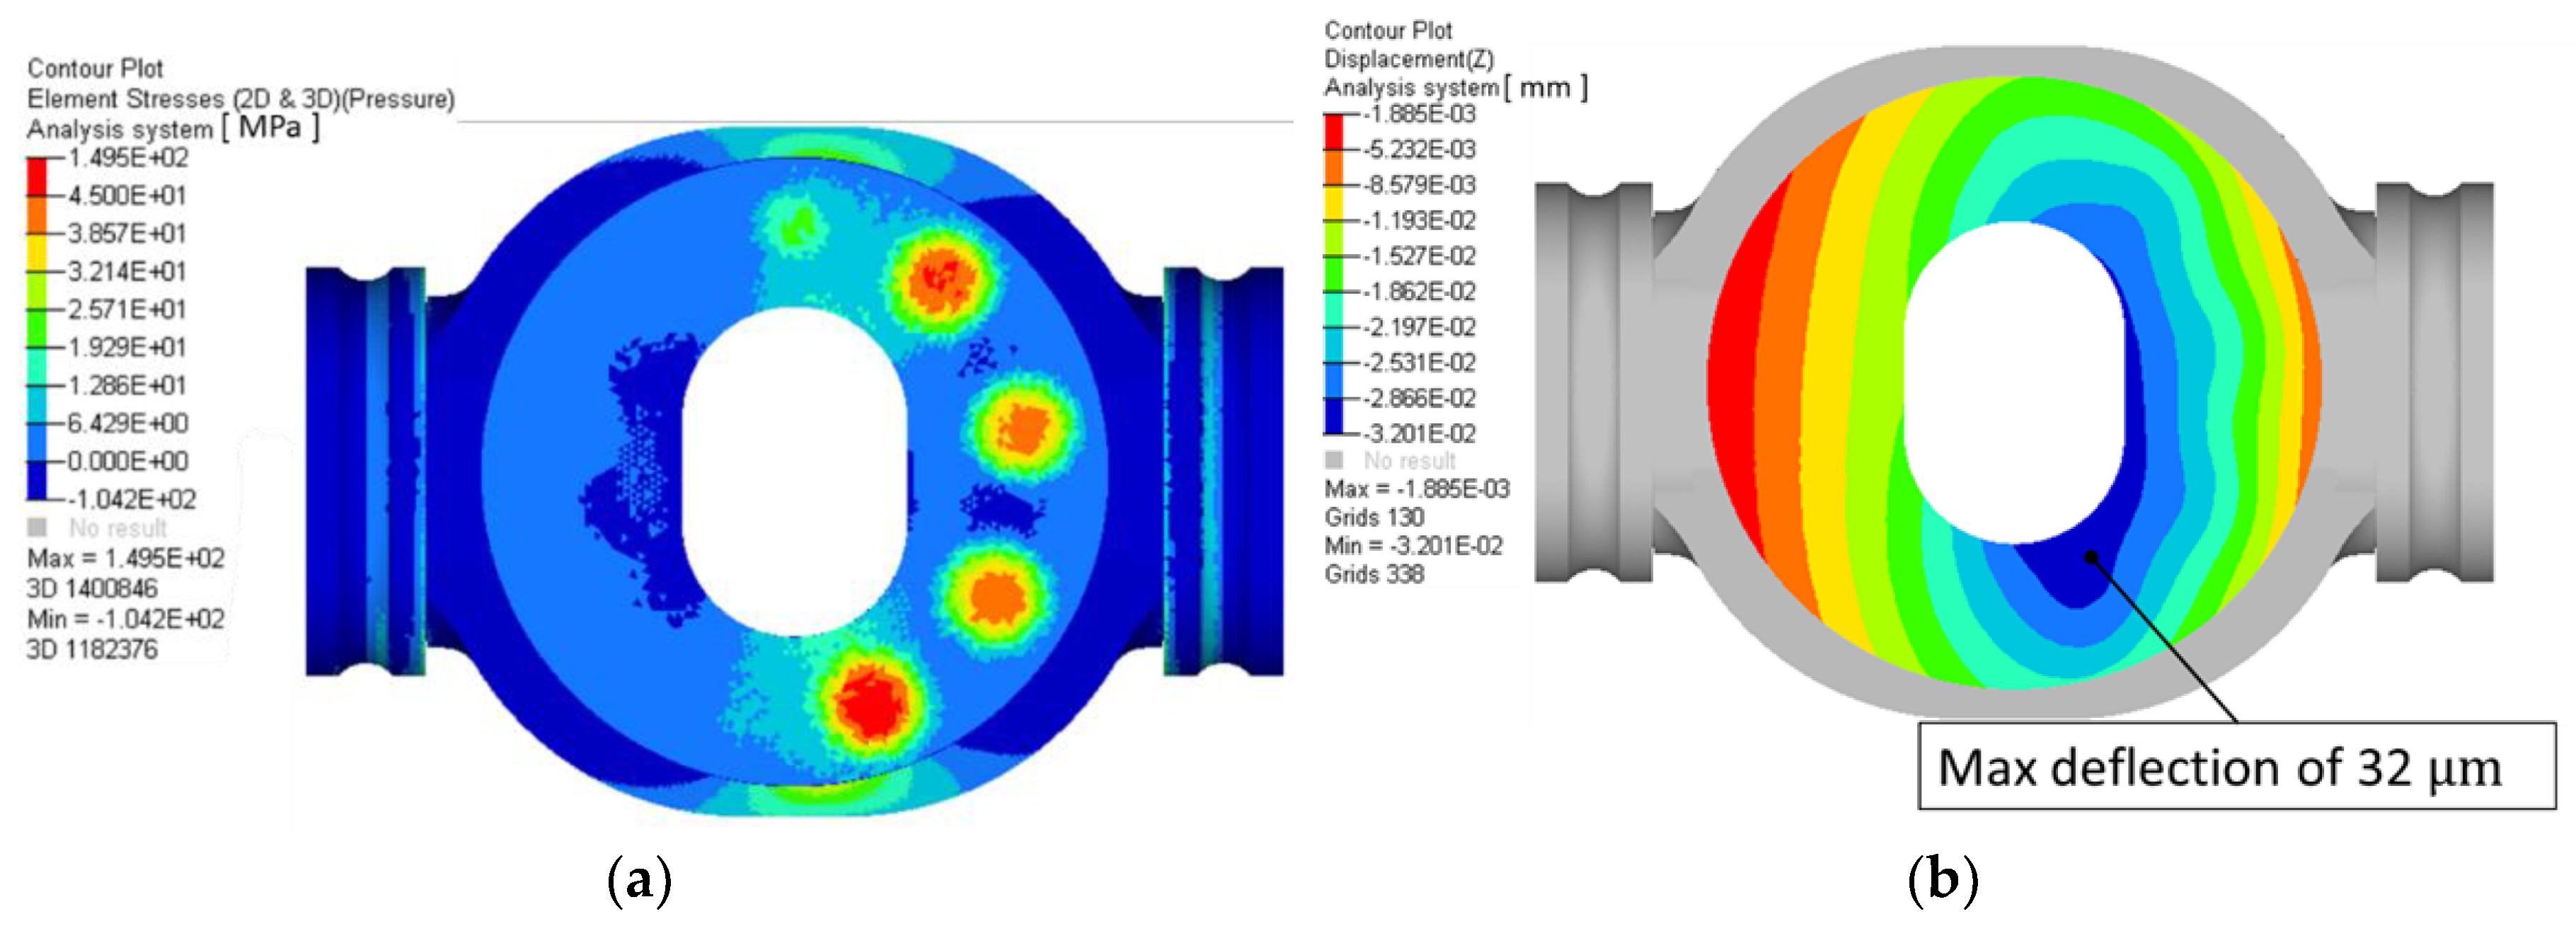
4. Virtual Prototyping for Solid Bodies
5. Virtual Prototyping for Lubricating Interfaces
- Fluid film thickness between the piston and the cylinder bore, the cylinder block and the valve plate, and the slipper and the swash plate.
- Pressure fields in the fluid film in the lubricating interfaces.
- Leakage flows in all three lubricating interfaces.
- Energy dissipation due to viscous flow in all three lubricating interfaces.
- Temperature distributions in the fluid film and main pump parts (cylinder block, piston, valve plate, slipper, swash plate, and end case).
- Surface deformations of the cylinder block, piston, valve plate, slipper, and swash plate due to pressure and thermal loading of these parts.
5.1. Material Selection
5.2. Operating Conditions
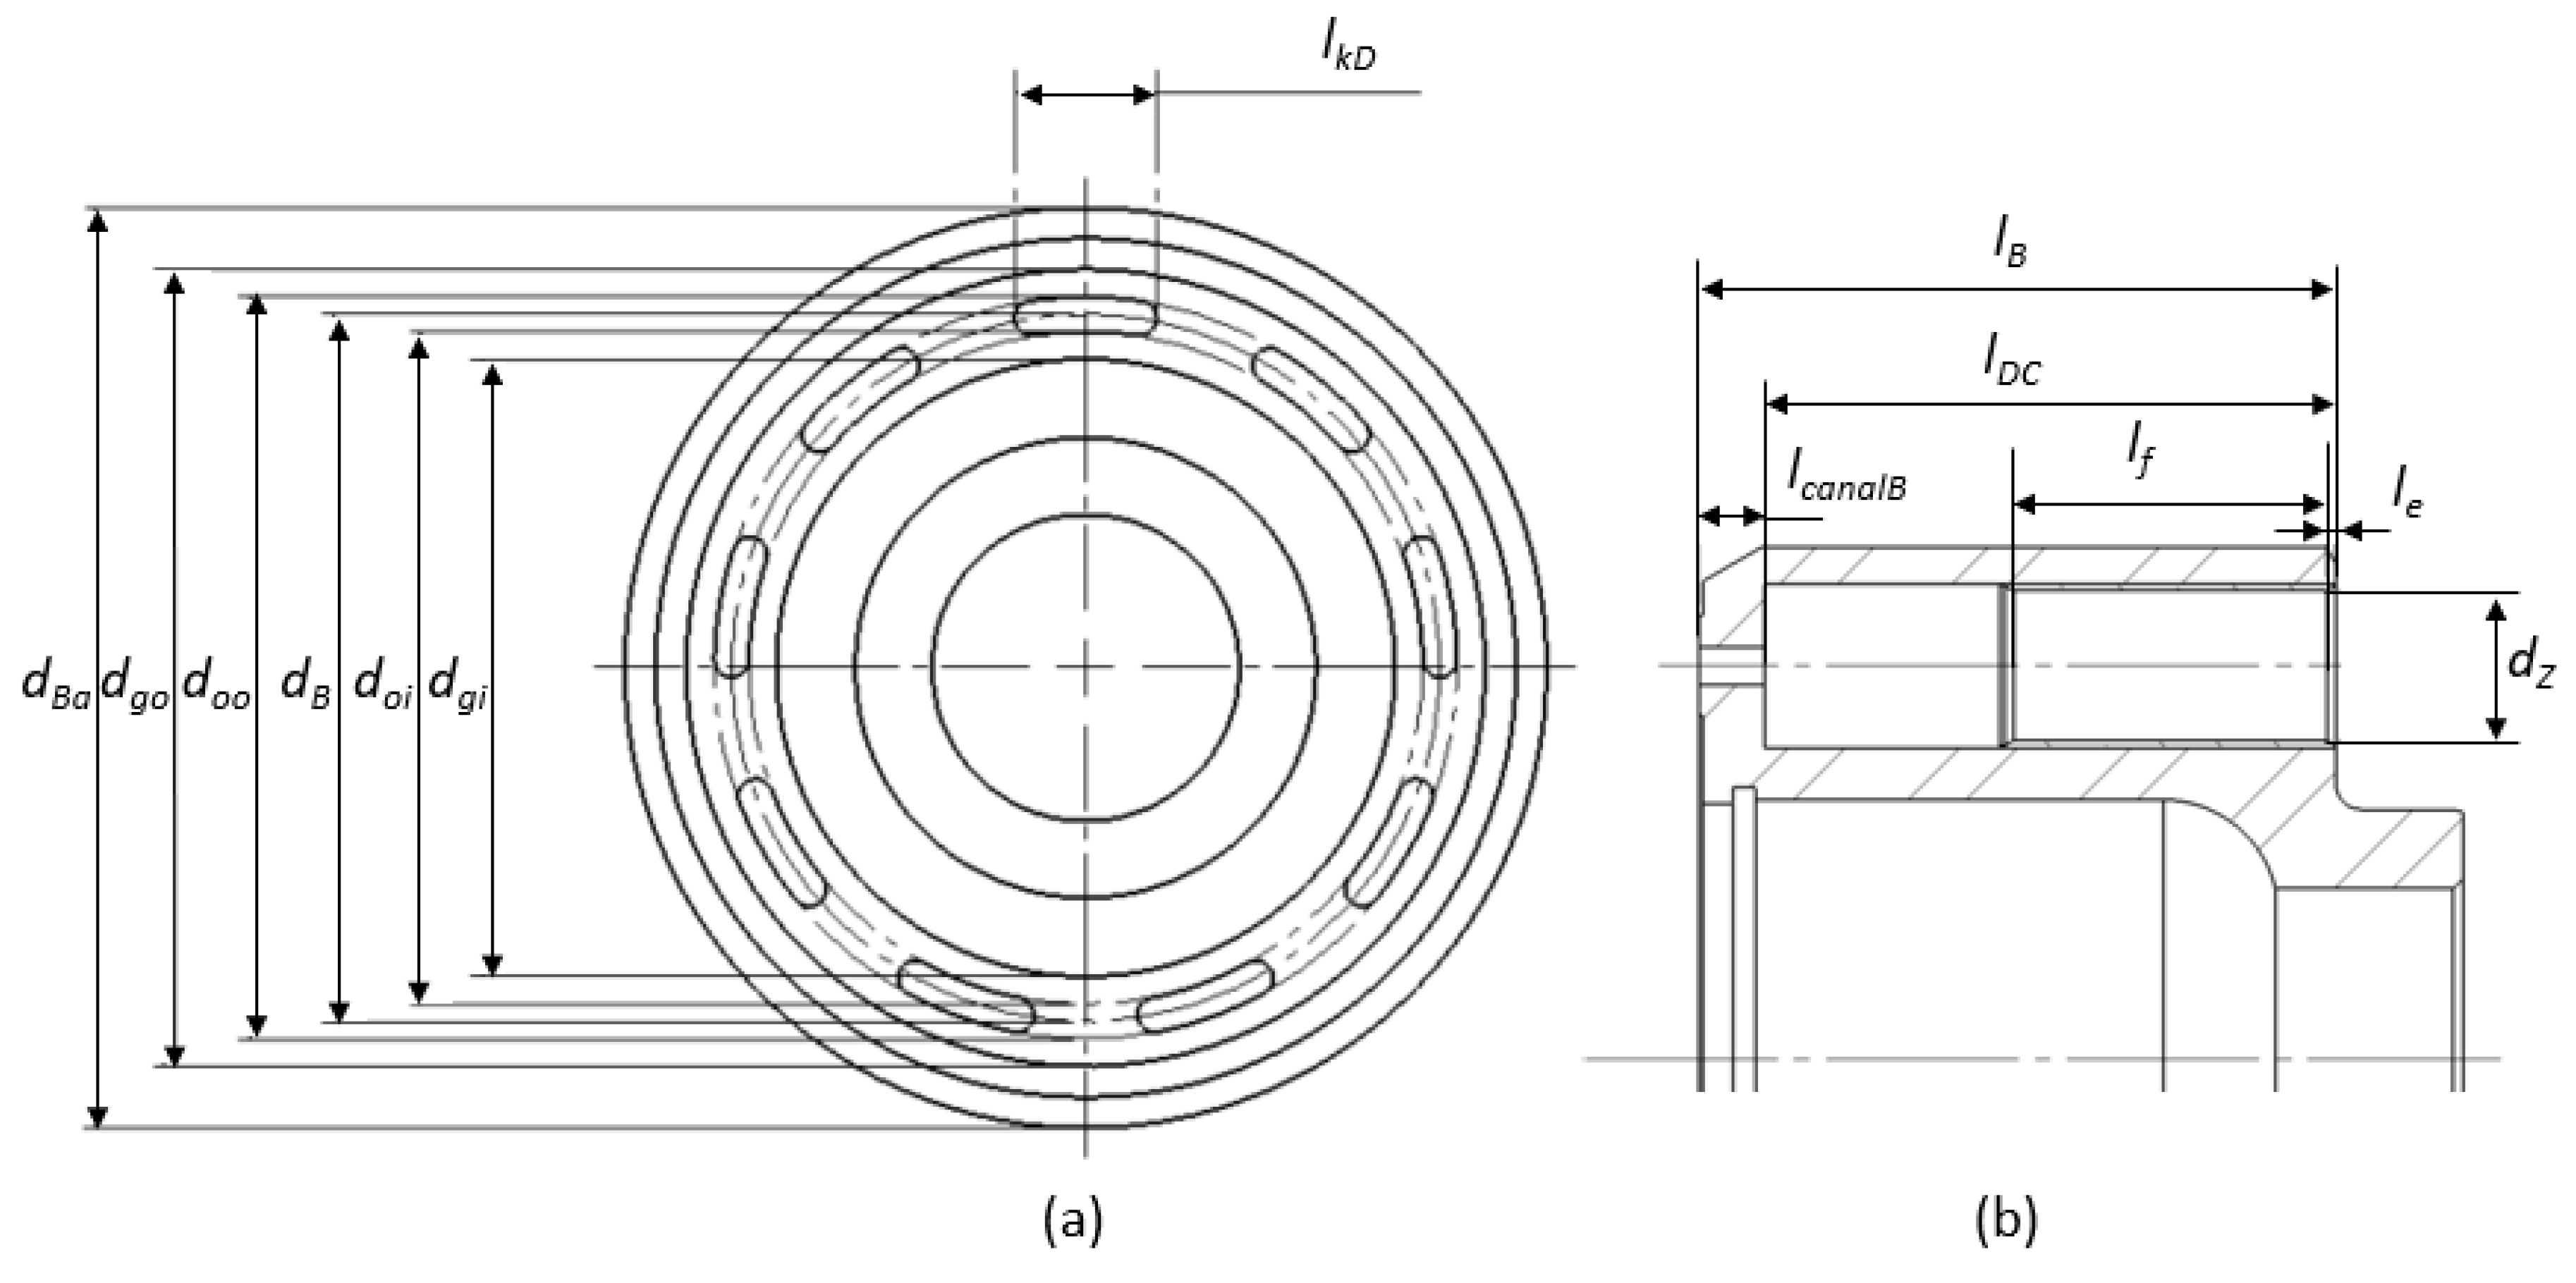
5.3. Cylinder Block/Valve Plate Interface Design Variables within Virtual Prototyping Variables
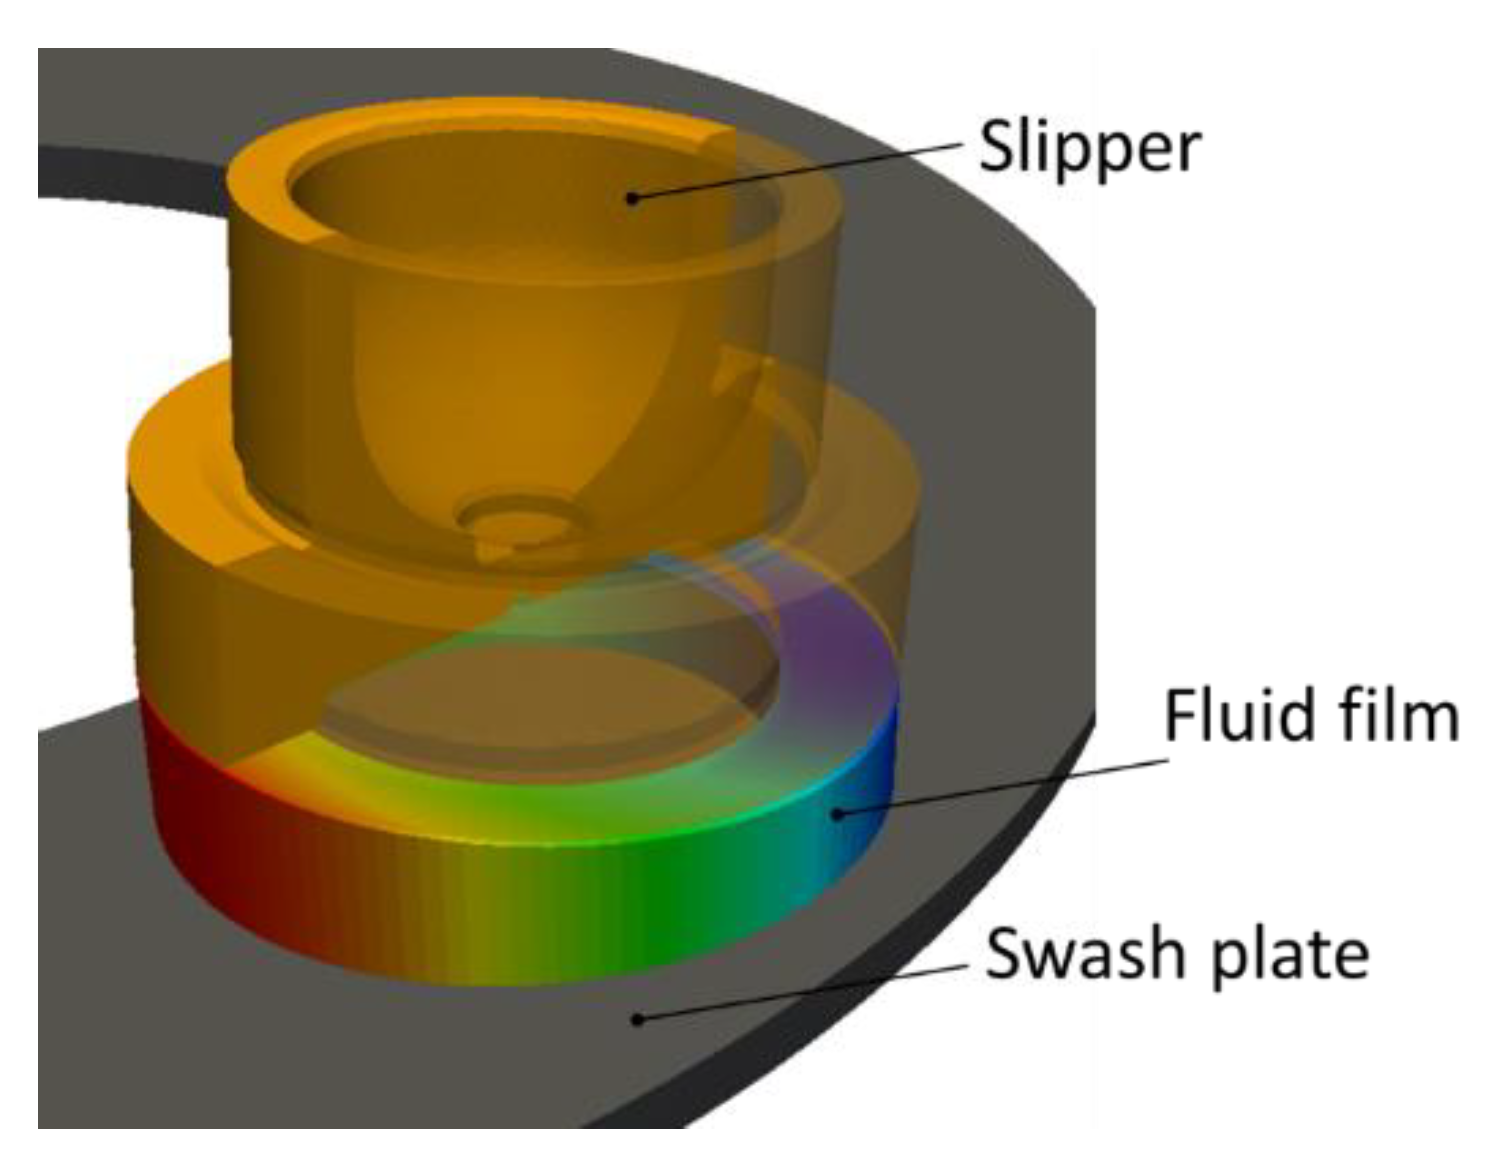
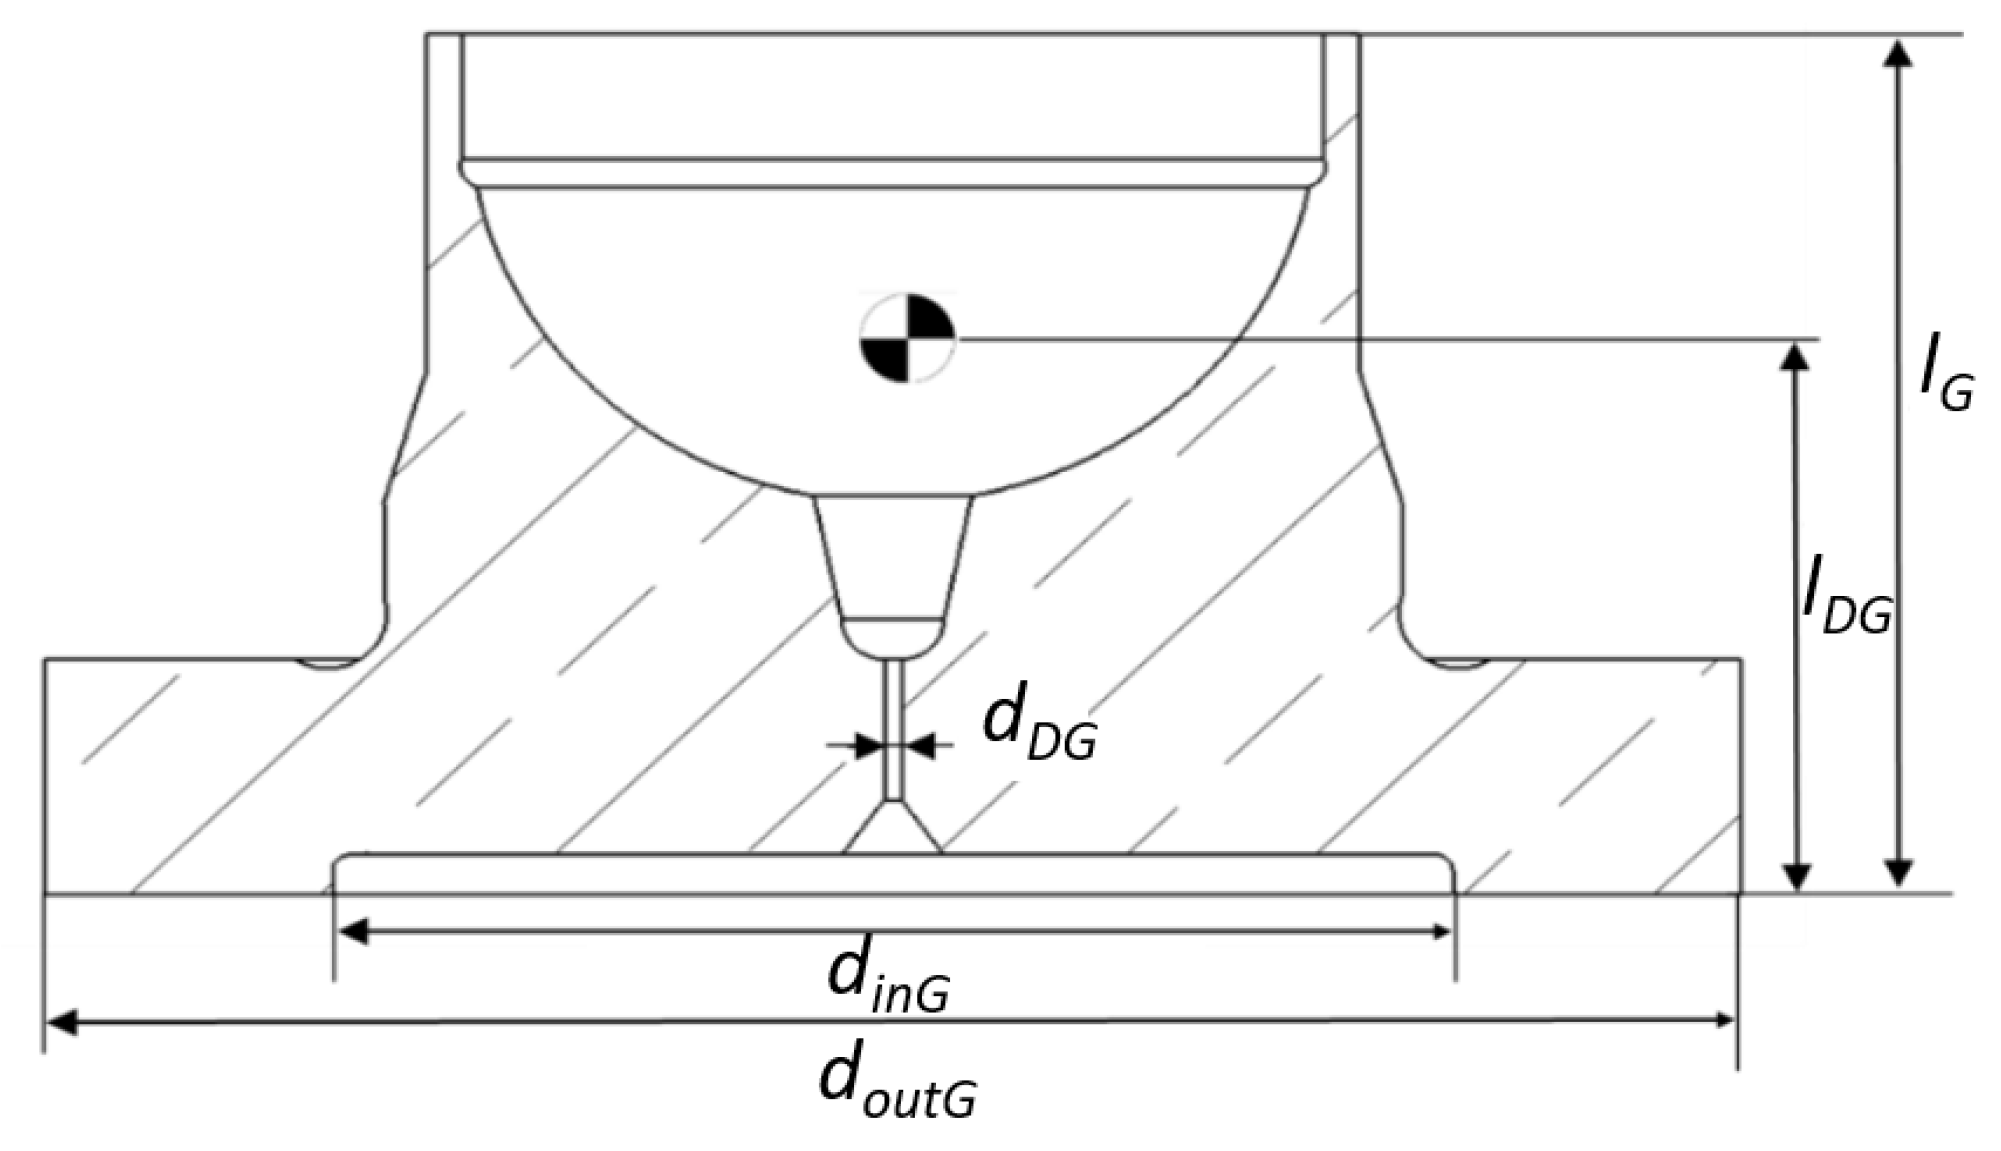
5.4. Slipper/Swash Plate Interface Design Variables within Virtual Prototyping Variables
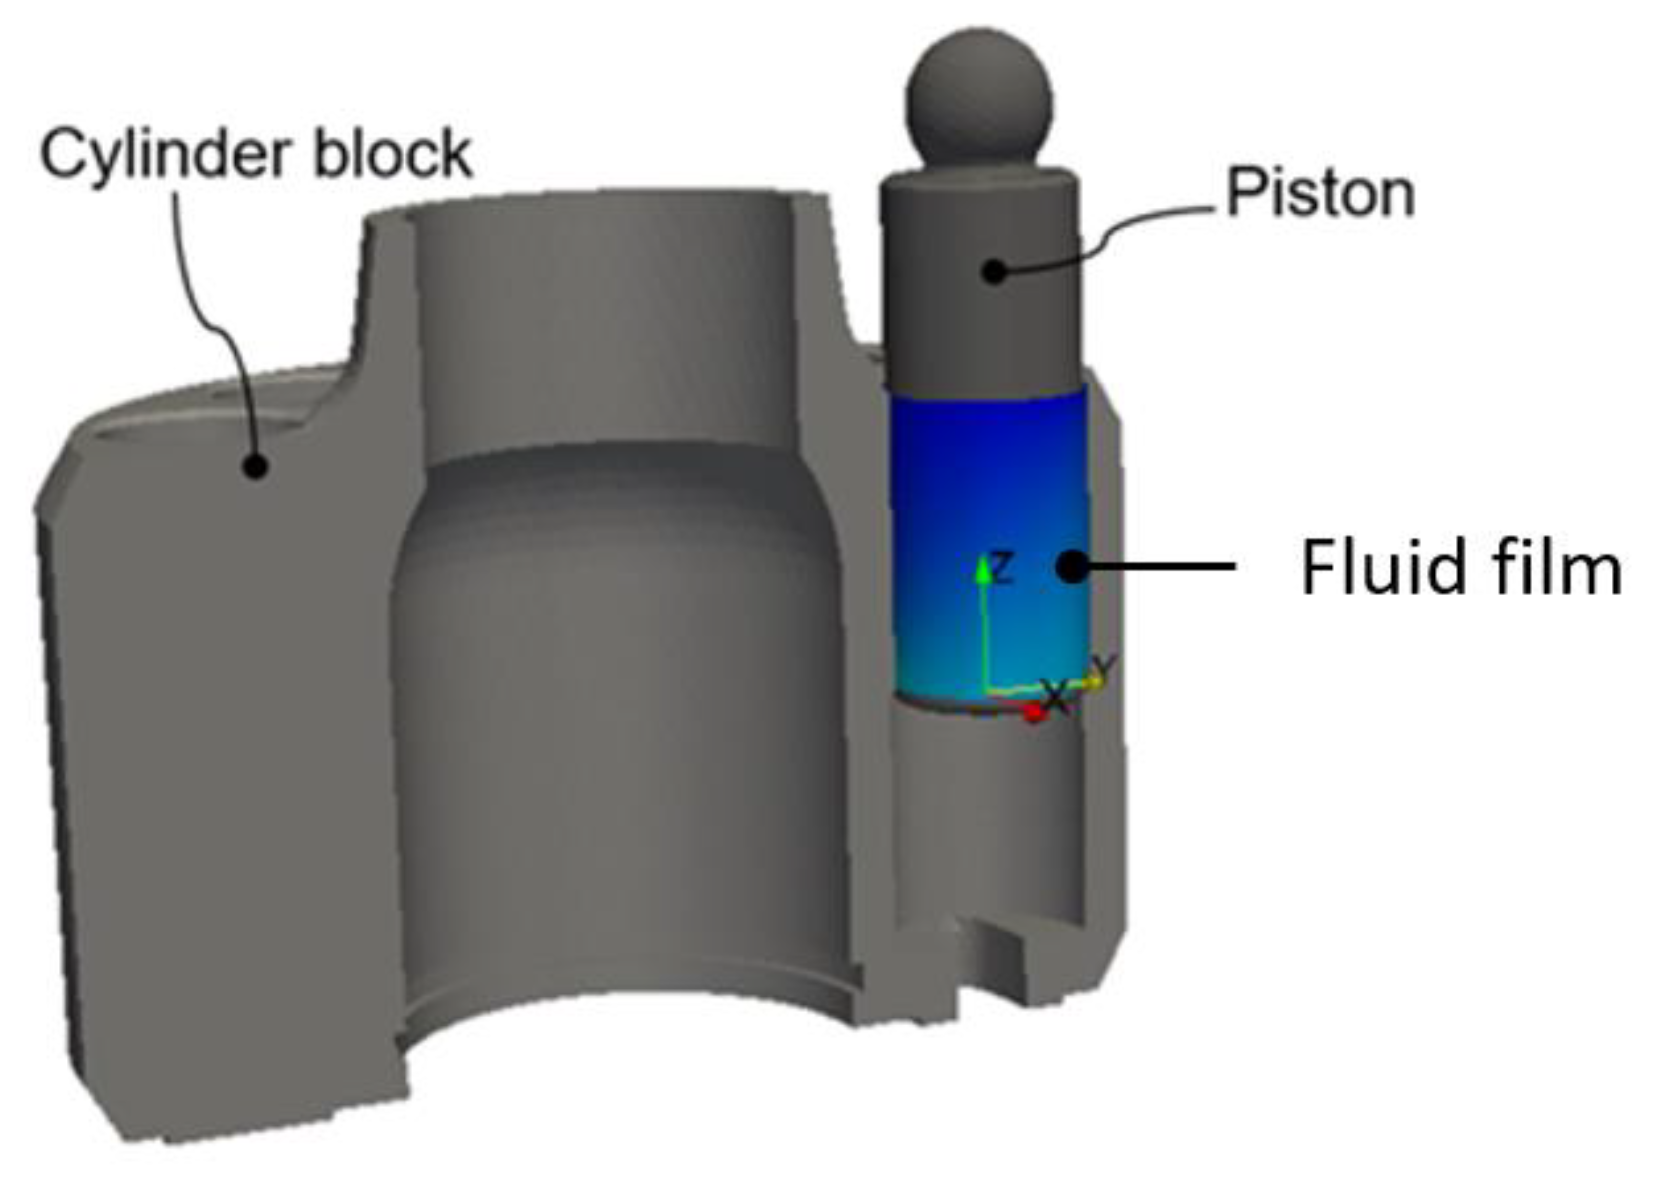
5.5. Piston/Cylinder Interface Design Variables within Virtual Prototyping Variables
6. Experimental Results and Comparison Against Simulations
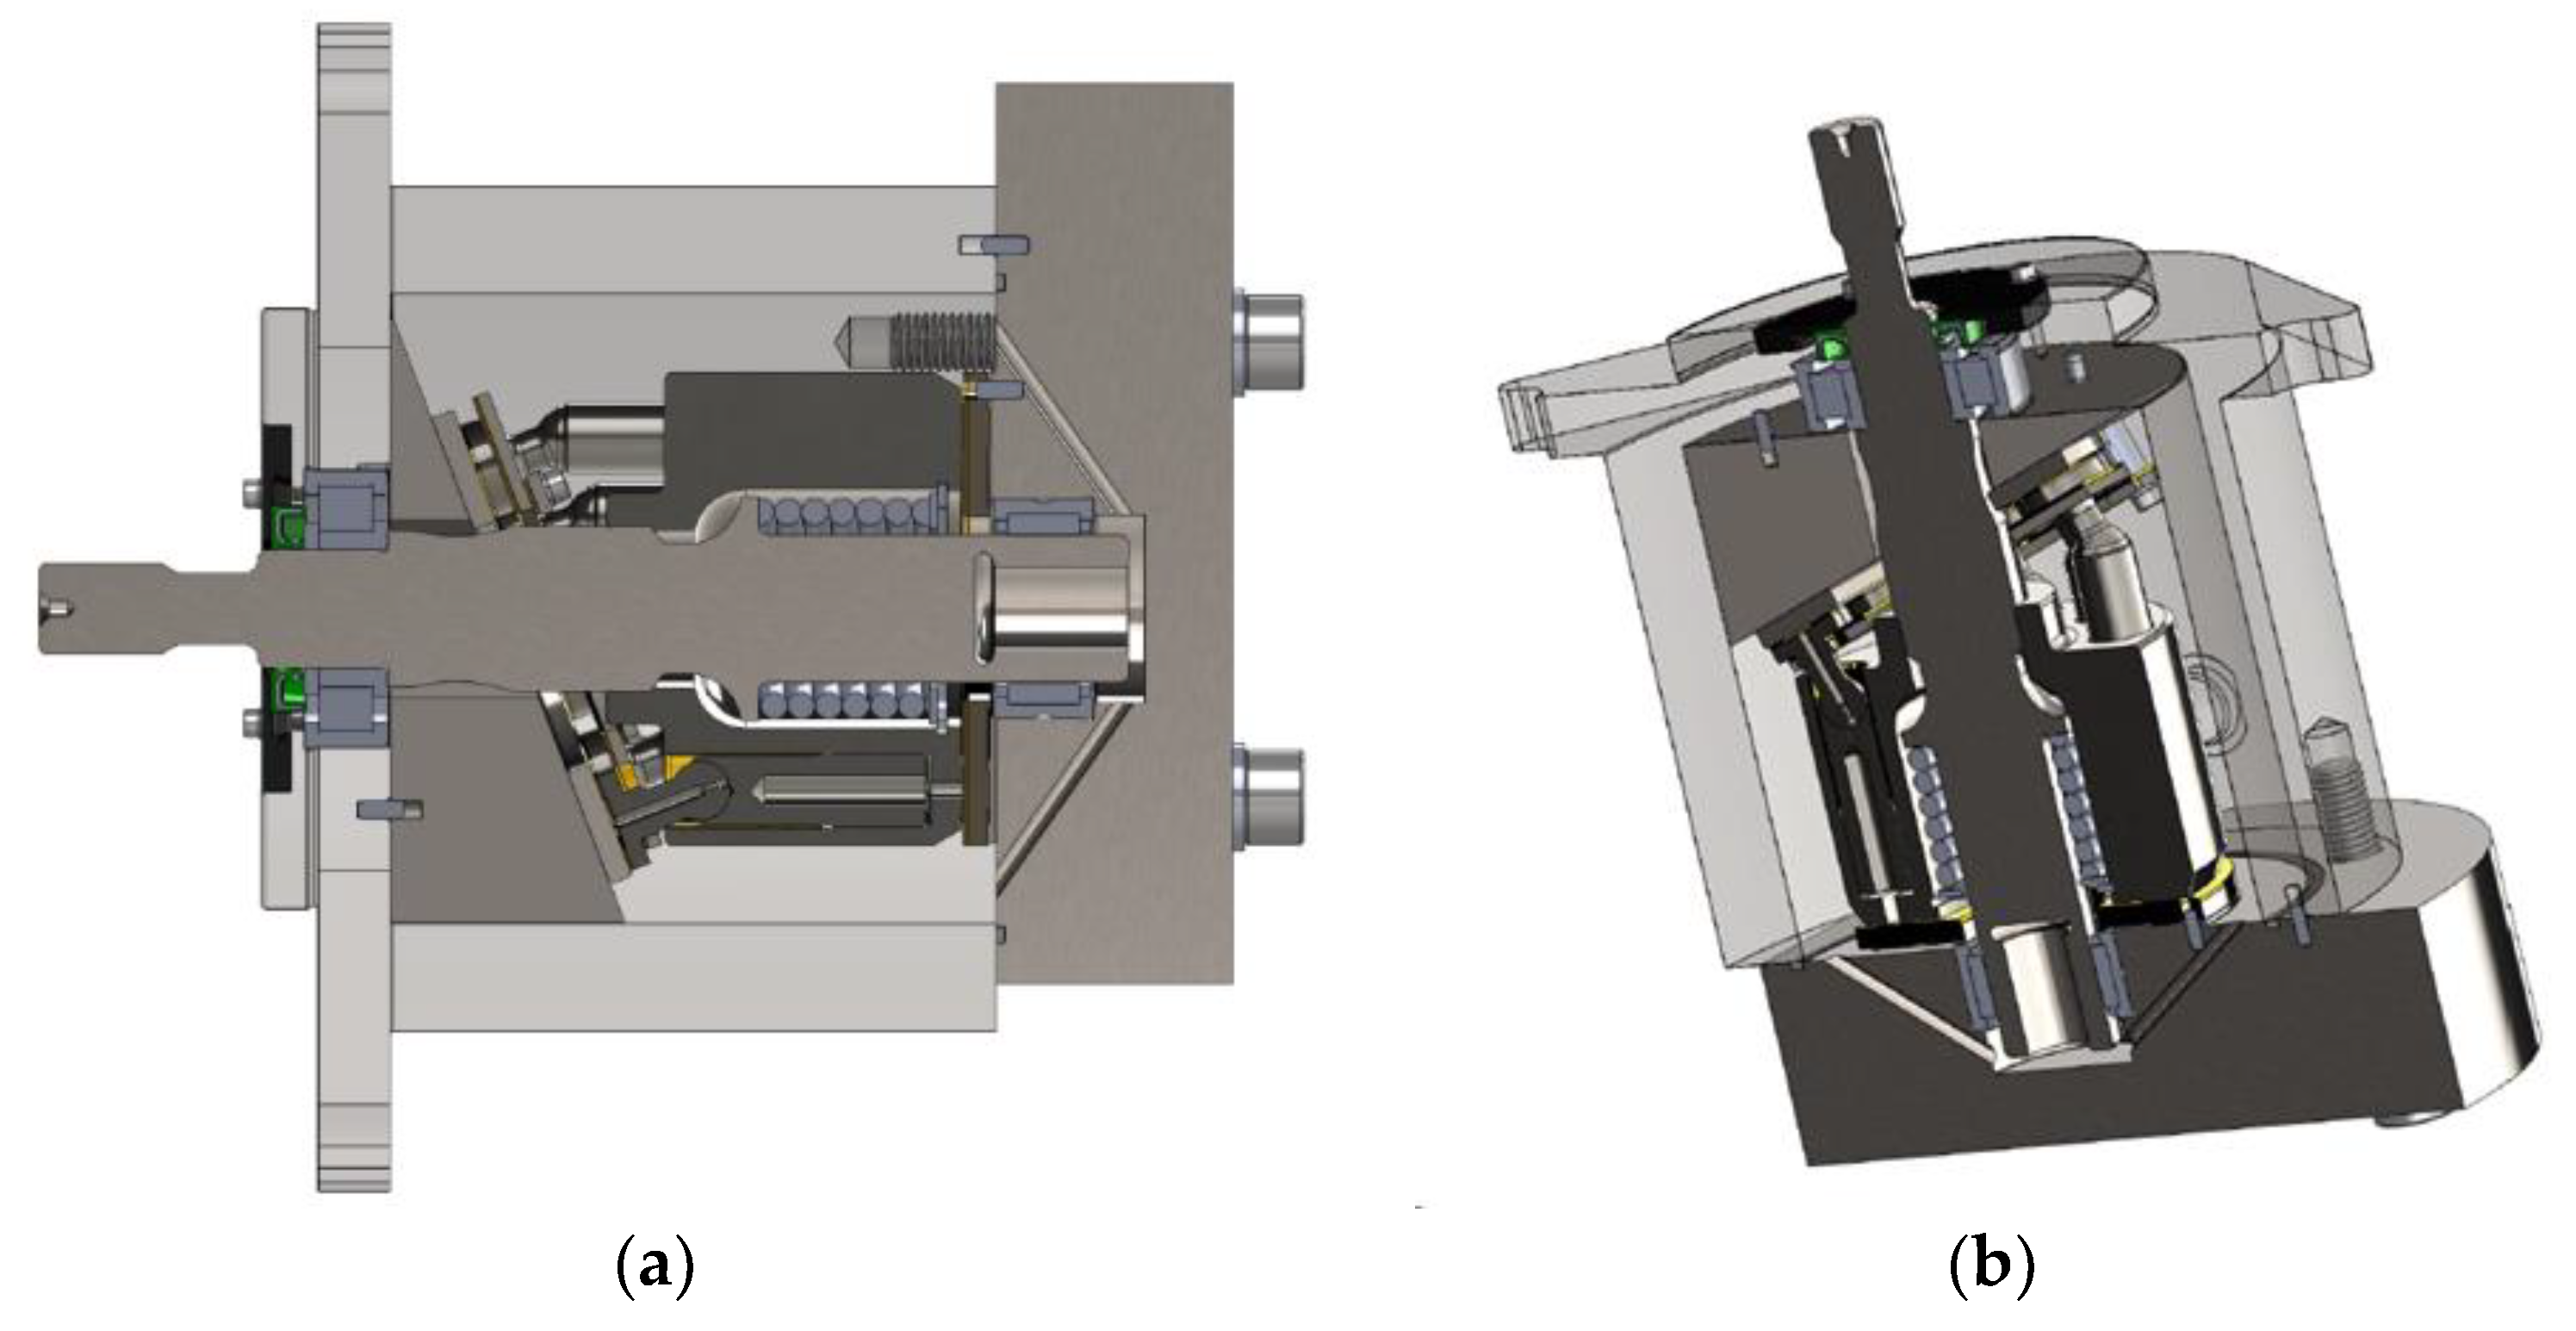
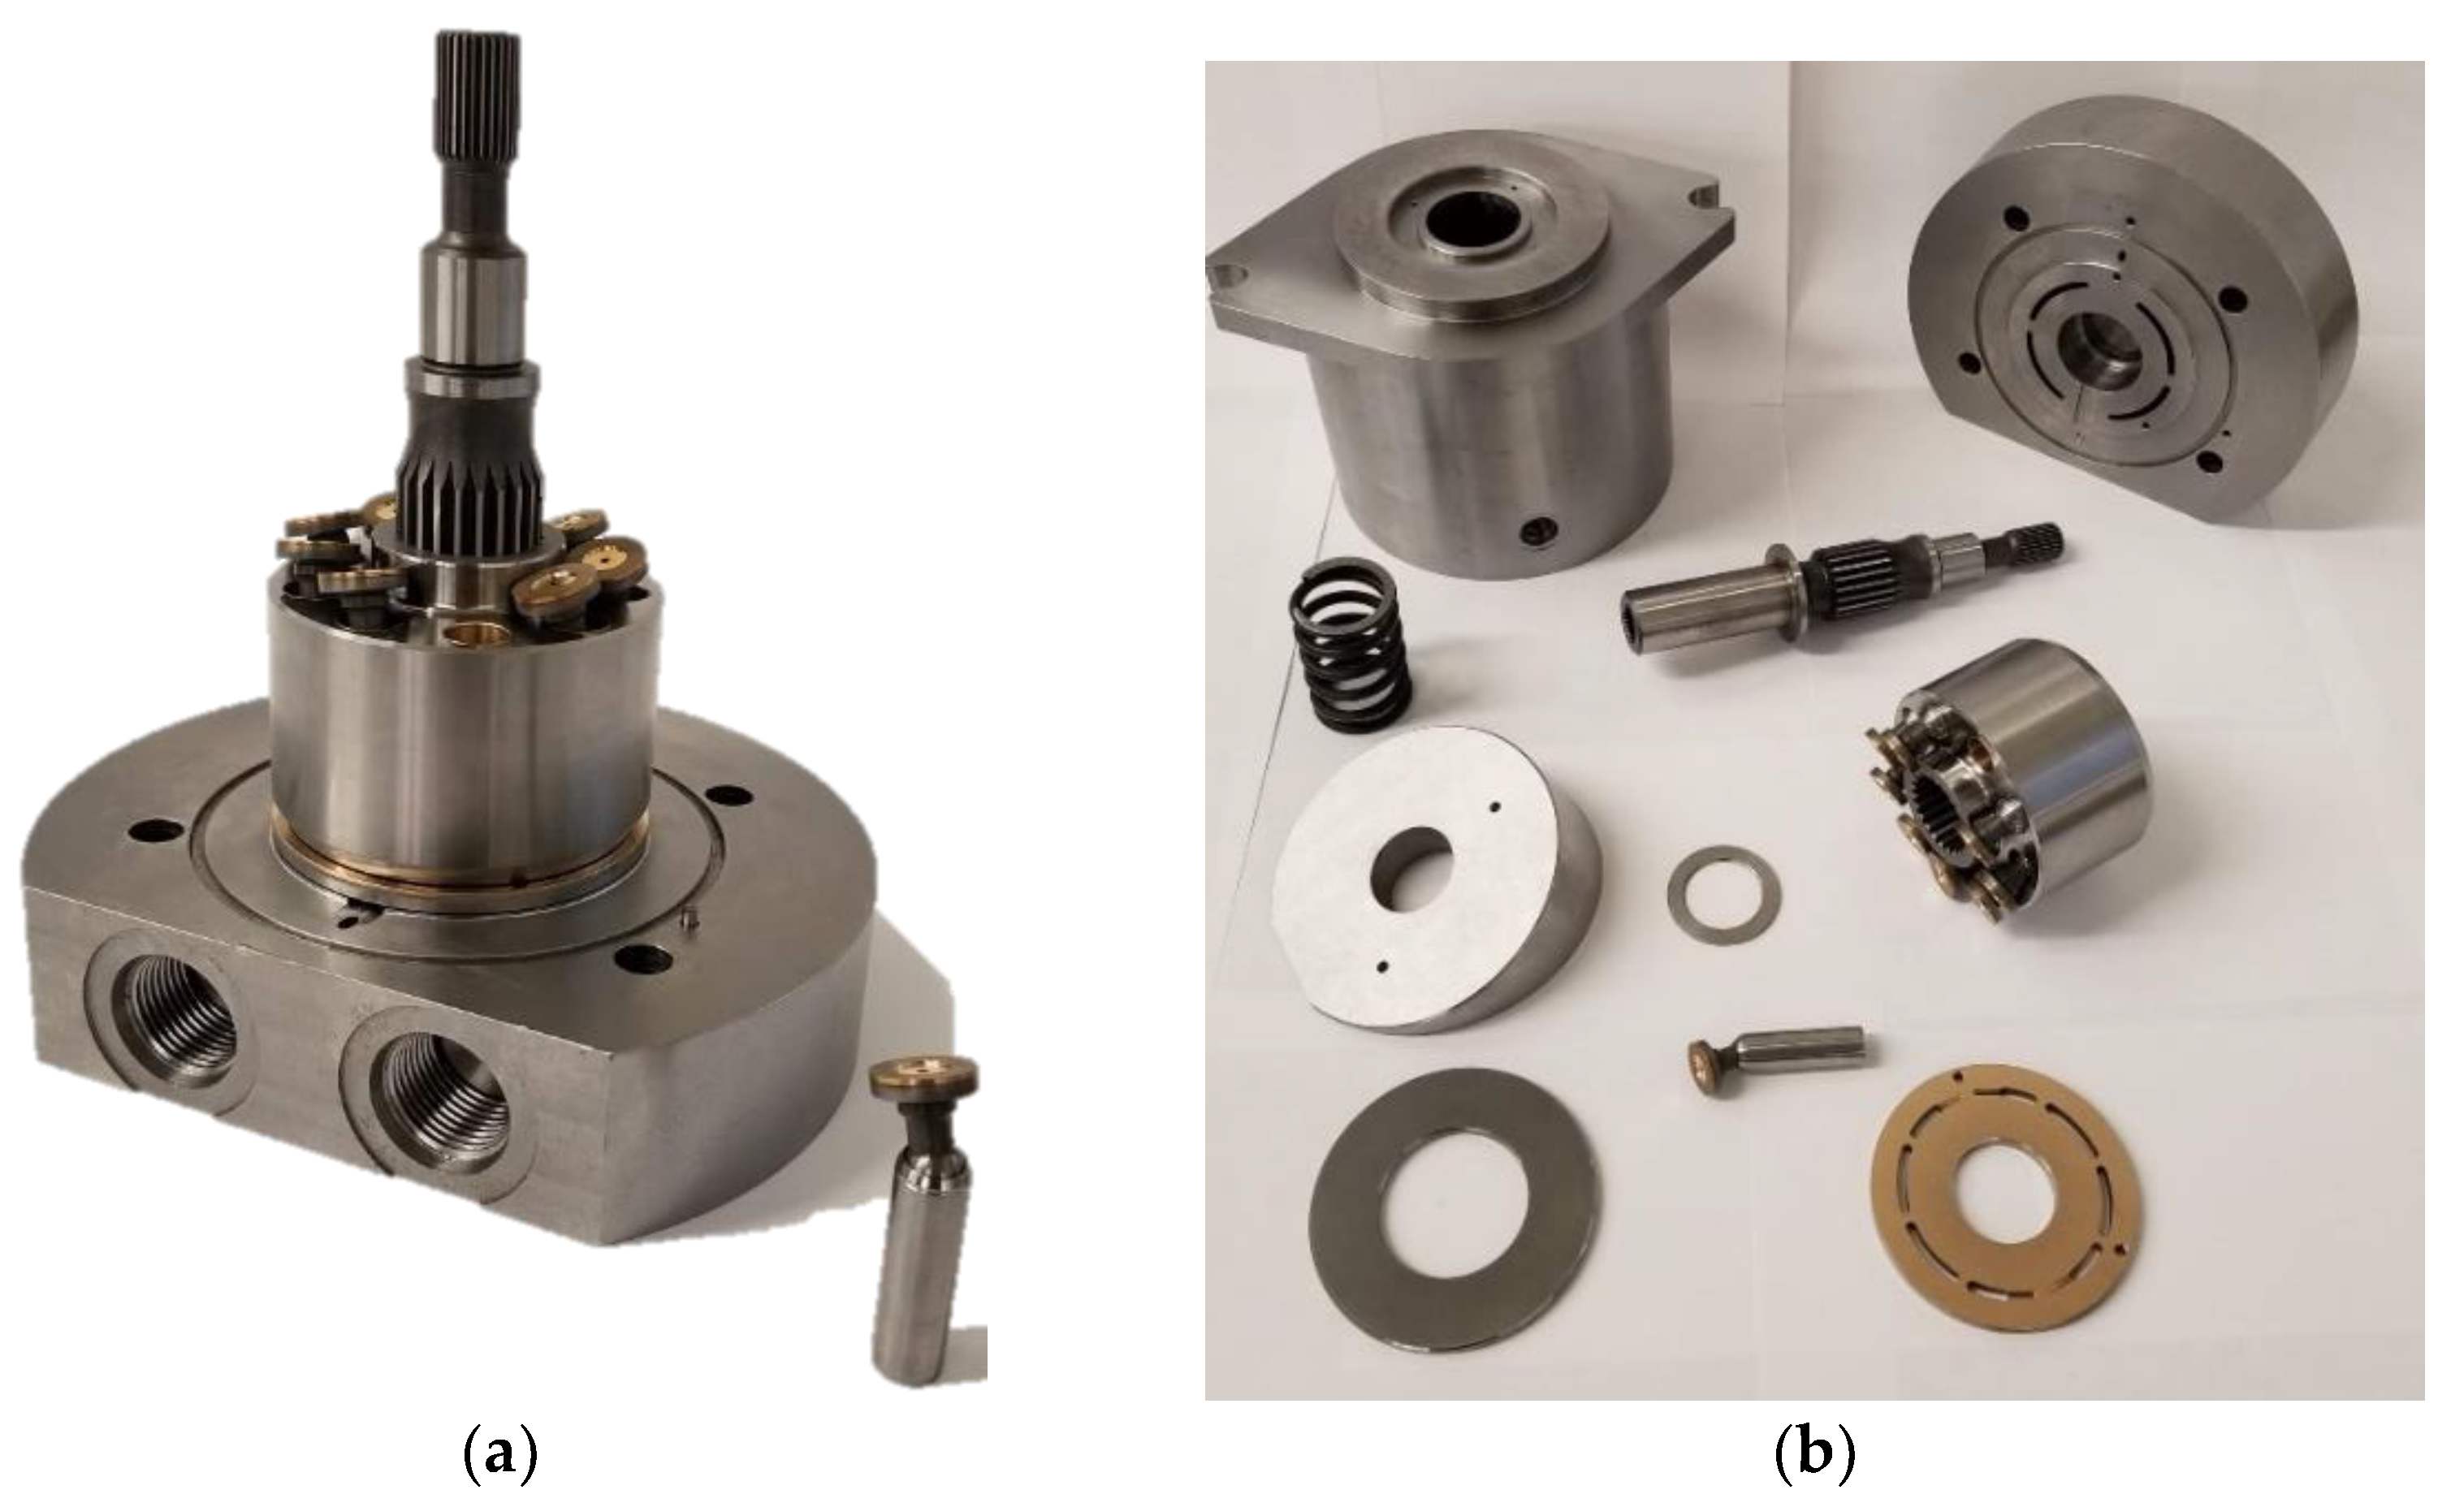
6.1. Test Rig Configuration
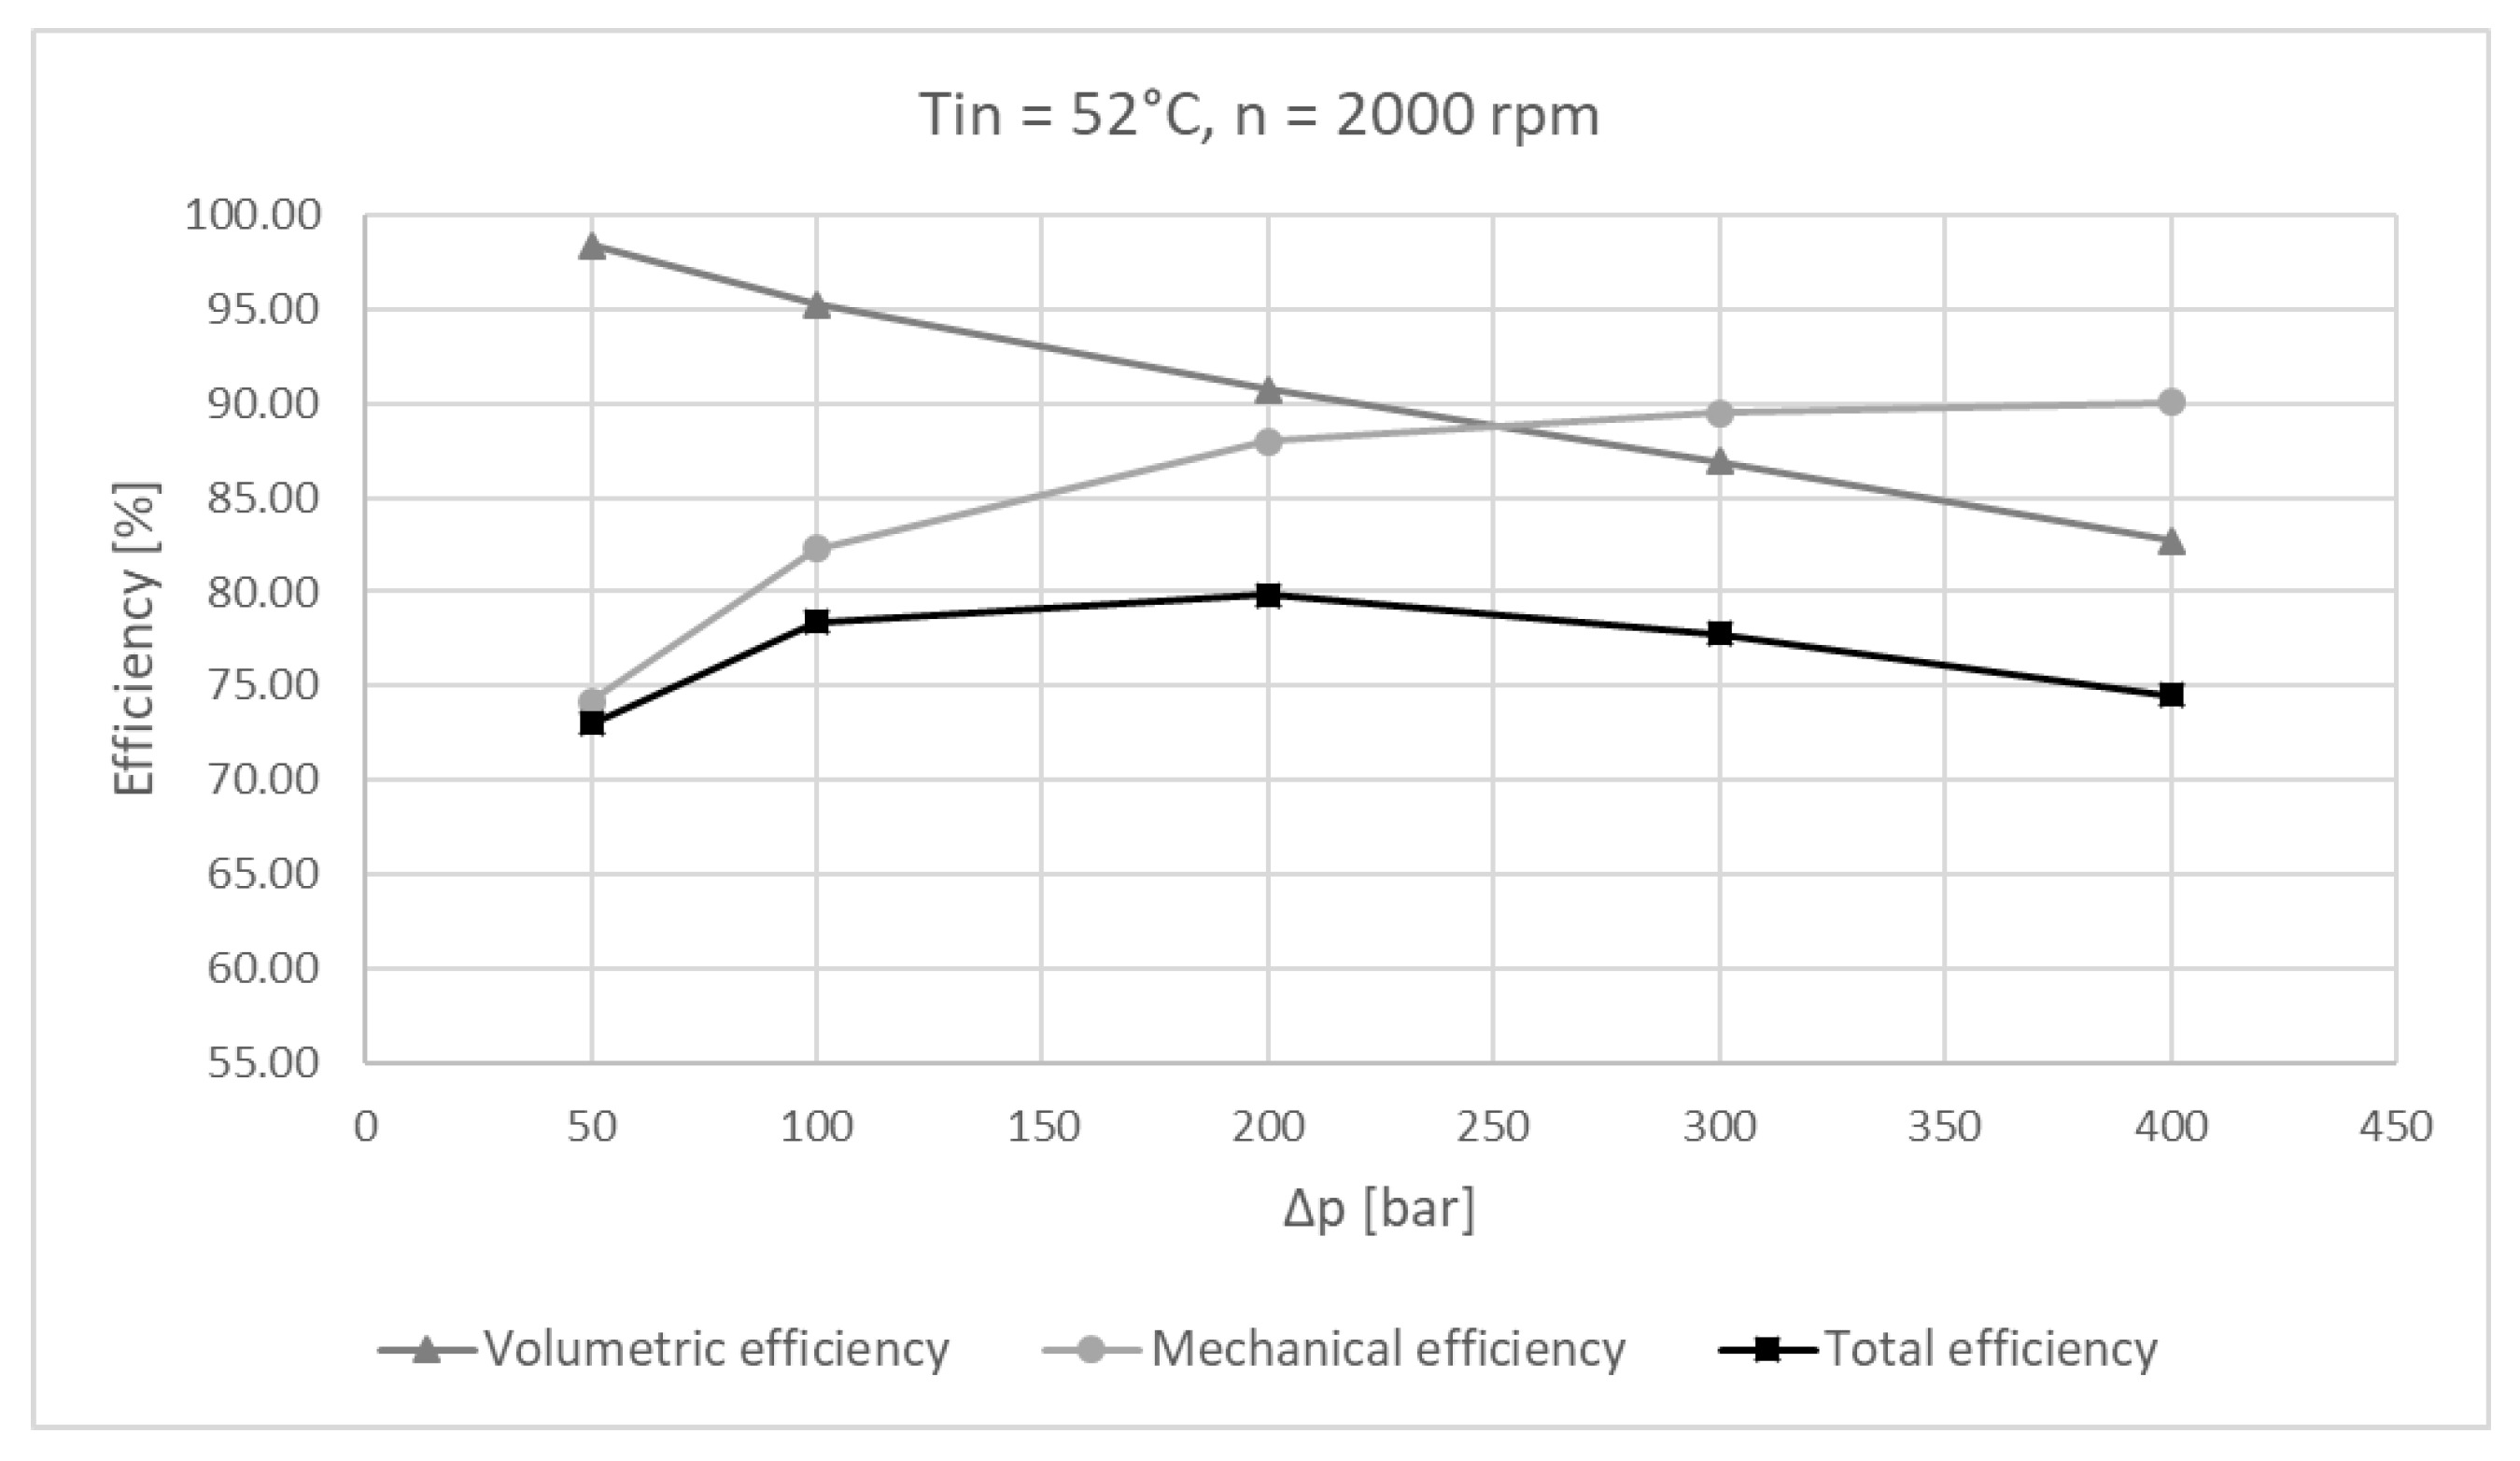
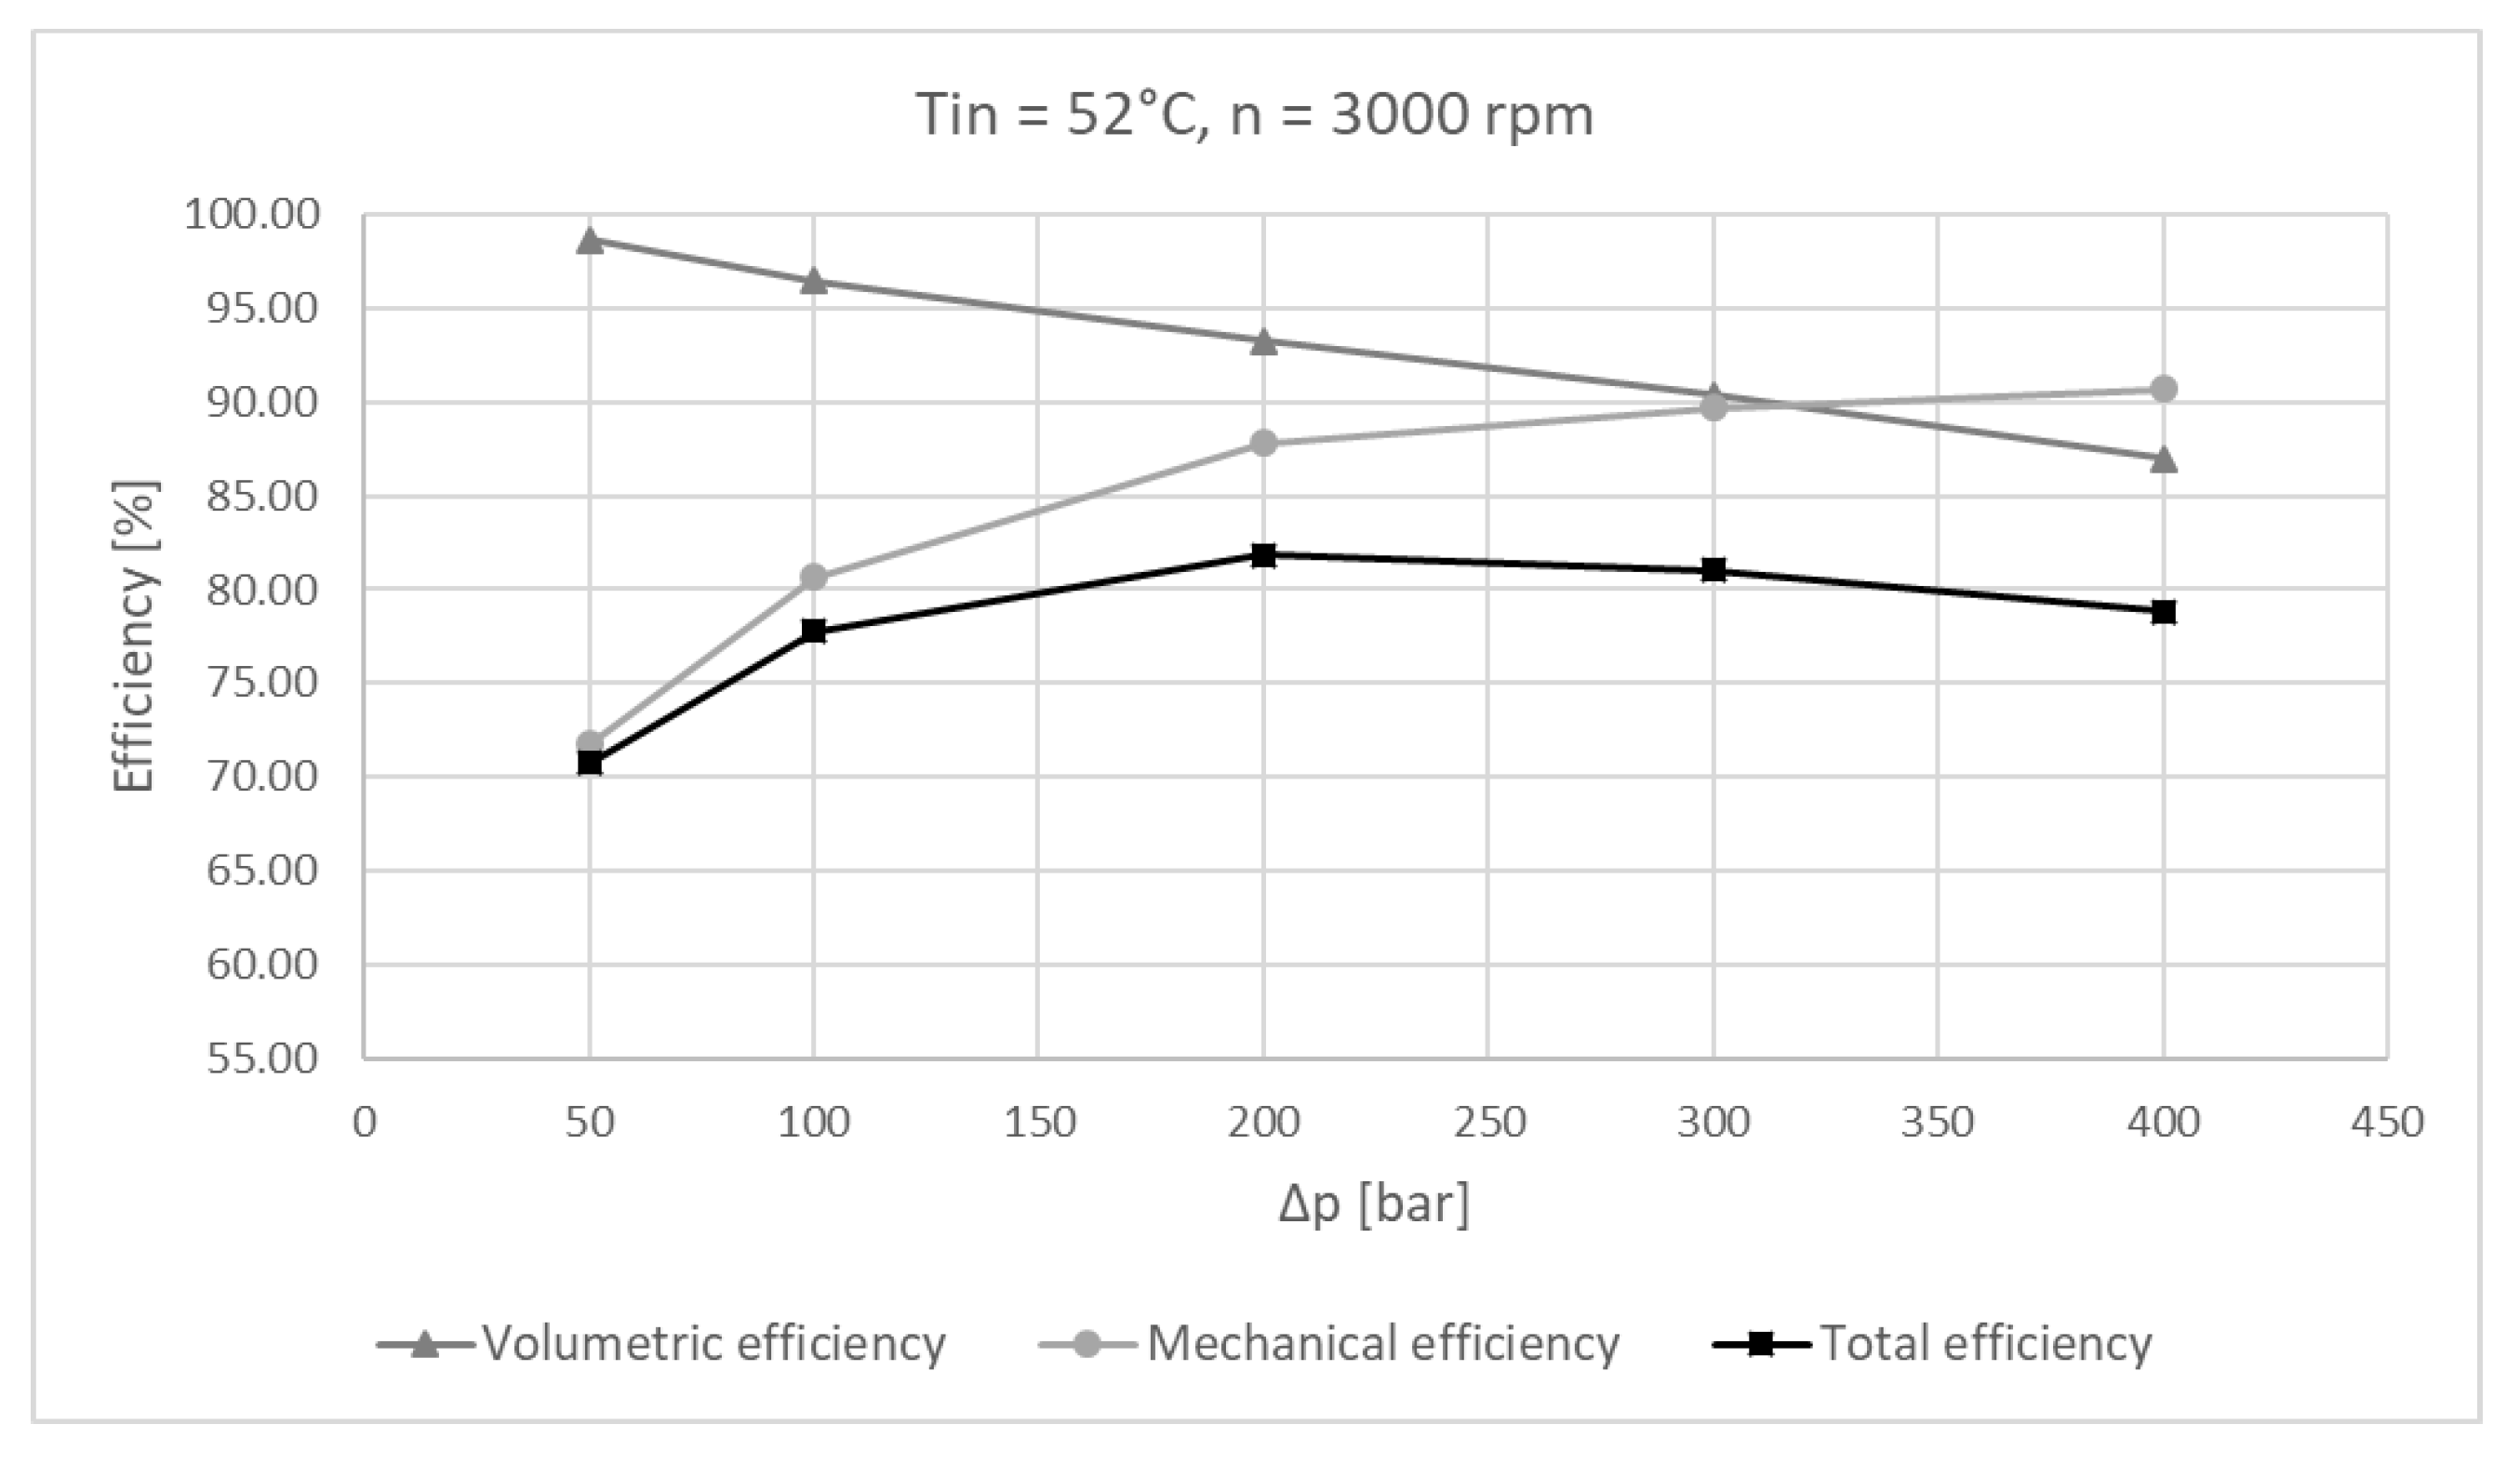
6.2. Experimental Results
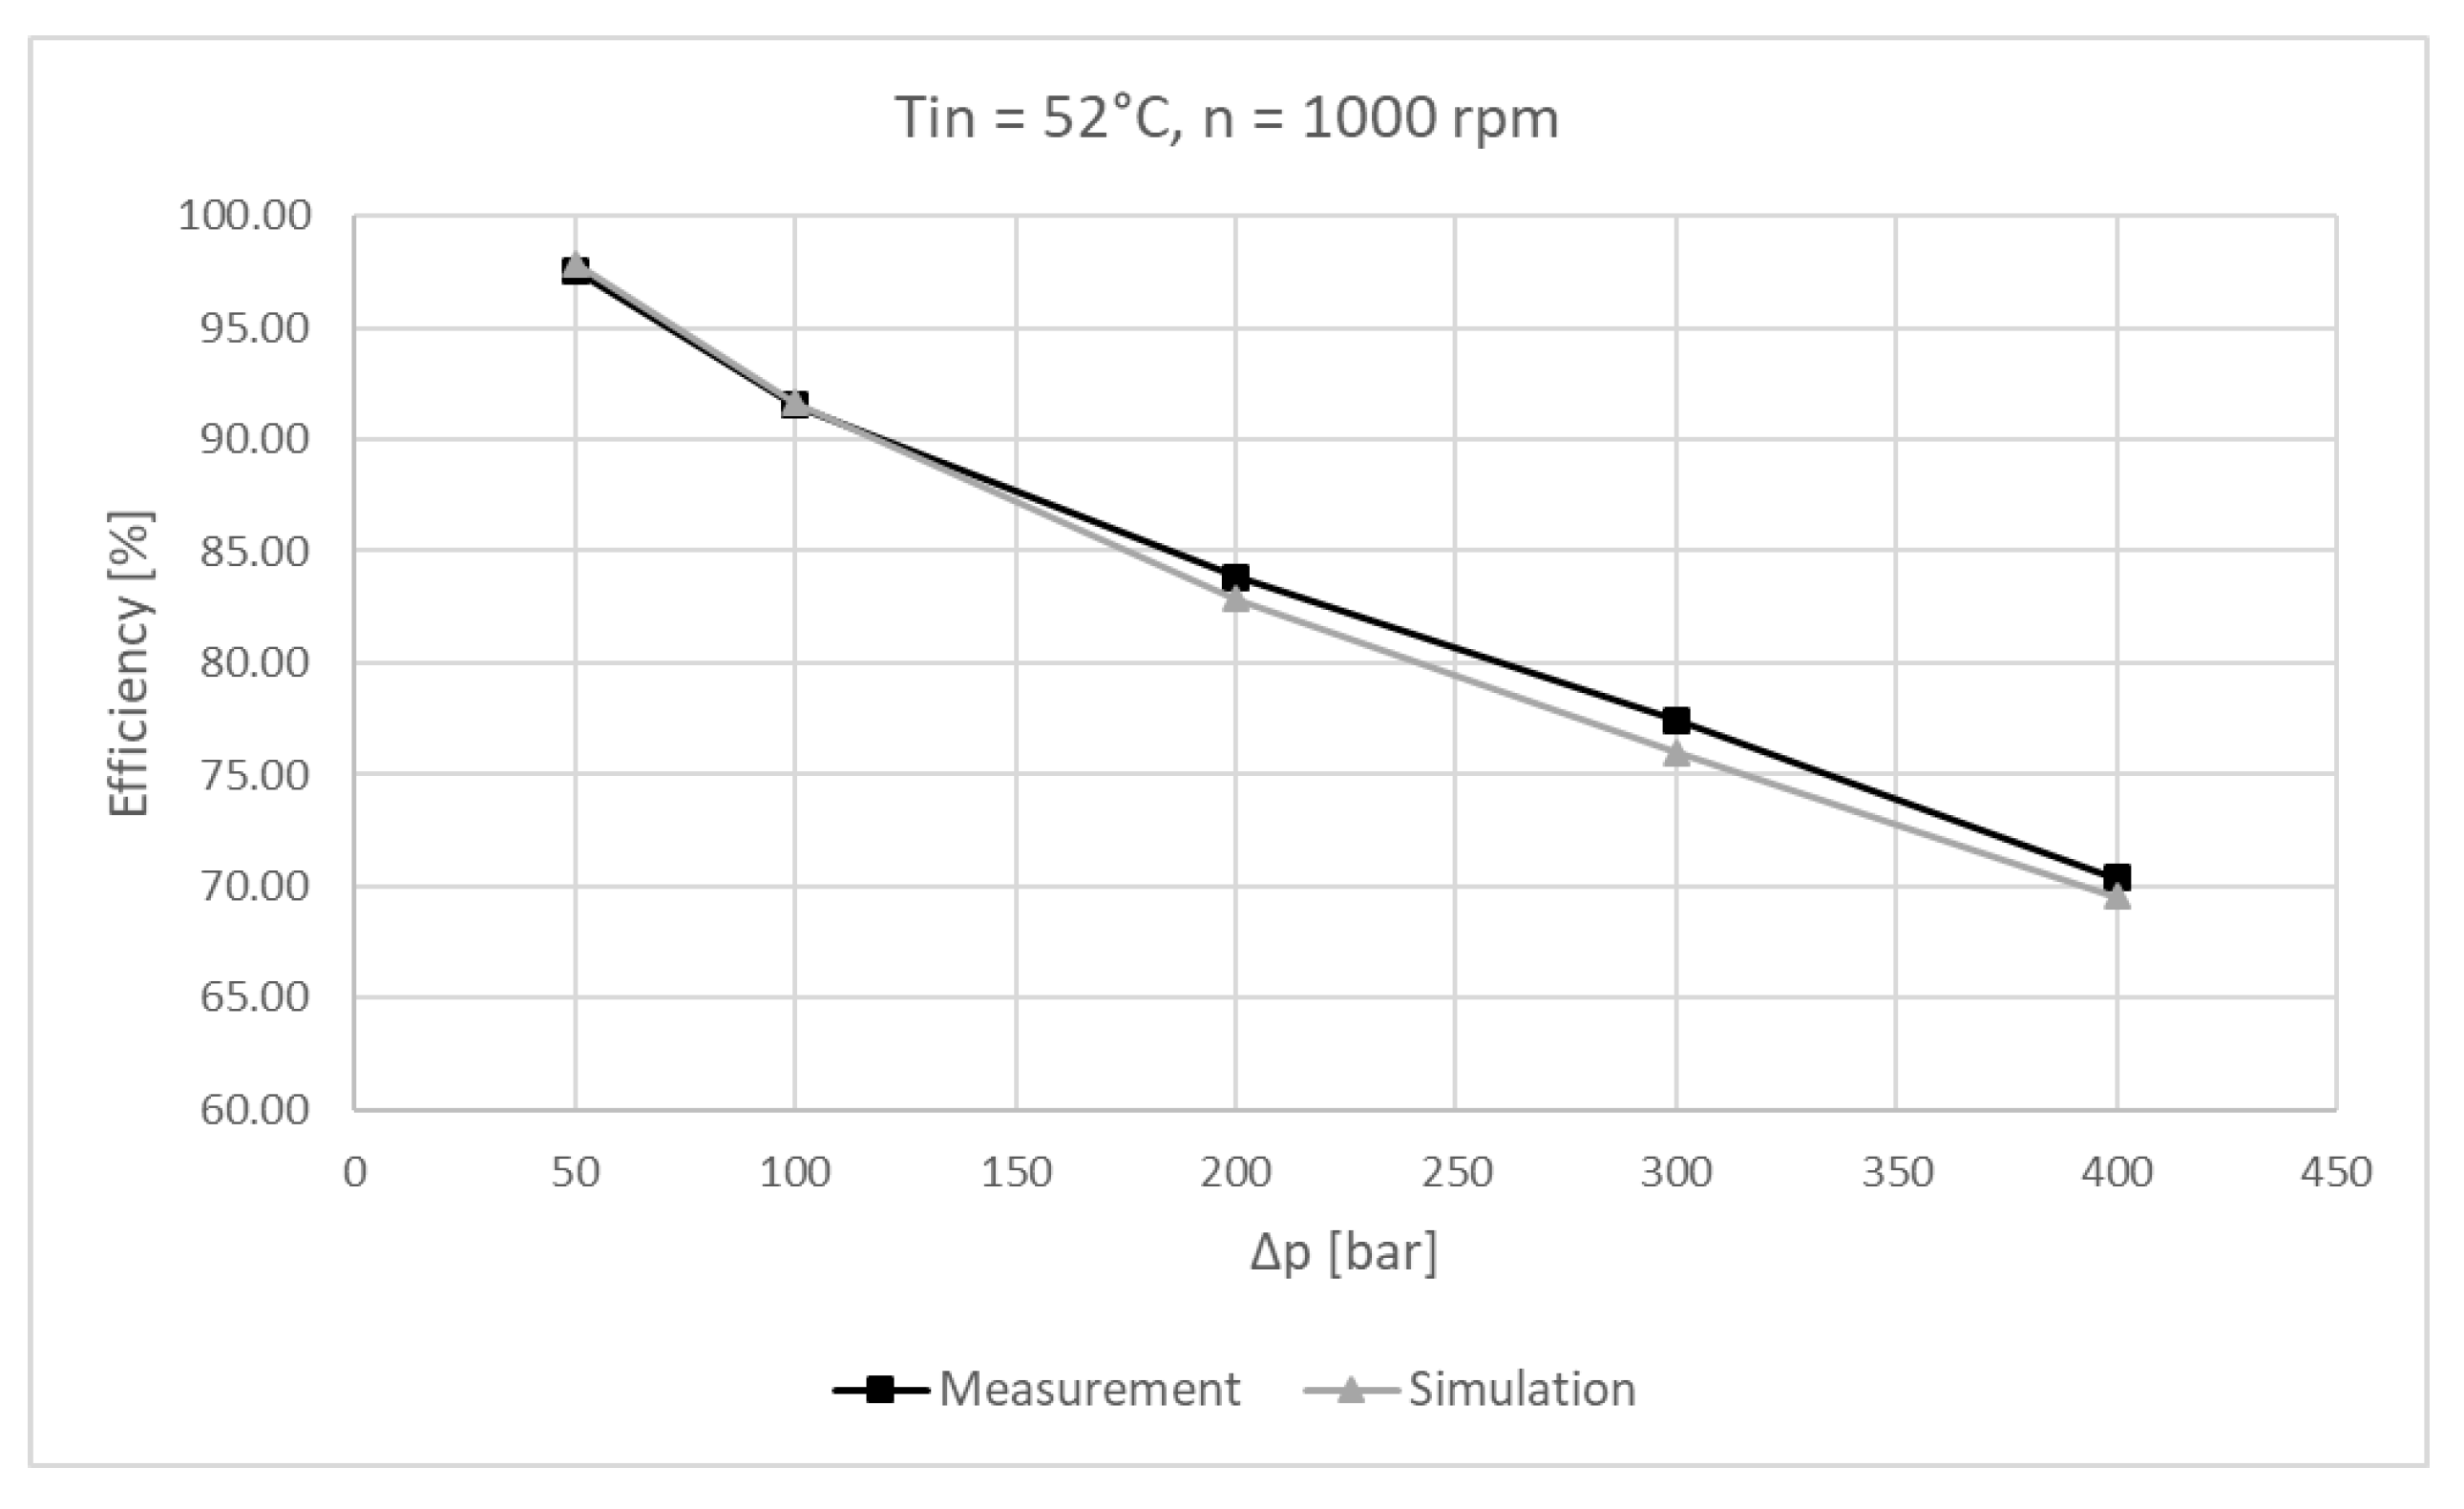
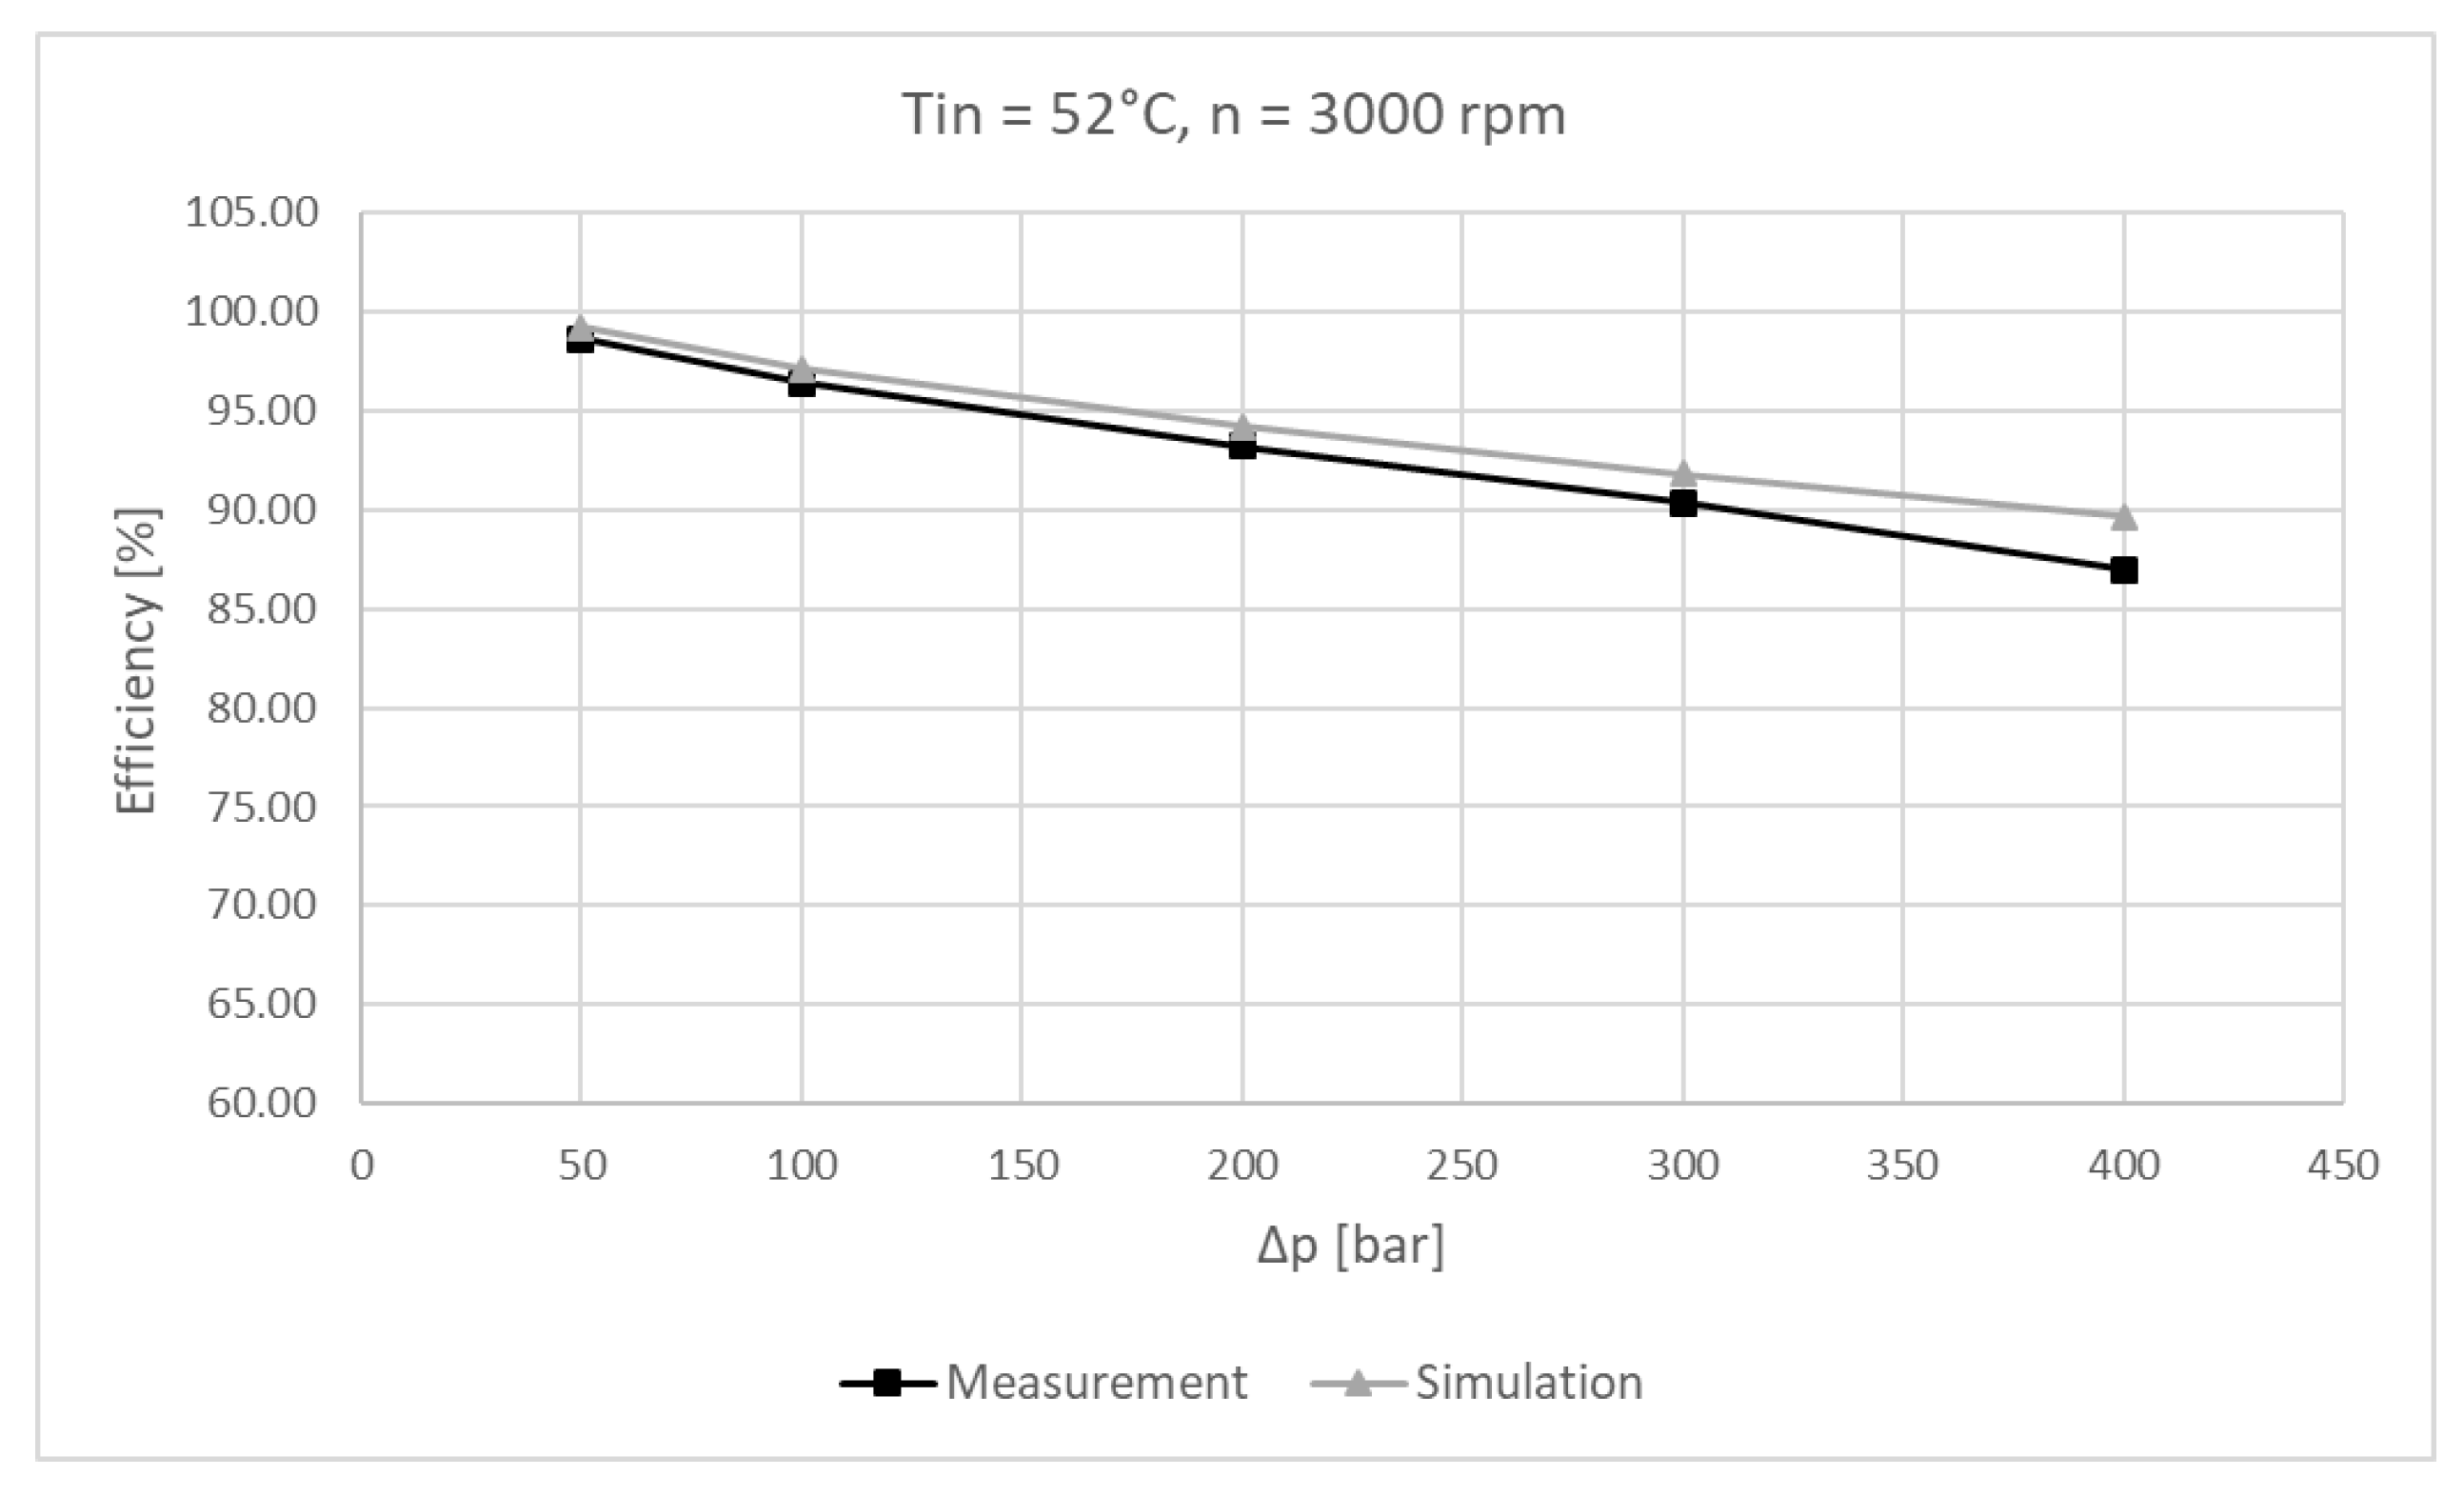
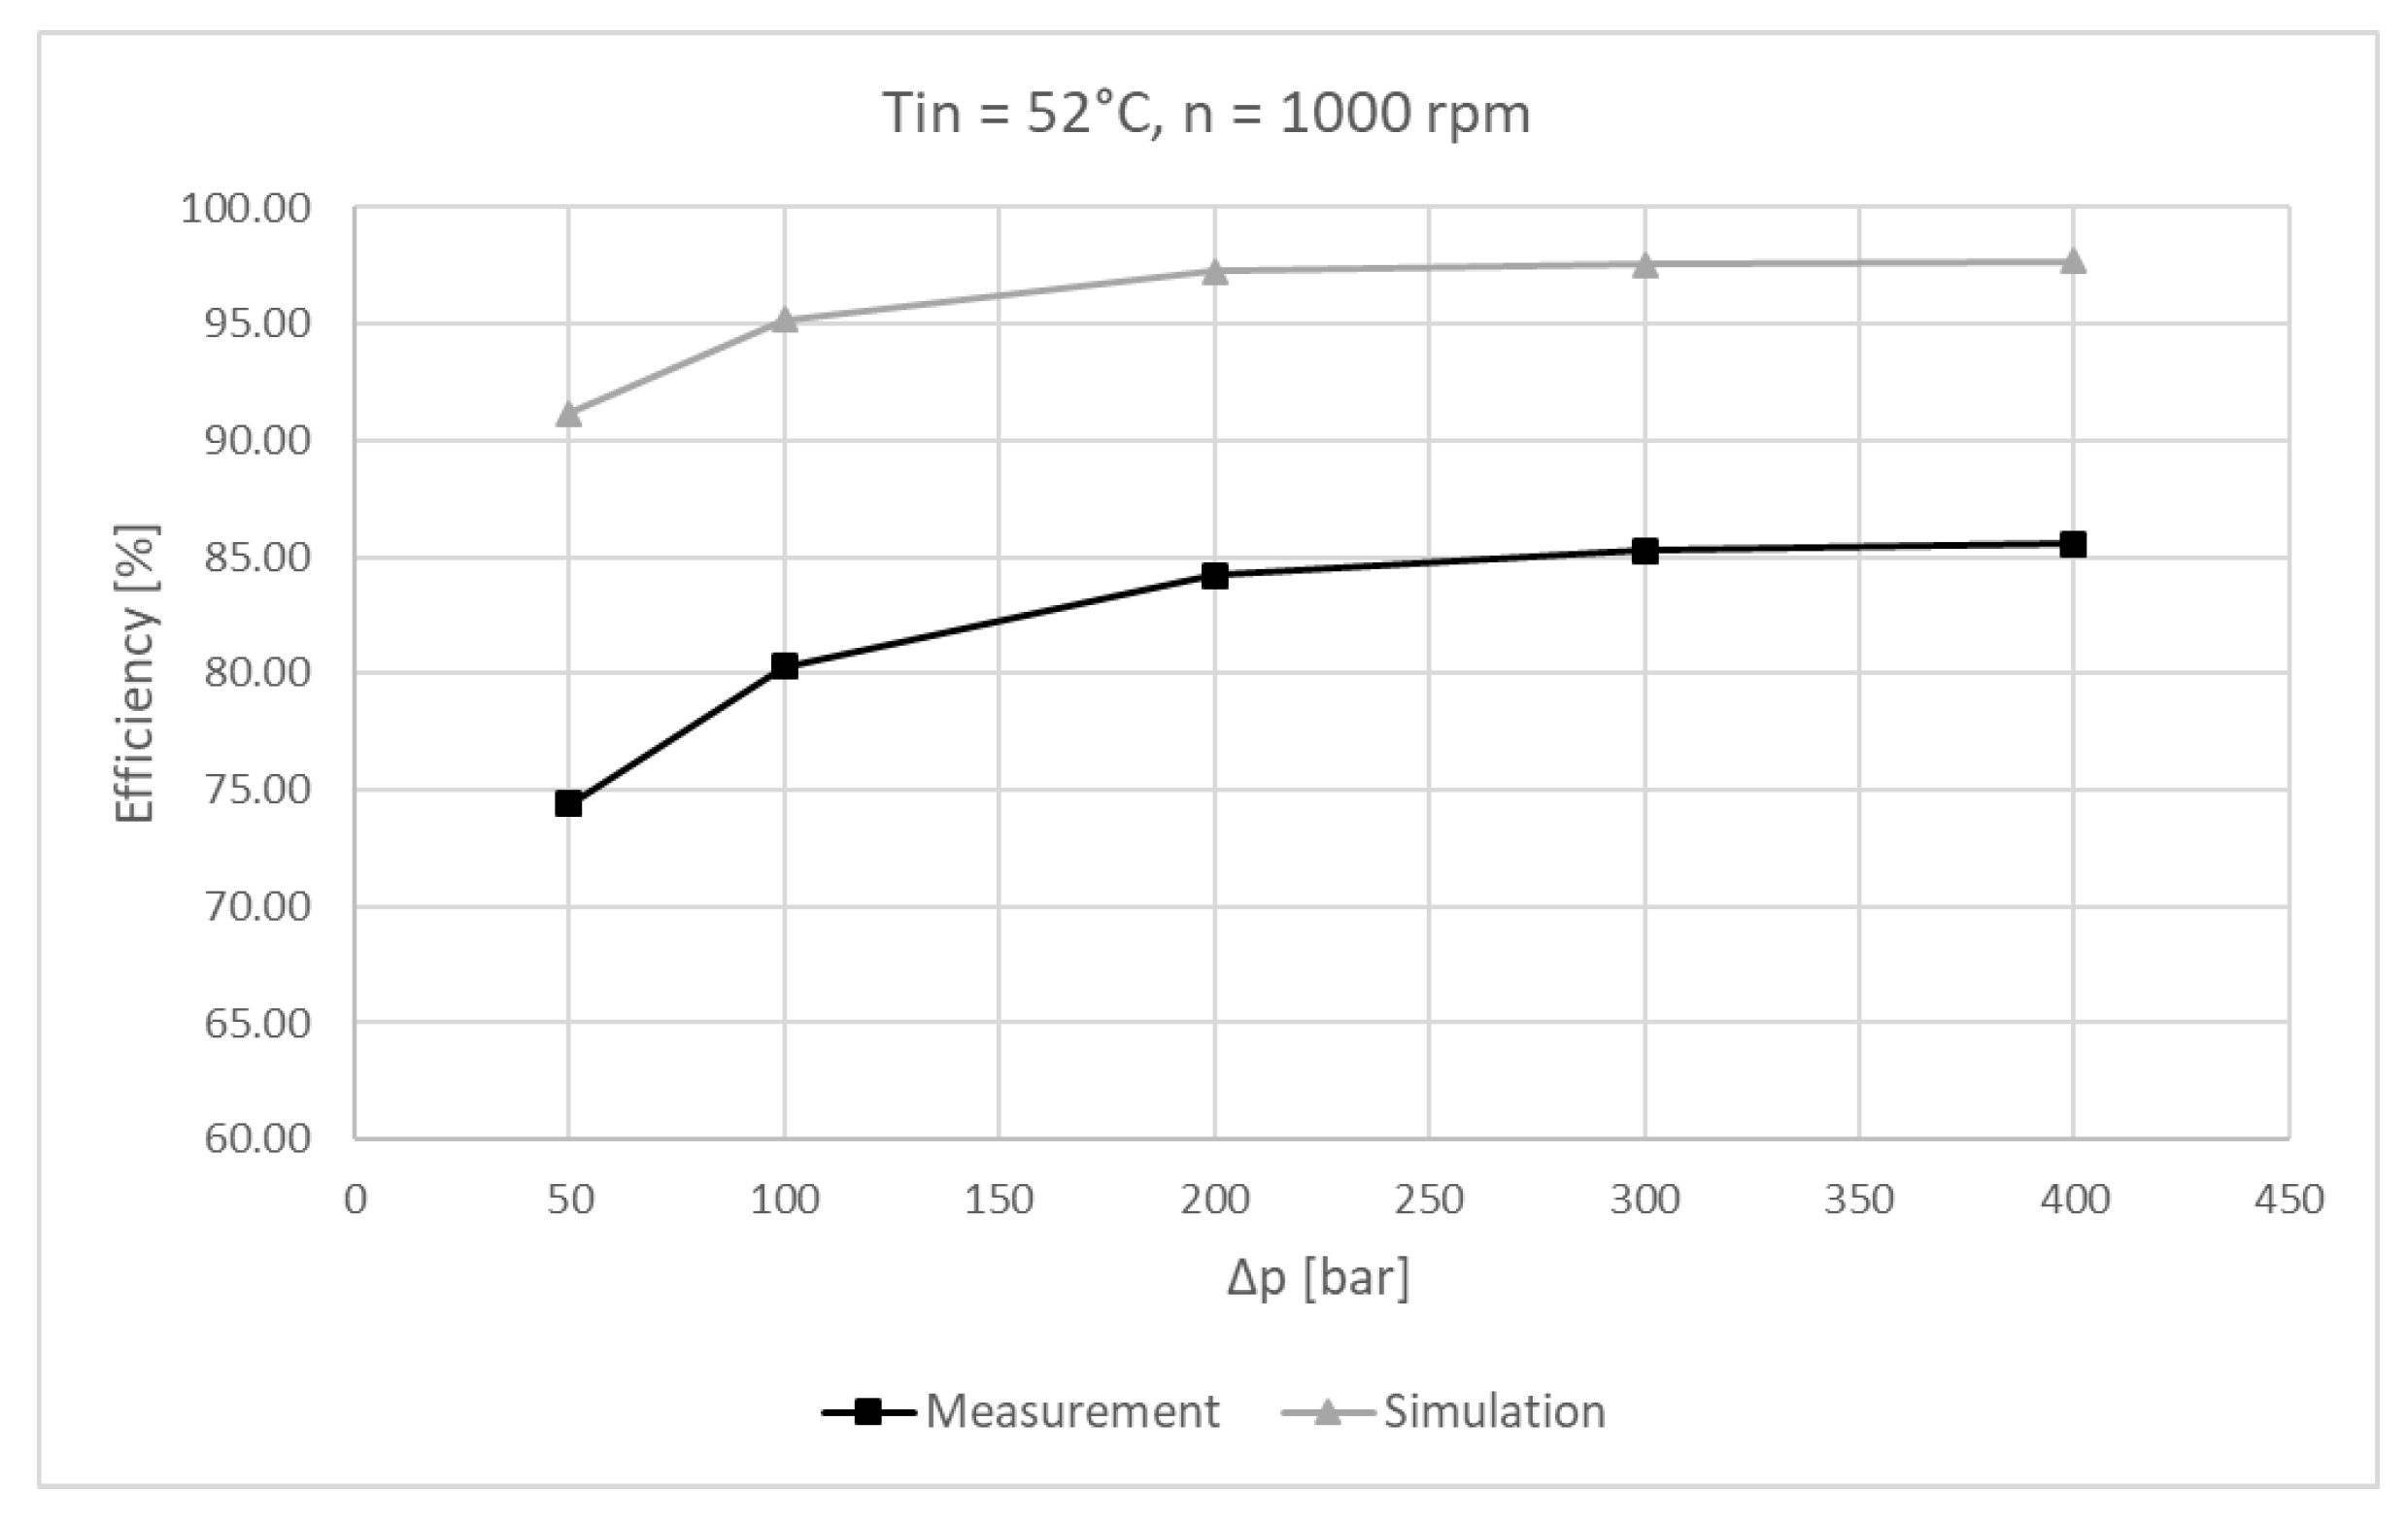
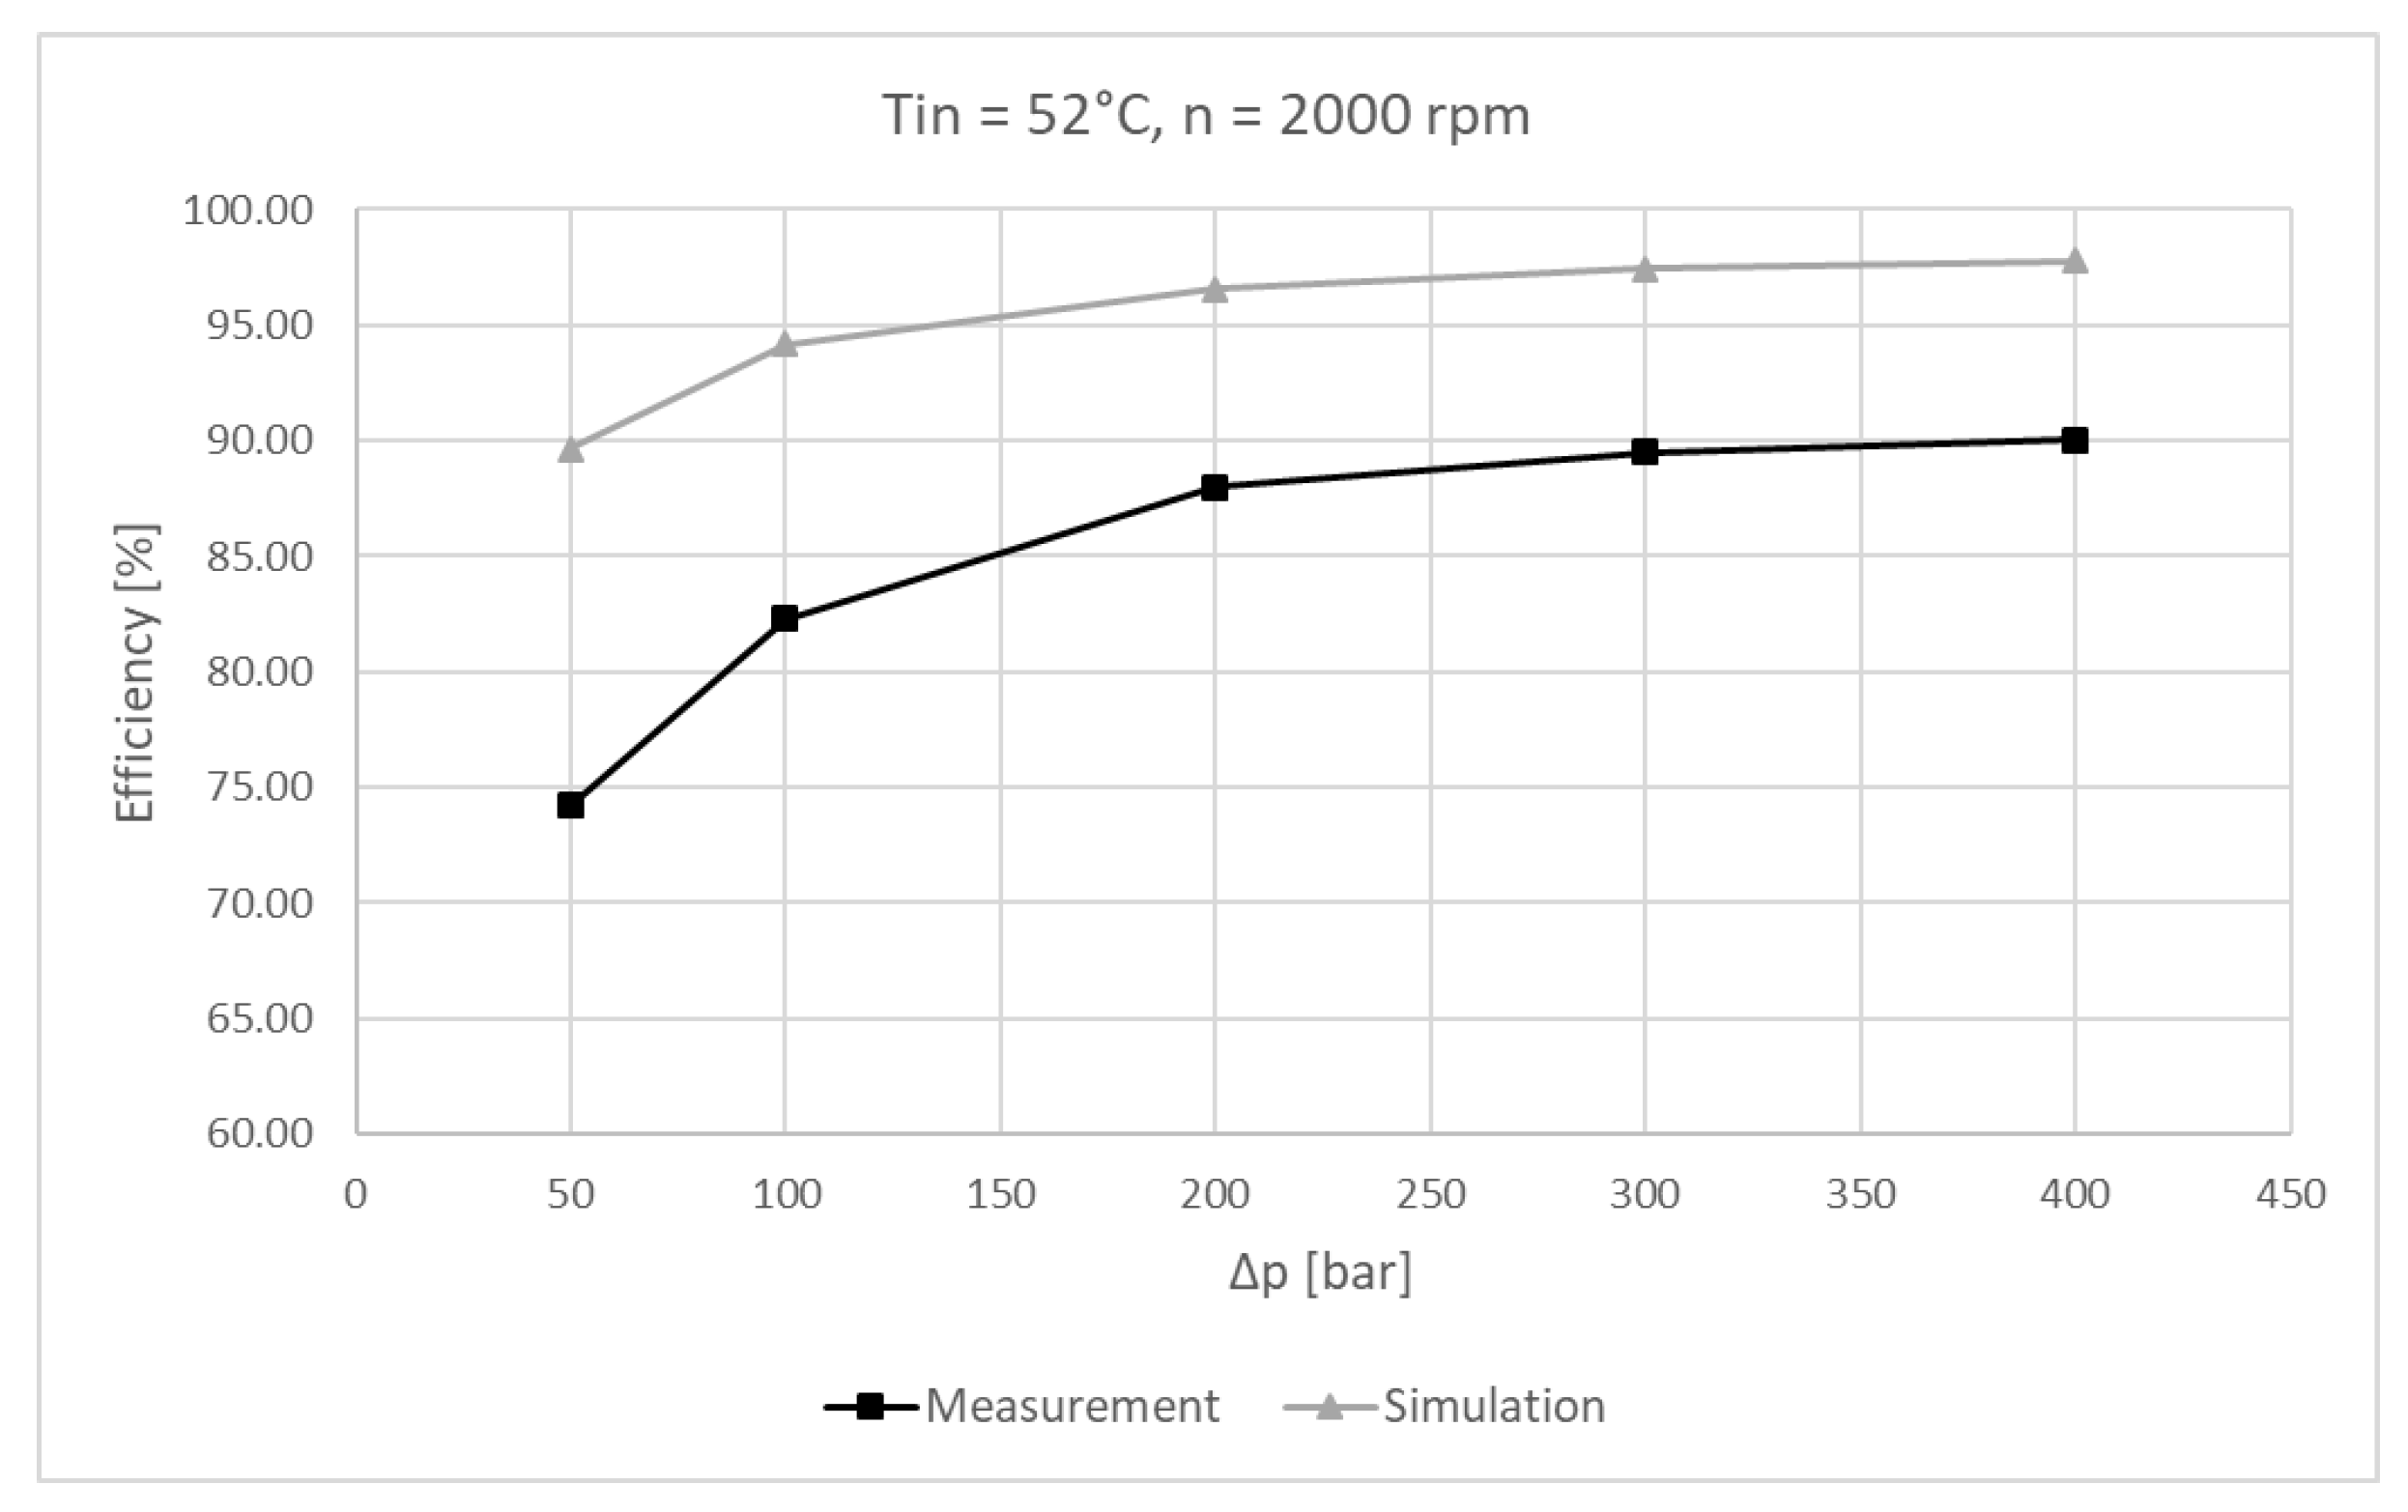
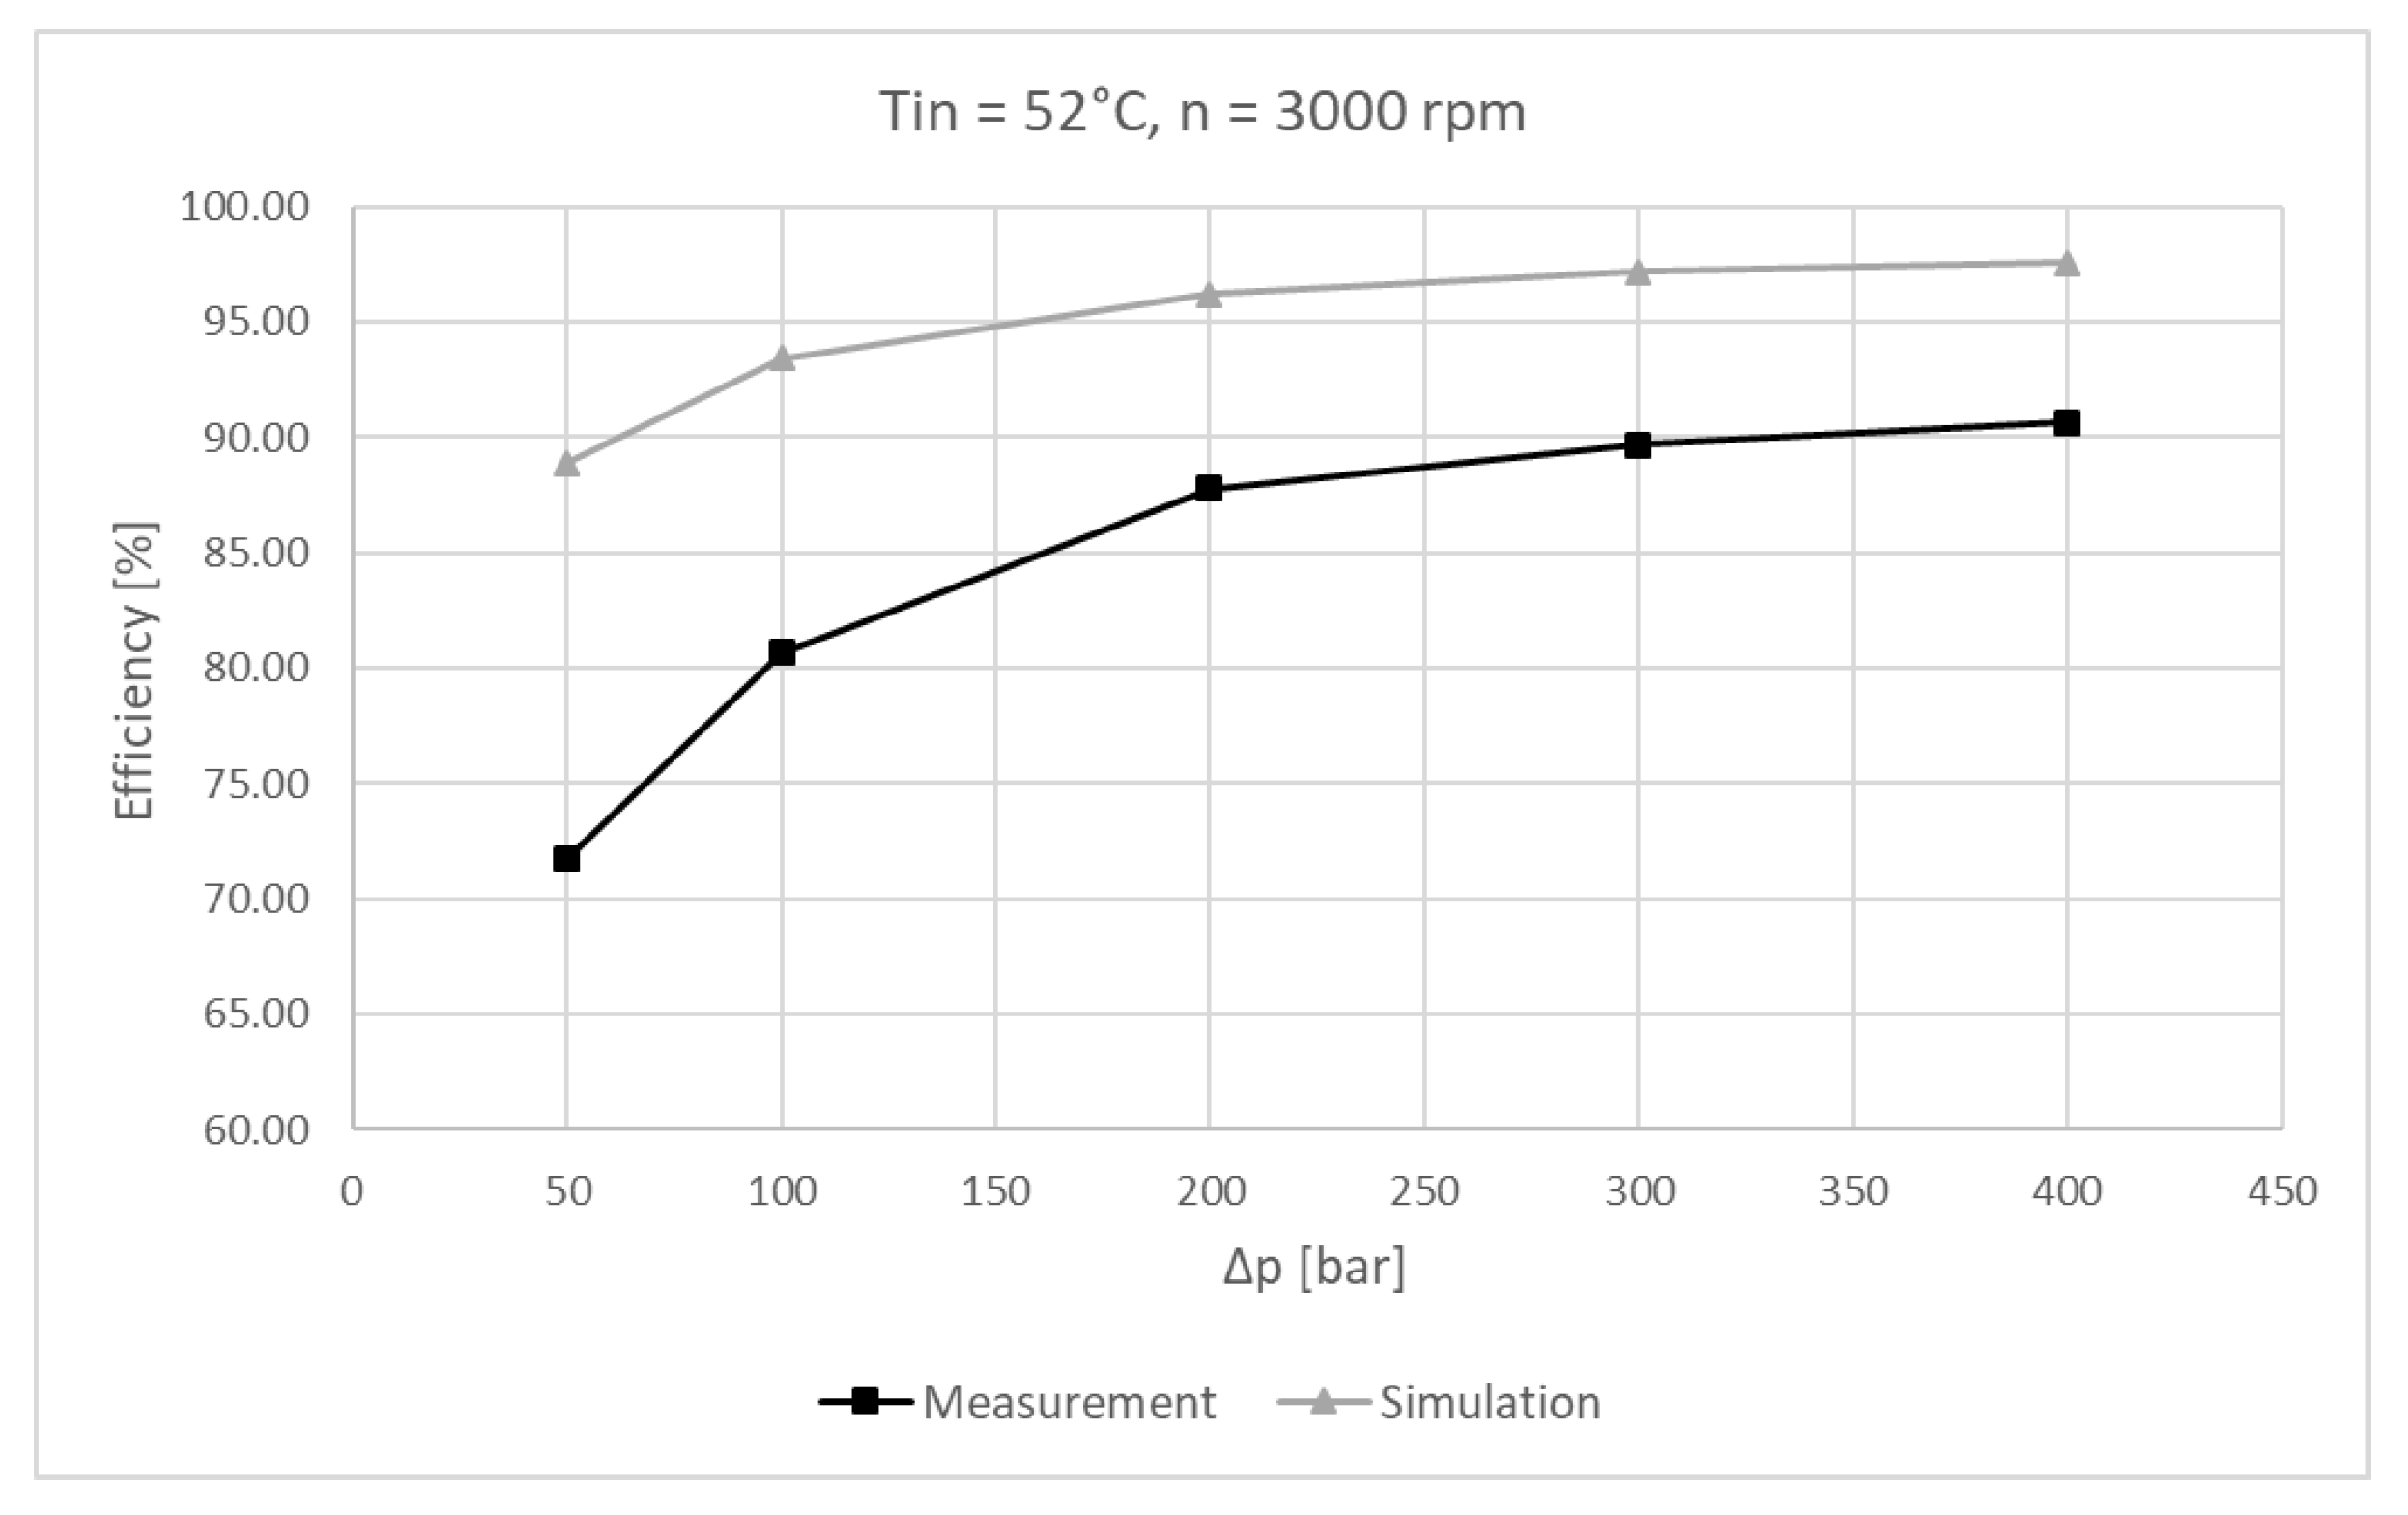
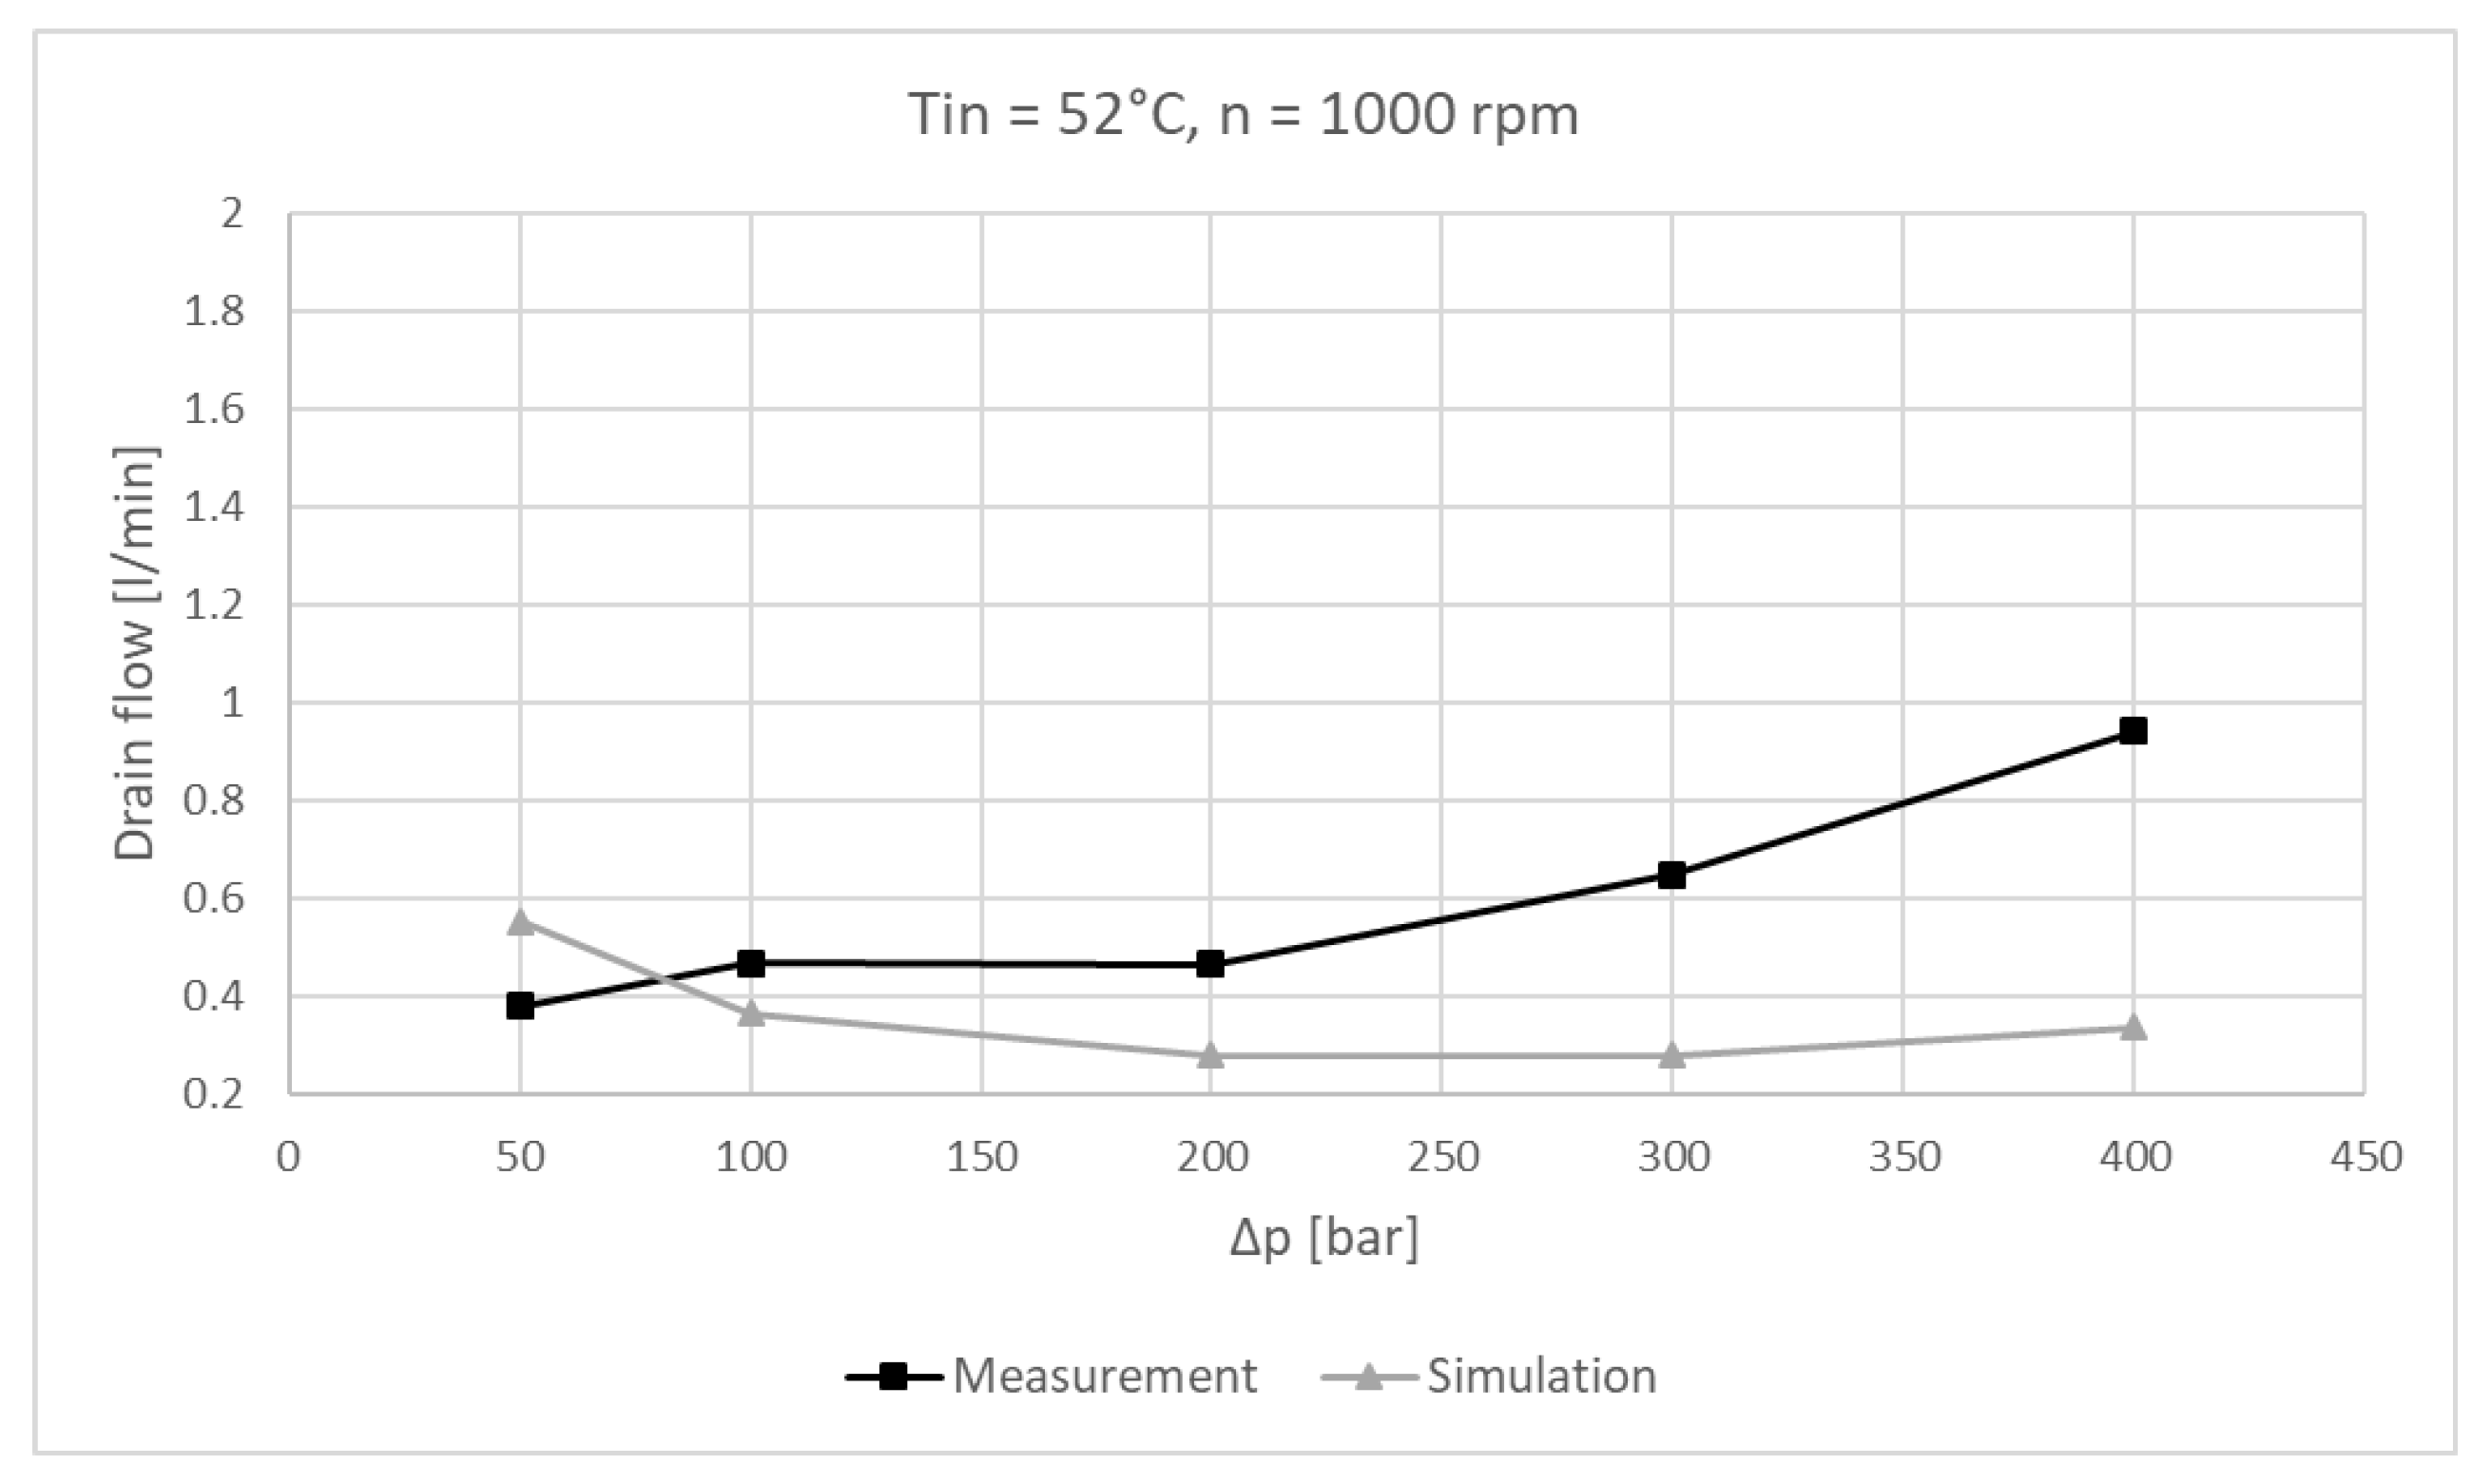
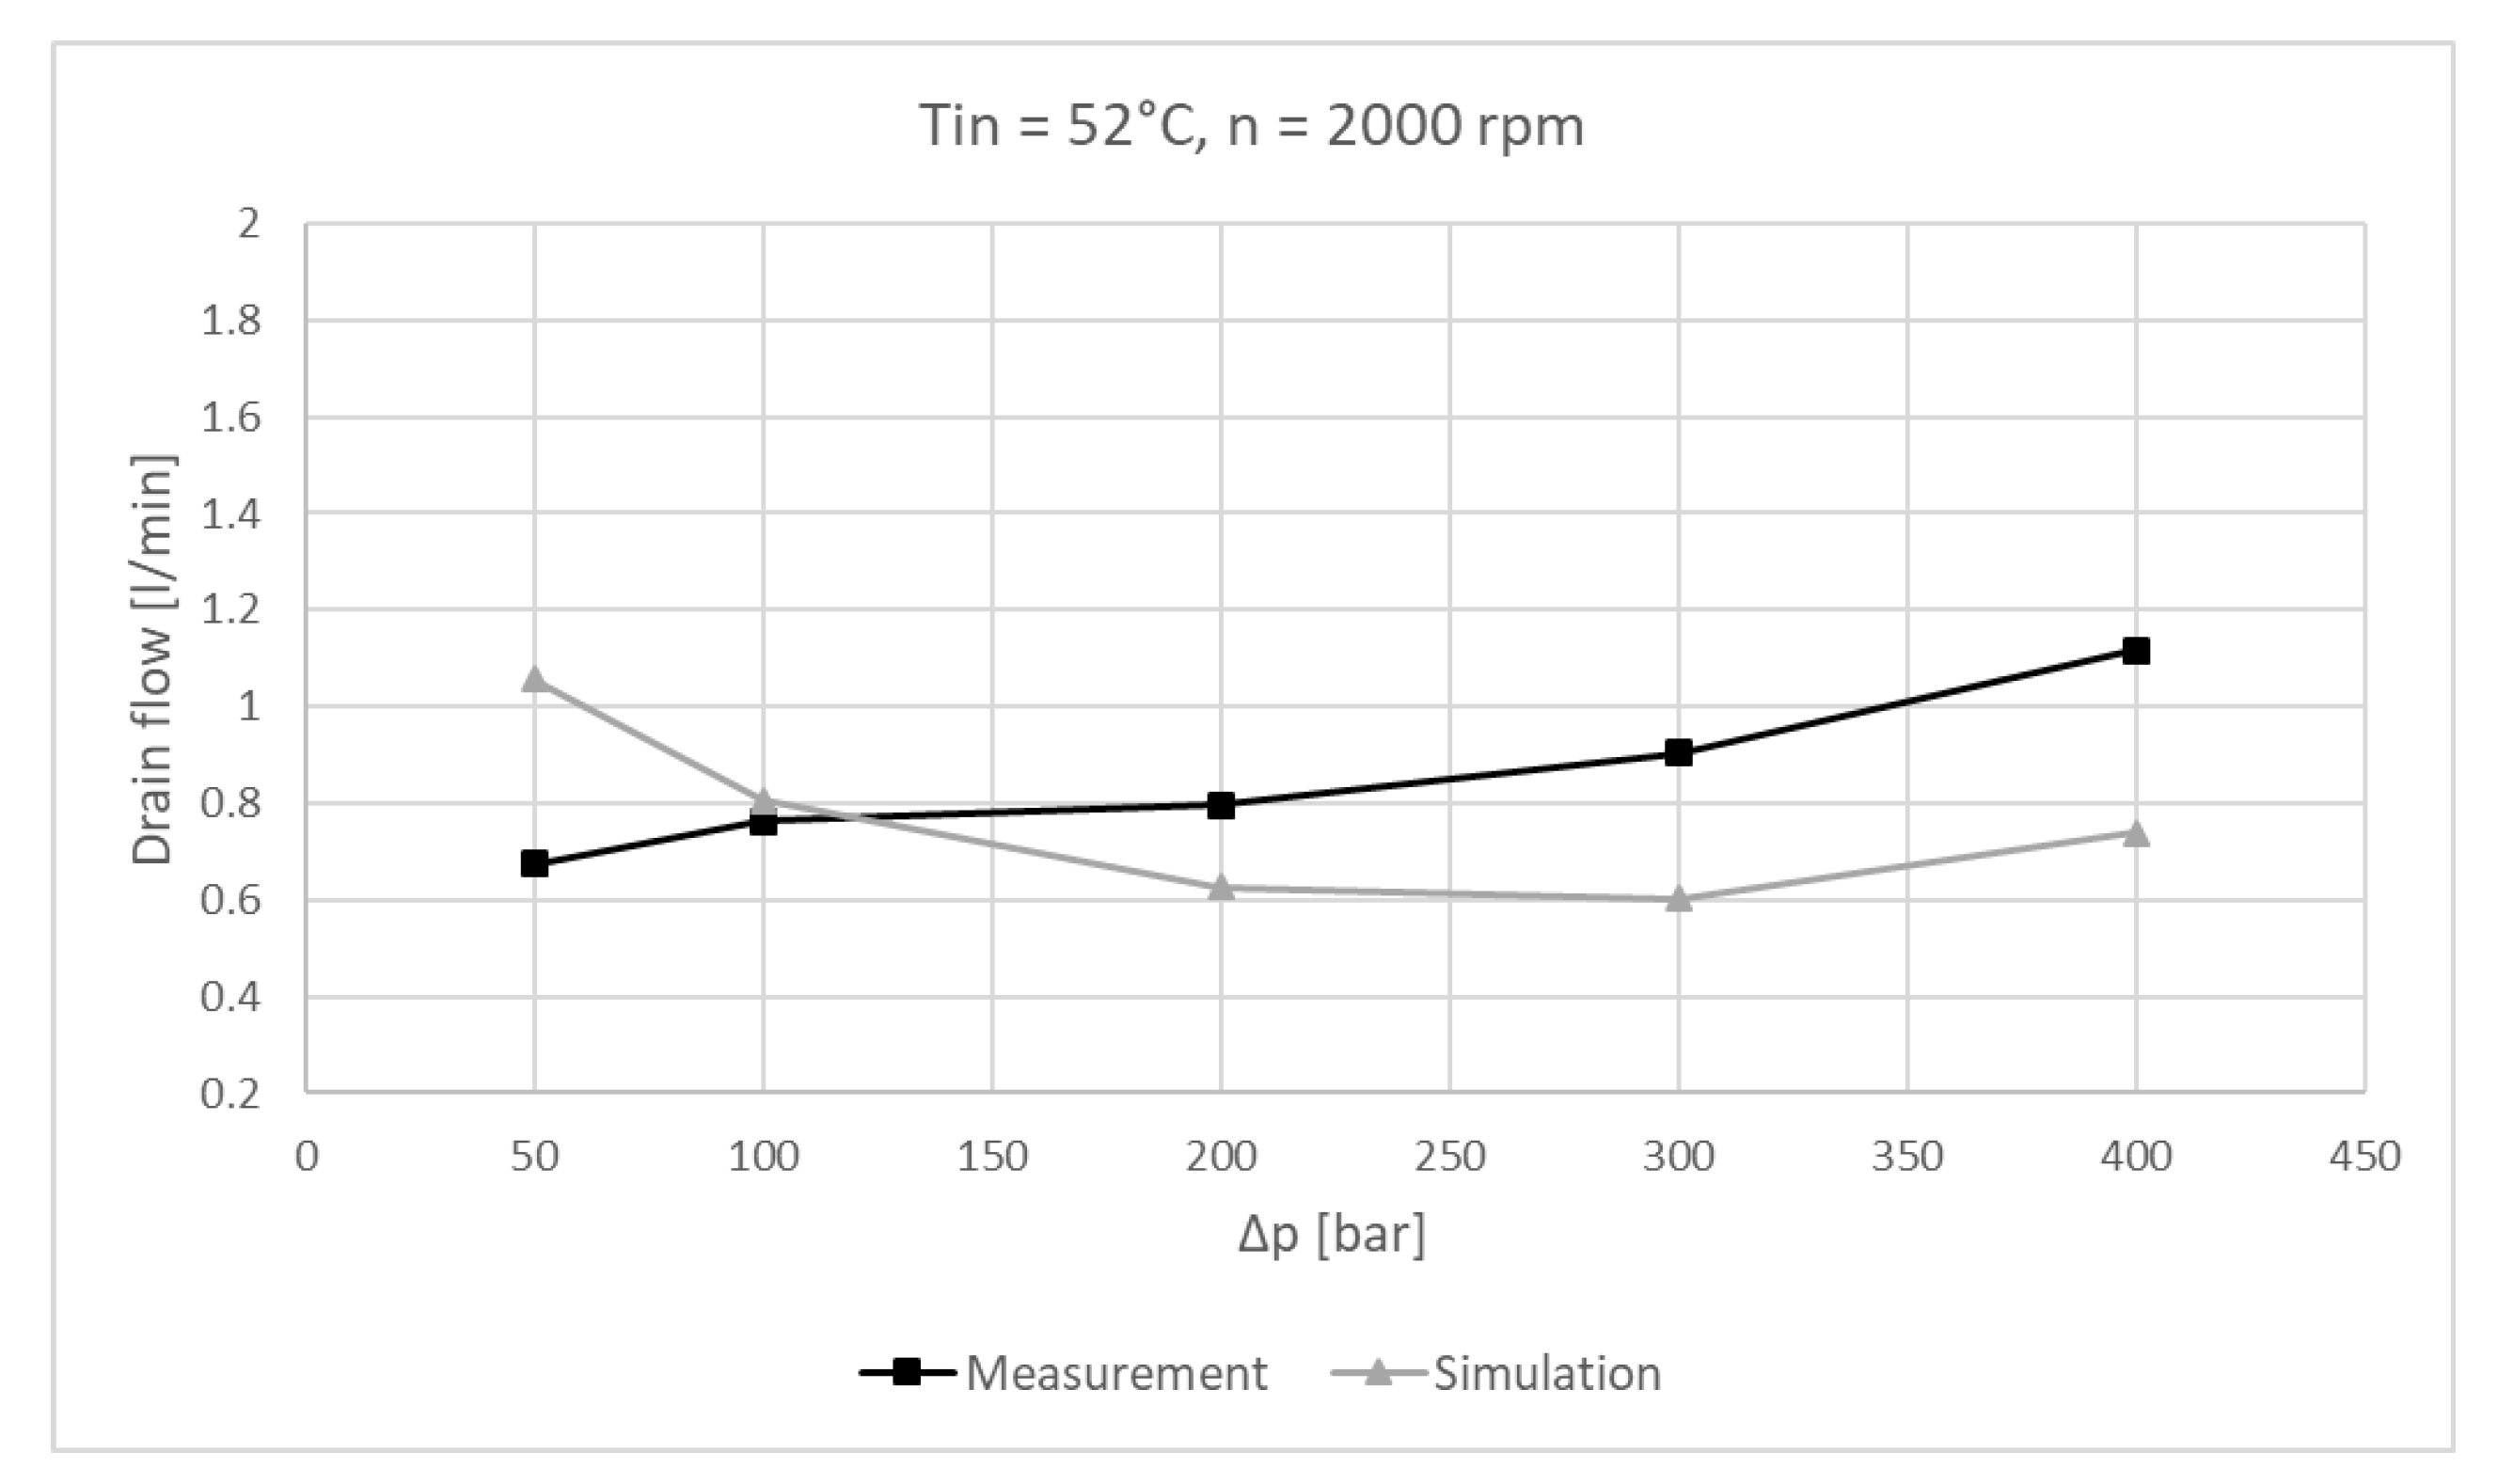
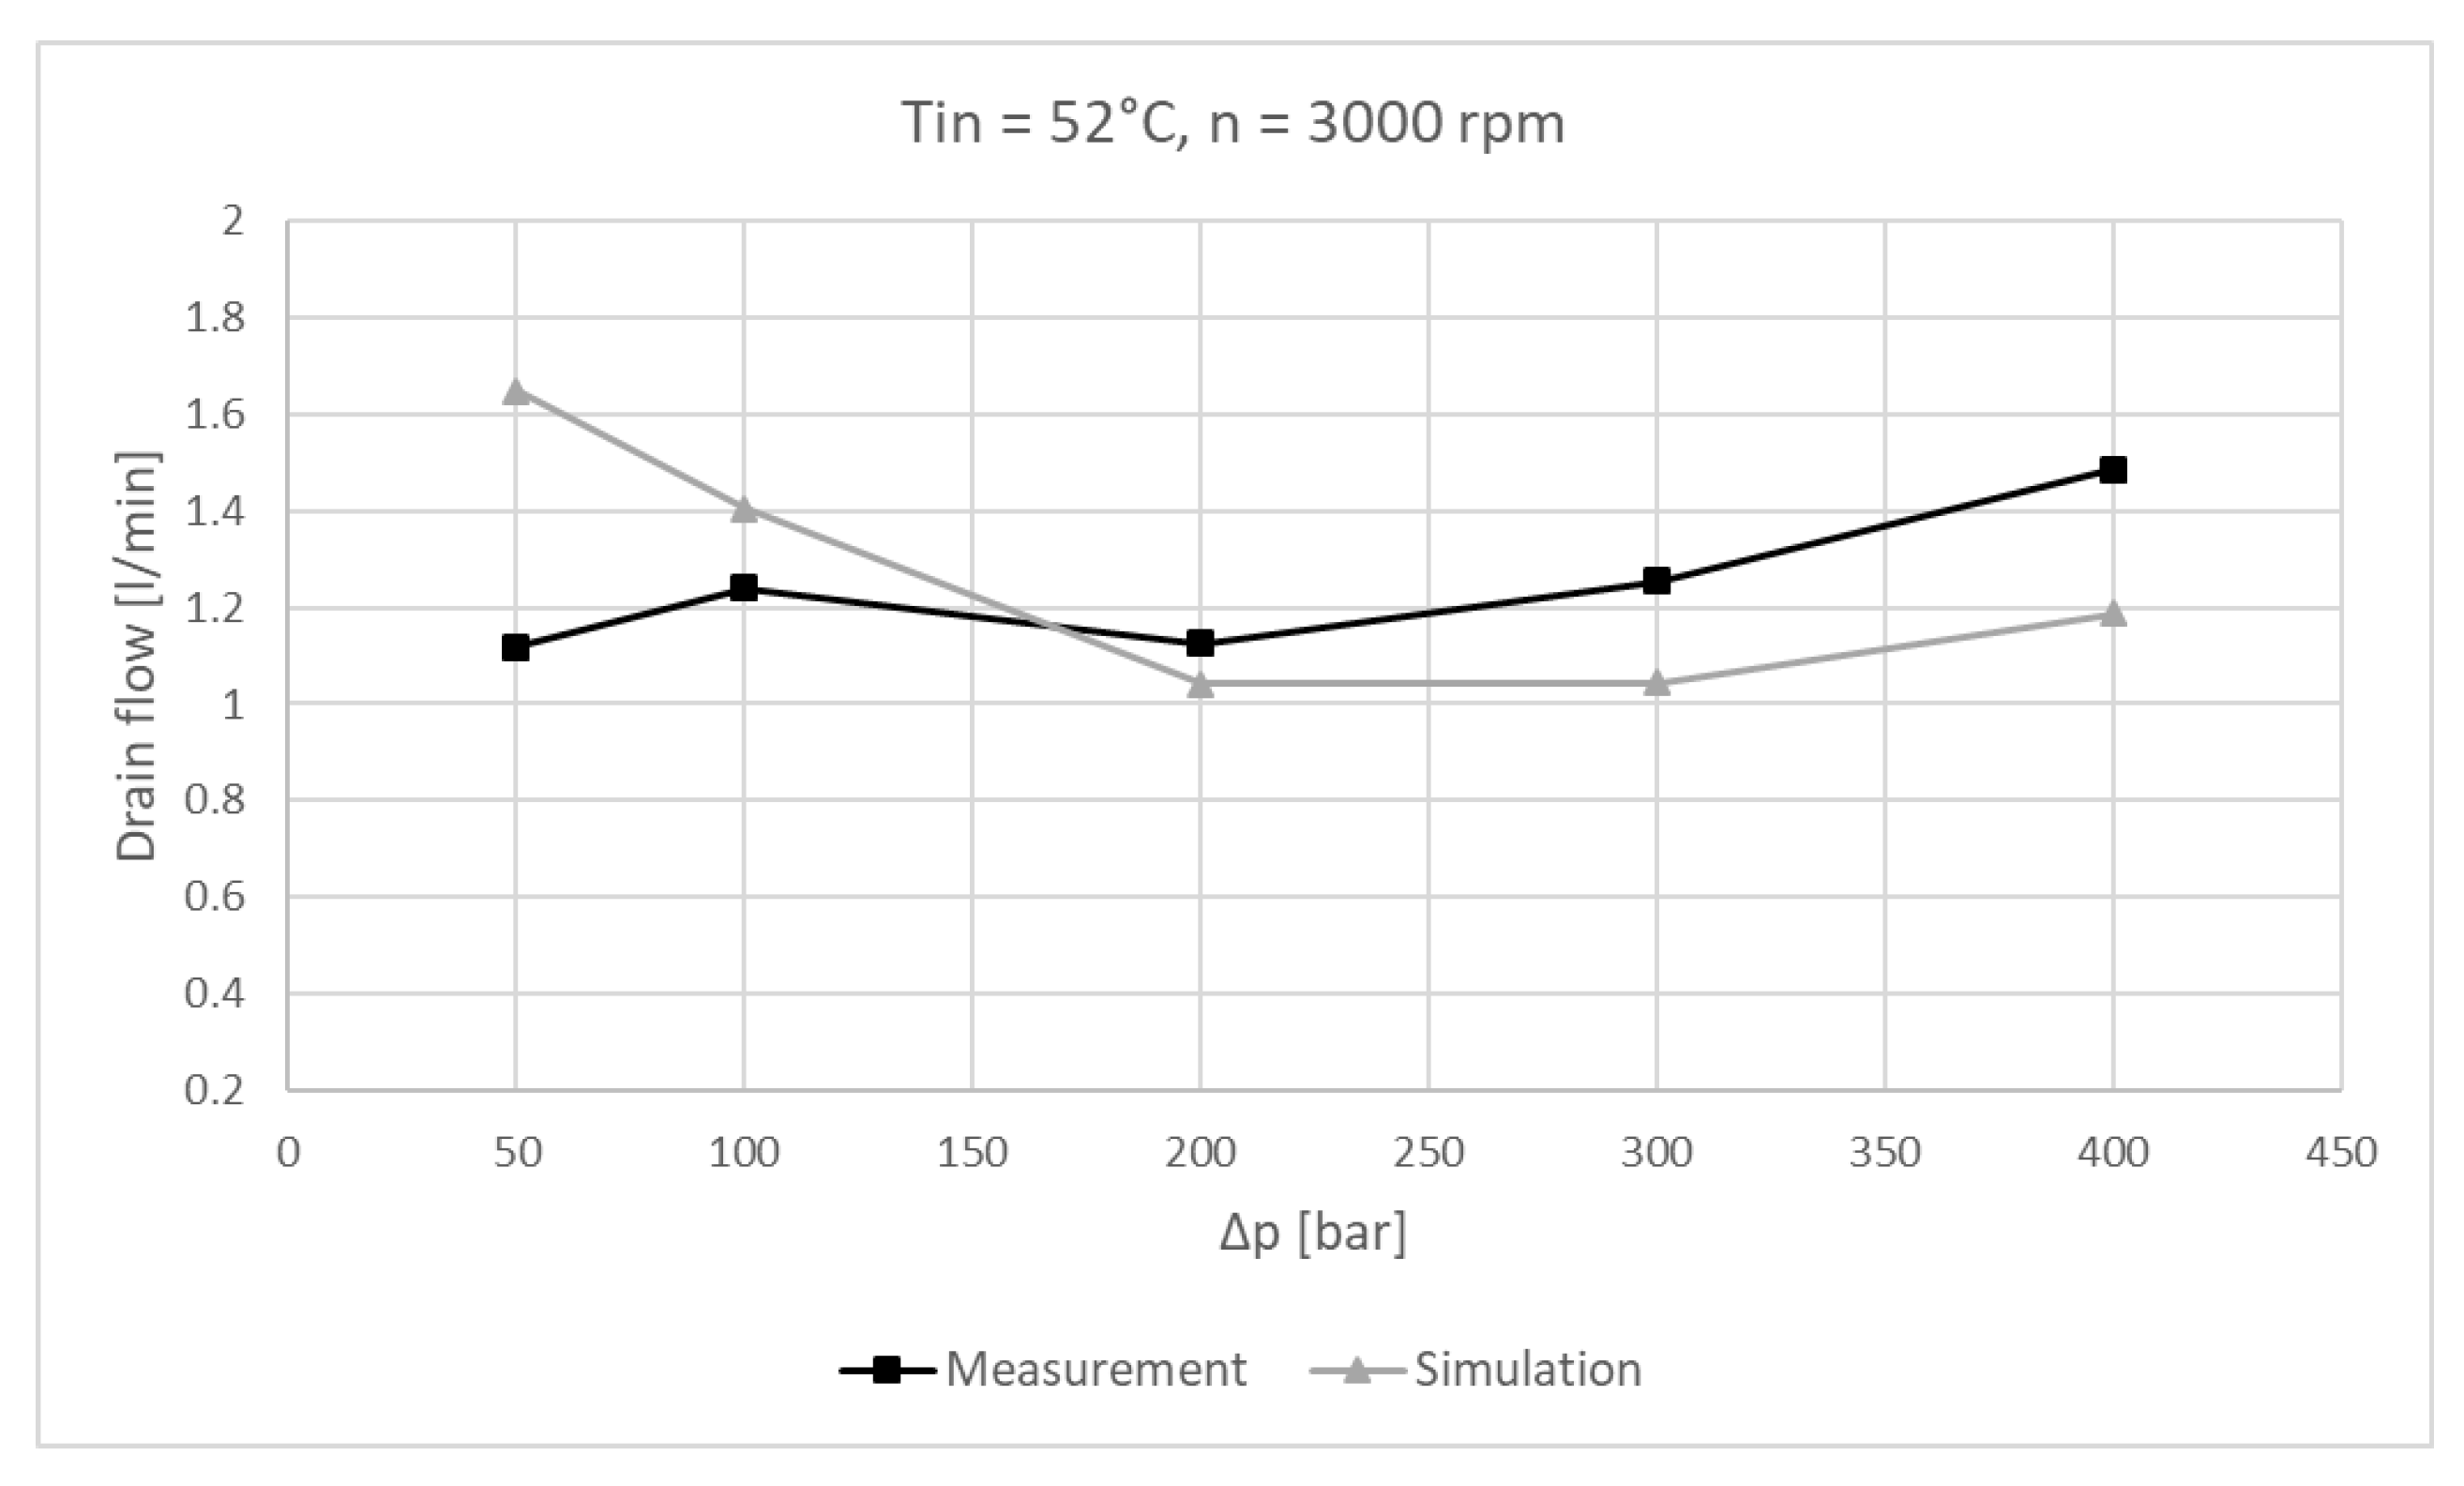
6.3. Experimental Results and Simulation Comparison
7. Discussion
8. Conclusions
Author Contributions
Funding
Acknowledgments
Conflicts of Interest
Nomenclature
| Symbols | Description | Units |
| h | Fluid film height | m |
| u | Velocity on x-axis | m/s |
| v | Velocity on y-axis | m/s |
| p | Pressure | Bar |
| t | Time | S |
| w | Velocity on z-axis | m/s |
| K | Bulk modulus | GPa |
| V | Volume | m3 |
| Q | Volumetric flow | m3/s |
| α | Discharge coefficient | - |
| Ar | Minimum cross-section area | m2 |
| µ | Dynamic viscosity | Pa·s |
| φ | Shaft angle | ° |
| ρ | Density | Kg/ m3 |
| Subscripts | Description | |
| i | Individual displacement chamber | - |
| a | Sliding surface | - |
| b | Fixed surface | - |
| DC | Displacement chamber | - |
| SK | Piston/cylinder interface | - |
| SB | Cylinder block/valve plate interface | - |
| SG | Slipper/swash plate interface | - |
References
- Becker, R.J. Quieting Hydraulic Systems and Components; SAE Technical Paper; SAE International: Milwaukee, WI, USA, 1970. [Google Scholar]
- Helgestad, B.O.; Foster, K.; Bannister, F.K. Pressure Transients in an Axial Piston Hydraulic Pump. Proc. Inst. Mech. Eng. 2007, 188, 189–199. [Google Scholar] [CrossRef]
- Edge, K.A.; Darling, J. Cylinder Pressure Transients in Oil Hydraulic Pumps with Sliding Plate Valves. Proc. Inst. Mech. Eng. Part B Manag. Eng. Manuf. 1986, 200, 45–54. [Google Scholar] [CrossRef]
- Palmberg, J.O. Modelling of flow ripple from fluid power piston pumps. In Proceedings of the 2nd Bath International Power Workshop, Bath, UK, 21–22 September 1989. [Google Scholar]
- Harrison, K.A.; Edge, K.A. Reduction of axial piston pump pressure ripple. Proc. Inst. Mech. Eng. Part I J. Syst. Control Eng. 2000, 214, 53–64. [Google Scholar] [CrossRef]
- Ivantysynova, M. A new approach to the design of sealing and bearing gaps of displacement machines. Proc. JFPS Int. Symp. Fluid Power 1999, 1999, 45–50. [Google Scholar] [CrossRef]
- Manring, N.D. The Discharge Flow Ripple of an Axial-Piston Swash-Plate Type Hydrostatic Pump. J. Dyn. Syst. Meas. Control 2000, 122, 263. [Google Scholar] [CrossRef]
- Wieczorek, U.; Ivantysynova, M. Computer aided optimization of bearing and sealing gaps in hydrostatic machines—The simulation tool CASPAR. Int. J. Fluid Power 2002, 3, 7–20. [Google Scholar] [CrossRef]
- Pettersson, M.; Weddfelt, K.; Palmberg, J. Methods of Reducing Flow Ripple from Fluid; SAE Technical Paper; SAE International: Milwaukee, WI, USA, 1991. [Google Scholar]
- Ivantysynova, M.; Seeniraj, G.K.; Huang, C. Comparison of Different Valve Plate Designs Focusing. In Proceedings of the Ninth Scandinavian International Conference on Fluid Power, Linköping, Sweden, 1–3 June 2005; pp. 1–16. [Google Scholar]
- Johansson, A. Design Principles for Noise Reduction in Hydraulic Piston Pumps: Simulation, Optimisation and Experimental Verification. Ph.D. Thesis, Linköping University, Linköping, Sweden, 2005. [Google Scholar]
- Johansson, A.; Andersson, J.; Palmberg, J.-O. Optimal design of the cross-angle for pulsation reduction in variable displacement pumps. In Proceedings of the Bath Workshop on Power Transmission and Motion Control; Professional Engineering Publishing: Bath, UK, 2002; pp. 319–334. [Google Scholar]
- Manring, N.D.; Dong, Z. The impact of using a secondary swash-plate angle within an axial piston pump. Trans. Soc. Mech. Eng. J. Dyn. Syst. Meas. Control 2004, 126, 65–74. [Google Scholar] [CrossRef]
- Seeniraj, G.K.; Ivantysynova, M. Noise Reduction in Axial Pison Machines Based on Multi-Objective Optimization. In Proceedings of the 5th FPNI PhD Symposium, Cracow, Poland, 1–5 July 2008. [Google Scholar]
- Kim, D.A. Contribution to Digital Prototyping of Axial Piston Pumps/Motors. Master’s Thesis, Purdue University, West Lafayette, IN, USA, 2012. [Google Scholar]
- Kalbfleisch, P.K. Computational Valve Plate Design. Master’s Thesis, Purdue University, West Lafayette, IN, USA, 2015. [Google Scholar]
- Deb, K.; Pratap, A.; Agarwal, S.; Meyarivan, T. A fast and elitist multiobjective genetic algorithm: NSGA-II. IEEE Trans. Evol. Comput. 2002, 6, 182–197. [Google Scholar] [CrossRef]
- Richardson, D.; Sadeghi, F.; Rateick, R.G.; Rowan, S. Experimental and Analytical Investigation of Floating Valve Plate Motion in an Axial Piston Pump. Tribol. Trans. 2017, 60, 537–547. [Google Scholar] [CrossRef]
- Hashemi, S.; Kroker, A.; Bobach, L.; Bartel, D. Multibody dynamics of pivot slipper pad thrust bearing in axial piston machines incorporating thermal elastohydrodynamics and mixed lubrication model. Tribol. Int. 2016, 96, 57–76. [Google Scholar] [CrossRef]
- Hashemi, S.; Friedrich, H.; Bobach, L.; Bartel, D. Validation of a thermal elastohydrodynamic multibody dynamics model of the slipper pad by friction force measurement in the axial piston pump. Tribol. Int. 2017, 115, 319–337. [Google Scholar] [CrossRef]
- Pelosi, M. An Investigation on the Fluid-Structure Interaction of Piston/Cylinder Interface. Ph.D. Thesis, Purdue University, West Lafayette, IN, USA, 2012. [Google Scholar]
- Mizell, D. A Study of the Piston Cylinder Interface of Axial Piston Machines. Ph.D. Thesis, Purdue University, West Lafayette, IN, USA, 2018. [Google Scholar]
- Shang, L. A Path Towar an Effective Scaling Approach for Axial Piston Machines. Ph.D. Thesis, Purdue University, West Lafayette, IN, USA, 2018. [Google Scholar]
- Zecchi, M. A Novel Fluid Structure Interaction and Thermal Model to Predict the Cylinder Block/Valve Plate Interface Performance in Swash Plate Type Axial Piston Machines. Ph.D. Thesis, Purdue University, West Lafayette, IN, USA, 2013. [Google Scholar]
- Schenk, A. Predicting Lubrication Performance between the Slipper and Swashplate in Axial Piston Hydraulic Machines. Ph.D. Thesis, Purdue University, West Lafayette, IN, USA, 2014. [Google Scholar]
- Chacon, R.; Ivantysynova, M. An Investigation of the Impact of Micro Surface on the Cylinder Block/Valve Plate Interface Performance. In Proceedings of the 8th FPNI Ph. D Symposium on Fluid Power, Lappeenranta, Finland, 11–13 June 2014; p. V001T02A006. [Google Scholar]
- Ernst, M.; Ivantysynova, M. Axial Piston Machine Cylinder Block Bore Surface Profile for High-Pressure Operating Conditions with Water as Working Fluid. In Proceedings of the 2018 Global Fluid Power Society PhD Symposium (GFPS), Samara, Russia, 18–20 July 2018; pp. 1–7. [Google Scholar]
- Wondergem, A.M.; Ivantysynova, M. The Impact of the Surface Shape of the Piston on Power Losses. In Proceedings of the 8th FPNI Ph.D Symposium on Fluid Power, Lappeenranta, Finland, 11–13 June 2014. [Google Scholar]
- Wondergem, A.M.; Ivantysynova, M. The Impact of Micro-Surface Shaping on the Piston/Cylinder Interface of Swash Plate Type Machines. In Proceedings of the ASME/BATH 2015 Symposium on Fluid Power and Motion Control, Chicago, IL, USA, 12–14 October 2015; p. V001T01A060. [Google Scholar]
- Ivantysyn, R. Computational Design of Swash Plate Type Axial Piston Pumps a Framework for Computational Design. Master’s Thesis, Purdue University, West Lafayette, IN, USA, 2011. [Google Scholar]
- Huang, C.; Ivantysynova, M. A new approach to predict the load carrying ability of the gap between valve plate and cylinder block. In Proceedings of the Bath Workshop on Power transmission and Motion Control PTMC, Bath, UK, 10–12 September 2003; pp. 225–239. [Google Scholar]
- Seeniraj, G.K.; Ivantysynova, M. Multi-objective Optimization Tool for Noise Reduction in Axial Piston Machines. SAE Int. J. Commer. Veh. 2008, 1, 544–552. [Google Scholar] [CrossRef]
- Schenk, A.; Ivantysynova, M. Design and Optimization of the Slipper-Swashplate Interface Using an Advanced Fluid-Structure-Interaction Model. In Proceedings of the 52nd National Conference on Fluid Power 2011, Las Vegas, NV, USA, 23–25 March 2011; pp. 91–100. [Google Scholar]
- Shang, L.; Ivantysynova, M. Port and case flow temperature prediction for axial piston machines. Int. J. Fluid Power 2015, 16, 35–51. [Google Scholar]
- Shang, L.; Ivantysynova, M. A temperature adaptive piston design for swash plate type axial piston machines. Int. J. Fluid Power 2017, 18, 38–48. [Google Scholar] [CrossRef]
- Shang, L.; Ivantysynova, M. Scaling Criteria for Axial Piston Machines Based on Thermo-Elastohydrodynamic Effects in the Tribological Interfaces. Energies 2018, 11, 3210. [Google Scholar] [CrossRef]
- Ivantysyn, J.; Ivantysynova, M. Hydrostatic Pumps and Motors, Principles, Designs, Performance, Modelling, Analysis, Control and Testing; Academia Books International: New Dehli, India, 2001; ISBN 81-85522-16-2. [Google Scholar]
- Schenk, A.; Ivantysynova, M. A Transient Thermoelastohydrodynamic Lubrication Model for the Slipper/Swashplate in Axial Piston Machines. J. Tribol. 2015, 137, 031701. [Google Scholar] [CrossRef]
- Manring, N.; Ivantysyn, J. Extended Slipper for Hydrostatic Pump and Motor Rotating Cylinders. U.S. Patent No 6,220,144, 3 June 1997. [Google Scholar]
- Chacon, R.; Ivantysynova, M. An Investigation of the Impact of the Elastic Deformation of the End case / Housing on Axial Piston Machines Cylinder Block/Valve Plate Lubricating Interface. In Proceedings of the 10th IFK International Conference on Fluid Power, Dresden, Germany, 8–10 March 2016; pp. 283–294. [Google Scholar]
- Chacon, R. Advanced Virtual Prototyping of Axial Piston Machines. In Proceedings of the 9th FPNI Ph.D. Symposium on Fluid Power, Catarina, Brazil, 26–28 October 2016; p. V001T01A036. [Google Scholar]
- Chacon, R. Cylinder block/valve plate interface performance investigation through the introduction of micro-surface shaping. Master’s Thesis, Purdue University, West Lafayette, IN, USA, 2014. [Google Scholar]
- Kim, T.; Kalbfleisch, P.; Ivantysynova, M. The effect of cross porting on derived displacement volume. Int. J. Fluid Power 2014, 15, 77–85. [Google Scholar] [CrossRef]


| Cost Functions |
|---|
| f1() = Leakage (%) |
| f2() = ∆Qhp (L/min) |
| f3() = ∆Mx (Nm) |
| f4() = ∆My (Nm) |
| f5() = (Nm) |
| Description | Symbol | Unit |
|---|---|---|
| Young’s modulus | E | (Pa) |
| Poisson’s ratio | ν | (-) |
| Density | ρ | (kg/m3) |
| Thermal conductivity | λ | (W/mK) |
| Coefficient of linear thermal expansion | α | (-) |
| Operating Condition | Speed (rpm) | Δp (bar) | Displacement (%) |
|---|---|---|---|
| 1 | max | max | max |
| 2 | max | max | min |
| 3 | max | min | min |
| 4 | max | min | max |
| 5 | min | max | max |
| 6 | min | max | min |
| 7 | min | min | min |
| 8 | min | min | max |
| 9 | min | max | moderate |
| 10 | moderate | max | max |
| Description | Specification |
|---|---|
| Pressure differential | 50, 100, 200, 300, 400 (bar) |
| Speed | 1000, 2000, 3000 (rpm) |
| Displacement | 100 (%) |
| Temperature | 42, 52, 72 (°C) |
| ID | Description | Specification |
|---|---|---|
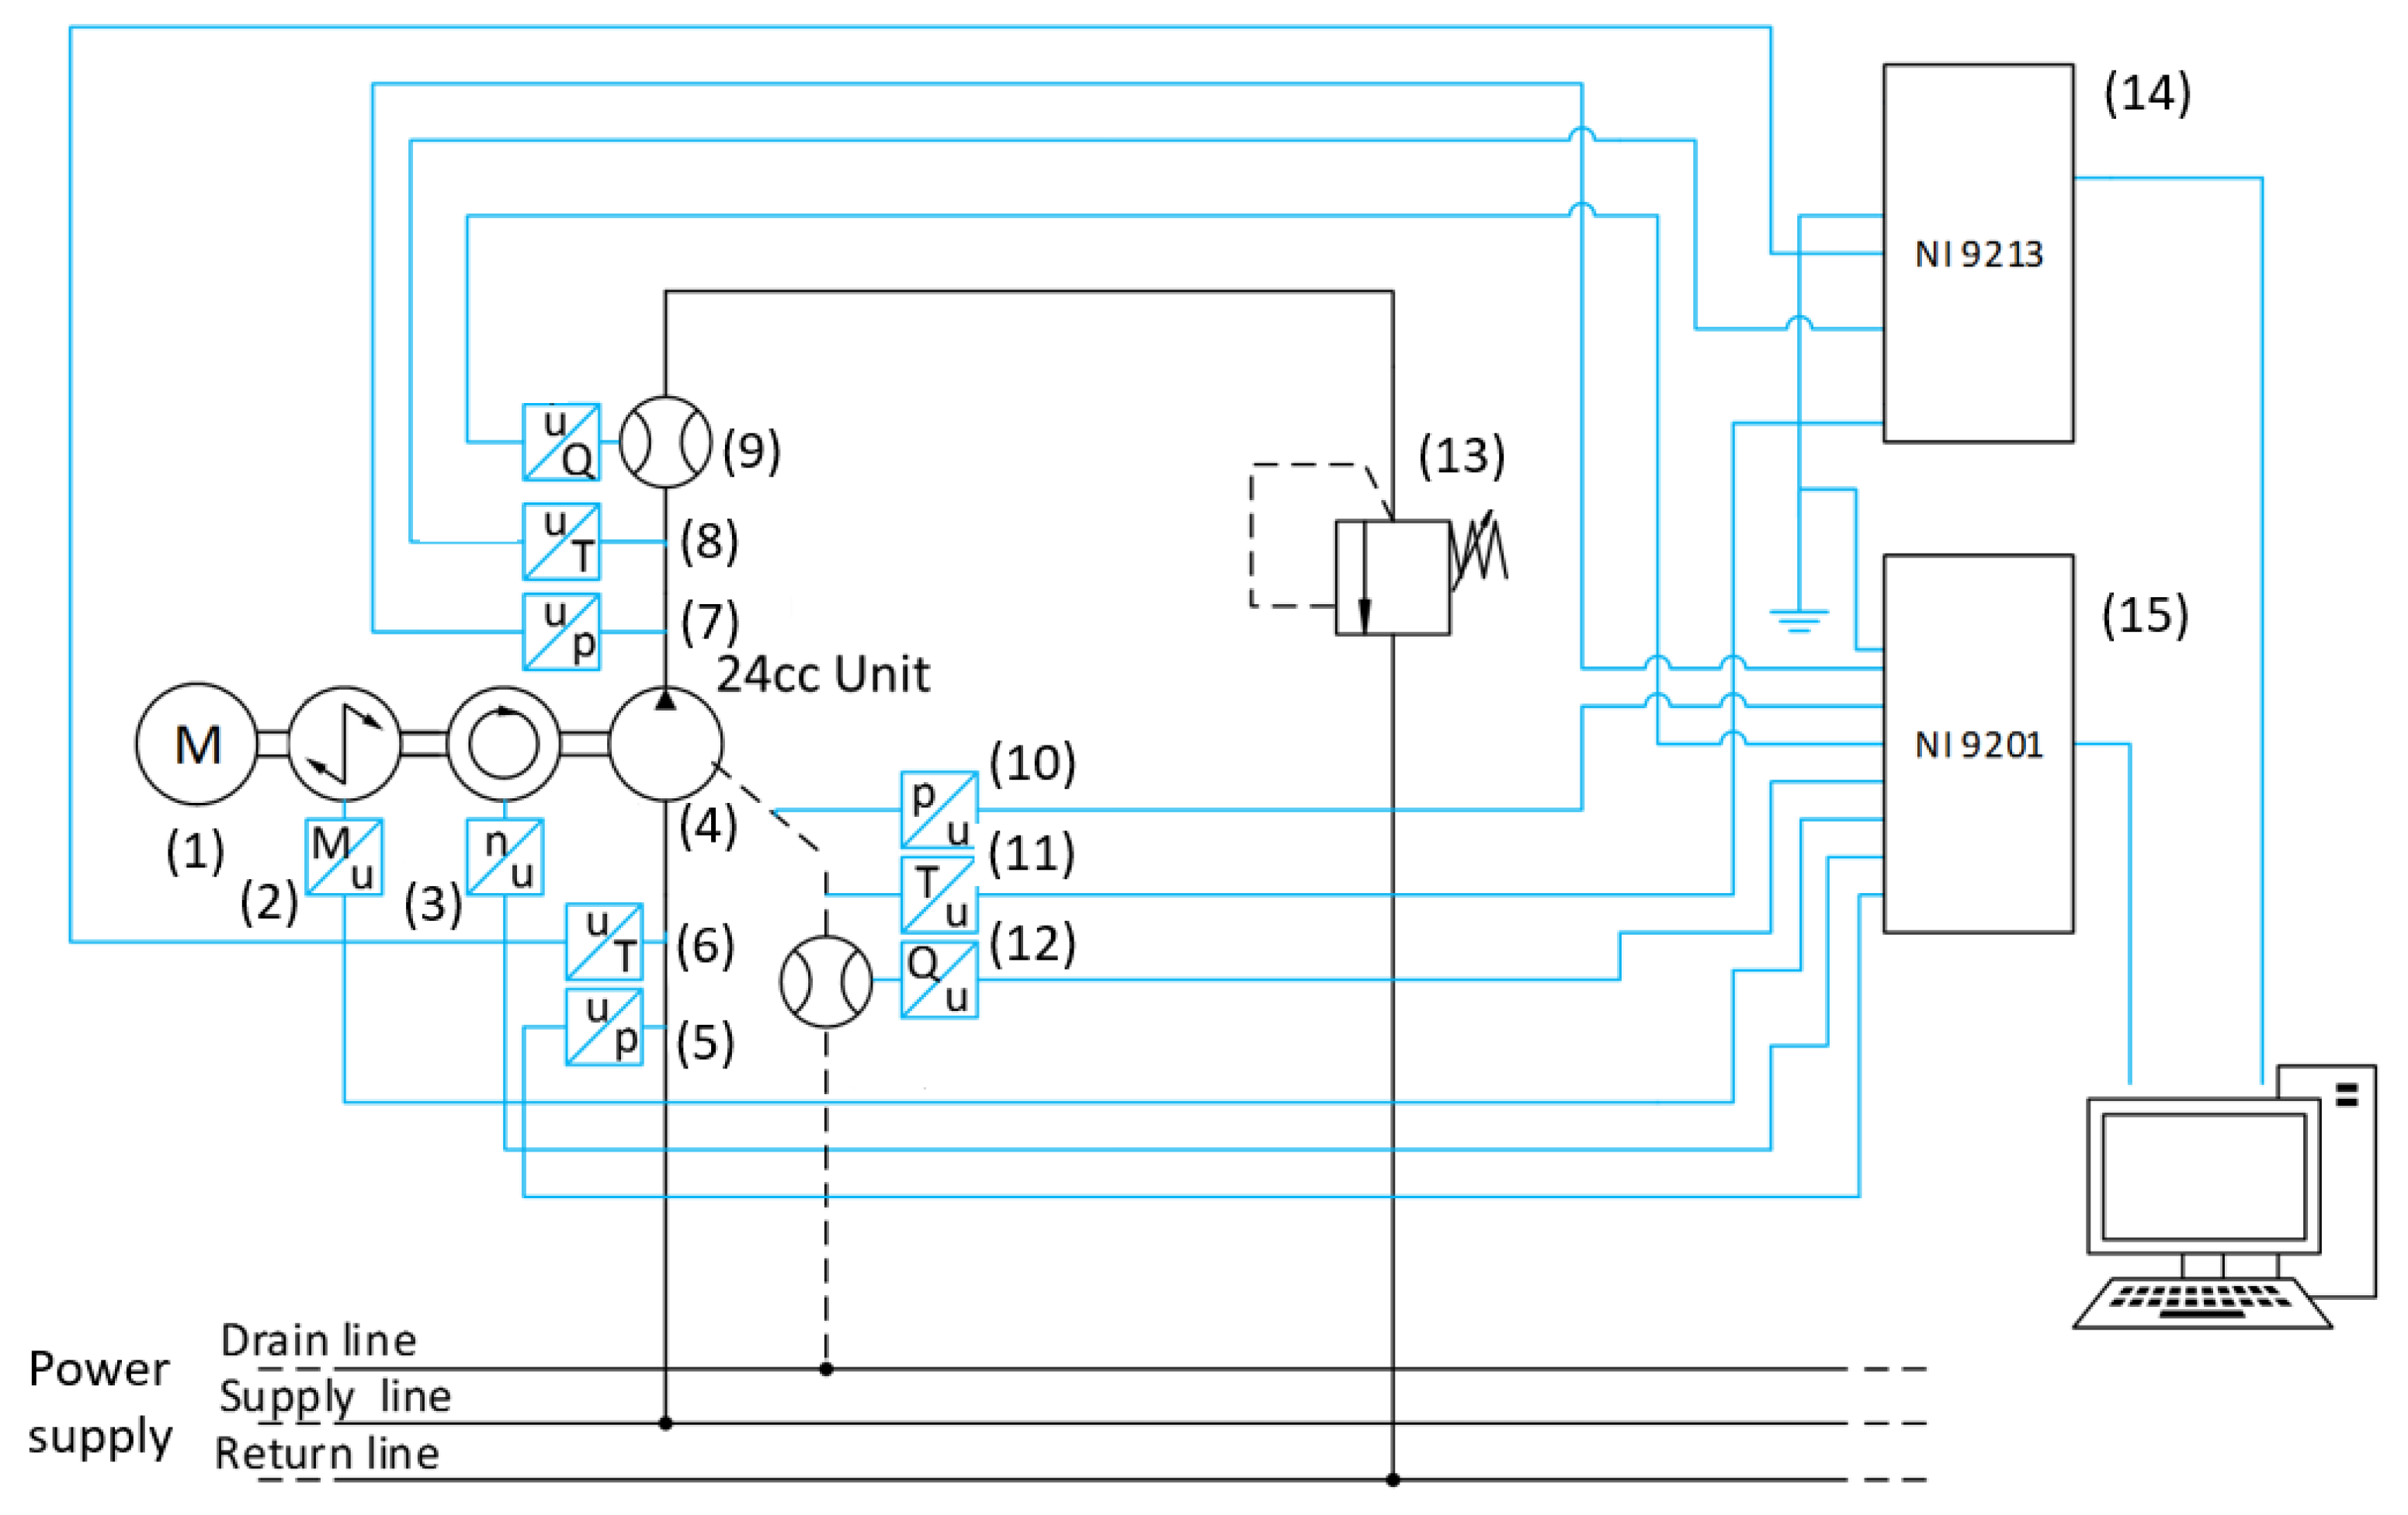
| 1 | Electric drive | Max power: 225 Kw, Max torque 615 Nm @3500 rpm |
| 2, 3 | Staiger Mohilo torque cell | 0–500 Nm range, error ±0.2% of full scale |
| 4 | Closed circuit pump | 24cc, fixed displacement, max torque 160 Nm @Δp = 400 bar |
| 5 | Pressure transducer | WIKA S-10, 0–100 bar, 0.125% BFSL |
| 6, 8, 11 | Thermocouple | Omega K-type Thermocouple, 2.2 °C error limit |
| 7 | Pressure transducer | HYDAC HAD 4445, 0.5% BFSL |
| 9 | Flowmeter | VSE VS 10 Gear type, 1.2–250 L/min, 0.3% accuracy |
| 10 | Pressure transducer | WIKA S-10, 0–25 bar, 0.125% BFSL |
| 12 | Flowmeter | VSE VS 0.2 Gear type, 0.02–18 L/min, 0.3% accuracy |
| 13 | Pressure relief | Max flow 350 L/min |
| 14 | DAQ | NI cDAQ, NI 9213 |
| 15 | DAQ | NI cDAQ, NI 9201 |
© 2019 by the authors. Licensee MDPI, Basel, Switzerland. This article is an open access article distributed under the terms and conditions of the Creative Commons Attribution (CC BY) license (http://creativecommons.org/licenses/by/4.0/).
Share and Cite
Chacon, R.; Ivantysynova, M. Virtual Prototyping of Axial Piston Machines: Numerical Method and Experimental Validation. Energies 2019, 12, 1674. https://doi.org/10.3390/en12091674
Chacon R, Ivantysynova M. Virtual Prototyping of Axial Piston Machines: Numerical Method and Experimental Validation. Energies. 2019; 12(9):1674. https://doi.org/10.3390/en12091674
Chicago/Turabian StyleChacon, Rene, and Monika Ivantysynova. 2019. "Virtual Prototyping of Axial Piston Machines: Numerical Method and Experimental Validation" Energies 12, no. 9: 1674. https://doi.org/10.3390/en12091674
APA StyleChacon, R., & Ivantysynova, M. (2019). Virtual Prototyping of Axial Piston Machines: Numerical Method and Experimental Validation. Energies, 12(9), 1674. https://doi.org/10.3390/en12091674