Effectiveness of Blending Alternative Procurement Models and EU Funding Mechanisms Based on Energy Efficiency Case Study Simulation

Abstract
1. Introduction
2. Procurement Models and Funding Mechanisms: An Overview
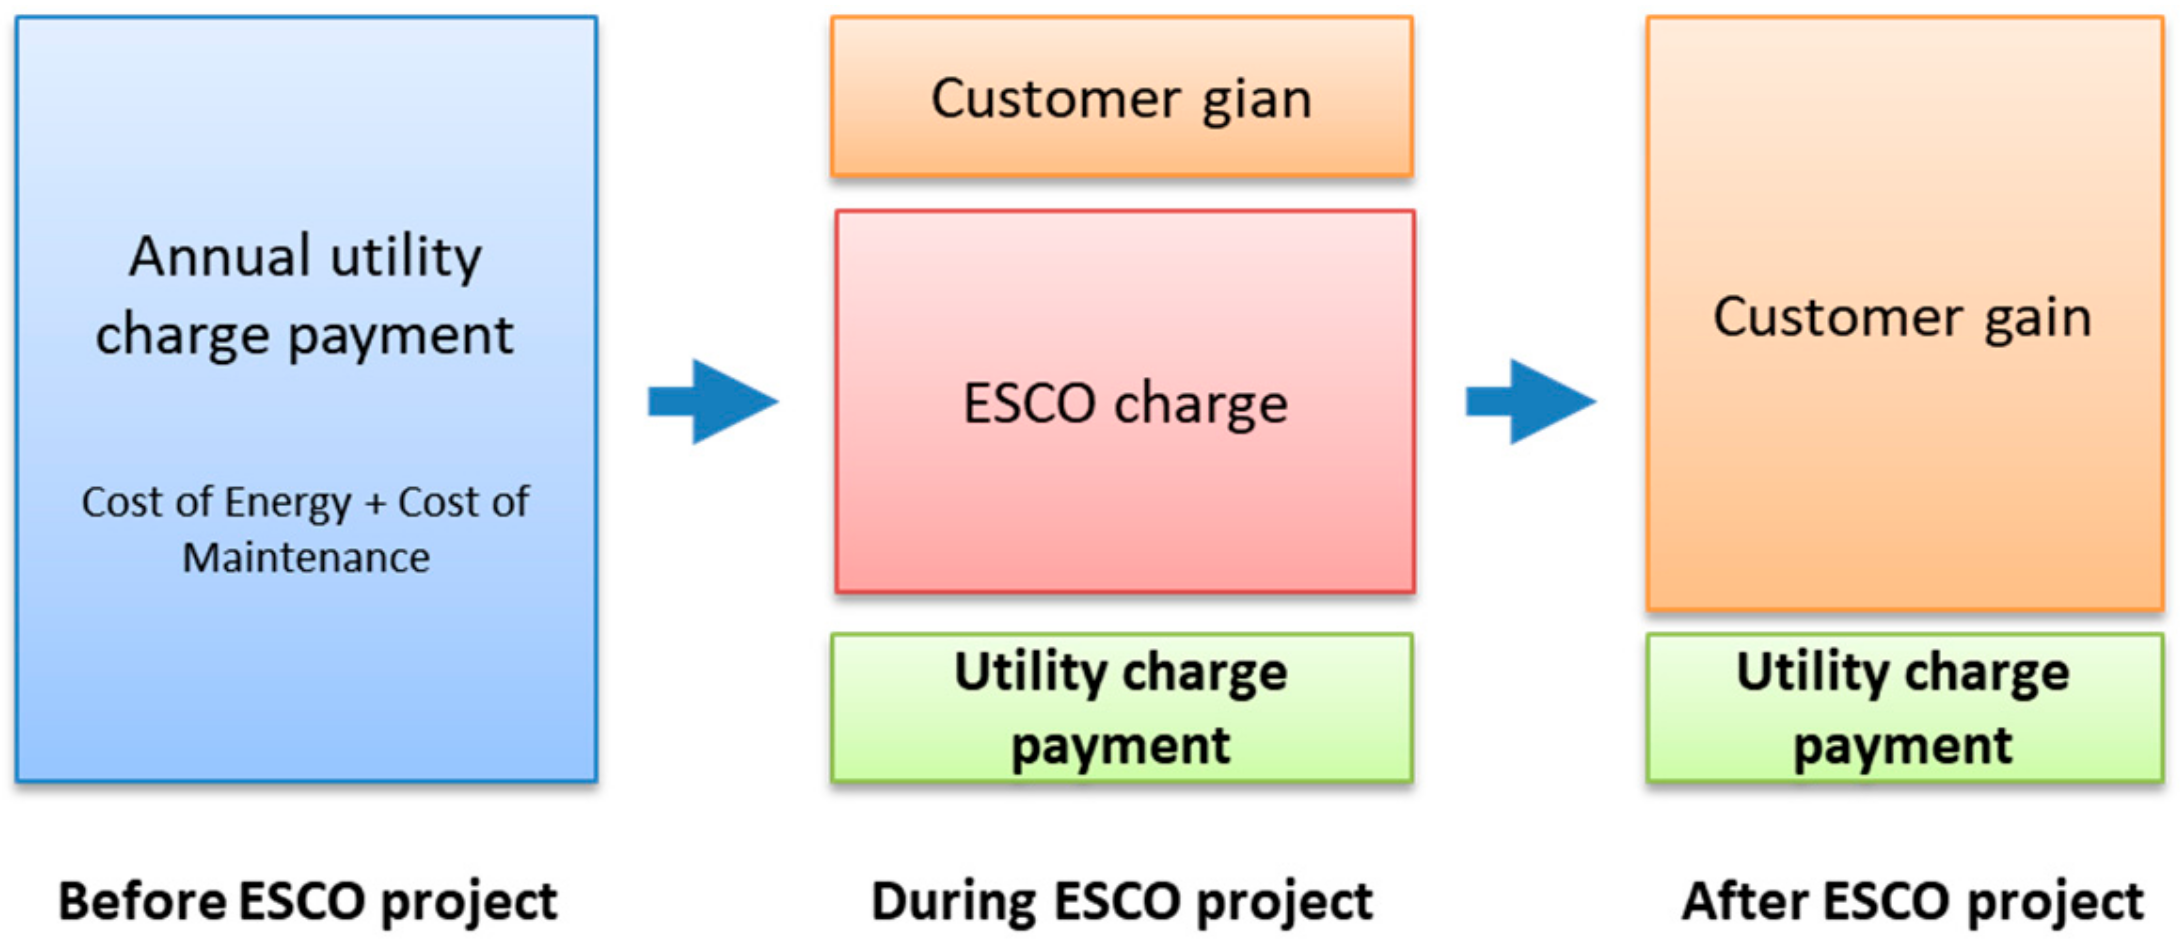
2.1. Traditional and Alternative Delivery Models in EE Projects
2.2. Traditional and Alternative Funding Mechanisms in EE Projects
3. Case Study Simulation
3.1. Basic Case—EE Project in Education Sector
3.2. Concept of Blending in EE Projects
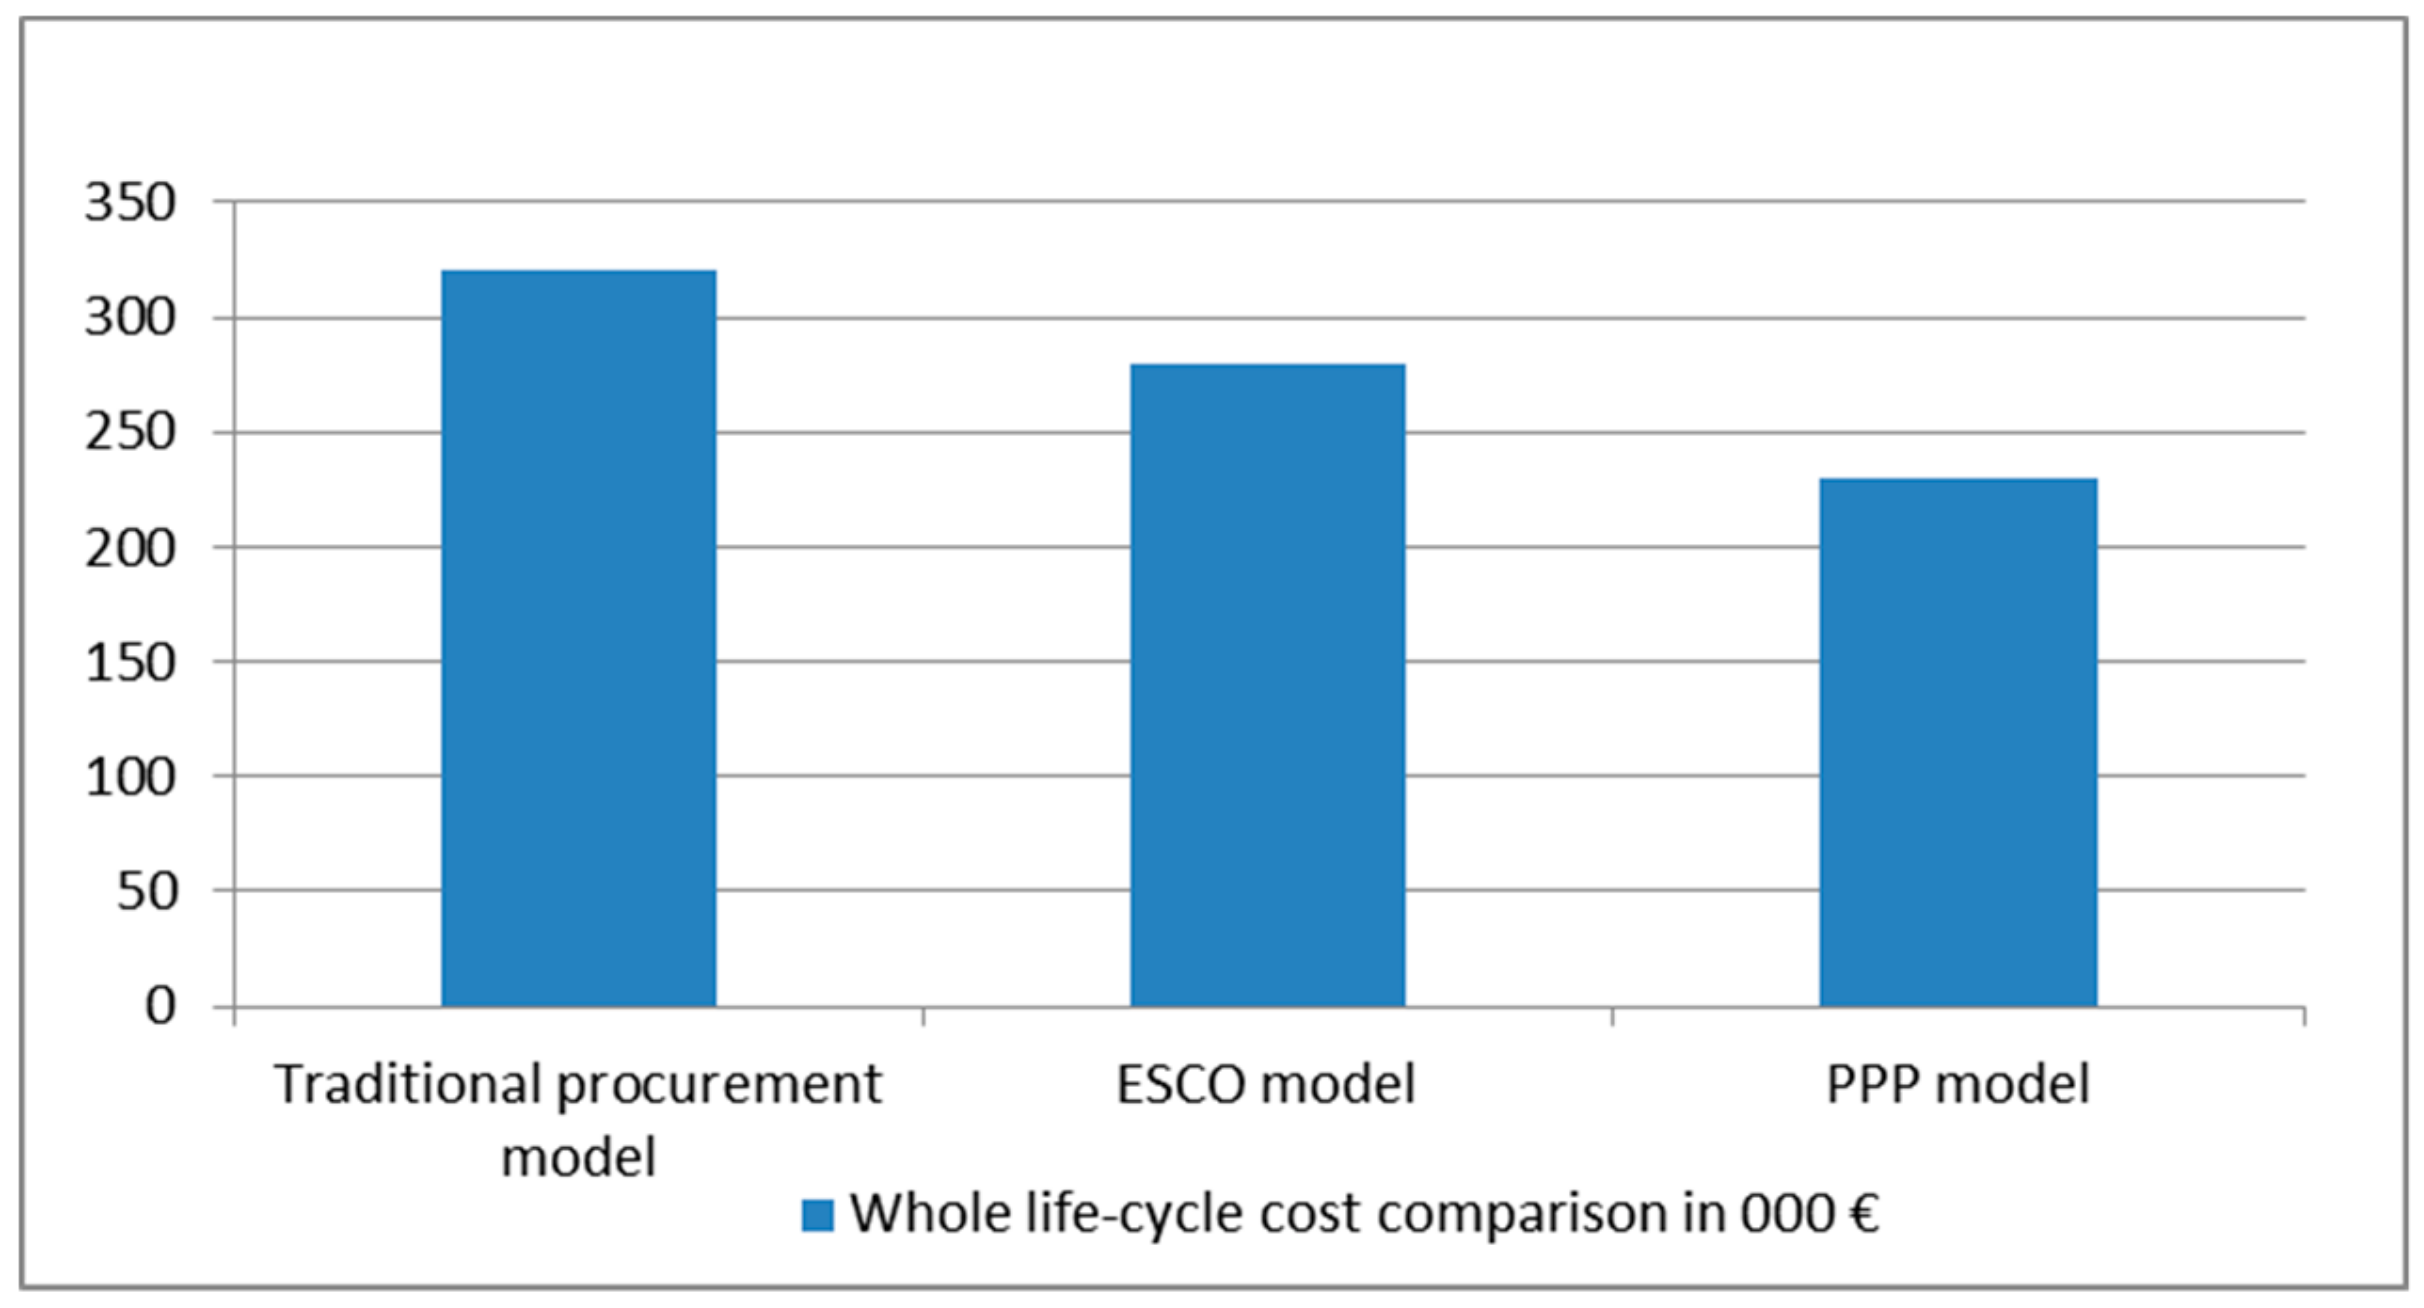
3.3. Effectiveness of Blending
4. Discussion
5. Conclusions
Author Contributions
Funding
Conflicts of Interest
Appendix A

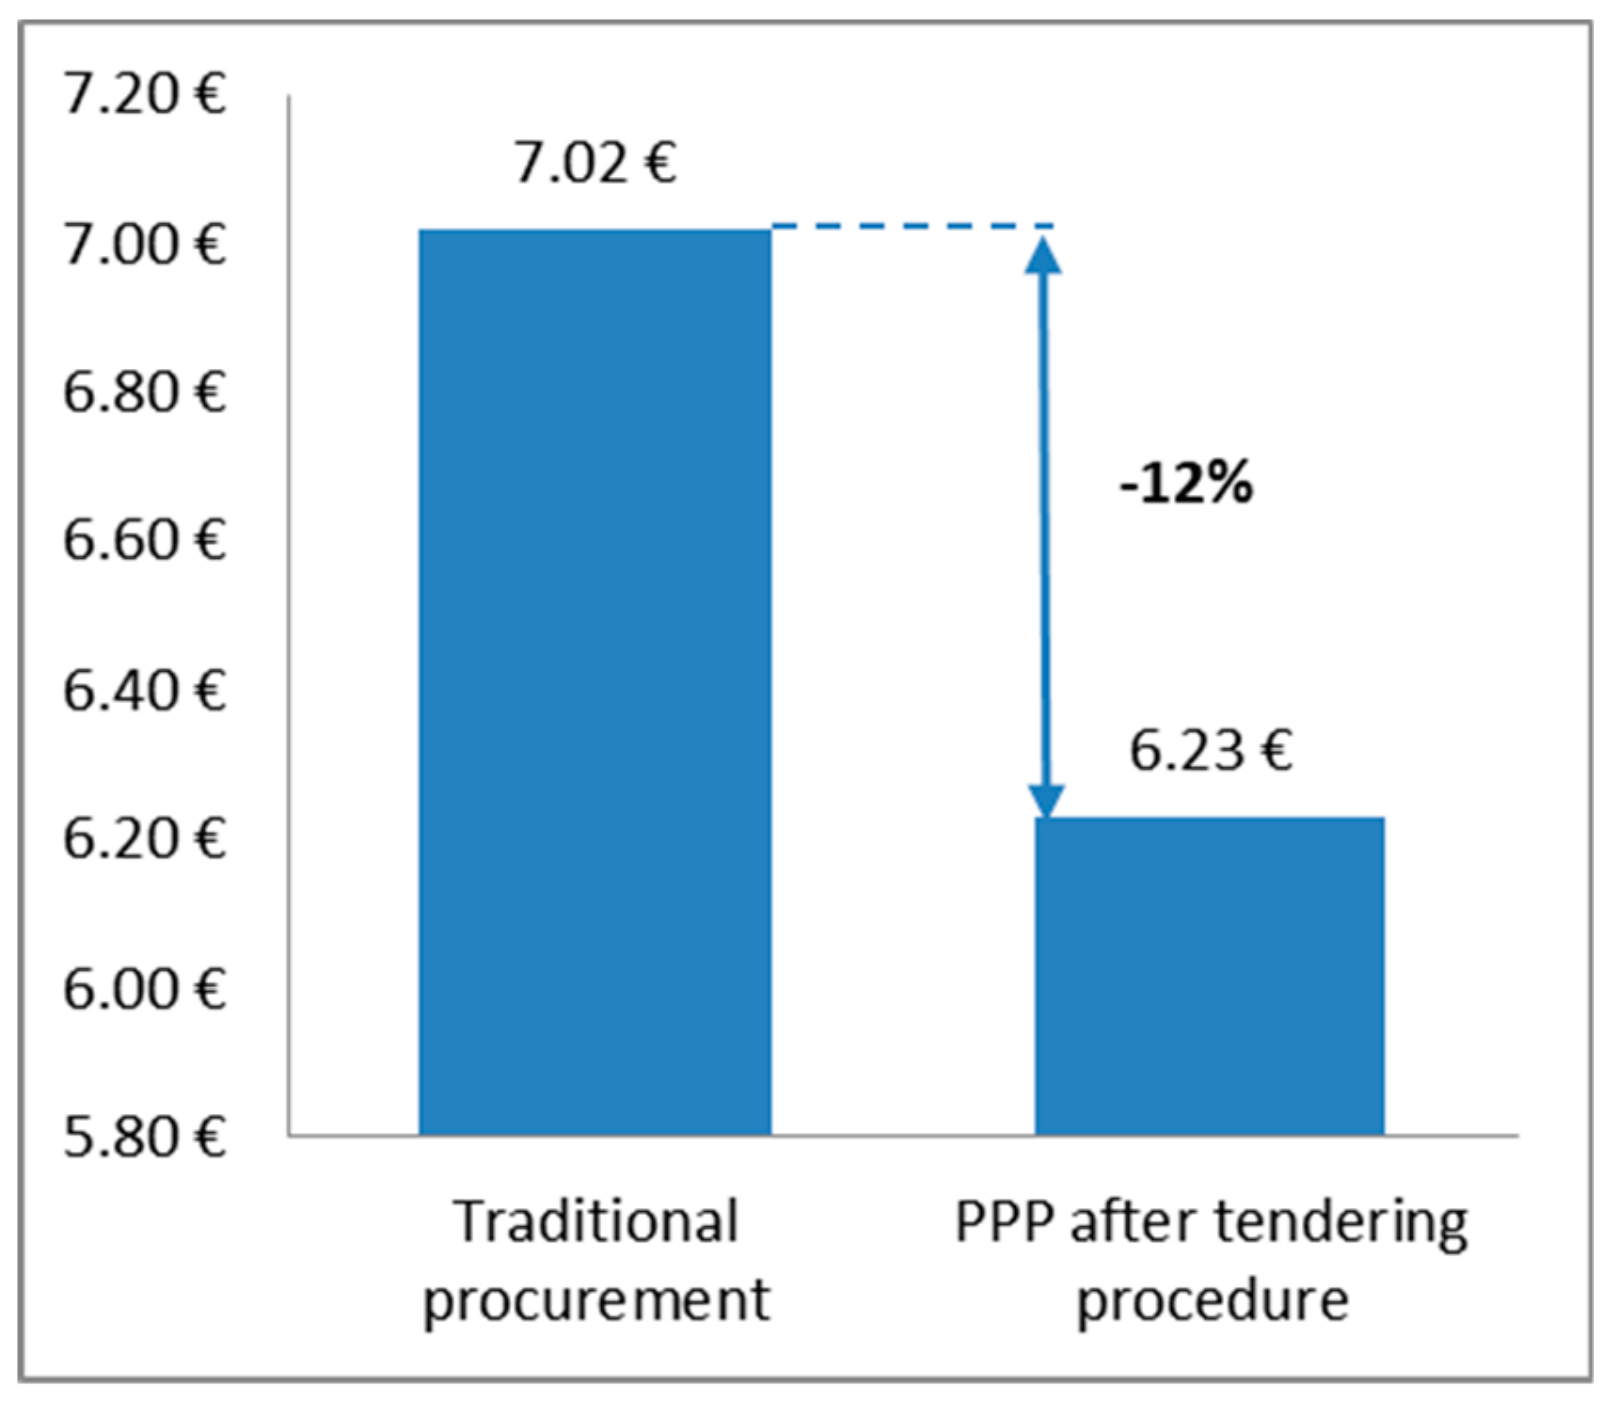
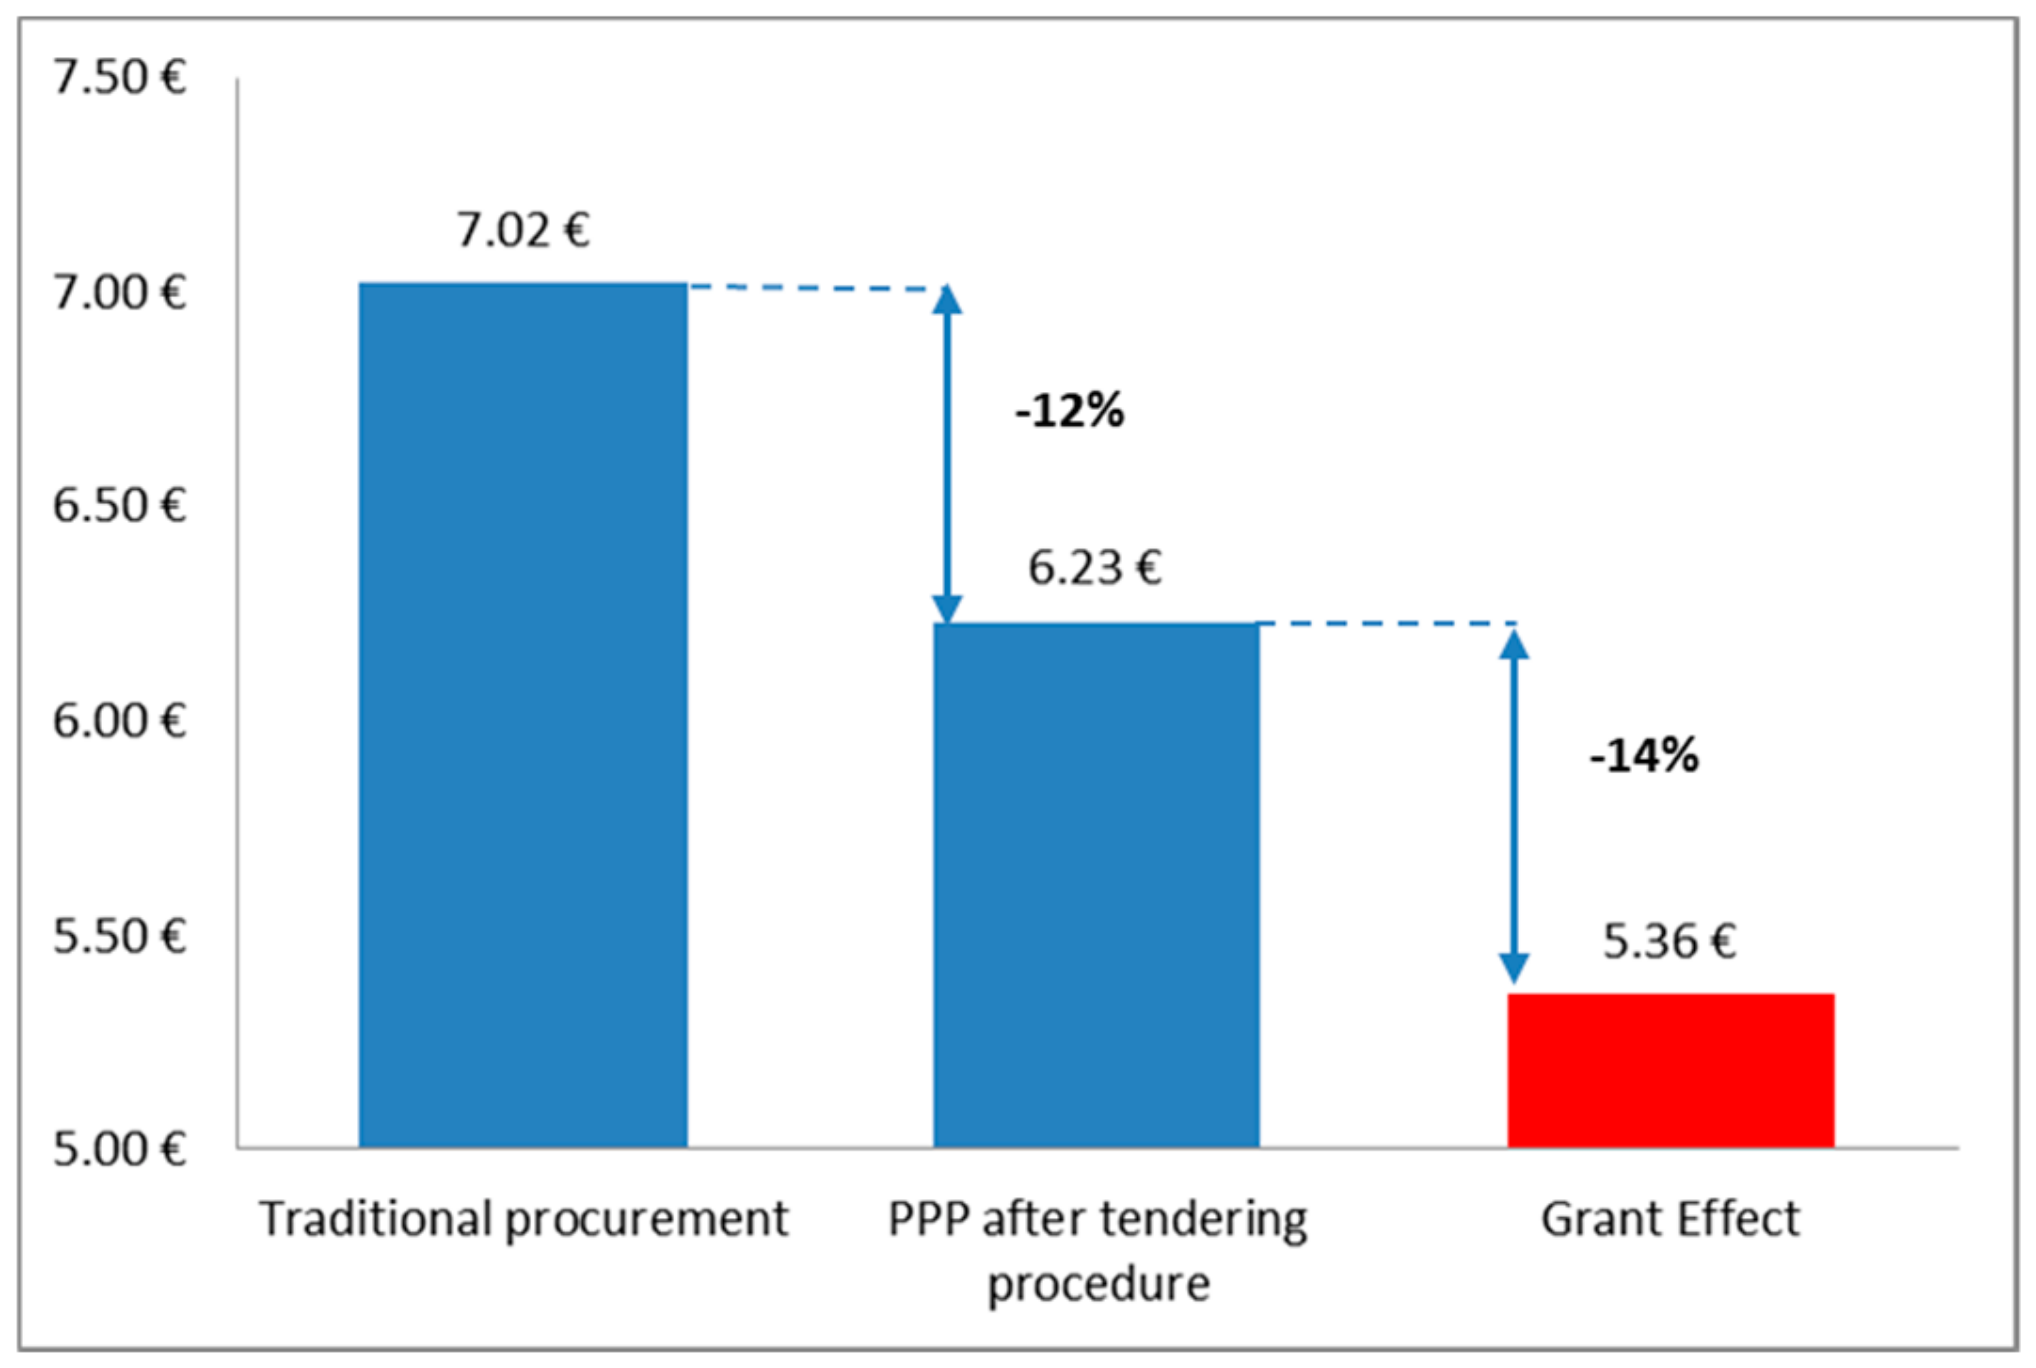
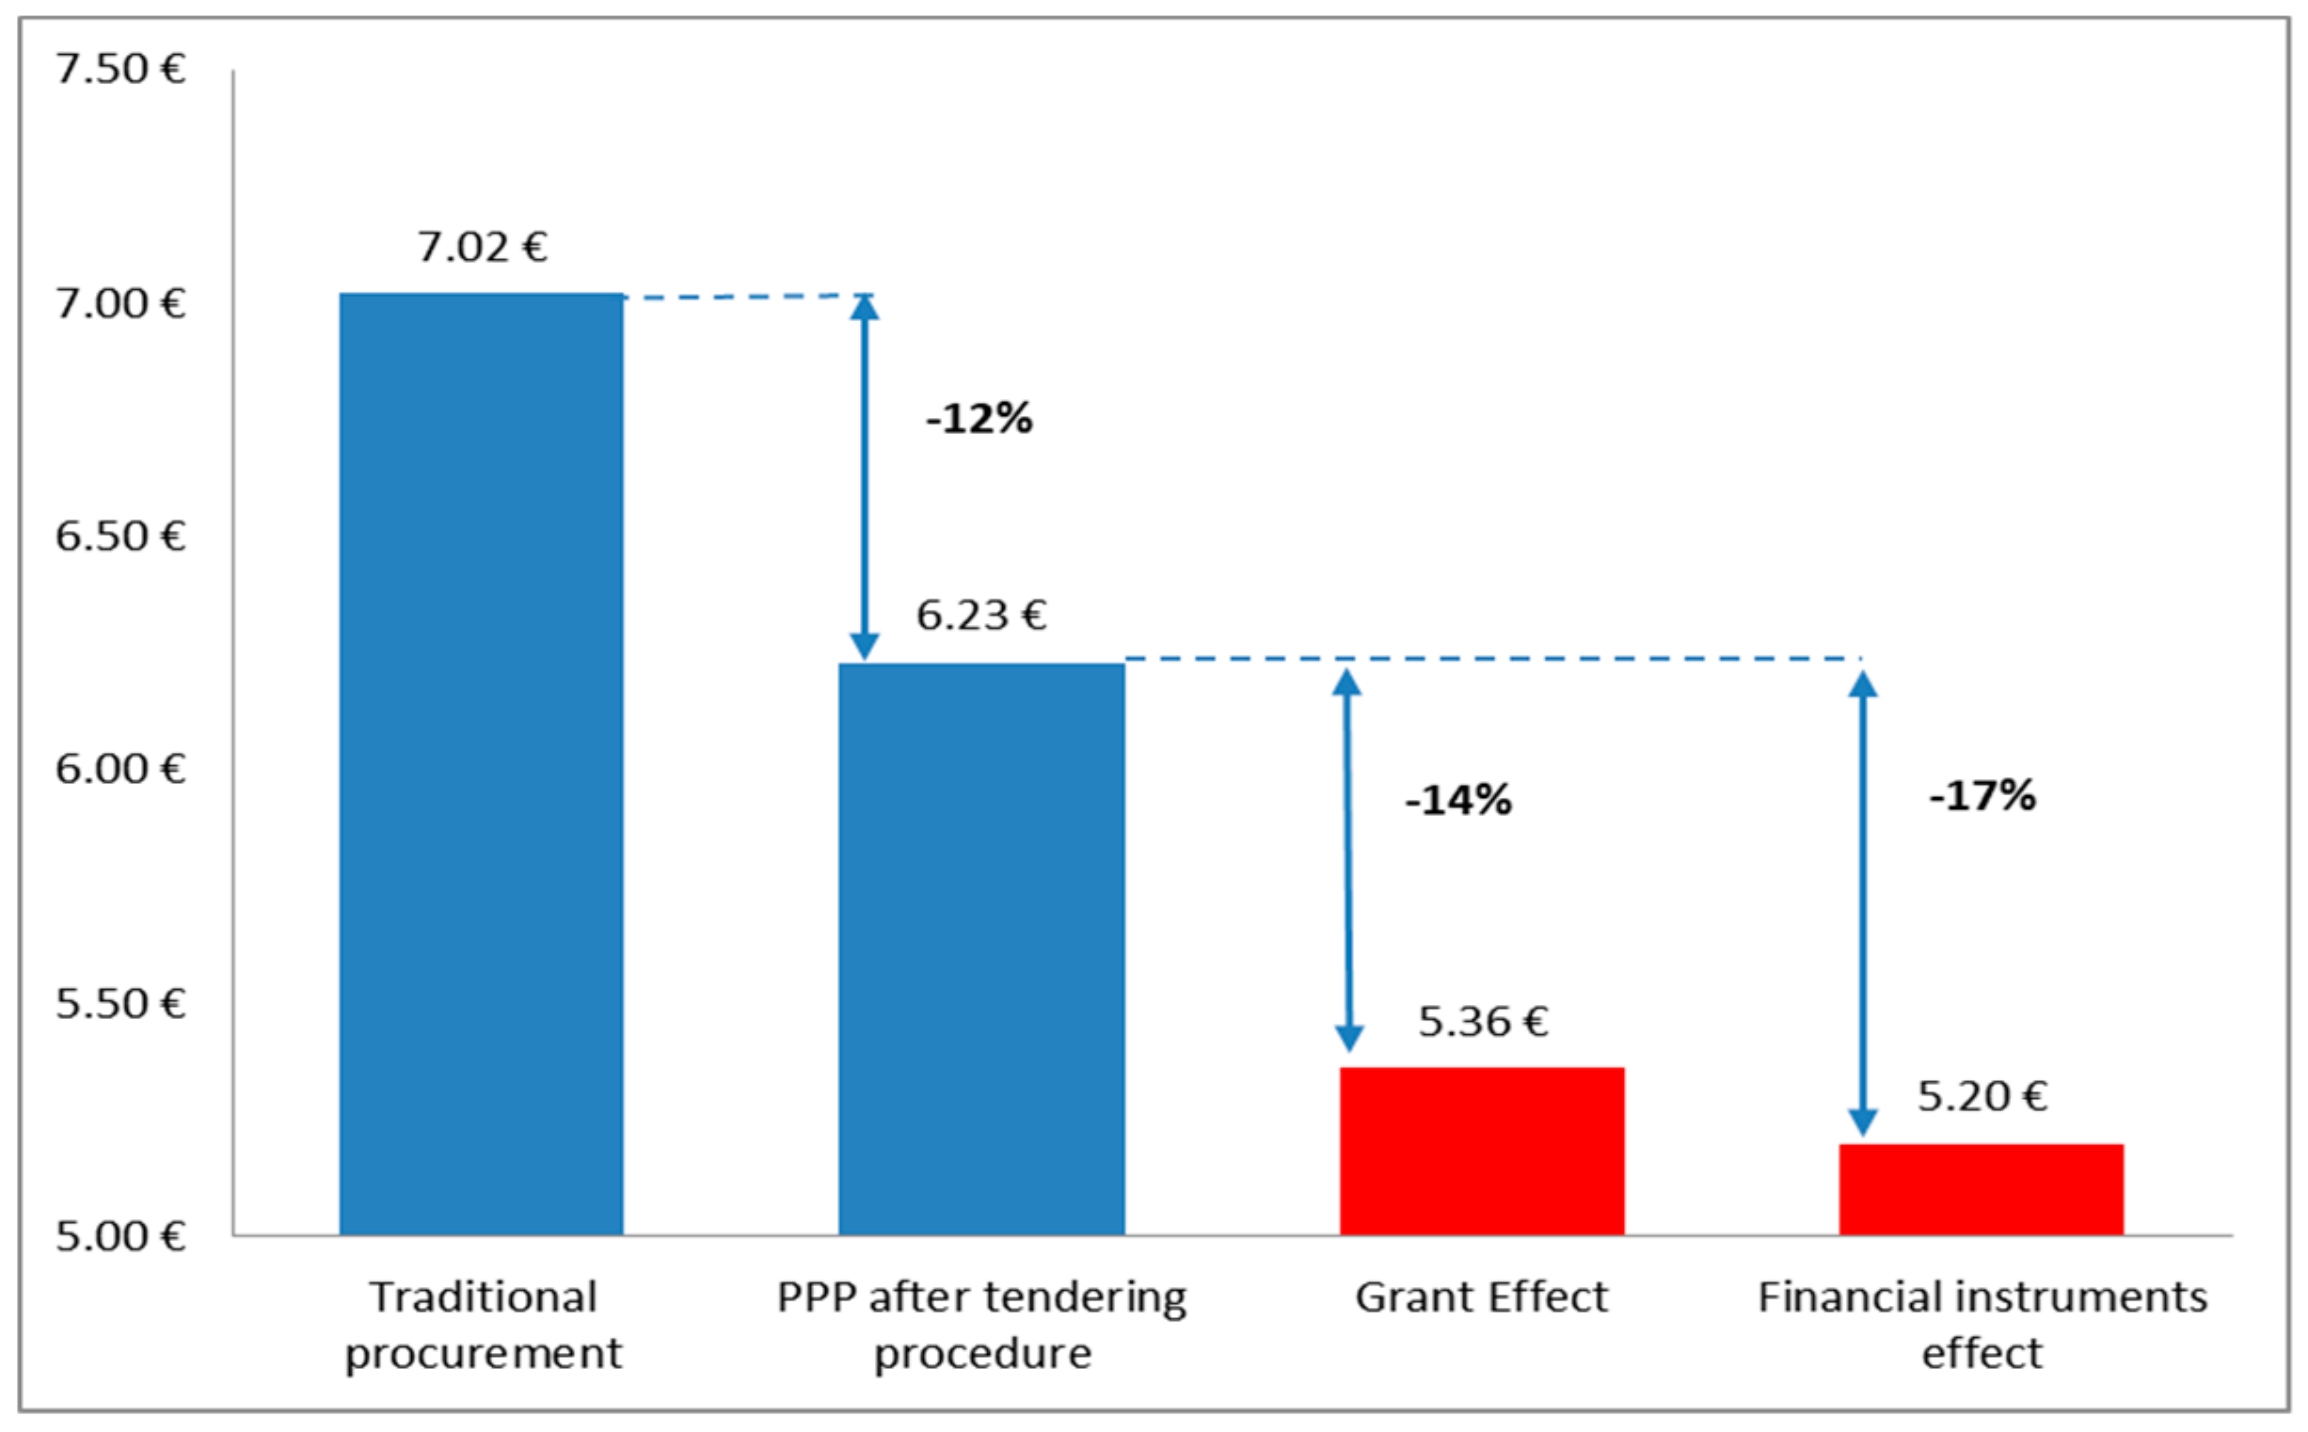
| VfM Analysis for EE School Project No. 0004/2011 | Traditional Procurement | PPP Bid (Offered by Private Sector) |
|---|---|---|
| Discount rate | 5.50% | 5.50% |
| CAPEX | 2,149,697.00 € | 2,149,697.00 € |
| NPV of Whole-life-cycle costs (30 years) | 4,971,851.01 € | 4,412,340.71 € |
| Monthly Unitary Charge(Availability Payment) | 22,527.18 € | 19,992.18 € |
| Duration (number of years) | 30 | 30 |
| Total m2 of asset | 3,209.00 m2 | 3,209.00 m2 |
| Monthly Unitary Charge (Availability payment) per m2 | 7.02 € | 6.23 € |
| Proposed PPP model: | Availability based PPP model | |
| Value for Money (% difference form traditional procurement) | 12% | |
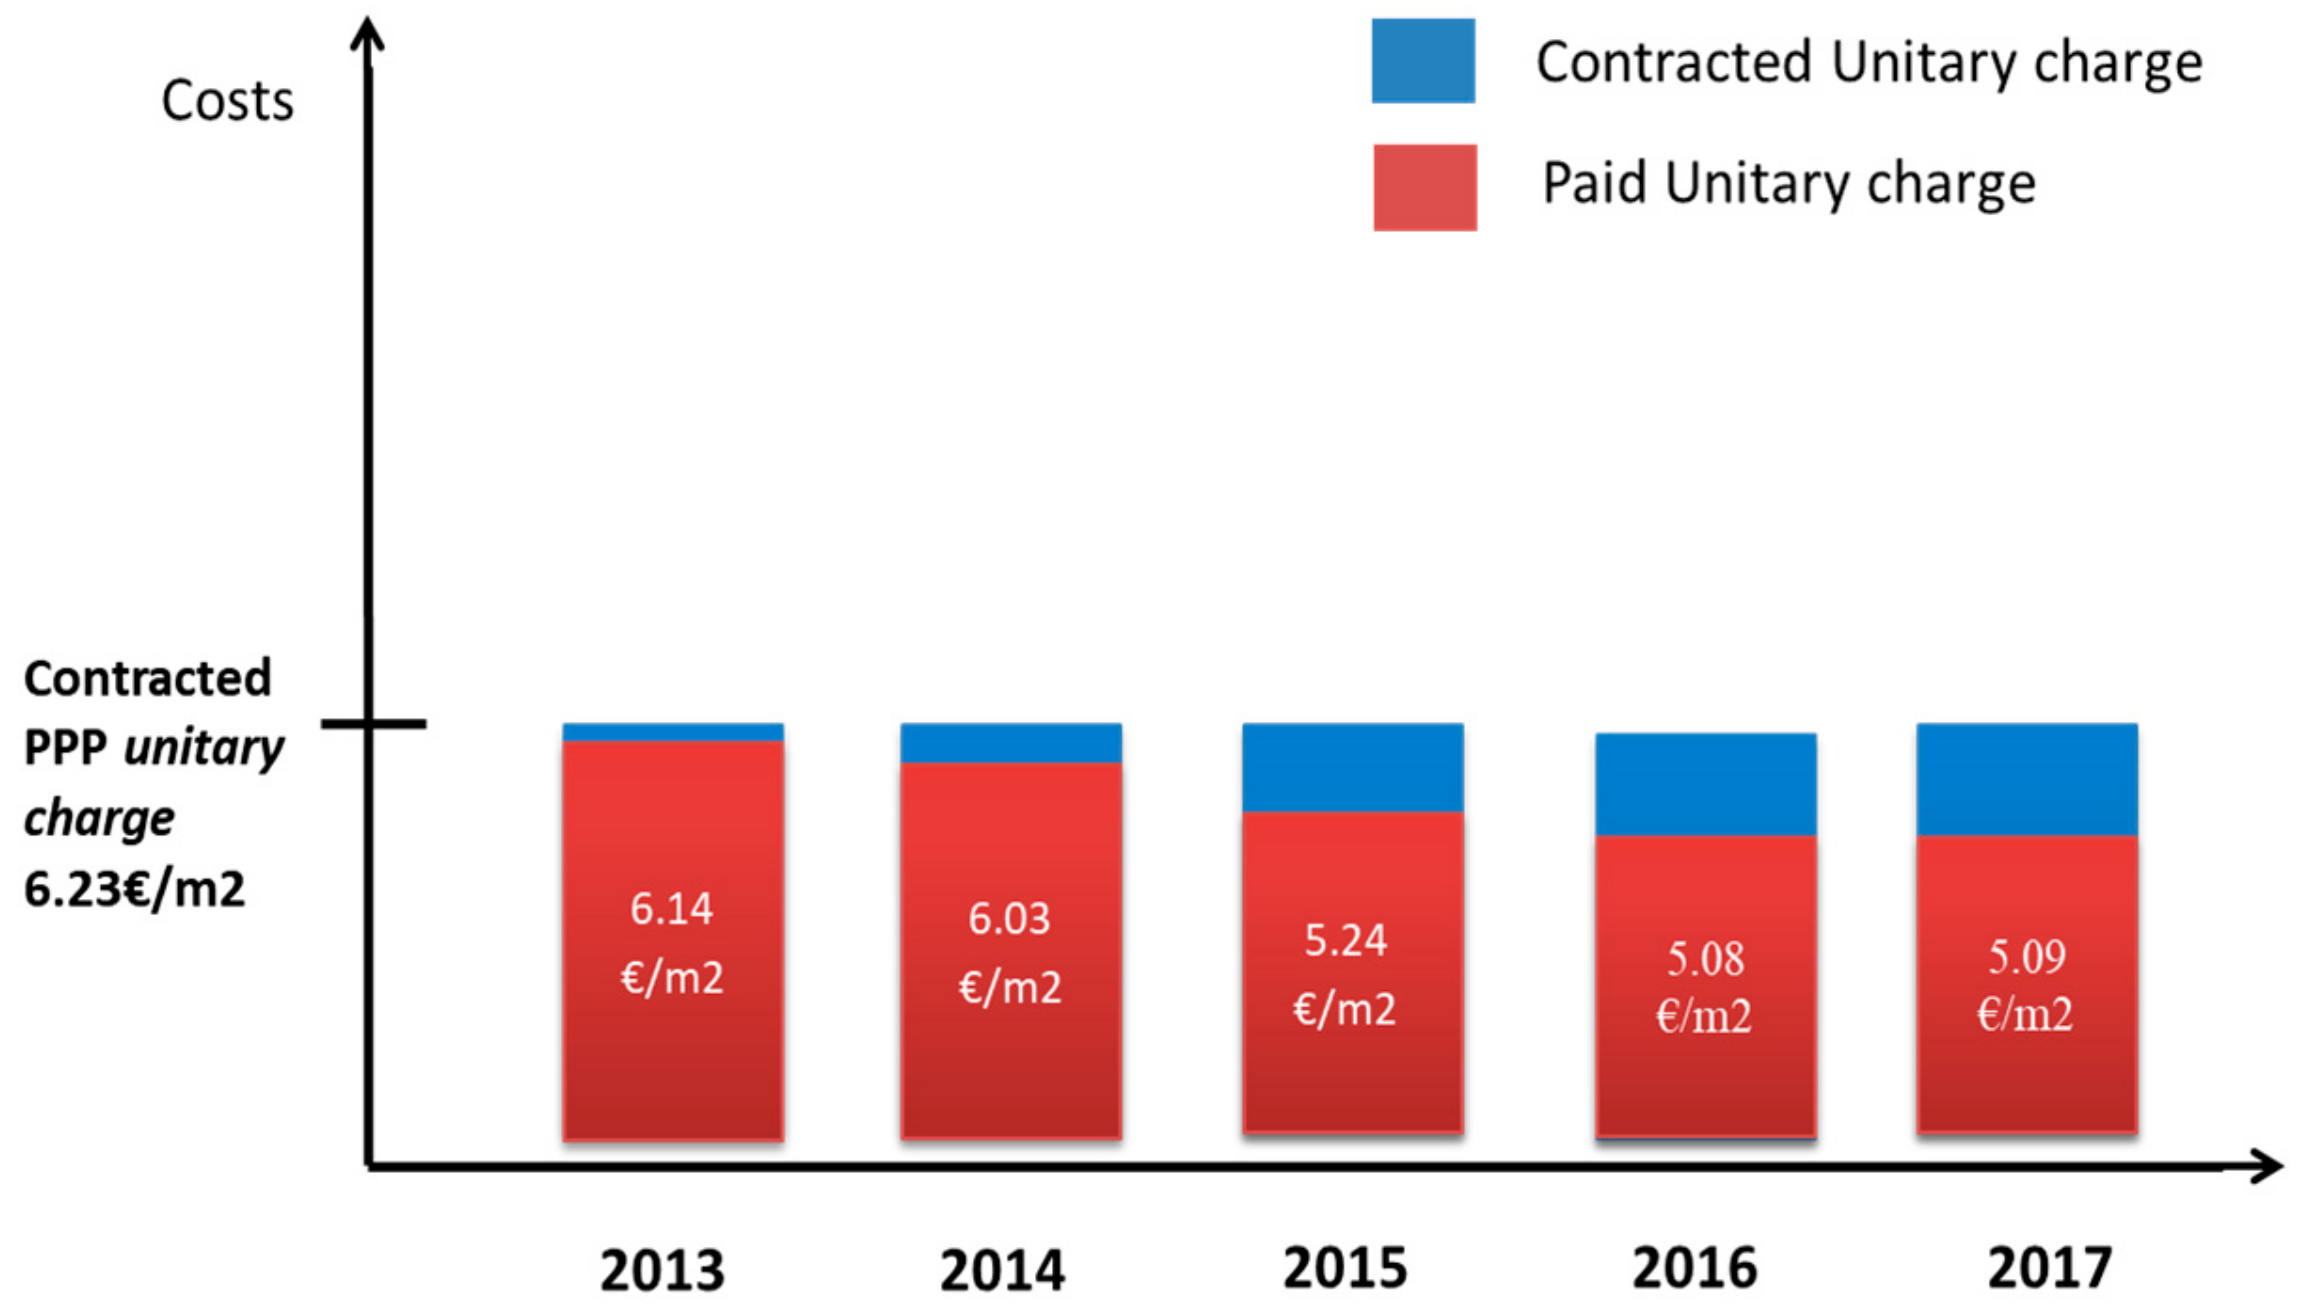
| YEARS | 2013 | 2014 | 2015 | 2016 | 2017 |
|---|---|---|---|---|---|
| Unitary Charge Data | |||||
| Number of m2 of project asset | 3.209 m2 | 3.209 m2 | 3.209 m2 | 3.209 m2 | 3.209 m2 |
| Indexation | No | No | No | No | No |
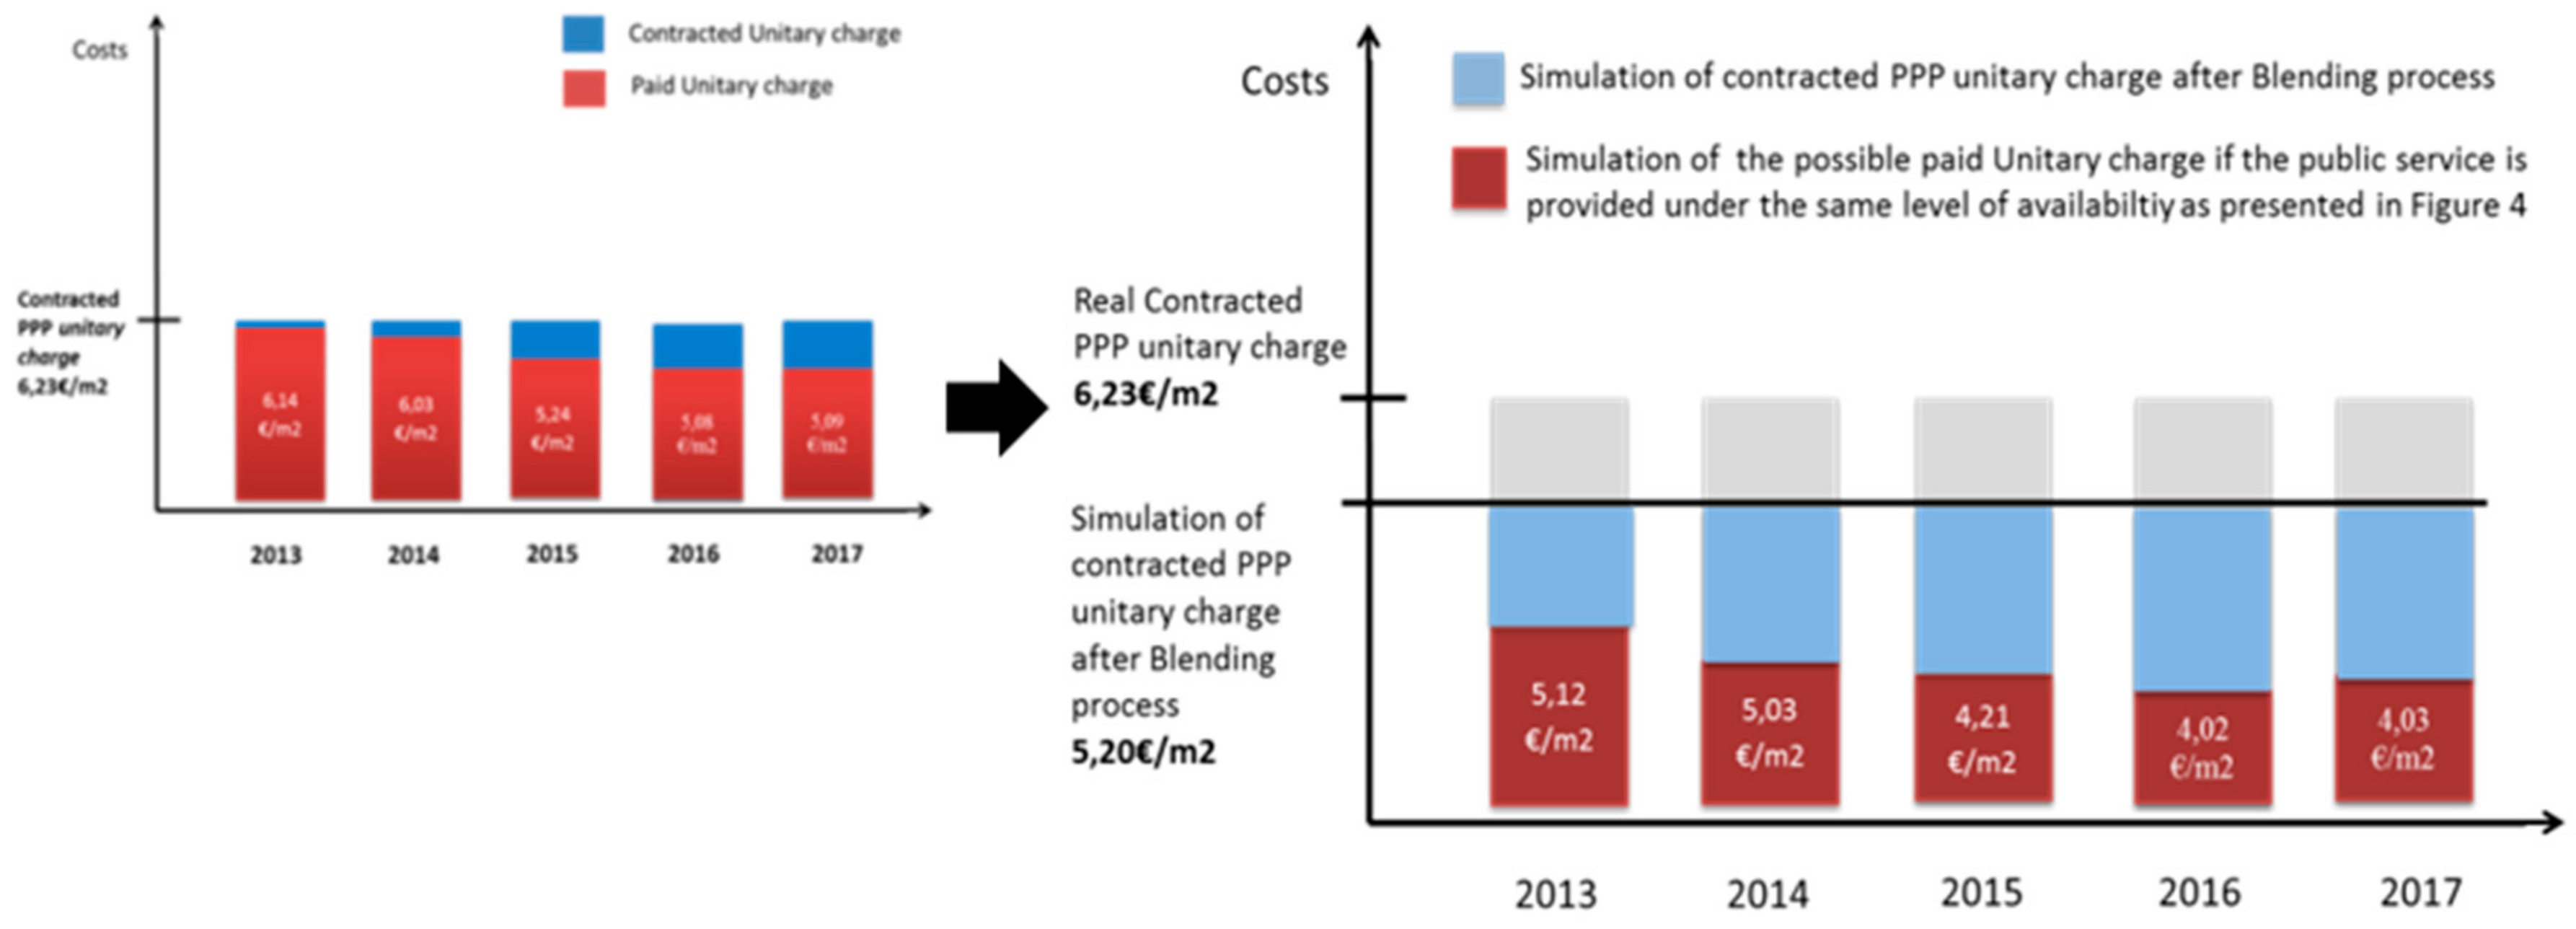
| Contracted monthly Unitary Charge | 19,992.18 € | 19,992.18 € | 19,992.18 € | 19,992.18 € | 19,992.18 € |
| Contracted monthly Unitary Charge per m2 | 6.23 € | 6.23 € | 6.23 € | 6.23 € | 6.23 € |
| Contracted yearly Unitary Charge | 239,906.16 € | 239,906.16 € | 239,906.16 € | 239,906.16 € | 239,906.16 € |
| Contracted Yearly Unitary Charge per m2 | 74.76 € | 74.76 € | 74.76 € | 74.76 € | 74.76 € |
| Payment Mechanism (Yearly Data) | |||||
| Contracted level of Availability of Asset | 100.00% | 100.00% | 100.00% | 100.00% | 100.00% |
| Payment Deduction (Risks Occurrence) | |||||
| Risks related with construction | 0.000320% | 0.000000% | 0.000320% | 2.679760% | 0.000000% |
| Risks related with operation | 1.004200% | 0.021200% | 3.807000% | 4.760900% | 4.291600% |
| Risks related with maintenance | 0.021300% | 2.003100% | 7.603020% | 10.430120% | 14.004060% |
| Risks related with compensating events | 0.008450% | 1.080560% | 2.793000% | 0.000000% | 0.000000% |
| Risks related with relief events | 0.400200% | 0.099800% | 1.685200% | 0.580052% | 0.000000% |
| TOTAL payment deduction (Yearly sum) as % of Availabiltiy level | 1.434470% | 3.204660% | 15.888540% | 18.450832% | 18.295660% |
| Payment Adjustment | |||||
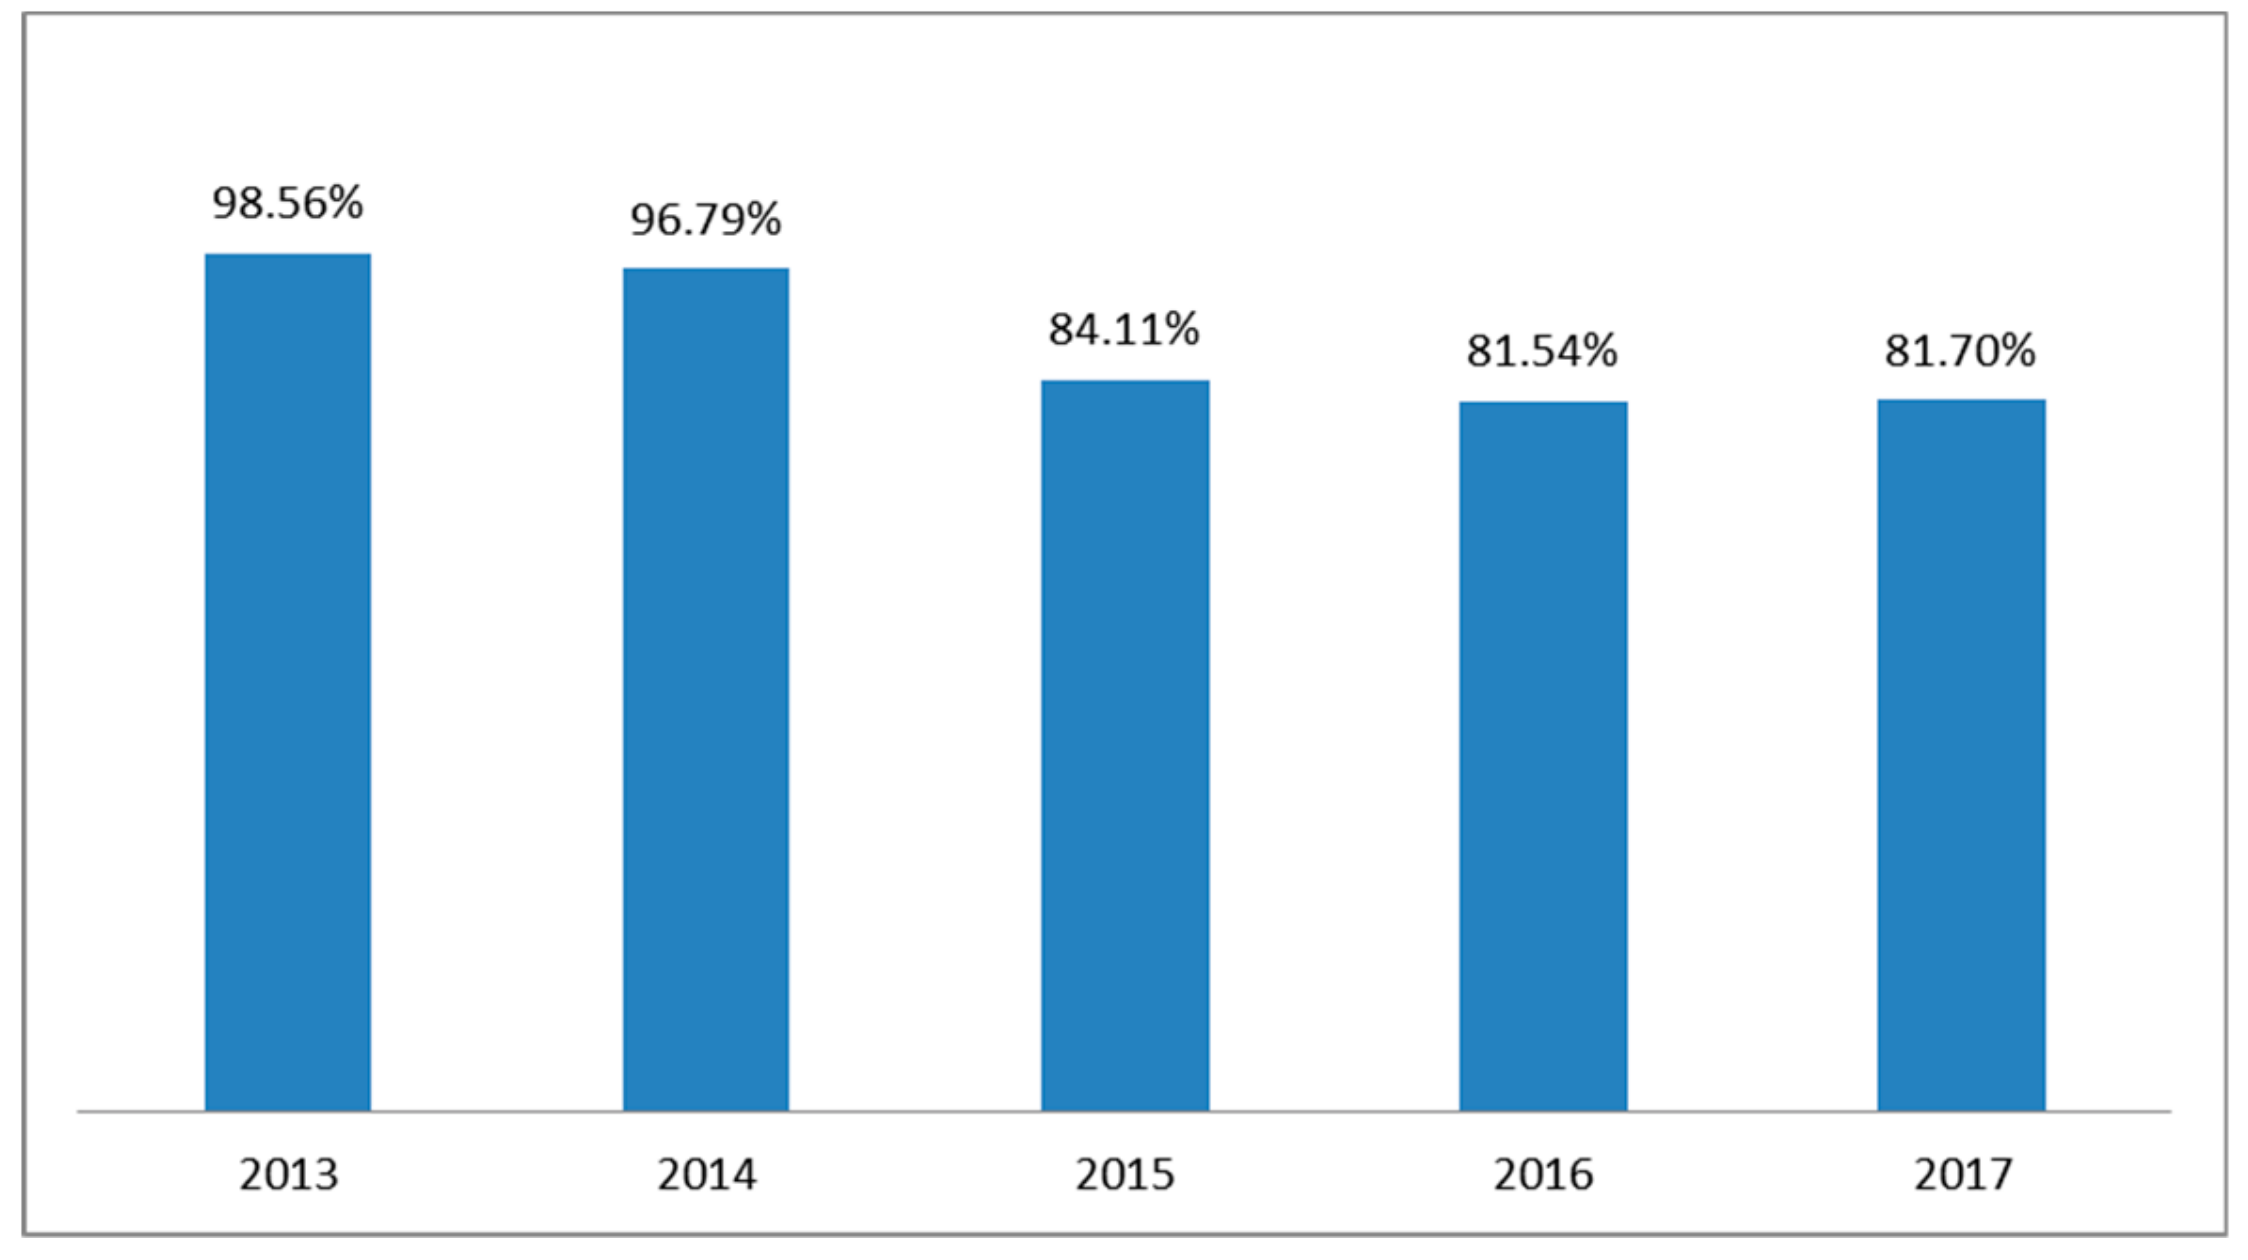
| Level of Availabiltiy of assets after Risks payment deduction (yearly data) | 98.5655% | 96.7953% | 84.1115% | 81.5492% | 81.7043% |
| Paid Values | |||||
| Paid Unitary Charge (yearly) after adjustment (level of availabilty of asset) | 236,464.78 € | 232,217.98 € | 201,788.57 € | 195,641.48 € | 196,013.74 € |
| Paid Unitary Charge yearly per m2 based on availability of asset | 73.69 € | 72.36 € | 62.88 € | 60.97 € | 61.08 € |
| Paid Unitary Charge monthly per m2 based on availability of asset | 6.14 € | 6.03 € | 5.24 € | 5.08 € | 5.09 € |
| Special Purpose Vehicle (SPV) | |||||
| Name: | Meteor Partnerstvo d.o.o. | ||||
| Headquarter | Varaždin, Croatia | ||||
References
- Patterson, M.G. What is energy efficiency? Concepts, indicators and methodological issues. Energy Policy 1996, 24, 377–390. [Google Scholar] [CrossRef]
- Yang, J.B.; Chou, H.Y. Key challenges in executing energy-savings performance contracts in public buildings: Taiwan experience. J. Chin. Inst. Eng. 2017, 40, 482–491. [Google Scholar] [CrossRef]
- European Investment Bank–EIB. Guide to Statistical Treatment of PPPs. Available online: http://www.eib.org/en/infocentre/publications/all/epec-a-guide-to-the-statistical-treatment-of-ppps (accessed on 8 September 2018).
- European Commission. Clean Energy for All Europeans–Unlocking Europe’s Growth Potential. Available online: http://europa.eu/rapid/press-release_IP-16-4009_en.htm (accessed on 12 August 2018).
- European Commission, Directive 2006/32/EC of the European Parliament and of the Council of 5 April 2006 on Energy End-Use Efficiency and Energy Services and Repealing Council Directive 93/76/EEC. Available online: https://eur-lex.europa.eu/legal-content/EN/TXT/?uri=celex%3A32006L0032 (accessed on 5 June 2017).
- Patronen, J.; Kaura, E.; Torvestad, C. Nordic Heating and Cooling: Nordic Approach to EU’s Heating and Cooling Strategy; Nordic Council of Ministers: Copenhagen, Denmark, 2017. [Google Scholar]
- Sorrell, S. The economics of energy service contracts. Energy Policy 2007, 35, 507–521. [Google Scholar] [CrossRef]
- Polzin, F.; von Flotow, P.; Nolden, C. Modes of governance for municipal energy efficiency services–The case of LED street lighting in Germany. J. Clean. Prod. 2016, 139, 133–145. [Google Scholar] [CrossRef]
- Hannon, M.J.; Foxon, T.J.; Gale, W.F. The co-evolutionary relationship between Energy Service Companies and the UK energy system: Implications for a low-carbon transition. Energy Policy 2013, 61, 1031–1045. [Google Scholar] [CrossRef]
- Marino, A.; Bertoldi, P.; Rezessy, S.; Boza-Kiss, B. A snapshot of the European energy service market in 2010 and policy recommendations to foster a further market development. Energy Policy 2011, 39, 6190–6198. [Google Scholar] [CrossRef]
- Bertoldi, P.; Boza-Kiss, B. Analysis of barriers and drivers for the development of the ESCO markets in Europe. Energy Policy 2017, 107, 345–355. [Google Scholar] [CrossRef]
- European Court of Auditors (ECA). Special Report: Public Private Partnerships in the EU: Widespread shortcomings and limited benefits. 2018. Available online: https://www.eca.europa.eu/en/Pages/DocItem. aspx?did=45153 (accessed on 11 March 2019).
- Bukarica, V.; Morvaj, Z.; Tomšić, Ž. Evaluation of energy efficiency policy instruments effectiveness–case study Croatia. Policy 2007, 582, 418. [Google Scholar]
- Pavković, B.; Zanki, V.; Čačić, G. Energy Efficiency in Building Sector in Croatia: Preliminary Energy Studies. Strojarstvo 2010, 52, 681–694. [Google Scholar]
- Bukarica, V.; Robić, S. Implementing energy efficiency policy in Croatia: Stakeholder interactions for closing the gap. Energy Policy 2013, 61, 414–422. [Google Scholar] [CrossRef]
- European court of Auditors (ECA). Special Report: The Effectiveness of Blending Regional Investment Facility Grants with Financial Institution Loans to Support EU External Policies. 2014. Available online: https://www.eca.europa.eu/Lists/ECADocuments/SR14_16/SR14_16_EN.pdf (accessed on 2 November 2018).
- Vine, E. An international survey of the energy service company (ESCO) industry. Energy Policy 2005, 33, 691–704. [Google Scholar] [CrossRef]
- Nolden, C.; Sorrell, S.; Polzin, F. Innovative Procurement Frameworks for Energy Performance Contracting in the UK Public Sector. Spru Work. Pap. Ser. (Swps) 2015. [Google Scholar] [CrossRef]
- Bratt, C.; Hallstedt, S.; Robèrt, K.H.; Broman, G.; Oldmark, J. Assessment of criteria development for public procurement from a strategic sustainability perspective. J. Clean. Prod. 2013, 52, 309–316. [Google Scholar] [CrossRef]
- Bertoldi, P.; Rezessy, S.; Vine, E. Energy service companies in European countries: Current status and a strategy to foster their development. Energy Policy 2006, 34, 1818–1832. [Google Scholar] [CrossRef]
- Antonini, E.; Longo, D.; Gianfrate, V.; Copiello, S. Challenges for public-private partnerships in improving energy efficiency of building sector. Int. J. Hous. Sci. Its Appl. 2016, 40, 99–109. [Google Scholar]
- Grimsey, D.; Lewis, M.K. Evaluating the risks of public private partnerships for infrastructure projects. Int. J. Proj. Manag. 2002, 20, 107–118. [Google Scholar] [CrossRef]
- Famira, G.; Musec, M. EPC: A Way to Contract for Green Energy 2015. Available online: http://ceelm.com/index.php/legal-analysis-energy/62-energy/2418-energy-efficiency-performance-contrcting-in-croatia-a-way-to-contract-for-green-energy (accessed on 4 April 2018).
- Ürge-Vorsatz, D.; Köppel, S.; Liang, C.; Kiss, B.; Nair, G.G.; Celikyilmaz, G. “An Assessment of on Energy Service Companies (ESCOs) Worldwide.” Budapest: Central European University, 2007. Available online: https://www.worldenergy.org/documents/esco_synthesis.pdf (accessed on 18 August 2017).
- Killian, E. ESCO: Energy Efficient Investment with No Money Down, Internet Article. Available online: https://buildingenergy.cx-associates.com/2012/05/esco-energy-efficiency-investment-with-no-money-down/ (accessed on 7 September 2017).
- Yescombe, E.R. Public-Private Partnerships: Principles of Policy and Finance; Elsevier: Amsterdam, The Netherlands, 2011; p. 31. [Google Scholar]
- European Commission Papers (2009) Communication from the Commission to the European Parliament, the Council, the European Economic and Social Committee and the Committee of the Regions-Mobilising Private and Public Investment for Recovery and Long Term Structural Change: Developing Public Private Partnership. Available online: http://eur-lex.europa.eu/legal-content/en/TXT/?uri=CELEX%3A52009DC06 (accessed on 8 September 2018).
- EUROSTAT. Manual on Government Deficit and Debt-Implementation of ESA 2010-2016. Available online: https://ec.europa.eu/eurostat/web/products-manuals-and-guidelines/-/KS-GQ-16-001 (accessed on 8 August 2018).
- Benito, B.; Montesinos, V.; Bastida, F. An example of creative accounting in public sector: The private financing of infrastructures in Spain. Crit. Perspect. Account. 2008, 19, 963–986. [Google Scholar] [CrossRef]
- Hurst, C.; Reeves, E. An economic analysis of Ireland’s first public private partnership. Int. J. Public Sect. Manag. 2004, 17, 379–388. [Google Scholar] [CrossRef]
- Bing, L.; Akintoye, A.; Edwards, P.J.; Hardcastle, C. The allocation of risk in PPP/PFI construction projects in the UK. Int. J. Proj. Manag. 2005, 23, 25–35. [Google Scholar] [CrossRef]
- European PPP Expertise Centre, Value for Money Assessment—Review of Approaches and Key Concepts. Available online: www.eib.org/en/infocentre/publications/all/epec-value-for-money-assessment.htm (accessed on 10 January 2018).
- Definition “Unique unitary charge”, present form of Net-Present-Value (NPV) of all project costs during the whole-life-cycle period (30-years). Include cost of design, finance, construction, operation and maintenance of the project. Usually when Value-for-Money is developing the calculations of unique unitary charge are made for Traditional delivery option and at least one alternative delivery option (for e.g., PPP).
- Ministarstvo Graditeljstva, Program Energetske Obnove Višestambenih Zgrada za 2014–2020. Available online: http://www.mgipu.hr/doc/Propisi/Program_EO_VS_ZGRADE.pdf (accessed on 5 May 2018).
- Agency for Investments and Competitiveness, Register of PPP Projects in Republic of Croatia. The Project Is Recorded by Official Register no. 0004/2011. Available online: http://www.aik-invest.hr/jpp/registar (accessed on 12 March 2018).
- Agency for Investments and Competitiveness (AIK). Available online: www.aik-invest.hr (accessed on 12 March 2018).
- Value-for-Money (VfM) analysis, is obligatory by the Croatian PPP law (Article 9., OG 78/12, 152/14) and in this project present the costs of design, finance, build, operate and maintenance of infrastructure within different procurement models (Traditional procurement and PPP procurement after tendering procedure). The values are presented in a form of unique monthly unitary charge in Euro (€) per square meter. The values include VAT.
- Unique unitary charge, include cost of design, finance, construction, operation and maintenance of the asset in whole life-cycle-period (30 years). The costs are in a form of €/m2 per months. The data are available form Register of PPP projects in Croatia. Available online: http://www.aik-invest.hr/jpp/registar/ (accessed on 8 March 2018).
- The Value Present a Real Data for Case Study Project, Available from Croatian Regulatory Body for PPP (AIK). Available online: http://www.aik-invest.hr/jpp/registar/ (accessed on 8 March 2018).
- The Value Present a Real Data Offered by Private Sector. The Value Is Signed in PPP Contract between Public and Private Sector, Available in Croatian PPP Register (reg. no. 0004/2011). Available from Croatian Regulatory Body for PPP (AIK). Available online: http://www.aik-invest.hr/jpp/registar/ (accessed on 8 March 2018).
- European Investment Bank-European PPP Expertise Centre. Blending EU Structural and Investment Funds and PPPs in the 2014–2020 Programming Period Guidance Note on January 2016. Available online: http://www.eib.org/attachments/epec/epec_blending_ue_structural_investment_funds_ppps_en.pdf (accessed on 2 February 2018).
- Garrido, L.; Gomez, J.; de los Ángeles Baeza, M.; Vassallo, J.M. Is EU financial support enhancing the economic performance of PPP projects? An empirical analysis on the case of spanish road infrastructure. Transp. Policy 2017, 56, 19–28. [Google Scholar] [CrossRef]
- Pereira, J. Blended Finance: What It Is, How It Works and How It Is Used. Available online: https://oxfamilibrary.openrepository.com/handle/10546/620186 (accessed on 3 April 2018).
- Becker, S.O.; Egger, P.H.; Von Ehrlich, M. Going NUTS. The effect of EU Structural Funds on regional performance. J. Public Econ. 2010, 94, 578–590. [Google Scholar] [CrossRef]
- European Commission, Study to Determine Flat Rate Revenue Percentages for the Sectors or Subsectors Within the Fields of (i) ICT, (ii) Research, Development and Innovation and (iii) Energy Efficiency to Apply to Net Revenue Generating Operations Co-Financed by the European Structural and Investment Funds (ESI Funds) in 2014–2020. Available online: https://ec.europa.eu/regional_policy/sources/docgener/studies/pdf/flat_rate/flat_rate_exec_en.pdf (accessed on 28 March 2019).
- AIK Manual: Combining EU Funds and Public-Private Partnership Projects. Available online: http://www.aik-invest.hr/wp-content/uploads/2017/05/prirucnik_hr_full.pdf (accessed on 4 July 2018).
- Aglietta, M.; Espagne, E.; Perrissin-Fabert, B. A Proposal to Carbon Investment in EU. Available online: http://faere.fr/pub/Conf2015/Perrissin_FAERE2015_proposal-finance-low-carbon-transition-eu.pdf (accessed on 5 March 2018).
- European Commission 2017, Private finance for Energy Efficiency (EU program PF4EE). Available online: https://ec.europa.eu/clima/policies/budget/life/instruments_en (accessed on 2 March 2018).
- The Value Present EU Financing Instruments Conditions for Blending Options under the Operational program Competitiveness and Cohesion 2014–2020, Currently Available for Private Sector Projects in EE Sector, Offered by Croatian Development Bank (HBOR). Available online: https://www.hbor.hr/en/kreditni_program/financing-of-eu-private-sector-projects/ (accessed on 28 March 2019).
- ESIF. EU Policy Document. Financial Instruments under the ESIF. 2020. Available online: http://eesi2020.eu/wp-content/uploads/2016/05/Questionnaire_Croatia.pdf (accessed on 10 March 2018).
- Juričić, D.; Kušljić, D. Ekonomika kombiniranja subvencija s javno-privatnim partnerstvom. Ekon. Pregl. 2014, 65, 56–88. [Google Scholar]
- Ferrer, J.N.; Behrens, A. Innovative Approaches to EU Blending Mechanisms for Development Finance; Special Report; CEPS: Brussels, Belgium, 2011. [Google Scholar]
- Croatian Government legislation for implementation EE projects: Energy Efficiency act (OG 127/14), Construction Act (OG 153/13, 20/17), Regulation on Energy Service (OG 11/15), Ordinance on Energy Construction Audit and Certification (OG 88/17), PPP Act (OG 78/12, 152/14), Regulation on Implementation of PPP Projects (OG 15/15), Ordinance on Small Value PPP Projects (OG 23/15).


© 2019 by the authors. Licensee MDPI, Basel, Switzerland. This article is an open access article distributed under the terms and conditions of the Creative Commons Attribution (CC BY) license (http://creativecommons.org/licenses/by/4.0/).
Share and Cite
Rogić Lugarić, T.; Dodig, D.; Bogovac, J. Effectiveness of Blending Alternative Procurement Models and EU Funding Mechanisms Based on Energy Efficiency Case Study Simulation. Energies 2019, 12, 1612. https://doi.org/10.3390/en12091612
Rogić Lugarić T, Dodig D, Bogovac J. Effectiveness of Blending Alternative Procurement Models and EU Funding Mechanisms Based on Energy Efficiency Case Study Simulation. Energies. 2019; 12(9):1612. https://doi.org/10.3390/en12091612
Chicago/Turabian StyleRogić Lugarić, Tereza, Domagoj Dodig, and Jasna Bogovac. 2019. "Effectiveness of Blending Alternative Procurement Models and EU Funding Mechanisms Based on Energy Efficiency Case Study Simulation" Energies 12, no. 9: 1612. https://doi.org/10.3390/en12091612
APA StyleRogić Lugarić, T., Dodig, D., & Bogovac, J. (2019). Effectiveness of Blending Alternative Procurement Models and EU Funding Mechanisms Based on Energy Efficiency Case Study Simulation. Energies, 12(9), 1612. https://doi.org/10.3390/en12091612