Life Cycle Assessment of a Biogas-Fed Solid Oxide Fuel Cell (SOFC) Integrated in a Wastewater Treatment Plant

 ,
, 
 ,
, 
Abstract
1. Introduction
- For what concerns the SOFC manufacturing phase, a 2015 report from Ernest Orlando Lawrence Berkeley National Laboratory is used [40]. Thanks to the cooperation with the worldwide largest SOFC manufacturers, the report analyzed SOFC applications for use in CHP and power-sector only from 1 to 250 kW-electric. The resulting total cost of ownership includes the direct manufacturing cost, operational costs, and life-cycle impact assessment of possible ancillary financial benefits during operation and at end-of-life. The report provides data on an industrial production of SOFC systems, which is difficult to find in literature and is available thanks to the laboratory cooperation with FC producers.
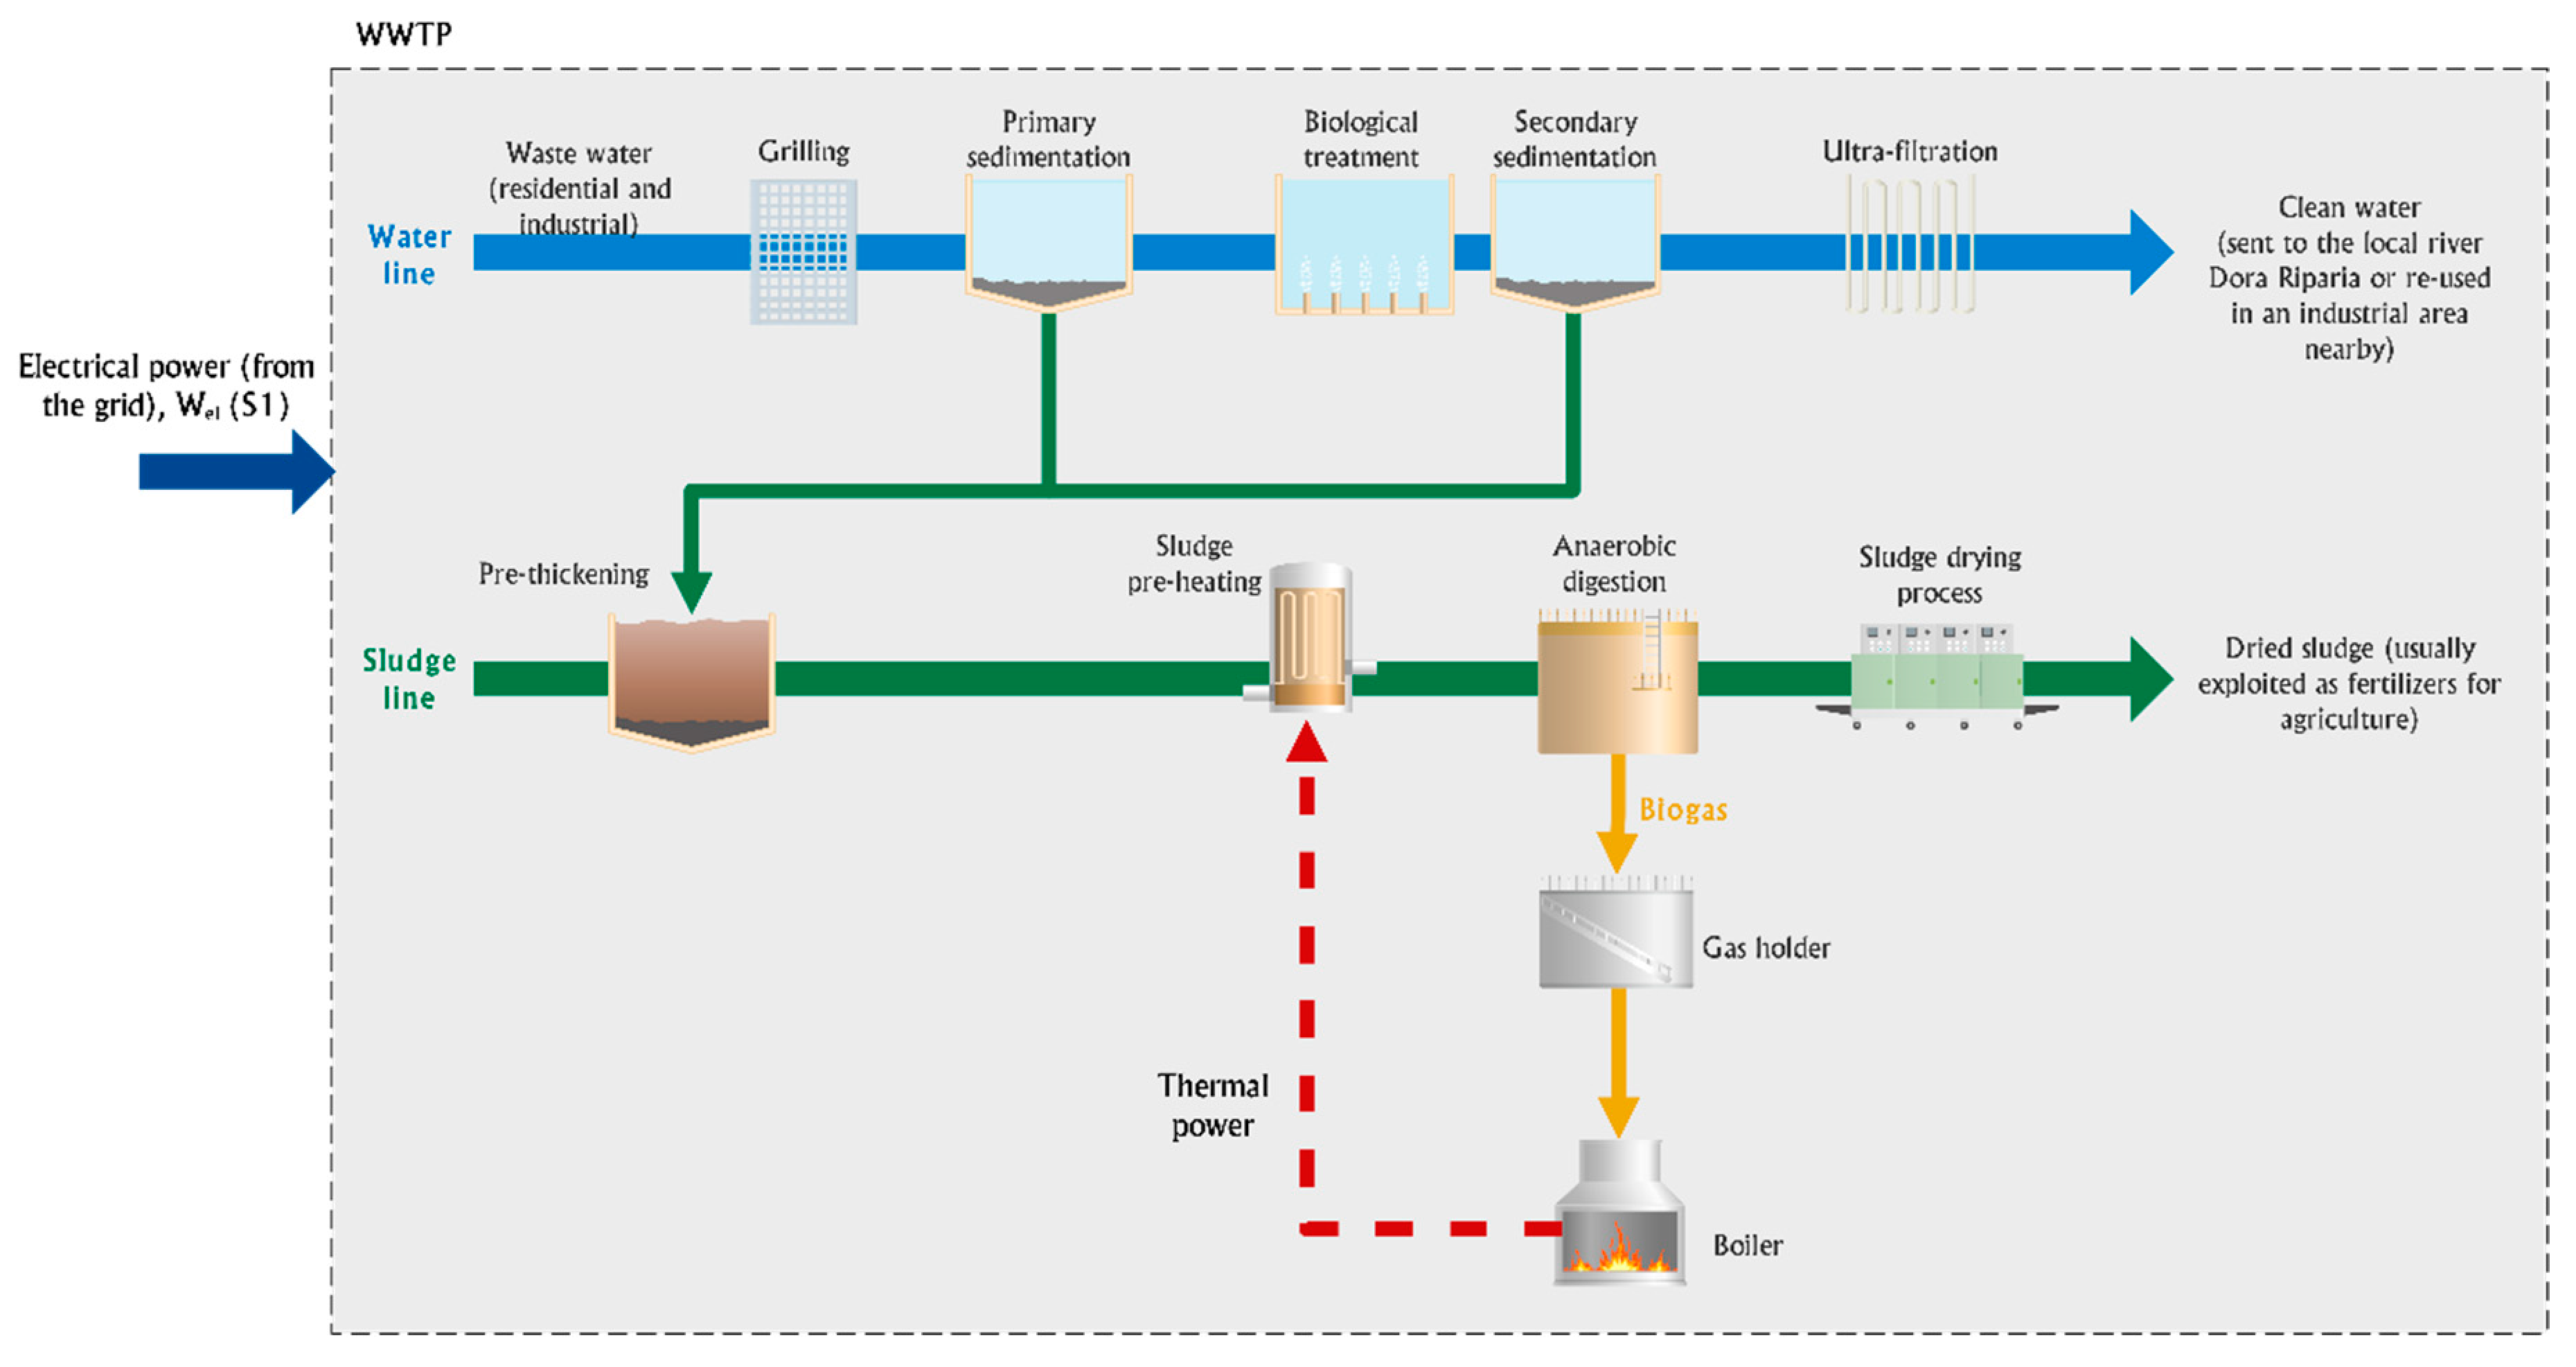
- For what concerns the operation phase and the SOFC management in a real industrial environmental, data have been retrieved from the DEMOSOFC (Demonstration of large SOFC system fed with biogas from WWTP) plant the first industrial-scale installation of a biogas-fed SOFC plant in Europe. The three SOFC modules, supplied by Convion [41], produce about 174 kWel and around 90 kW-thermal. All the generated energy is self-consumed within the Waste Water Treatment Plant (WWTP) of Collegno (Torino, IT), where biogas is produced from sewage sludge. Two SOFC modules are currently running since October 2017. The use of real data represents a unique and significant added value for the LCA study.
2. Plant Layout and Scenarios Definition
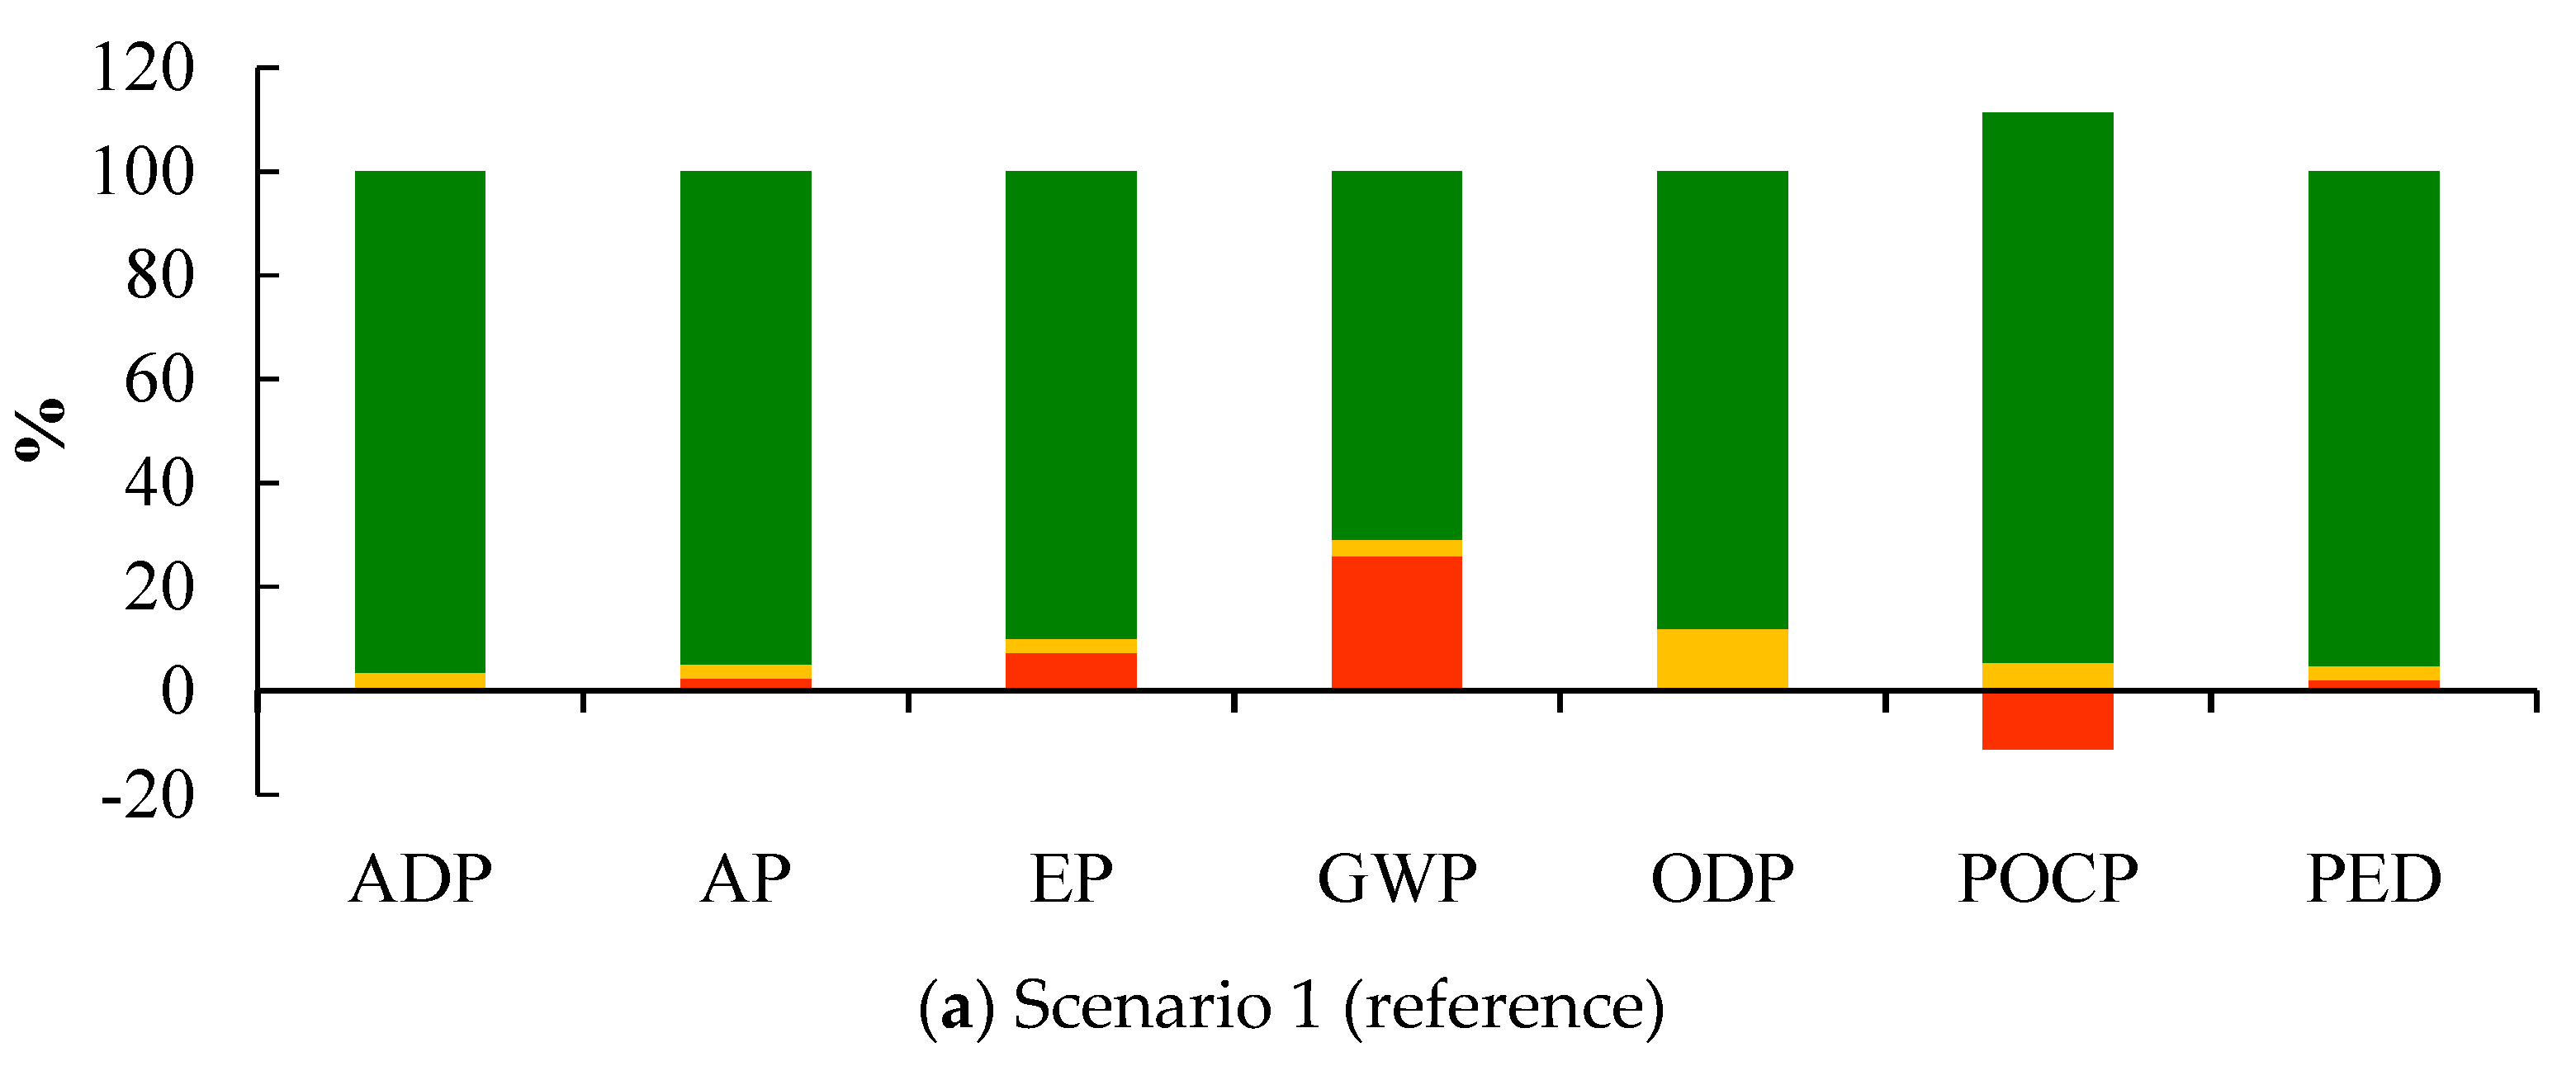
- Scenario 1: the reference scenario in which all the electricity needed for operations is purchased from the grid and biogas is exploited in a boiler for thermal recovery or flared. No CHP system installed, and this represents the ante-DEMOSOFC scenario.
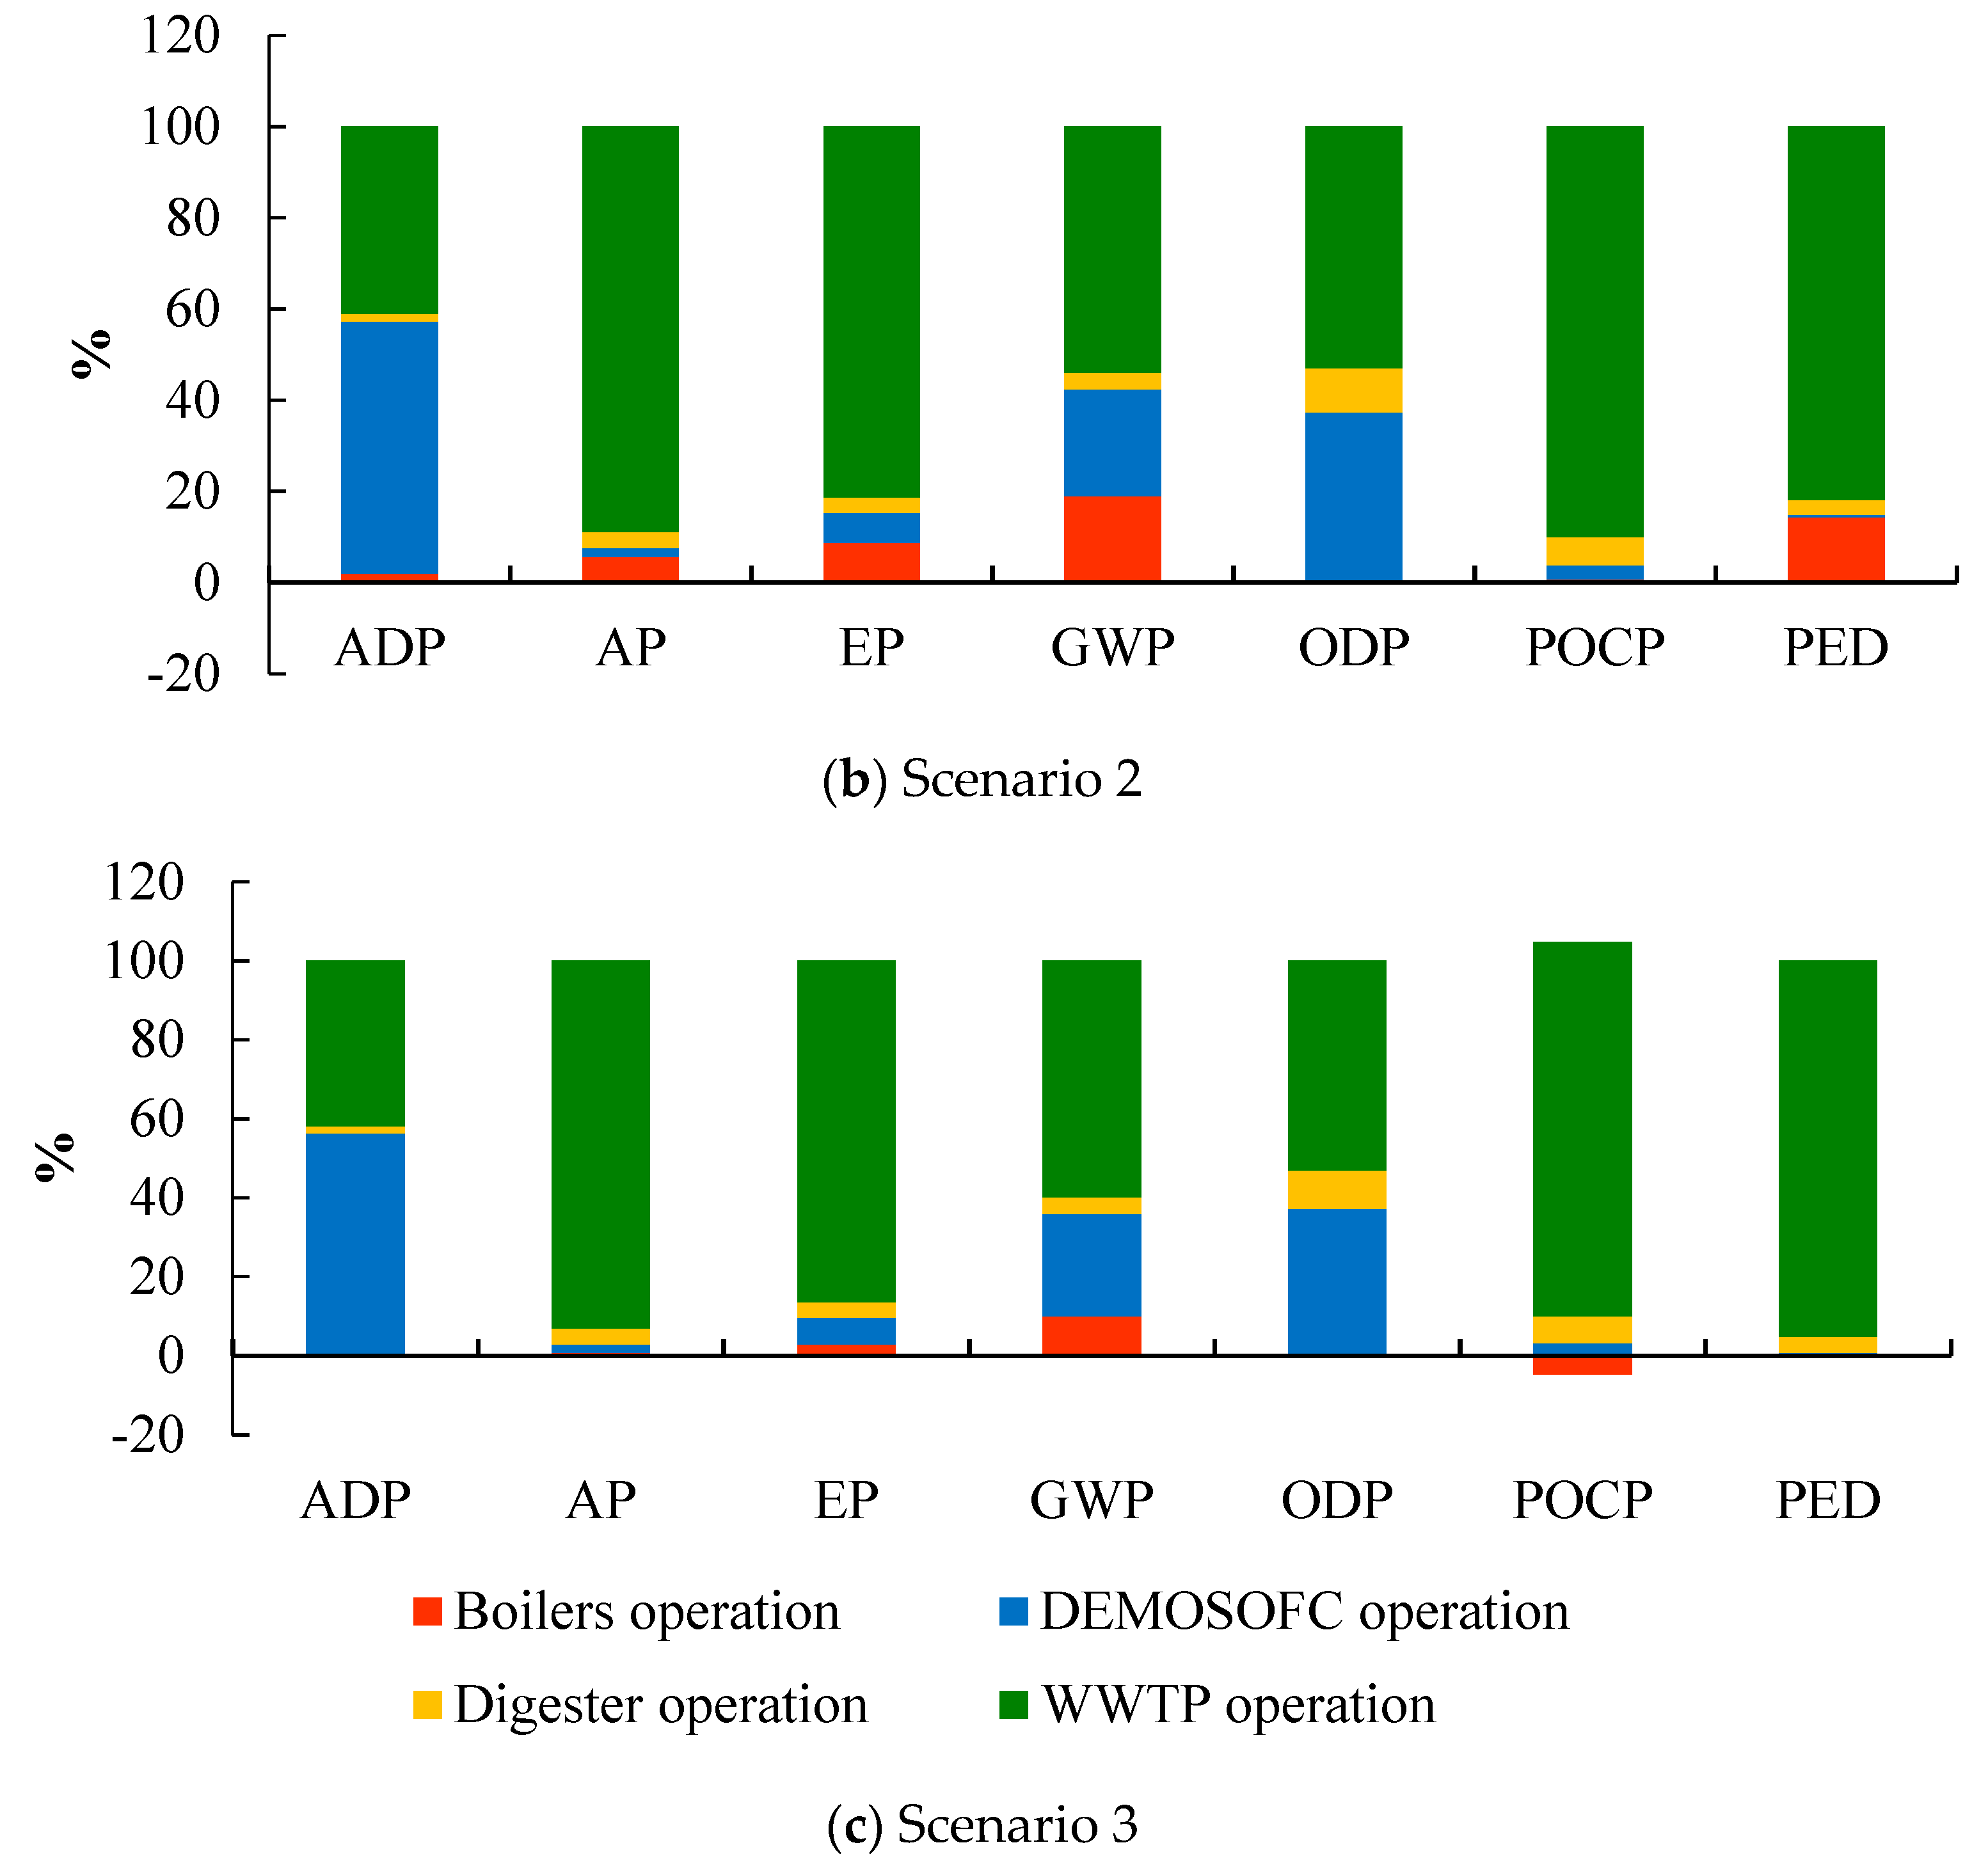
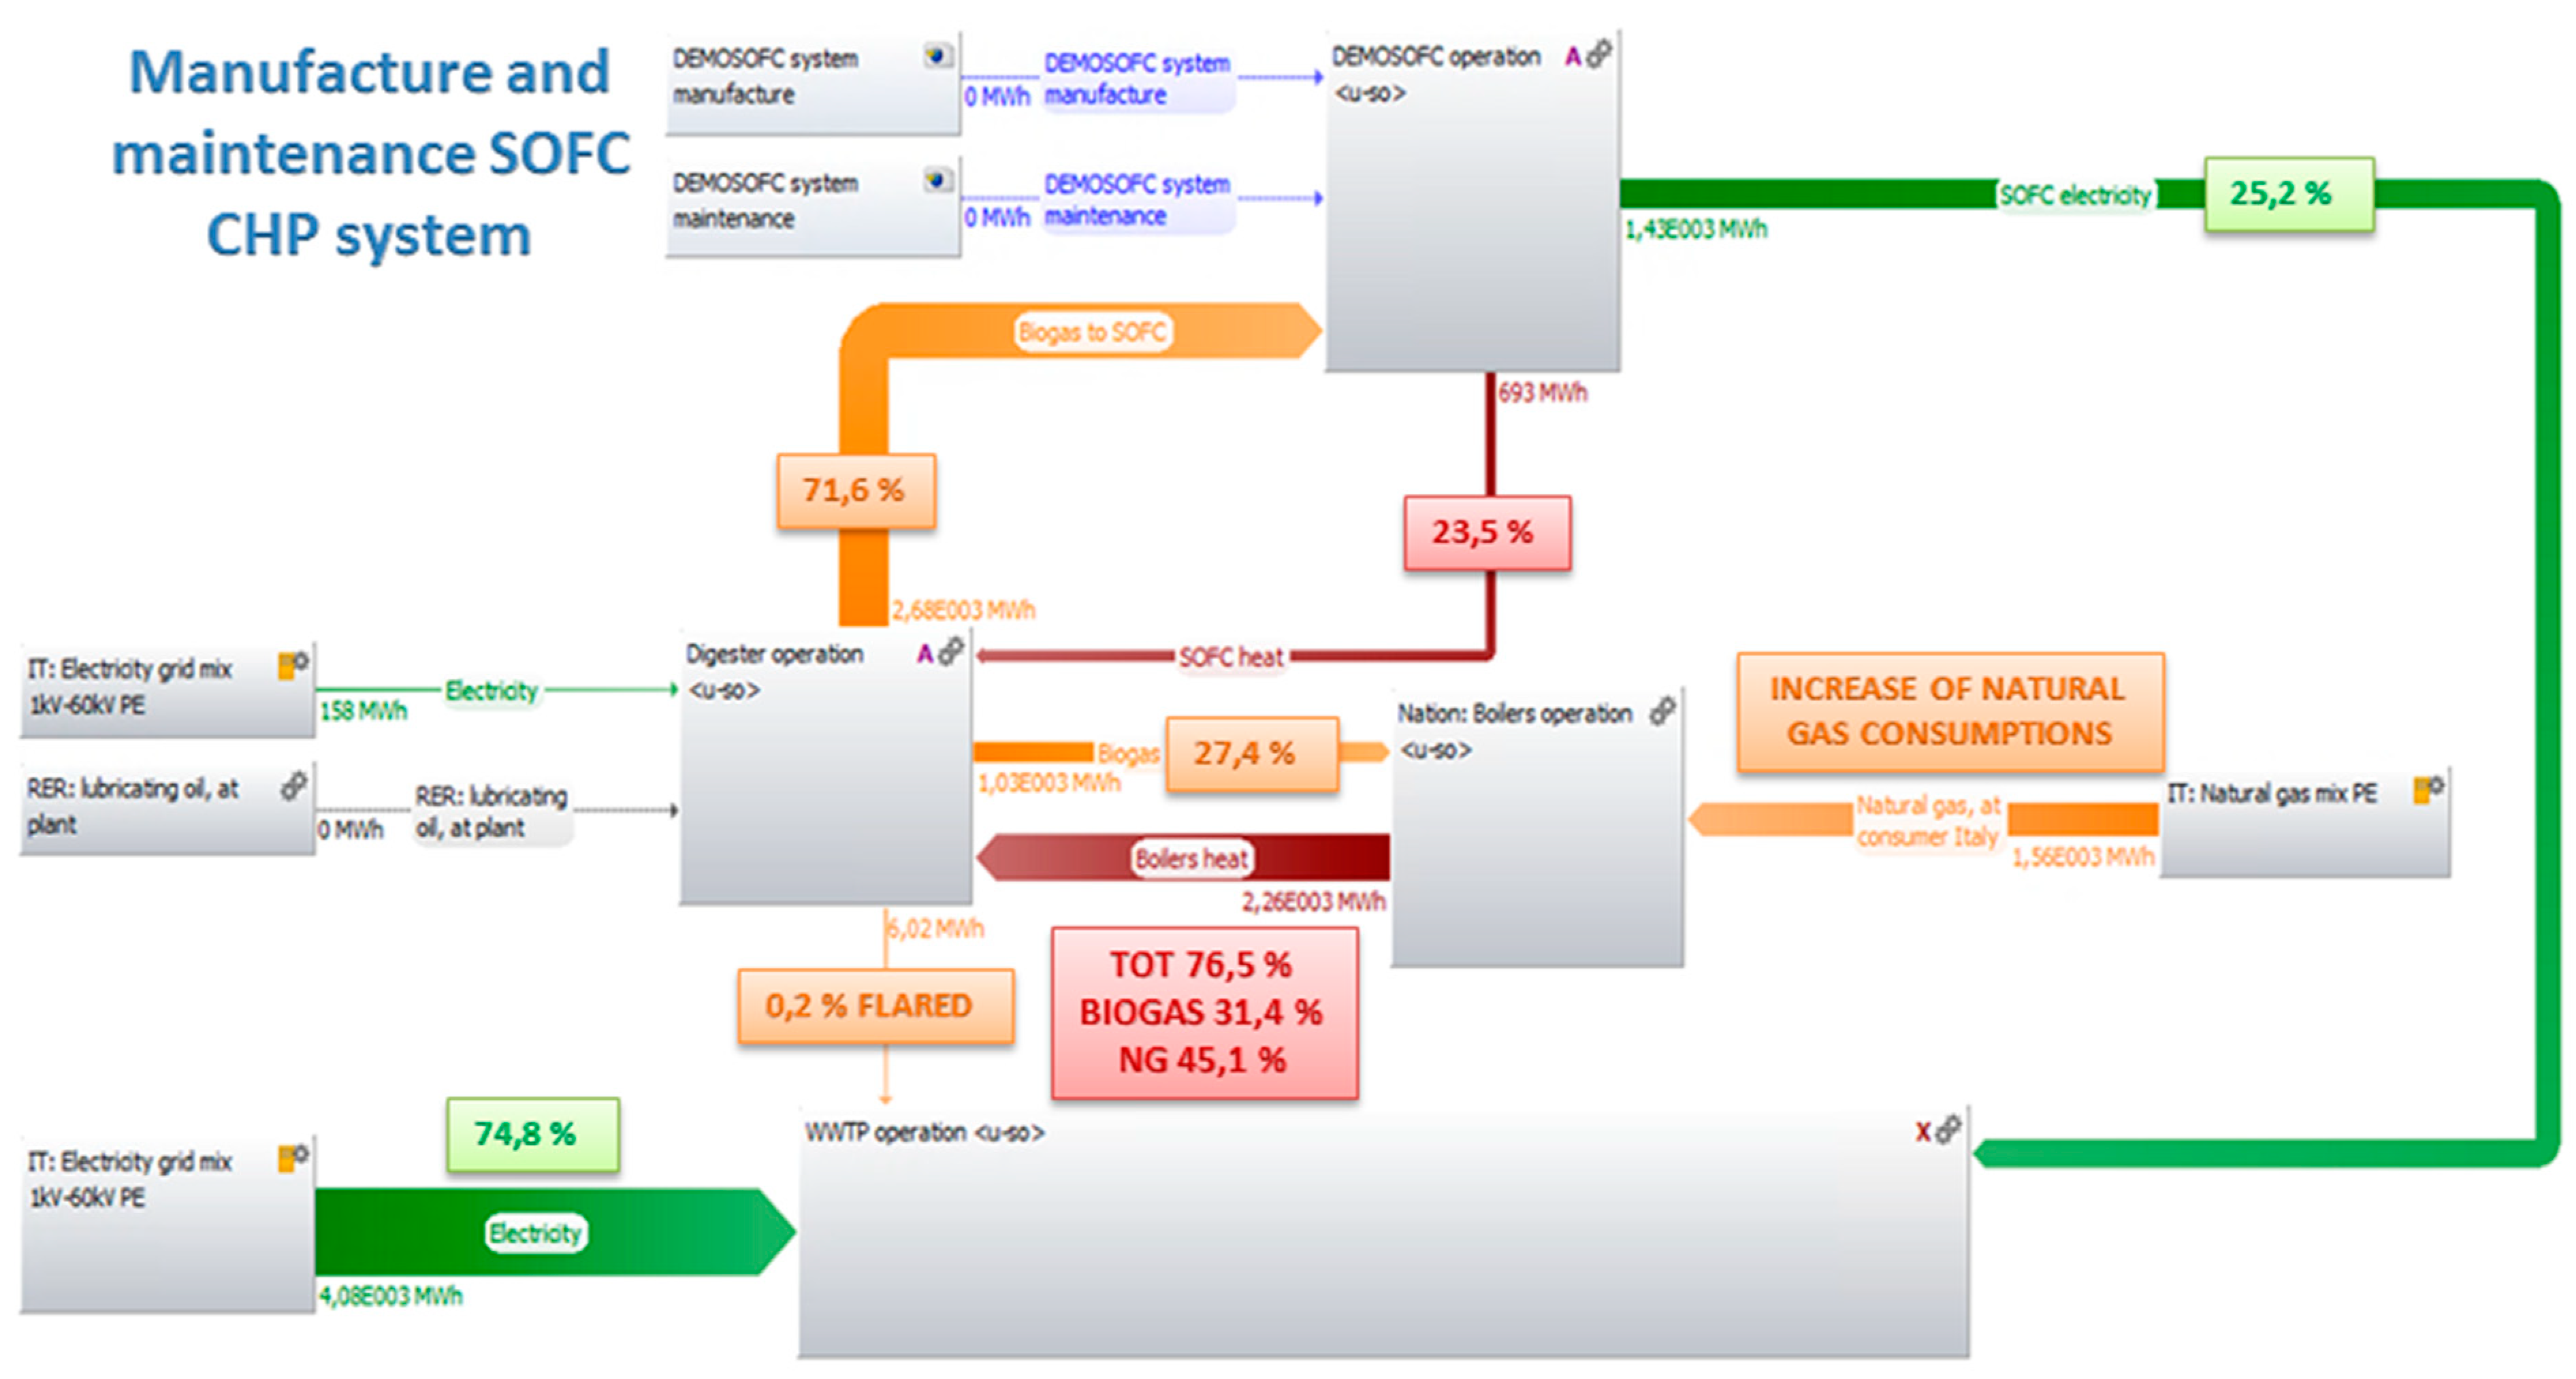
- Scenario 2: it foresees the installation of the SOFCs CHP system and biogas management improvements (since biogas is primarily sent to the CHP system and surplus gas, when available, is still used for thermal production in the existing boilers).
- The biogas processing unit, where biogas is dehumidified, cleaned from harmful contaminants and compressed;
- SOFCs cogeneration modules (total power 174 kWel), where electrical energy is produced and used for internal plant needs;
- Heat recovery section, where thermal power contained in exhaust gas exiting from SOFCs is recovered and transferred to the sludge entering the digester;
- SOFC electrical efficiency: 53.1% [41]
- SOFC thermal efficiency: 25.8% [41]
- Yearly equivalent capacity factor: 95% (assumption)
- Ordinary maintenance per year: 7.5 days (assumption)
- Digester thermal load (daily-based) definition as described in [52]
- Electrical load (monthly-based) from SMAT data. Average yearly consumption equal to 20.88 kWh/PE/y, in line with the work developed by Panepinto et al. on a similar SMAT-owned WWTP [45]
- Boiler efficiency: 90%
- Biogas average macro-composition: 60% CH4–40% CO2
3. Methodology
3.1. General Principles
3.2. System Boundaries
3.3. Functional Unit
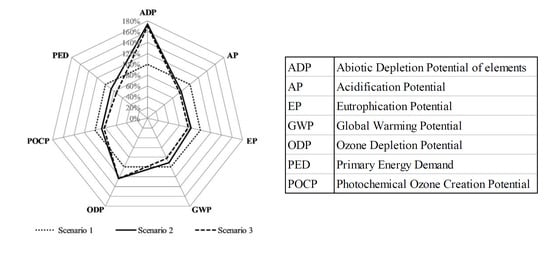
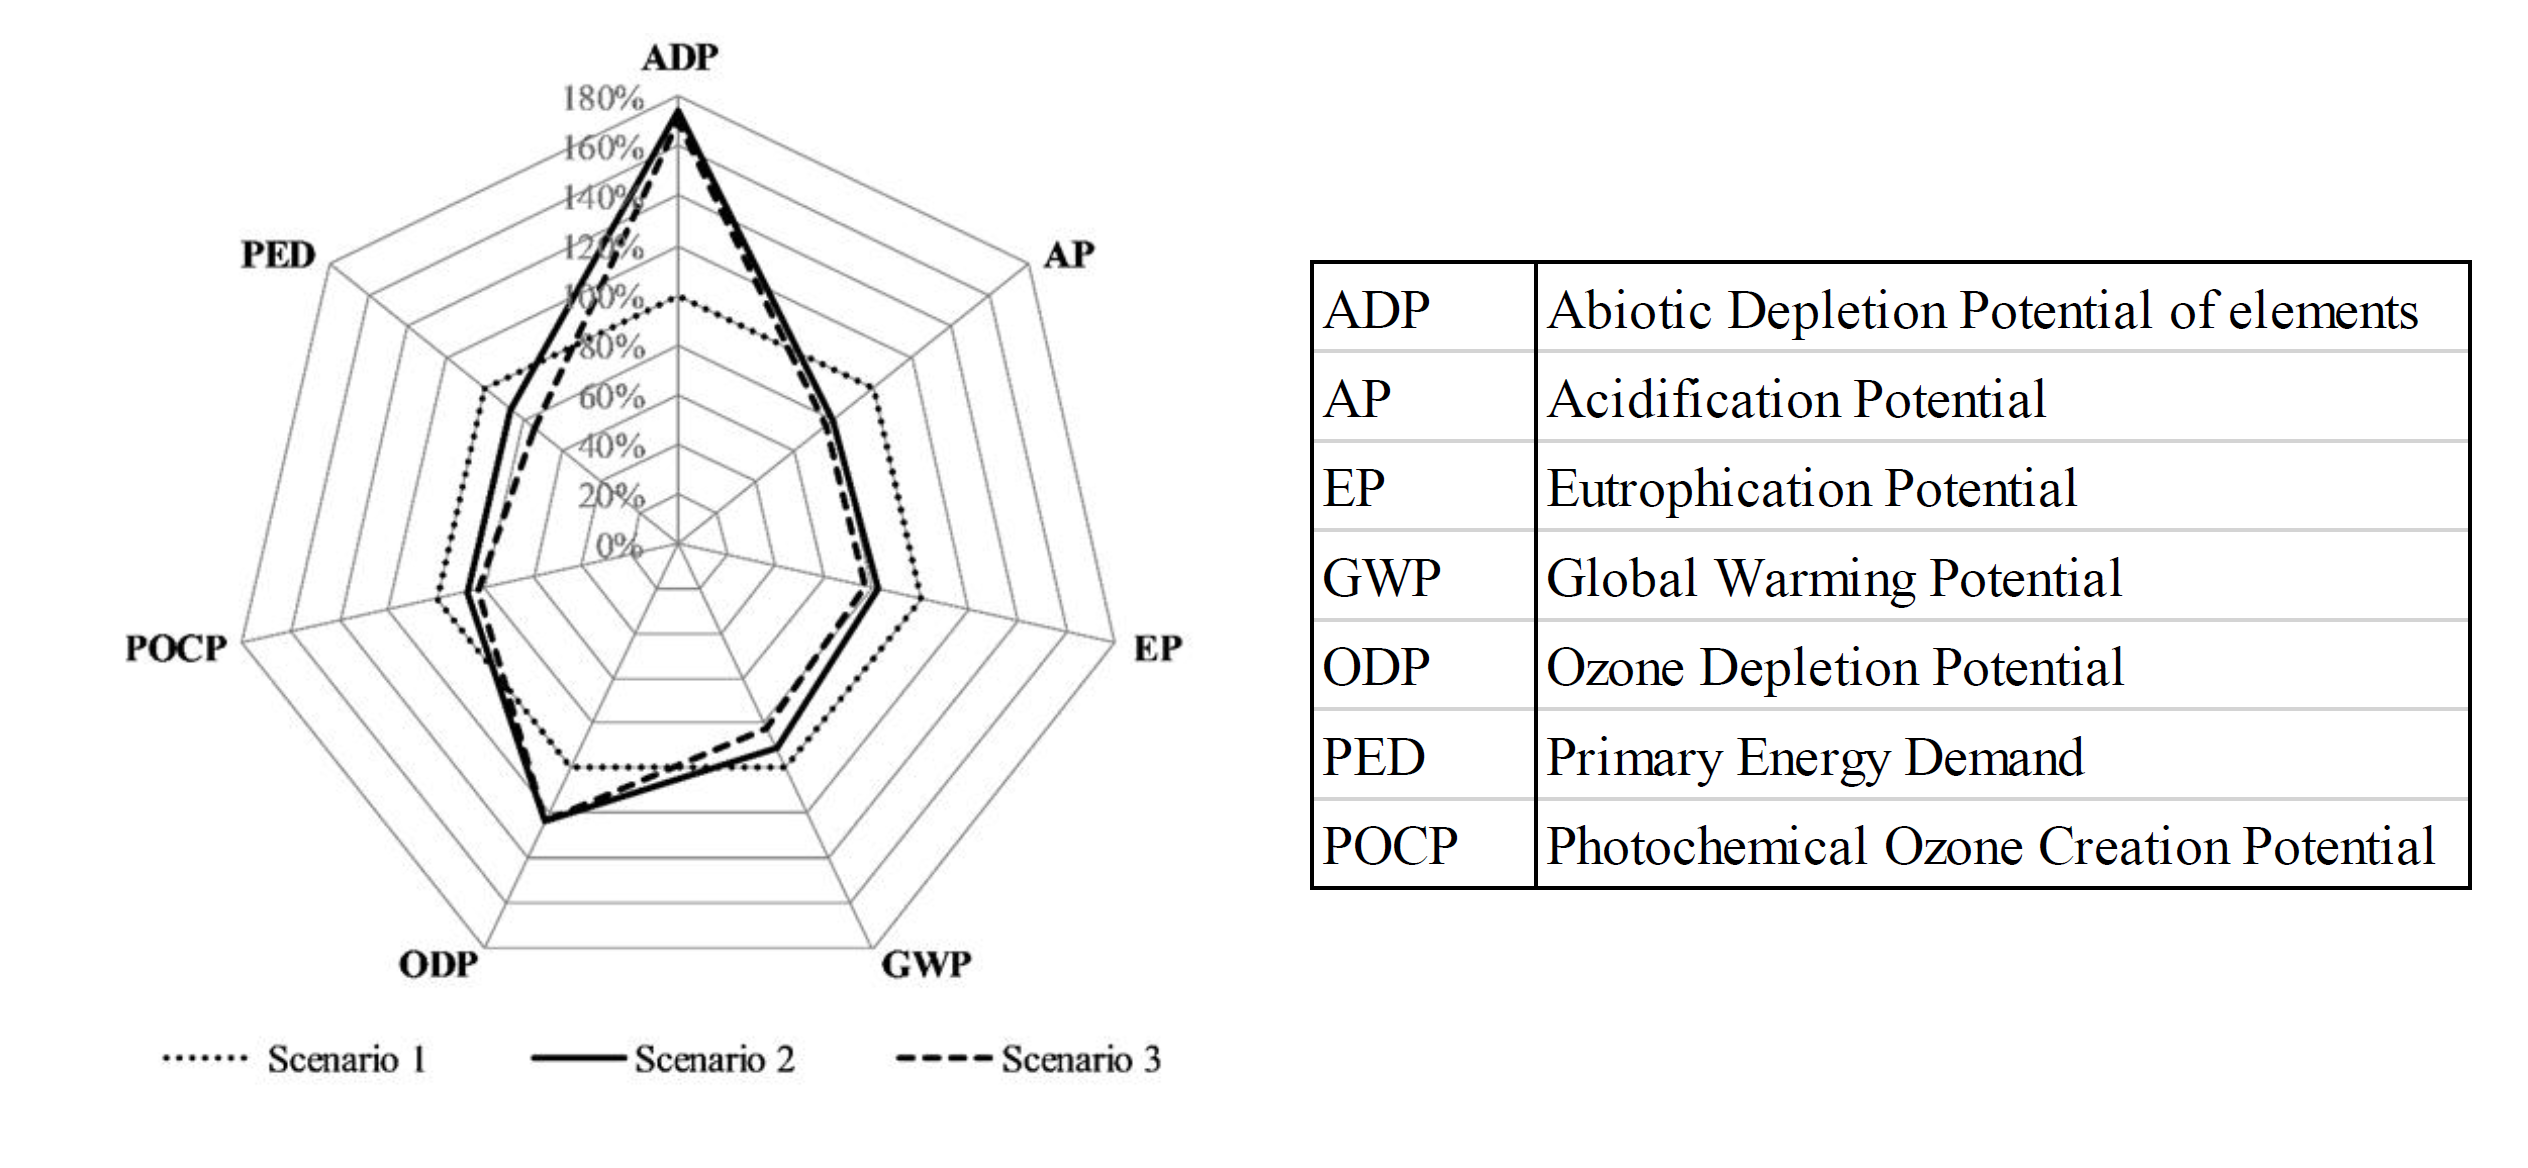
3.4. Impact Assessment Method and Related Indicators
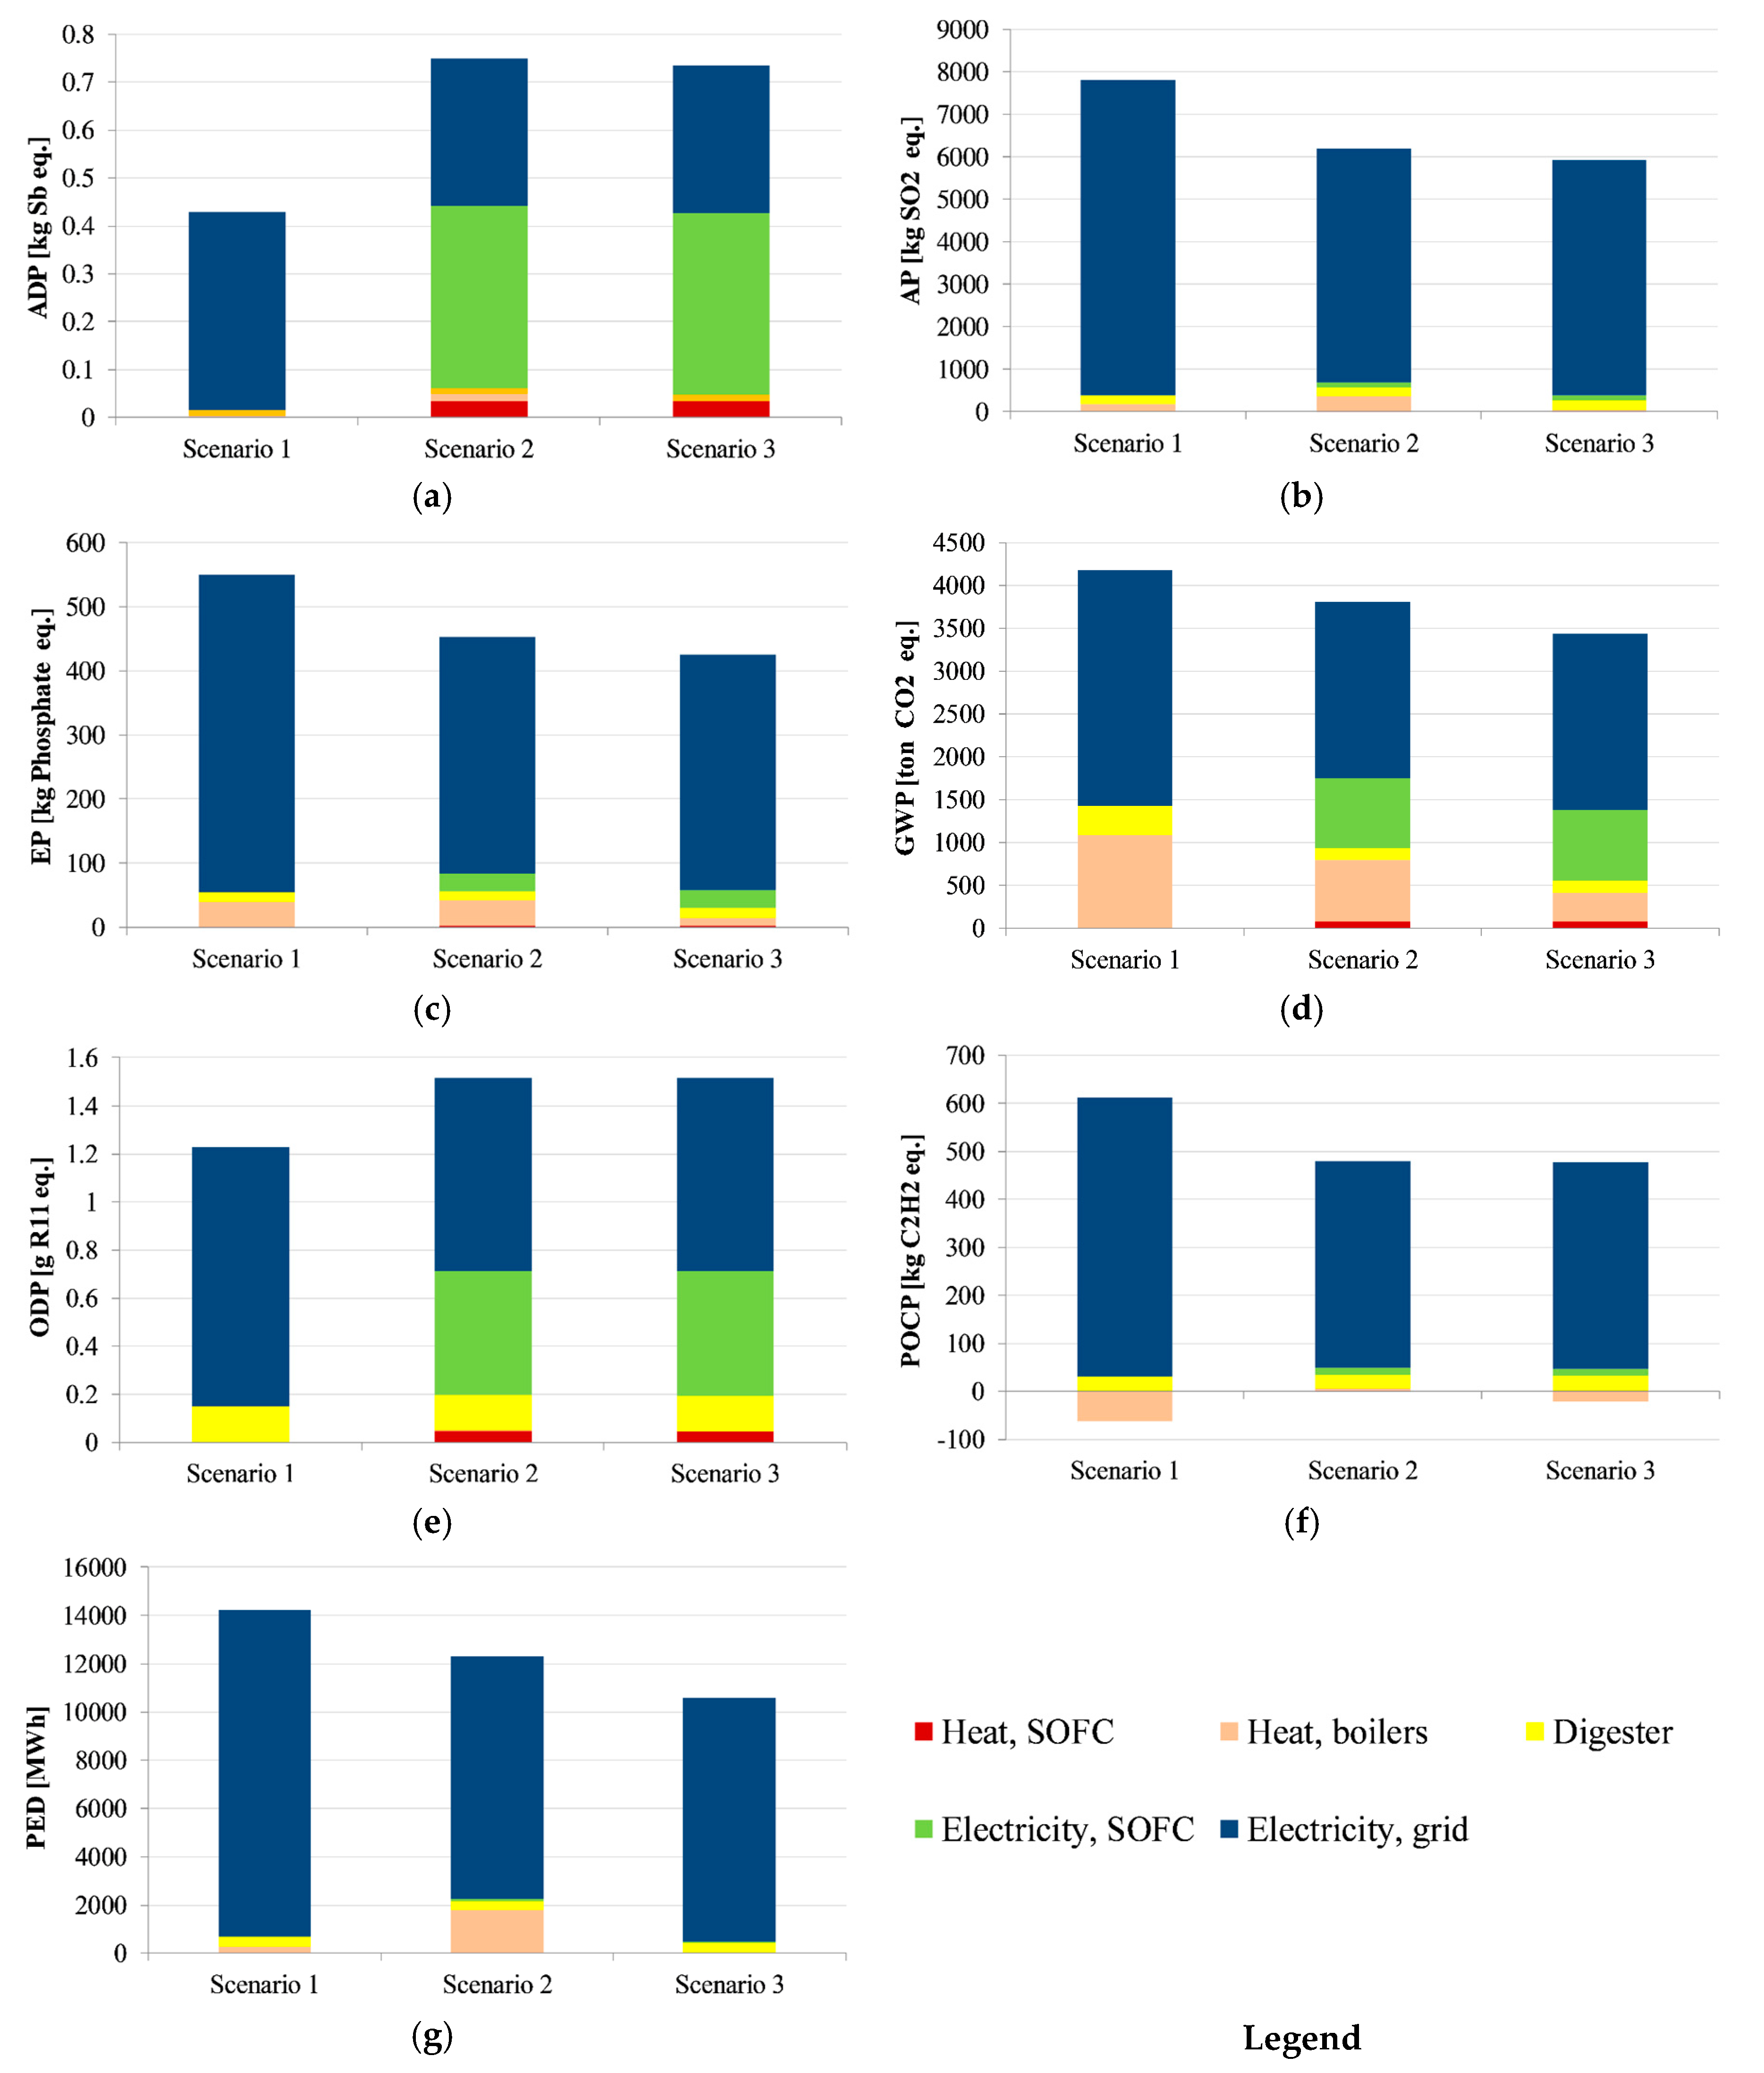
- Global Warming Potential (GWP) in kg CO2-eq
- Acidification Potential (AP) in kg SO2-eq
- Abiotic Depletion Potential of elements (ADP) in kg Sb-eq
- Eutrophication Potential (EP) in kg PO4-eq
- Ozone Depletion Potential (ODP) in kg CFC11-eq,
- Photochemical Ozone Creation Potential (POCP) in kg C2H2-eq
- Primary Energy Demand from renewable and non-renewable resources (PED) in MWh-eq.
4. Inventory
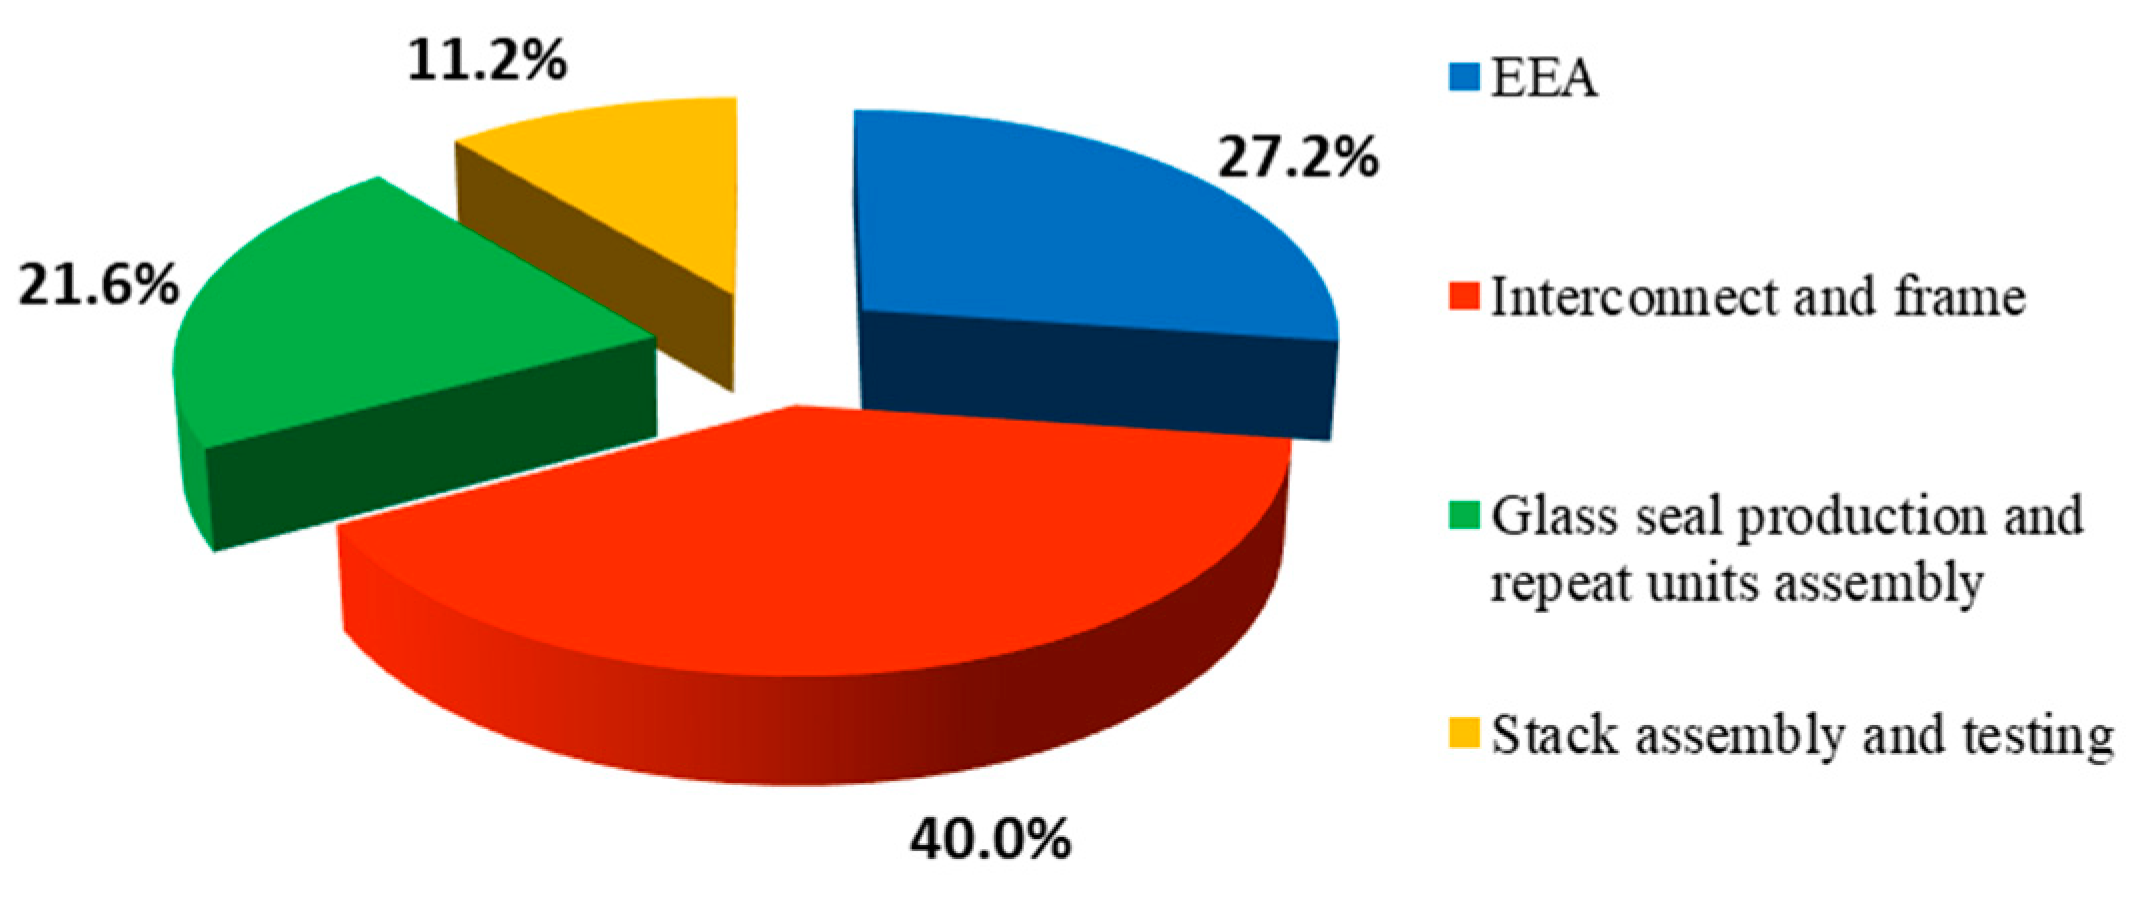
4.1. SOFC Stack Manufacturing
4.2. CHP System Manufacturing
4.3. CHP System Maintenance
4.4. CHP System Operation
4.5. Boilers Operation
4.6. Anaerobic Digester Operation
4.7. WWTP Operation
5. Results and Discussion
5.1. Energetic Flows and LCIA Profiles
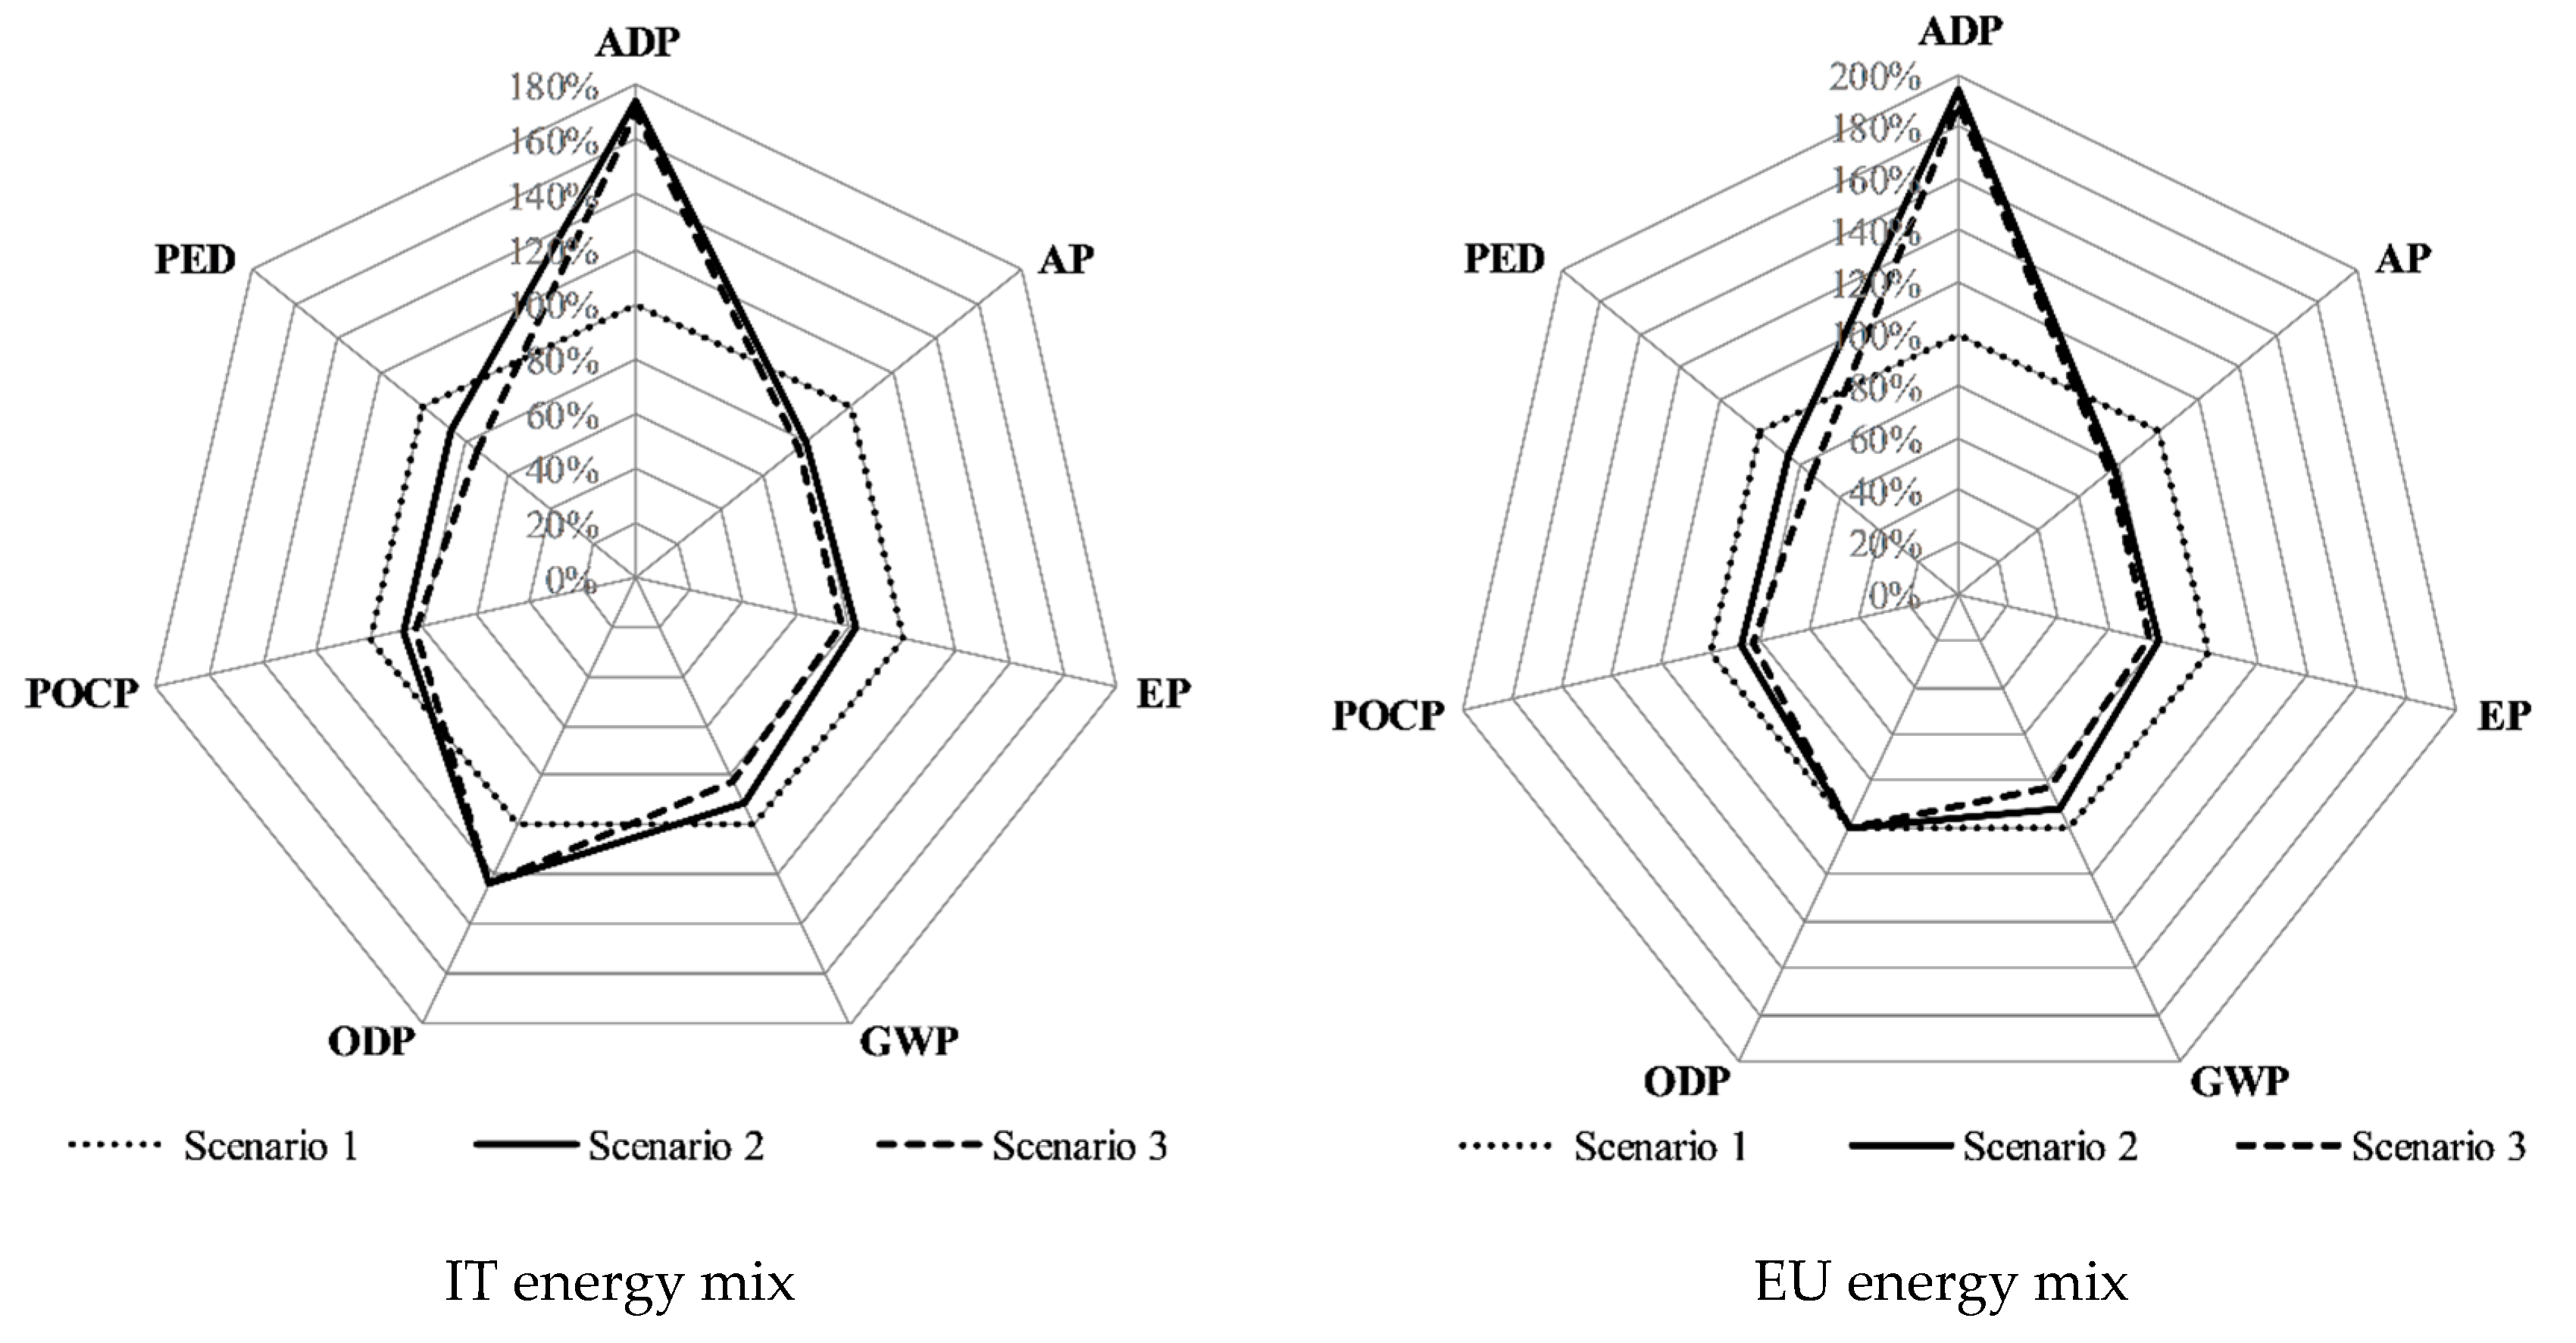
5.2. Interpretation of Results and Comparison between the Assessed Scenarios
- Heat from the SOFC: Allocation based on exergy (8.1% of the operational phase of the CHP system)
- Heat from boilers: Natural gas and biogas consumption and combustion’s emissions
- Digester: Electricity and lubricating oil for its operation, flare and pipe leakage emissions
- Electricity from the SOFC: Allocation based on exergy (91.9% of the operational phase of the CHP system)
- Electricity from the grid: Electricity required by the WWTP (excluded that auto-produced from SOFC)
5.3. Energy and Carbon Payback Times
5.4. Sensitivity Analysis
6. Conclusions
Author Contributions
Funding
Acknowledgments
Conflicts of Interest
Nomenclature
| ADP | Abiotic Depletion Potential of elements |
| AP | Acidification Potential |
| APU | Auxiliary Power Unit |
| CHP | Combined Heat and Power |
| EP | Eutrophication Potential |
| FC | Fuel Cell |
| GWP | Global Warming Potential |
| LCA | Life Cycle Assessment |
| LCI | Life Cycle Inventory |
| LCT | Life Cycle Thinking |
| ODP | Ozone Depletion Potential |
| PED | Primary Energy Demand |
| POCP | Photochemical Ozone Creation Potential |
| SOFC | Solid Oxide Fuel Cell |
| WWTP | Waste Water Treatment Plant |
Appendix A


References
- Kitous, A.; Keramidas, K. Analysis of Scenarios Integrating the INDCs-JRC POLICY BRIEF; European Comission: Brussels, Belgium, 2015. [Google Scholar]
- Adamson, K.-A. The Fuel Cell and Hydrogen Annual Review 2016; 4th Energy Wave: Edinburgh, Scotland, 2016. [Google Scholar]
- Lewis, J. Stationary fuel cells-Insights into commercialisation. Int. J. Hydrogen Energy 2014, 39, 21896–21901. [Google Scholar] [CrossRef]
- Pirkandi, J.; Mahmoodi, M.; Ommian, M. An optimal configuration for a solid oxide fuel cell-gas turbine (SOFC-GT) hybrid system based on thermo-economic modelling. J. Clean. Prod. 2017, 144, 375–386. [Google Scholar] [CrossRef]
- Santarelli, M.; Briesemeister, L.; Gandiglio, M.; Herrmann, S.; Kuczynski, P.; Kupecki, J.; Lanzini, A.; Llovelld, F.; Papurello, D.; Spliethoff, H.; et al. Carbon recovery and re-utilization (CRR) from the exhaust of a solid oxide fuel cell (SOFC): Analysis through a proof-of-concept. J. CO2 Util. 2017, 18, 206–221. [Google Scholar] [CrossRef]
- Sala, S.; Reale, F.; Cristobal-Garcia, J.; Pant, R. Life Cycle Assessment for the Impact Assessment of Policies; European Commission: Ispra, Italy, 2016; ISBN 9789279648137. [Google Scholar]
- Dewulf, J.; De Meester, S.; Alvarenga, R. Sustainability Assessment of Renewables-Based Products: Methods and Case Studies; John Wiley & Sons: Hoboken, NJ, USA, 2015; ISBN 9781118933947. [Google Scholar]
- European Commission Circular Economy Strategy-Environment-European Commission. Available online: http://ec.europa.eu/environment/circular-economy/index_en.htm (accessed on 24 September 2018).
- ISO. ISO 14040:2006-Environmental Management—Life Cycle Assessment—Principles and Framework; ISO: Geneva, Switzerland, 2016. [Google Scholar]
- ISO. ISO 14044:2006-Environmental Management—Life Cycle Assessment—Requirements and Guidelines; ISO: Geneva, Switzerland, 2016. [Google Scholar]
- European Commission-Joint Research Centre. Institute for Environment and Sustainability: International Reference Life Cycle Data System. In ILCD Handbook: General Guide for Life Cycle Assessment-Detailed Guidance; European Commission: Brussels, Belgium, 2010. [Google Scholar]
- Jing, R.; Wang, M.; Wang, W.; Brandon, N.; Li, N.; Chen, J.; Zhao, Y. Economic and environmental multi-optimal design and dispatch of solid oxide fuel cell based CCHP system. Energy Convers. Manag. 2017, 154, 365–379. [Google Scholar] [CrossRef]
- Benveniste, G.; Pucciarelli, M.; Torrell, M.; Kendall, M.; Tarancón, A. Life Cycle Assessment of microtubular solid oxide fuel cell based auxiliary power unit systems for recreational vehicles. J. Clean. Prod. 2017, 165, 312–322. [Google Scholar] [CrossRef]
- Zucaro, A.; Fiorentino, G.; Zamagni, A.; Bargigli, S.; Masoni, P.; Moreno, A.; Ulgiati, S. How can life cycle assessment foster environmentally sound fuel cell production and use? Int. J. Hydrogen Energy 2013, 38, 453–468. [Google Scholar] [CrossRef]
- Masoni, P.; Zamagni, A. Guidance Document for Performing LCAs on Fuel Cells and H₂ Technologies (Project FC-Hy Guide). Available online: http://www.fc-hyguide.eu/documents/10156/d0869ab9-4efe-4bea-9e7a-1fb823f4fcfa (accessed on 7 March 2018).
- Lunghi, P.; Bove, R.; Desideri, U. LCA of a molten carbonate fuel cell system. J. Power Sources 2004, 137, 239–247. [Google Scholar] [CrossRef]
- Lunghi, P.; Bove, R.; Desideri, U. Life-cycle-assessment of fuel-cells-based landfill-gas energy conversion technologies. J. Power Sources 2004, 131, 120–126. [Google Scholar] [CrossRef]
- Raugei, M.; Bargigli, S.; Ulgiati, S. A multi-criteria life cycle assessment of molten carbonate fuel cells (MCFC)—A comparison to natural gas turbines. Int. J. Hydrogen Energy 2005, 30, 123–130. [Google Scholar] [CrossRef]
- Mehmeti, A.; Santoni, F.; Della, M.; Mcphail, S.J. Life cycle assessment of molten carbonate fuel cells: State of the art and strategies for the future. J. Power Sources 2016, 308, 97–108. [Google Scholar] [CrossRef]
- Staffell, I.; Ingram, A.; Kendall, K. Energy and carbon payback times for solid oxide fuel cell based domestic CHP. Int. J. Hydrogen Energy 2012, 37, 2509–2523. [Google Scholar] [CrossRef]
- Evangelisti, S.; Lettieri, P.; Borello, D.; Clift, R. Life cycle assessment of energy from waste via anaerobic digestion: A UK case study. Waste Manag. 2014, 34, 226–237. [Google Scholar] [CrossRef] [PubMed]
- Evangelisti, S.; Tagliaferri, C.; Brett, D.J.L.; Lettieri, P. Life cycle assessment of a polymer electrolyte membrane fuel cell system for passenger vehicles. J. Clean. Prod. 2017, 142, 4339–4355. [Google Scholar] [CrossRef]
- Duclos, L.; Lupsea, M.; Mandil, G.; Svecova, L.; Thivel, P.X.; Laforest, V. Environmental assessment of proton exchange membrane fuel cell platinum catalyst recycling. J. Clean. Prod. 2017, 142, 2618–2628. [Google Scholar] [CrossRef]
- Kim, D.; Kim, J.; Koo, C.; Hong, T.; Kim, D.; Kim, J.; Koo, C.; Hong, T. An Economic and Environmental Assessment Model for Selecting the Optimal Implementation Strategy of Fuel Cell Systems—A Focus on Building Energy Policy. Energies 2014, 7, 5129–5150. [Google Scholar] [CrossRef]
- Longo, S.; Cellura, M.; Guarino, F.; Ferraro, M.; Antonucci, V.; Squadrito, G. Life Cycle Assessment of Solid Oxide Fuel Cells and Polymer Electrolyte Membrane Fuel Cells. In Hydrogen Economy; Elsevier: Amsterdam, The Netherlands, 2017; pp. 139–169. ISBN 9780128111321. [Google Scholar]
- Mehmeti, A.; Mcphail, S.J.; Pumiglia, D.; Carlini, M. Life cycle sustainability of solid oxide fuel cells: From methodological aspects to system implications. J. Power Sources 2016, 325, 772–785. [Google Scholar] [CrossRef]
- Tonini, D.; Astrup, T. LCA of biomass-based energy systems: A case study for Denmark. Appl. Energy 2012, 99, 234–246. [Google Scholar] [CrossRef]
- Sadhukhan, J. Distributed and micro-generation from biogas and agricultural application of sewage sludge: Comparative environmental performance analysis using life cycle approaches. Appl. Energy 2014, 122, 196–206. [Google Scholar] [CrossRef]
- Aziz, N.I.H.A.; Hanafiah, M.M.; Gheewala, S.H. A review on life cycle assessment of biogas production: Challenges and future perspectives in Malaysia. Biomass Bioenergy 2019, 122, 361–374. [Google Scholar] [CrossRef]
- Ayodele, T.R.; Ogunjuyigbe, A.S.O.; Alao, M.A. Economic and environmental assessment of electricity generation using biogas from organic fraction of municipal solid waste for the city of Ibadan, Nigeria. J. Clean. Prod. 2018, 203, 718–735. [Google Scholar] [CrossRef]
- Garfí, M.; Castro, L.; Montero, N.; Escalante, H.; Ferrer, I. Evaluating environmental benefits of low-cost biogas digesters in small-scale farms in Colombia: A life cycle assessment. Bioresour. Technol. 2019, 274, 541–548. [Google Scholar] [CrossRef]
- Gabisa, E.W.; Gheewala, S.H. Potential, environmental, and socio-economic assessment of biogas production in Ethiopia: The case of Amhara regional state. Biomass Bioenergy 2019, 122, 446–456. [Google Scholar] [CrossRef]
- Ali, M.Y.; Hassan, M.; Rahman, M.A.; Kafy, A.-A.; Ara, I.; Javed, A.; Rahman, M.R. Life cycle energy and cost analysis of small scale biogas plant and solar PV system in rural areas of Bangladesh. Energy Procedia 2019, 160, 277–284. [Google Scholar] [CrossRef]
- Esteves, E.M.M.; Herrera, A.M.N.; Esteves, V.P.P.; Morgado, C.D.R.V. Life cycle assessment of manure biogas production: A review. J. Clean. Prod. 2019, 219, 411–423. [Google Scholar] [CrossRef]
- Ingrao, C.; Bacenetti, J.; Adamczyk, J.; Ferrante, V.; Messineo, A.; Huisingh, D. Investigating energy and environmental issues of agro-biogas derived energy systems: A comprehensive review of Life Cycle Assessments. Renew. Energy 2019, 136, 296–307. [Google Scholar] [CrossRef]
- Torquati, B.; Venanzi, S.; Ciani, A.; Diotallevi, F.; Tamburi, V.; Torquati, B.; Venanzi, S.; Ciani, A.; Diotallevi, F.; Tamburi, V. Environmental Sustainability and Economic Benefits of Dairy Farm Biogas Energy Production: A Case Study in Umbria. Sustainability 2014, 6, 6696–6713. [Google Scholar] [CrossRef]
- Pehnt, M. Life-cycle assessment of fuel cell stacks. Int. J. Hydrogen Energy 2001, 26, 91–101. [Google Scholar] [CrossRef]
- Nease, J.; Ii, T.A.A. Comparative life cycle analyses of bulk-scale coal-fueled solid oxide fuel cell power plants. Appl. Energy 2015, 150, 161–175. [Google Scholar] [CrossRef]
- Bicer, Y.; Khalid, F. Life cycle environmental impact comparison of solid oxide fuel cells fueled by natural gas, hydrogen, ammonia and methanol for combined heat and power generation. Int. J. Hydrogen Energy 2018. (In press) [CrossRef]
- Scataglini, R.; Mayyas, A.; Wei, M.; Chan, H.; Lipman, T.; Gosselin, D.; D’alessio, A.; Breunig, H.; Colella, W.G.; James, B.D.; et al. A Total Cost of Ownership Model for Solid Oxide Fuel Cells in Combined Heat and Power and Power-Only Applications; Lawrence Berkeley National Laboratory: Alameda County, CA, USA, 2015.
- Convion Fuel Cell Systems Convion. Available online: http://convion.fi/ (accessed on 11 April 2019).
- De Haas, D.; Dancey, M. Wastewater treatment energy efficiency-A review with current Australian perspectives. Water 2015, 53–58. [Google Scholar] [CrossRef]
- Bachmann, N. Sustainable Biogas Production in Municipal Wastewater Treatment Plants-Technical Brochure of IEA Bioenergy. Available online: https://www.ieabioenergy.com/publications/sustainable-biogas-production-in-municipal-wastewater-treatment-plants/ (accessed on 1 December 2018).
- Daw, J.; Hallett, K.; Dewolfe, J.; Venner, I. Energy Efficiency Strategies for Municipal Wastewater Treatment Facilities-Technical Report of NREL (National Renewable Energy Laboratory). Available online: https://www.nrel.gov/docs/fy12osti/53341.pdf (accessed on 22 November 2016).
- Panepinto, D.; Fiore, S.; Zappone, M.; Genon, G.; Meucci, L. Evaluation of the energy efficiency of a large wastewater treatment plant in Italy. Appl. Energy 2016, 161, 404–411. [Google Scholar] [CrossRef]
- Ruffino, B.; Campo, G.; Genon, G.; Lorenzi, E.; Novarino, D.; Scibilia, G.; Zanetti, M. Improvement of anaerobic digestion of sewage sludge in a wastewater treatment plant by means of mechanical and thermal pre-treatments: Performance, energy and economical assessment. Bioresour. Technol. 2015, 175, 298–308. [Google Scholar] [CrossRef]
- Ruffino, B.; Campo, G.; Zanetti, M.C.; Genon, G. Improvement of the anaerobic digestion of activated sludge: Thermal and economical perspectives. WIT Trans. Ecol. Environ. 2014, 190, 979–991. [Google Scholar]
- The New York State Energy Research and Development Authority. Water & Wastewater Energy Management Best Practices Handbook; The New York State Energy Research and Development Authority: Albany, NY, USA, 2010.
- SMAT Società Metropolitana Acque Torino S.p.A. Available online: http://www.smatorino.it/ (accessed on 12 April 2019).
- DEMOSOFC Project Official Website. Available online: www.demosofc.eu (accessed on 20 December 2015).
- Giarola, S.; Forte, O.; Lanzini, A.; Gandiglio, M.; Santarelli, M.; Hawkes, A. Techno-economic assessment of biogas-fed solid oxide fuel cell combined heat and power system at industrial scale. Appl. Energy 2018, 211, 689–704. [Google Scholar] [CrossRef]
- Mehr, A.S.; Gandiglio, M.; MosayebNezhad, M.; Lanzini, A.; Mahmoudi, S.M.; Yari, M.; Santarelli, M. Solar-assisted integrated biogas solid oxide fuel cell (SOFC) installation in wastewater treatment plant: Energy and economic analysis. Appl. Energy 2017, 191, 620–638. [Google Scholar] [CrossRef]
- European Platform on Life Cycle Assessment (EPLCA) LCT–Our Thinking–Life Cycle Thinking. Available online: http://eplca.jrc.ec.europa.eu/?page_id=14 (accessed on 25 September 2018).
- Stranddorf, H.K.; Hoffmann, L.; Schmidt, A. FORCE Technology Impact categories, normalisation and weighting in LCA. Environ. News 2005, 78, 90. [Google Scholar]
- Gandiglio, M.; Lanzini, A.; Soto, A.; Leone, P.; Santarelli, M. Enhancing the energy efficiency of wastewater treatment plants through co-digestion and fuel cell systems. Front. Environ. Sci. 2017, 5, 70. [Google Scholar] [CrossRef]
- Rillo, E.; Gandiglio, M.; Lanzini, A.; Bobba, S.; Santarelli, M.; Blengini, G. Life Cycle Assessment (LCA) of biogas-fed Solid Oxide Fuel Cell (SOFC) plant. Energy 2017, 126, 585–602. [Google Scholar] [CrossRef]
- Scataglini, R.; Wei, M.; Mayyas, A.; Chan, S.H.; Lipman, T.; Santarelli, M. A Direct Manufacturing Cost Model for Solid-Oxide Fuel Cell Stacks. Fuel Cells 2017, 17, 825–842. [Google Scholar] [CrossRef]
- Primas, A. Life Cycle Inventories of New CHP Systems; Ecoinvent Report No. 20; Ecoinvent Centre: Dübendorf, Switzerland, 2007. [Google Scholar]
- Farnell, P. Engineering Aspects of Hydrocarbon Steam Reforming Catalysts. Top. Catal. 2016, 59, 802–808. [Google Scholar] [CrossRef]
- Spath, P.L.; Mann, M.K. Life Cycle Assessment of Hydrogen Production Via Natural Gas Steam Reforming; National Renewable Energy Laboratory: Golden, CO, USA, 2001.
- PIECE. Program for North American Mobility In Higher Education. In MODULE 14. “Life Cycle Assessment (LCA)” 4 Steps of LCA, Approaches, Software, Databases, Subjectivity, Sensitivity Analysis, Application to a Subjectivity, Sensitivity Analysis, Application to a Classic Example; 2017; Available online: https://vdocuments.mx/module-14-life-cycle-assessment-lca-4-steps-of-lca-life-cycle-assessment.html (accessed on 24 April 2019).
- Papadias, D.D.; Ahmed, S.; Kumar, R. Fuel quality issues with biogas energy-An economic analysis for a stationary fuel cell system. Energy 2012, 44, 257–277. [Google Scholar] [CrossRef]
- Santarelli, M.; Lanzini, A.; Gandiglio, M.; Le Pera, A.; Lorenzi, E.; Hakala, T.; Hawkes, A. Energy Planning of the DEMOSOFC (Deliverable of the DEMOSOFC EU Project). Available online: http://www.demosofc.eu/?attachment_id=862 (accessed on 12 April 2019).
- Santarelli, M.; Lanzini, A.; Gandiglio, M.; Papurello, D.; Lorenzi, E.; Hakala, T.; Hawkes, A. Optimization of the DEMOSOFC (Deliverable of the DEMOSOFC EU Project). Available online: http://www.demosofc.eu/?attachment_id=865 (accessed on 12 April 2019).
- Santarelli, M.; Lanzini, A.; Gandiglio, M.; Papurello, D.; Vaudano, G.; Fausone, U.; Hakala, T.; Liukkonen, M. Detailed Engineering of the DEMOSOFC (Deliverable of the DEMOSOFC EU Project). Available online: https://drive.google.com/file/d/0Bxqph4W5H-_Uc1FnUzV4UUFKTTQ/view (accessed on 12 April 2019).
- Jungbluth, N.; Dinkel, F.; Stettler, C.; Doka, G.; Chudacoff, M.; Dauriat, A.; Spielmann, M.; Sutter, J.; Emmenegger, M.F.; Gnansonou, E.; et al. Life Cycle Inventories of Bioenergy; Ecoinvent Report No. 17; Swiss Center Für Life Cycle Inventories: Dubendorf, Switzerland, 2007. [Google Scholar]


| Parameter/Scenario | Scenario 1 | Scenario 2 | Scenario 3 |
|---|---|---|---|
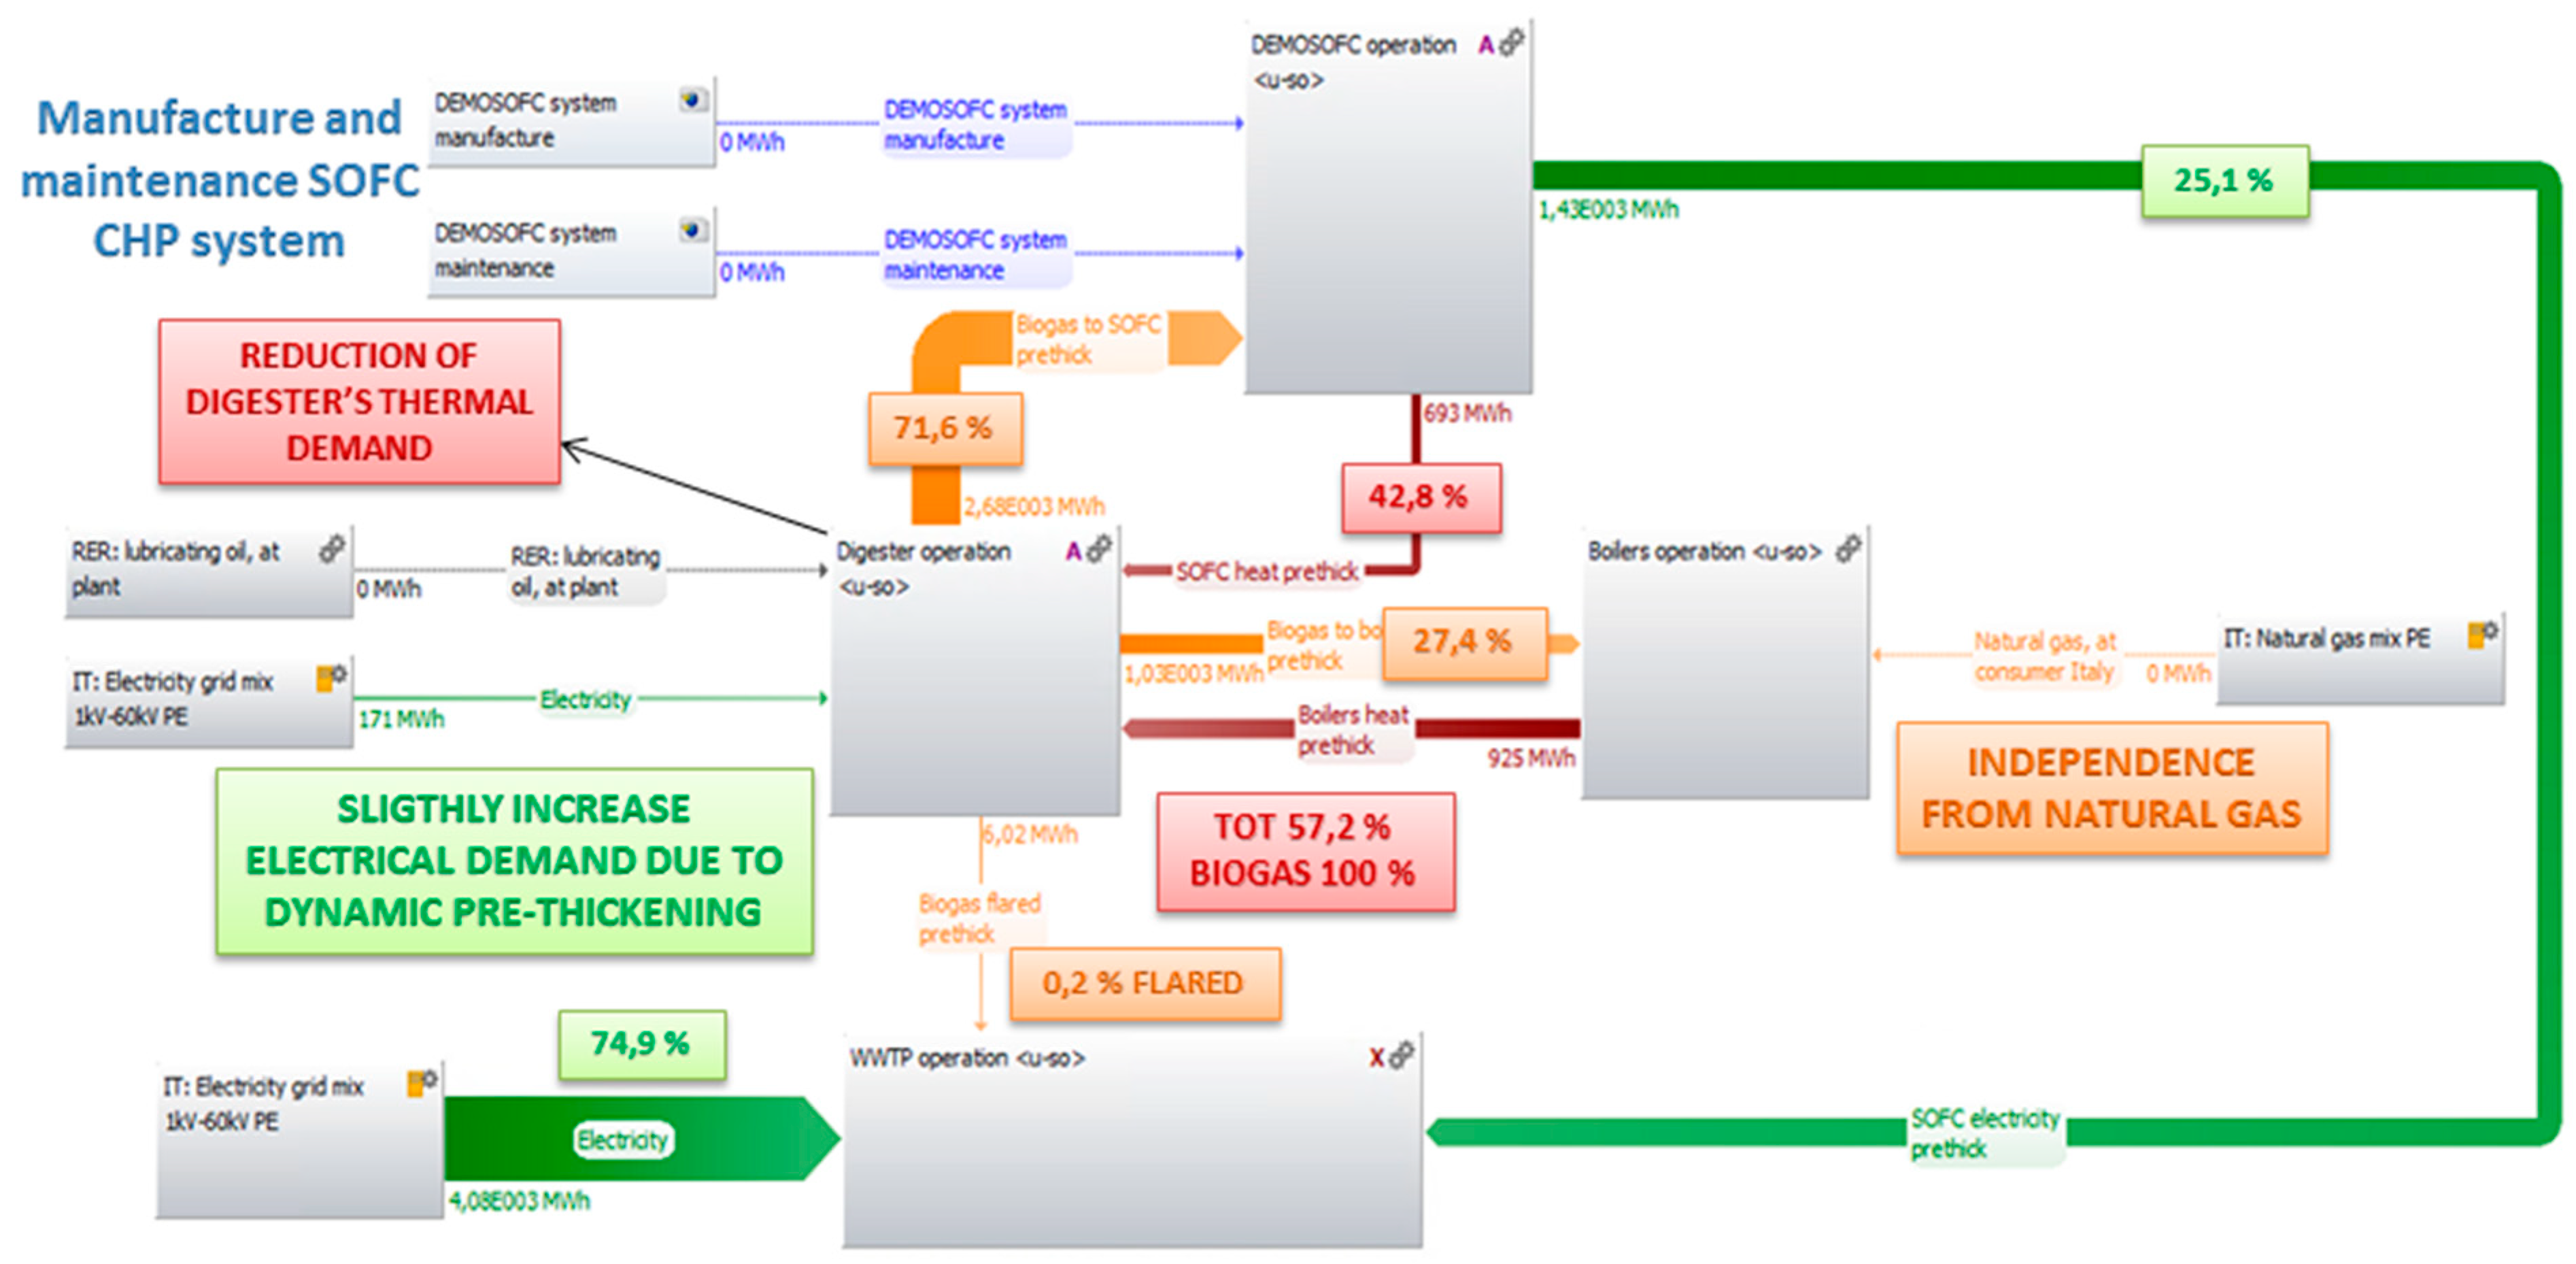
| Electrical energy | Grid 100% | SOFC modules 25.2% Grid 74.8% | SOFC modules 25.1% Grid 74.9% |
| Thermal energy | Biogas burned 93% NG burned 7% | SOFC modules 23.5% Biogas burned 31.4% NG burned 45.1% | SOFC modules 43% Biogas burned 57% NG burned 0% |
| Biogas handling (*) | Boilers 82.6 % Flare 16.6 % | SOFC modules 71.6% Boilers 27.4% Flares 0.2% | SOFC modules 71.6% Boilers 27.4% Flare 0.2% |
| Fuel Cell Energy (Versa Power) SOFC | ||
|---|---|---|
| Total plate area | 540 | cm2 |
| EEA dimensions | 18.15 × 18.15 | cm |
| Actively catalyzed area | 329 | cm2 |
| Single cell active area | 299 | cm2 |
| Gross cell inactive area | 45 | % |
| Current density | 0.35 | A/cm2 |
| Reference voltage | 0.8 | V |
| Power density | 0.28 | W/cm2 |
| Cell power | 84 | W |
| Cells per stack | 130 | units |
| Gross stack power | 11 | kW |
| Net stack power | 10 | kW |
| Component | Materials | Thickness [µm] | Process |
|---|---|---|---|
| Anode | Ni/YSZ | 700 | Tape casting |
| Anode-electrolyte interlayer | 50%NiO+50%YSZ | 10 | Screen printing |
| Electrolyte | YSZ | 10 | Screen printing |
| Cathode-electrolyte interlayer | 50%LSM+50%YSZ | 10 | Screen printing |
| Cathode | LSM | 50 | Screen printing |
| Material/Energy Flows | Value | Unit |
|---|---|---|
| Electrode-electrolyte assembly | ||
| NiO | 12.3 | kg |
| 8YSZ | 4.47 | kg |
| LSM | 1.07 | kg |
| Dibutyl phthalate (plasticizer) | 1.46 | kg |
| Polyvinyl Butyral (binder) | 1.46 | kg |
| Methocel A4M (binder) | 0.97 | kg |
| n-Butyl acetate 99.5% (solvent) | 4.39 | kg |
| 2-Butoxyethanol (solvent) | 0.55 | kg |
| Carbon black (pore former) | 0.95 | kg |
| Electricity consumption | 295 | kWh |
| Interconnect and frame manufacturing process | ||
| 441 SS | 43.54 | kg |
| MCO | 0.73 | kg |
| Electricity consumption | 433 | kWh |
| Glass seal production & repeat unit assembly | ||
| Glass powder | 0.182 | kg |
| N-butyl acetate (solvent) | 0.050 | kg |
| Polyvinyl butyral (binder) | 0.018 | kg |
| Benzyl n-butyl phthalate (plasticizer) | 0.014 | kg |
| Electricity consumption | 234 | kWh |
| Stack assembly and testing | ||
| 441 SS | 29.68 | kg |
| Electricity consumption | 121 | kWh |
| Emissions to air | Value | Unit |
| Electrode-electrolyte assembly | ||
| Carbon dioxide | 4.32 | kg |
| 99.5% n-Butyl acetate (solvent) | 4.44 | kg |
| 2-Butoxyethanol (solvent) | 0.55 | kg |
| Material/Energy Flows | Value | Unit |
|---|---|---|
| SOFC stack, 10 kWe | 18 | pieces |
| Steam reforming catalyst | 53 | kg |
| WGS catalyst | 53 | kg |
| Stainless steel (mass contribution) | 16,000 | kg |
| Sheet rolling, stainless steel (process contribution) | 16,000 | kg |
| Reinforced steel (mass contribution) | 16,800 | kg |
| Sheet rolling, steel (process contribution) | 16,800 | kg |
| Activated carbon, siloxanes + VOCs | 1300 | kg |
| Activated carbon, H2S | 650 | kg |
| Inverter (2.5 kW) | 70 | pieces |
| Natural gas, burned in an industrial furnace | 23.6 | MWhth |
| Electricity, IT consumption mix | 8.35 | MWhel |
| Material/Energy Flows | Value | Unit |
|---|---|---|
| Stacks’ replacement | 3 | pieces |
| Reinforced steel | 262 | kg |
| Stainless steel | 66 | kg |
| Steam reforming catalyst | 13 | kg |
| WGS catalyst | 13 | kg |
| Activated carbon, siloxanes + VOCs | 1300 | kg |
| Activated carbon, H2S | 650 | kg |
| SOFC Modules | ||
|---|---|---|
| Nominal electrical power | 174 | kWe |
| Nominal biogas flow rate | 55 | Nm3/h |
| Equivalent capacity factor | 95 | % |
| Number of shutdowns | 0 | / |
| Avg. biogas flow rate | 52.3 | Nm3/h |
| Effective electrical power | 166.2 | kWe |
| Thermal power | 81.1 | kWth |
| Avg. electrical efficiency | 53.1 | % |
| Avg. thermal efficiency | 25.8 | % |
| Annual operating hours | 8581 | h |
| Material/Energy Flows | Value | Unit |
|---|---|---|
| Biogas to SOFC | 449,084 | Nm3 |
| DEMOSOFC system | 0.05 | pieces |
| DEMOSOFC maintenance | 1 | pieces |
| Emissions to Air | ||
| Carbon dioxide, biogenic | 880.8 | ton |
| Scenario 1, Reference Flow: 3006 MWh Heat | ||
| Material/energy flows | Value | Unit |
| Natural gas, IT mix | 25,610 | Nm3 |
| Biogas to boilers | 518,408 | Nm3 |
| Emissions to Air | ||
| Carbon dioxide, biogenic | 1020.2 | ton |
| Carbon dioxide, fossil | 50.5 | ton |
| Carbon monoxide, biogenic | 186.9 | kg |
| Carbon, monoxide, fossil | 15.4 | kg |
| Nitrogen oxide | 181.7 | kg |
| Nitrogen dioxide | 15.1 | kg |
| Scenario 2, Reference Flow: 2256.3 MWh Heat | ||
| Material/energy flows | Value | Unit |
| Natural gas, IT mix | 155,317 | Nm3 |
| Biogas to boilers | 172,241 | Nm3 |
| Emissions to Air | ||
| Carbon dioxide, biogenic | 338.9 | ton |
| Carbon dioxide, fossil | 306.0 | ton |
| Carbon monoxide, biogenic | 62.1 | kg |
| Carbon, monoxide, fossil | 93.3 | kg |
| Nitrogen oxide | 139.6 | kg |
| Nitrogen dioxide | 11.6 | kg |
| Scenario 3, Reference Flow: 925.4 MWh Heat | ||
| Material/energy flows | Value | Unit |
| Natural gas, IT mix | 0 | Nm3 |
| Biogas to boilers | 172,241 | Nm3 |
| Emissions to Air | ||
| Carbon dioxide, biogenic | 338.9 | ton |
| Carbon dioxide, fossil | \ | \ |
| Carbon monoxide, biogenic | 62.1 | kg |
| Carbon, monoxide, fossil | \ | \ |
| Nitrogen oxide | 55.8 | kg |
| Nitrogen dioxide | 4.6 | kg |
| Scenario 1, Reference Flow: 627041 Nm3 Biogas | ||
| Material/energy flows | Value | Unit |
| Heat, from boiler operation | 3006 | MWh |
| Electricity, IT mix, from the grid | 158 | MWh |
| Lubricating oil, at the plant | 178.6 | kg |
| Emissions to Air | ||
| Carbon dioxide, biogenic | 3715 | kg |
| Methane, biogenic | 2022 | kg |
| Scenario 2, Reference Flow: 627041 Nm3 Biogas | ||
| Material/energy flows | Value | Unit |
| Heat from boilers operation | 2256.3 | MWh |
| Heat from SOFC | 693.1 | MWh |
| Electricity, IT mix, from the grid | 158 | MWh |
| Lubricating oil, at the plant | 178.6 | kg |
| Emissions to Air | ||
| Carbon dioxide, biogenic | 3715 | kg |
| Methane, biogenic | 2022 | kg |
| Scenario 3, Reference Flow: 627041 Nm3 Biogas | ||
| Material/energy flows | Value | Unit |
| Heat from boilers operation | 925.4 | MWht |
| Heat from SOFC | 693.1 | MWht |
| Electricity, IT mix, from the grid | 171 | MWhe |
| Lubricating oil, at the plant | 178.6 | kg |
| Emissions to Air | ||
| Carbon dioxide, biogenic | 3715 | kg |
| Methane, biogenic | 2022 | kg |
| Scenario 1, Reference Flow: 13,958,807 m3 Treated Wastewater | ||
| Material/energy flows | Value | Unit |
| Electricity, IT mix, from the grid | 5479.4 | MWh |
| Biogas flared | 103,930 | Nm3 |
| Emissions to Air | ||
| Carbon dioxide, biogenic | 204.1 | ton |
| Scenario 2, Reference Flow: 13,958,807 Idem m3 Treated Wastewater | ||
| Material/energy flows | Value | Unit |
| Electricity, IT mix, from the grid | 4078 | MWh |
| Electricity from SOFC | 1427 | MWh |
| Biogas flared | 1008 | Nm3 |
| Emissions to Air | ||
| Carbon dioxide, biogenic | 1.98 | ton |
| Scenario 3, Reference Flow: 13,958,807 Idem m3 Treated Wastewater | ||
| Material/energy flows | Value | Unit |
| Electricity, IT mix, from the grid | 4078 | MWh |
| Electricity from SOFC | 1427 | MWh |
| Biogas flared | 1008 | Nm3 |
| Emissions to Air | ||
| Carbon dioxide, biogenic | 1.98 | ton |
| PBT [Years] | Scenario 2 | Scenario 3 |
|---|---|---|
| Energy, IT mix | 0.70 | 0.37 |
| Energy, EU mix | 0.63 | 0.36 |
| Carbon, IT mix | 0.54 | 0.29 |
| Carbon, EU mix | 0.56 | 0.31 |
© 2019 by the authors. Licensee MDPI, Basel, Switzerland. This article is an open access article distributed under the terms and conditions of the Creative Commons Attribution (CC BY) license (http://creativecommons.org/licenses/by/4.0/).
Share and Cite
Gandiglio, M.; De Sario, F.; Lanzini, A.; Bobba, S.; Santarelli, M.; Blengini, G.A. Life Cycle Assessment of a Biogas-Fed Solid Oxide Fuel Cell (SOFC) Integrated in a Wastewater Treatment Plant. Energies 2019, 12, 1611. https://doi.org/10.3390/en12091611
Gandiglio M, De Sario F, Lanzini A, Bobba S, Santarelli M, Blengini GA. Life Cycle Assessment of a Biogas-Fed Solid Oxide Fuel Cell (SOFC) Integrated in a Wastewater Treatment Plant. Energies. 2019; 12(9):1611. https://doi.org/10.3390/en12091611
Chicago/Turabian StyleGandiglio, Marta, Fabrizio De Sario, Andrea Lanzini, Silvia Bobba, Massimo Santarelli, and Gian Andrea Blengini. 2019. "Life Cycle Assessment of a Biogas-Fed Solid Oxide Fuel Cell (SOFC) Integrated in a Wastewater Treatment Plant" Energies 12, no. 9: 1611. https://doi.org/10.3390/en12091611
APA StyleGandiglio, M., De Sario, F., Lanzini, A., Bobba, S., Santarelli, M., & Blengini, G. A. (2019). Life Cycle Assessment of a Biogas-Fed Solid Oxide Fuel Cell (SOFC) Integrated in a Wastewater Treatment Plant. Energies, 12(9), 1611. https://doi.org/10.3390/en12091611