Article

Behavior of Weakly Cemented Rock with Different Moisture Contents under Various Tri-Axial Loading States

1
State Key Laboratory of Coal Resources and Safe Mining, School of Mines, China University of Mining and Technology, Xuzhou 221116, China
2
College of Geology and Mines Engineering, Xinjiang University, Urumqi 830046, China
*
Author to whom correspondence should be addressed.
Energies 2019, 12(8), 1563; https://doi.org/10.3390/en12081563
Submission received: 3 April 2019 / Revised: 19 April 2019 / Accepted: 21 April 2019 / Published: 25 April 2019

Abstract

:
To better understand the physical and mechanical behavior of weakly cemented rock with different moisture contents for the success of water-preserved mining, this paper presents the systematic tri-axial compression tests on three typical rock samples (i.e., mudstone, sandstone, and sandy mudstone) sampled from Ili mining area, where the environmental requirements for water conservation are significantly strict. Both the influences of moisture content and confining pressure on the failure mode and the stress-strain behavior of weakly cemented rock have been discussed and compared with each other. Test results showed that: (1) compared to sandstone and sandy mudstone, both the peak stress and residual stress of the weakly cemented mudstone are much more sensitive to confining pressure and moisture content. In detail, the peak stress is very relevant to moisture content, whereas, the residual stress is more sensitive to the confining pressure, (2) with the increase of moisture content, both the yield and ductility of weakly cemented mudstone have been significantly enhanced. However, a similar experimental observation has been found for sandstone and sandy mudstone, and (3) the microstructure and the mineral component are believed to be the two main factors leading to the scatter in terms of the stress-strain behavior for different weakly cemented rocks. Experimental results and discussions presented in this paper can provide the guideline for further research on the application of water-preserved mining in other coal mines with a similar geological condition.

1. Introduction

As one of the most important energy replacement areas, coal resources and reserves in Xinjiang, Northwestern of China, have attracted much attention due to their first rank compared to other mining areas. Due to the area’s specific geological conditions, the protection and utilization of water resource during mining activities are becoming the main concern for coal operators and government managers. During the past decades, the rapid development of coal mining industries and coal-based chemical industries in Ili coal mining area, which is the only one mining area rich in water resources, has made a huge contribution to the social economics. It should, however, be noted that the coal seam in this area characteristics with shallow depth and large thickness makes the ecological environment very sensitive to mining activities, resulting in a series of devastating ecological environment problems including unrecoverable damage to the aquifer, loss of superficial water and unexpected death of surface vegetation [1]. Compared to the economic benefits obtained from coal production, the environmental footprint left by mining activities seems to be more serious owing to its complicated and difficult procedure to recover. It is now urgent to resolve the contradiction between coal mining and water resources protection.
To achieve a coordinated development between cost-effective mining and the protection of water resources, a new mining method termed water-preserved mining has been recently proposed [2,3]. A large amount of research focusing on this mining method has been conducted and found that there exists an important structure (i.e., barrier layer) for the expansion of the overburden channel, as shown in Figure 1. The barrier layer is defined as one or several strata distributed over the caving layer, the integrity of which is closely related to the success of water-preserved mining preservation [2]. In Ili mining area, the barrier layer mainly consists of typical weakly cemented Jurassic and Cretaceous mudstone, sandstone and sandy mudstone due to its late diagenesis age. The typical geological condition leads to the application of water-preserved mining technology in this area being much more difficult than that in other mining areas (e.g., Shendong mining area). In particular, the high clay mineral content and low strength of weakly cemented rock bring the side effect of the stability of the overall strata around barrier layer, resulting in the instability of surrounding rock.
Extensive research has been carried out to deepen the understanding of the physical and mechanical behavior of weakly cemented rocks under different loading conditions (i.e., uniaxial and tri-axial). Various types of rock samples have been well investigated through experimental and analytical methods. Among them, Wang et al. explored the deformation characteristics and failure modes of weakly cemented mudstone with variable water contents and confining pressures under uniaxial and tri-axial compression loading. Based on the experimental observations, the authors divided the strain-stress curves into five different portions considering the effect of moisture content and applied confinement [4,5]. VH Nguyen et al. theoretically investigated the effect of the loading path on the permeability evolution of sandstone and stated that the permeability of sandstone is closely relevant to its microstructure and the confining pressure applied on before the reach of the yield [6]. You et al. also discussed the relationship between the temperature/confining pressure and the permeability of weakly cemented sandstone under tri-axial loading state. The comparison of the microstructures before and after test has indicated that the sensitivity of confining pressure and temperature will decrease with particle size [7]. Zheng et al. evaluated the creep characteristics of weakly cemented porous sandstone and revised the existing Burger model to make it much more reliable to predict the stress-strain behavior [8]. Erguler et al. quantified the effect of moisture content on mechanical properties of different rock samples containing clay-rich minerals through the experimental analysis [9]. Zhao et al. analyzed the influence of particle size and loading path on the plastic strain energy and plastic deformation characteristics of weakly cemented sandstone, revealing that the plastic strain energy is more suitable for the evaluation of rock during loading compared to residual strain energy [10]. Meng et al. tested the elastic-plastic characteristics of the very weakly cemented rock mass with large deformation by comparing the post-peak strain softening and expansion characteristics. It has been verified that the tensile failure mode will gradually transfer to plastic and shearing failure with the increase of moisture content [11]. Among them, it is sandstone rather than other typical weakly cemented rock that has been widely investigated.
Current research has provided meaningful enlightenment for the mastery of the mechanical properties of weakly cemented rock and these beneficial research outcomes will be useful for the application of water-preserved mining in Ili mining area. Different from traditional rock engineering as reported in existing open literature, the complicit mining activities will lead to the redistribution of the stress field, fracture field, and seepage field, as shown in Figure 1 [12,13], resulting in the changes of both the stress situation and moisture content of multiple rock layers around the caved coal seam. The failure mode and stress-strain behavior of the weakly cemented rock under typical states in which both the confining pressure and moisture content are two problematic points to be considered for the success of water-preserved mining.
Against this background, this paper presents the systematic experimental investigation of the behavior and failure mode of weakly cemented rock with different moisture contents under tri-axial loading states. Three typical weakly cemented rock samples (i.e., mudstone, sandstone, sandy mudstone) were obtained from main barrier layers in Ili mining area. To evaluate the effect of confining pressure and moisture content caused by mining activities, a total of 15 specimens that covered three different confining pressures (i.e., 1 MPa, 3 MPa, and 5 MPa) and moisture contents (i.e., natural moisture, dry, and saturated) have been tested. The experimental results obtained from this paper can provide a reference to the application of water-preserved mining technology for other coal mines with similar geological conditions.

2. Experimental Program

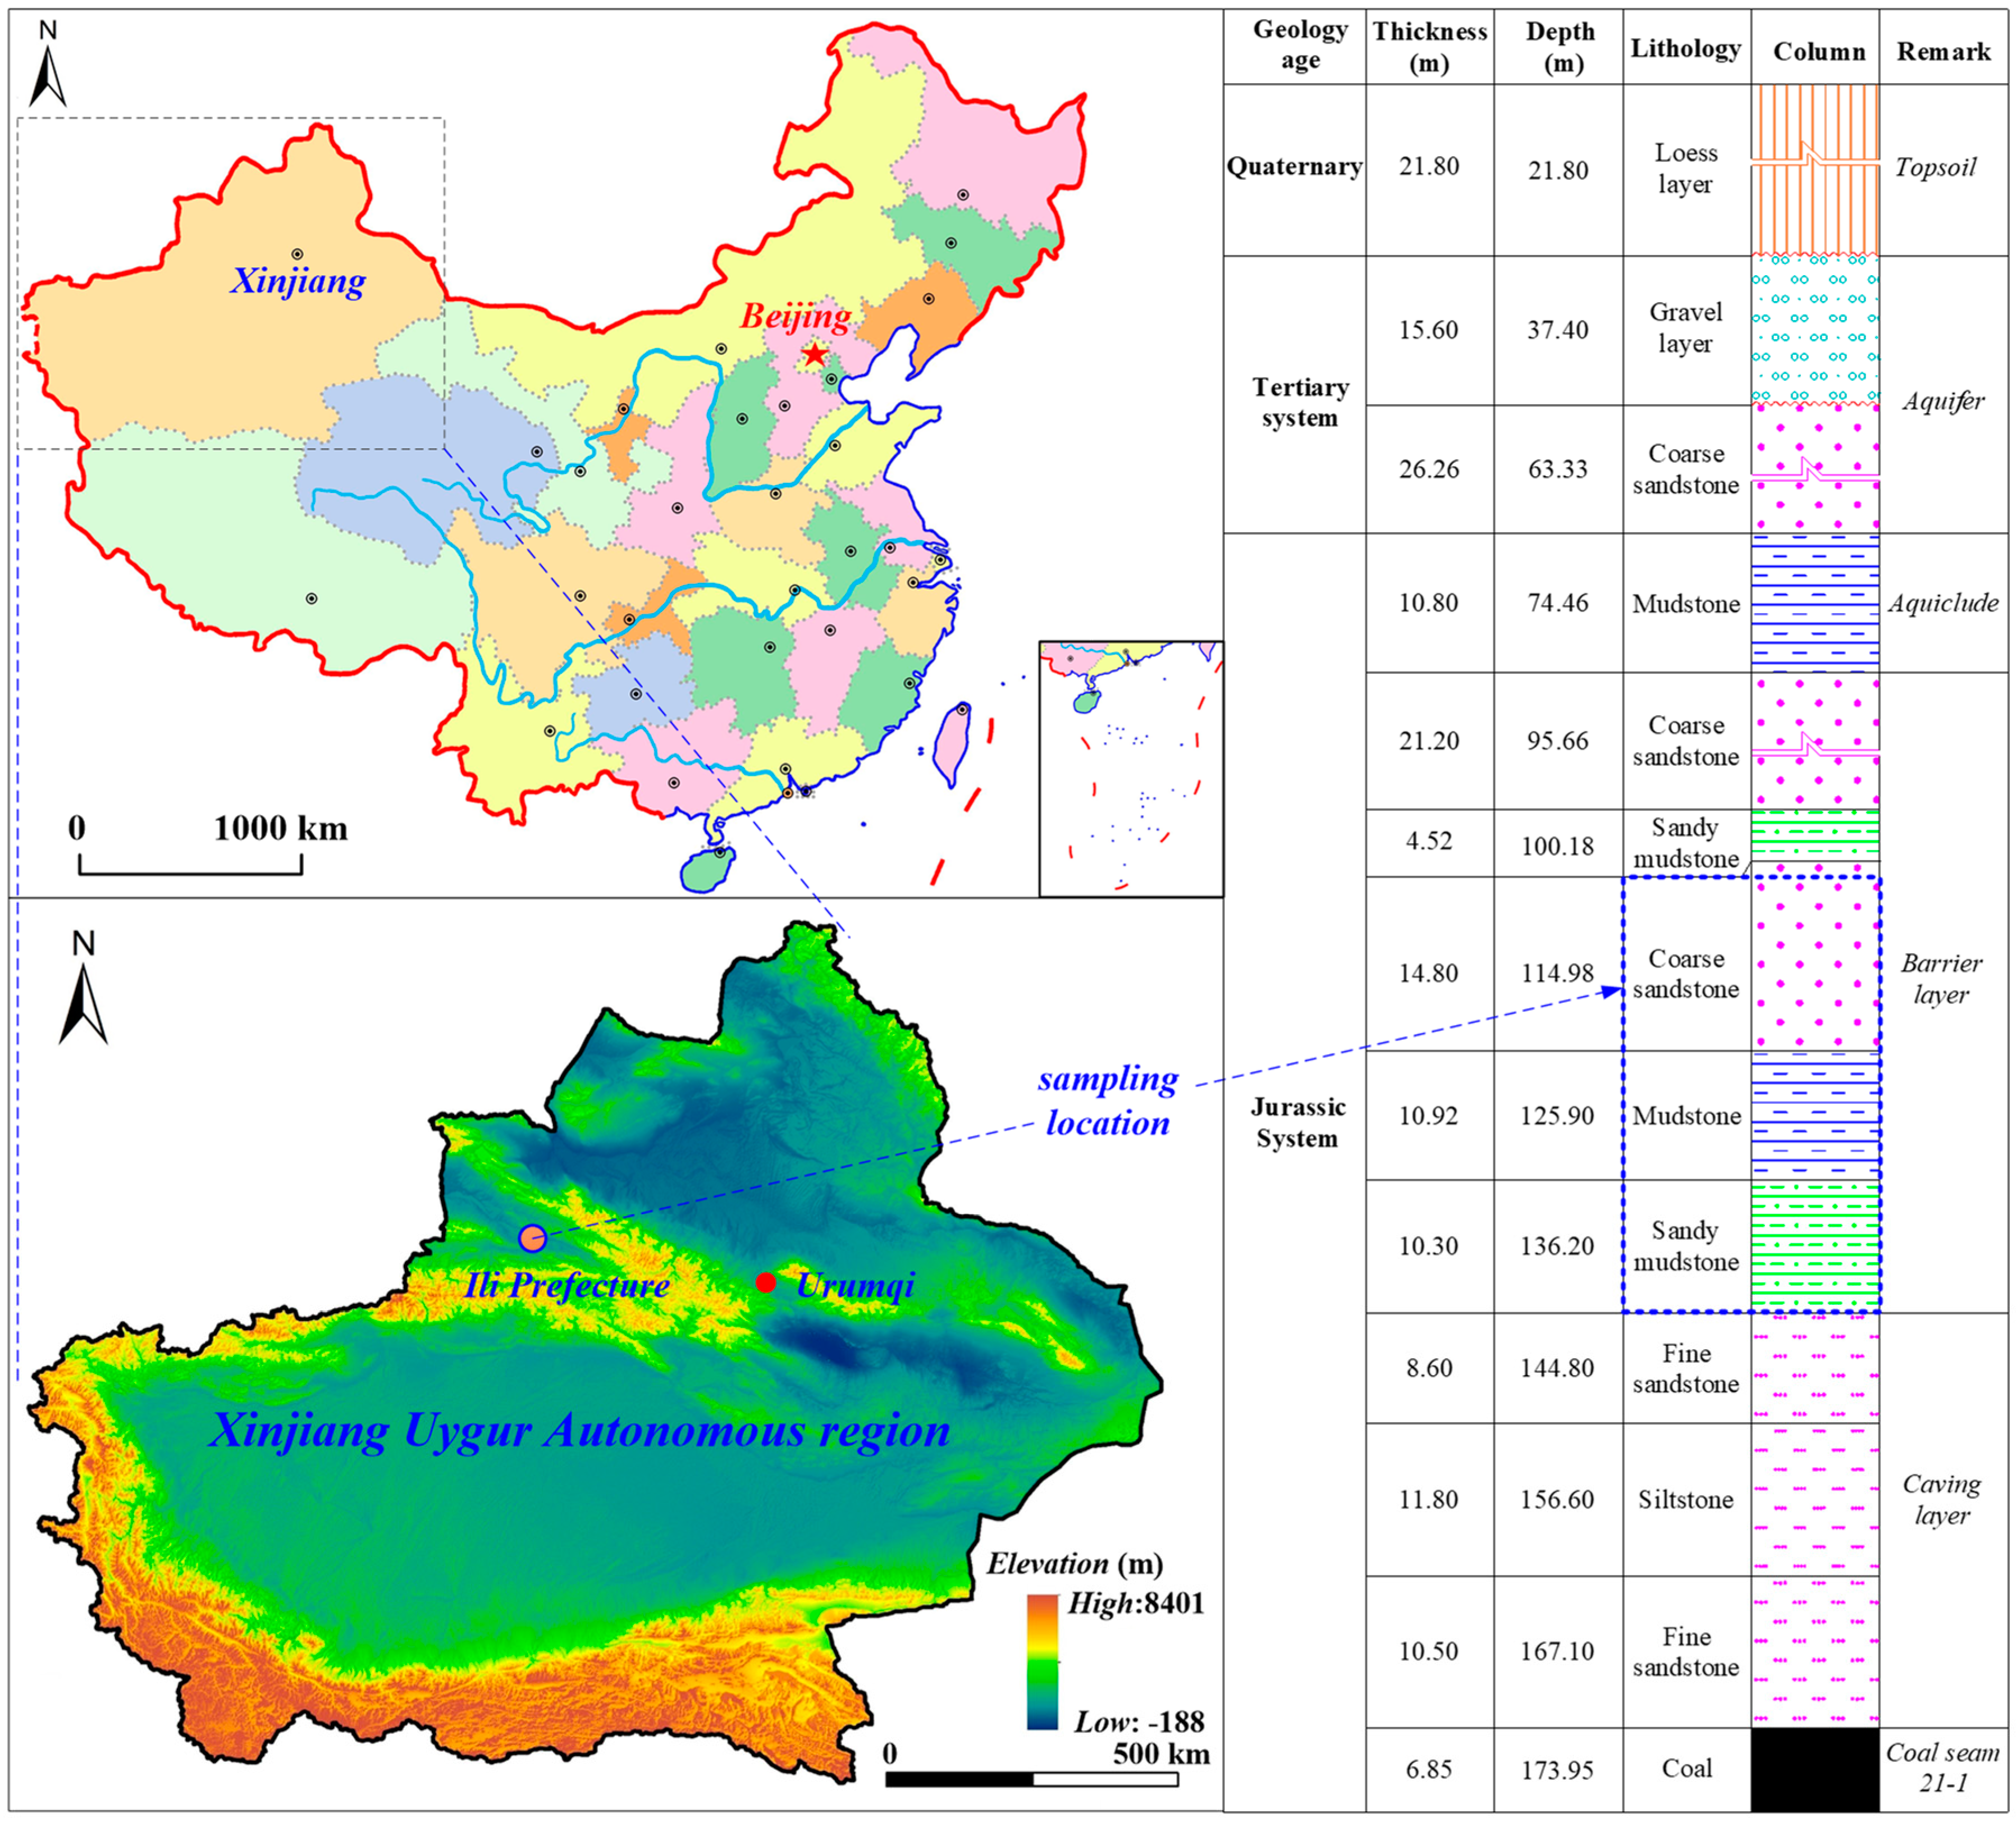
2.1. Geological Conditions and Research Area

All specimens presented in this paper were obtained from Ili mining area, Xinjiang, northwestern of China. Three representative types of weakly cemented rock samples (i.e., mudstone, sandstone and sandy mudstone) over the coal seam have been selected from Jurassic consolidated formations, as shown in Figure 2. The rock cores were extracted from Ili NO.4 coal mine, whose average mining depth 120 m. The ground-free reversed circulation was applied to get the rock core according to the standard drilling process. The collected rock cores were immediately covered with polymer resin and cling wrap to maintain the original moisture content before further process.

2.2. Preparation of Rock Samples

To minimize the change of rock moisture content during the preparation of rock samples, the dry cutting and lathe cutter machines have been used to drill standard rock samples in accordance with ASTM-D4543-01 [14]. All rock samples have a nominal height of 100 mm and a nominal diameter of 50 mm with an acceptable polished surface roughness (less than 0.02 mm) and perpendicular angle (i.e., no more than 0.001 rad). In order to eliminate the effect caused by the lab environment, these rock samples were directly put into the oven and humidity tank for 24 h to obtain the completely dry and saturated rock samples, respectively. Herein, the average temperature of the oven was 105 °C according to ASTM D4643-17 [15].

2.3. Test Matrix

A total of 15 cylindrical rock samples have been prepared and tested, comprising of three series according to the type of rocks. In each series, there were five identical samples with different moisture contents (i.e., natural moisture, dry, and saturated) under variable confining pressure (i.e., 1 MPa, 3 MPa, and 5 MPa) to simulate the tri-axial loading states in real practical applications. The in situ stress in the research area is about 3 MPa according to its average mining depth. Therefore, 1 MPa and 5 MPa were selected to simulate the rock mass subjected to stress concentration and the stress reduction situations as presented in Figure 1. For ease of reference, each rock sample was given a name starting with the letter of the type of rock, followed by the first letter of the moisture condition and the last number is used to differentiate the confining pressure under tri-axial test. Taking NY-N-3 for example, it is the rock sample of mudstone under natural moisture state with the confining pressure of 3 MPa.

2.4. Moisture Content

The moisture content of rock samples presented in Table 1 was calculated according to the following equation,
ω w = m w m d m d × 100 %
where ωw is the moisture content of the sample, and mw and md are the weights of the saturated and dry rock samples, respectively.
It is obvious in Table 1 that the moisture content of natural state and saturated state for different types of rock samples are much different. As shown in Table 1, the differences between mw and md for mudstone, sandstone and sandy mudstone are 6.39%, 3.87%, and 2.76%, respectively. It indicates that the water absorption capacities of these three typical rocks are not all the same.

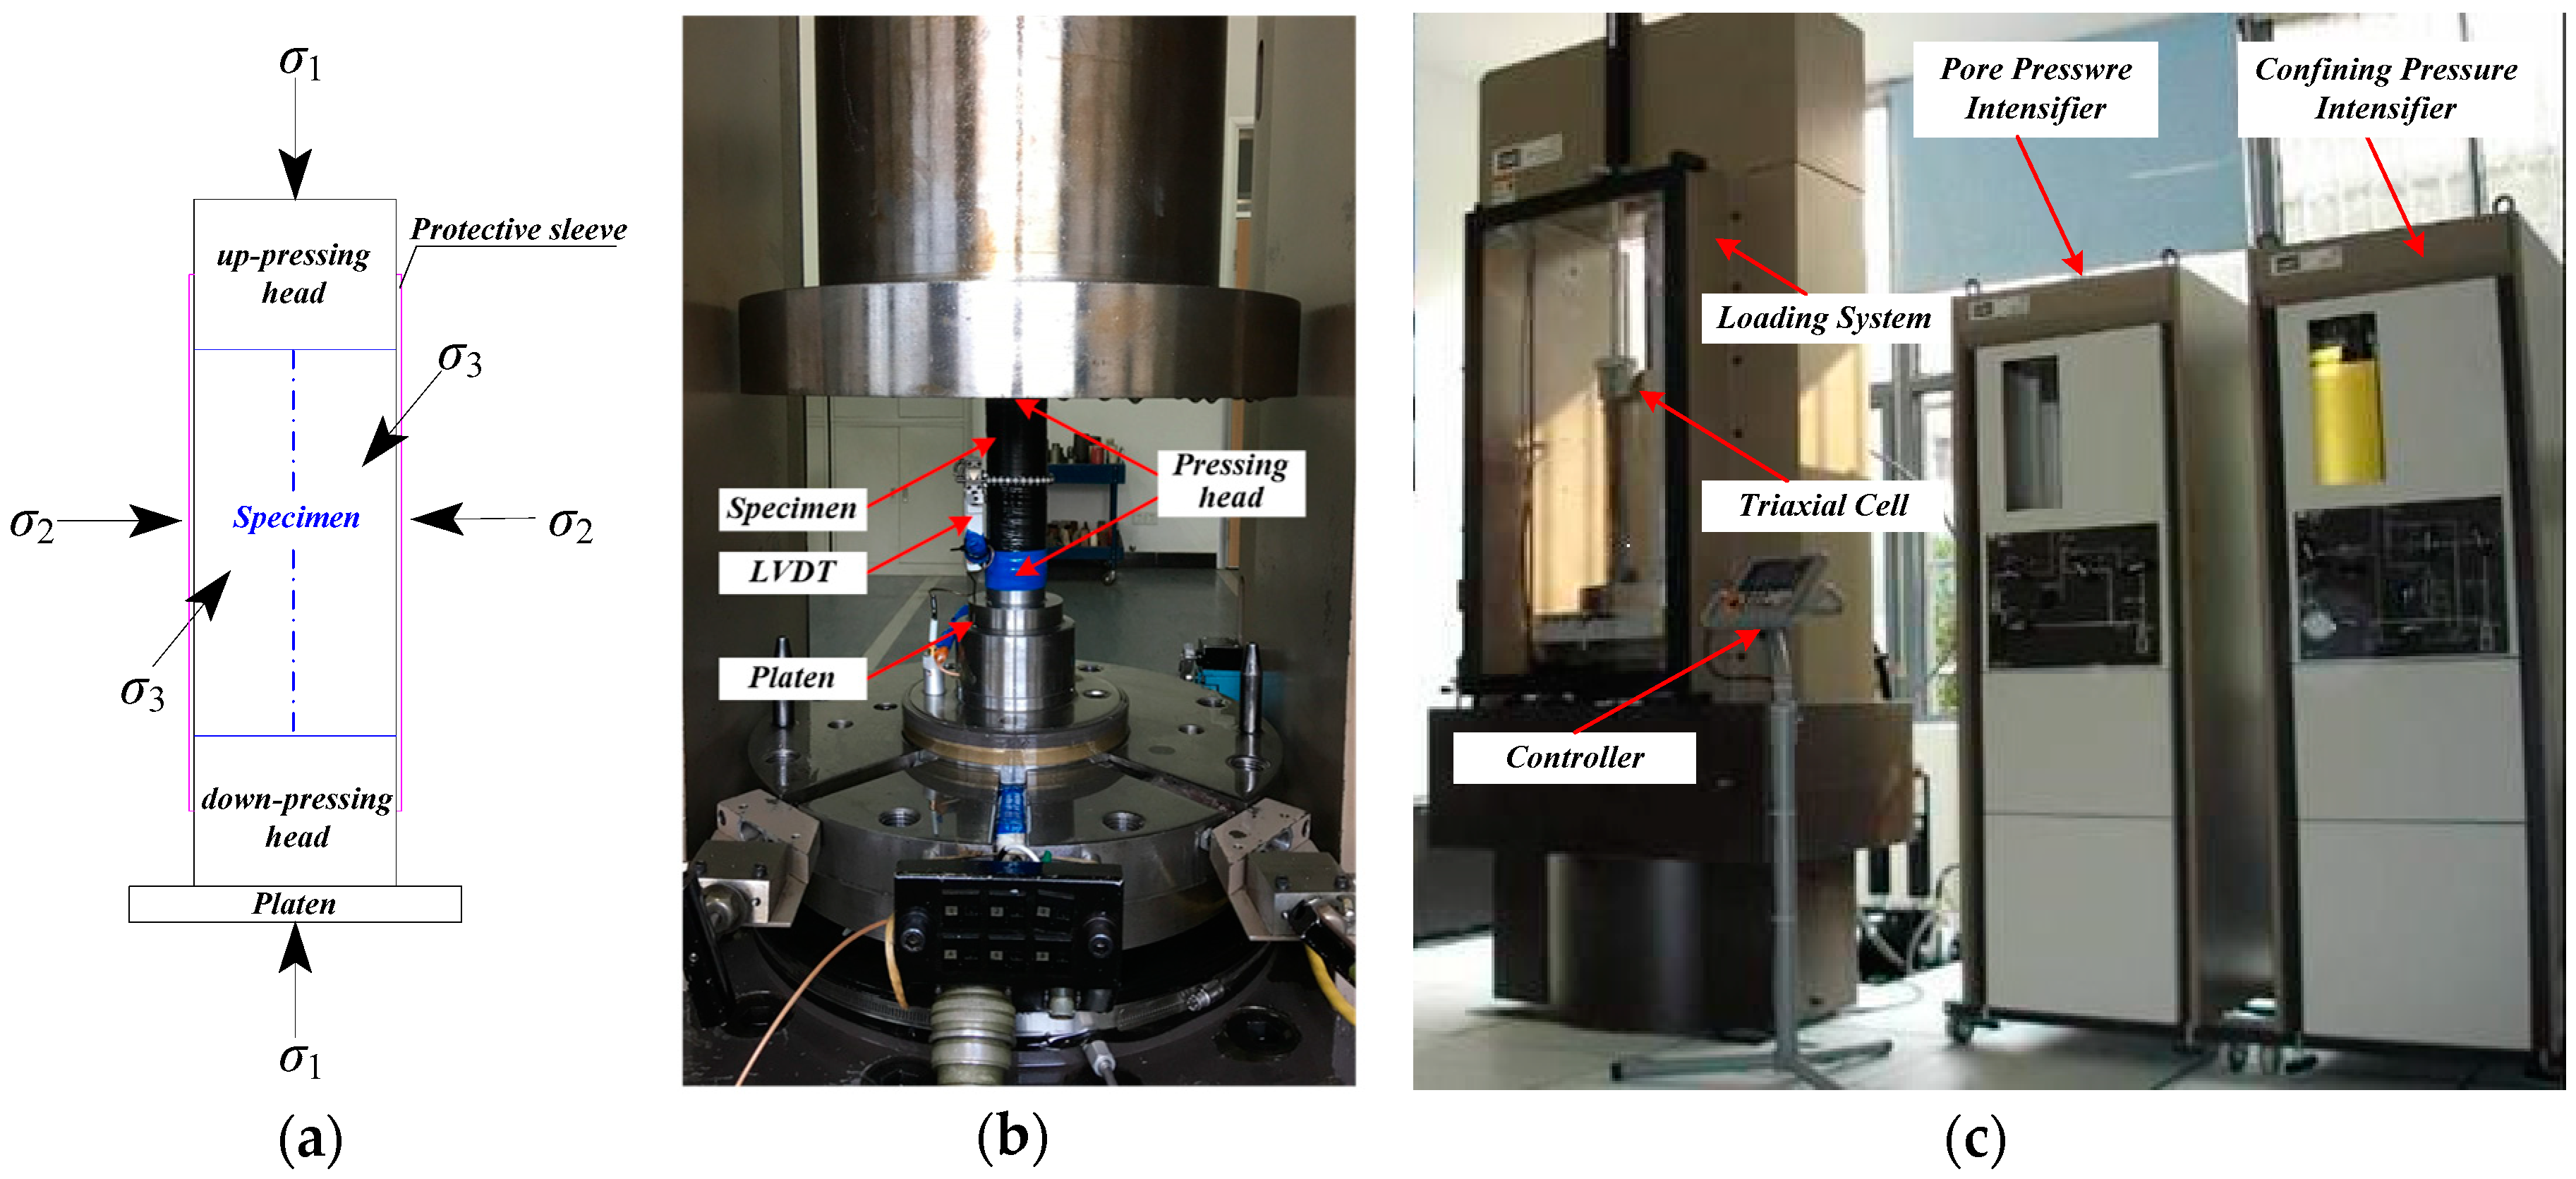
2.5. Test Set-Up and Instrumentation

All tri-axial compression tests were conducted at China University of Mining and Technology using an electro-hydraulic servo-controlled rock mechanics testing system (MTS815.03) with displacement control (see Figure 3). Two linear variable displacement transducers (LVDTs) were placed at the opposite corners between the bottom and the top loading plates (see Figure 3b). The loading rate for all rock samples was 0.002 mm per second in accordance with ASTM-D7012-1020 [16] after the constant confining pressure has been applied to the rock samples for several minutes. As shown in Figure 3a,b, the confining pressure was applied to rock samples by the hydraulic system. The tri-axial test lasted continuously until the axial load kept constant to obtain the stable stress-strain curves with a residual load. All specimens were collected after tests and covered with cling wrap to keep their original failure states. In the test, both the axial load and axial strain were simultaneously recorded by the data logger.

3. Experimental Results and Discussions

3.1. General

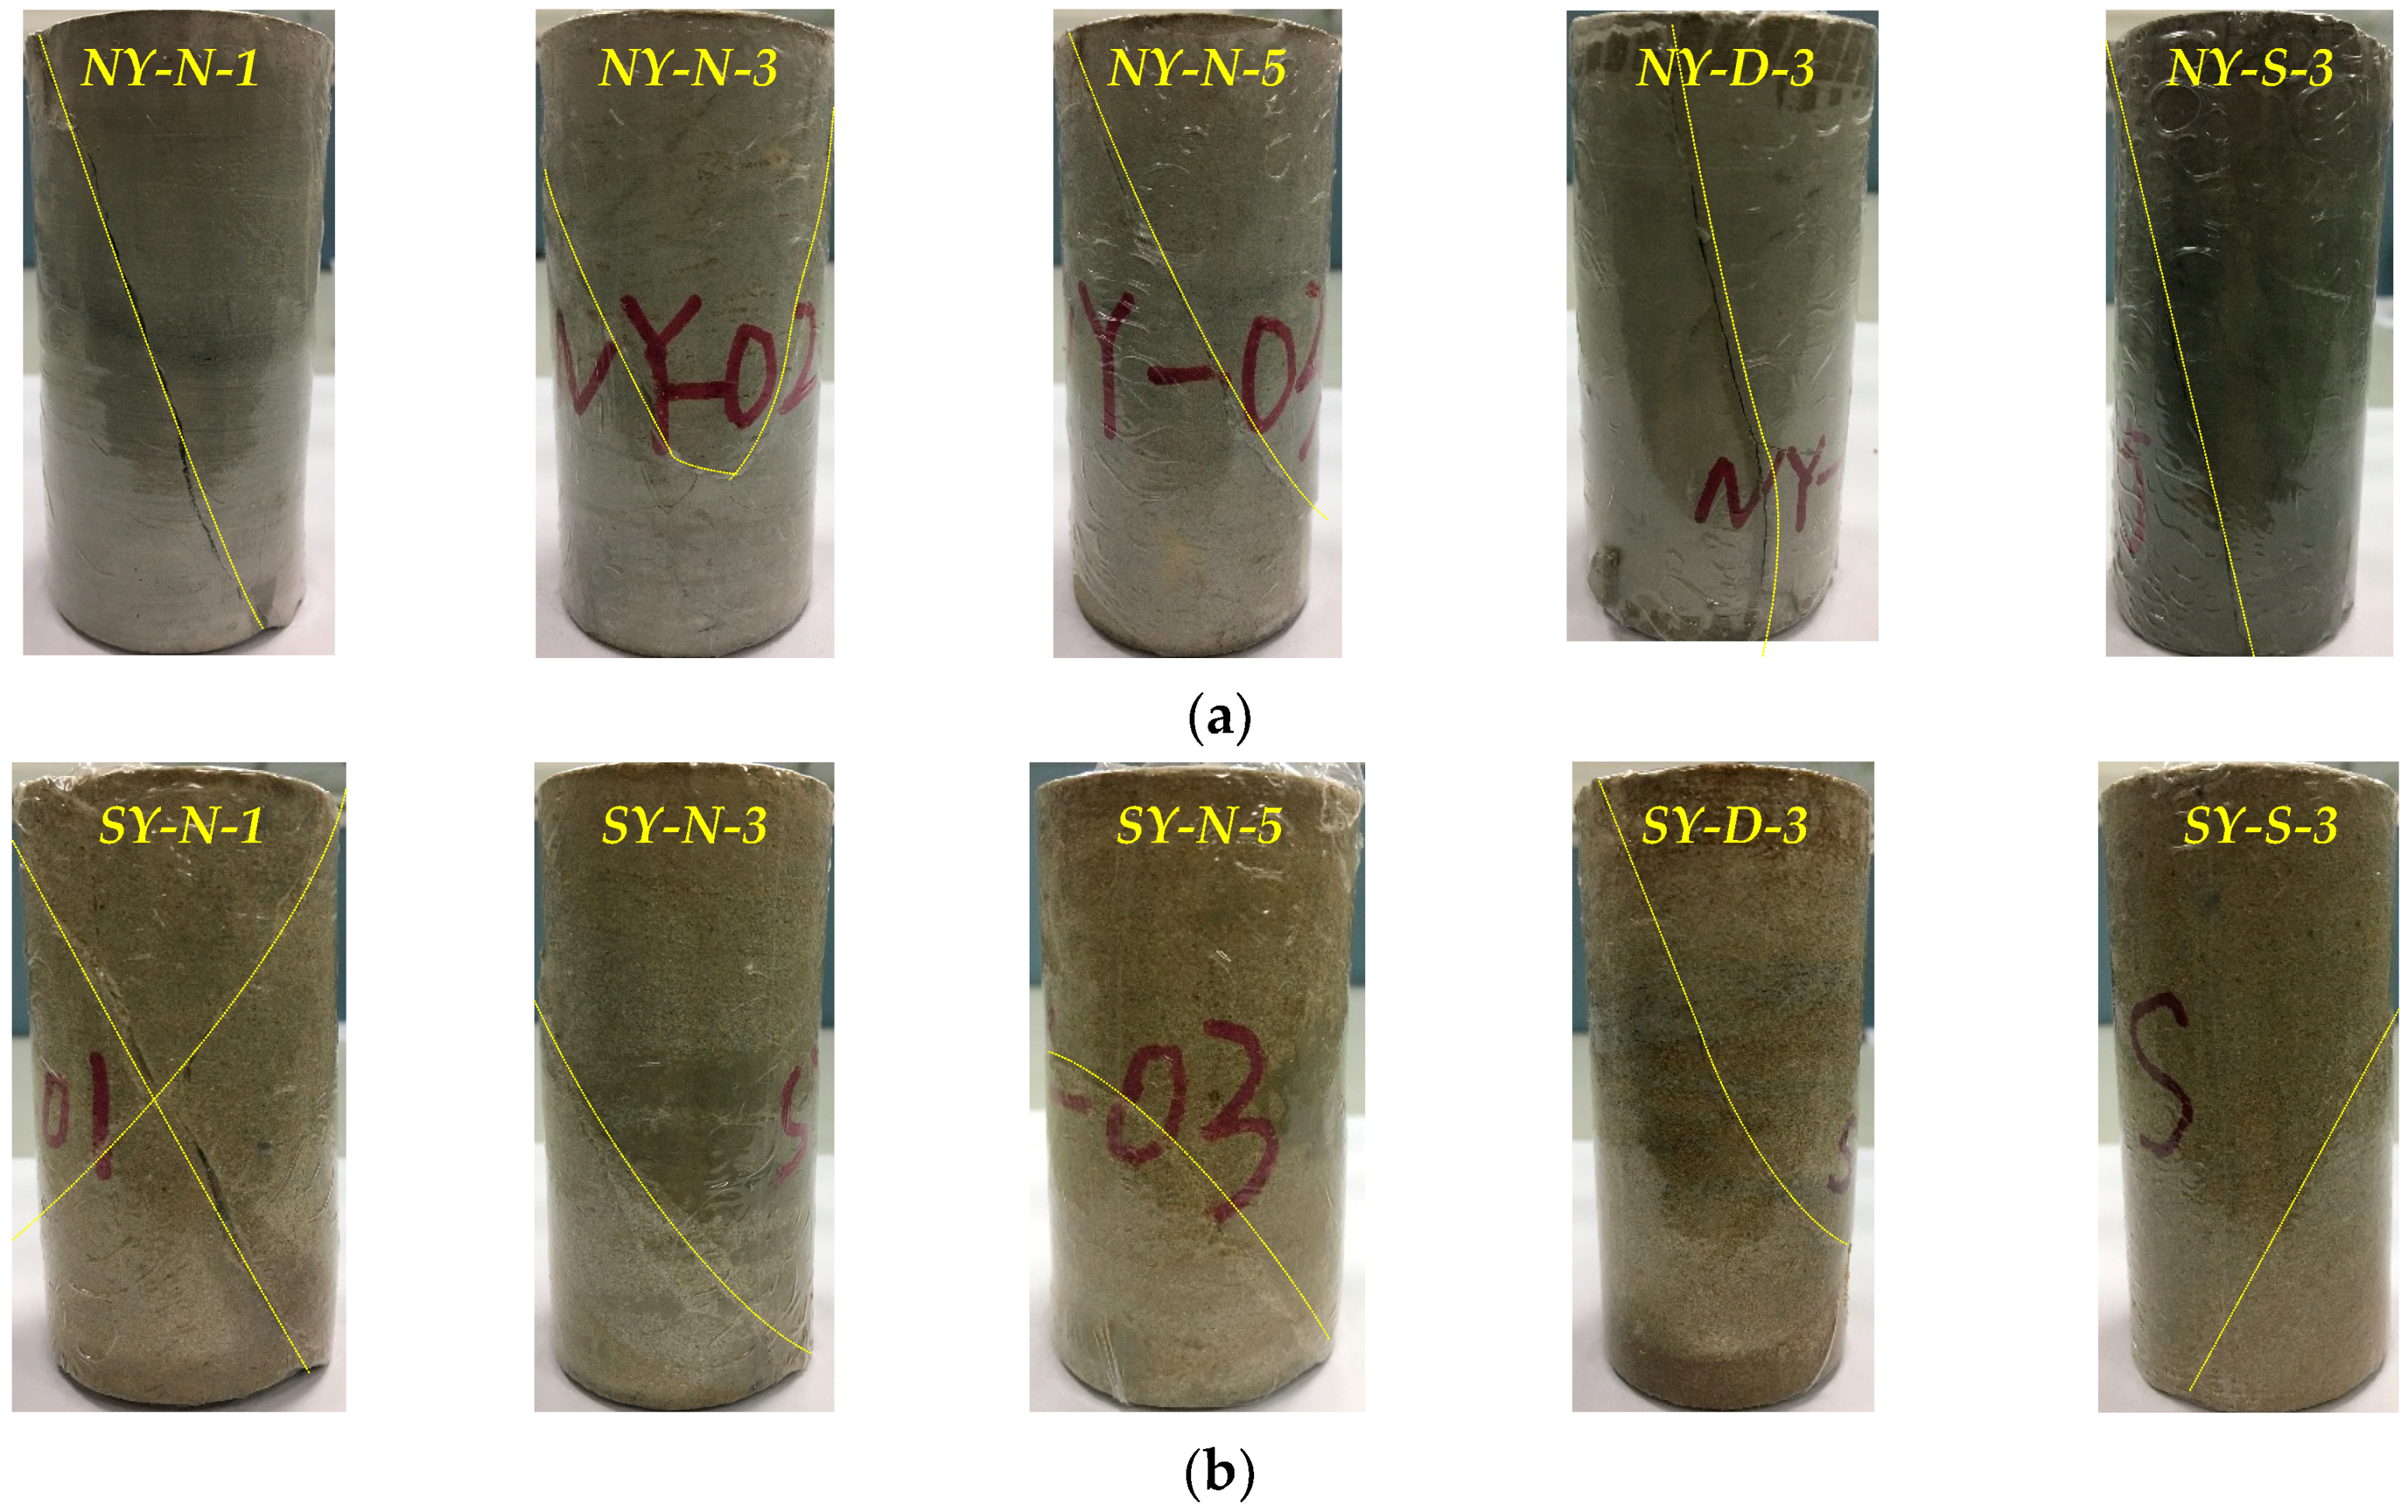
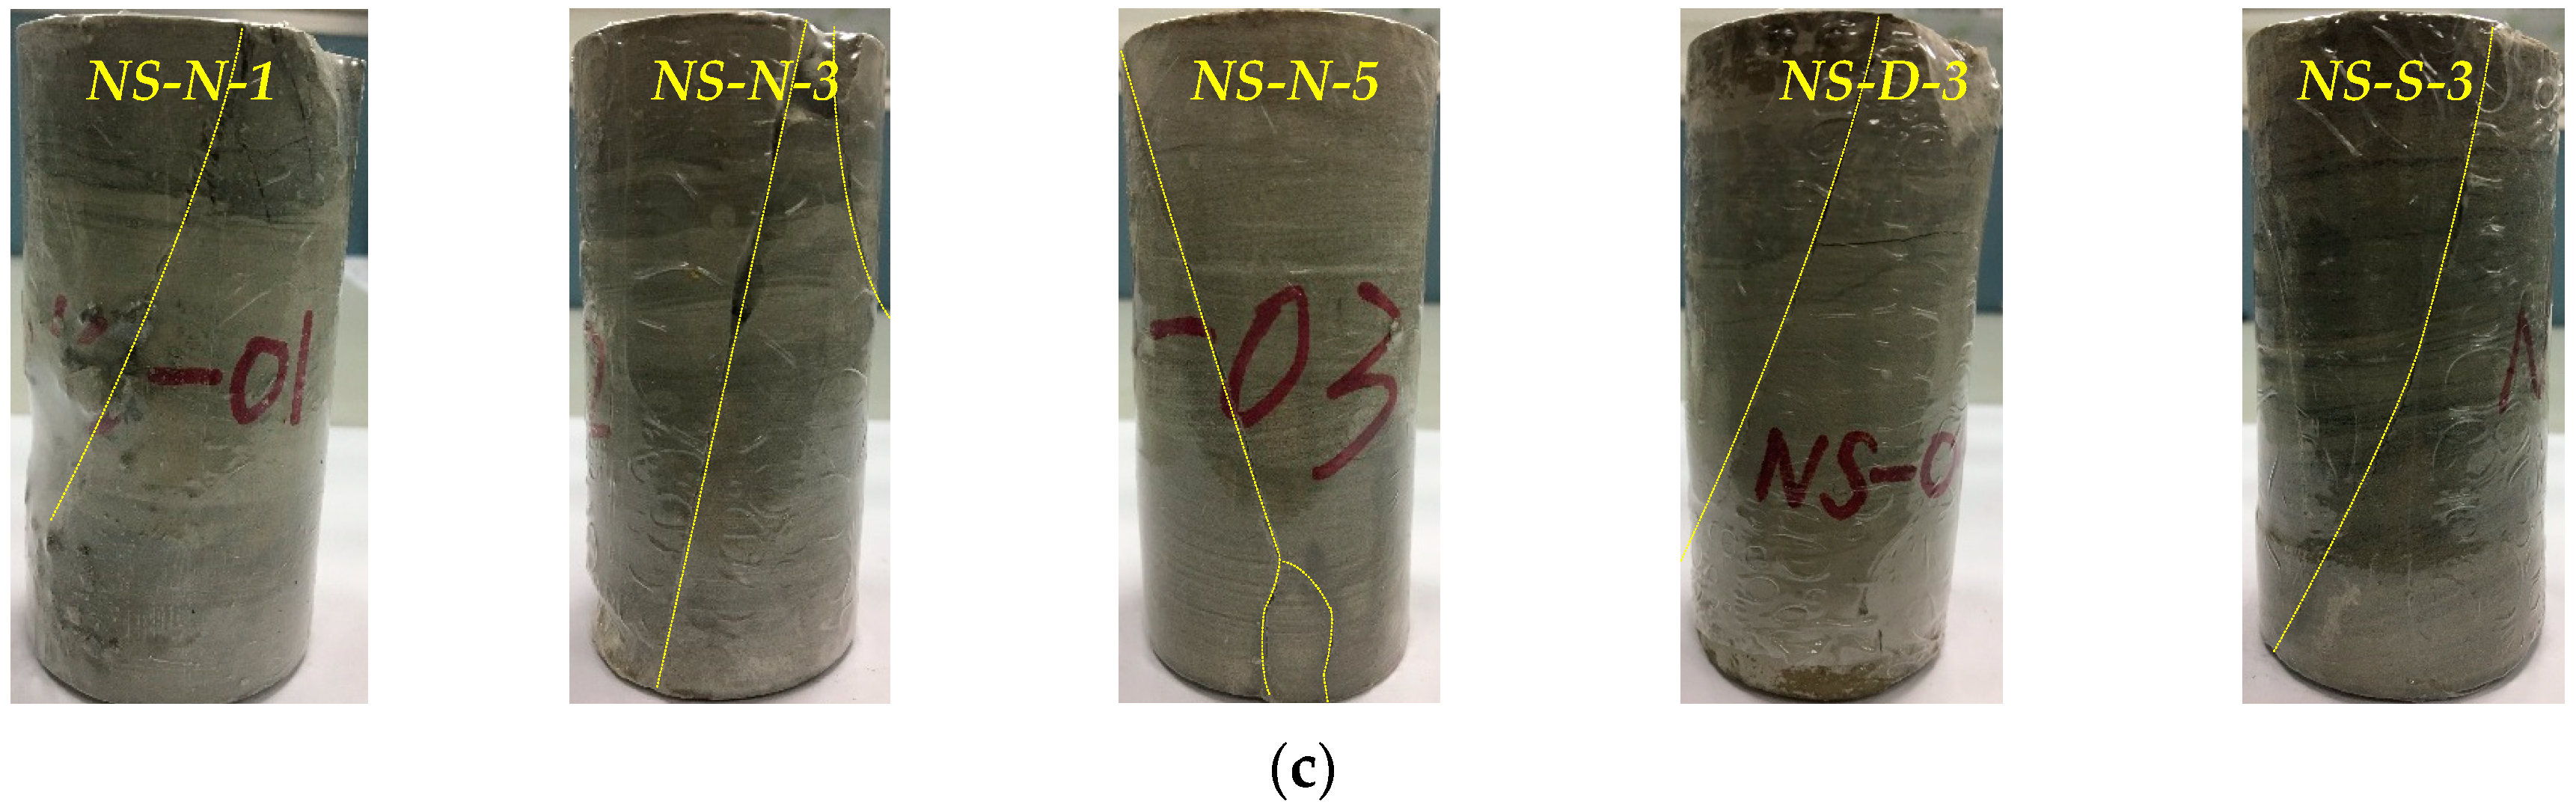
3.1.1. Failure Modes

Figure 4 presents the failure modes of all specimens with different moisture contents and confining pressures under tri-axial loading states. It is apparent that there is no significant difference in terms of the failure modes for each specimen. That is, all specimens experienced an obvious shear failure mode with a single crack as marked with a yellow line (see Figure 4). It is interesting that the sandstone under the low confining pressure (i.e., 1 MPa) as shown in Figure 4b presents a clear shear failure with X-shaped conjugate slope. However, with the increase of confining pressure, these mentioned X-shaped conjugate slope changes to single crack again owing to the effectiveness of confinement.

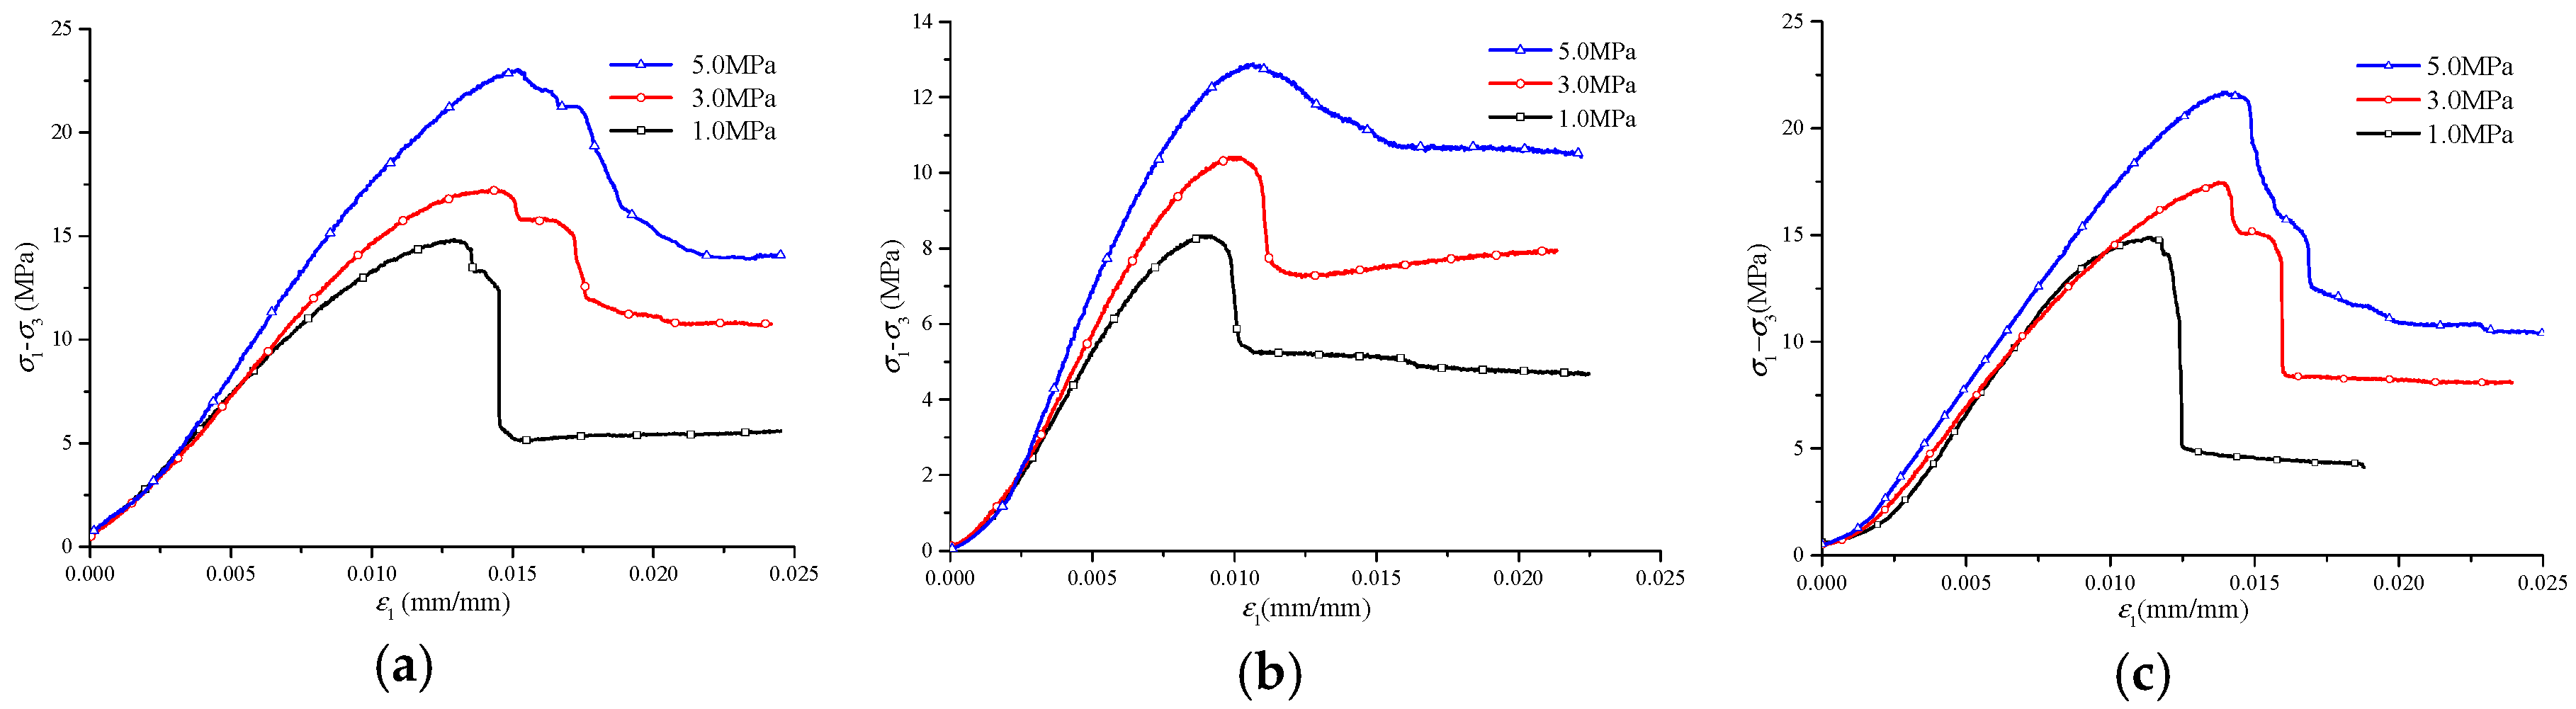
3.1.2. Stress-Strain Behavior

Axial stress-strain curves of all rock samples under tri-axial loading with different confining pressures are plotted in Figure 5, and the key results, including the peak stress, peak strain, residual stress, and elastic modulus, are all listed in Table 2. Herein, the peak strain is defined as the axial strain corresponding to the peak stress, which was averaged from two LVDTs covering the overall height of the rock samples. Residual stress is equivalent to the peak load of the sample divided by the cros-section when the test was prematurely terminated.
The only difference between the three rock samples from the same series presented in Figure 5 is the confining pressure (i.e., 1 MPa, 3 MPa, and 5 MPa). As mentioned earlier, these variable confining pressures were used to represent different stress states caused by mining activities while the constant moisture content (i.e., natural moisture) was accepted. It is obvious that the peak stress of these rock samples under in situ stress condition (i.e., equivalent 3.0 MPa presented herein) are 20.23 MPa (mudstone), 13.42 MPa (sandstone), and 20.47 MPa (sandy mudstone), indicating these weakly cemented rock samples are all with the low strength at in situ state (see Table 2).
It can also be found in Figure 5 that the confining pressure has a significant effect on the stress and deformation characteristics of these weakly cemented rock specimens. With the increase of confining pressure, the peak stress, residual stress, peak strain, and elastic modulus have been significantly enhanced. In particular, these rock samples show an obvious yield and plastic deformation behavior before the reach of peak stress. Once the peak stress was reached, the stress-strain curves showed a strain softening behavior with a descending branch. That is, the brittleness of the rock has been successfully changed and the ductility has been enhanced with sufficient confinement, the evidence of which is the apparent increase of axial strains shown in Figure 5 and Table 2.
The typical stress-strain curves of the rock sample with different moisture contents (i.e., natural moisture, dry and saturated state) are presented in Figure 6 and key results are listed in Table 2. In Figure 6, all specimens were under the constant confining pressure (i.e., 3MPa) to investigate the effect of the moisture content on the behavior of rock samples in in situ conditions. Similarly, the moisture content has a significant influence on the load carrying capacity and deformation characteristics of weakly cemented rocks. The peak stress, residual stress, peak strain, and elastic modulus of the rock decrease with increasing water content. The peak stress of mudstone, sandstone and sandy mudstone under dry state are 32.11 MPa, 19.58 MPa, and 28.92 MPa, respectively. Compared to these rock samples under dry state, the peak stress for these saturated samples decreased to 94.84%, 72.36%, and 87.67%, respectively.
Three typical rock samples all present a yield behavior and presents an enhanced ductility before the peak stress was reached as shown in Figure 6. However, the effect of water content on the brittle-ductile characteristics is different. In detail, the ductility of mudstone experienced an obvious enhancement with the increase of water content. However, the ductility of the sandstone and sandy mudstone were significantly weakened with the increase of water content. In particular, the brittleness of sandy mudstone is much more obvious.

3.2. Effect of Confining Pressure

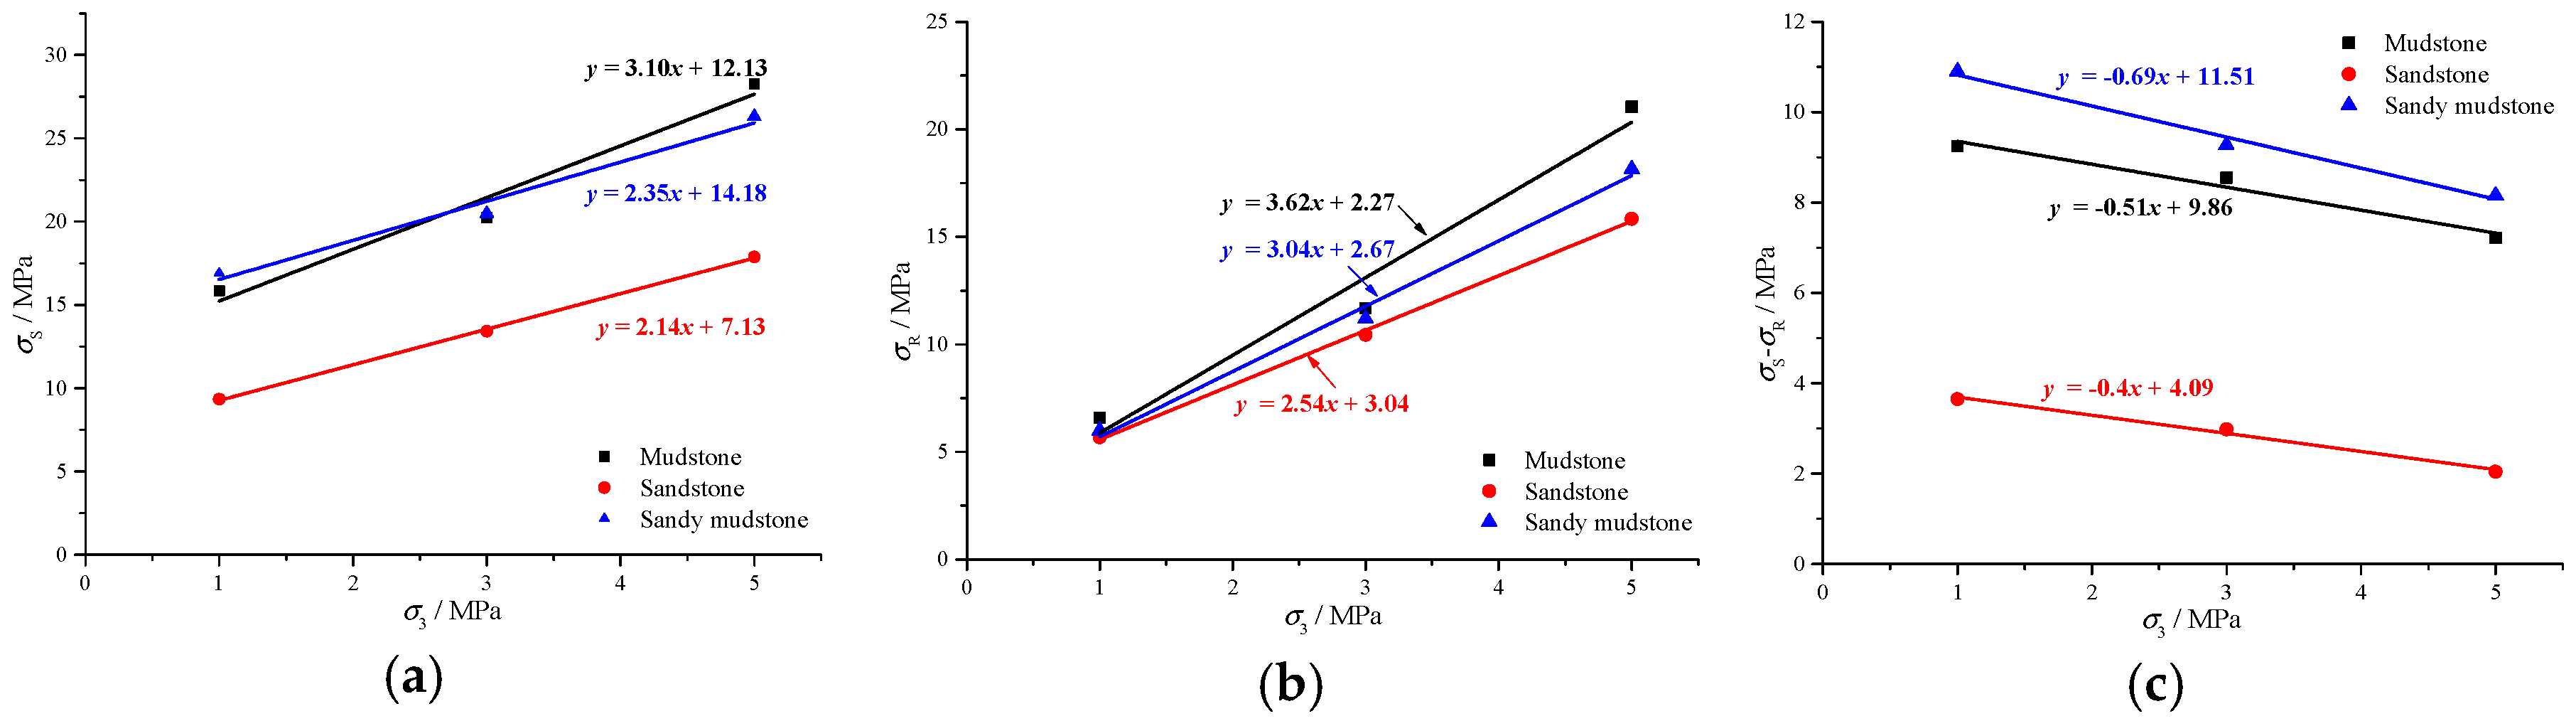
3.2.1. Sensitivity Coefficient of Confining Pressure (kc)

In this section, the peak stress (σS), residual stress (σR) and the difference between peak stress and residual stress (σC) have been plotted in the same coordinate system for further comparison. It is obvious in Figure 7 that both the peak stress and residual stress of weakly cemented rocks shared a similar increase with the increase of confining pressure. Whereas, the difference between peak stress and residual stress experienced an opposite trend, showing that the difference between peak stress and residual stress decreased with the confining pressure.
To further investigate the effect of confining pressure on the behavior of weakly cemented rock, the sensitivity coefficient (kC) has been recently proposed based on the linear correlation between the peak stress and residual stress, as shown in Figure 7. In detail, the slope of the fitted line reflects the effect of confining pressure on different stress. Correspondingly, three coefficients can be obtained according to following equations, in which kCS, kCR, and kC(SR) represent the sensitivity of peak stress, residual stress and the difference between peak stress and residual stress on confining pressure, respectively.
k C S = σ S 2 σ S 1 σ C 2 σ C 1
k C R = σ R 2 σ R 1 σ C 2 σ C 1
k C ( S R ) = ( σ S 2 σ R 2 ) ( σ S 1 σ R 1 ) σ C 2 σ C 1 = k C S k C R
As shown in Figure 7, the peak stress and residual stress of mudstone are much more sensitive to confining pressure compared to sandy mudstone, followed by the sandstone according to the value of the defined sensitivity coefficient (kC). Another interesting observation from the fitted lines is that kCS is smaller than kCR, indicating that the sensitivity of the peak stress of weakly cemented rock is not more obvious than that of the residual stress for confining pressure. Different from the above discussion, the sensitivity coefficient of the difference between peak stress and residual stress, kC(SR) which is negative, represents that the value of kC(SR) decreases with the increase of confining pressure. Compared to sandstone, the difference between peak stress and residual stress of sandy mudstone is much more sensitive to confining pressure, followed by sandstone.

3.2.2. Transfer Confining Pressure (σT)

Since the residual stress is much more sensitive to confining pressure than that of the peak stress, as pointed out earlier, these three fitted lines shown in Figure 7c will be intersected with X axis (i.e., confining pressure) if the confining pressure increases to some extent. Correspondingly, the peak stress at this intersection point will be equal to the residual stress. As a result, the confining pressure at this point is defined as the transfer confining pressure (σT). On the other hand, the intersection point is also the threshold for the behavior of brittleness to ductility [17]. In detail, if the confining pressure applied to the rock sample is smaller than the transfer confining pressure, the stress-strain curve will show obvious strain softening behavior. By contrast, the stress-strain curve will exhibit a strain hardening behavior.
According to the aforementioned determination of the transfer confining pressure, the estimated value of σT for mudstone (19.33 MPa), sandy mudstone (10.23 MPa) and sandstone (16.68 MPa), as shown in Figure 7c, can be found. It should be noted that the estimated value of σT will be affected by various factors, including the mineral component and moisture content. In addition, due to the lack of database to clarify the effect of confining pressure on the difference between the peak stress and residual stress, further investigation should be, therefore, conducted to obtain the acceptable value of σT.

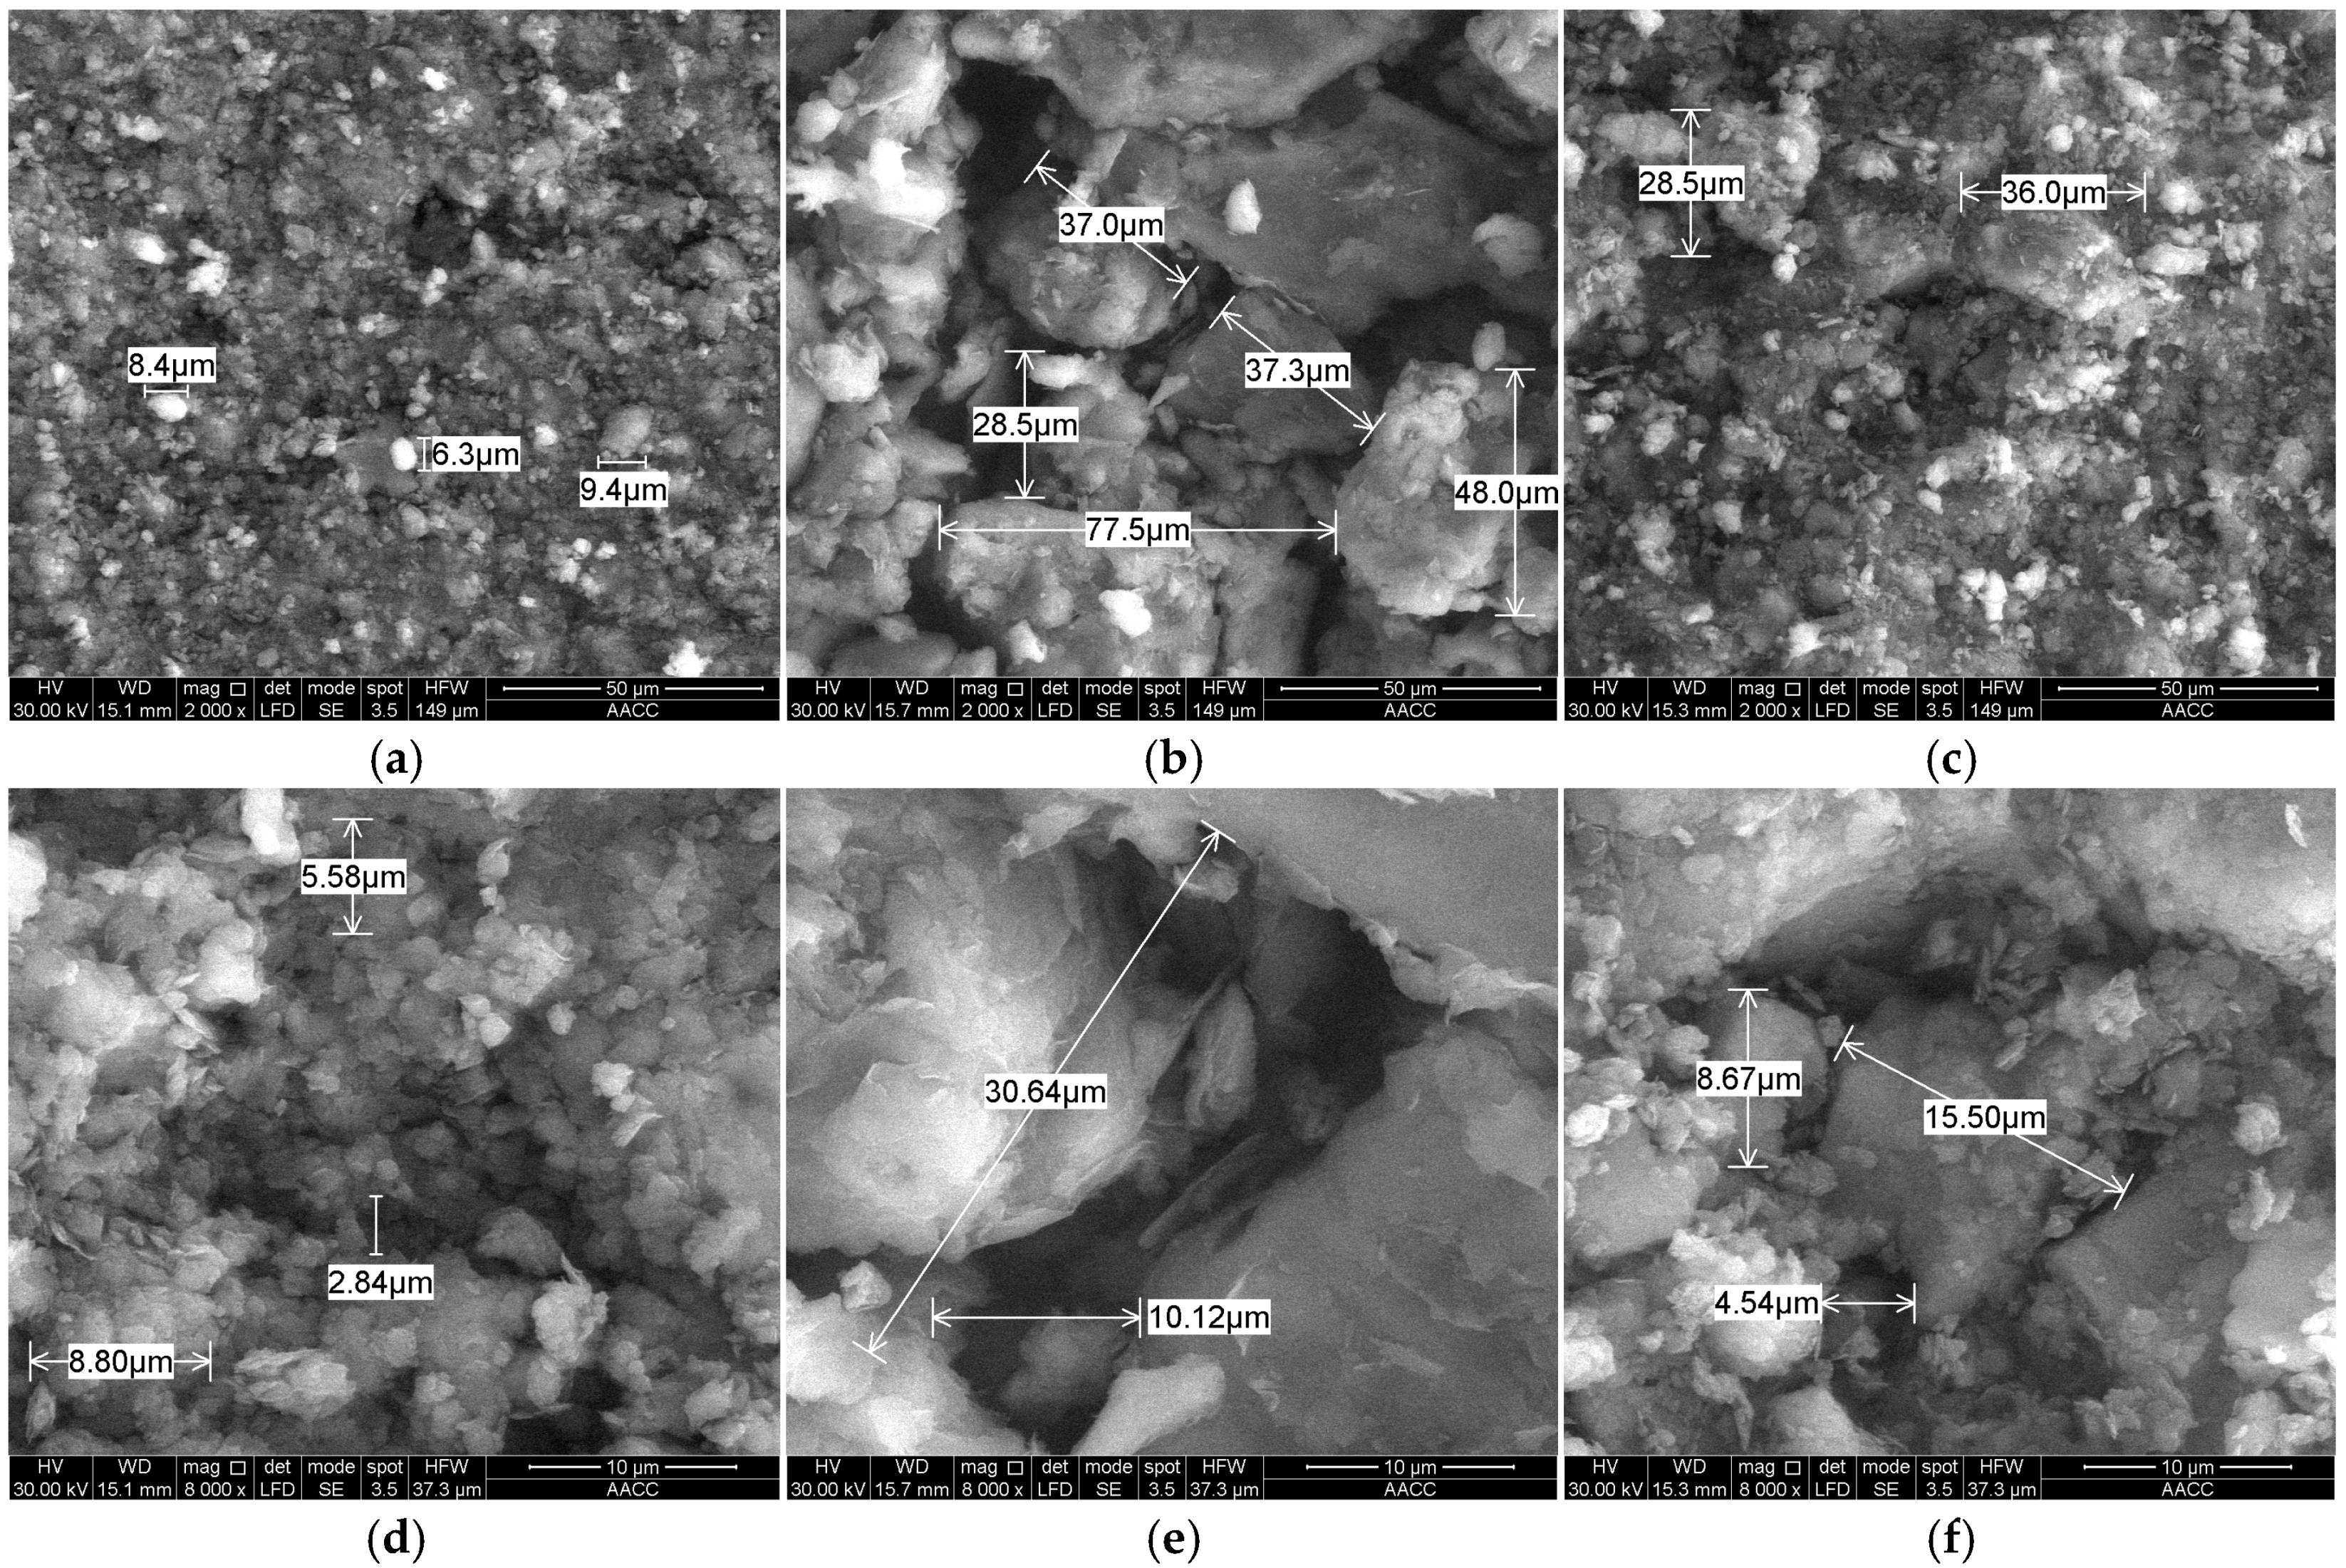
3.2.3. Comparison in Microstructures

Figure 8 shows the microstructure of typical rock samples through the scanning electron microscopy (SEM Quanta 250) testing method. It is apparent that the internal structure of the mudstone is dense and there is no obvious pores and voids, as shown in Figure 8a, while the particles of sandstone with loose internal structure and various visible voids are disorderly distributed (see Figure 8b). Different from mudstone and sandstone, the internal structure of the sandy mudstone is relatively tight with a certain particle size (see Figure 8c). When the magnified scale increases from 2000 times to 8000 times, it can be found in Figure 8d that the particles of mudstone are uniformly distributed by the mud crystal particles with a small particle size (less than 10 μm). The voids between particles are fully filled with flocculent Imon, and flaky kaolinite. The sandstone is mainly composed of the particle size. As shown in Figure 8e, a small amount of flocculent Imon mixed layer can be seen in the voids between the powder particles with the approximate size of 20 μm. The small particles of sandstone are weakly cemented due to the existing of various voids and cracks, while the sandy mudstone shown in Figure 8f is composed of mud crystals and powder particles, filled with the mixture of flaky kaolinite and flocculent ionic mixture around the small cracks.
It has been well established that the mechanical behavior of porous rock material is closely relevant to its particle size, porosity, and cementation [18,19,20,21,22,23]. From the cementation aspect, the cementation of sandstone presented in this research is much worse than that of mudstone and sandy mudstone, resulting in its worse mechanical behavior as presented earlier. For these rock materials with large porosity, the effect of particle size is not strong enough, and this effect will decrease with the value of porosity as well. As compared in Figure 8, it can be concluded that for porosity sandstone, the effect of confining pressure mainly depends on the cementation state and the value of porosity. Whereas, the particle size is believed to be the main factor to be considered for sandstone mudstone and mudstone with a similar cementation state and low porosity.

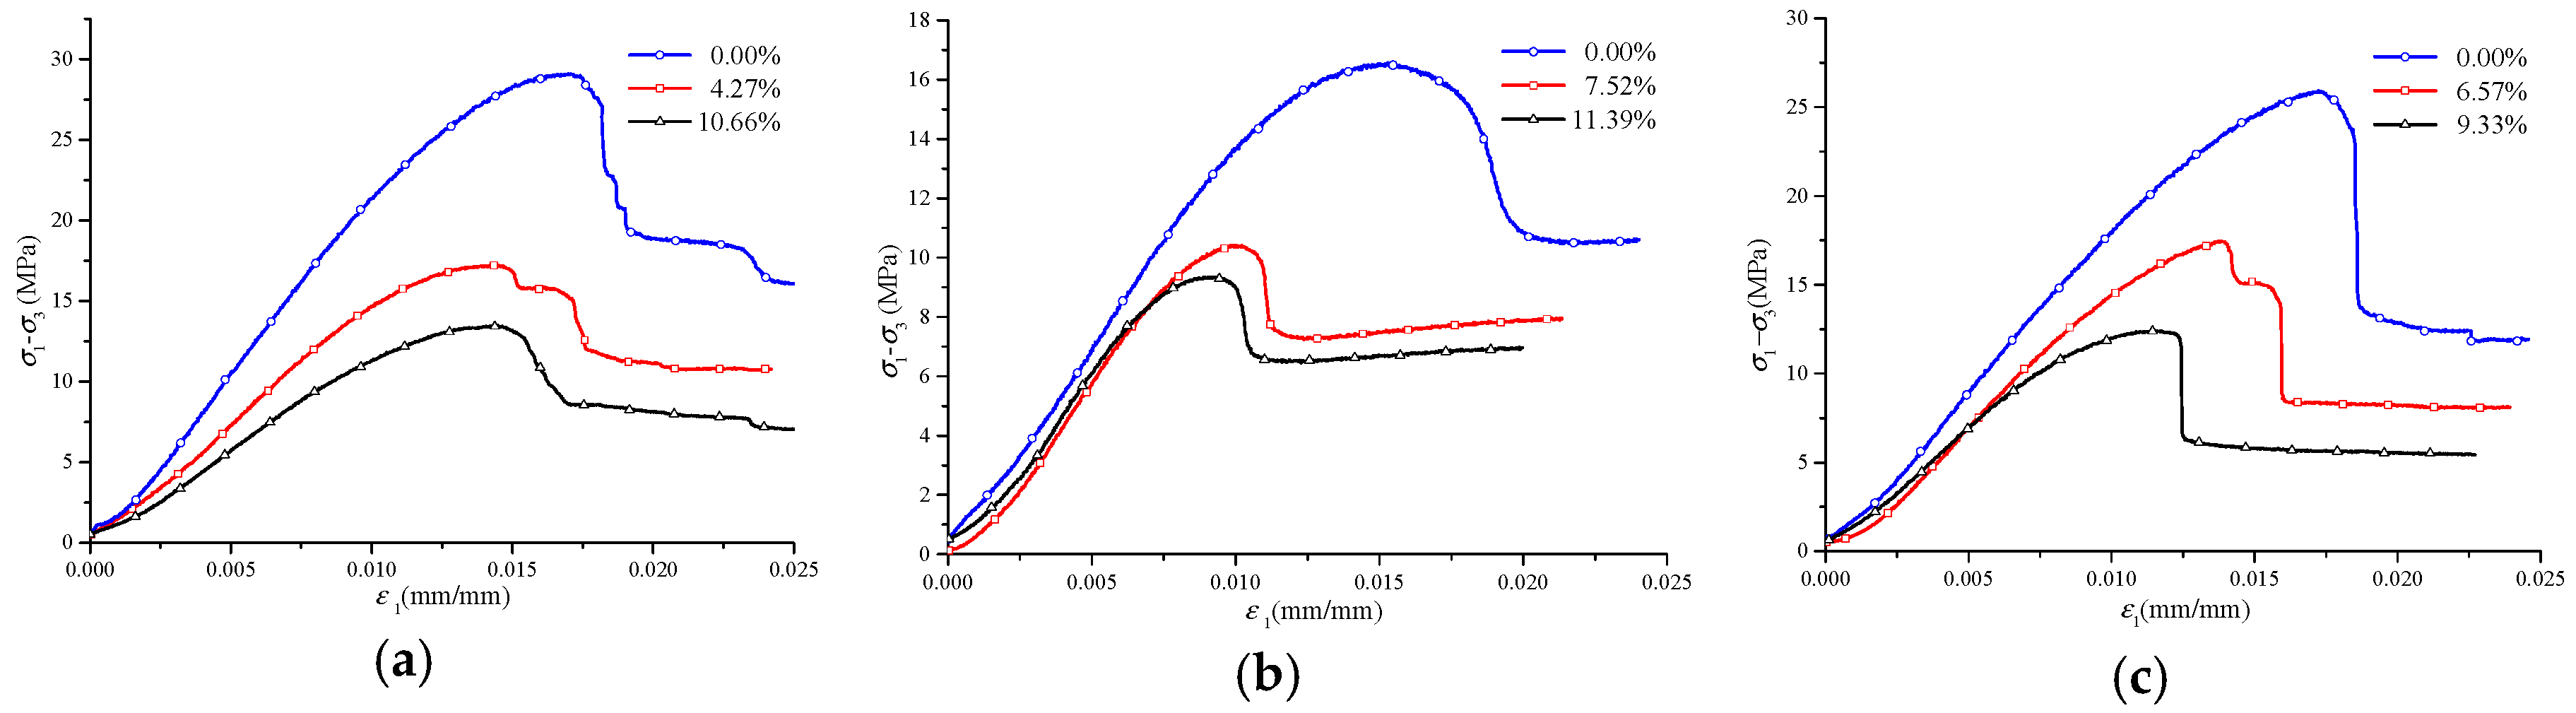
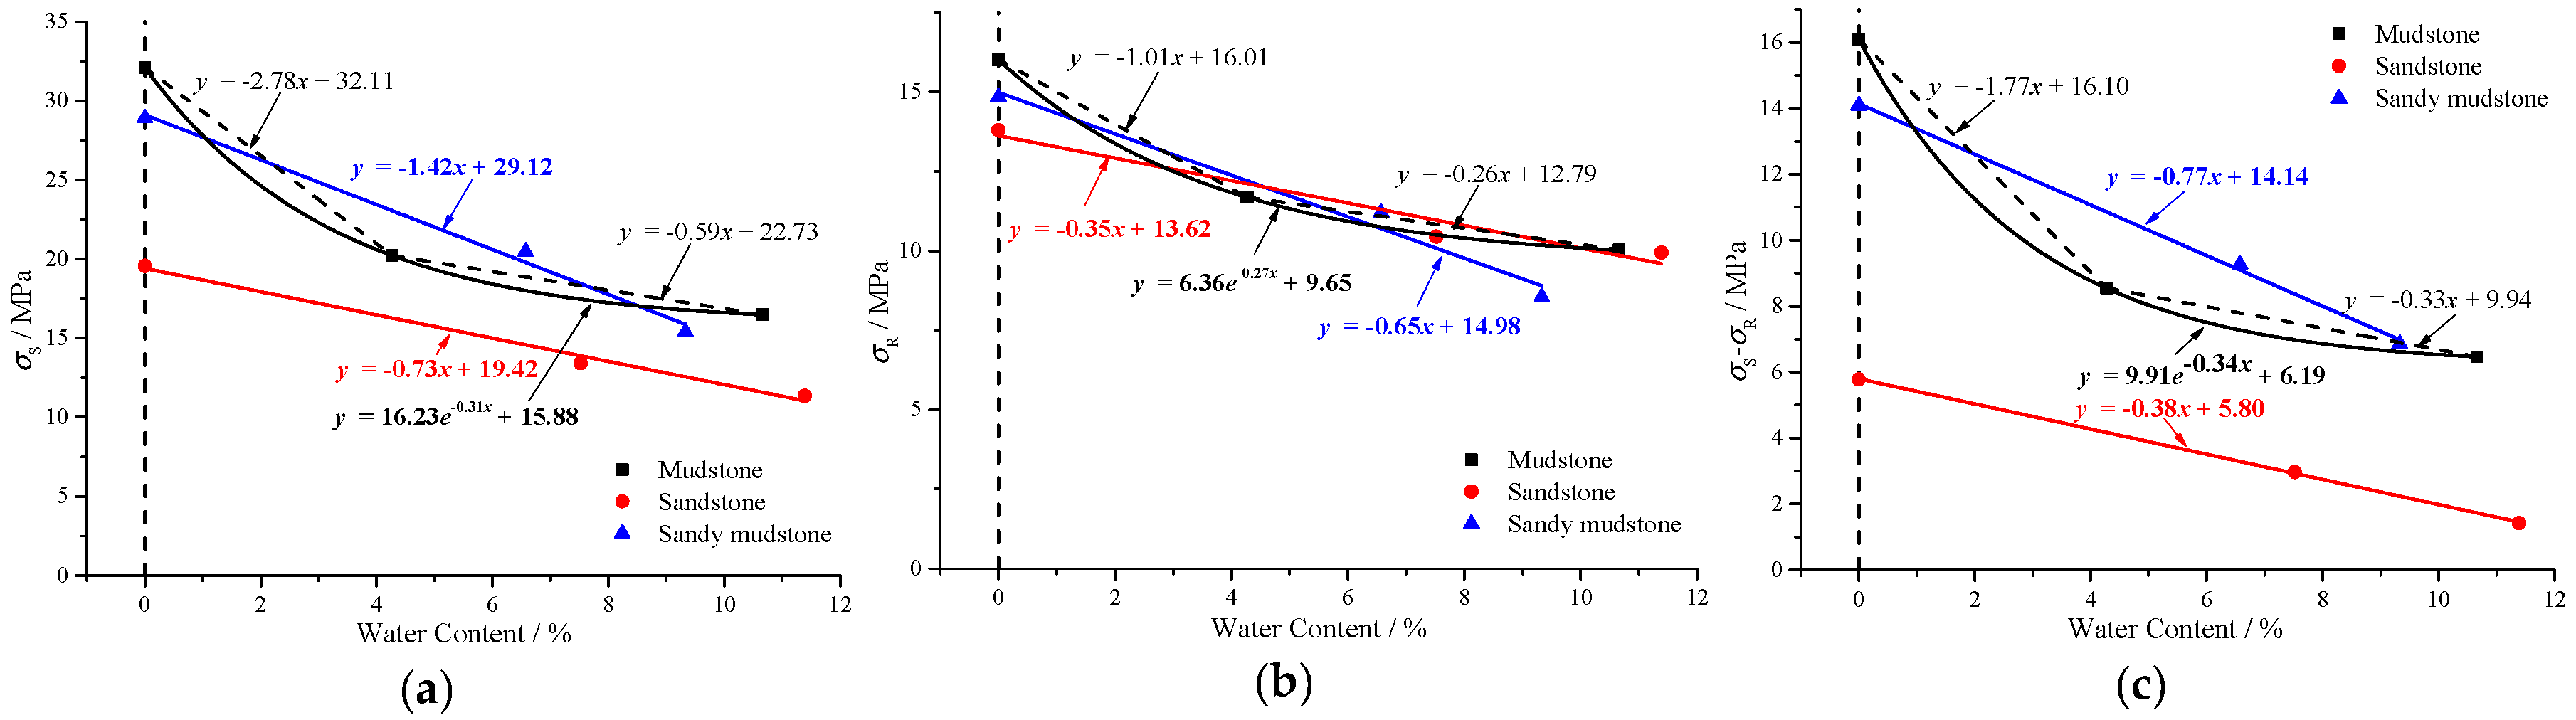
3.3. Effect of Moisture Content

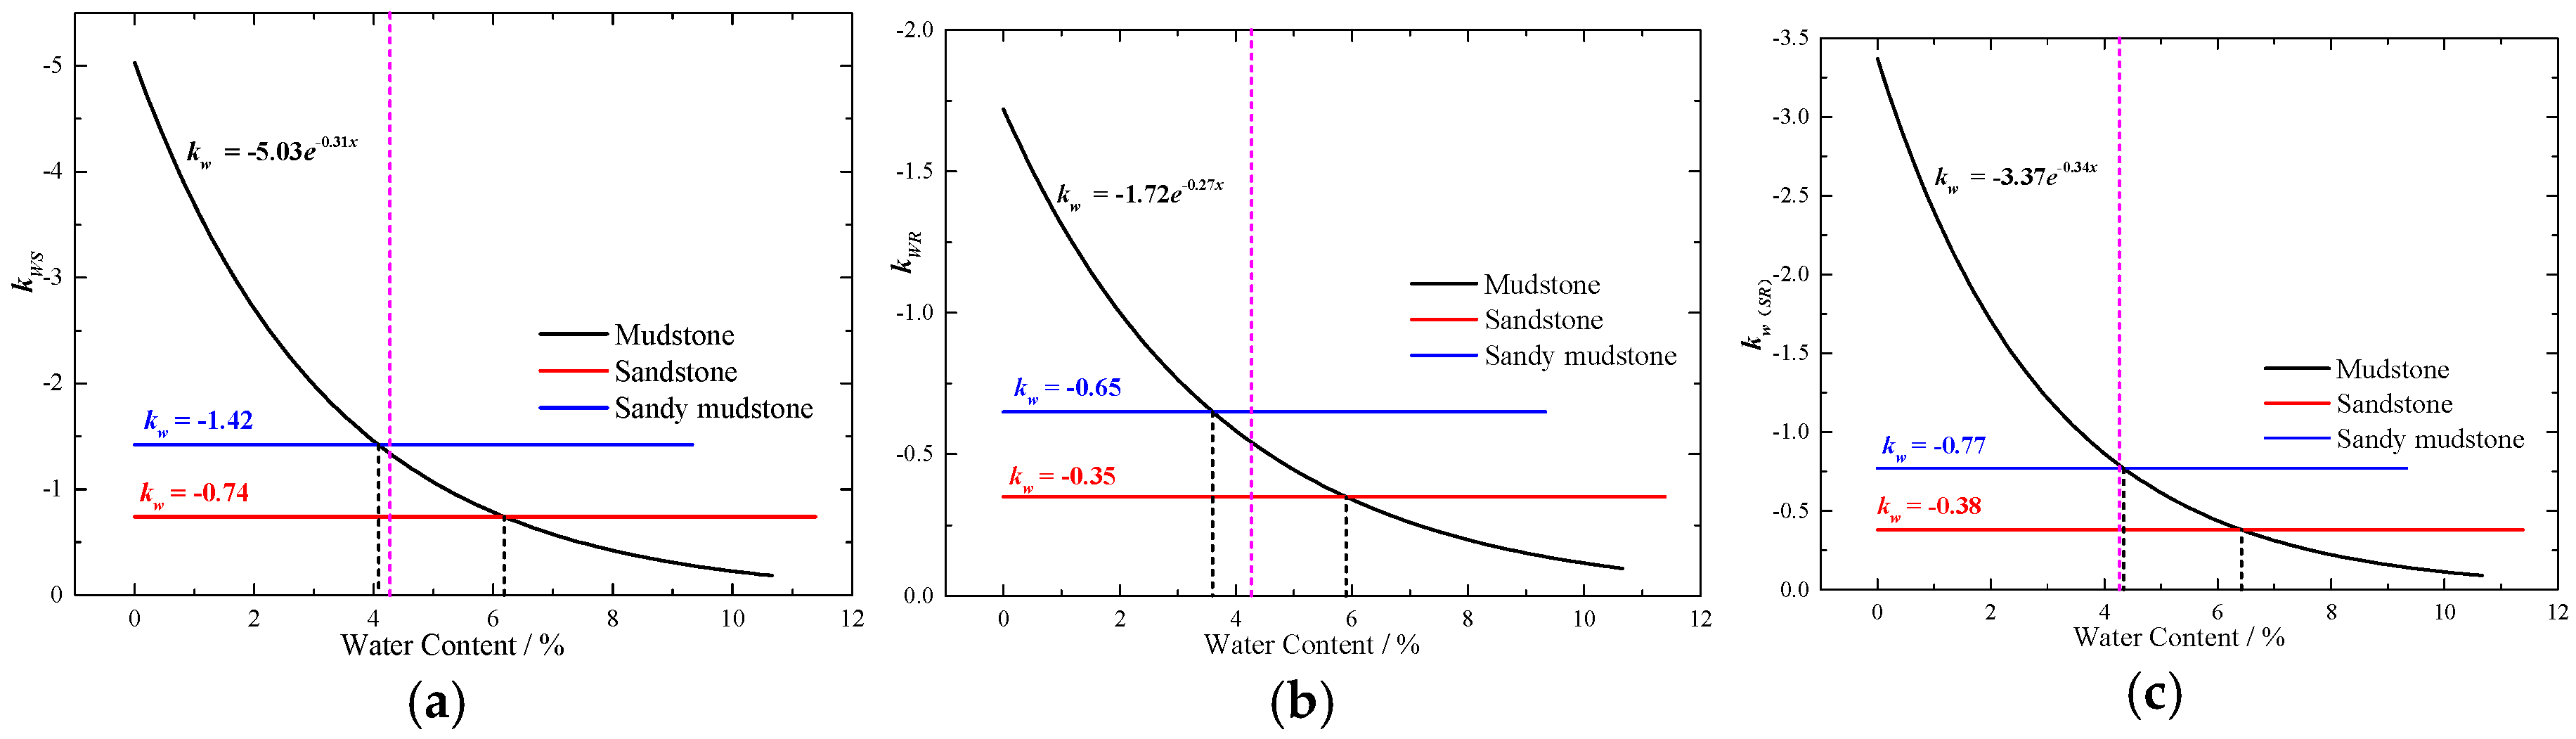
3.3.1. Sensitivity Coefficient of Moisture Content (kw)

Herein, the peak stress (σs), residual stress (σR) and the difference between peak stress and residual stress (σc) of rock samples with different moisture contents have been plotted in the same coordinate system again, for further comparison. It can be seen from Figure 9 that with the increase of water content, the linear correlation between peak stress, residual stress, and peak residual stress of sandstone and sandy mudstone is significantly obvious, while mudstone presents a negative exponential function. The slope of the fitted line reflecting the effect of the influence caused by moisture content on the mechanical behavior of weakly cemented rock has been defined as the sensitivity coefficient of moisture content (kW). The sensitivity coefficient of moisture content for peak stress, residual stress and the difference between peak stress and residual stress are termed as kWS, kWR, and kW(SR), respectively. The sensitivity coefficient of moisture can be theoretically calculated by the following equations, in which w is the measured moisture content, as indicated in Table 1.
k W S = σ S 2 σ S 1 w 2 w 1
k W R = σ R 2 σ R 1 w 2 w 1
k W ( S R ) = ( σ S 2 σ R 2 ) ( σ S 1 σ R 1 ) w 2 w 1 = k W S k W R

3.3.2. Moisture Migration Procedure

As shown in Figure 10, the value of the sensitivity coefficient of mechanical parameters with respect to moisture content can be regarded as a constant parameter for sandstone and sandy mudstone. The negative exponential relationship between moisture content and mechanical behavior lead to a decrease of kw with the increase of moisture content.
It is well known that both the nonuniform distribution of underground coal water and mining activities will change the moisture content for weakly cemented rock. Herein, two situations in terms of the moisture migration that occurred in practical applications are selected for further discussion. When the moisture content decreases owing to the loss of water from the rock mass, the peak stress, residual stress and residual stress of mudstone are most sensitive to the moisture content compared to sandy mudstone, followed by sandstone. While the moisture content changes from a natural state to a saturated state, the peak stress and residual stress of sandstone become much more sensitive to moisture content compared to mudstone and sandy mudstone.

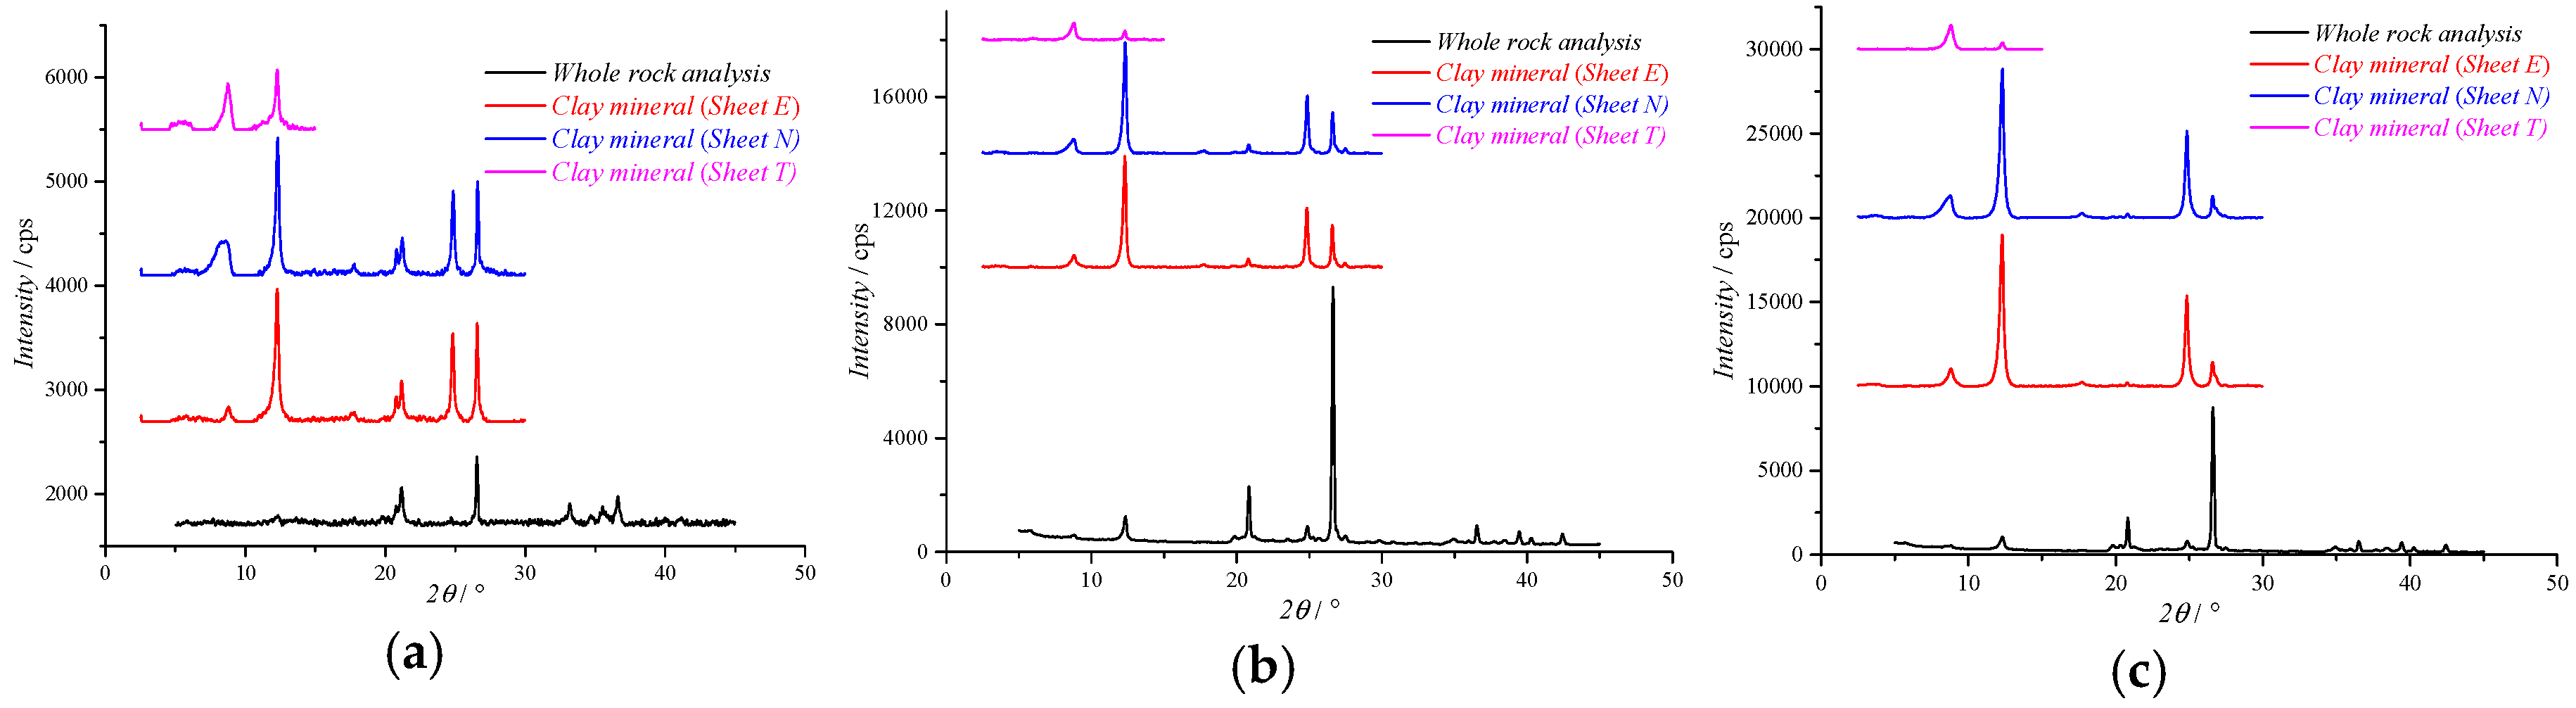
3.3.3. Comparison of Mineral Components

In general, the mineral components of in situ rock mass are constant with natural moisture content. However, either the drying or saturation procedure will change its mineral components, resulting in the difference in terms of mechanical behavior. The mineral components and the contents of these three typical rock samples are, therefore, determined by an X-ray diffractometer (D8 ADVANCE) in accordance with SY/T5163-2010 [24]. The “K value” evaluation method was adopted based on the whole rock analysis in the present study. Since the XRD is a semi-quantitative analysis method, herein, the relative content of each clay mineral was determined by the subtraction of the diffraction peak area under three different conditions (i.e., untreated sample, treated sample by ethylene glycol, and heated sample). Correspondingly, these three conditions are termed as Sheet N, Sheet E, and Sheet T, as shown in Figure 11. The detailed results obtained from XRD test are presented in Figure 11 and Table 3, respectively. The main diagenetic minerals of these rock samples are quartz and clay minerals, the only difference between them is the observation of potassium feldspar in sandstone and sandy mudstone.
Even though the diagenetic mineral types are nearly the same, the difference in terms of the component content is significant. In particular, the contents of clay minerals in mudstone, sandstone, and sandy mudstone are 71%, 25%, and 36%, respectively. To better understand the composition of these clay minerals, the clay minerals were collected and tested again to determine the content of a single component (i.e., Illite, kaolinite, and Illite-smectite mixed-layer). According to the further test, it has been found that the relative content of kaolinite in mudstone, sandstone, and sandy stone occupied about 43%, 69%, and 69%, respectively, while the contents of Illite-smectite mixed-layer (I/S) are 49%, 18%, and 19%. As a result, it can be easy to obtain the contents of kaolinite in mudstone, sandstone, and sandy mudstone, which are 31%, 17% and 25%, respectively. Meanwhile, the content of Illite-smectite mixed-layer (I/S) accounts for 35%, 5%, and 7% for mudstone, sandstone, and sandy stone. More detailed information can be found in Table 3.
Compared with mudstone and sandstone thorough the XRD and SEM tests, as shown in Figure 11 and Figure 8, it can be found that the porosity of the former is relatively small, however, the content of clay mineral component is much higher and vice versa. It is interesting that both the mineral components and microstructure of sandy mudstone are in the middle of mudstone and sandstone. It is believed that the extra water from the external surroundings will immediately combine with these clay minerals (i.e., kaolinite, Illite, and montmorillonite), resulting in serious deterioration of their microstructure. The sensitivity to moisture content of these rocks with a high content of clay minerals will decrease with the moisture content. On the other hand, the external water in sandstone due to the increase of moisture content is mainly in the form of pore water, the lubrication effect of pore water on the surface of powder crystal particles leads to the increase of strength. That is, for these rock samples with low content of hydrophilic minerals, the sensitivity of water content is mainly dependant on the porosity rather than others. In other words, the greater the porosity is the weaker the sensitivity of water content presents.

4. Conclusions

This paper presents systematic tri-axial compression tests on three typical weakly cemented rocks (i.e., mudstone, sandstone, and sandy mudstone) with different moisture contents (i.e., natural state, drying state, and saturated state) to simulate the real geological conditions and loading state affected by mining activities. Scanning electron microscopy (SEM) testing and X-ray diffractometer (XRD) testing have been conducted to better understand the sensitivity of mechanical behavior on confining pressure and moisture content on the mechanical behavior of rock samples. According to the systematic experiments and theoretical analysis, the following conclusions can be drawn:
  • The mechanical behavior of weakly cemented rock samples under tri-axial is generally correlated with confining pressure. Among them, mudstone is much more sensitive to confining pressure compared to sandstone, followed by sandy stone. It should be noted that the residual stress of weakly cemented rock is much more sensitive to confining pressure rather than the peak stress.
  • The peak stress of three types of rock samples decreases with the increase of water contents. When the moisture content decreases due to the loss of water from the rock mass, the peak stress, residual stress and residual stress of mudstone are most sensitive to the moisture content compared to sandy mudstone, followed by sandstone. While the moisture content changes from a natural state to a saturated state, the peak stress, residual stress, and residual stress of sandstone becomes to be much more sensitive to moisture content, compared to mudstone and sandy rock.
  • The effect of confining pressure mainly depends on the cementation state and porosity for weakly cemented rocks. When the rock cementation state is similar, the effect of particle size will be much more significant than other parameters. However, for the specimens with a high content of clay mineral components, the effect of moisture content plays a critical role owing to the deterioration while the reaction between water and hydrophilic mineral occurs.
Since that the main objective of this research is to investigate the effect of confining pressure and moisture content on weakly cemented rocks, the relationship between mineral components and microstructure and compressive behavior of weakly cemented rock under tri-axial loading states has successfully provided a guideline for the application of water-preserved mining technology in Ili mining area. However, it is still necessary to carry out a series of experimental tests to enrich the database by using more variable confining pressure and moisture contents for the setting up of a more reliable theoretical model for prediction.

Author Contributions

Conceptualization, H.L. and D.Z.; formal analysis, H.L. and H.Z.; investigation, H.L. and H.Z.; writing—original draft preparation, H.L., D.Z. and W.Y.; writing—review and editing, H.L. and M.C.; supervision, H.L. and D.Z.

Funding

The research was financially supported by the Research Projects of Autonomous Region Universities (No. XJEDU2017M008), the National Basic Research Program of China (2015CB251600), the Natural Science Foundation of Xinjiang Uyghur Autonomous Region (2019D01C023) and the National Natural Science Foundation (51264035).

Acknowledgments

The authors would like to express their grateful thanks to Ili NO4 coal mine for their continuous support in terms of the collection of rock samples and extend their thanks to technical staffs for their warm help during the preparation of rock samples.

Conflicts of Interest

The authors declare no conflict of interest.

References

  1. Zhang, D.S.; Liu, H.L.; Fan, G.W.; Wang, X.F. Connotation and prospection on scientific mining of large Xinjiang coal base. J. Min. Saf. Eng. 2015, 32, 1–6. [Google Scholar]
  2. Zhang, D.S.; Fan, G.W.; Ma, L.Q.; Wang, X.F. Aquifer protection during longwall mining of shallow coal seams: A case study in the Shendong Coalfield of China. Int. J. Coal Geol. 2011, 86, 190–196. [Google Scholar] [CrossRef]
  3. Zhang, D.S.; Fan, G.W.; Liu, Y.D.; Ma, L.Q. Field trials of aquifer protection in longwall mining of shallow coal seams in China. Int. J. Rock Mech. Min. Sci. 2010, 47, 908–914. [Google Scholar] [CrossRef]
  4. Wang, W.M.; Zhao, Z.H.; Wang, Y.J.; Gao, X. Failure Behavior and Constitutive Model of Weakly Consolidated Soft Rock. Sci. World J. 2013, 2013, 758750. [Google Scholar] [CrossRef] [PubMed]
  5. Wang, W.M.; Zhao, Z.H.; Wang, L. Elastic-plastic damage analysis for weakly consolidated surrounding rock regarding stiffness and strength cracking. J. Min. Saf. Eng. 2013, 30, 679–685. [Google Scholar]
  6. Nguyen, V.H.; Gland, N.; Dautriat, J.; David, C.; Wassermann, J.; Guélard, J. Compaction, permeability evolution and stress path effects in unconsolidated sand and weakly consolidated sandstone. Int. J. Rock Mech. Min. Sci. 2014, 67, 226–239. [Google Scholar] [CrossRef]
  7. You, S.; Ji, H.G.; Wang, T.; Song, C.Y. Thermal and mechanical coupling effects on permeability of weakly cemented sandstone. Emerg. Mater. Res. 2018, 7, 100–108. [Google Scholar] [CrossRef]
  8. Zheng, H.; Feng, X.T.; Hao, X.J. A creep model for weakly consolidated porous sandstone including volumetric creep. Int. J. Rock Mech. Min. Sci. 2015, 78, 99–107. [Google Scholar] [CrossRef]
  9. Erguler, Z.A.; Ulusay, R. Water-induced variations in mechanical properties of clay-bearing rocks. Int. J. Rock Mech. Min. Sci. 2009, 46, 355–370. [Google Scholar] [CrossRef]
  10. Zhao, Y.C.; Yang, T.H.; Xiao, F.K.; Wang, H.; Liu, G.; Zheng, X.; Zhou, J.R.; Shen, Z.L. The variation law of plastic strain energy of western weak cemented sandstone during cyclic loading experiment. J. China Coal Soc. 2015, 40, 1813–1819. [Google Scholar]
  11. Meng, Q.B. Study on Structure and Mechanical Properties and Constitutive Model of Very Weakly Cemented Rock. Ph.D. Thesis, China University of Mining and Technology, Xuzhou, China, 2014. [Google Scholar]
  12. Peng, S.S. Longwall Mining; Society for Mining Metallurgy, and Exploration: Littleton, CO, USA, 2006. [Google Scholar]
  13. Xie, H.P.; Zhang, Y.T.; Gao, F.; Zhang, R.; Gao, M.Z.; Liu, J.F. Stress-fracture-seepage field behavior of coal under different mining layouts. J. China Coal Soc. 2016, 41, 2405–2417. [Google Scholar]
  14. ASTM D4543-01, Standard Practices for Preparing Rock Core Specimens and Determining Dimensional and Shape Tolerances; ASTM International: West Conshohocken, PA, USA, 2001.
  15. ASTM D4643-17, Standard Test Method for Determination of Water Content of Soil and Rock by Microwave Oven Heating; ASTM International: West Conshohocken, PA, USA, 2017.
  16. ASTM D7012-14e1, Standard Test Methods for Compressive Strength and Elastic Moduli of Intact Rock Core Specimens under Varying States of Stress and Temperatures; ASTM International: West Conshohocken, PA, USA, 2014.
  17. Yu, D.H.; Peng, J.B. Experimental study of mechanical properties of chlorite schist with water under triaxial compression. Chin. J. Rock Mech. Eng. 2009, 28, 205–211. [Google Scholar]
  18. Hsieh, Y.M.; Li, H.H.; Huang, T.H.; Jeng, F.S. Interpretations on how the macroscopic mechanical behavior of sandstone affected by microscopic properties—Revealed by bonded-particle model. Eng. Geol. 2008, 99, 1–10. [Google Scholar] [CrossRef]
  19. Atapour, H.; Mortazavi, A. The influence of mean grain size on unconfined compressive strength of weakly consolidated reservoir sandstones. J. Pet. Sci. Eng. 2018, 171, 63–70. [Google Scholar] [CrossRef]
  20. Zhou, Z.L.; Cai, X.; Cao, W.L.; Li, X.B.; Cheng, X. Influence of Water Content on Mechanical Properties of Rock in Both Saturation and Drying Processes. Rock Mech. Rock Eng. 2016, 49, 3009–3025. [Google Scholar] [CrossRef]
  21. Lindqvist, J.E.; Åkesson, U.; Malaga, K. Microstructure and functional properties of rock materials. Mater. Charact. 2007, 58, 1183–1188. [Google Scholar] [CrossRef]
  22. Peng, J.; Wong, L.N.Y.; Teh, C.I. Influence of grain size heterogeneity on strength and microcracking behavior of crystalline rocks. J. Geophys. Res.-Solid Earth 2017, 122, 1054–1073. [Google Scholar] [CrossRef] [Green Version]
  23. Sajid, M.; Coggan, J.; Arif, M.; Andersen, J.; Rollinson, G. Petrographic features as an effective indicator for the variation in strength of granites. Eng. Geol. 2016, 202, 44–54. [Google Scholar] [CrossRef] [Green Version]
  24. SY/T5163-2010, Analysis Method for Clay Minerals and Ordinary Non-Clay Minerals in Sedimentary Rocks by the X-Ray Diffraction; Chinese National Energy Board: Beijing, China, 2010.
Figure 1. Overburden movement resulting from longwall mining.
Energies 12 01563 g001
Figure 2. Location and general geological stratigraphy of the weakly cemented strata.
Energies 12 01563 g002
Figure 3. MTS815.03 Electro-hydraulic servo-controlled rock mechanics testing system. (a) loading state; (b) Test set-up; (c) loading system.
Energies 12 01563 g003
Figure 4. Failure modes of all specimens. (a) Mudstone, (b) sandstone, (c) sandy mudstone.
Energies 12 01563 g004aEnergies 12 01563 g004b
Figure 5. Stress-strain behavior of rock samples under different confining pressures. (a) Mudstone, (b) sandstone, (c) sandy mudstone.
Energies 12 01563 g005
Figure 6. Stress-strain behavior of rock samples with different moisture contents. (a) Mudstone, (b) sandstone, (c) sandy mudstone.
Energies 12 01563 g006
Figure 7. Effects of confining pressure on the mechanics behaviors of rock samples. (a) Peak stress; (b) residual stress; (c) difference between peak stress and residual stress.
Energies 12 01563 g007
Figure 8. SEM images of microstructure of typical rock samples. (a) mudstone; (b) sandstone; (c) sandy mudstone; (d) mudstone; (e) sandstone; (f) sandy mudstone.
Energies 12 01563 g008
Figure 9. Effects of moisture contents on the mechanics behaviors of rock samples. (a) Peak stress, (b) residual stress, (c) difference between peak stress and residual stress.
Energies 12 01563 g009
Figure 10. Sensitivity coefficient of moisture content for rock samples. (a) Peak stress, (b) residual stress, (c) difference between peak stress and residual stress.
Energies 12 01563 g010
Figure 11. XRD diffraction, pattern. (a) Mudstone, (b) sandstone, (c) sandy mudstone.
Energies 12 01563 g011
Table 1. Details of rock samples.
SeriesSamplesDiameter/mmHeight/mmMoisture Content/%Confining Pressure/MPa
MudstoneNY-N-149.799.14.271.0
NY-N-349.599.84.273.0
NY-N-549.998.94.275.0
NY-D-349.3100.10.003.0
NY-S-350.1100.310.663.0
SandstoneSY-N-150.0100.07.521.0
SY-N-349.6100.07.523.0
SY-N-548.798.97.525.0
SY-D-350.0101.20.003.0
SY-S-350.1101.511.393.0
Sandy mudstoneNS-N-149.4100.36.571.0
NS-N-349.9100.56.573.0
NS-N-549.799.56.575.0
NS-D-349.599.80.003.0
NS-S-349.898.99.333.0
Table 2. Key test results.
LithologySpecimensPeak Stress/MPaResidual Stress/MPaPeak Strain/%Elastic Modulus/GPakC/kCS, kCR, kC (SR)kW/kWS, kWR, kW (SR)
MudstoneNY-N-115.846.591.291.443.10, 3.62, −0.51−5.03e−0.31x
−1.72e−0.27x
−3.37e−0.34x
(0 ≤ x ≤ 10.66)
NY-N-320.2311.681.441.67
NY-N-528.2621.041.532.03
NY-D-332.1116.011.712.01
NY-S-316.4810.021.411.28
SandstoneSY-N-19.335.770.911.322.14, 2.54, −0.40−0.74, −0.35, −0.38
SY-N-313.4210.911.011.42
SY-N-517.8815.641.121.81
SY-D-319.5813.801.531.52
SY-S-311.369.940.941.45
Sandy mudstoneNS-N-115.915.141.131.682.35, 3.04, −0.69−1.42, −0.65, −0.77
NS-N-320.4711.281.381.72
NS-N-526.7017.841.391.94
NS-D-328.9214.831.721.87
NS-S-315.418.551.161.48
Table 3. Test results of rock mineral composition.
LithologyContent of Minerals (%)Relative Content of Clay Minerals (%)
QuartzPotash FeldsparClay MineralsIllite (It)Kaolinite (K)Illite-Smectite Mixed-Layer (I/S)
Mudstone2907184349
Sandstone70525136918
Sandy mudstone60436126919

