Article

Experimental Study of DI Diesel Engine Operational and Environmental Behavior Using Blends of City Diesel with Glycol Ethers and RME

by
Theodoros C. Zannis
1,*,
Roussos G. Papagiannakis
2,
Efthimios G. Pariotis
1 and
Marios I. Kourampas
1
1
Naval Architecture and Marine Engineering Section, Hellenic Naval Academy, 18539 Piraeus, Greece
2
Thermodynamic & Propulsion Systems Section, Aeronautical Sciences Department, Hellenic Air Force Academy, Dekelia Air Force Base, 1010 Dekelia, Attiki, Greece
*
Author to whom correspondence should be addressed.
Energies 2019, 12(8), 1547; https://doi.org/10.3390/en12081547
Submission received: 29 March 2019 / Revised: 21 April 2019 / Accepted: 22 April 2019 / Published: 24 April 2019

Abstract

:
An experimental investigation is performed in a single-cylinder direct-injection (DI) diesel engine using city diesel oil called DI1 and two blends of DI1 with a mixture of glycol ethers. The addition of glycol ethers to fuel DI1 produced oxygenated fuels GLY10 (10.2 mass-% glycol ethers) and GLY30 (31.3 mass-% glycol ethers) with 3% and 9% oxygen content, respectively. The addition of biofuel rapeseed methyl ester (RME) to fuel DI1 produced oxygenated blend RME30 (31.2 mass-% RME) with 3% oxygen content. Engine tests were performed with the four fuels in the DI diesel engine at 2500 RPM and at 20%, 40%, 60%, and 80% of full load. The experimental diesel engine was equipped with devices for recording cylinder pressure, injection pressure, and top dead center (TDC) position and also it was equipped with exhaust gas analyzers for measuring soot, NO, CO, and HC emissions. A MATLAB 2014 code was developed for analyzing recorded cylinder pressure, injection pressure, and TDC position data for all obtained engine cycles and for calculating the main engine performance parameters. The assessment of the experimental results showed that glycol ethers have more beneficial impact on soot and NO emissions compared to RME, whereas RME have less detrimental impact on engine performance parameters compared to glycol ethers.

1. Introduction

During recent years, internal combustion engine manufacturers in cooperation with research institutes and universities from all over the world have managed to develop advanced technology four-stroke and two-stroke diesel engines for various industrial sectors with considerably improved thermal efficiency and environmental behavior compared to the past decades [1]. It is characteristic that nowadays the brake-specific fuel consumption (BSFC) of medium-speed marine diesel engines has reached the value of 168 g/kWh [2] and the corresponding BSFC of large two-stroke slow-speed diesel engines is close to 156 g/kWh [3], which corresponds to the highest thermal efficiency and to the lowest specific CO2 emissions of all fossil fuel-powered propulsion and electric power generation thermal engines. However, diesel engines still remain a major source of gaseous and particulate emissions, which have serious detrimental effects on human health and on the environment [1]. For this reason and also for compliance with strict environmental regulations currently issued in many industrial sectors such as automotive, maritime, and the electric power generation sector, engine manufacturers and research organizations have strived to find solutions for further reducing the gaseous and particulate diesel-emitted pollutants and also to further reduce the carbon footprint of diesel engines by improving their efficiency [4].
One direct mean for improving mainly the environmental behavior not only of future but also of existing compression ignition engines is the use of alternative gaseous fuels such as natural gas, methane, and hydrogen. Natural gas combustion in compression ignition engines under dual-fuel mode has proven to be quite effective in reducing both soot and NOx emissions with positive effects also in brake-specific energy consumption [5]. However, compression ignition (CI) combustion with natural gas either as a diesel oil supplement or using pilot diesel oil quantity for combustion initiation and flame development resulted in significant deterioration of CO and HC emissions compared to conventional diesel operation [5]. The influence of biogas and waste fats methyl esters on NOx, CO, and PM emissions of dual fuel engines has been examined in the past with quite encouraging results regarding the improvement of the environmental performance of these engines [6]. Also, the combustion of alternative gaseous fuels such as a mixture of methane with hydrogen have been examined in spark-ignition (SI) engines with quite positive results regarding the environmental repercussions of this type of engine [7].
Another more cost-effective method than natural gas thought to also drastically reduce mainly diesel-emitted particulate matter (PM) is the use of other alternative gaseous and liquid biofuels such as straight vegetable oils, methyl esters of vegetable oils, alcohols, and ethers. Vegetable oils and vegetable oil esters can be used in CI engines either as neat fuels or as blends with conventional diesel oils without any serious engine modifications. Experimental and theoretical studies conducted in the past have examined the use of vegetable oils and their esters in CI engines under both steady-state and transient conditions. Specifically, a heat release rate and performance analysis and also an environmental behavior assessment of a six-cylinder turbocharged (T/C) direct-injection (DI) diesel engine using blends of diesel oil with esters of cottonseed oil or sunflower oil had been performed in the past [7]. The experimental results of this study [8] showed significant reduction of diesel-emitted soot, which increase with increasing biofuel content in fuel blend. In another experimental study [9], the combustion of cottonseed oil, cottonseed oil methyl ester, ethanol, and butanol on the performance characteristics and the exhaust emissions of a T/C multi-cylinder CI engine was investigated, and it was found that the use of either ethanol or butanol results in the defeat of the well-known soot/NOx trade-off of conventional CI engines. In a previous experimental investigation [10], the beneficial effects of blends of butanol and diethyl ether with either vegetable oils or biodiesels on diesel engine environmental behavior have been demonstrated. Also, in another important study [11], the individual impact of ethanol, n-butanol, and diethyl ether as biofuel supplements on CI engine performance characteristics, cyclic variability, and emissive behavior has thoroughly been examined.
Chauhan et al. [12] reviewed the effect of various blends of conventional diesel oil with various types of ethers and vegetable oils on CI engine performance and emissions and concluded that the use of 10% to 20% biodiesel addition to diesel fuel can be favorable for long-term use in CI engines. Also, in a recent study [13], the impact of various additives, including oxygenated ones, to diesel engine-out regulated and non-regulated emissions was examined. Apart from the aforementioned reviews, Giakoumis et al. [14] examined the influence of various biofuel blends on combustion-induced noise radiation using internal and published data. Also, the relative impact of various biodiesels on exhaust emissions under diesel engine transient operation has been thoroughly been reviewed [15]. In a recent review [16], very informative correlations for predicting biodiesel cetane number using various fatty acid compositions have also been developed. Apart from the experimental investigations performed in the past using various liquid and gaseous biofuels in CI engines, theoretical studies have also been performed using either multi-dimensional computational fluid dynamics (CFD) or phenomenological simulations models of the operational performance and the polluting potentiality of CI engines burning alternative oxygenated fuels. Detailed two-zone phenomenological models initially developed for conventional CI engine performance and emission analysis [17] and also for EGR analysis [18] have been properly modified and used for investigating the effect of oxygenated fuels on CI engine operational and environmental behavior [19]. Also, multi-zone models have been used for examining the influence of diesel/biofuel blending ratio and molecular structure on CI engine performance and emissions [20]. Finally, comprehensive CFD models have been used for assessing the impact of oxygenated fuel properties on diesel spray combustion and soot formation [21]. The influence of fuels chemical composition and properties on CI engine transient operational and environmental performance has been examined in the past using detailed simulations models [22].
The present study emphasizes the experimental examination of the use of blends of diesel oil with either a mixture of diethylene glycol dimethyl ether and diethylene glycol dibutyl ether called glycol ethers or rapeseed methyl ester (RME). Studies conducted in the past investigated the impact of either pure RME or blends of RME with conventional diesel oil on diesel engine performance characteristics and exhaust emissions showing that the use of RME can mainly result in reduction of diesel-emitted soot concentration and particle size and number. Specifically, Labecki et al. [23] examined the influence of diesel and RME on high-speed DI diesel engine-emitted soot particle number–size distribution considering various injection parameters and EGR rates. Klyus [24] investigated the impact of various biofuels on CI engine technology. Buyukkaya [25] analyzed the impact of biodiesel content and type on DI diesel engine combustion characteristics and pollutant emissions and Allocca et al. [26] performed measurements in a quiescent combustion chamber and in a EURO5 CI engine using conventional diesel oils and RME. Imran et al. [27] thoroughly examined the impact of RME on CI engine performance and emissions under various engine speeds and loads and demonstrated the positive influence of this biofuel on CI engine soot reduction. Previously published experimental studies have compared the relative impact of RME on CI engine performance and emissions compared to other biodiesels such as soybean oil methyl ester (SME) and palm oil methyl ester (PME) [28], gas-to-liquid (GTL) [29], and bioethanol [30]. As in many cases, RME combustion in CI engines results in deterioration of NOx emissions compared to conventional diesel operation; the use of exhaust gas recirculation (EGR) has also been examined in CI engine burning blends of conventional diesel oil and RME as an effective method for NOx emissions curtailment [31]. Experimental studies performed in the past have also investigated the use of glycol ethers and RME either individually or on a comparative basis for assessing their relative influence on CI engine combustion characteristics, performance parameters, and pollutant emissions. Specifically, Gómez-Cuenca et al. [32] and Song et al. [33] performed engine tests with blends of conventional diesel oil and glycol ethers and they demonstrated the positive influence of ethers on CI engine environmental behavior. In addition, the relative impact of glycol ethers and RME as additives to diesel oil has been experimentally assessed in a Ricardo/Hydra CI engine and showed that glycol ethers can be more beneficial on soot reduction compared to RME [34]. Also, the addition of ethers to conventional diesel fuels with increasing aromatic content has been investigated showing that the combination of low aromatic content in the parental fuel with increased glycol ether content can substantially reduce diesel-emitted soot [35]. Of particular importance is a previous review study [36] where various alternative oxygenated fuels were compared with intake-air oxygen enrichment as two in-cylinder mixture oxygen-enhancement techniques, which showed that fuel-bound oxygen and oxygenated fuel properties have a direct effect on local soot formation and especially on local soot oxidation rate inside fuel spray. Another important experimental study is the one of Song et al. [33], which examined the effect of blends of a Finnish summer grade diesel oil with glycol ethers at two different proportions (10 mass-% and 30 mass-%) and RME (30 mass-%) and they derived informative results regarding the impact of ethers and RME on combustion evolution through photographic studies, on performance characteristics, and on exhaust emissions.
Having thoroughly examined existing literature in the field of liquid oxygenated biofuels, one question is raised; whether alternative oxygenated fuels such as glycol ethers and RME can be used in old technology diesel engines for substantially improving their environmental performance without considerable detrimental effects in their operational availability and their performance characteristics. This question is essential since most of the related published studies refer to modern diesel engines with electronically controlled fuel injection systems. However, worldwide, there is a large fleet of surpassed technology diesel engines, which require serious improvement of their environmental behavior. Another question raised is the feasibility of the development of an experimental apparatus based on a DI diesel engine with very low budget, which can be used for fuels testing and also for educational purposes since it has been proved that the training of young engineers on diesel engine technology can be quite favorable on the development of their engineering skills [37].
Also, engine development [38] and engine measuring hardware and software companies [39] have developed commercial instrumentation and software for analyzing cylinder pressure sensor data and performance CI engine performance analysis without details about the methods used for analyzing the cylinder pressure signals and for performing performance and combustion analysis. In addition, a relevant experimental study [33] conducted in the past with glycol ethers and RME as diesel oil additives in single-cylinder DI diesel engine have not described in detail the cylinder pressure processing and performance analysis methodology.
Hence, the main objective of the present study is to experimentally examine the effect of conventional diesel oil and its blends with either glycol ethers or RME for assessing their individual impact on the combustion characteristics and soot, NO, CO, and total unburned hydrocarbons (HC) emissions of a relatively old technology DI diesel engine. Besides that, another objective of the present analysis is to demonstrate the development and use of a DI diesel engine experimental installation with limited funding, which can be used not only for fuels testing, but also for other applications and for young engineers training. Another objective of the present study is to describe, in detail, a theoretical methodology for processing cylinder pressure, injection pressure, and top dead center (TDC) position data obtained over many engine cycles for calculating the engine performance parameters and combustion characteristics either on a cycle-to-cycle basis or on average cycle basis. Unlike the past, the detailed description of this methodology can be adopted by scientists and engineers working on CI engine development and it can also be used for educational purposes. Consequently, tests were performed in single-cylinder naturally aspirated DI diesel engine (“Lister LV1”) using one conventional diesel oil, two of its blends with glycol ethers, and a blend of diesel oil with RME at 2500 rpm and at 20%, 40%, 60%, and 80% load. Also, a computational model was developed in MATLAB [40] for processing measured cylinder pressure, injection pressure, and TDC position data from all engine operating points and for calculating engine performance and combustion characteristics. The evaluation of the experimental results showed that for the same blending proportion in conventional diesel oil, a biodiesel-agent (RME) appears to have less detrimental impact on engine performance parameters and specific fuel consumption and more positive impact on HC emissions reduction compared to a mixture of synthetic oxygenates (glycol ethers). Oppositely, the same percentage of glycol ethers in a diesel blend appears to have more beneficial impact on soot and NO emissions compared to RME.

2. Test Fuels Description

The test fuels examined in the present study were prepared under a combined theoretical and experimental investigation, which was conducted in the past and aimed at the computational and experimental examination of various conventional and alternative blends that could be used in both existing (at the time) and future fleets of diesel-powered vehicles [20,34,36]. The main purpose of this extensive and detailed investigation was the determination of the optimum diesel fuel chemical synthesis and physical and chemical properties for attaining reduction of diesel emitted pollutants without deteriorating or, if possible, further improving the specific fuel consumption of existing and future diesel engines. Hence, under this elaborate research investigation, a series of non-oxygenated and oxygenated diesel fuels were prepared by an oil refinery in Finland for examining, among other fuel parameters, the effect of fuel oxygen content and oxygenate molecular structure on diesel engine performance characteristics and gaseous and particulate emissions [20,34,36]. Initially, Finnish summer grade city diesel oil was chosen as the reference fuel or, in other words, the “base” fuel (DI1) of this investigation. For the development of “base” fuel DI1, three oxygenated diesel blends were prepared with oxygen content ranging from 3% to 9%. In particular, it was decided to use diethylene glycol dimethyl ether (Diglyme), diethylene glycol dibutyl ether (Butyl Diglyme), and rapeseed methyl ester (RME) as oxygenated additives to “base” fuel DI1. Both diglyme and butyl diglyme are called glymes [20,34,36]. The blending of Finnish summer grade city diesel (DI1) with RME at 31.2 mass-% provided an oxygenated diesel blend with 3% oxygen. Rapeseed methyl ester is a biofuel with high viscosity and density, which can be prepared from biological sources such as vegetable oils (rapeseed oil). Esters of vegetable oils such as rapeseed oil, soybean oil, and cottonseed oil are considered as renewable alternative solutions for diesel oils [26,27,28,29]. Methyl esters are produced from corresponding vegetable oils through esterification process [9,16,26,27,28,29]. The addition of a mixture of diglyme (C6H14O3) and butyl diglyme (C12H26O3) to “base” fuel DI1 at different blending ratios produced two oxygenated diesel fuels, namely GLY10 (89.8 mass-% DI110.2 mass-% glymes) and GLY30 (68.7 mass-% DI1-1.3 mass-% glymes) with 3% and 9% oxygen content, respectively. Glycol ethers are synthetically produced oxygenated substances that indicate high cetane number and low value of heat of combustion. The chemical composition and the physical and chemical properties of the test fuels DI1, RME30, GLY10, and GLY30 are presented in Table 1 as delivered from an oil refinery in Finland. It is worth mentioning here that the measured results for the composition of fuels GLY10 (89.8 mass-% DI1-0.2 mass-% glymes) and GLY30 (68.7 mass-% DI1–31.3 mass-% glymes) in glymes and in base fuel DI1 are slightly different compared to the corresponding scheduled percentages of the initial fuel recipes as evidenced from the data of Table 1. The symbol “mass-%” corresponds to the blending mass composition of a test fuel e.g., test fuel GLY30 contains 16.6 mass-% diglyme and 14.7 mass-% butyl diglyme, which means that 1 kg of test fuel GLY10 contains 166 g diglyme and 147 g butyl diglyme; thus, 313 g glymes.
From the examination of the specifications provided in Table 1, it can be concluded that the blending of RME and glymes with “base” fuel DI1 provide the opportunity to investigate the effect of oxygenated additive type on diesel engine performance and combustion characteristics and also on diesel-emitted pollutants. This examination is facilitated using test fuels RME30 and GLY30, which have almost the same percentage (31 mass-%) of two different oxygenated additives, namely RME and glymes. Also, test fuels DI1 (0% oxygen), GLY10 (3% oxygen), and GLY30 (9% oxygen) formulate a series of fuels with progressively increasing oxygen content using the same oxygenated additives (mixture of glymes) at different blending ratios. As a result, the experimental results obtained for the examined diesel engine performance parameters and exhaust emissions can be used for the examination of the influence of increasing oxygen content on HSDI diesel engine operational and environmental behavior.

3. Description of the Diesel Engine Experimental Installation, the Fuel Testing Procedure, and the Processing Methodology of the Measured Cylinder Pressure, Injection Pressure, and TDC Position Data

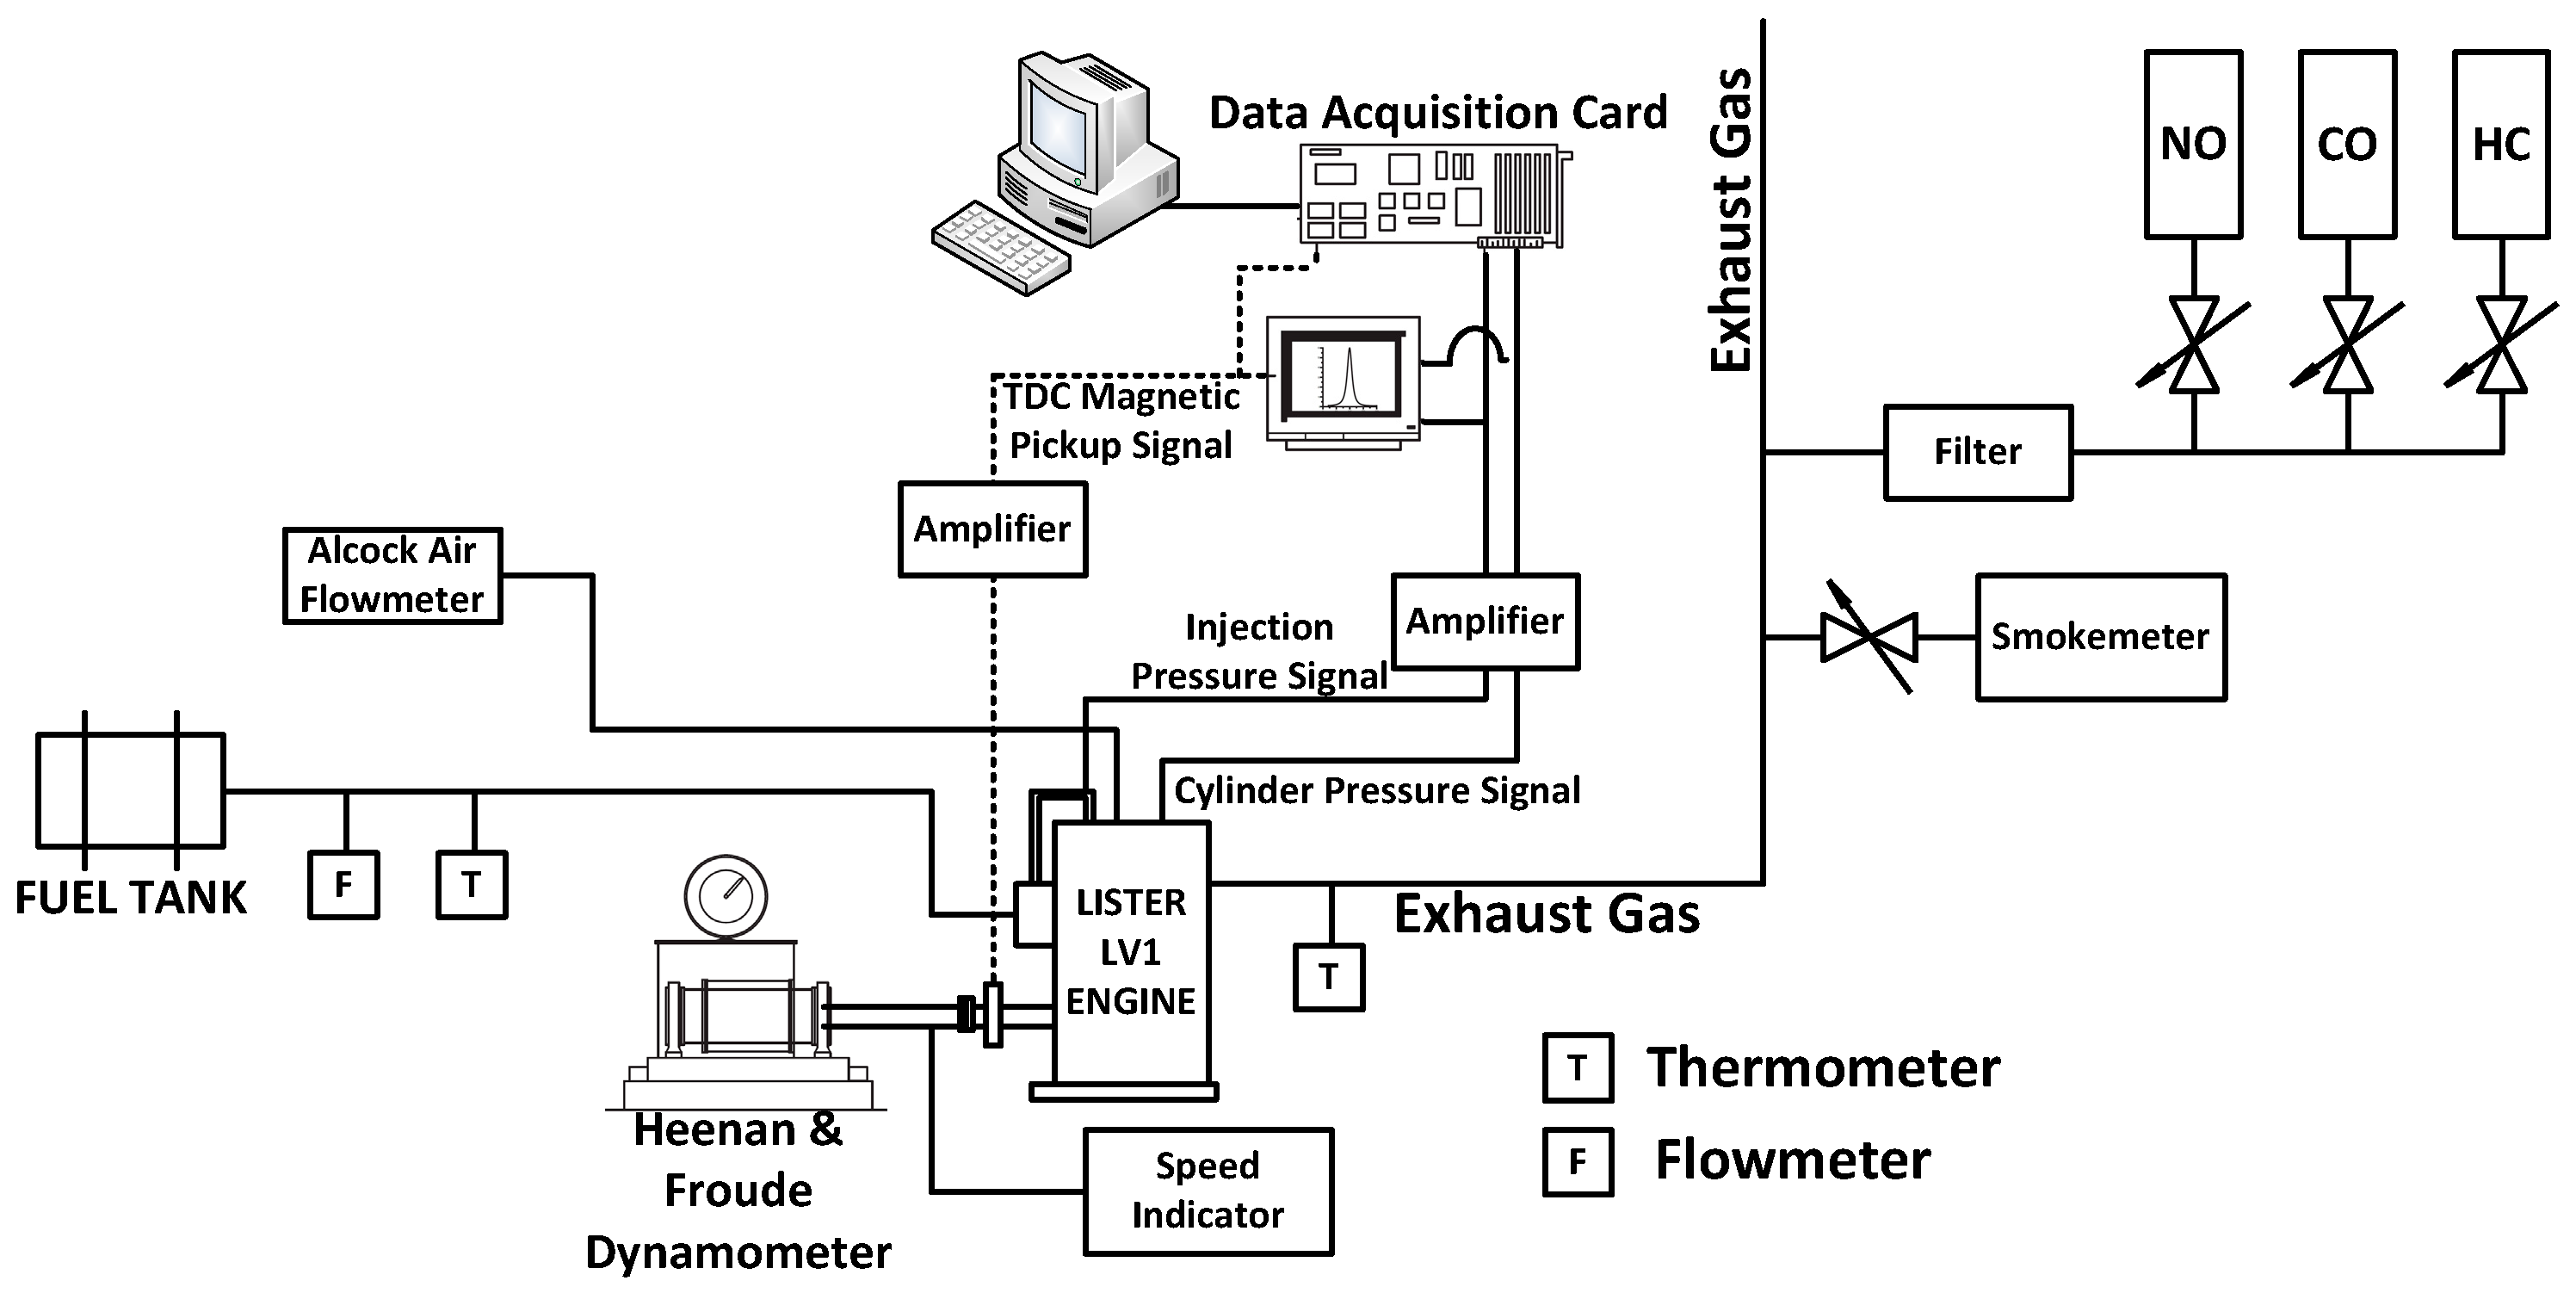
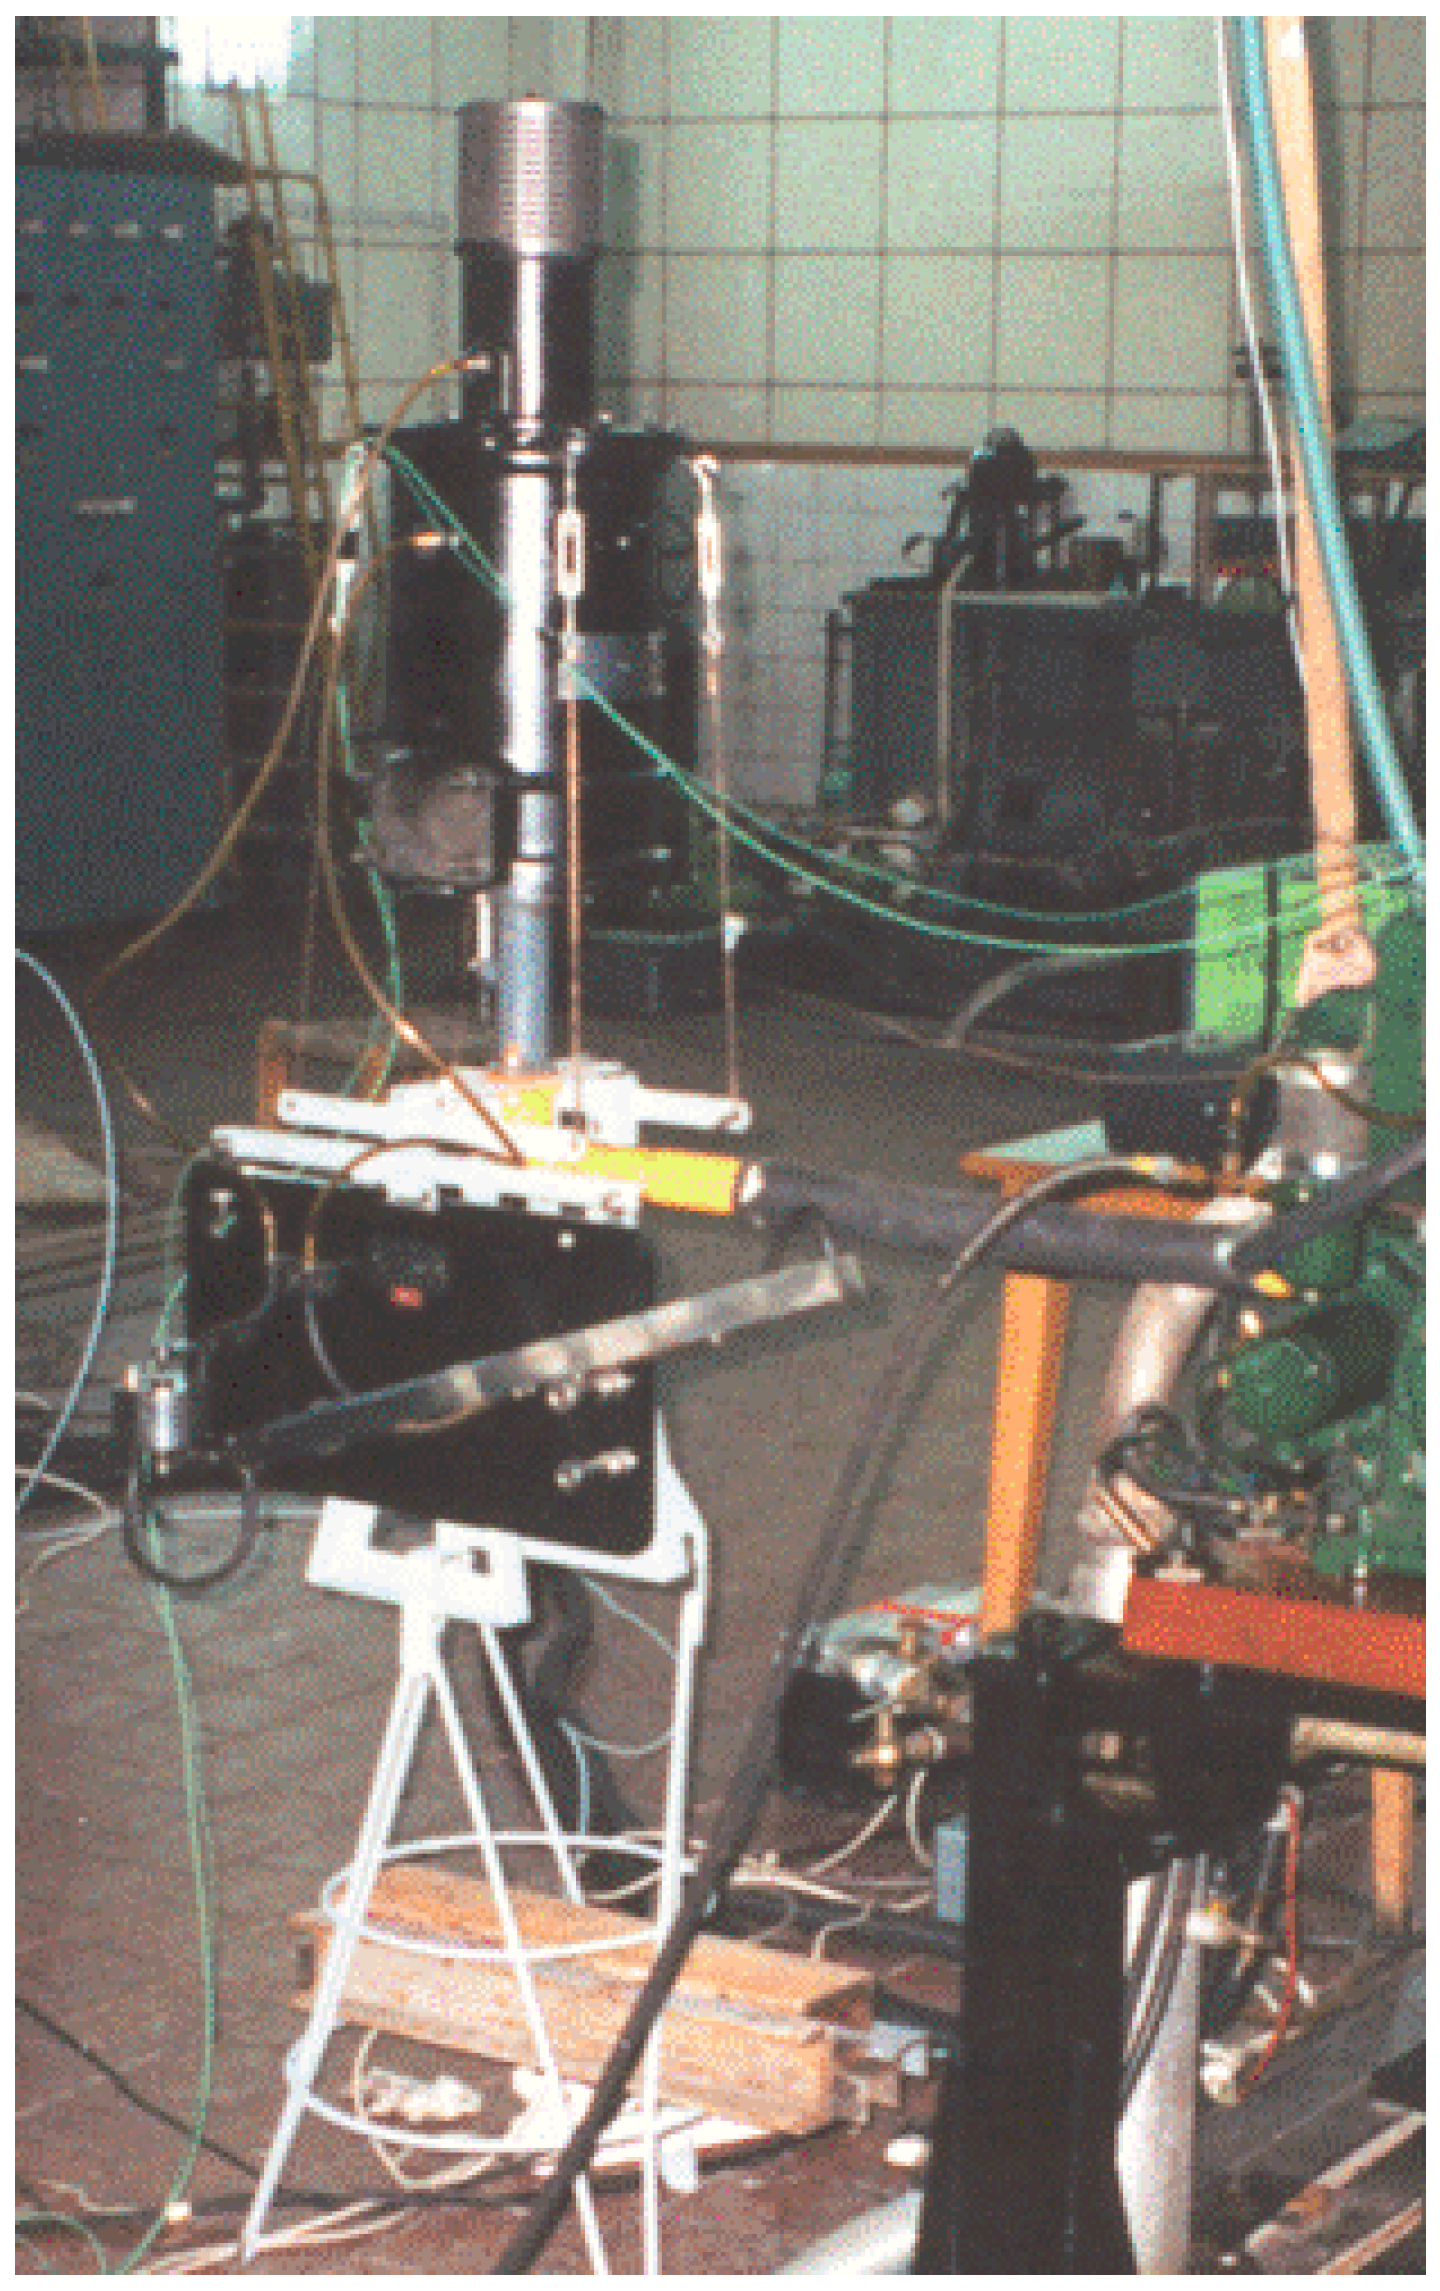
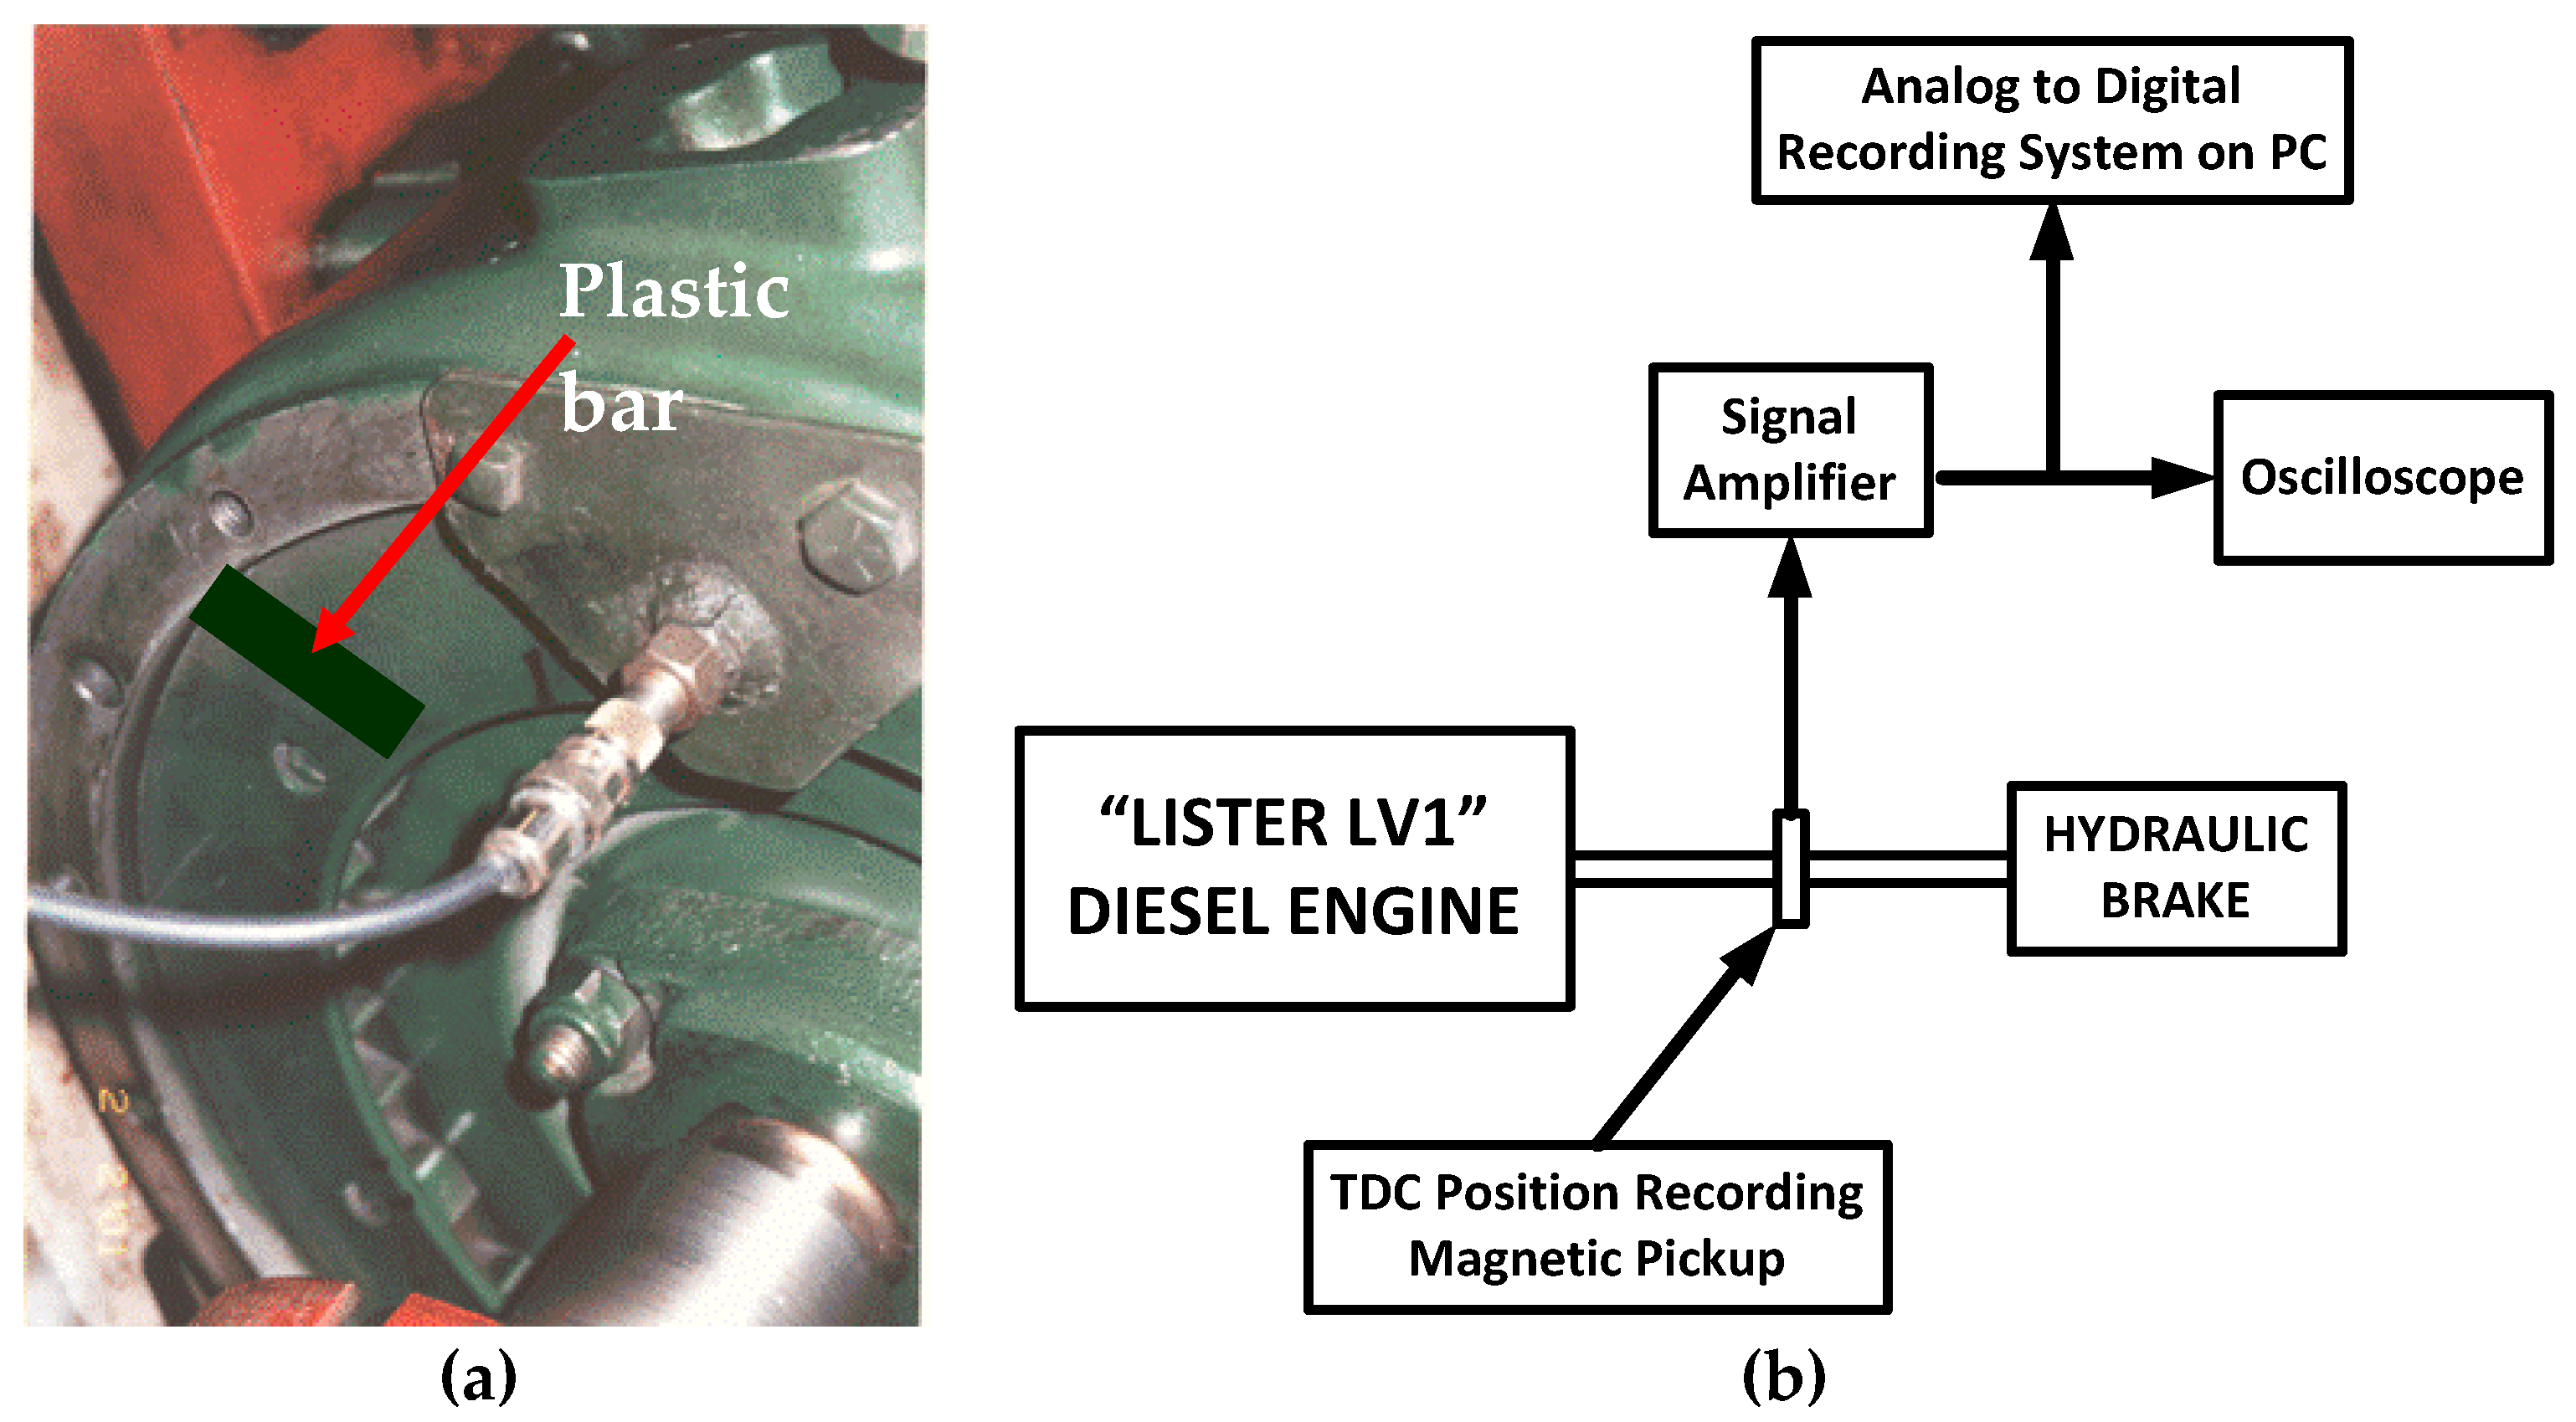
3.1. Description of the Diesel Engine Experimental Installation

An experimental apparatus was installed in the past at the Internal Combustion Engines Laboratory of National Technical University of Athens, Greece based on a single-cylinder DI diesel engine coupled with a hydraulic dynamometer. In the specific experimental installation, devices for controlling diesel engine operation and monitoring its operational parameters were installed. The diesel engine used in the experiments is “Lister LV1” engine, which was developed by Lister Petter Company. The main technical data of the “Lister LV1” engine are given in Table 2. In Table 3, the main operating parameters of the “Lister LV1” engine, which were used during the engine tests, are given. The main operating parameters shown in Table 3 are the measured barometric pressure in the laboratory, the measured relative humidity, the dry air temperature of the laboratory, and the hydraulic dynamometer load in kg. Also, an effort was made that during engine tests, the pressure of the lubricant oil system to was have limited variations in the range between 0.7 and 1.0 bar. “Lister LV1” engine is coupled with a Heenan and Froude hydraulic dynamometer [20,34,36].
The main measuring equipment comprised of an Alcock air flow meter (viscous type), fuel tank, and flow-meter for measuring engine fuel consumption, thermocouples for recording exhaust gas temperature, lubricant oil temperature and engine coolant temperature, a magnetic pickup for recording TDC position, a crankshaft rotational speed indicator, and a piezoelectric transducer for measuring in-cylinder pressure [35,41]. The piezoelectric transducer used for recording cylinder pressure was developed by Kistler and it was a Kistler 6001 type. The operational temperature range of the Kistler 6001 piezoelectric transducer was from −196 to 350 °C, its sensitivity was 15 pCb/bar, and its linearity was lower than ±0.8% at full scale indication [35,41].
A similar piezoelectric transducer was fitted to the high-pressure fuel line between pump and injector close to the injector for monitoring fuel injection pressure. This piezoelectric transducer was also developed by Kistler and it was a Kistler 6005 type. The operational temperature range of the Kistler 6005 piezoelectric transducer was from −196 to 240 °C, its sensitivity was 7.91pCb/bar and its linearity was lower than ±0.1% at full scale indication [35,41]. An oscilloscope was used to monitor cylinder pressure or injection pressure signal.
It was also used a fast data acquisition system for recording cylinder pressure, injection pressure, and TDC position measurements and storing them in a PC [35,41]. The data acquisition system was based on an analog-to-digital (ADC) converter DAS-1801ST of Keithley, which was installed in a personal computer. The specific ADC converter can record 8 differential or 16 single-phase signals with 12-bit resolution in each one. In the engine tests described in this study, the ADC converter recorded 3 analog signals from two piezoelectric transducers and the TDC position magnetic pickup through a STP-50/C terminal board [35,41].
In addition, exhaust gas analyzers were used for the measurement of tailpipe soot, NO, CO, and HC values. A Bosch RTT100 smoke meter was used for the measurement of diesel-emitted soot concentration in mg/L at the engine exhaust. NO emissions were measured in ppm using a Signal 4000 type chemiluminescent analyzer and HC emissions (equivalent propane) were measured also in ppm using a flame ionization analyzer manufactured by Ratfisch. Both NO and HC analyzers were equipped with thermostatically controlled heated lines. Finally, CO emissions were measured in ppm using a Signal 3001 type non-dispersive infrared analyzer [35,41].
Figure 1 shows a schematic view of the experimental apparatus used to perform engine tests in “Lister LV1” DI diesel engine using test fuels DI1, RME30, GLY10, and GLY30.
Figure 2 shows a photograph of the Alcock viscous type air flow meter used during engine tests to measure intake air flow rate. Alcock air flow meter is specifically designed in a way that the measuring errors from air flow pulsations in engine intake duct due to the reciprocating piston movement are eliminated. In the examined experimental apparatus, the Alcock flow meter is placed after the air filter. The measuring element of the Alcock flow meter is a cell with triangular cross section passages, which each one of them 76 mm long and 0.43 mm high. The pressure drop of the air is attributed to the cell resistance, which is analogous to the air flow velocity. Hence, the air volume flow rate through the measuring element of the Alcock flow meter varies linearly with the pressure drop, thus minimizing the measuring error. The inclined tube of the Alcock flow meter contains a mixture of water and alcohol with specific weight equal to 0.82 at ambient temperature. The tube has a variable inclination corresponding to three different positions, which each inclined position corresponding to different range of measured flow rates. In the present study, the middle inclined position of the tube was used [35,41].
It is of particular importance to discuss the installation and the use of the magnetic pickup on the engine flywheel for recording TDC position signal. For this reason, in Figure 3a is shown the installation of the magnetic pickup on “Lister LV1” engine flywheel and in Figure 3b is shown a schematic view of the complete TDC position signal measuring and recording apparatus. As evidenced from Figure 3a, a plastic bar is placed on the flywheel following the rotation of the engine crankshaft. When the plastic bar is aligned with the magnetic pickup, then the circuit is closed and the TDC position signal becomes equal to zero. Though, during recent decades, a shaft encoder has been used for monitoring cylinder pressure, which is capable of recording pressures with very small crank angle steps, e.g., 0.1 or 0.2 of crank angle degree, the use of magnetic pickup is a cost-effective and reliable method for measuring TDC position signal and it has been used in many engine tests with conventional and alternative diesel oils [42].

3.2. Fuels Testing Procedure

Engine tests were performed with test fuels DI1, RME30, GLY10, and GLY30 at 2500 rpm and at four engine loads namely 20%, 40%, 60%, and 80% of full load. All tests were carried out using constant static injection timing (26 degCA BTDC) of the fuel injection system to avoid variations in fuel injection commencement inside the combustion chamber due to static injection timing variations. Also, a serious effort was made all engine tests to be performed without noticeable variations of intake air temperature and lubricant oil temperature as a method for avoiding engine operation fluctuations and most importantly, engine loading variations. Engine testing procedure comprised of the following two steps [35,41]:
  • Initially, engine tests were carried out at 2500 rpm and at all engine loads (20%, 40%, 60%, and 80% of full load) using only “base” fuel DI1. At each operating point, various engine operational parameters were recorded such as fuel consumption, exhaust gas temperature, intake temperature, flow mass rate, cylinder pressure, and injection pressure. Hence, using this testing methodology, the engine baseline operation for the reference fuel DI1 was constituted.
  • The previous testing procedure was repeated for the same engine operating conditions for each one of the oxygenated test fuels RME30, GLY10, and GLY30.
It should be clarified that all engine tests at 2500 rpm and at each engine load were performed by keeping the dynamometer load (i.e., hydraulic brake weight) constant when changing from one fuel to another. Hence, since variations in heat of combustion were experienced between fuels DI1, RME30, GLY10, and GLY30, the fuel consumption was adjusted at each load when moving from one fuel to another in order to keep the dynamometer weight constant.
As already mentioned, the experimental single-cylinder DI diesel engine considered in the present study (“Lister LV1”) is directly connected to a proper hydraulic dynamometer. The hydraulic brake manufacturer provided the following equation for the calculation of engine brake power [35,41]:
P e = W · RPM 1500
where Pe is the engine brake power in CV, W is the hydraulic dynamometer load indication in kg, and RPM is the rotational speed of the engine shaft.
Engine intake air flow rate was measured using an Alcock measuring device, which measures intake pressure variation and it was calibrated for air temperature of 20 °C. Hence, the intake air volume flow rate is calculated using the following relation, which has been derived according to a proper diagram accompanying the Alcock measuring device [35,41]:
V ˙ A = 1.698 · ( Alcock   value )
where V ˙ A is the intake air volume flow rate in m3/h and Alcock value is measured in cm. During experiments, the laboratory dry air temperature Troom and the barometric pressure proom were recorded and the results are given above in Table 3 at each operating point. The measurements for laboratory air temperature and barometric pressure were used for calculating the engine intake air mass flow rate using measured intake air volume flow rate and the ideal gas equation of state [35,41]:
m ˙ A = p room R T room V ˙ A
A constant volume tube of 50 mL is used for measuring engine fuel consumption. The measurement of fuel consumption is based on the measurement of time required for the evacuation of the 50 mL diesel fuel tube from the engine. Consequently, the fuel consumption in kg/h is calculated using the following relation [35,41]:
m ˙ f ( kg h ) = [ 50 ( mL ) · ρ f ( kg m 3 ) · 10 6 ( m 3 mL ) · 3600 ( s h ) Δ t ( s ) ]
where ρf is fuel density and Δt in s is the time required for the evacuation of the 50 mL diesel fuel tube during engine operation. Results for the estimated intake air mass flow rate in kg/h and the measured fuel flow rate in kg/h of the engine at each operating point are given in Table 4.

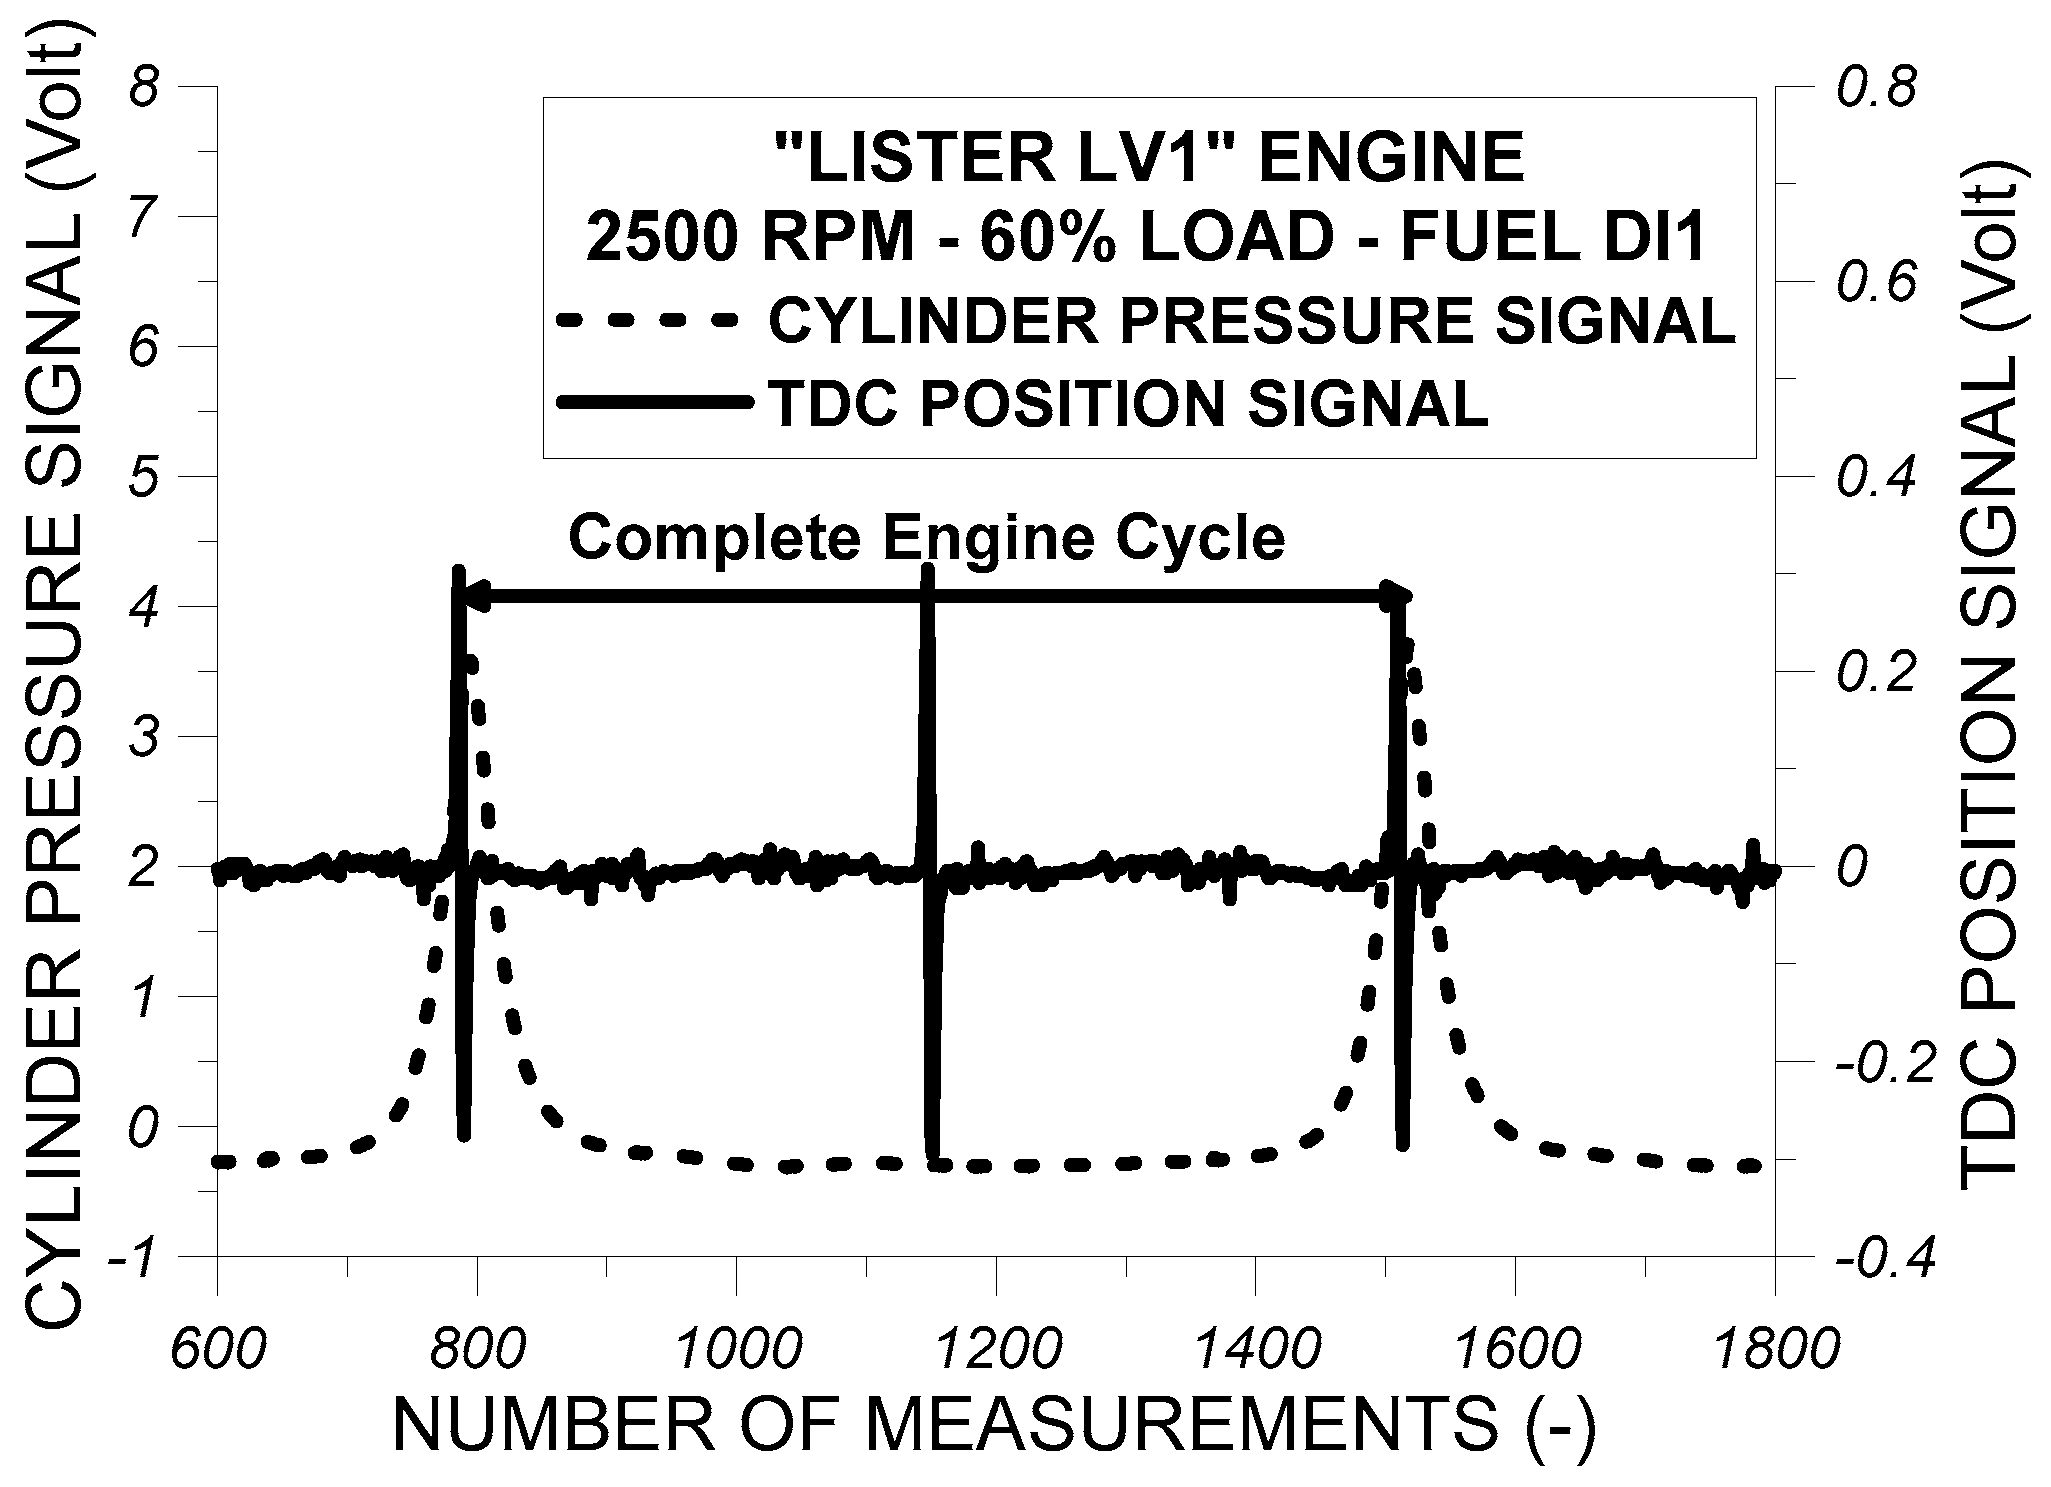
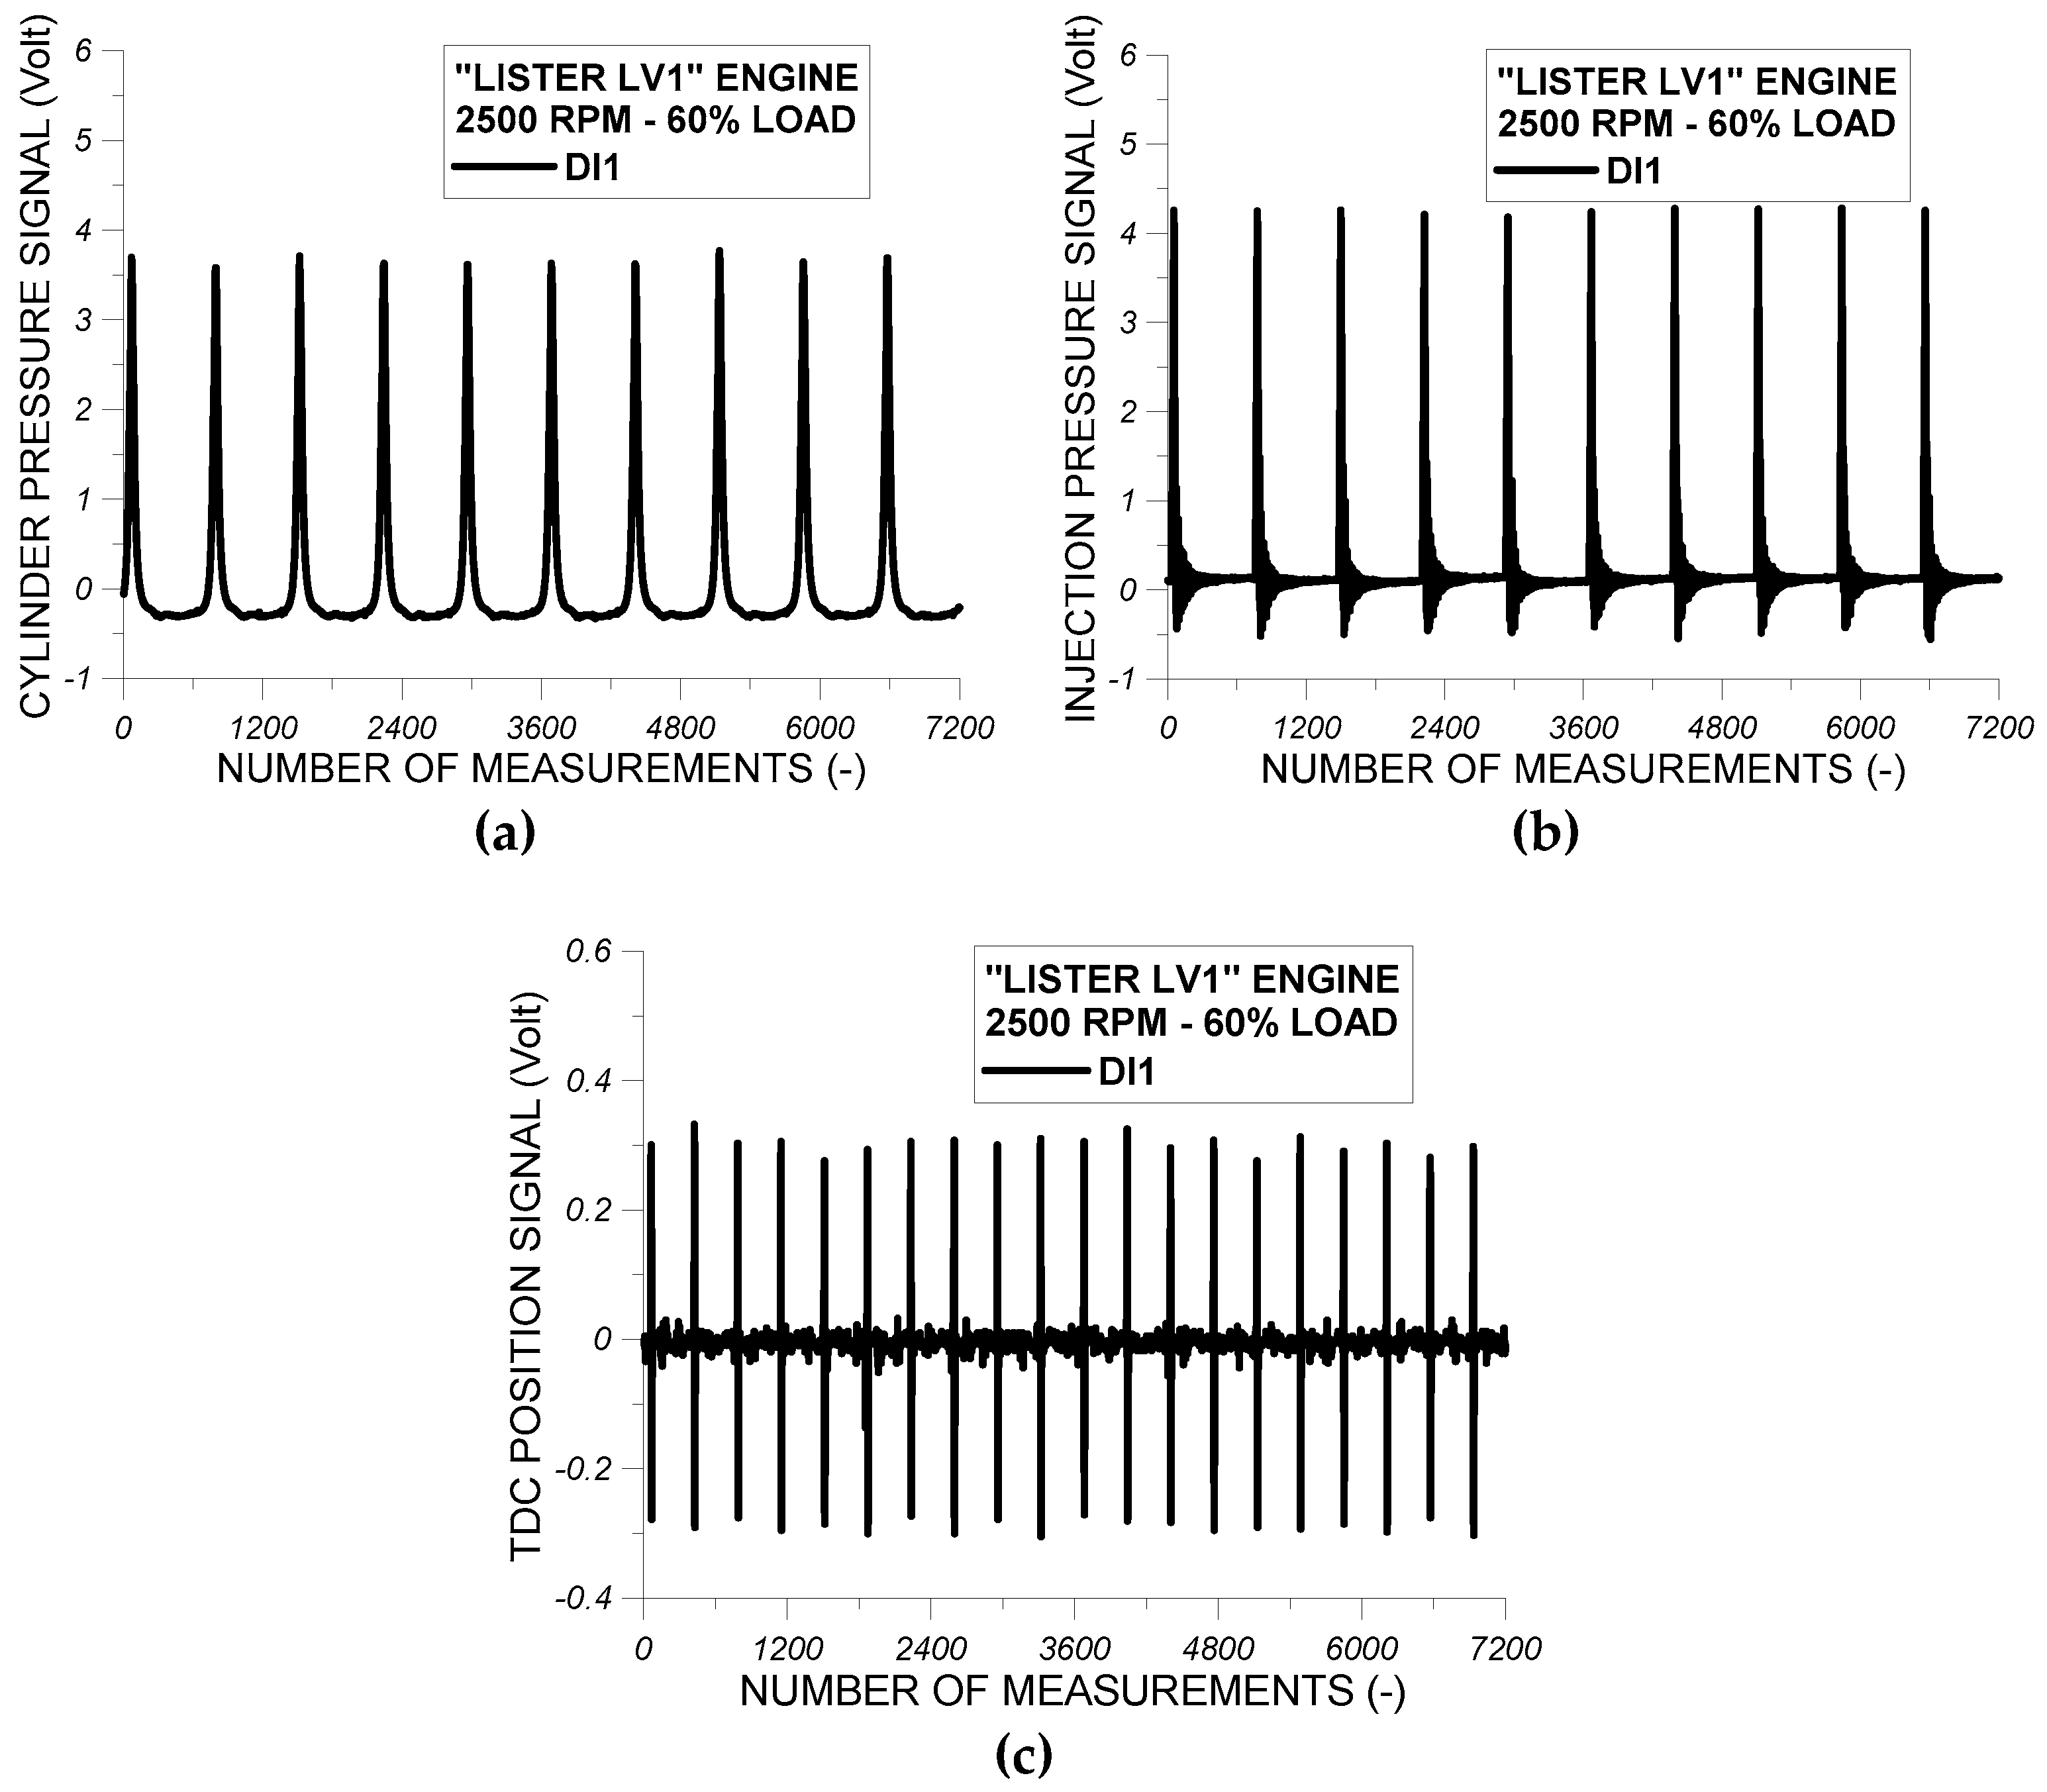
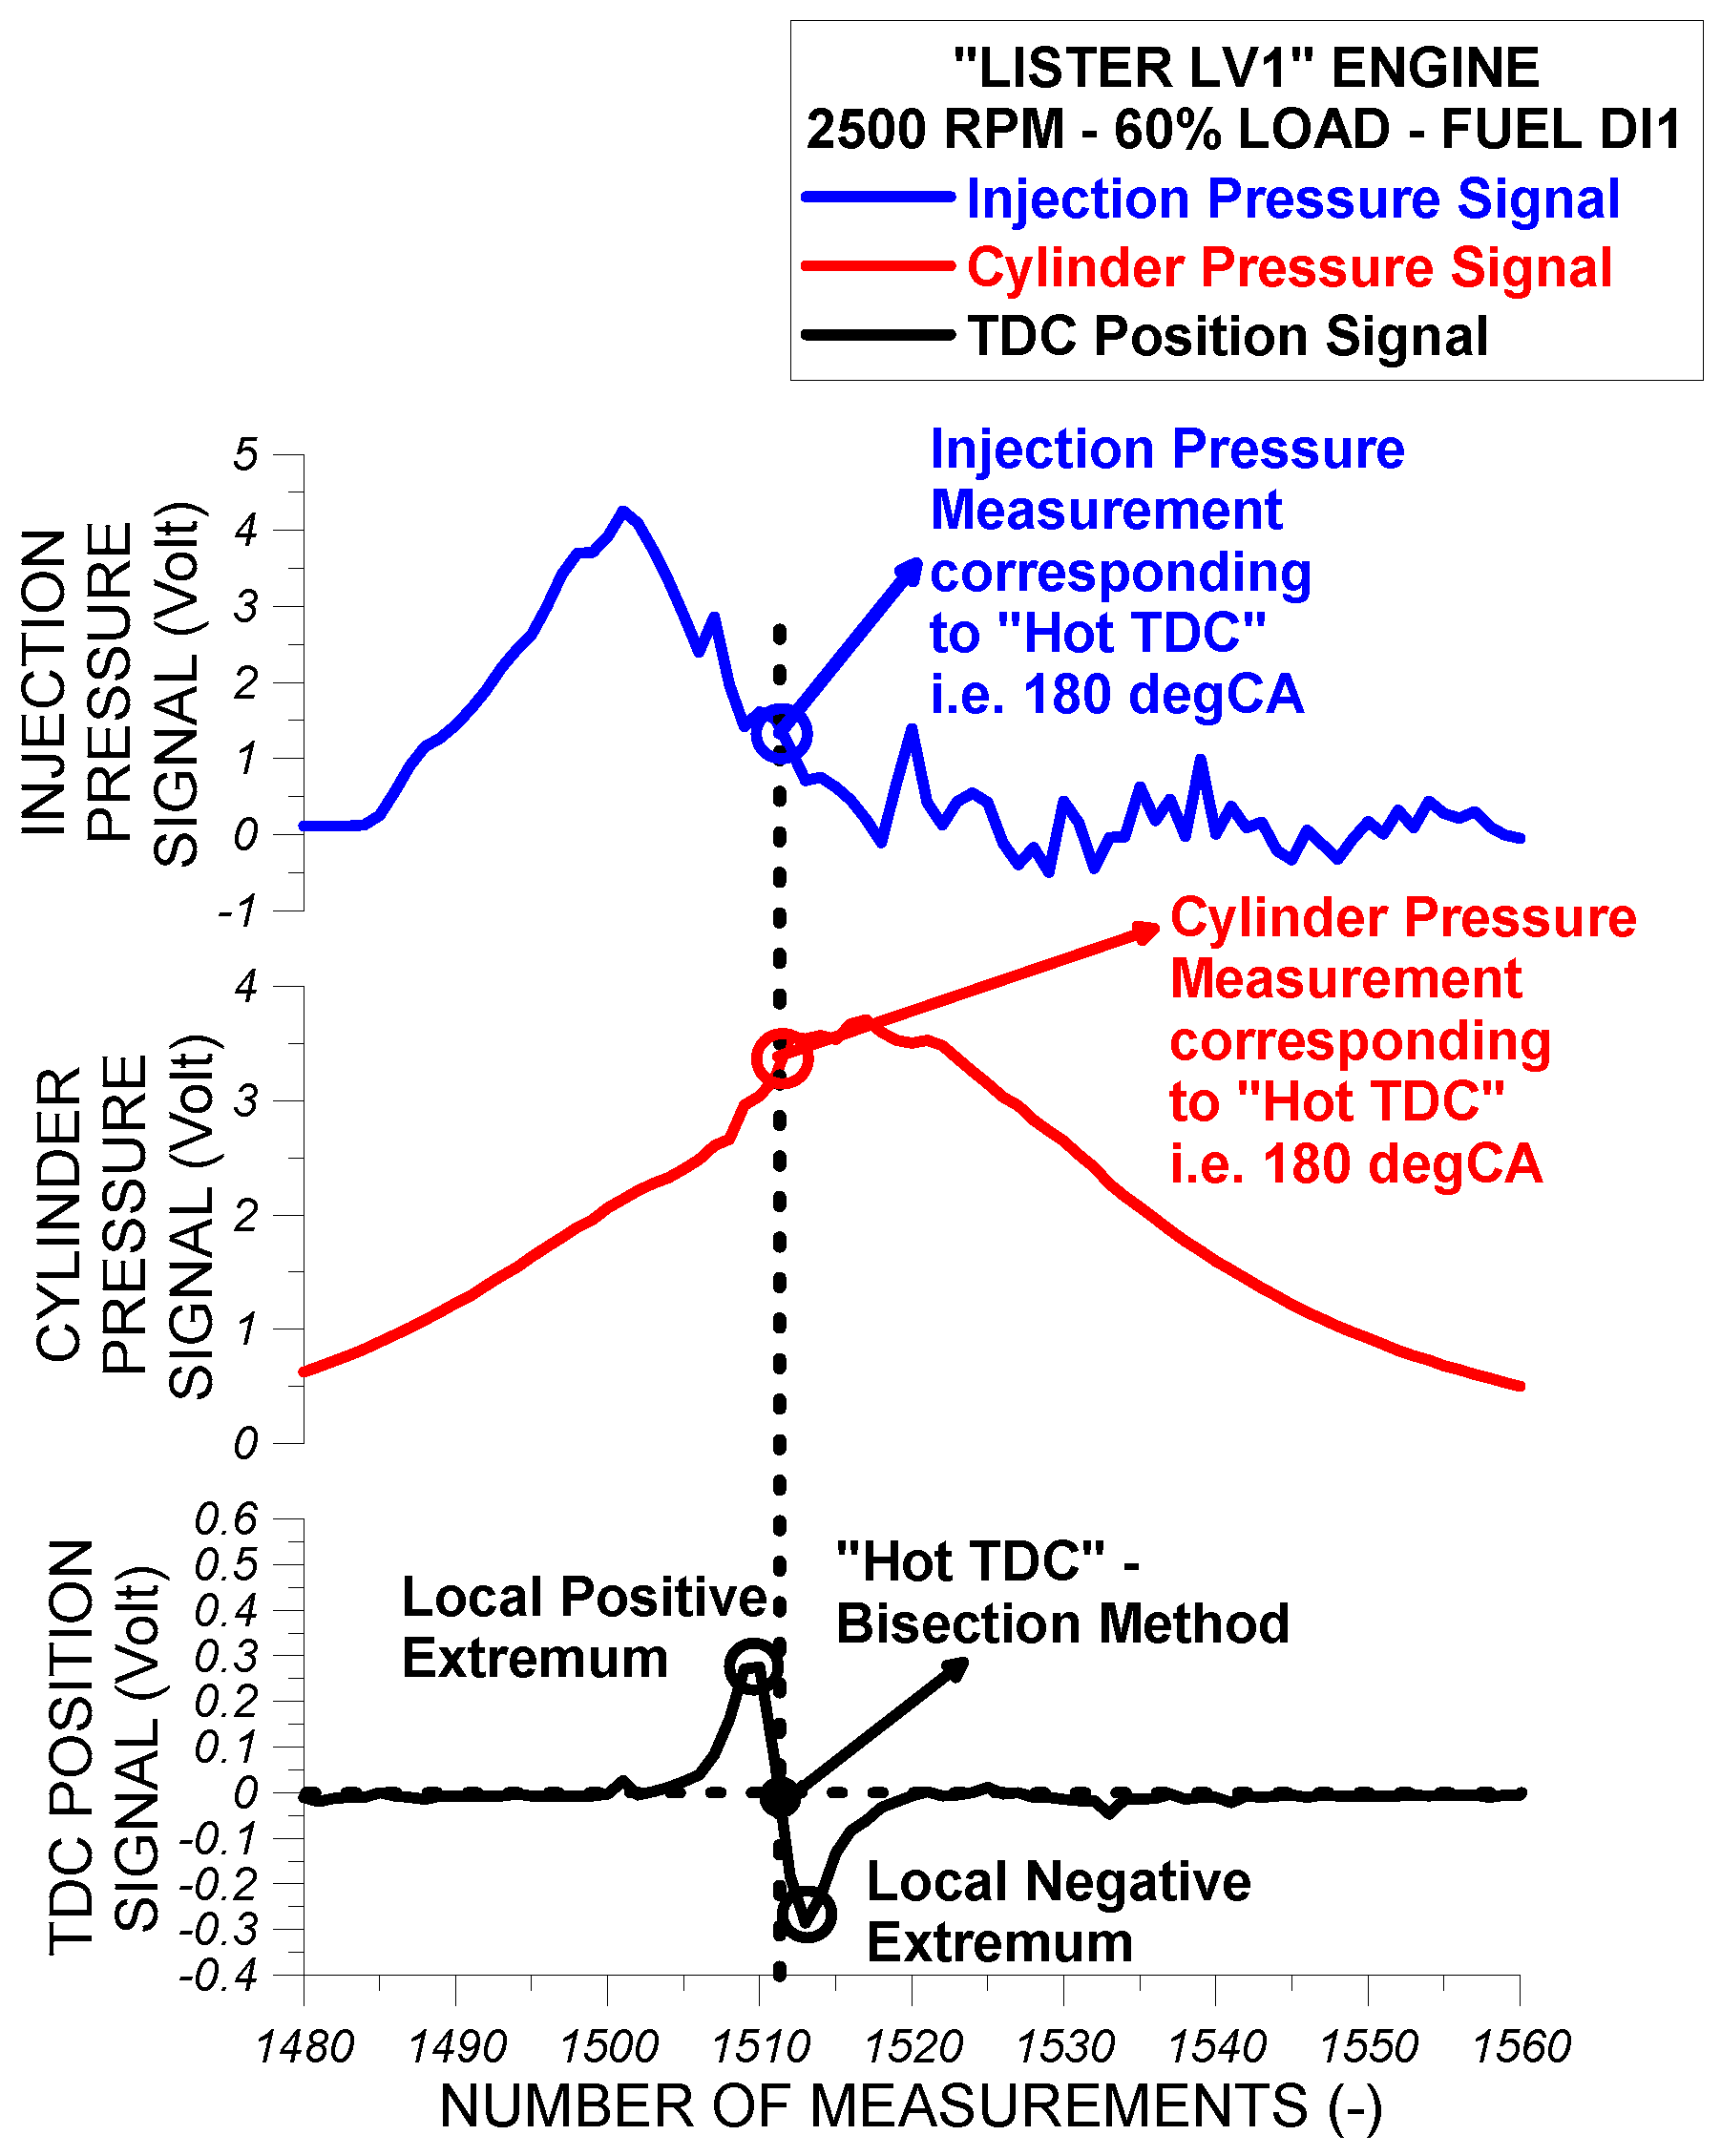
3.3. Description of the Processing Procedure of the Cylinder Pressure, Injection Pressure, and TDC Position Signals Initially Obtained from the Diesel Engine

A computational model was developed in MATLAB [40] for processing initial experimental signals for cylinder pressure, injection pressure, and TDC position previously obtained during an engine testing procedure in “Lister LV1” using test fuels DI1, RME30, GLY10, and GLY30. Engine tests were performed at 2500 rpm and at four engine loads namely 20%, 40%, 60%, and 80% of full engine load. The developed model was used to process the aforementioned experimental signals for generating the average cylinder pressure–crank angle profile and the average fuel injection pressure–crank angle profile and then to use these profiles for calculating the main performance and combustion characteristics of the “Lister LV1” for all test fuels examined. Of particular importance is the description of the mathematical process adopted from the developed model to process the initial cylinder pressure, injection pressure, and TDC position signals over all obtained complete engine cycles for generating the average cylinder pressure and the average injection pressure profiles for each examined engine operating point and each examined test fuel.
Hence, during the engine testing procedure and at each engine operating point after setting the rack position in the fuel pump and after securing constant operating conditions, the following signals obtained from the engine were recorded in a personal PC through a fast data acquisition system: The cylinder pressure signal, the injection pressure signal, and the TDC position signal. In Figure 4, the characteristic signals of cylinder pressure (Figure 4a), injection pressure (Figure 4b), and TDC position (Figure 4c) are shown, as obtained from the diesel engine during testing procedure of fuel DI1 at 2500 rpm and 80% of full load. It should be mentioned that in the specific experimental investigation, 100 consecutive engine cycles were recorded at each engine operating point as evidenced also from Figure 4a–c. In Figure 4a,b, cylinder pressure and injection pressure signals for 10 consecutive cycles are shown.
As evidenced from Figure 5, TDC position signal undergoes, at a specific acquisition point, an abrupt rise and immediately afterwards a steep reduction around zero. The cross-section point of the TDC position curve, which connects the local maximum with the local minimum of the TDC position signal with the zero horizontal line, corresponds to the piston immobilization position at TDC (Figure 6). The number of measurements between two consecutive positions at which the TDC position signal becomes equal to zero provides the number of measurements, which were actually received during a complete engine cycle. The point at which the TDC position signal becomes equal to zero is numerically tracked using the bisection method.
At the point that the TDC position signal becomes equal to zero, it can be matched with a value of crank angle (CA) equal to 180 degCA or 540 degCA (it is assumed that the crank angle is equal to 0 degCA when the piston is at BDC). This procedure provides us with the opportunity to correlate the measured values of cylinder pressure and injection pressure with specific crank angles for a complete engine cycle. Having specified the points at which the TDC position signal becomes equal to zero, we can then determine the points that correspond to TDC positions during combustion (180 degCA) i.e., “hot TDCs” since all other TDC position zero points correspond to the gas exchange period of an engine cycle (540 degCA). The TDC position zero points that are assigned to 180 degCA are those that correspond to the peak values of the cylinder pressure signal. As shown in Figure 6, the tracking of the “hot TDC” can be used for also identifying the cylinder pressure measurement corresponding to “hot TDC” or, in other words, to 180 degCA using the measured cylinder pressure signal and the TDC position signal. Also, as evidenced, the measured injection pressure signal and TDC position signal can be used for correlating the “hot TDC” measurement with the measured injection pressure corresponding to “hot TDC” i.e., to 180 degCA.
Having determined the TDC position points and knowing the number of measurements at each obtained complete engine cycle, the actual acquisition step can be calculated, which is equal to the ratio of the theoretical number of measurements, which are supposed to be obtained during a complete four-stroke engine cycle in the case where the acquisition step was set equal to 1 degCA (720 measurements) to the actual number of measurements obtained during engine tests at a complete engine cycle (e.g., 722 measurements). Small deviations between the theoretical and the actual total number of measurements can be ascribed to the fact the engine crankshaft speed indicates small deviations compared to the specified value during engine tests. Depending on the shaft rotational speed small variation, the actual acquisition step can be lower than 1 degCA, e.g., if the theoretical measurements during a complete engine cycle are 720 and the actual measurements are 722, then the actual acquisition step of measurements is 0.997 degCA. Hence, the distance in crank angle degrees between the cylinder pressure value at 180 degCA i.e., at “hot TDC” and the previous cylinder pressure measurement will be equal to the actual acquisition step in crank angle degrees. The same distance in crank angle degrees will be the cylinder pressure value at 180 degCA and the next cylinder pressure measurement. For example, if the actual acquisition step is 0.997 degCA and starts from the cylinder pressure measurement at 180 degCA, the previous cylinder pressure measurement will be assigned to 180 − 0.997 = 179.003 degCA and the next cylinder pressure measurement will be assigned to 180 + 0.997 = 180.997 degCA. Consequently, using the actual acquisition step in crank angle degrees, we can start from the cylinder pressure values at 180 degCA and move backward and forward assigning cylinder pressure measurements to crank angles for all the complete engine cycles. It should be underlined here that not all measured engine cycles are complete, meaning that the recording of the pressure and the TDC position signals does not start from the beginning of the first cycle and it does not end at the end of the last cycle. Hence, usually the first and the last engine cycles are excluded from the analysis since they do not contain measurements close to pre-described theoretical total number of measurements per cycle i.e., 720. Having assigned the measured cylinder pressure values to non-integer crank angle degrees for each complete cycle a linear interpolation can be used for calculating cylinder pressure values corresponding to integer crank angle degrees i.e., from 1 to 720 degCA and for each complete engine cycle. The cylinder pressure piezoelectric transducer constant in bar/Volt is then used for converting cylinder pressure measurements from Volt to bars. This way, the cylinder pressure crank angle degree profile for each complete engine cycle is generated. The same procedure is followed for tracking the injection pressure value corresponding to “hot TDC” and thus to 180 degCA, and then to derive the injection pressure–crank angle degree profile for each complete engine cycle. It should be noticed that in the case of fuel injection–crank angle degree profiles an adjustment of the fuel injection pressure was made at each operating case for taking into account the residual pressure of the fuel injection system through piezoelectric transducer drift.
Also, it should be mentioned that the cylinder pressure and injection pressure data analysis is performed considering constant shaft speed, which is equal to the one derived from the actual acquisition step. As known, the engine rotational speed varies during an engine operation cycle mainly due to the inertia of the moving masses of the main kinematic mechanism. However, the effect of reciprocating and rotating masses of “Lister LV1” engine on its angular velocity cycle variation is partially counterbalanced by the flywheel. Also, “Lister LV1” is a small lightweight engine and thus, high inertia forces are not expected. For this reason, the present “Lister LV1” engine performance analysis is performed considering constant angular velocity i.e., engine speed during an engine operation cycle.
At this point, it should be underlined that all three signals of TDC position, cylinder pressure, and injection pressure are not received at exactly the same time instant from the fast acquisition card. In other words, there is a time phase between the three recorded signals. Specifically, during an acquisition step, all three signals are recorded. Hence, the time phase between two consecutive signals is equal with 1/3 of the acquisition step e.g., if the acquisition step is set to 1 degCA, then at the first 1/3 of the degree the cylinder pressure signal is recorded, at the second 1/3 of the degree the injection pressure signal is recorded, and at the final 1/3 of the degree the TDC position signal is recorded.
The values of cylinder pressure and injection pressure for each complete engine cycle are then used to calculate the average cylinder pressure–crank angle and the average injection pressure–crank angle profiles. The determination of the average cylinder pressure–crank angle and the average injection pressure–crank angle profiles provides us with the opportunity to calculate the engine performance parameters of the examined diesel engine such as indicated work and power, IMEP, ISFC, gross and net heat release rate, ignition delay, and combustion duration. The derivation of individual cylinder pressure and injection pressure profiles for all recorded complete engine cycles and their processing for performance and heat release rate analysis has proven quite useful in engine cases where there is cyclic variation on performance and combustion characteristics between consecutive engine cycles.
Having estimated the cylinder pressure–crank angle degree profile for each recorded complete engine cycle and also for the average cycle, the indicated work per cylinder can be calculated and through this the cylinder indicated power. Hence, the measured cylinder pressure–crank angle degree profiles are transformed to cylinder pressure–instantaneous cylinder volume profiles and then, the trapezoidal method is used for integrating each cylinder pressure–volume profile and for calculating indicated power and IMEP [43,44]. This way, the covariance (COV) of the IMEP can be estimated for each obtained complete cycle providing the opportunity to examine the effect of test fuels on the cyclic variability of the cylinder pressure profile. According to Byttner et al. [45], the COV(IMEP) is calculated as follows:
COV ( IMEP ) = σ ( IMEP ) μ ( IMEP )
where σ and μ are the standard deviation and the mean value of IMEP over all recorded complete engine cycles. A similar mathematical relation with the aforementioned one was also used to calculate the covariance of the mean injection pressure for assessing the effect of test fuels on the cyclic variation of mean fuel line pressure.
The calculation of the heat release rate is of high importance in diesel engines since, from its processing, very important information can be extracted, such as the initiation and the completion of the combustion, the quality of combustion, the fuel burning rate, and the duration and the intensity of the premixed and the diffusion-controlled in-cylinder combustion. Hence, the following mathematical formula, which has been thoroughly analyzed by Heywood [46], is used to calculate the instantaneous net heat release rate:
d Q net d φ = d Q g r o s s d φ d Q l o s s d φ = ( 1 + c V R ) p d V d φ + c V R V d p d φ .
In the previous relation, the term d Q g r o s s / d φ is called total or gross heat release rate, whereas the difference d Q n e t / d φ is called net heat release rate [46,47]. The term d Q l o s s / d φ corresponds to the instantaneous in-cylinder gas heat transfer losses, which are transferred to the cylinder walls mainly through heat convection and secondarily, after combustion initiation, mainly through additional heat radiation due to flame development and combustion-released burning particles. In the present study, the well-known Annand model [46,48] is used to calculate the instantaneous heat losses since this model has already been used successfully for heat release rate calculations [34,35,36,41] and also in experimental transfer studies [49]. It is worth mentioning that Annand model was calibrated in the present analysis at each operating point using the following relation:
m ˙ f = Q ˙ g r o s s , t o t L H V
where m ˙ f the measured fuel injected quantity per engine cycle, Q ˙ g r o s s , t o t is the total gross heat released during an engine cycle, and LHV is the lower heating value of each examined fuel.
The accurate calculation of the combustion duration during an engine cycle is not easy and simple since the precise determination of the end of combustion is quite difficult. This is due to the fact the heat release rate curve indicates fluctuations towards the end of combustion and thus the precise end of combustion is quite difficult to be spotted. For this reason, in many diesel combustion investigations, various combustion durations are defined, which correspond to different proportions of fuel injected mass such as CA5, CA25, CA50, and CA90 or CA95, which correspond to the combustion duration in crank angle degrees of the 5%, 25%, 50%, and 90% or 95% of fuel injected mass per cycle, respectively.
The computational model can be used for experimental data processing of either four-stroke or two-stroke diesel engines where measurements of cylinder pressure, injection pressure, and TDC position (three sensors) were obtained, or it can be used for processing only measurements of cylinder pressure and TDC position (two sensors). Also, it should be underlined that most of the input data of the computational model can be found in any case of examined diesel engine from the engine manufacturer manual, the manufacturers of piezoelectric transducers for cylinder pressure and injection pressure transducers, and the fuel preparation refineries. Hence, the developed experimental data processing model can provide reliable results for the following diesel engine performance and combustion characteristics:
  • Cylinder pressure–crank angle and injection pressure–crank angle profiles for each measured complete engine cycle at a certain engine operating point;
  • Average cylinder pressure–crank angle and injection pressure–crank angle profiles over all measured complete engine cycles at a certain engine operating point;
  • Indicated work and power;
  • Indicated mean effective pressure (IMEP) per engine cycle and per average cylinder pressure profile at a certain engine operating point;
  • Indicated specific fuel consumption (ISFC);
  • Engine mechanical efficiency;
  • Brake-specific fuel consumption (BSFC);
  • Actual acquisition step in crank angle degrees;
  • Actual engine speed;
  • Instantaneous gross and net heat release rates for each measured cycle cylinder pressure profile and for the average cylinder pressure profile at a certain engine operating point;
  • Instantaneous heat transfer loss rate for each measured cycle cylinder pressure profile and for the average cylinder pressure profile at a certain engine operating point;
  • In-cylinder gas temperature–crank angle profile for each measured cycle cylinder pressure profile and for the average cylinder pressure profile at a certain engine operating point;
  • Cumulative gross and net heat release rates for each measured cycle cylinder pressure profile and for the average cylinder pressure profile at a certain engine operating point;
  • Cumulative heat loss rate for each measured cycle cylinder pressure profile and for the average cylinder pressure profile at a certain engine operating point;
  • Instantaneous and cumulative fuel burning mass rates for the average cylinder pressure profile at a certain engine operating point;
  • Ignition angle and ignition delay for the average cylinder pressure profile at a certain engine operating point;
  • Peak cylinder pressure and corresponding crank angle for each measured cycle cylinder pressure profile and for the average cylinder pressure profile at a certain engine operating point;
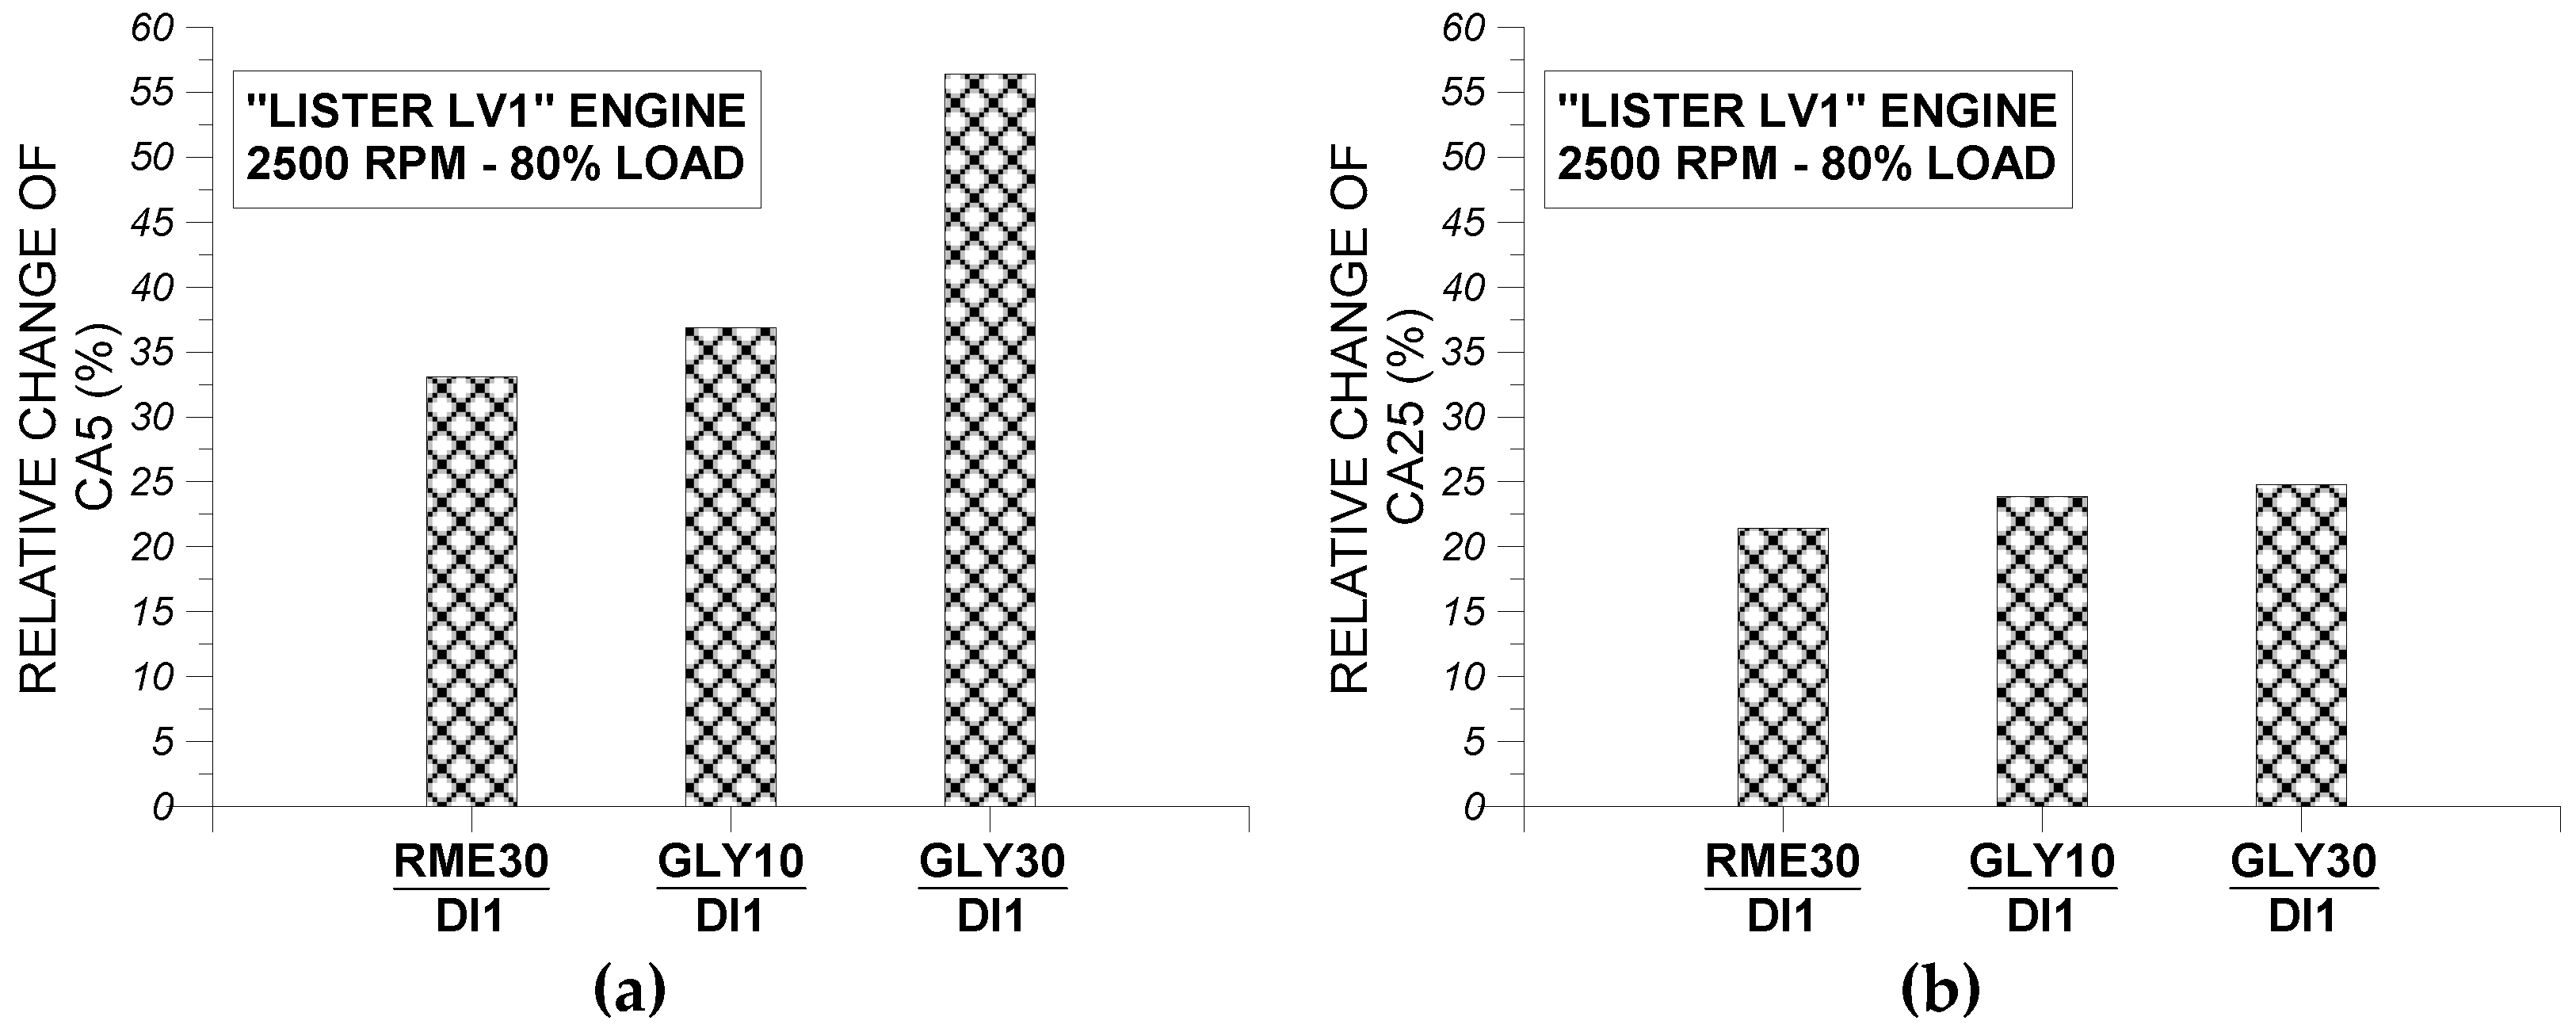
  • Combustion durations of 5%, 25%, 50%, 90%, and 100% of the total injected fuel mass for each measured cycle cylinder pressure profile and for the average cylinder pressure profile at a certain engine operating point;
  • Average injection pressure, dynamic injection timing (i.e., start of injection, SOI), peak injection pressure, and fuel injection duration for the average cylinder pressure profile at a certain engine operating point.

4. Results and Discussion

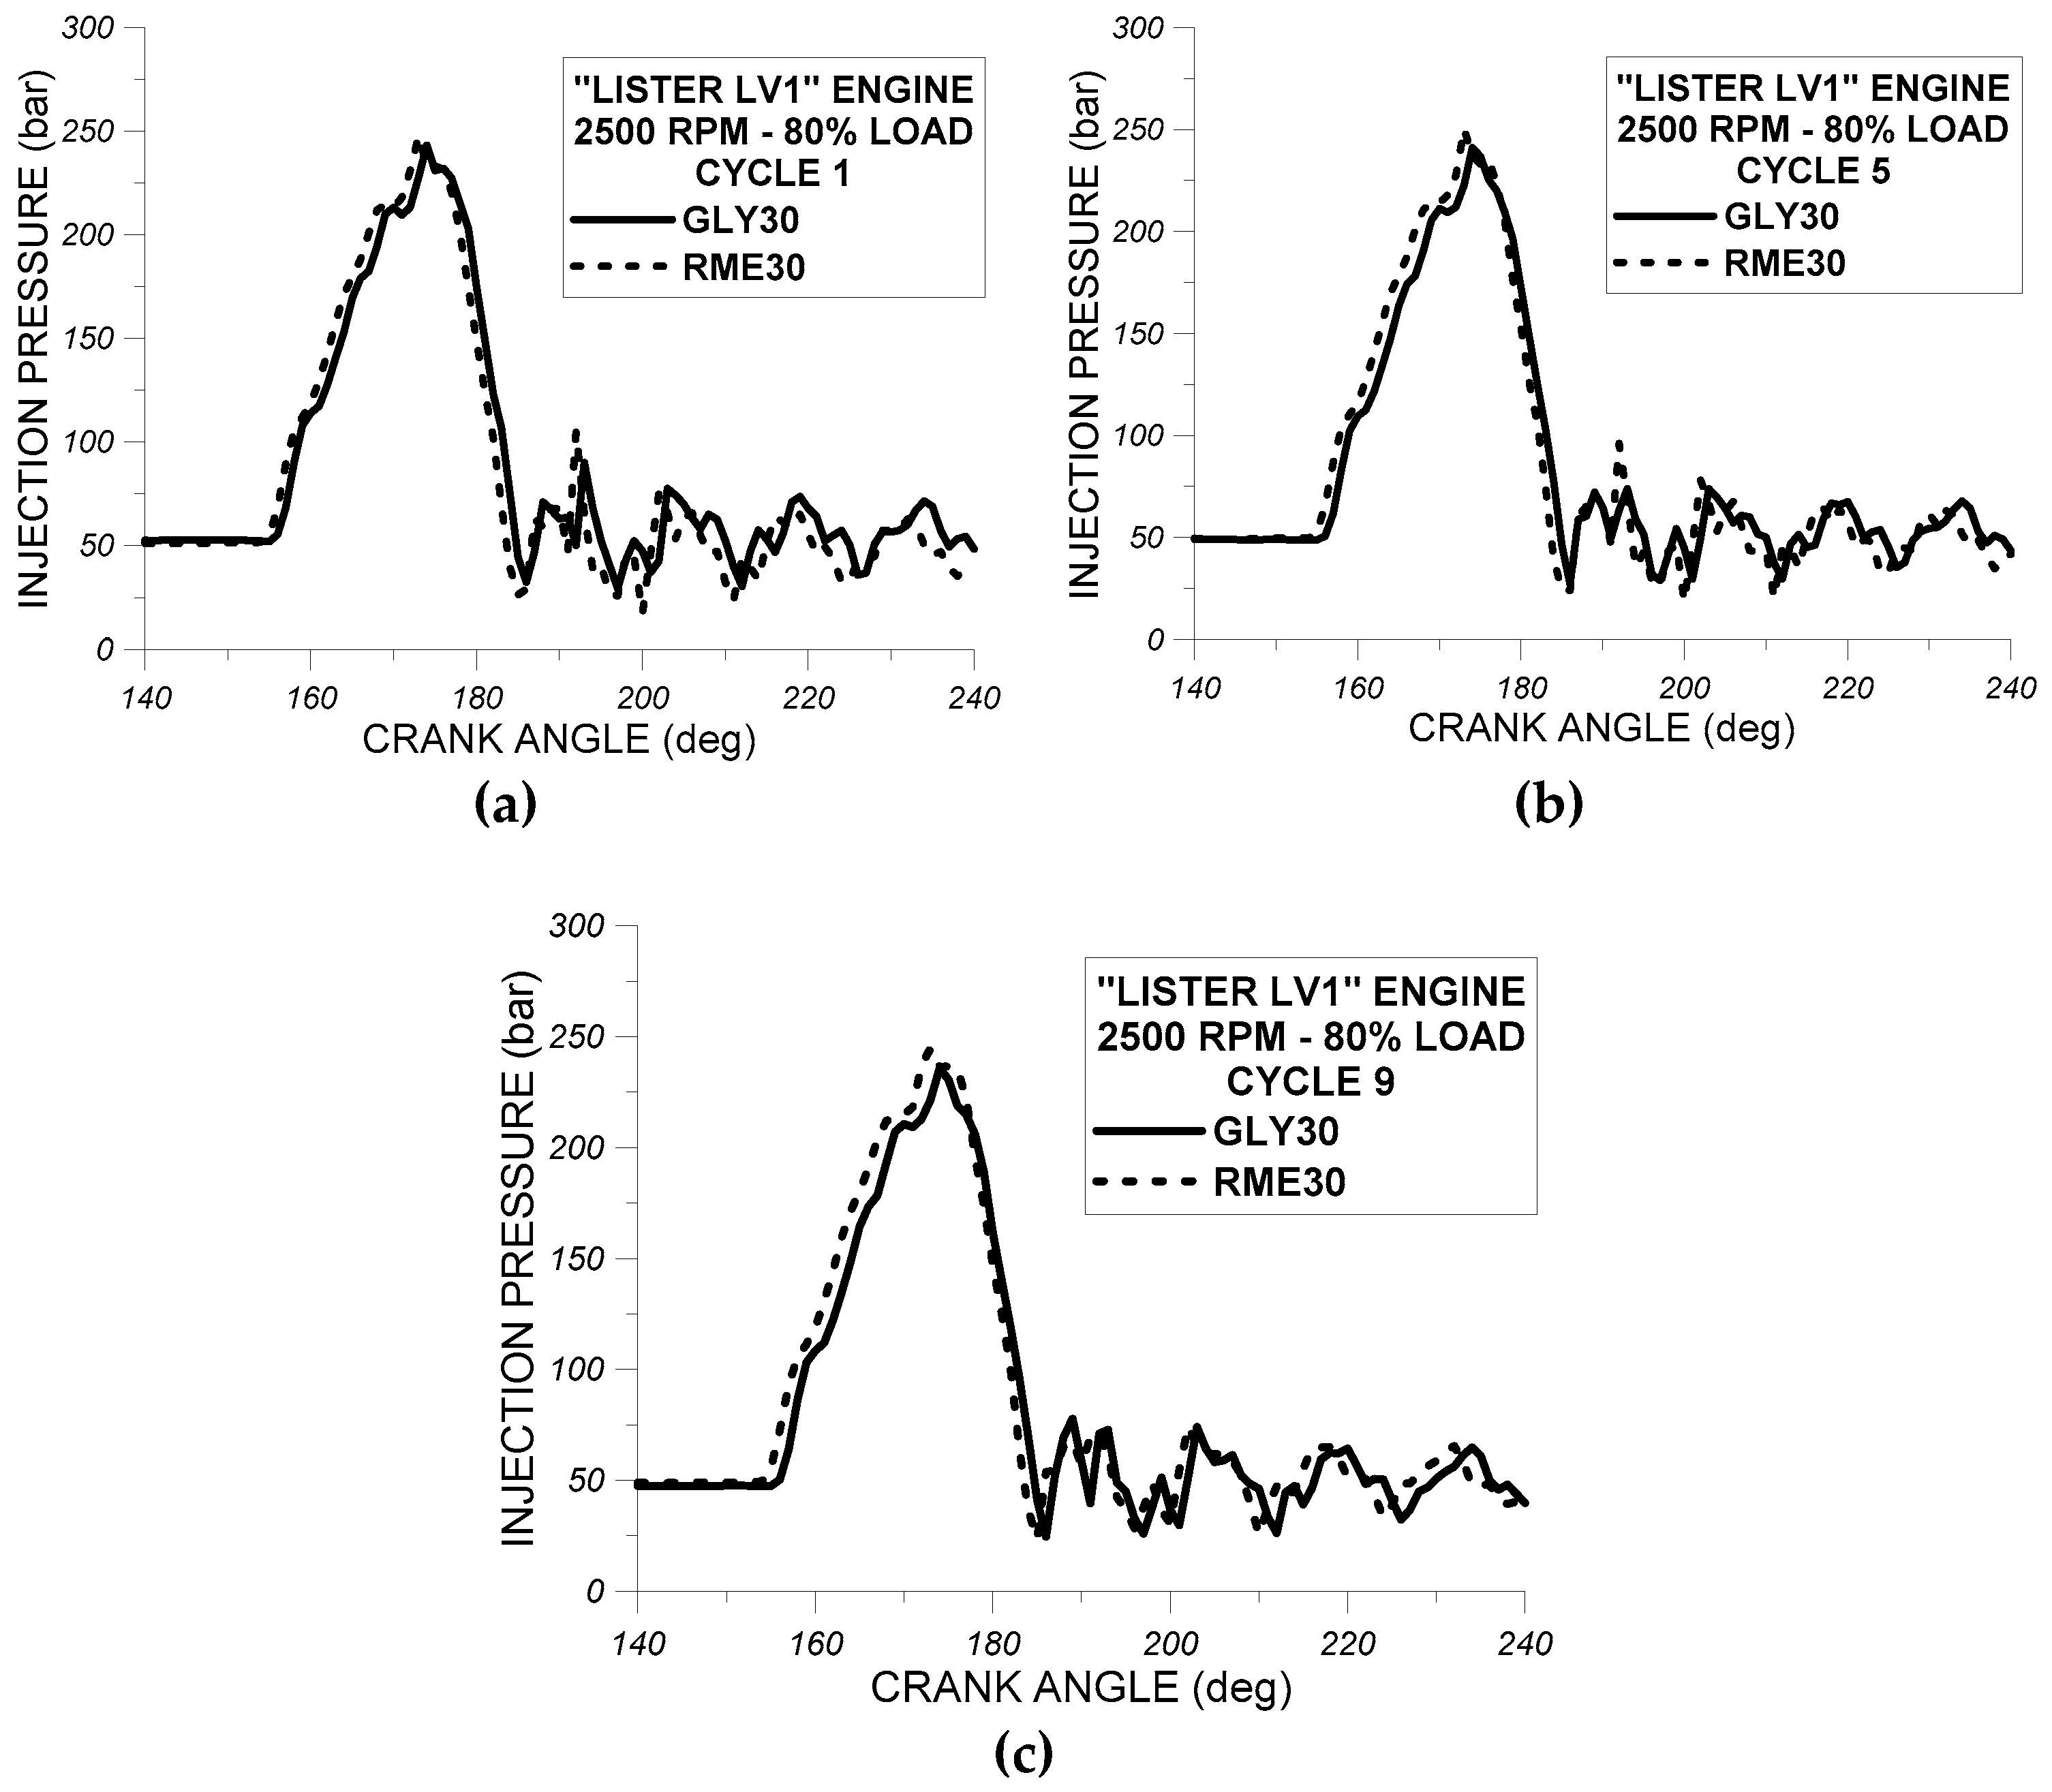
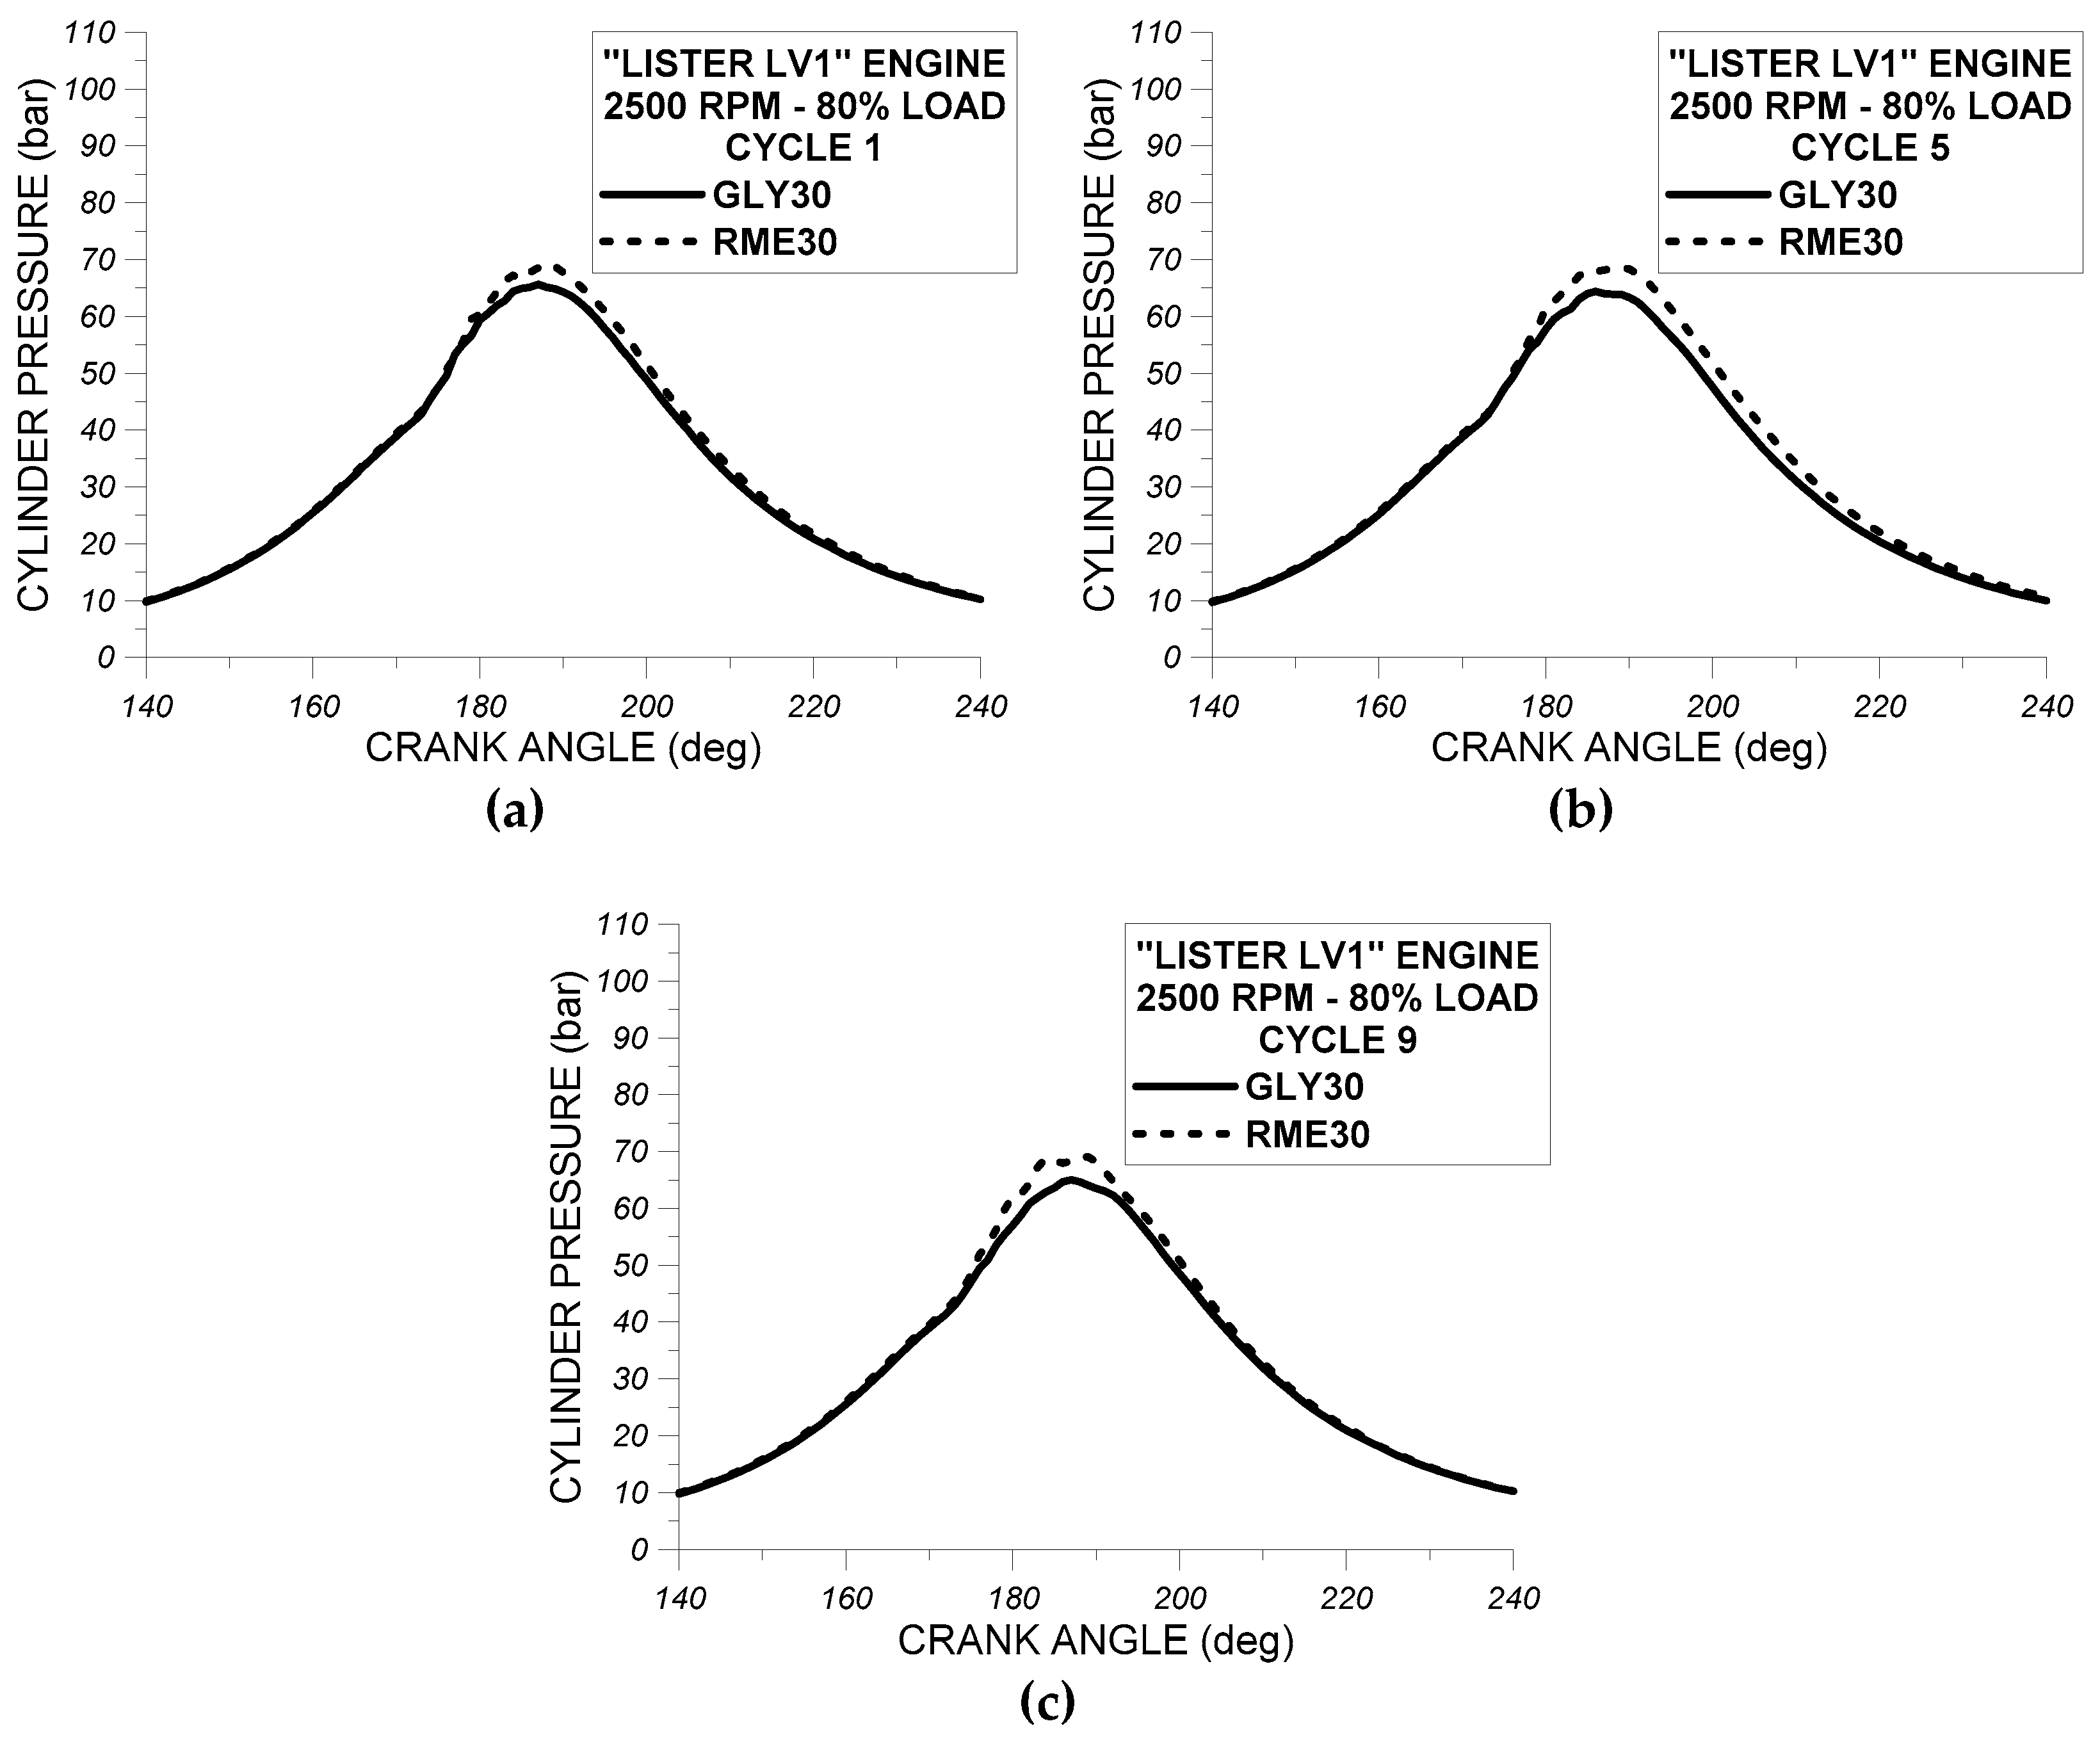
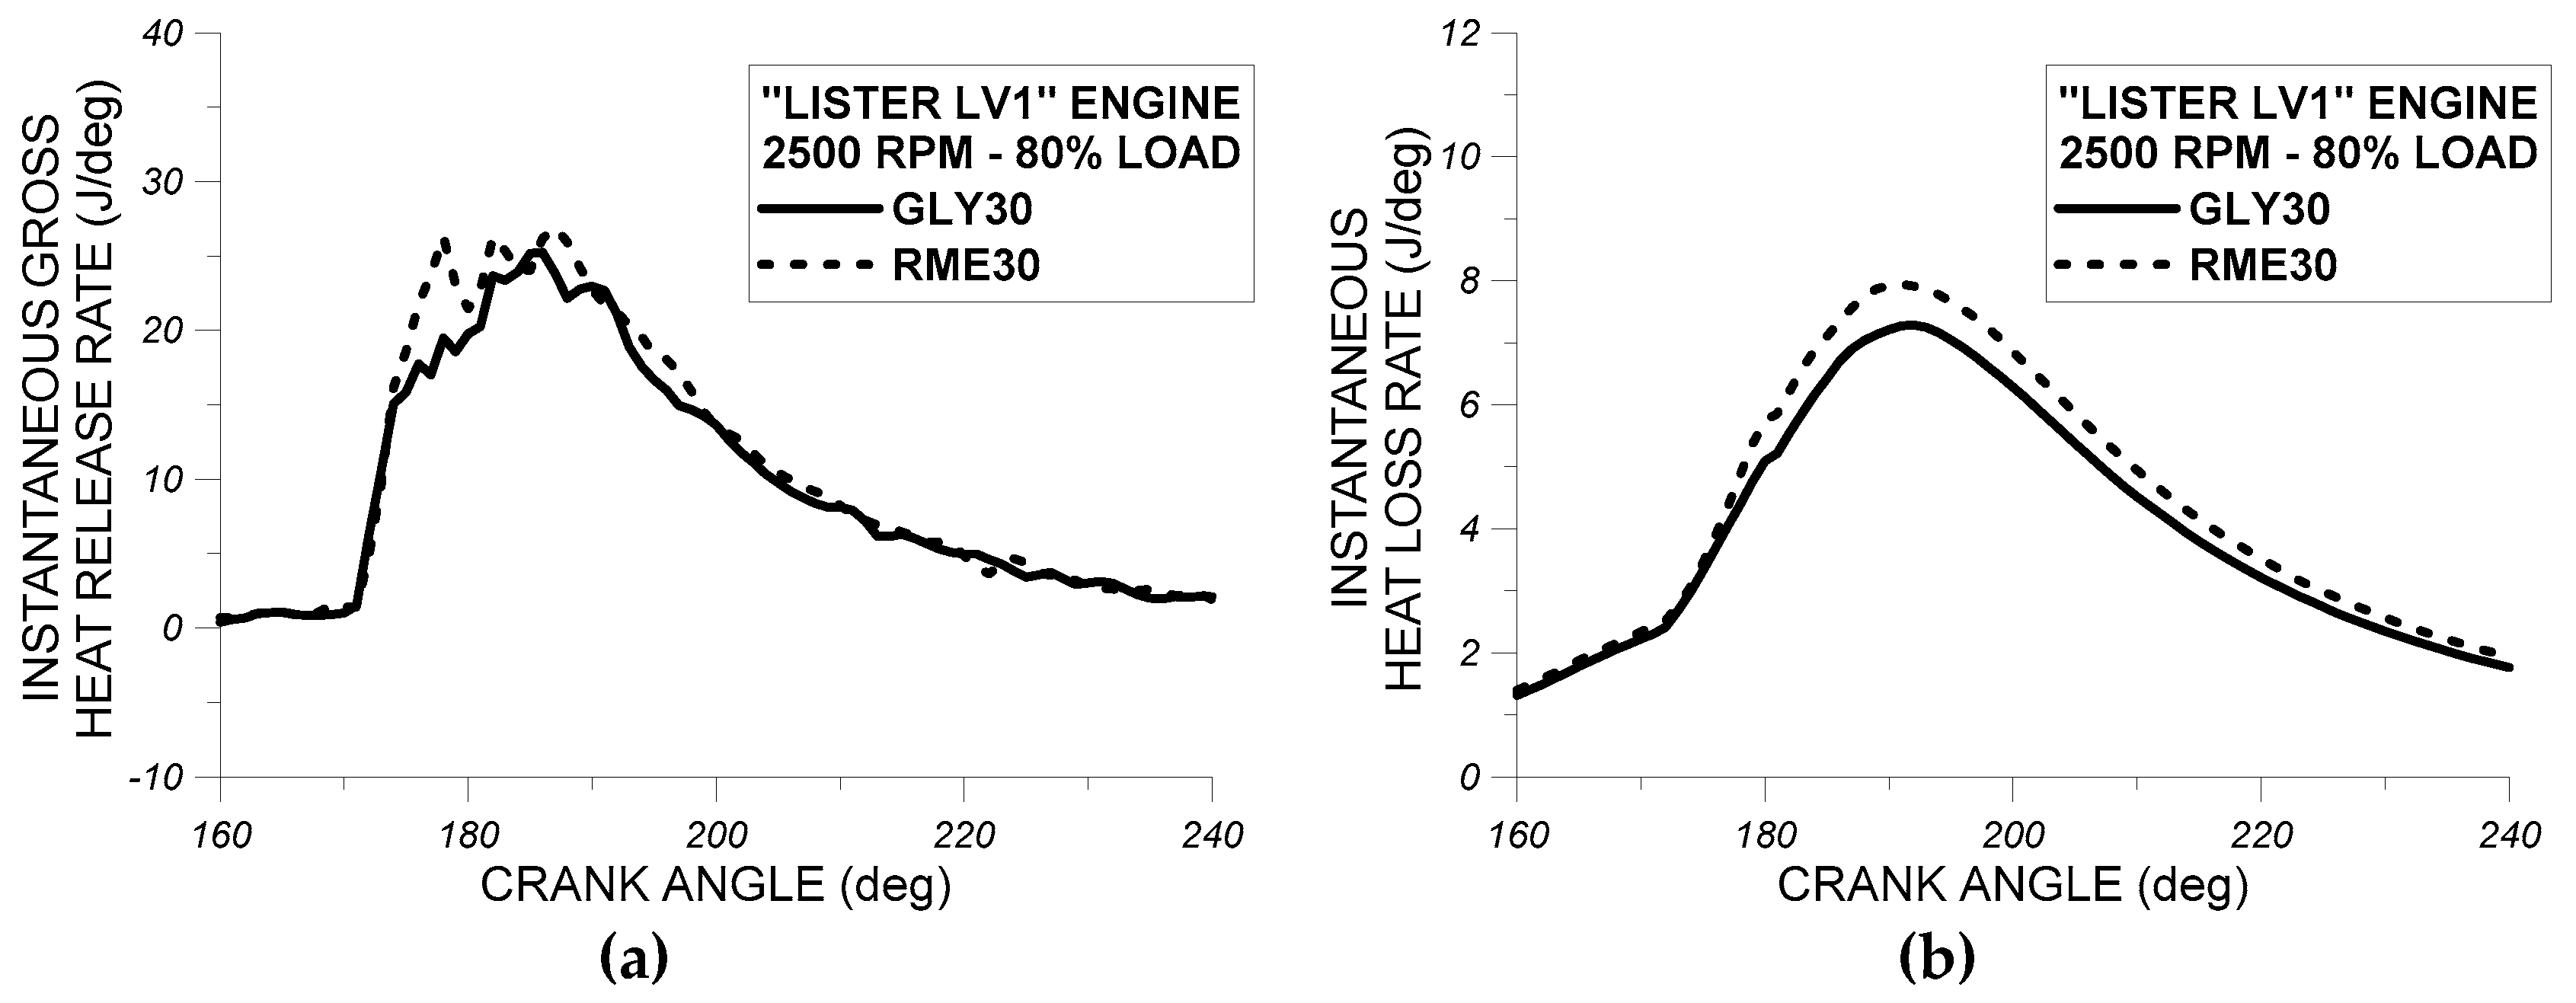
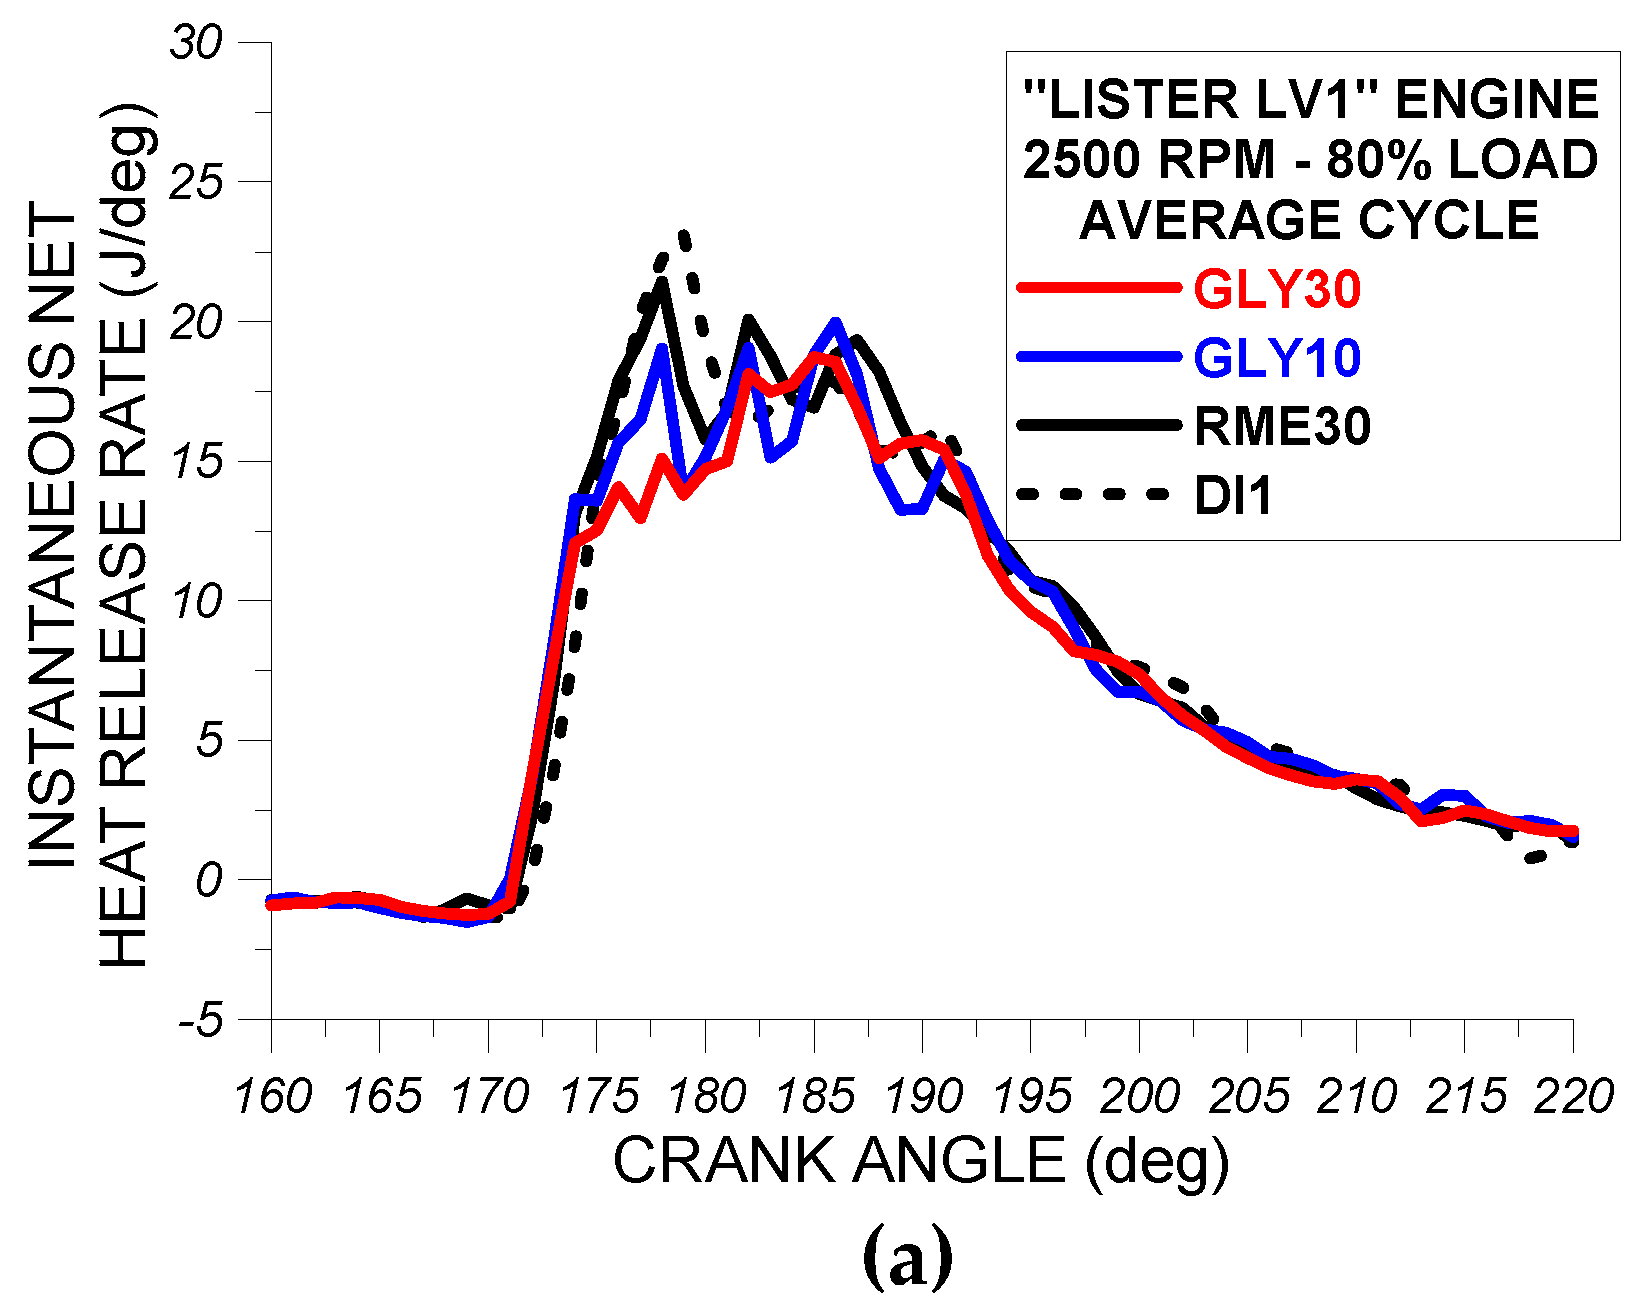
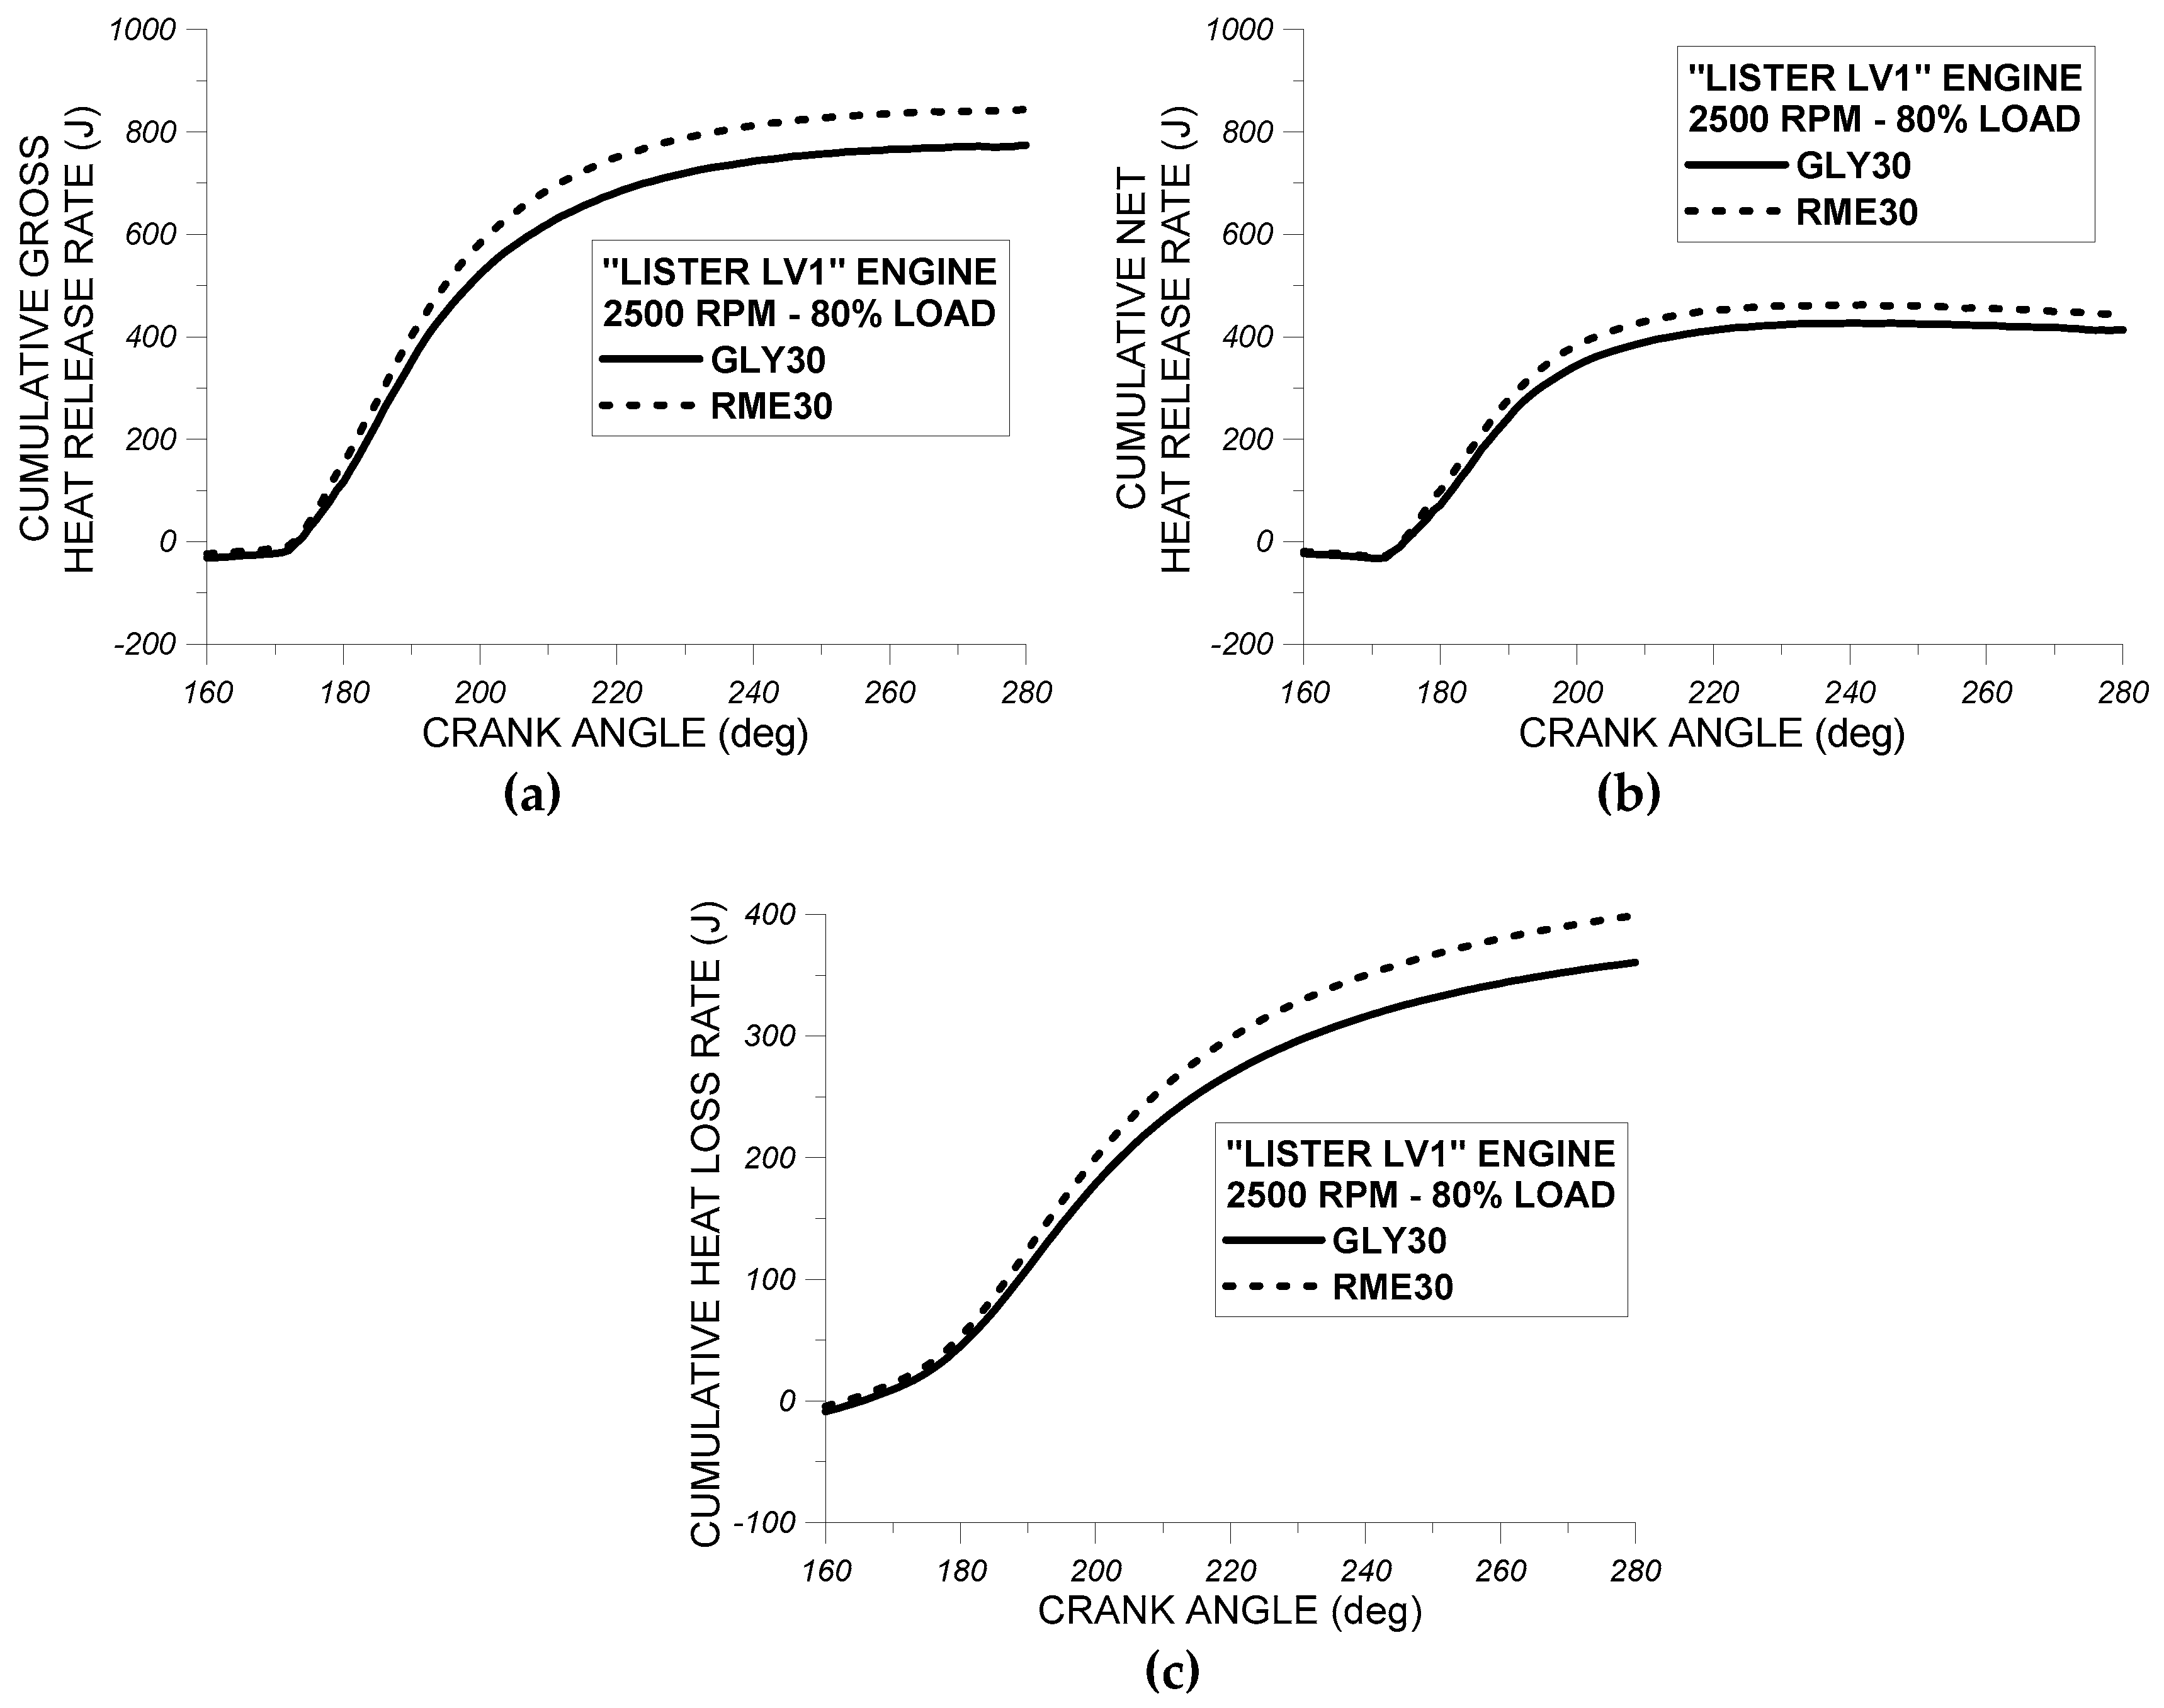
4.1. Effect of RME30 and GLY30 on HSDI Diesel Engine-Measured Cylinder Pressure and Injection Pressure Cycle-to-Cycle Variation and Average Cycle Heat Release Rate Analysis Results

The oxygenated fuels RME30 and GLY30 have almost the same mass percentage (31 mass-%) of two different oxygenated additives (RME and mixture of glymes). Hence, the evaluation of experimental results for cylinder pressure, injection pressure, and heat release rates for these two fuels at 2500 rpm and at 80% of full load facilitate the extraction of conclusions about their effect on diesel injection and combustion mechanisms.
In Figure 7a–c, experimental results for fuel injection pressure profiles of RME30 and GLY30 of the first (Figure 7a), the fifth (Figure 7b), and the ninth (Figure 7c) engine recorded cycle at 2500 rpm and at 80% of full load are shown. All experimental results shown in Figure 7a–c are given for the high-speed single-cylinder DI diesel engine “Lister LV1”. It was decided that the effect of RME30 and GLY30 on the fuel injection pressure profiles of the first, the fifth, and the ninth recorded complete engine cycle would be examined to assess the impact of these oxygenated fuels on the cycle variation of the fuel line pressure, since the physical properties of these fuels may influence the behavior of the fuel injection system.
From the observation of Figure 7a–c, it is concluded that the use of fuel RME30 in “Lister LV1” engine resulted in an earlier initiation of fuel injection pressure rise and also in a steeper injection pressure rise compared to fuel GLY30. These observations can be attributed to the lower compressibility factor of RME30 compared to GLY30. Also as evidenced from Figure 7a–c, the individual impact of fuels RME30 and GLY30 on fuel injection pressure profile do not vary noticeably from one engine cycle to another, indicating that the fuel injection pressure system performs almost the same when using either RM30 or GLY30.
In Figure 8a–c, experimental results for cylinder pressure profiles of RME30 and GLY30 of the first (Figure 8a), the fifth (Figure 8b), and the ninth (Figure 8c) complete engine cycle at 2500 rpm and at 80% of full load of “Lister LV1” engine are shown. We also decided to assess the effect of RME30 and GLY30 on the cylinder pressure profiles of the first, the fifth, and the ninth obtained complete engine cycles to evaluate the impact of these oxygenated fuels on the cycle variation of the measured cylinder pressure.
From the examination of Figure 8a–c, it results that fuel RM30 indicates higher cylinder pressures around TDC and slightly higher cylinder pressures during expansion stroke compared to fuel GLY30. Hence, slightly higher amounts of combustion energy are released during the first stages of combustion in the case of RME30 compared to GLY30. Also, slightly higher combustion energy is released during diffusion-controlled combustion, thus leading to slightly higher in-cylinder pressures during expansion stroke for fuel RME30 compared to GLY30. These observations can be possibly ascribed to the earlier injection pressure rise and, thus, earlier initiation of in-cylinder fuel injection for fuel RME30 compared to GLY30 led to the preparation of slightly higher fuel quantity in the case of RME30. Also, according to Figure 8a–c, no noticeable variations from one cycle to another in cylinder pressure profile differences between fuels RME30 and GLY30 are evidenced, leading to the conclusion that the specific oxygenated fuels do not cause significant cyclic variation regarding cylinder pressure.
In Figure 9a, comparative experimental results for instantaneous gross heat release rate for test fuels RME30 and GLY30 at 2500 rpm and at 80% of full load are given. Initial predictions for instantaneous gross heat release rate were smoothed using an intrinsic smoothing spline function of MATLAB [40] and the smoothed gross heat release rate results are given in Figure 9a. In addition, in Figure 9b, comparative results for the instantaneous in-cylinder heat loss rate for RME30 and GLY30 at 2500 rpm and at 80% of full load are presented. Gross heat release and heat loss rate results for fuels RME30 and GLY30, provided in Figure 9a,b, were calculated using the corresponding experimental results of cylinder pressure of the average cycle from all recorded ones at 2500 rpm and at 80% load.
As observed from Figure 9a, both fuels RME30 and GLY30 indicate almost the same ignition angles, thus meaning combustion is initiated for both fuels at almost the same angle. Also, according to Figure 9a, the intensity of premixed and diffusion-controlled combustion phases are relatively higher for test fuel RME30 compared to fuel GLY30. This observation, as already explained, can be attributed to the earlier initiation of injection process for test fuel RME30 compared to GLY30, which results in the premixed combustion of a relatively higher fuel mass. The spontaneous combustion of a relatively higher fuel mass in the case of RME30 with slightly higher heat of combustion compared to GLY30 results in higher premixed combustion-released energy and thus, more intense premixed combustion. Also, the use of RME30 results in slightly higher amounts of combustion-released energy during diffusion-controlled combustion compared to the use of GLY30.
From the observation of Figure 9b, it can be concluded that the fuel RME30 indicates higher instantaneous heat loss rates during all stages of combustion (i.e., both premixed and diffusion-controlled combustion) around TDC and during expansion stroke compared to GLY30. This observation can be attributed to the higher in-cylinder bulk gas temperatures experienced for test fuel RME30 compared to GLY30 during combustion as a result of the aforementioned higher in-cylinder pressures.
In Figure 10a, comparative experimental results for the cumulative gross heat release rate between fuels RME30 and GLY30 are given. Also, in Figure 10b, comparative experimental results for the cumulative net heat release rate between fuels RME30 and GLY30 are presented, and finally, in Figure 10c, comparative results for the cumulative heat loss rate between fuels RME30 and GLY10 are given. All results shown in Figure 10a–c correspond to “Lister LV1” engine operation at 2500 rpm and at 80% of full load. From the observation of Figure 10a,b, it results that fuel RME30 indicates higher values of cumulative gross and net heat release rate compared to fuel GLY30 after TDC during expansion stroke. This observation follows the observations previously made for the differences in instantaneous gross and net heat release rates between fuels RME30 and GLY30. Finally, the higher instantaneous heat loss rate observed in Figure 9a for test fuel RME30 compared to fuel GLY30 also results in higher cumulative heat loss rate for RME30 compared to GLY30 after TDC, as evidenced from Figure 10a.
Hence, from the observation of the effects of RME30 and GLY30 on fuel injection and in-cylinder combustion characteristics, it can be concluded that the combustion mechanism is primarily affected by the fuel injection process which, as evidenced, is controlled by oxygenated fuels physical properties and mainly by the lower compressibility factor of RME30 compared to GLY30. This observation should be kept in mind in contrast with the higher oxygen content of GLY30 compared to RME30, which it would be expected to enhance local fuel combustion rates. Hence, the lower compressibility factor of RME30 appears to overwhelm the higher oxygen content of GLY30 regarding their impact on in-cylinder combustion mechanism and its characteristics.

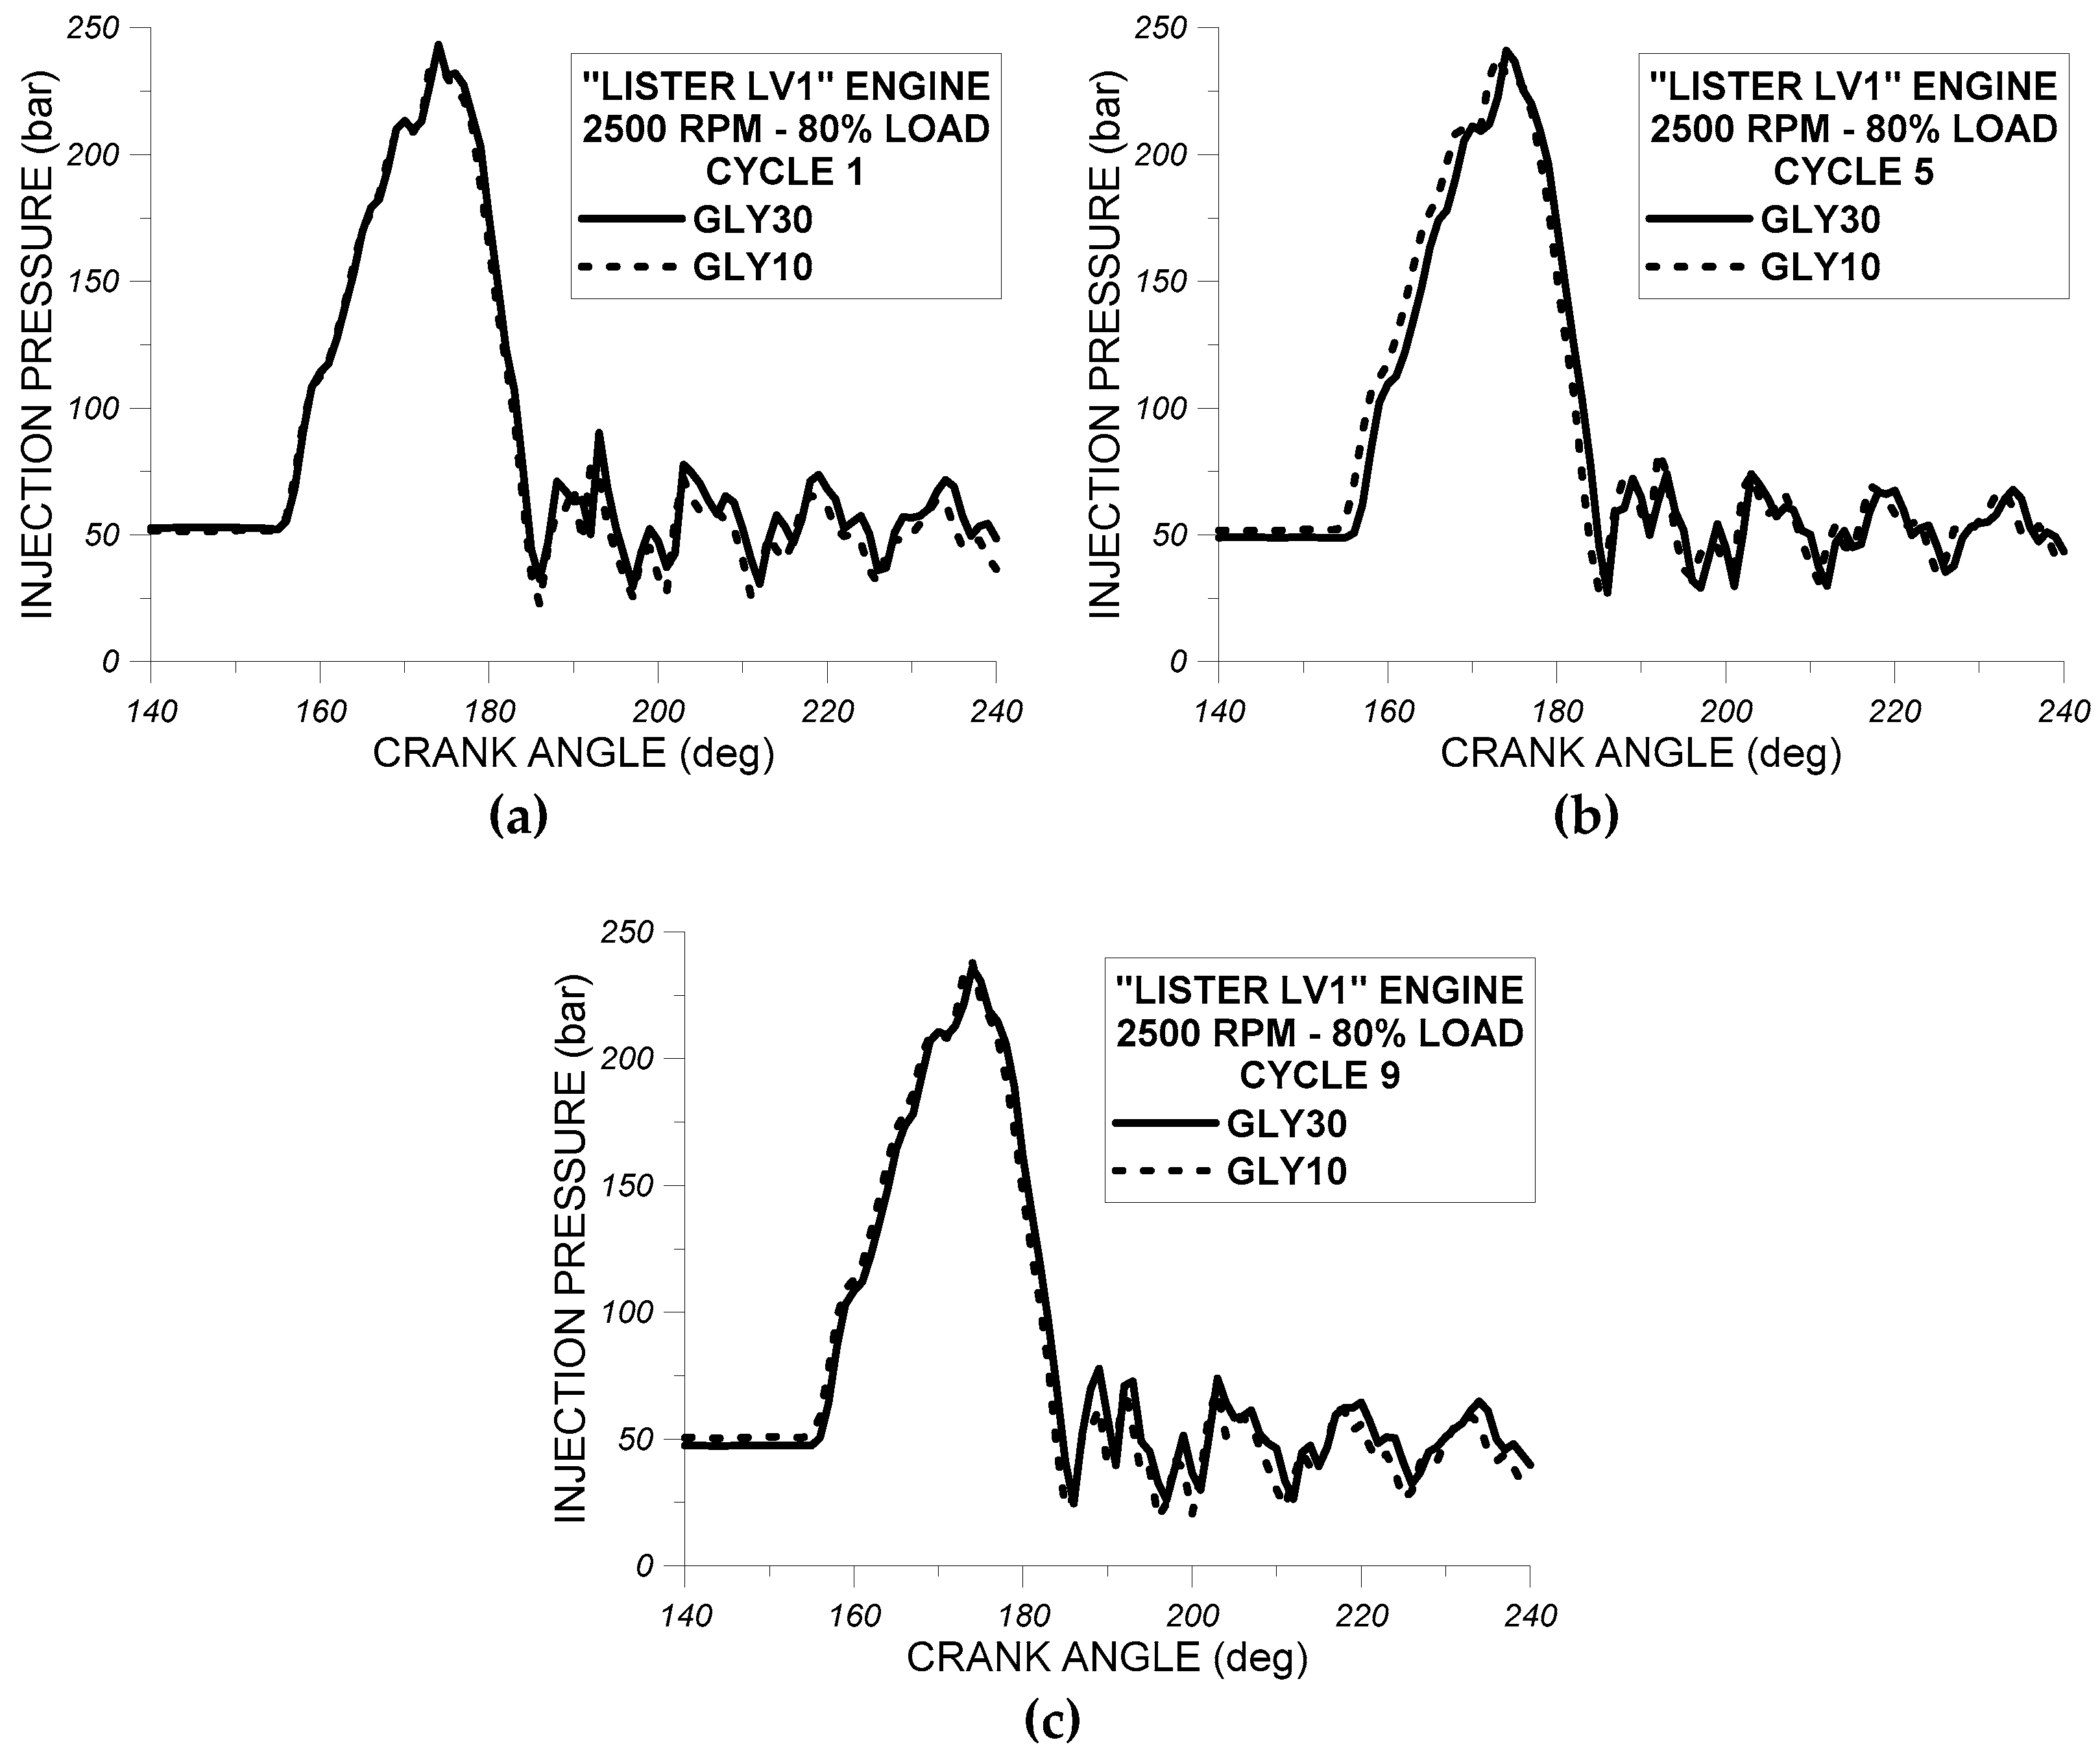
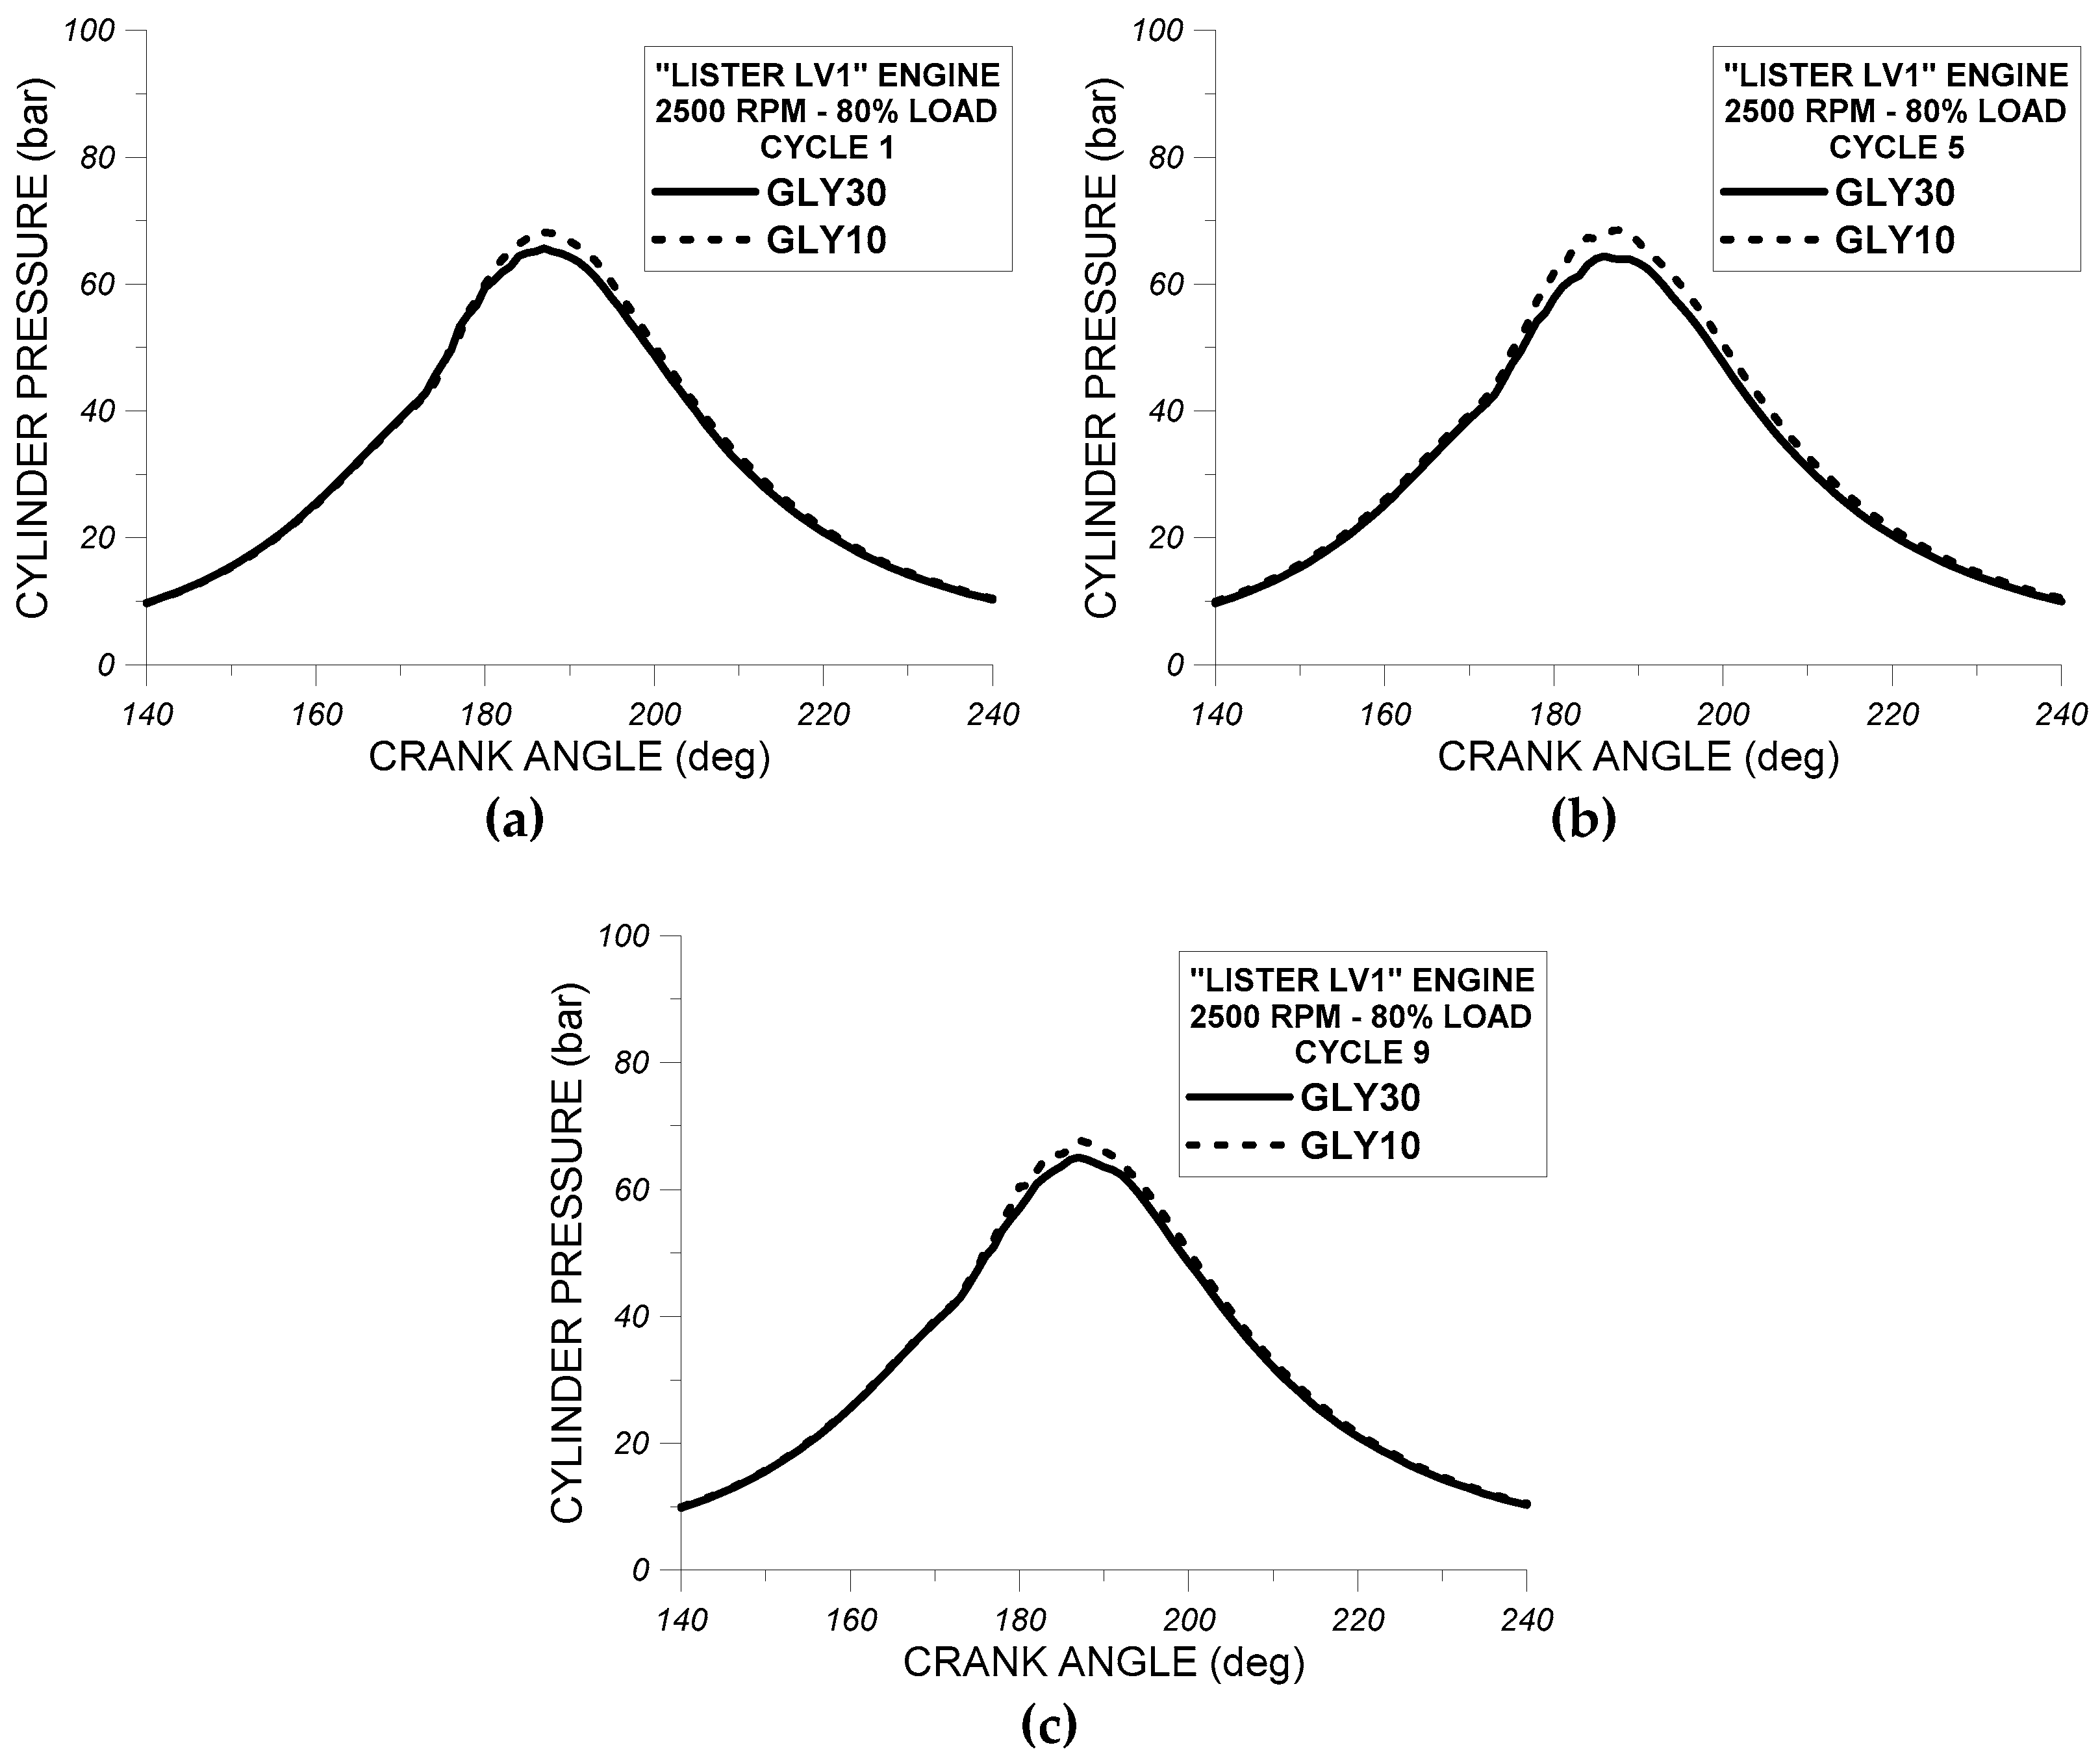
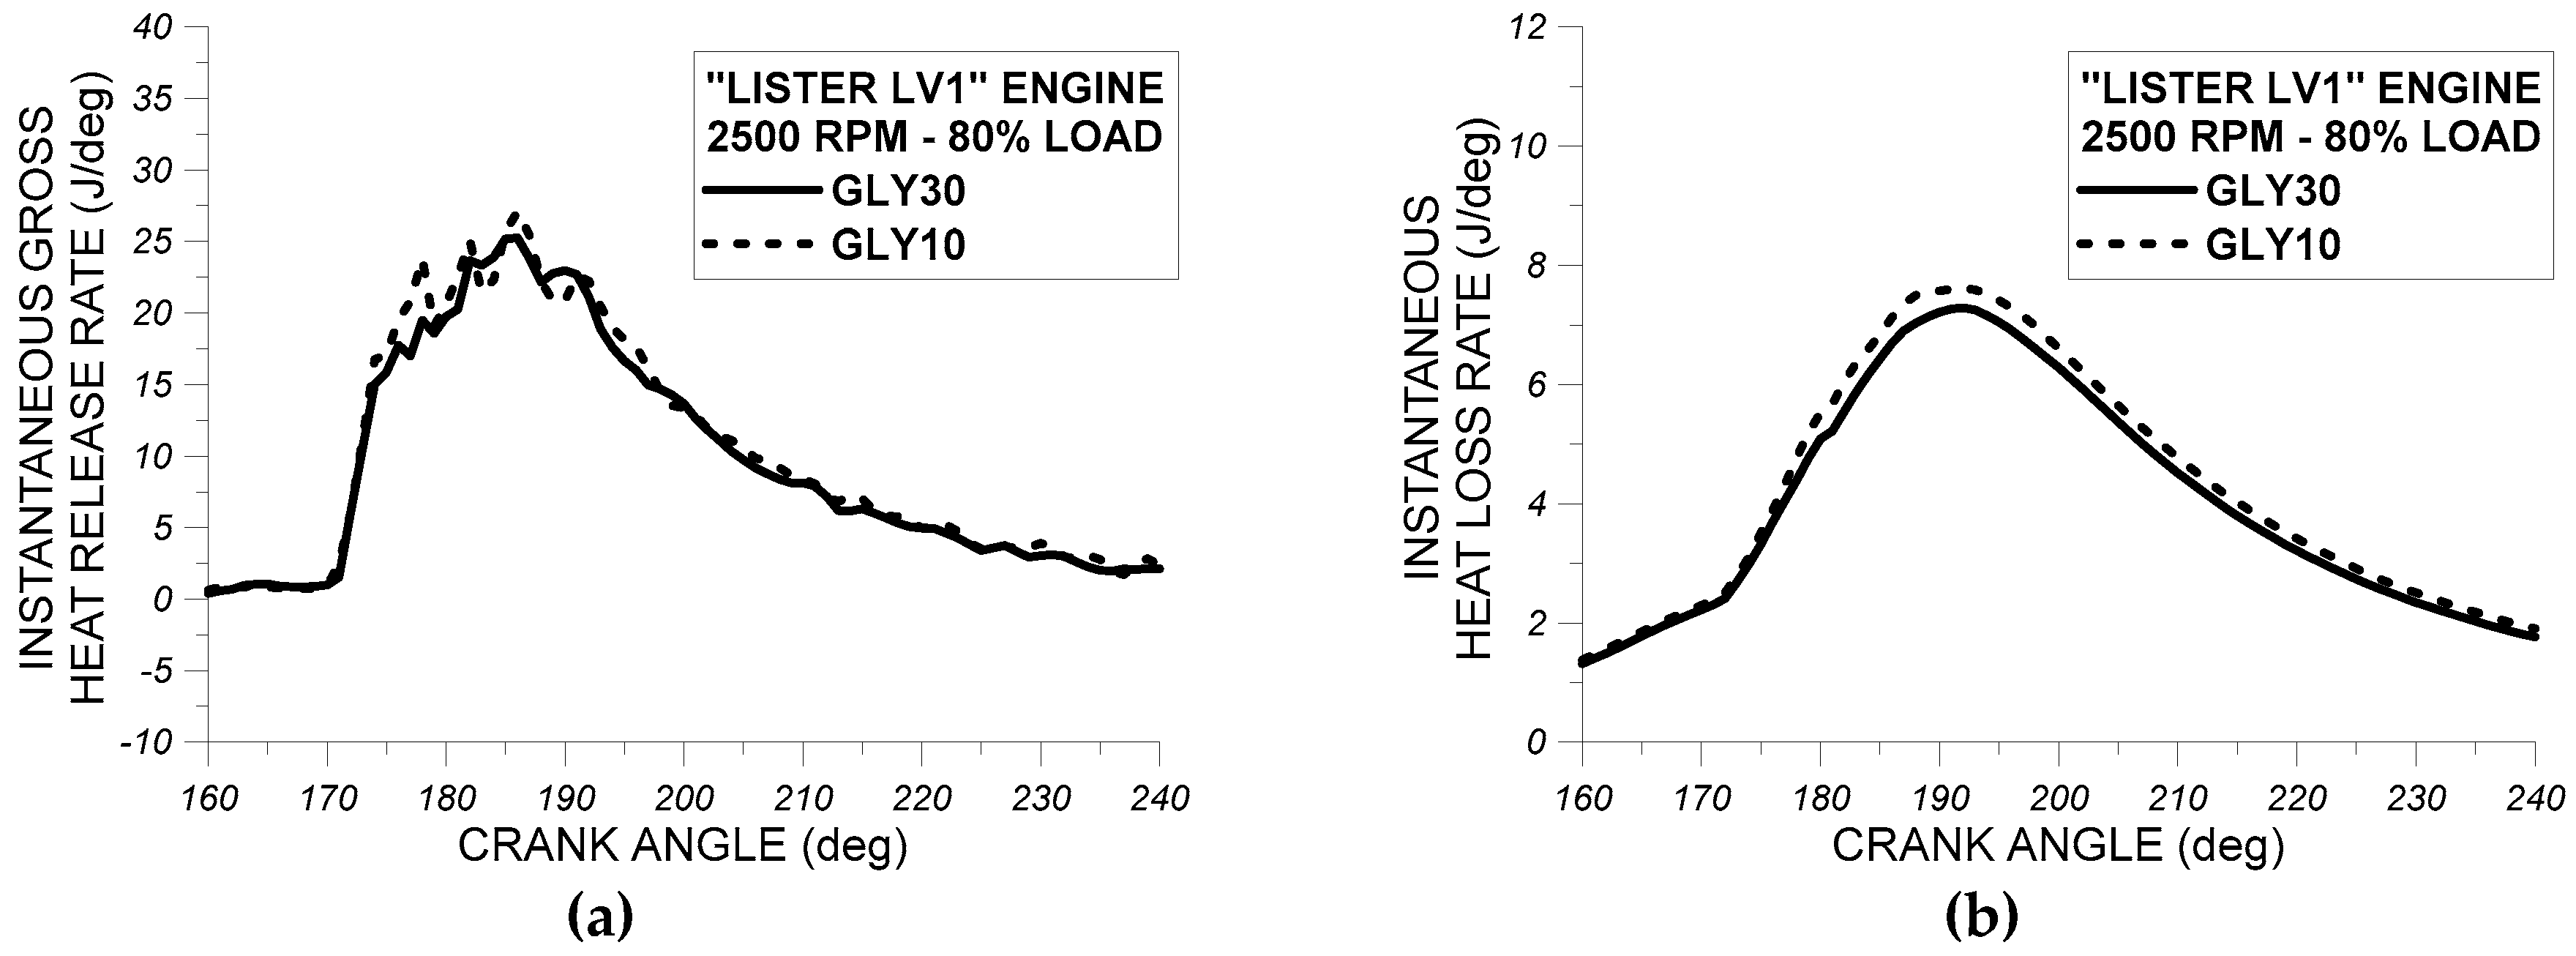
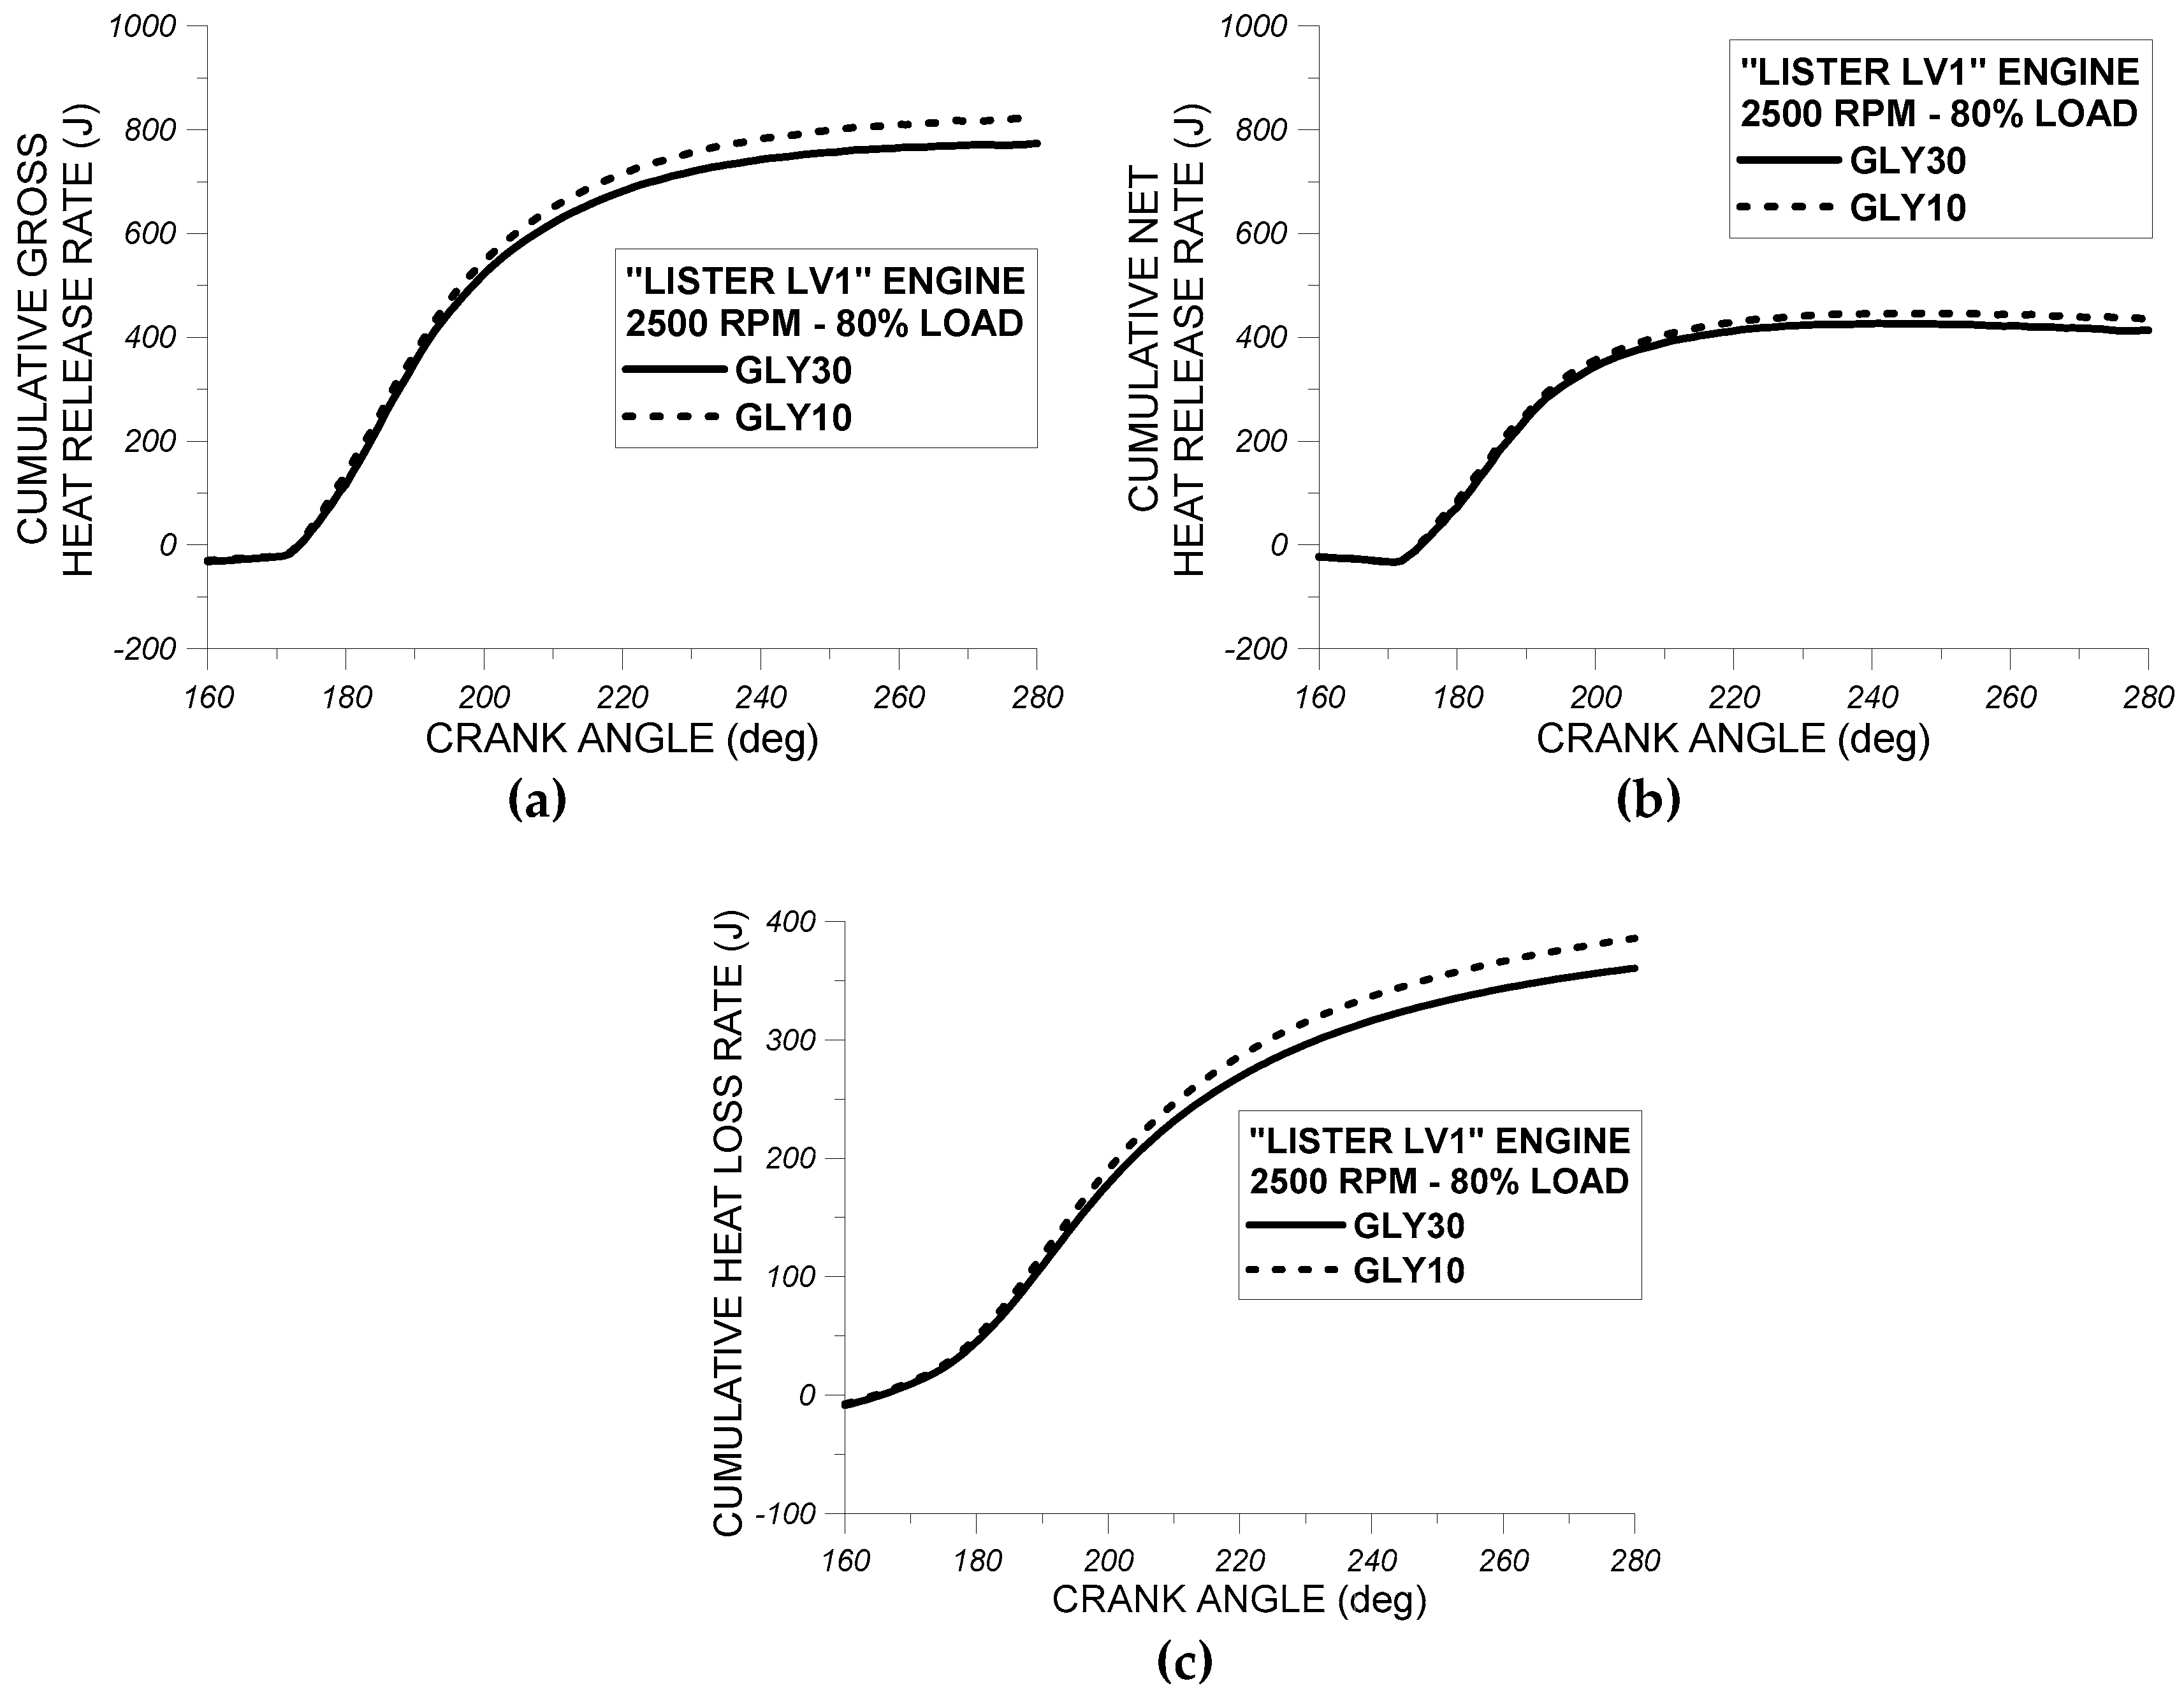
4.2. Effect of GLY10 and GLY30 on HSDI Diesel Engine-Measured Cylinder Pressure and Injection Pressure Cycle-to-Cycle Variation and Average Cycle Heat Release Rate Analysis Results

The oxygenated fuels GLY10 and GLY30 have almost the same oxygenated additive type (glymes) at different proportions 10.2 mass-% and 31.3 mass-%, respectively. The different blending ratios of oxygenated agents result in different fuel oxygen contents between fuels GLY10 (3% oxygen) and GLY30 (9% oxygen). Hence, the assessment of experimental results for cylinder pressure, injection pressure, and heat release rates for these two fuels at 2500 rpm and at 80% of full load will facilitate the extraction of conclusions about their effect on diesel injection and combustion mechanisms. Initially, we decided to examine the effect of GLY10 and GLY30 on the cyclic variation of measured fuel injection and cylinder pressure profiles for assessing the impact of these two oxygenated additives on the behavior of the fuel injection system and on engine operation and performance. In Figure 11a–c, experimental results for fuel injection pressure profiles of GLY10 and GLY30 of the first (Figure 11a), the fifth (Figure 11b), and the ninth (Figure 11c) engine cycle at 2500 rpm and at 80% of full load are shown. All experimental results shown in Figure 11a–c are given for the high-speed single-cylinder DI diesel engine “Lister LV1”. From the observation of Figure 11a–c, it is concluded that the use of fuel GLY10 in “Lister LV1” engine results in slightly earlier initiation and steeper injection pressure rise compared to fuel GLY30 at all cycles examined. This observation can also be ascribed to the lower compressibility factor of fuel GLY10 compared to GLY30. In fact, since the difference in fuel compressibility factor between fuels GLY10 and GLY30 is lower compared to the corresponding difference between fuels RME30 and GLY30, the pertinent effects on fuel injection pressure are more pronounced in the case of fuel pair RME30-GLY30 compared to the fuel pair GLY10-GLY30.
In Figure 12a–c, experimental results for cylinder pressure profiles of GLY10 and GLY30 of the first (Figure 12a), the fifth (Figure 12b), and the ninth (Figure 12c) complete engine cycle at 2500 rpm and at 80% of full load of “Lister LV1” engine are shown. From the examination of Figure 12a–c, it results that fuel GLY10 indicates slightly higher cylinder pressures around TDC and during expansion stroke compared to fuel GLY30. Hence, though both fuels appear to ignite almost simultaneously, higher amounts of combustion energy are released during combustion, thus leading to higher in-cylinder pressures during expansion stroke for fuel GLY10 compared to GLY30. This difference in measured cylinder pressure between fuels GLY10 and GLY30 is associated with the differences evidenced in fuel injection pressure between these two fuels due to lower compressibility factor of fuel GLY10 compared to fuel GLY30. Differences in measured cylinder pressure are less pronounced in the case of fuel pair GLY10–GLY30 compared to fuel pair RME30–GLY30. Also, no noticeable cyclic variation is observed when the “Lister LV1” engine burned either GLY10 or GLY30.
In Figure 13a, comparative experimental results for instantaneous gross heat release rate for test fuels GLY10 and GLY30 at 2500 rpm and at 80% of full load are given. Results shown in Figure 12a are smoothed using an intrinsic MATLAB function [40]. In addition, in Figure 13b, comparative results for the instantaneous in-cylinder heat loss rate for GLY10 and GLY30 at 2500 rpm and at 80% of full load are presented. As observed from Figure 13a,b, both fuels GLY10 and GLY30 indicate no serious differences in ignition angle, thus meaning combustion is initiated for both fuels at almost the same angle. Also, according to Figure 13a,b, the intensity of premixed and diffusion-controlled combustion phases are relatively higher for test fuel GLY10 compared to fuel GLY30. This observation, as already explained, can be ascribed to the earlier initiation of injection process for test fuel GLY10 compared to GLY30. The slightly higher cylinder pressures and corresponding in-cylinder bulk gas temperatures experienced for fuel GLY10 compared to fuel GLY30 results in slightly higher instantaneous heat loss rates for fuel GLY10 relative to GLY30 as witnessed from the observation of Figure 13b.
In Figure 14a–c, comparative results for the cumulative gross heat release rate (Figure 14a), cumulative net heat release rate (Figure 14b), and cumulative heat loss rate (Figure 14c) between fuels GLY10 and GLY30 at 2500 rpm and at 80% of full load are given. From the observation of Figure 14a,b, it results that fuel GLY10 demonstrates slightly higher values of cumulative gross and net heat release rate compared to fuel GLY30 after TDC during expansion stroke. These observations are in accordance with the previously made observations for the differences in instantaneous gross and net heat release rates between fuels GLY10 and GLY30. Finally, the slightly higher instantaneous heat loss rate observed in Figure 13b for test fuel GLY10 compared to fuel GLY30 also results in slightly higher cumulative heat loss rate for GLY10 compared to GLY30 after TDC, as evidenced from Figure 14c.
Consequently, the use of GLY30 results in a delay of fuel injection process and, thus, results in lower cylinder pressures and in-cylinder gas temperatures after TDC during expansion stroke compared to fuels RME30 and GLY10. Hence, RME30 is the most influential oxygenated fuel on fuel injection pressure and injection process and on in-cylinder combustion mechanism, followed by GLY10 and GLY30.

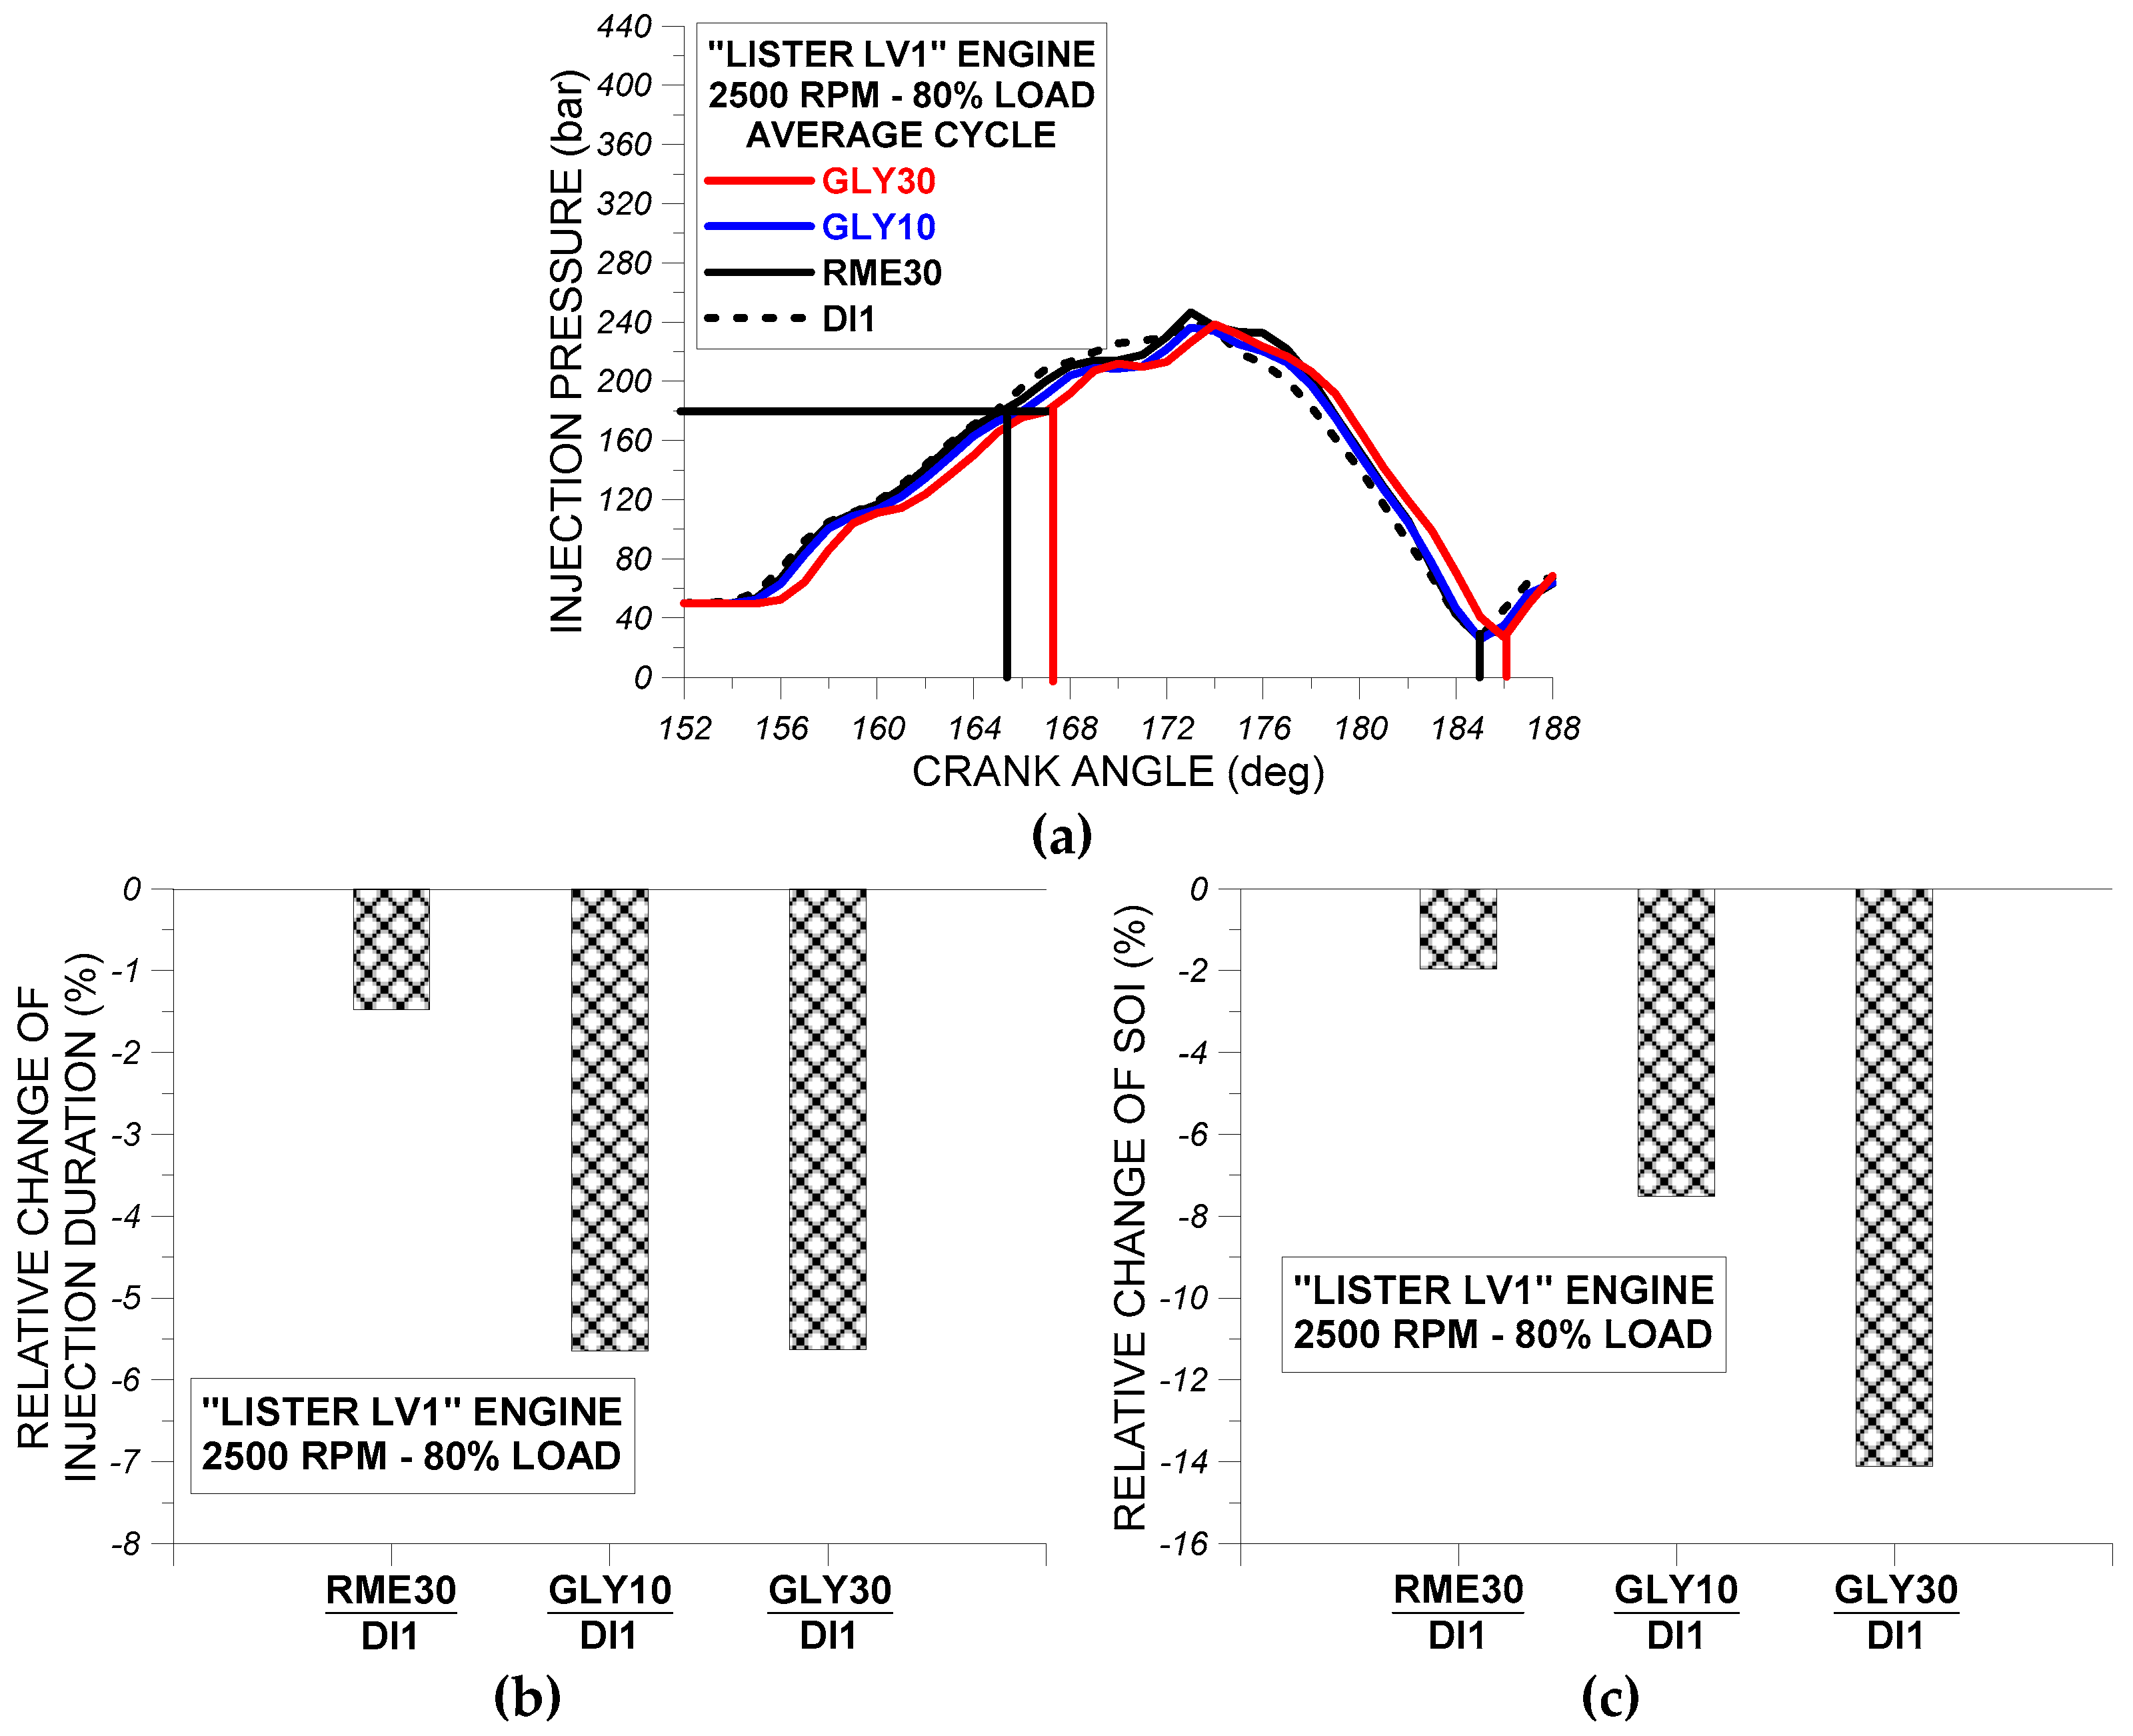
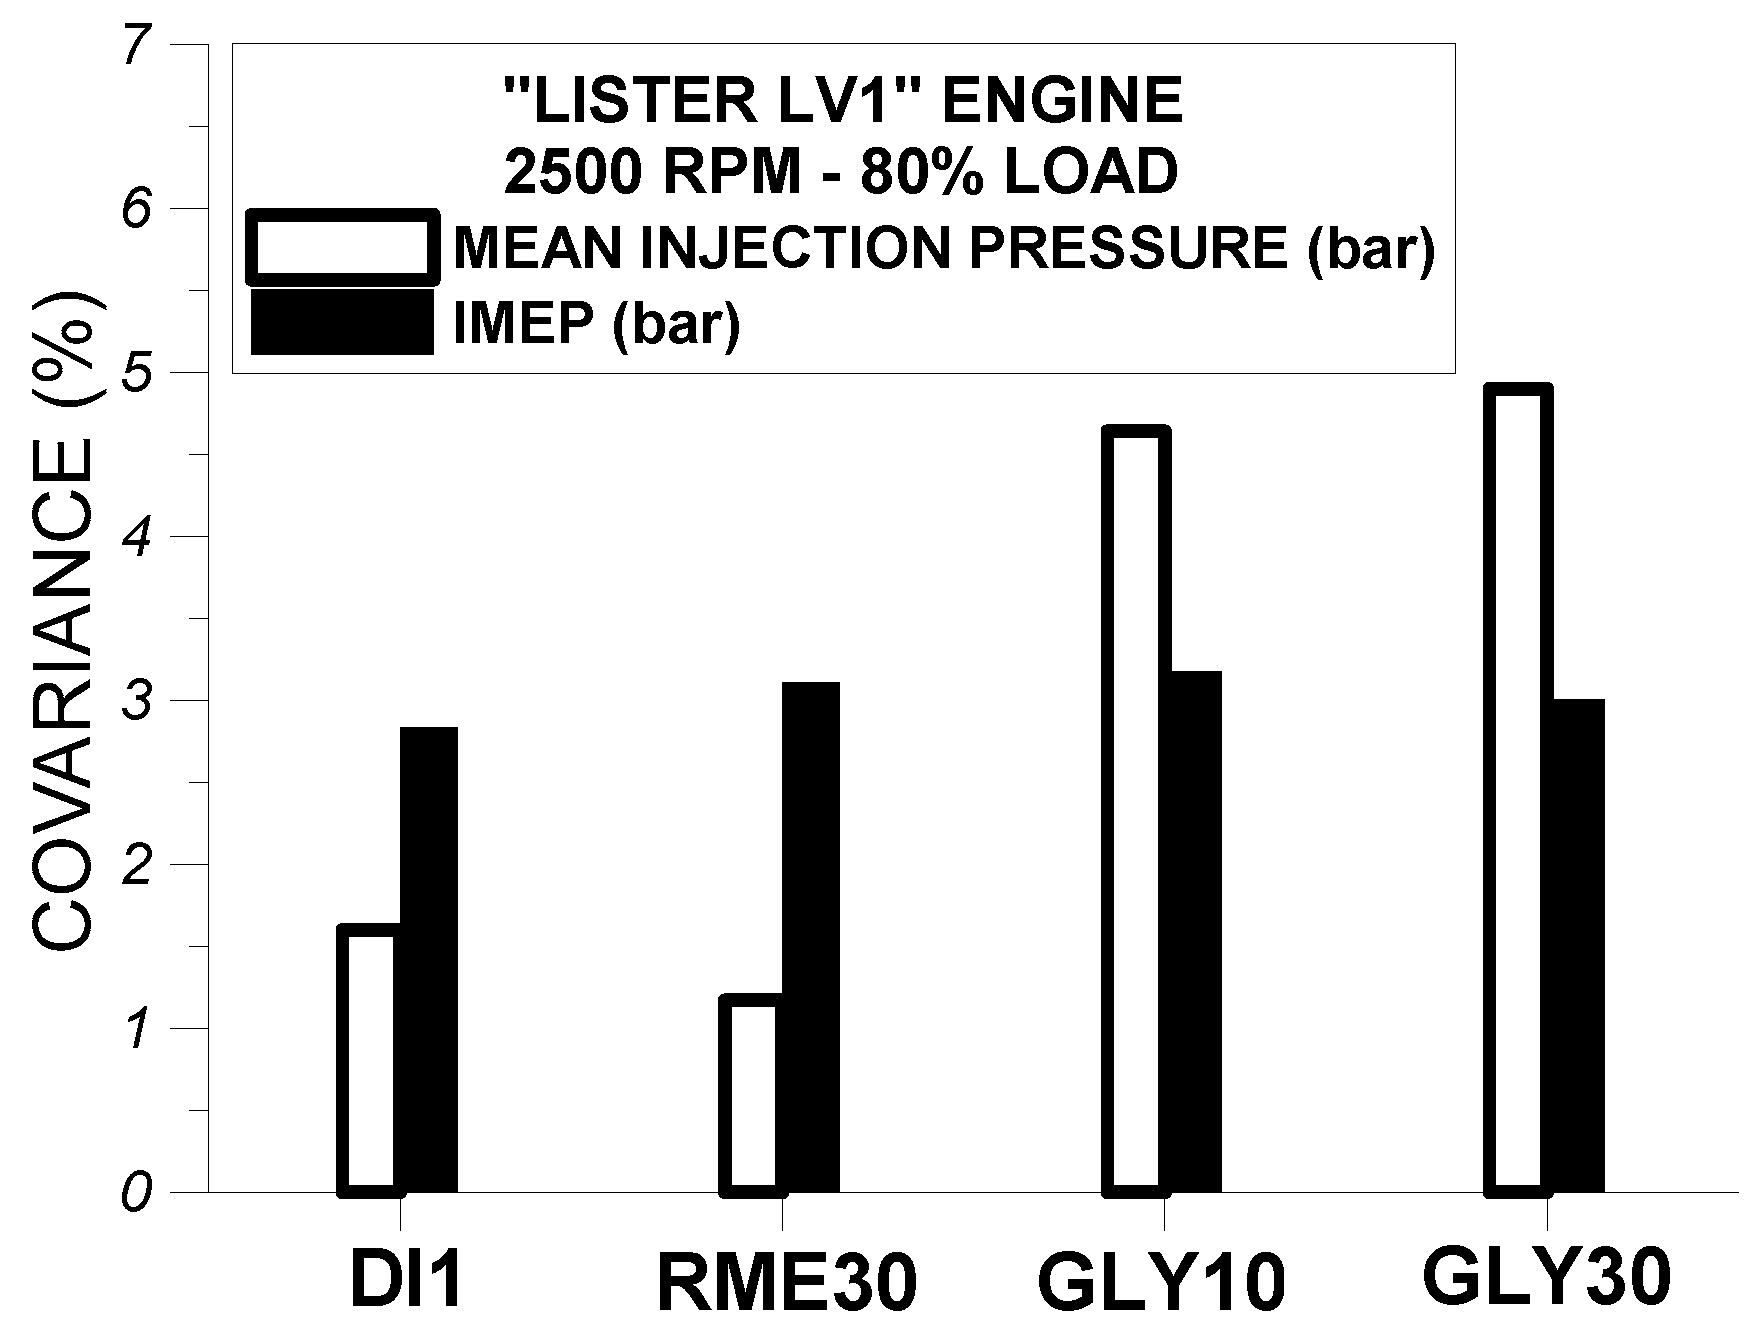
4.3. Effect of Test Fuels DI1, RME30, GLY10, and GLY30 on the Cyclic Variation of Mean Injection Pressure and Indicated Mean Effective Pressure (IMEP)

A statistical analysis has also been performed to examine the effect of test fuels DI1, RME30, GLY10, and GLY30 on the cyclic variation of measured mean injection pressure and IMEP. Hence, in Figure 15, results for the covariance of measured mean injection pressure and IMEP of test fuels DI1, RME30, GLY10, and GLY30 at 2500 rpm and at 80% of full load are given. These results have been derived from the statistical analysis of 100 consecutive cycles obtained from “Lister LV1” engine using the aforementioned test fuels. As evidenced from Figure 15, the covariance of IMEP is similar for all examined fuels and, in all cases, does not exceed 3%, thus demonstrating the addition of RME and glycol ethers to base fuel DI1 did not seriously affect the operation of the examined “Lister LV1” from one cycle to another. A similar behavior for the effect of the examined test fuels on COV(IMEP) was also evidenced at 20%, 40%, and 60% of full load. Hence, the addition of RME and glycol ethers to base fuel DI1 did not affect noticeably “Lister LV1” engine steady-state operation. Moreover, as evidenced from Figure 15, the addition of RME to fuel DI1 resulted in reduction of the covariance of mean injection pressure, whereas the addition of glymes in the case of fuels GLY10 and GLY30 resulted in the increase of the covariance of mean injection pressure compared to conventional diesel operation. Hence, fuel injection system operation indicated slightly lower cyclic variation with the addition of RME compared to conventional diesel operation, whereas the addition of glymes to base fuel DI1 led to a more unsteady cyclic behavior of the fuel injection system, which, however, did not exceed the 5% covariance, which is within the limits of steady-state operation.

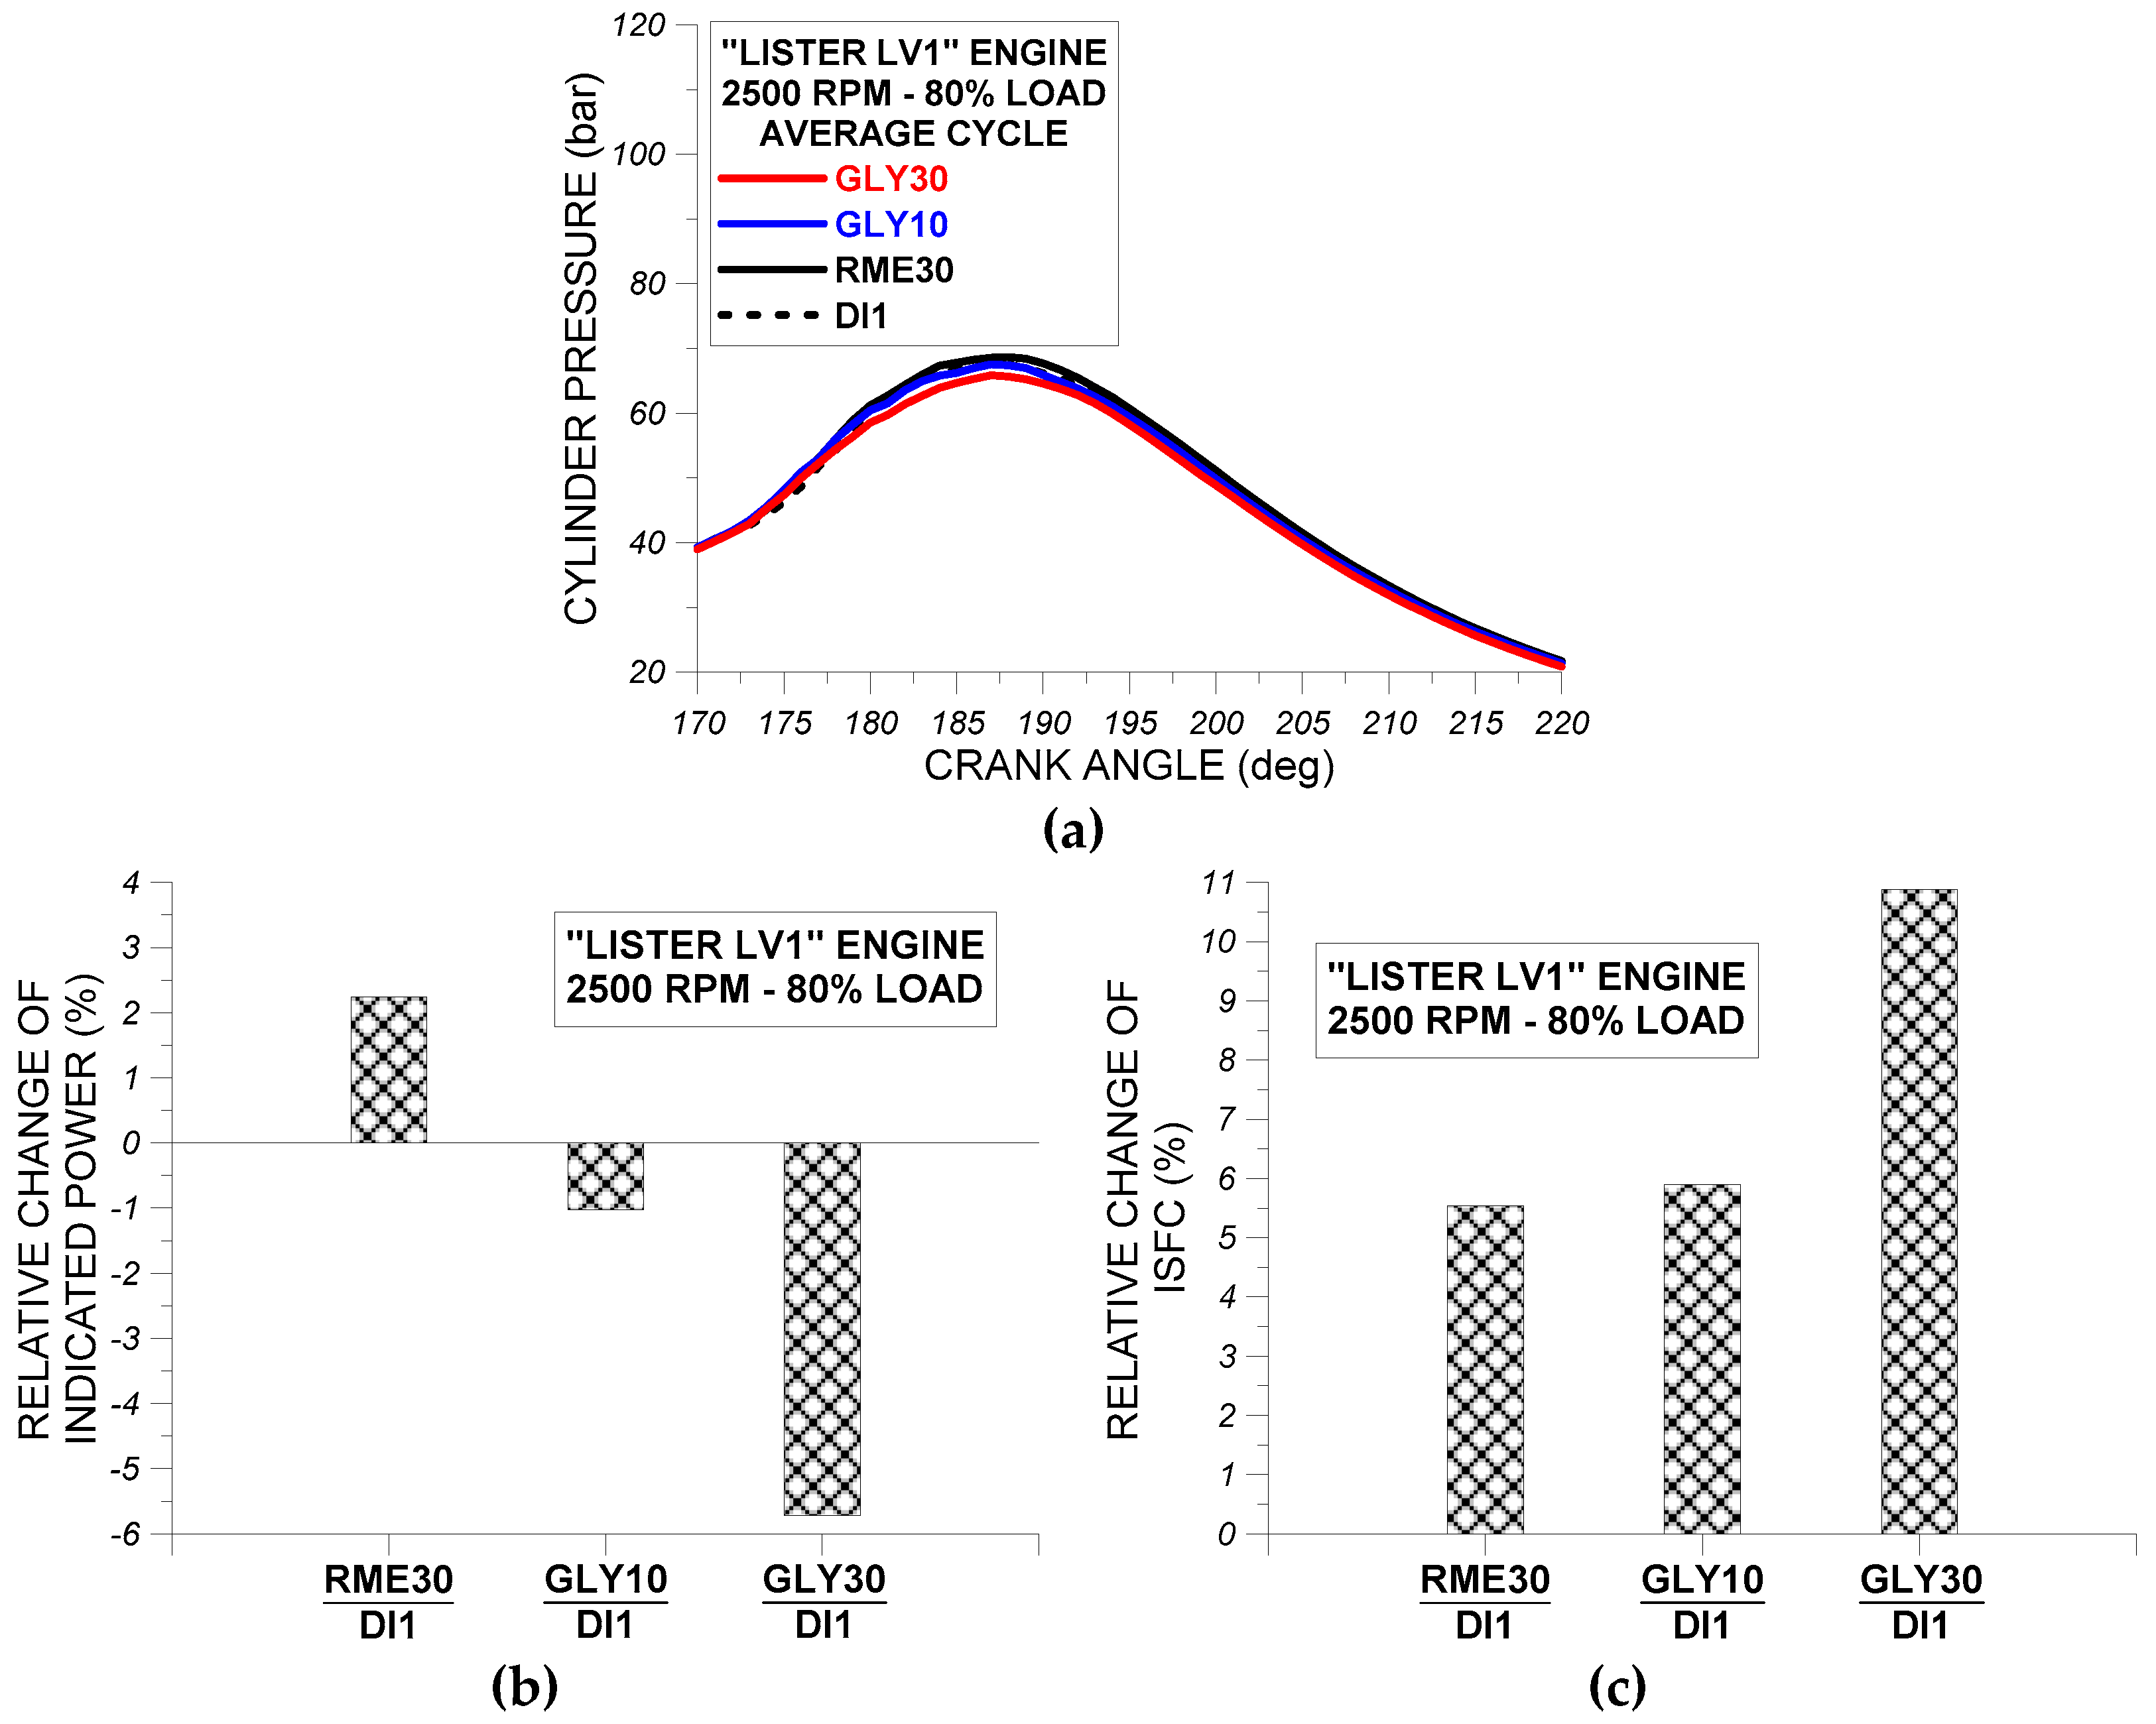
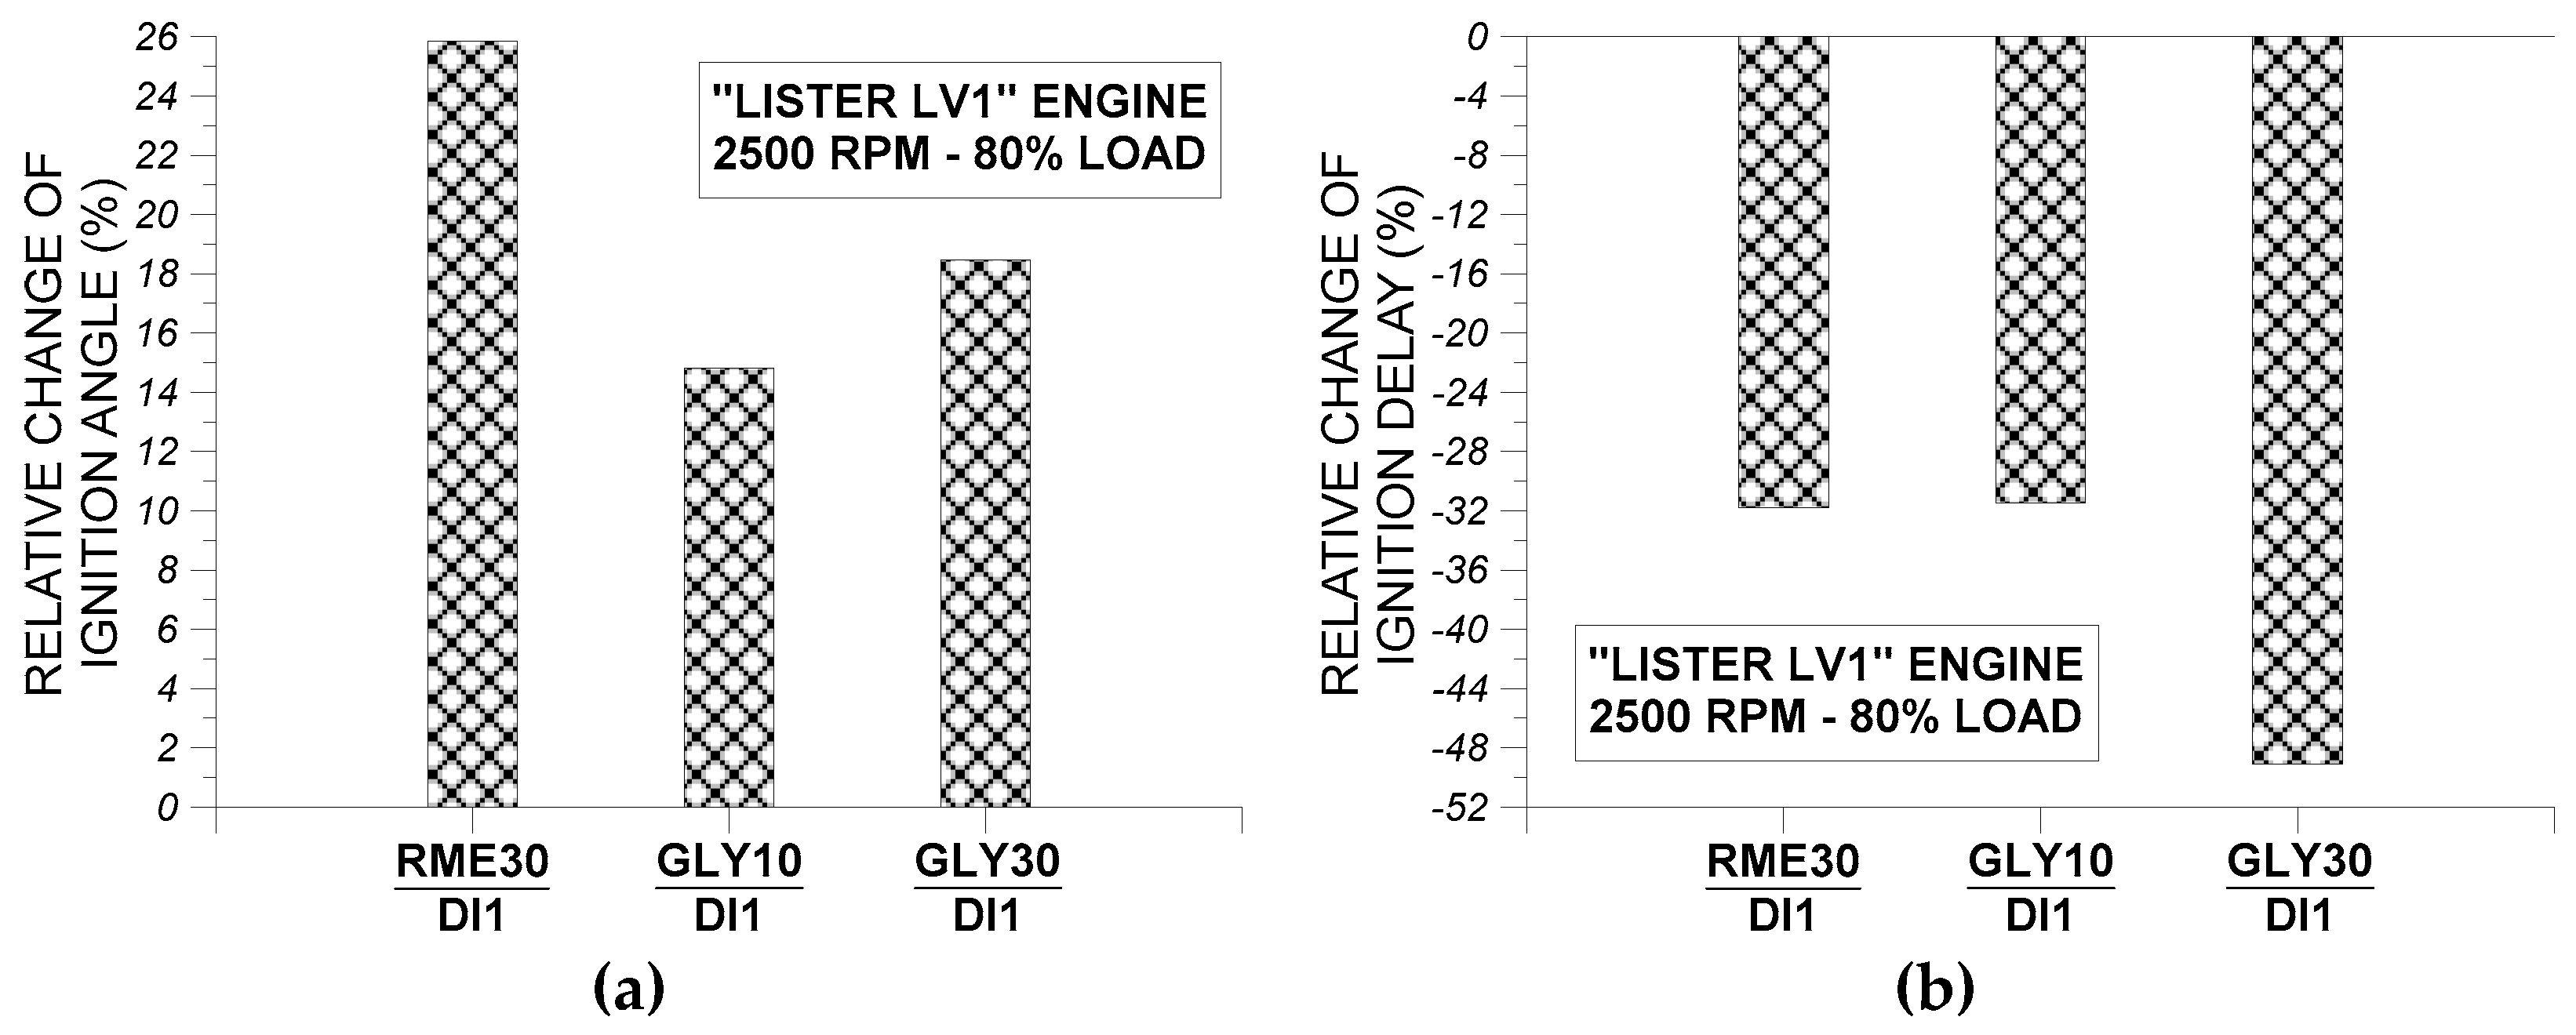
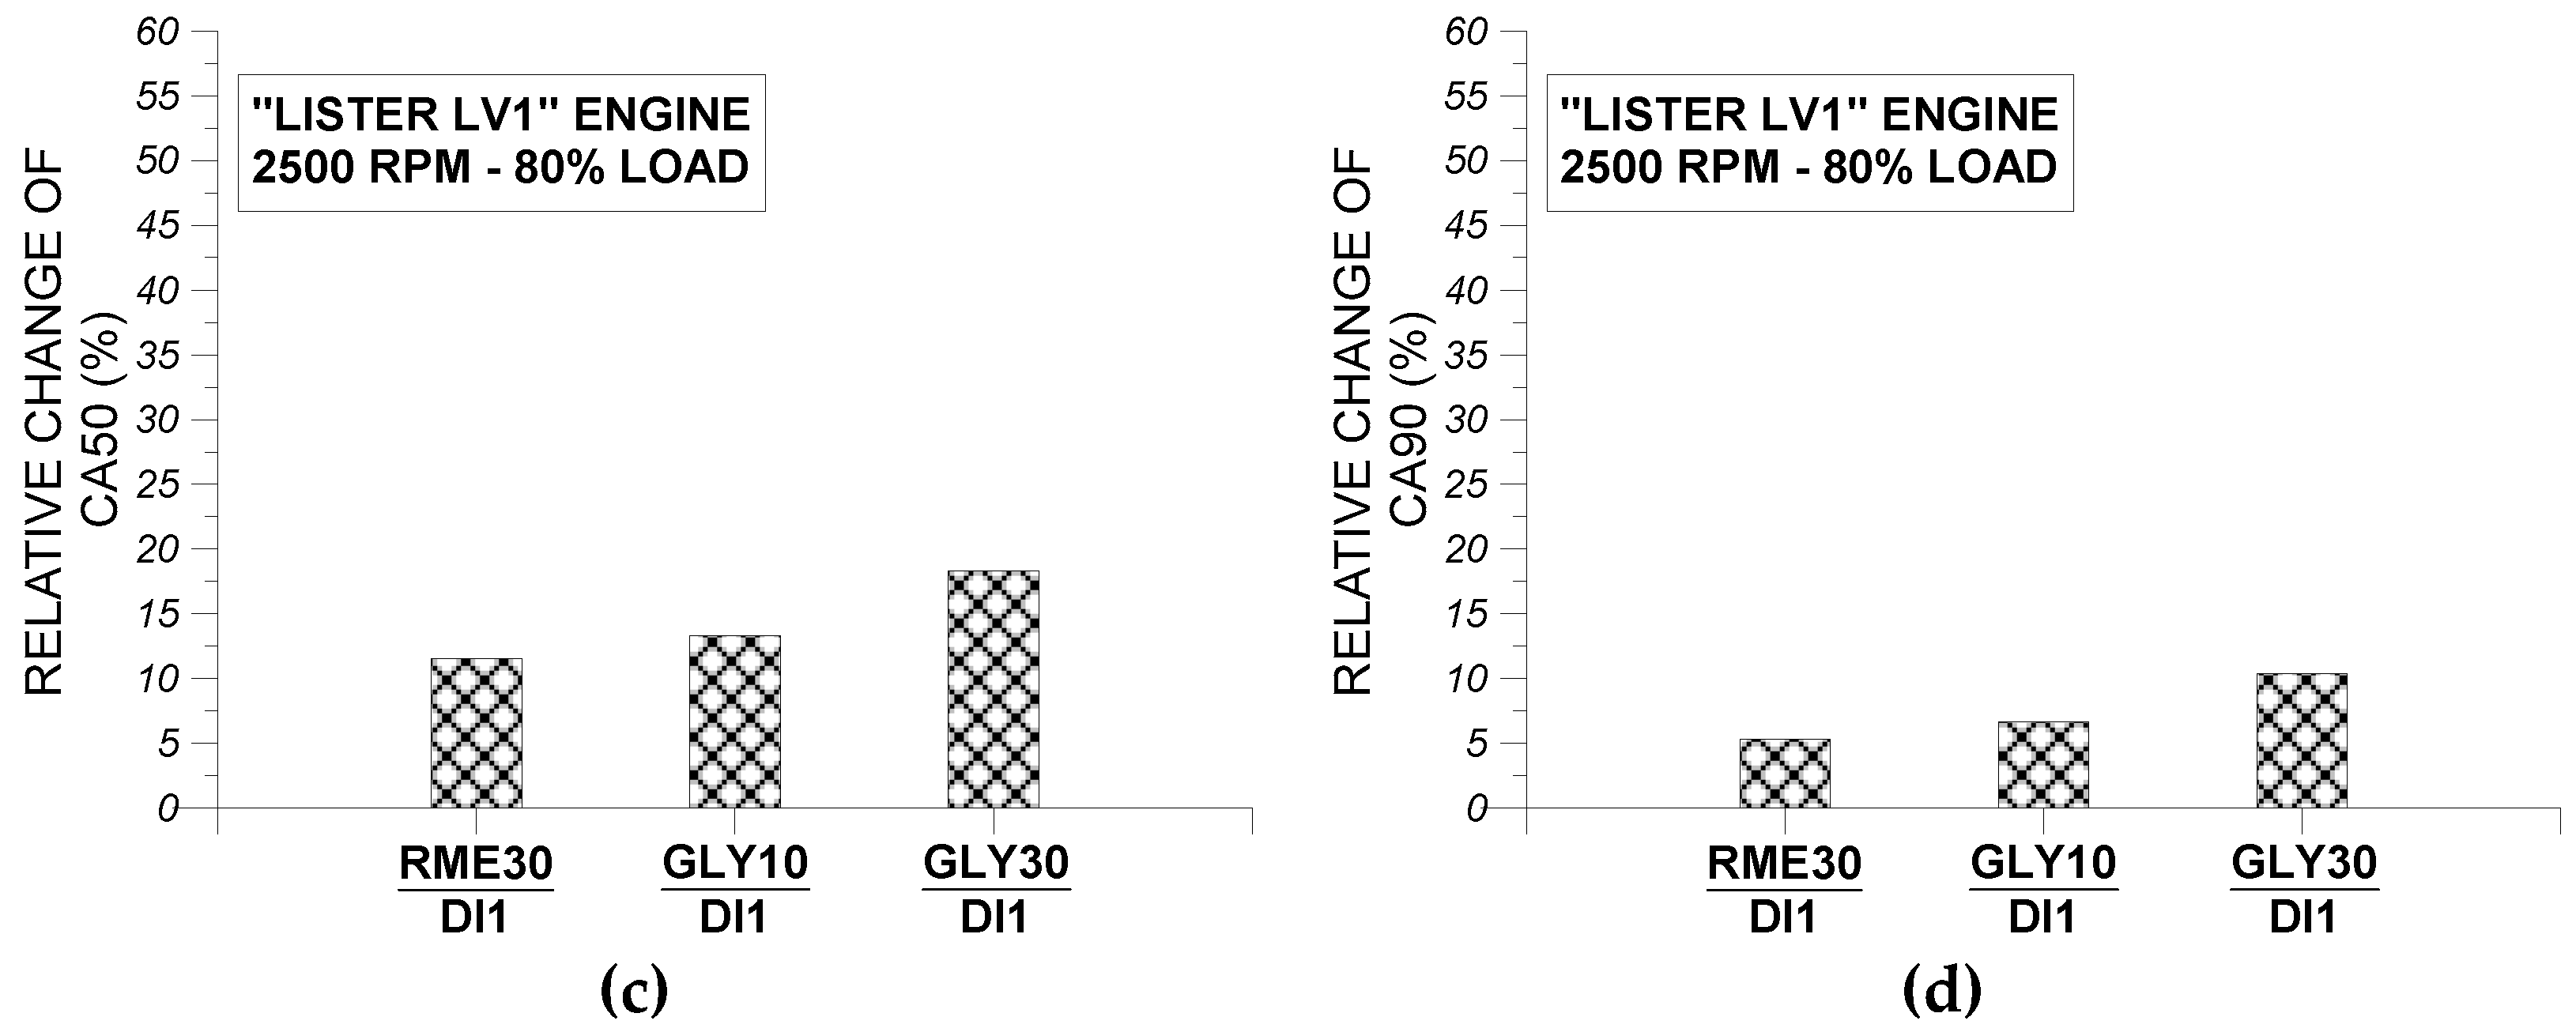
4.4. Effect of Test Fuels DI1, RME30, GLY10, and GLY30 on Examined HSDI Diesel Engine Main Performance Parameters and Combustion Characteristics

In this section, the effect of conventional fuel DI1 and oxygenated fuels RME30, GLY10, and GLY30 on measured in-cylinder pressure and injection pressure and on instantaneous net heat release rate at 2500 rpm and at 80% of full load is analyzed. We also examined the influence of oxygenated fuels RME30, GLY10, and GLY30 on the percentage change of the indicated power, ISFC, injection duration, SOI, ignition angle, ignition delay, and combustion durations of 5% (CA5), 25% (CA25), 50% (CA50), and 90% (CA90) of fuel injected mass per cycle. The percentage change of each one of the aforementioned performance and combustion characteristics for each oxygenated fuel is expressed with reference to the pertinent value of “base” fuel DI1. The main objective of this investigation is to examine the relative deviation of the main performance and combustion parameters in the case of oxygenated fuels combustion compared to conventional “base” fuel combustion. Another objective of this particular examination is the evaluation, on a comparative basis, of the individual effect of each one of the three oxygenated fuels examined in this study not only compared to “base” fuel DI1, but also among them. In other words, this investigation will facilitate the assessment of the effect of increasing fuel oxygen content for the same oxygenated additive by examining engine performance results for test fuels GLY10 (3% oxygen) and GLY30 (9% oxygen). Also, this investigation will facilitate the evaluation of the influence a biofuel additive (RME) in contrast with a synthetic oxygenated additive (Glymes) by comparing performance results of fuels RME30 and GLY30, which have almost the same blending ratio (31mass-%) of two different oxygenated agents. Overall, this particular analysis will reveal not only the operational behavior of oxygenated fuels compared to conventional diesel oil, but also will support the selection of the best oxygenated fuel in terms of engine performance and combustion characteristics among the three examined in this study.
In Figure 16a, measured injection pressure profiles for test fuels DI1, RME30, GLY10, and GLY30 at 2500 rpm and at 80% of full load are compared. Results in Figure 16a are given for the average engine cycle. In Figure 16b, the relative changes of injection duration for oxygenated blends RME30, GLY10, and GLY30 with reference to the corresponding value of conventional diesel oil DI1 at 2500 rpm and at 80% of full load are shown. In Figure 16c, the relative changes of dynamic injection timing (i.e., start of injection, SOI) for oxygenated blends RME30, GLY10, and GLY30 with reference to the corresponding value of conventional diesel oil DI1 at 2500 rpm and at 80% of full load are presented. As evidenced from Figure 16a, with reference to crank angle when the injector needle is lifted (i.e., 180 bar), all oxygenated fuels indicate a delay in injection process initiation inside the cylinder compared to fuel DI1. The delay in injection process is less pronounced in the case of oxygenated fuel RME30, in which it has almost the same SOI with “base” fuel DI1, and is more pronounced in the case of oxygenated fuel GLY30. Conventional fuel DI1 and oxygenated fuels RME30 and GLY10 indicate almost the same end of fuel injection process as evidenced from Figure 16a, whereas the fuel injection process completion for oxygenated fuel GLY30 is delayed compared to all other fuels. The small delay in injection process initiation (i.e., small retardation of injection timing) observed in the case of oxygenated fuel GLY10 and especially in the case of oxygenated fuel GLY30 is associated with the progressive increase of fuel compressibility factor observed in the cases of GLY10 and GLY30 compared to conventional fuel DI1. The injection process appears to close almost at the same angle in the case of fuels DI1, RME30, and GLY10, revealing a reduction of injection duration mainly due to similar values of fuel viscosity in the case of fuel pair DI1-RME30 and due to lower fuel viscosity in the case of fuel GLY10 compared to fuel DI1. In the case of oxygenated fuel GLY30, the injection process end is slightly delayed compared to all other fuels. However, the difference between injection process end and injection process initiation in the case of oxygenated fuel GLY30 is lower compared to fuels DI1 and RME30, thus leading to a reduction of injection duration mainly due to significantly lower viscosity of fuel GLY30 compared to the viscosities of fuels DI1 and RME30. Variations in fuel injection process initiation and completion are reflected in the relative changes of injection duration of oxygenated fuels RME30, GLY10, and GLY30 compared to conventional fuel DI1 shown in Figure 16b. As evidenced from Figure 16b, the highest reductions of injection duration are evidenced in the case of oxygenated fuels GLY10 and GLY30 compared to conventional fuel DI1 reaching up 5.5%. The relative reduction of injection duration in the case of biofuel-added blend RME30 is limited compared to conventional oil DI1 not exceeding 1.5%. Also, according to Figure 16c, the progressive transition from diesel oil DI1 to RME30 and then to fuels GLY10 and GLY30 results in a relative reduction of SOI (i.e., distance in crank angles from TDC) and thus to a progressive delay in fuel injection process initiation inside the engine cylinder. The effect on SOI reduction is more pronounced in the case of oxygenated fuel GLY30 with the highest compressibility factor compared to diesel oil DI1 and is less pronounced in the case of oxygenated fuel RME30.
Overall, it can be concluded that the biodiesel-added blend RME30 indicates an almost similar behavior with conventional diesel oil DI1 regarding its effect on fuel injection process whereas the diesel/glycol ethers fuel GLY30 demonstrated the highest impact on fuel injection process leading to the highest reduction in injection duration and the highest delay in injection process initiation (i.e., highest reduction of SOI) compared to conventional diesel oil DI1.
In Figure 17a, measured cylinder pressure profiles for test fuels DI1, RME30, GLY10, and GLY30 at 2500 rpm and at 80% of full load are compared. Results in Figure 17a are given for the average engine cycle. In Figure 17b, the relative changes of indicated power for oxygenated blends RME30, GLY10, and GLY30 with reference to the corresponding value of conventional diesel oil DI1 at 2500 rpm and at 80% of full load are presented. In Figure 17c, the relative changes of ISFC for oxygenated blends RME30, GLY10, and GLY30 with reference to the corresponding value of conventional diesel oil DI1 at 2500 rpm and at 80% of full load. As evidenced from Figure 17a, the transition from fuel DI1 to oxygenated fuel RME30 results in slightly higher cylinder pressures around TDC mainly due to the higher fuel heating power (fuel consumption in kg/s x LHV in kJ/kg) of RME30 compared to fuel DI1. The slightly higher cylinder pressures around TDC observed for oxygenated fuel RME30 compared to fuel DI1 result, as evidenced more clearly from Figure 17b, in the small increase of engine indicated power by almost 2%. The transition from fuel DI1 to fuel GLY10 results in almost similar cylinder pressures, which are slightly lower, compared to fuel RME30 and to fuel DI1, mainly due to the almost same fuel heating power values between fuels DI1 and GLY10. The slightly lower cylinder pressures around TDC observed for oxygenated fuel GLY10 compared to fuel DI1 result, as evidenced more clearly from Figure 17b, in the small reduction of engine indicated power by almost 1%.
The transition from fuel DI1 to fuel GLY30 results in lower cylinder pressures, which are also lower compared to other two oxygenated fuels, mainly due to the lower fuel heating power of fuel GLY30 compared to all other fuels. The lower cylinder pressures around TDC and during the expansion stroke observed for oxygenated fuel GLY30 compared to fuel DI1 result, as evidenced more clearly from Figure 17b, in reduction of engine indicated power by almost 5.5%, which is the highest indicated power reduction observed in the present analysis compared to conventional diesel operation with fuel DI1. According to Figure 17a, the transition from diesel oil DI1 to oxygenated fuel RME30, to GLY10, and finally to fuel GLY30 results in a progressive increase of ISFC, which is associated with the lower values of LHV of oxygenated fuels RME30, GLY10, and GLY30 compared to the LHV of fuel DI1.
Overall, it can be concluded from the comparison of the effects of fuels RME30 and GLY30, which have the same blending ratio of two different oxygenated additives (RME vs. glycol ethers), on indicated power and ISFC that the synthetic oxygenated additive (glycol ethers) have more detrimental impact on indicated power and ISFC compared to the same proportion of a RME mainly due to lower LHV. The comparison of the effects of fuels GLY10 and GLY30, which have the same oxygenated additive (glycol ethers) at different proportions, also showed that GLY30 has more detrimental influence on indicated power and ISFC compared to GLY10 mainly due to lower LHV as a result of the higher oxygen content of GLY30 compared to GLY10.
In Figure 18a, experimental results for instantaneous net heat release rates for test fuels DI1, RME30, GLY10, and GLY30 at 2500 rpm and at 80% of full load are compared. Results in Figure 18a are given for the average engine cycle, and all heat release rate profiles are smoothed using an intrinsic function of MATLAB [40]. In Figure 18b, the relative changes of ignition angle for oxygenated blends RME30, GLY10, and GLY30 with reference to the corresponding value of conventional diesel oil DI1 at 2500 rpm and at 80% of full load are presented. Values of ignition angles as distances in crank angle degrees from TDC, which were derived from the processing of the instantaneous heat release rate profiles, are used for the calculation of results shown in Figure 18b. In Figure 18c, the relative changes of ignition delay for oxygenated blends RME30, GLY10, and GLY30 with reference to the corresponding value of conventional diesel oil DI1 at 2500 rpm and at 80% of full load are given. As evidenced from Figure 18a, the transition from fuel DI1 to oxygenated fuel RME30 results in an earlier initiation of combustion, thus leading to the relative increase of ignition angle (i.e., distance from TDC) as evidenced more clearly from Figure 18b. The earlier initiation of combustion observed when changing from fuel DI1 to fuel RME30 can be attributed to the slightly higher cetane number of fuel RME30 compared to fuel DI1. Also, the transition from fuel DI1 to fuel RME30 results in a less intense premixed combustion phase, which is associated with the relative reduction of ignition delay when changing from fuel DI1 to fuel RME30, as observed from Figure 18c.
As observed from Figure 18a, the transition from fuel DI1 to oxygenated fuel GLY10 and also to oxygenated fuel GLY30 results in an earlier initiation of combustion, thus leading to the relative increase of ignition angle in both cases, as evidenced more clearly from Figure 18b. The earlier initiation of combustion observed when changing from fuel DI1 to fuel GLY10 and also to fuel GLY30 can be attributed to the higher cetane number of these two oxygenated fuels compared to fuel DI1. Also, the transition from fuel DI1 to fuel GLY10 and also to fuel GLY30 results in less intense premixed combustion phases, which is associated with the relative reductions of ignition delay when changing from fuel DI1 to fuel GLY10 and to fuel GLY30, as observed from Figure 18c.
According to Figure 18c, the highest relative reduction of ignition delay when changing from conventional diesel oil to oxygenated fuels is observed in the case of the blend containing 31.3 mass-% glycol ethers (GLY30) as evidenced from Figure 18c, which is associated with the highest reduction of SOI (i.e., highest retardation of injection timing) as observed from Figure 16c.
Consequently, the use of oxygenated fuels in “Lister LV1” engine resulted in the acceleration of combustion initiation compared to conventional diesel oil operation with the effects more pronounced in the case of biodiesel-added fuel RME30. Also, the use of oxygenated blends resulted in the reduction of ignition delay compared to conventional diesel oil operation with the effects more pronounced in the case of glycol ethers-added fuel GLY30, which had the highest cetane number from all fuels examined. Finally, the use of oxygenated additives resulted in the downplaying of premixed combustion phase intense compared to conventional diesel oil operation with the effects to be more pronounced in the case of glymes-added fuel GLY30, which indicated the highest reductions in ignition delay and thus, to fuel physical and chemical preparation time.
It should also be mentioned that the experimental results shown in this section for cylinder pressure (Figure 17a) and for ignition delay relative reduction (Figure 18c) are in accordance on a qualitative basis with corresponding experimental results derived in a Ricardo Hydra optical engine [33] with the same oxygenated fuels used in the present study.
In Figure 19a–d, the relative changes of combustion durations in crank angle of 5% (CA5) (Figure 19a), 25% (CA25) (Figure 19b), 50% (CA50) (Figure 19c), and 90% (CA90) (Figure 19d) of oxygenated fuels RME30, GLY10, and GLY30 with reference to “base” fuel DI1 at 2500 rpm and at 80% of full load are shown. As evidenced from Figure 19a–d, the diesel engine operation with all examined oxygenated fuels results in the relative increase of all combustion durations compared to conventional diesel operation with fuel DI1. The highest impact on the elongation of all combustion durations compared to conventional diesel oil operation is evidenced in the case of the oxygenated fuel GLY30, which indicates the lowest LHV compared to all other fuels, whereas the lowest impact on the relative increase of all combustion durations is witnessed in the case of biofuel-added blend RME30. The highest values of relative increase of combustion duration for all examined oxygenated fuels is evidenced in the case of CA5 (Figure 19), whereas the effects of oxygenated fuels on combustion duration are reduced, progressively moving to the initial stages of combustion (CA5) to the final stages of combustion (CA90). Hence, the effects of oxygenated fuels on the elongation of combustion compared to baseline diesel operation are more pronounced in the case of initial premixed combustion (CA5, Figure 19a) and they are progressively downplayed as moving from premixed to diffusion-controlled combustion.
Overall, it can be concluded that the glycol ethers-added blend GLY30 with the highest oxygen content results in the highest increase of both premixed and total combustion duration compared to baseline diesel operation mainly due to its highest fuel consumption compared to all other fuels. On the other hand, the lowest relative deterioration of both premixed and total combustion duration is evidenced in the case of biodiesel-added blend RME30 compared to diesel-only operation.

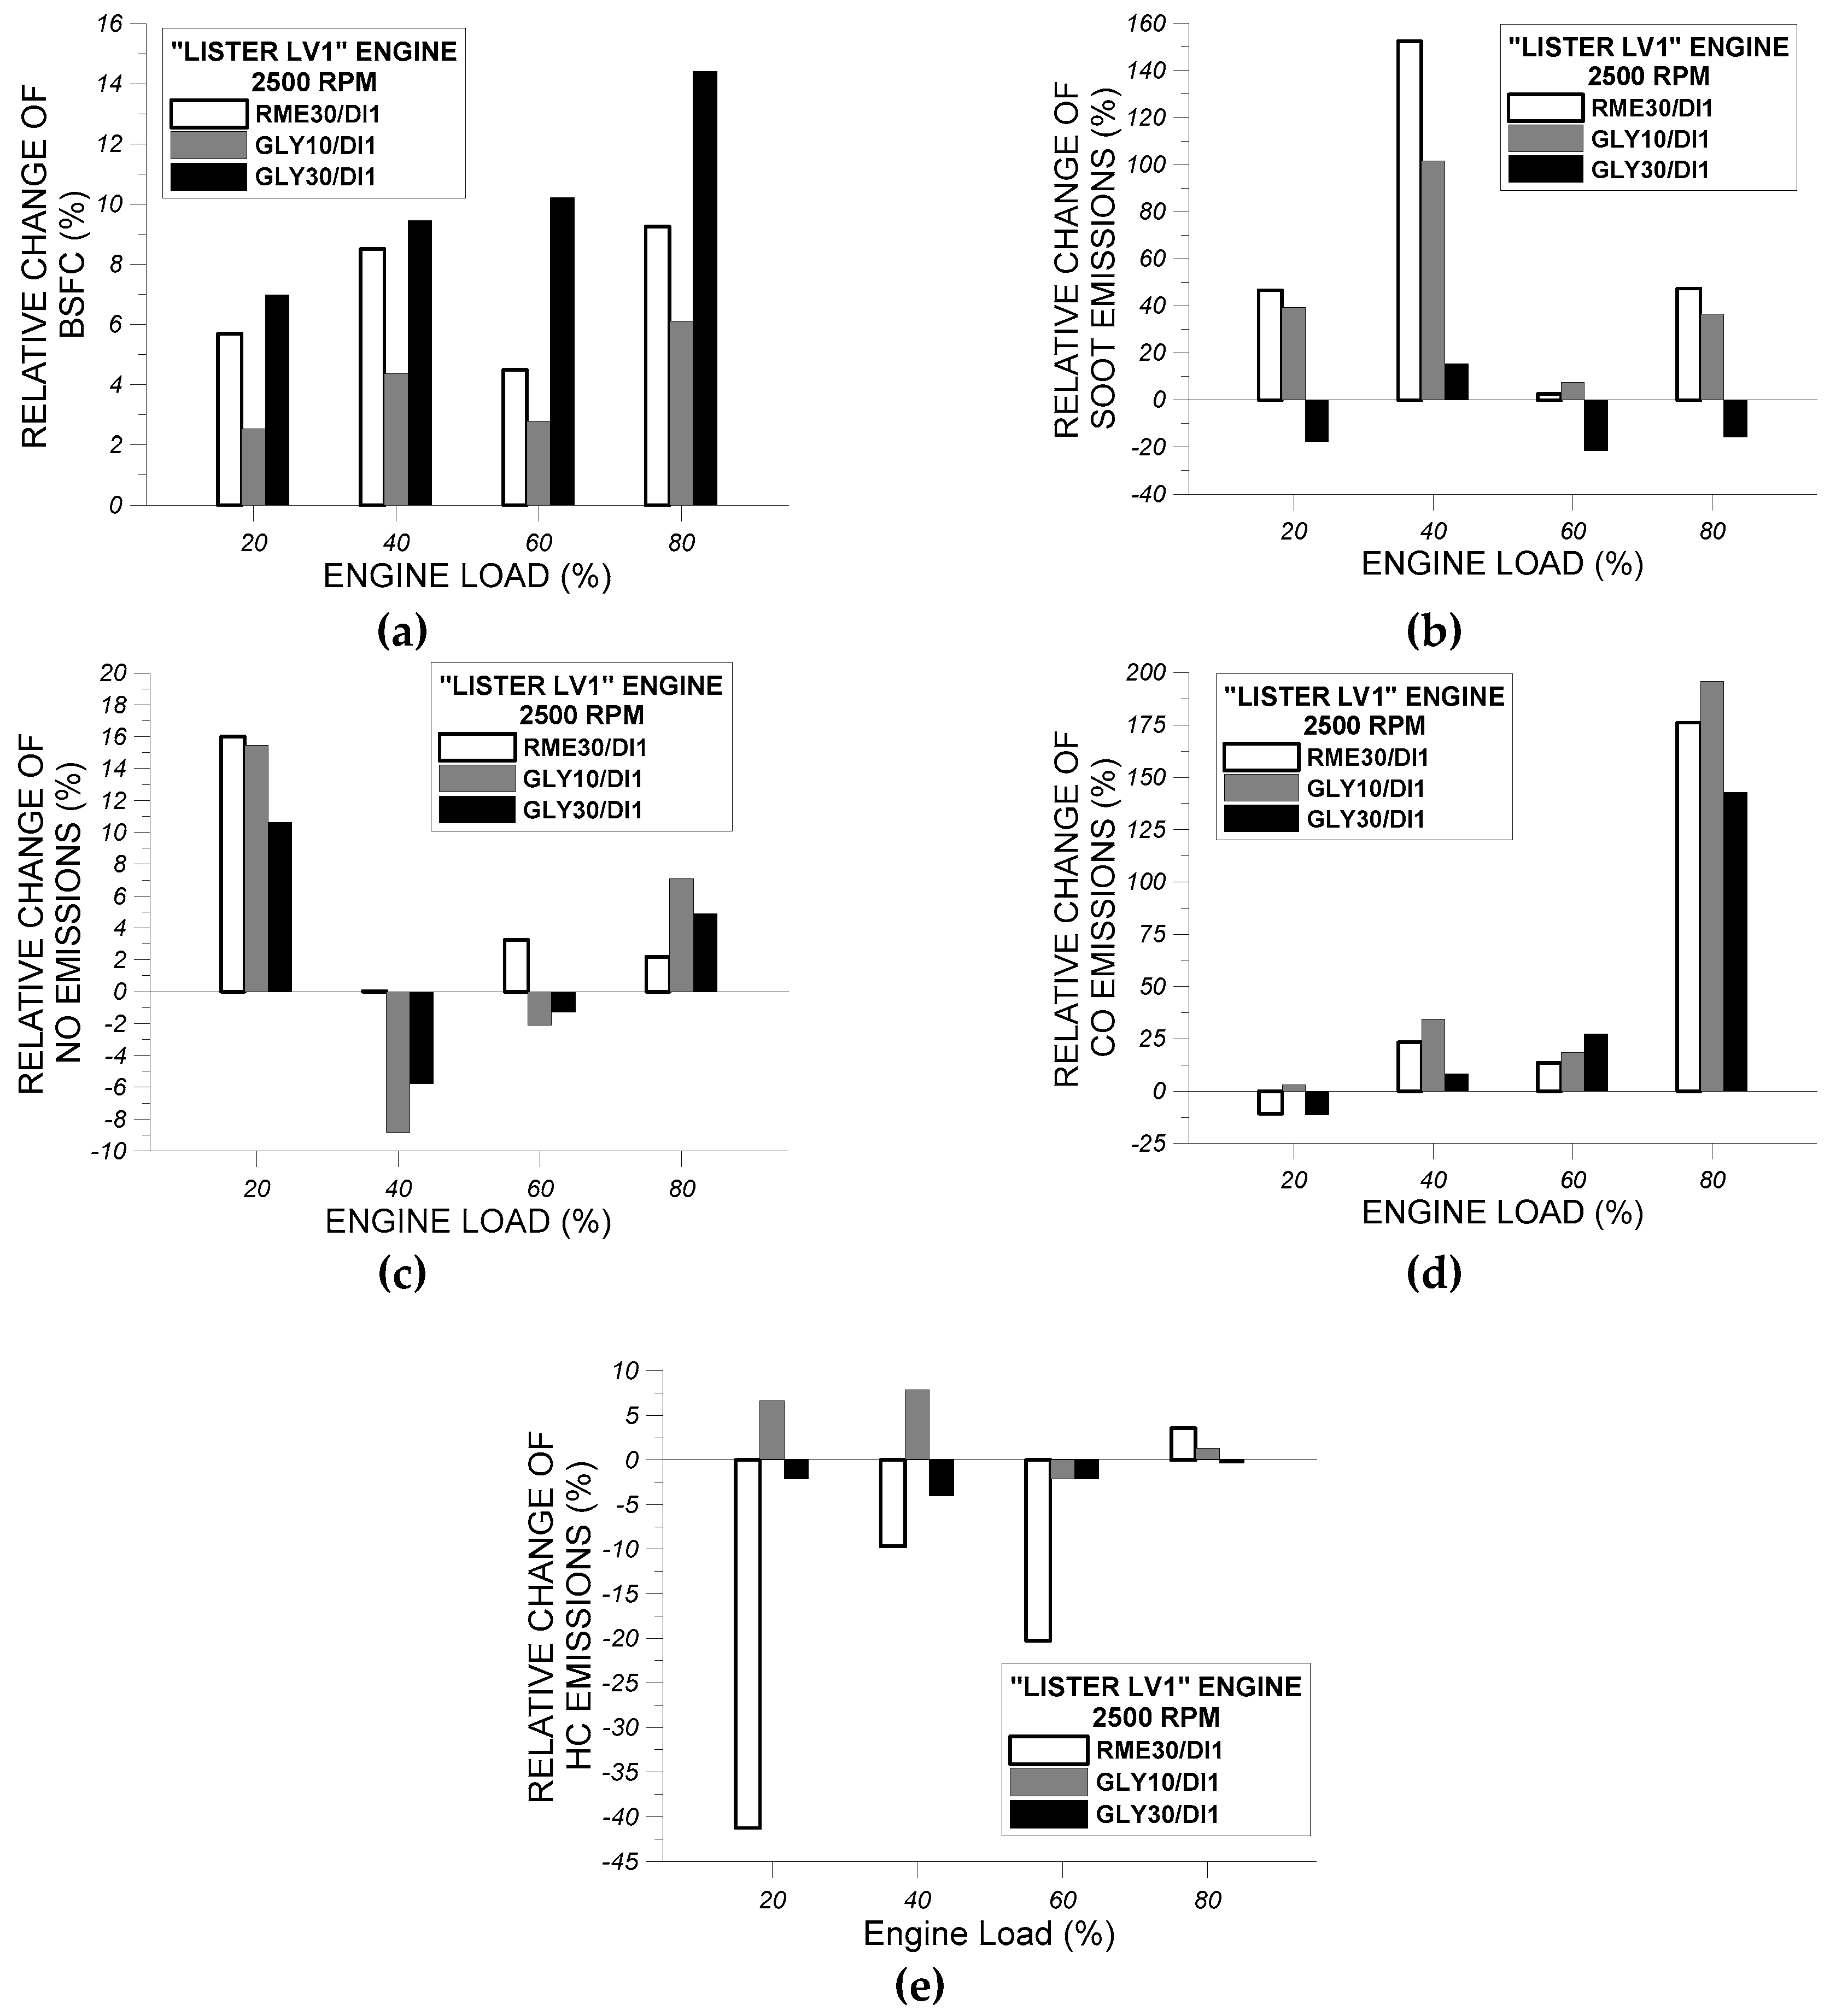
4.5. Effect of Test Fuels RME30, GLY10, and GLY30 on the Percentage Change of HSDI Diesel Engine BSFC and Exhaust Soot, NO, CO, and HC Emissions Compared to Diesel Operation with “Base” Fuel DI1

Figure 20a depicts the variation of the percentage change of measured BSFC of the three oxygenated fuels RME30, GLY10, and GLY30 with reference to “base” fuel DI1 as function of engine load at 2500 rpm. As evidenced from Figure 20a, the use of oxygenated fuels RME30, GLY10, and GLY30 results in a deterioration of BSFC compared to baseline diesel operation at all engine loads. The highest deterioration of measured BSFC is evidenced in the case of GLY30 at all examined engine loads, which ranged from 7% at 20% load to 15% at 80% load. The lowest worsening of BSFC compared to baseline diesel operation is witnessed in the case of GLY10 at all examined engine loads, which ranged from 2% at 20% load to 6% at 80% load. The aforementioned relative BSFC variations between GLY30 and DI1 and GLY10 and DI1 are associated with the fact that GLY30 indicates the highest LHV reduction (9.95%) compared to DI1, whereas GLY10 indicates the lowest LHV reduction (3.6%) compared to DI1.
Figure 20b shows the variation of the percentage change of measured soot (in mg/L) of the three oxygenated fuels RME30, GLY10, and GLY30 with reference to baseline fuel DI1 as function of engine load at 2500 rpm. At all engine loads, the replacement of the non-oxygenated fuel DI1 from oxygenated fuels RME30 and GLY10 results in an increase of measured tailpipe soot concentration, which is more pronounced in the case of RME30 compared to GLY10 at all examined engine load with the exception of 60% load where the effects of both RME30 and GLY10 on soot relative increase are almost similar. Oppositely, the transition from baseline non-oxygenated fuel DI1 to oxygenated fuel GLY30 results in reduction of measured exhaust soot at all examined loads with the exception of 40% load, where a relative increase is observed at almost 15% compared to baseline operation. Soot reductions experienced with GLY30 range from 16% at 80% load to 21.5% at 60% load compared to DI1. Hence, though that the oxygenated fuel GLY30 indicated the highest fuel consumption at all loads due to its lowest LHV compared all other fuels, it exhibits the lowest soot exhaust values compared to both non-oxygenated DI1 and oxygenated fuels RME30 and GLY10. This observation can be attributed possibly to the fact that the high oxygen content (9%) of fuel GLY30, which is readily inside fuel jet zones during combustion, promotes, as evidenced significantly, soot oxidation rate despite the increased average fuel/air equivalence ratio due to increased fuel consumption, which is expected to enhance in-cylinder fuel formation rate.
In Figure 20c, the variation of the percentage change of measured NO emissions (in ppm) of the three oxygenated fuels RME30, GLY10, and GLY30 with reference to baseline fuel DI1 as function of engine load at 2500 rpm. The transition from baseline fuel DI1 to oxygenated fuel RME30 results in a relative increase of NO emissions at all examined loads except from 40% load, where the relative change of NO emissions between DI1 and RME30 is imperceptible. The percentage increase of NO emissions in the case of RME30 ranges from 16% at 20% load to 3% at 60% load. The transition from “base” fuel DI1 to glymes-added fuel GLY10 results in an increase of NO emissions at 20% load (15.5% relative increase) and at 80% load (7% relative increase), whereas at 40% and at 60%, NO emissions are decreased by 9% and 2%, respectively, compared to baseline diesel operation. The same behavior is evidenced also in the case of transition from non-oxygenated fuel DI1 to oxygen-added fuel GLY30. Specifically, a relative increase of NO emissions is witnessed at low and at high load, which spans from 10.6% at 20% load to 4.9% at 80% load when changing from fuel DI1 to GLY30. Oppositely, as evidenced from Figure 20c, transition from fuel DI1 to fuel GLY30 results in reduction of NO emissions by 5.8% at 40% of full load and by 4.4% at 60% of full load. Higher NO emissions observed in the case of fuel RME30 compared to baseline fuel DI1 at most of the examined engine loads are possibly associated with the higher cylinder pressures and bulk-gas temperatures observed in the case of RME30 compared to fuel DI1, which in combination with the slightly higher local fuel-bound oxygen availability, promoted in-cylinder NO formation. In the case of oxygenated fuels GLY10 and GLY30, the lower fuel supplied thermal energy compared to “base” fuel DI1 resulted in lower cylinder pressures and in-cylinder gas temperatures resulted in lower negative effects to in-cylinder NO formation at 20% load compared to RME30 and to exhaust NO reductions at 40% and at 60% load compared to baseline diesel operation. A quite encouraging outcome is that, as evidenced from Figure 20b,c, in the case of oxygenated fuel GLY30 and at 60% load, the well-known soot/NOx trade-off is reversed since both diesel-emitted soot and NO are reduced compared to baseline diesel operation. As previous studies have shown, NO emissions are correlated with various engine operating parameters such as intake temperature, fuel consumption, intake air moisture, or in-cylinder water content [50]. For this reason, it should be noticed here that further experimental studies are scheduled to be performed using different injection nozzles for the test fuels DI1, RME30, GLY10, and GLY30. The different injection nozzles will help to control the fuel injection process by keeping the fuel injection rate almost the same for the examined test fuels and thus, for controlling the heat released energy per engine cycle and through this, the diesel-generated flame temperatures. This experimental campaign will be conducted to potentially isolate the effect of different LHV and physical properties of test fuels on in-cylinder gas temperature and thus, to potentially clarify the impact of oxygenated additive structure and oxygen content not only on NOx, but also on soot, CO, and HC emissions.
Figure 20d demonstrates the variation of the percentage change of measured CO emissions (in ppm) of the three oxygenated fuels RME30, GLY10, and GLY30 with reference to baseline fuel DI1 as function of engine load at 2500 rpm. As observed from Figure 20d, with the exception of 20% load, the transition from “base” fuel DI1 to oxygenated fuels RME30, GLY10, and GLY30 at all engine loads resulted in a considerable deterioration of CO emissions compared to baseline diesel operation. The more characteristic relative deterioration of tailpipe CO values is evidenced at 80% of full load, where the relative increase of CO emissions ranges from 143% for GLY30 to 196% for GLY10 compared to “base” fuel DI1. The substantial worsening of CO emissions when burning oxygenated fuels at high engine load (i.e., 80%) can be ascribed to the increase of fuel consumption in the case of oxygenated fuels due to LHV reduction for sustaining constant engine load, which lead to the increase of fuel/air equivalence ratio and to the substantial promotion of CO emissions.
Figure 20e depicts the variation of the relative change of measured HC emissions (in ppm) of the three oxygenated fuels RME30, GLY10, and GLY30 with reference to baseline fuel DI1 as function of engine load at 2500 rpm. As evidenced from Figure 20e, the transition from baseline fuel DI1 to oxygenated fuel RME30 results in a relative reduction of HC emissions at all examined loads except from 80% load where the relative increase of NO emissions between DI1 and RME30 is rather limited. The percentage reduction of HC emissions in the case of RME30 ranges from 41% at 20% load to 20% at 60% load. Oppositely, the transition from baseline fuel DI1 to oxygenated fuel GLY10 results in a relative increase of HC emissions ranging from 1.3% at 80% load to 7.85% at 40% load. At 60% load, the replacement of fuel DI1 by fuel GLY10 results in a small decrease of HC emissions of 2%. According to Figure 20e, the combustion of oxygenated fuel GLY30 results in a reduction of HC emissions compared to conventional diesel oil DI1 combustion at all examined engine loads. This reduction spans from 0.4% at 80% load to 4% at 40% load.

5. Conclusions

In the present study, an experimental investigation was performed in a single-cylinder naturally-aspirated high-speed DI diesel engine “Lister LV1” at 2500 rpm and at four engine loads (20%, 40%, 60%, and 80%) using one non-oxygenated diesel oil DI1, one oxygenated blend RME30 containing 68.8 mass-% DI1 and 31.2 mass-% RME, and two oxygenated blends GLY10 and GLY30 containing 10.2 mass-% and 31.3 mass-% glycol ethers respectively. During engine tests, experimental data were received for cylinder pressure, injection pressure, TDC position, fuel consumption, and soot, NO, CO, and HC emissions at all examined loads. An experimental data model was developed in MATLAB [40] for processing initial signals for cylinder pressure, injection pressure, and TDC position, and for generating engine performance characteristics and heat release rate results.
From the comparative evaluation of the effects of oxygenated fuels RME30, GLY10, and GLY30 compared to baseline diesel operation with fuel DI1 on engine performance characteristics and measured exhaust emissions it can be concluded that:
  • The oxygenated fuel GLY30 indicated the highest impact on fuel injection process leading to the highest reduction in injection duration and the highest delay in injection process initiation compared to all other oxygenated fuels.
  • The combustion of the most highly oxygenated fuel GLY30 resulted in the highest reductions in indicated power, ISFC, BSFC, and ignition delay compared to other oxygenated fuels. Also, oxygenated fuel GLY30 showed the highest combustion durations compared to all other fuels both during premixed and diffusion-controlled combustion phases.
  • The combustion of oxygen-added fuel GLY30 indicated the lowest soot exhaust values compared to both non-oxygenated DI1 and oxygenated fuels RME30 and GLY10.
  • Combustion of all examined oxygenated fuels resulted in the deterioration of NO emissions compared to baseline diesel operation at most of the examined operating points. However, there is an engine operating point (60% load) where the combustion of the highly-oxygenated fuel GLY30 can reverse the well-known soot/NO trade-off of conventional diesel engines leading to reduction of both soot and NO emissions.
  • Combustion of all examined oxygenated fuels resulted in substantial deterioration of CO emissions compared to baseline diesel operation at all examined engine loads.
  • The use of the oxygenated fuel with the highest oxygen content (GLY30, 9% oxygen) resulted in reduction of HC emissions compared to conventional diesel oil operation.
Overall, it can be concluded that for almost the same blending proportion (31 mass-%) in conventional diesel oil, a biodiesel-agent (RME) appears to be have less detrimental impact on engine performance parameters and specific fuel consumption and more positive impact on HC emissions reduction compared to a mixture of synthetic oxygenates (glycol ethers). Oppositely, the same percentage of glycol ethers in a diesel blend appears to have more beneficial impact on soot and NO emissions compared to rapeseed methyl ester.

Author Contributions

Conceptualization, T.C.Z.; software, T.C.Z. and M.I.K.; validation, R.G.P.; data curation, E.G.P. and M.I.K.; writing—original draft preparation, T.C.Z. and R.G.P.; writing—review and editing, E.G.P. and M.I.K.

Funding

This research was funded by European Commission under “NeDeNeF–New Diesel Engines and New Diesel Fuels” research program with contract number G3RD-CT 1999-00021.

Acknowledgments

Authors wish to express their gratitude to the European Commission for funding the research program “NeDeNeF” under which the experimental investigation was conducted and to the Institut Francais du Petrole (IFP) for coordinating it. Authors wish to thank also Fortum Oil & Gas Oy for preparing all the test fuels and supplying us with invaluable raw data.

Conflicts of Interest

The authors declare no conflict of interest.

Nomenclature

ABDCAfter bottom dead center
ATDCAfter top dead center
BBDCBefore bottom dead center
BDCBottom dead center
BSFCBrake specific fuel consumption
BTDCBefore top dead center
CACrank angle
CA25Combustion duration of 25% of fuel injected mass per cycle
CA5Combustion duration of 5% of fuel injected mass per cycle
CA50Combustion duration of 50% of fuel injected mass per cycle
CA90Combustion duration of 90% of fuel injected mass per cycle
COCarbon monoxide
degDegrees
DIDirect injection
EGRExhaust gas recirculation
EVOExhaust valve opening
GLYGlycol ethers—glymes
HCTotal unburned hydrocarbons
IMEPIndicated mean effective pressure
ISFCIndicated specific fuel consumption
IVCInlet valve closing
NONitrogen monoxide
ppmPart per million
RMERapeseed methyl ester
RPMRotations per minute
SOIStart of injection
TDCTop dead center

References

  1. Mollenhauer, K.; Tschoeke, H. Handbook of Diesel Engines; Springer–Verlag: Berlin/Heidelberg, Germany, 2010. [Google Scholar]
  2. Wartsila 31, World’s Most Efficient 4-Stroke Diesel Engine. Available online: https://www.wartsila.com/docs/default-source/product-files/engines/ms-engine/brochure-o-e-w31.pdf (accessed on 21 April 2019).
  3. MAN Diesel & Turbo, Marine Engine IMO Tier II and Tier III Programme 2018. Available online: https://www.man-es.com/docs/default-source/marine/4510_0017_02web.pdf (accessed on 21 April 2019).
  4. DieselNet: Engine & Emission Technology Online. Available online: https://www.dieselnet.com (accessed on 21 April 2019).
  5. Papagiannakis, R.G.; Krishnan, S.R.; Rakopoulos, D.C.; Srinivasan, K.K.; Rakopoulos, C.D. A combined experimental and theoretical study of diesel fuel injection timing and gaseous fuel/diesel mass ratio effects on the performance and emissions of natural gas-diesel HDDI engine operating at various loads. Fuel 2017, 202, 675–687. [Google Scholar] [CrossRef]
  6. Golimowski, W.; Krzaczek, P.; Marcinkowski, D.; Gracz, W.; Walowski, G. Impact of biogas and waste fats methyl esters on NO, NO2, CO and PM emission by dual fuel diesel engine. Sustainability 2019, 11, 1799. [Google Scholar] [CrossRef]
  7. Kosmadakis, G.M.; Rakopoulos, D.C.; Rakopoulos, C.D. Methane/hydrogen fueling a spark-ignition engine for studying NO, CO and HC emissions with a research CFD code. Fuel 2016, 185, 903–915. [Google Scholar] [CrossRef]
  8. Rakopoulos, D.C. Heat release analysis of combustion in heavy-duty turbocharged diesel engine operating on blends of diesel fuel with cottonseed or sunflower oils and their bio-diesel. Fuel 2012, 96, 524–534. [Google Scholar] [CrossRef]
  9. Rakopoulos, D.C.; Rakopoulos, C.D.; Giakoumis, E.G. Impact of properties of vegetable oil, bio-diesel, ethanol and n-butanol on the combustion and emissions of turbocharged HDDI diesel engine operating under steady and transient conditions. Fuel 2015, 156, 1–19. [Google Scholar] [CrossRef]
  10. Rakopoulos, D.C.; Rakopoulos, C.D.; Kyritsis, D.C. Butanol or DEE blends with either straight vegetable oil or biodiesel excluding fossil fuel: Comparative effects on diesel engine combustion attributes, cyclic variability and regulated emissions trade-off. Energy 2016, 115, 314–325. [Google Scholar] [CrossRef]
  11. Rakopoulos, D.C.; Rakopoulos, C.D.; Giakoumis, E.G.; Komninos, N.P.; Kosmadakis, G.M.; Papagiannakis, R.G. Comparative evaluation of ethanol, n-butanol, and diethyl ether effects as biofuel supplements on combustion characteristics, cyclic variations, and emissions balance in light-duty diesel engine. ASCE J. Energy Eng. 2017, 143, 04016044. [Google Scholar] [CrossRef]
  12. Chauhan, B.-S.; Singh, R.-K.; Cho, H.M.; Lim, H.C. Practice of diesel fuel blends using alternative fuels: A review. Renew. Sust. Energy Rev. 2016, 59, 1358–1368. [Google Scholar] [CrossRef]
  13. Hosseinzadeh–Bandbafha, H.; Tabatabaei, M.; Aghbashlo, M.; Khanali, M.; Demirbas, A. A comprehensive review on the environmental impacts of diesel/biodiesel additives. Energy Convers. Manag. 2018, 174, 579–614. [Google Scholar] [CrossRef]
  14. Giakoumis, E.G.; Rakopoulos, D.C.; Rakopoulos, C.D. Combustion noise radiation during dynamic diesel engine operation including effects of various biofuel blends: A review. Renew. Sust. Energy Rev. 2016, 54, 1099–1113. [Google Scholar] [CrossRef]
  15. Giakoumis, E.G.; Rakopoulos, C.D.; Dimaratos, A.M.; Rakopoulos, D.C. Exhaust emissions of diesel engines operating under transient conditions with biodiesel fuel blends. Prog. Energy Combust. Sci. 2012, 38, 691–715. [Google Scholar] [CrossRef]
  16. Giakoumis, E.G.; Sarakatsanis, C.K. A comparative assessment of biodiesel cetane number predictive correlations based on fatty acid composition. Energies 2019, 12, 422. [Google Scholar] [CrossRef]
  17. Rakopoulos, C.D.; Rakopoulos, D.C.; Kyritsis, D.C. Development and validation of a comprehensive two-zone model for combustion and emissions formation in a DI diesel engine. Int. J. Energy Res. 2003, 27, 1221–1249. [Google Scholar] [CrossRef]
  18. Rakopoulos, C.D.; Rakopoulos, D.C.; Mavropoulos, G.C.; Kosmadakis, G.M. Investigating the EGR rate and temperature impact on diesel engine combustion and emissions under various injection timings and loads by comprehensive two-zone modeling. Energy 2018, 157, 990–1014. [Google Scholar] [CrossRef]
  19. Rakopoulos, D.C.; Rakopoulos, C.D.; Giakoumis, E.G.; Papagiannakis, R.G. Evaluating oxygenated fuel’s influence on combustion and emissions in diesel engines using a two-zone combustion model. ASCE J. Energy Eng. 2018, 144, 04018046. [Google Scholar] [CrossRef]
  20. Rakopoulos, C.D.; Hountalas, D.T.; Zannis, T.C. Theoretical Study Concerning the Effect of Oxygenated Fuels on DI Diesel Engine Performance and Emissions; SAE Technical Paper 2004-01-1838; SAE International: New York, NY, USA, 2004. [Google Scholar] [CrossRef]
  21. Park, W.; Park, S.; Reitz, R.D.; Kurtz, E. The effect of oxygenated fuel properties on diesel spray combustion and soot formation. Combust. Flame 2017, 180, 276–283. [Google Scholar] [CrossRef]
  22. Rakopoulos, C.D.; Giakoumis, E.G.; Hountalas, D.T.; Rakopoulos, D.C. The Effect of Various Dynamic, Thermodynamic and Design Parameters on the Performance of a Turbocharged Diesel Engine Operating under Transient Load Conditions; SAE Technical Paper 2004-01-0926; SAE International: New York, NY, USA, 2004. [Google Scholar] [CrossRef]
  23. Labecki, L.; Lindner, A.; Winklmayr, W.; Uitz, R.; Cracknell, R.; Ganippa, L. Effects of injection parameters and EGR on exhaust soot particle number-size distribution for diesel and RME fuels in HSDI engines. Fuel 2013, 112, 224–235. [Google Scholar] [CrossRef]
  24. Klyus, O. Biofuels for self-ignition engines. Sci. J. Marit. Univ. Szczecin 2005, 7, 153–156. [Google Scholar]
  25. Buyukkaya, E. Effects of biodiesel on a DI diesel engine performance, emission and combustion characteristics. Fuel 2010, 89, 3099–3105. [Google Scholar] [CrossRef]
  26. Allocca, L.; Mancaruso, E.; Montanaro, A.; Sequino, L.; Vaglieco, B.-M. Evaluation of RME (rapeseed methyl ester) and mineral diesel fuels behaviour in quiescent vessel and EURO 5 engine. Energy 2014, 77, 783–790. [Google Scholar] [CrossRef]
  27. Imran, S.; Emberson, D.R.; Wen, D.S.; Diez, A.; Crookes, R.J.; Korakianitis, T. Performance and specific emissions contours of a diesel and RME fueled compression-ignition engine throughout its operating speed and power range. Appl. Energy 2013, 111, 771–777. [Google Scholar] [CrossRef]
  28. Johansson, M.; Yang, J.; Ochoterena, R.; Gjirja, S.; Denbratt, I. NOx and soot emissions trends for RME, SME and PME fuels using engine and spray experiments in combination with simulations. Fuel 2013, 106, 293–302. [Google Scholar] [CrossRef]
  29. Mancaruso, E.; Sequino, L.; Vaglieco, B.-M. GTL (Gas To Liquid) and RME (Rapeseed Methyl Ester) combustion analysis in a transparent CI (compression ignition) engine by means of IR (infrared) digital imaging. Energy 2013, 58, 185–191. [Google Scholar] [CrossRef]
  30. Guido, C.; Beatrice, C.; Napolitano, P. Application of bioethanol/RME/diesel blend in a Euro5 automotive diesel engine: Potentiality of closed loop combustion control technology. Appl. Energy 2013, 102, 13–23. [Google Scholar] [CrossRef]
  31. Tsolakis, A.; Megaritis, A.; Wyszynski, M.L.; Theinnoi, K. Engine performance and emissions of a diesel engine operating on diesel-RME (rapeseed methyl ester) blends with EGR (exhaust gas recirculation). Energy 2007, 32, 2072–2080. [Google Scholar] [CrossRef]
  32. Gómez-Cuenca, F.; Gómez-Marín, M.; Folgueras-Díaz, M.B. Effects of ethylene glycol ethers on diesel fuel properties and emissions in a diesel engine. Energy Convers. Manag. 2011, 52, 3027–3033. [Google Scholar] [CrossRef]
  33. Song, H.; Quinton, K.-S.; Peng, Z.; Zhao, H.; Ladommatos, N. Effects of oxygen content of fuels on combustion and emissions of diesel engines. Energies 2016, 9, 28. [Google Scholar] [CrossRef]
  34. Zannis, T.C.; Hountalas, D.T.; Kouremenos, D.A. Experimental investigation to specify the effect of oxygenated additive content and type on di diesel engine performance and emissions. Trans. SAE J. Fuels Lubr. 2004, 113, 1723–1743. [Google Scholar] [CrossRef]
  35. Zannis, T.C.; Hountalas, D.T. DI diesel engine performance and emissions from the oxygen enrichment of fuels with various aromatic content. Energy Fuels 2004, 18, 659–666. [Google Scholar] [CrossRef]
  36. Rakopoulos, C.D.; Hountalas, D.T.; Zannis, T.C.; Levendis, Y.A. Operational and environmental evaluation of diesel engines burning oxygen-enriched air or oxygen-enriched fuels: A. review. Trans. SAE J. Fuels Lubr. 2004, 113, 1723–1743. [Google Scholar] [CrossRef]
  37. Laskowski, R.; Chybowski, L.; Gawdzinska, K. An engine room simulator as a tool for environmental education of marine engineers. In Advances in Intelligent Systems and Computing; Springer: Berlin/Heidelberg, Germany, 2015. [Google Scholar]
  38. AVL GCA—Gas Exchange and Combustion Analysis Software. Available online: https://www.avl.com/-/gca-gas-exchange-and-combustion-analysis-software (accessed on 21 April 2019).
  39. Kongsberg, K-Chief Vessel Performance System. Available online: https://www.kongsberg.com (accessed on 21 April 2019).
  40. MATLAB and Statistics Toolbox Release 2014a, The MathWorks, Inc., Natick, Massachusetts, United States. Available online: https://www.mathworks.com/products/matlab.html (accessed on 21 April 2019).
  41. Zannis, T.C.; Hountalas, D.T.; Papagiannakis, R.G.; Levendis, Y.A. Effect of fuel chemical structure and properties on diesel engine performance and pollutant emissions: Review of the results of four European research programs. Trans. SAE J. Fuels Lubr. 2008, 117. [Google Scholar] [CrossRef]
  42. Bueno, A.V.; Velásquez, J.A.; Milanez, L.F. Internal Combustion Engine Indicating Measurements. In Applied Measuring Systems; Md. Zahurul Haq; IntechOpen: London, UK, 2012; Volume 2, ISBN 978-953-51-0103-1. [Google Scholar]
  43. Chapra, S.C.; Canale, R.P. Numerical Methods for Engineers, 6th ed.; McGraw-Hill: New York, NY, USA, 2010; ISBN 978-0-07-340106-5. [Google Scholar]
  44. Hahn, B.; Valentine, D.T. Essential MATLAB for Scientists and Engineers, 3rd ed.; Butterworth-Heinemann: Burlington, VT, USA, 2007; ISBN 13: 9-78-0-75-068417-0. [Google Scholar]
  45. Byttner, S.; Rongvaldsson, T.; Wickstrom, N. Estimation of Combustion Variability Using In-cylinder Ionization Measurements; SAE Technical Paper 2001-01-3485; SAE International: New York, NY, USA, 2001. [Google Scholar] [CrossRef]
  46. Heywood, J.B. Internal Combustion Engine Fundamentals; McGraw-Hill: New York, NY, USA, 1988. [Google Scholar]
  47. Ferguson, C.R. Internal Combustion Engines—Applied Thermosciences; John Wiley: New York, NY, USA, 1986. [Google Scholar]
  48. Annand, W.J.D. Heat transfer in the cylinders of reciprocating internal combustion engines. Proc. Inst. Mech. Eng. 1963, 177, 973–990. [Google Scholar]
  49. Rakopoulos, C.D.; Mavropoulos, G.C. Experimental instantaneous heat fluxes in the cylinder head and exhaust manifold of an air-cooled diesel engine. Energy Convers. Manag. 2000, 41, 1265–1281. [Google Scholar] [CrossRef]
  50. Chybowski, L.; Laskowski, R.; Gawdzinska, K. An overview of systems supplying water into the combustion chamber of diesel engines to decrease the amount of nitrogen oxides in exhaust gas. J. Mar. Sci. Technol. 2015, 20, 393–405. [Google Scholar] [CrossRef]
Figure 1. Schematic view of the experimental installation used to perform engine tests in “Lister LV1” DI diesel engine using test fuels DI1, RME30, GLY10, and GLY30.
Energies 12 01547 g001
Figure 2. Photographic view of the Alcock air flow meter installed at the intake of the diesel engine “Lister LV1” [35,41].
Energies 12 01547 g002
Figure 3. (a) Photographic view of the magnetic pickup installation on “Lister LV1” engine flywheel and (b) schematic view of the complete installation of the top dead center (TDC) position magnetic pickup with the signal amplifier, the oscilloscope, and the PC analog-to-digital recording system [35,41].
Energies 12 01547 g003
Figure 4. (a) Cylinder pressure signal, (b) fuel injection pressure signal, and (c) TDC position signal as obtained from the “Lister LV1” engine during testing procedure for test fuel DI1 at 2500 rpm and at 60% of full engine load.
Energies 12 01547 g004
Figure 5. Graphical explanation of the procedure followed for the determination of the number of complete engine cycles. Experimental data are given for “Lister LV1” engine at 2500 rpm and at 60% of full engine load using fuel DI1.
Energies 12 01547 g005
Figure 6. Graphical explanation of “hot TDC” position determination per engine cycle. Also, in the figure, the graphical explanation of the cylinder pressure and the injection pressure measurements tracking corresponding to the “hot TDC” is shown. Experimental data are given for “Lister LV1” engine at 2500 rpm and at 60% of full engine load using fuel DI1.
Energies 12 01547 g006
Figure 7. Comparison of experimental results for fuel injection pressure profile of (a) the first engine operation cycle, (b) the fifth engine operation cycle, and (c) the ninth engine operation cycle for test fuels RME30 and GLY30 at 2500 rpm and at 80% of full load. All experimental results are given for the high-speed single-cylinder DI diesel engine “Lister LV1”.
Energies 12 01547 g007
Figure 8. Comparison of experimental results for cylinder pressure profile of (a) the first engine operation cycle, (b) the fifth engine operation cycle, and (c) the ninth engine operation cycle for test fuels RME30 and GLY30 at 2500 rpm and at 80% of full load. All experimental results are given for the high-speed single-cylinder DI diesel engine “Lister LV1”.
Energies 12 01547 g008
Figure 9. Comparison of experimental results for (a) instantaneous in-cylinder gross heat release rate and (b) instantaneous in-cylinder heal loss rate for test fuels RME30 and GLY30 at 2500 rpm and at 80% of full load. All experimental results are given for the high-speed single-cylinder DI diesel engine “Lister LV1”.
Energies 12 01547 g009
Figure 10. Comparison of experimental results for (a) in-cylinder cumulative gross heat release rate, (b) in-cylinder cumulative net heat release rate, and (c) the in-cylinder cumulative heal loss rate for test fuels RME30 and GLY30 at 2500 rpm and at 80% of full load. All experimental results are given for the high-speed single-cylinder DI diesel engine “Lister LV1”.
Energies 12 01547 g010
Figure 11. Comparison of experimental results for fuel injection pressure profile of (a) the first engine operation cycle, (b) the fifth engine operation cycle, and (c) the ninth engine operation cycle for test fuels GLY10 and GLY30 at 2500 rpm and at 80% of full load. All experimental results are given for the high-speed single-cylinder DI diesel engine “Lister LV1”.
Energies 12 01547 g011
Figure 12. Comparison of experimental results for fuel injection pressure profile of (a) the first engine operation cycle, (b) the fifth engine operation cycle, and (c) the ninth engine operation cycle for test fuels GLY10 and GLY30 at 2500 rpm and at 80% of full load. All experimental results are given for the high-speed single-cylinder DI diesel engine “Lister LV1”.
Energies 12 01547 g012
Figure 13. Comparison of experimental results for (a) instantaneous in-cylinder gross heat release rate and (b) instantaneous in-cylinder heal loss rate for test fuels GLY10 and GLY30 at 2500 rpm and at 80% of full load. All experimental results are given for the high-speed single-cylinder DI diesel engine “Lister LV1”.
Energies 12 01547 g013
Figure 14. Comparison of experimental results for (a) in-cylinder cumulative gross heat release rate, (b) in-cylinder cumulative net heat release rate, and (c) the in-cylinder cumulative heal loss rate for test fuels GLY10 and GLY30 at 2500 rpm and at 80% of full load. All experimental results are given for the high-speed single-cylinder DI diesel engine “Lister LV1”.
Energies 12 01547 g014
Figure 15. Effect of test fuels DI1, RME30, GLY10, and GLY30 on the covariance of measured mean injection pressure and indicated mean effective pressure (IMEP). Results are given for the high-speed DI diesel engine “Lister LV1” at 2500 rpm and at 80% of full load.
Energies 12 01547 g015
Figure 16. Comparative assessment of experimental results of (a) injection pressure profiles, (b) relative changes of injection duration, and (c) relative change of start of injection (SOI) for test fuels DI1, RME30, GLY10, and GLY30. All relative changes are expressed with reference to the corresponding value of fuel DI1. Experimental results are given at 2500 rpm and at 80% of full load for the high-speed single-cylinder DI diesel engine “Lister LV1”.
Energies 12 01547 g016
Figure 17. Comparative assessment of experimental results of (a) cylinder pressure profiles, (b) relative changes of indicated power, and (c) relative change of indicated specific fuel consumption (ISFC) for test fuels DI1, RME30, GLY10, and GLY30. All relative changes are expressed with reference to the corresponding value of fuel DI1. Experimental results are given at 2500 rpm and at 80% of full load for the high-speed single-cylinder DI diesel engine “Lister LV1”.
Energies 12 01547 g017
Figure 18. Comparative assessment of experimental results of (a) instantaneous net heat release rate profiles, (b) relative change of ignition angle, and (c) relative change of ignition delay for test fuels DI1, RME30, GLY10, and GLY30. All relative changes are expressed with reference to the corresponding value of fuel DI1. Experimental results are given at 2500 rpm and at 80% of full load for the high-speed single-cylinder DI diesel engine “Lister LV1”.
Energies 12 01547 g018aEnergies 12 01547 g018b
Figure 19. Comparative assessment of experimental results for the relative changes of combustion durations of (a) 5% of fuel injected mass (CA5), (b) 25% of fuel injected mass (CA25), (c) 50% of fuel injected mass (CA50), and (d) 90% of fuel injected mass (CA90) for test fuels DI1, RME30, GLY10, and GLY30. All relative values are expressed with reference to the corresponding value of fuel DI1. Experimental results are given at 2500 rpm and at 80% of full load for the high-speed single-cylinder DI diesel engine “Lister LV1”.
Energies 12 01547 g019aEnergies 12 01547 g019b
Figure 20. Comparative assessment of experimental results for the relative changes of (a) brake-specific fuel consumption BSFC, (b) measured exhaust soot, (c) measured exhaust NO, (d) measured exhaust CO, and (e) measured exhaust total unburned hydrocarbons (HC) for test fuels DI1, RME30, GLY10, and GLY30. Experimental results are given at 2500 rpm and at 80% of full load for the high-speed single-cylinder DI diesel engine “Lister LV1”.
Energies 12 01547 g020
Table 1. Chemical composition, physical properties, and chemical properties of test fuels DI1, RME30, GLY10, and GLY30 examined in the present study [20,34,36].
FuelMethodDI1RME30GLY10GLY30
Description “Base” fuelDI1 + RME
3% oxygen
DI1 + Glymes
3% oxygen
DI1 + Glymes
9% oxygen
Fuel Recipe Finnish summer grade city diesel70 mass-% DI1
30 mass-% RME
90.7 mass-% DI1
5.0 mass-% Diglyme
4.3 mass- % Butyl Diglyme
71.4 mass-% DI1
15.0 mass-% Diglyme
13.6 mass-% Butyl Diglyme
Paraffines, mass-%ASTM D242540.128.136.428.6
Naphtenics, mass-%ASTM D242540.128.136.428.6
Aromatics, mass-%ASTM D254919.813.918.014.1
Density, 15 °C, kg/m3ISO 3675833.7848.2840.5854.9
Distillation, °C, 5%ISO 3405208.0221.5192.9175.2
Distillation, °C, 50%ISO 3405270.2307.3265.3254.6
Distillation, °C, 95%ISO 3405347.9350.6348.8345.2
Cetane numberISO 516553.354.259.572.7
Viscosity +40 °C, mm2/sISO 31042.943.272.541.99
LHV, MJ/kgISO 192843.0341.2241.4838.75
Compressibility, 60 bar, 20 °C, [× 10−5 bar−1]FEV6.816.566.876.98
Sulphur, mg/kgISO 8754 / D321031232823
Diglyme, mass-%GC-AED005.516.6
Butyl Diglyme, mass-%GC-AED004.714.7
Glymes, mass-%Calc.0010.231.3
RME ContentGC-AED031.200
Carbon, %ASTM D529186.183.083.278.1
Hydrogen, %ASTM D529114.013.313.613.2
C/H ratioASTM D52916.16.206.105.94
Oxygen contentCalc.0339
Table 2. Main technical data of the diesel engine “Lister LV1” used in the experiments [20,34,36].
Technical SpecificationDefinition
Number of cylinders1
Engine operation typeFour-stroke
Air breathing typeNaturally aspirated
Cooling methodAir cooled
Combustion chamberDirect injection—“Bowl-in-piston”
Cylinder bore85.73 mm
Piston stroke82.55 mm
Connecting rod length188.5 mm
Compression ratio17:1
Nominal speed range1000–3000 RPM
Maximum power6.7 kW @ 3000 RPM
Maximum torque25 Nm @ 2000 RPM
Number of fuel injector holes3
Nozzle orifice diameter0.250 mm
Injector opening pressure180 bar
Number of valves per cylinder2
Intake valve opening15 degCA BTDC
Intake valve closing41 degCA ABDC
Exhaust valve opening41 degCA BBDC
Exhaust valve closing15 degCA ATDC
Table 3. Main operating parameters of the diesel engine “Lister LV1” used in the experiments.
Engine Speed (RPM)Laboratory Barometric Pressure (mmHg)Laboratory Relative Humidity (%)Laboratory Dry Air Temperature (oC)Hydraulic Dynamometer Load (kg)Engine Power (kW)Engine Load (%)Lubricant Oil System Pressure (bar)
2500771.858.526.211.23200.7–1
770.65727.522.45400.7–1
769.556.527.833.68600.7–1
768562844.90800.7–1
Table 4. Results for the estimated intake air mass flow rate and the measured fuel flow rate of the engine for each one of the test fuels DI1, RME30, GLY10, and GLY30 at 2500 RPM and at 80% of full load.
FuelAlcock Value (cm)Intake Air Volume Flow Rate (m3/h)Intake Air Density (kg/m3)Intake Air Mass Flow Rate (kg/h)Measured Time of 50 mL Fuel Consumption (s)Fuel Consumption (kg/h)
DI116.828.531.19734.1591051.429
RME3016.728.361.19033.756991.542
GLY1016.728.361.18833.6751011.498
GLY3016.928.701.18433.9891031.494

