Optimal Scheduling of Plug-in Electric Vehicle Charging Including Time-of-Use Tariff to Minimize Cost and System Stress


 , and
, and
Abstract
1. Introduction
2. PEV Charging Coordination
3. Problem Formulation
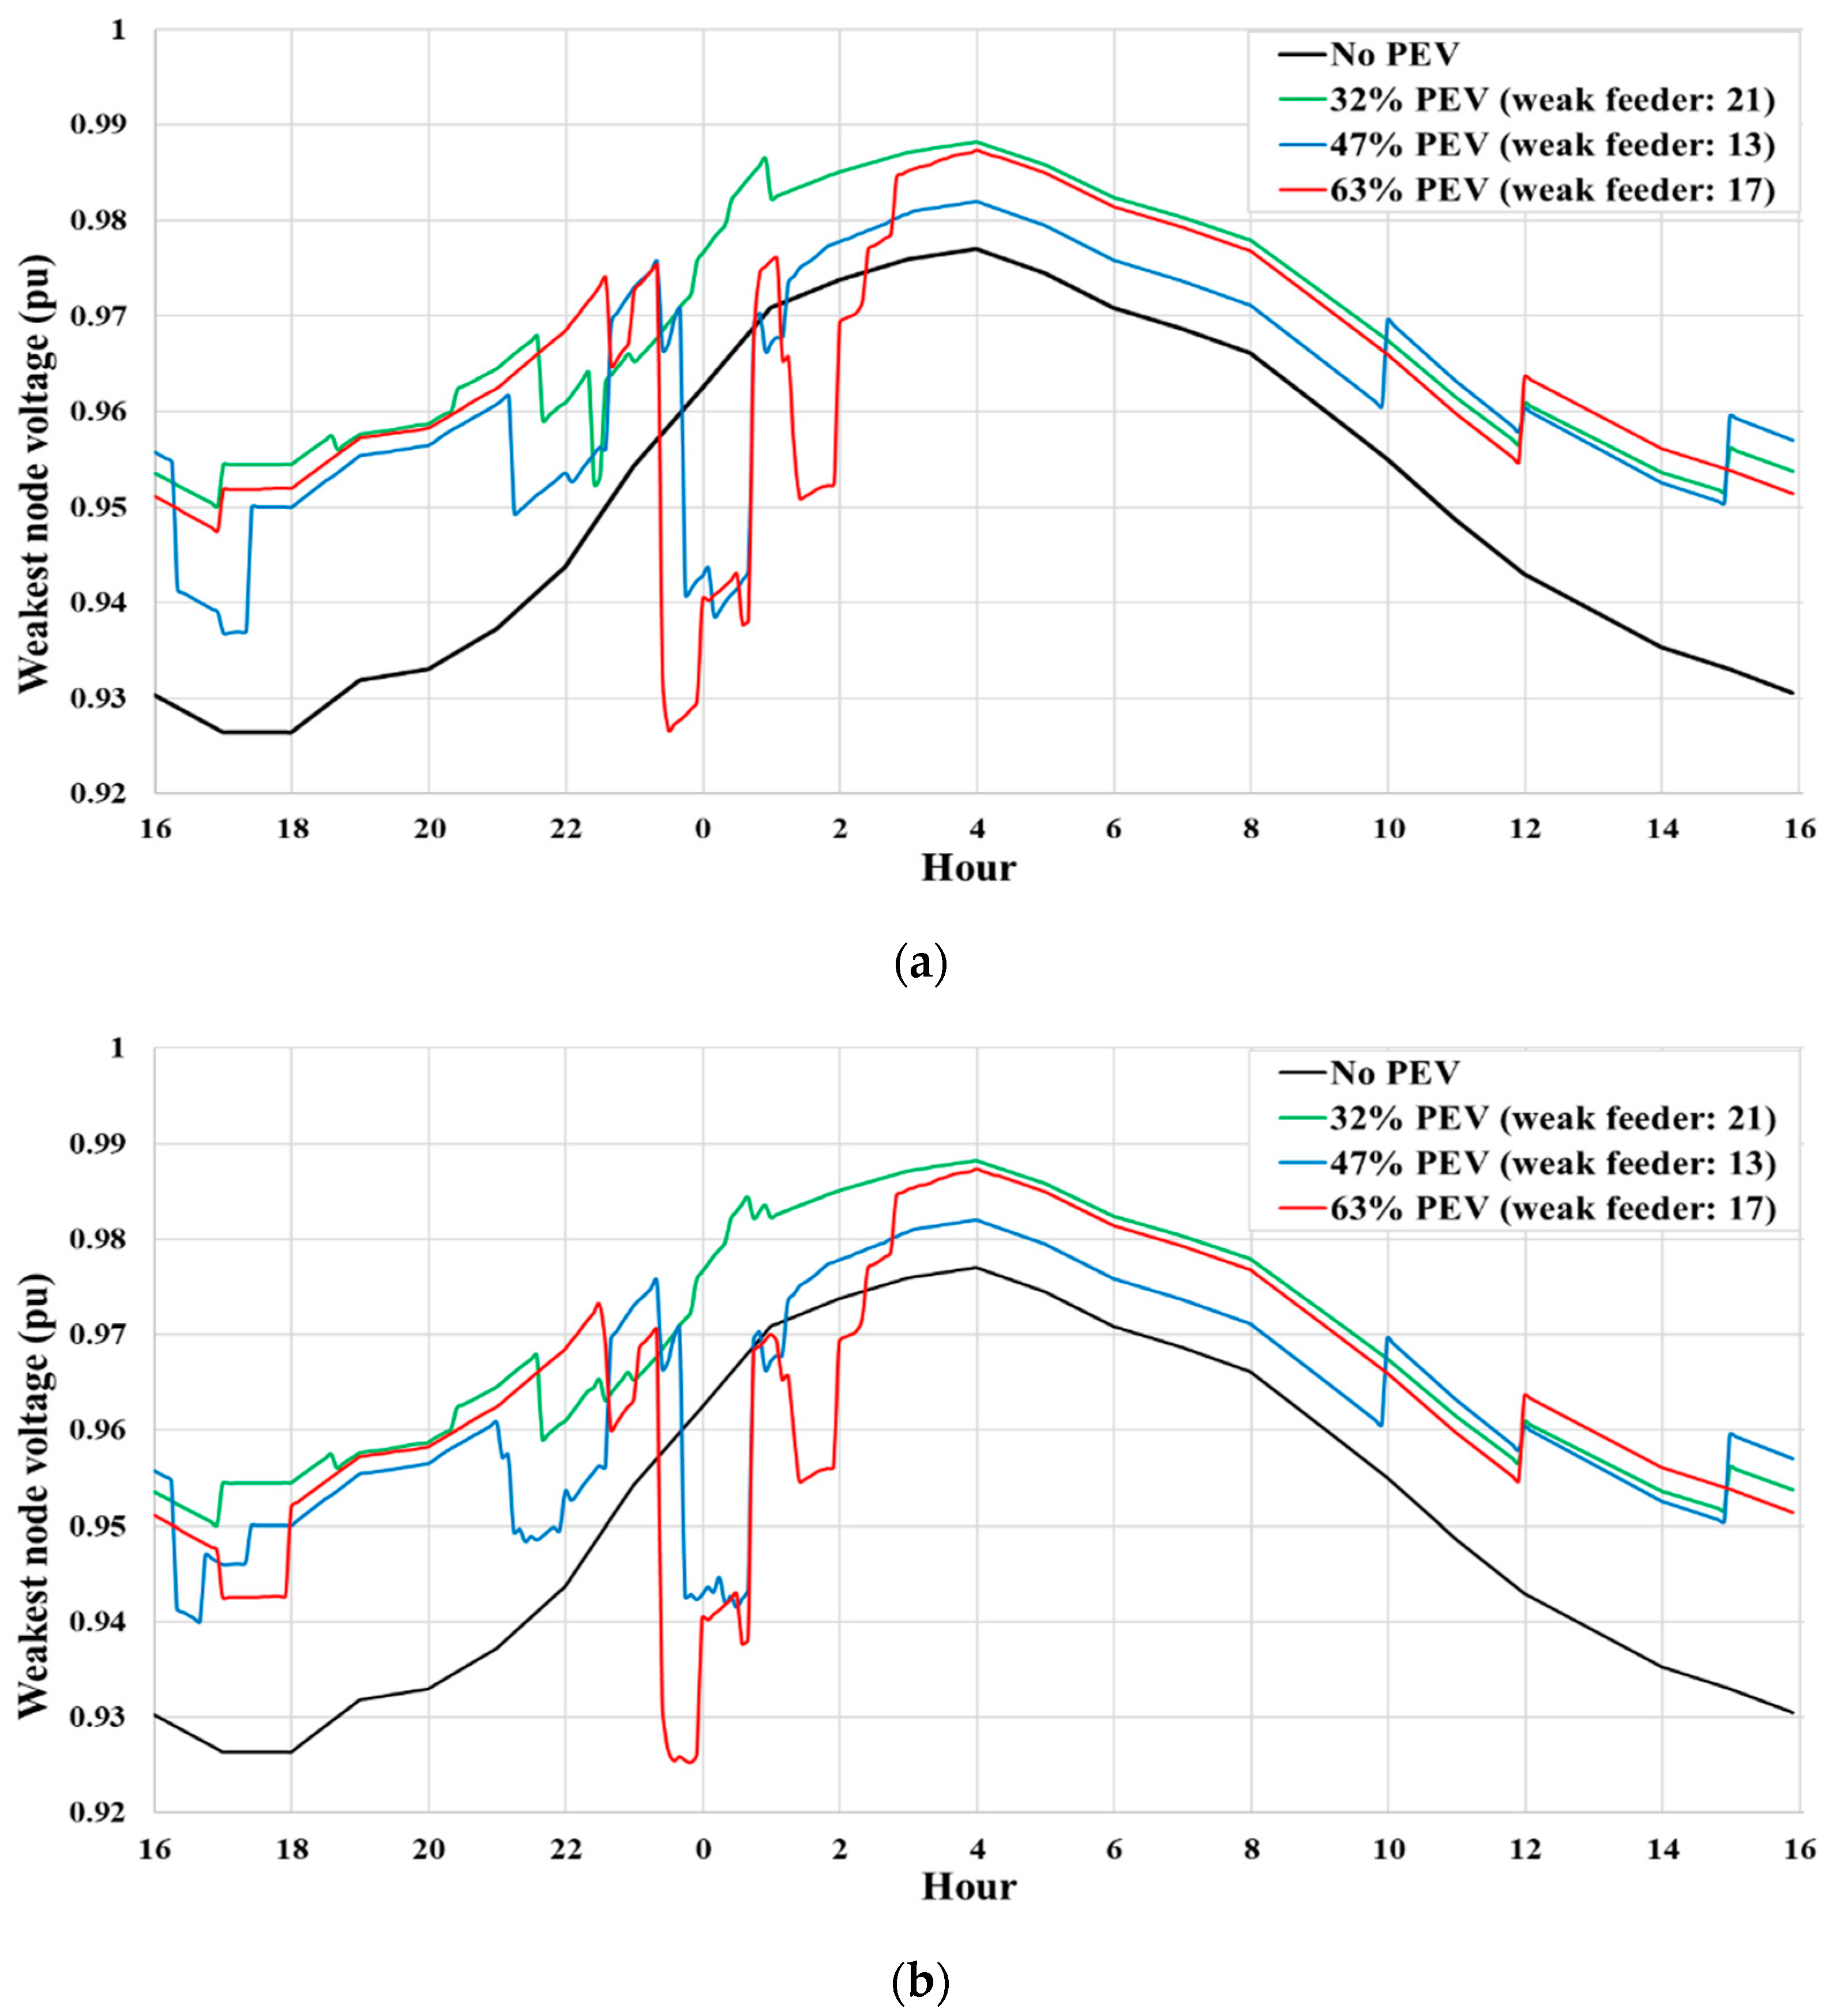
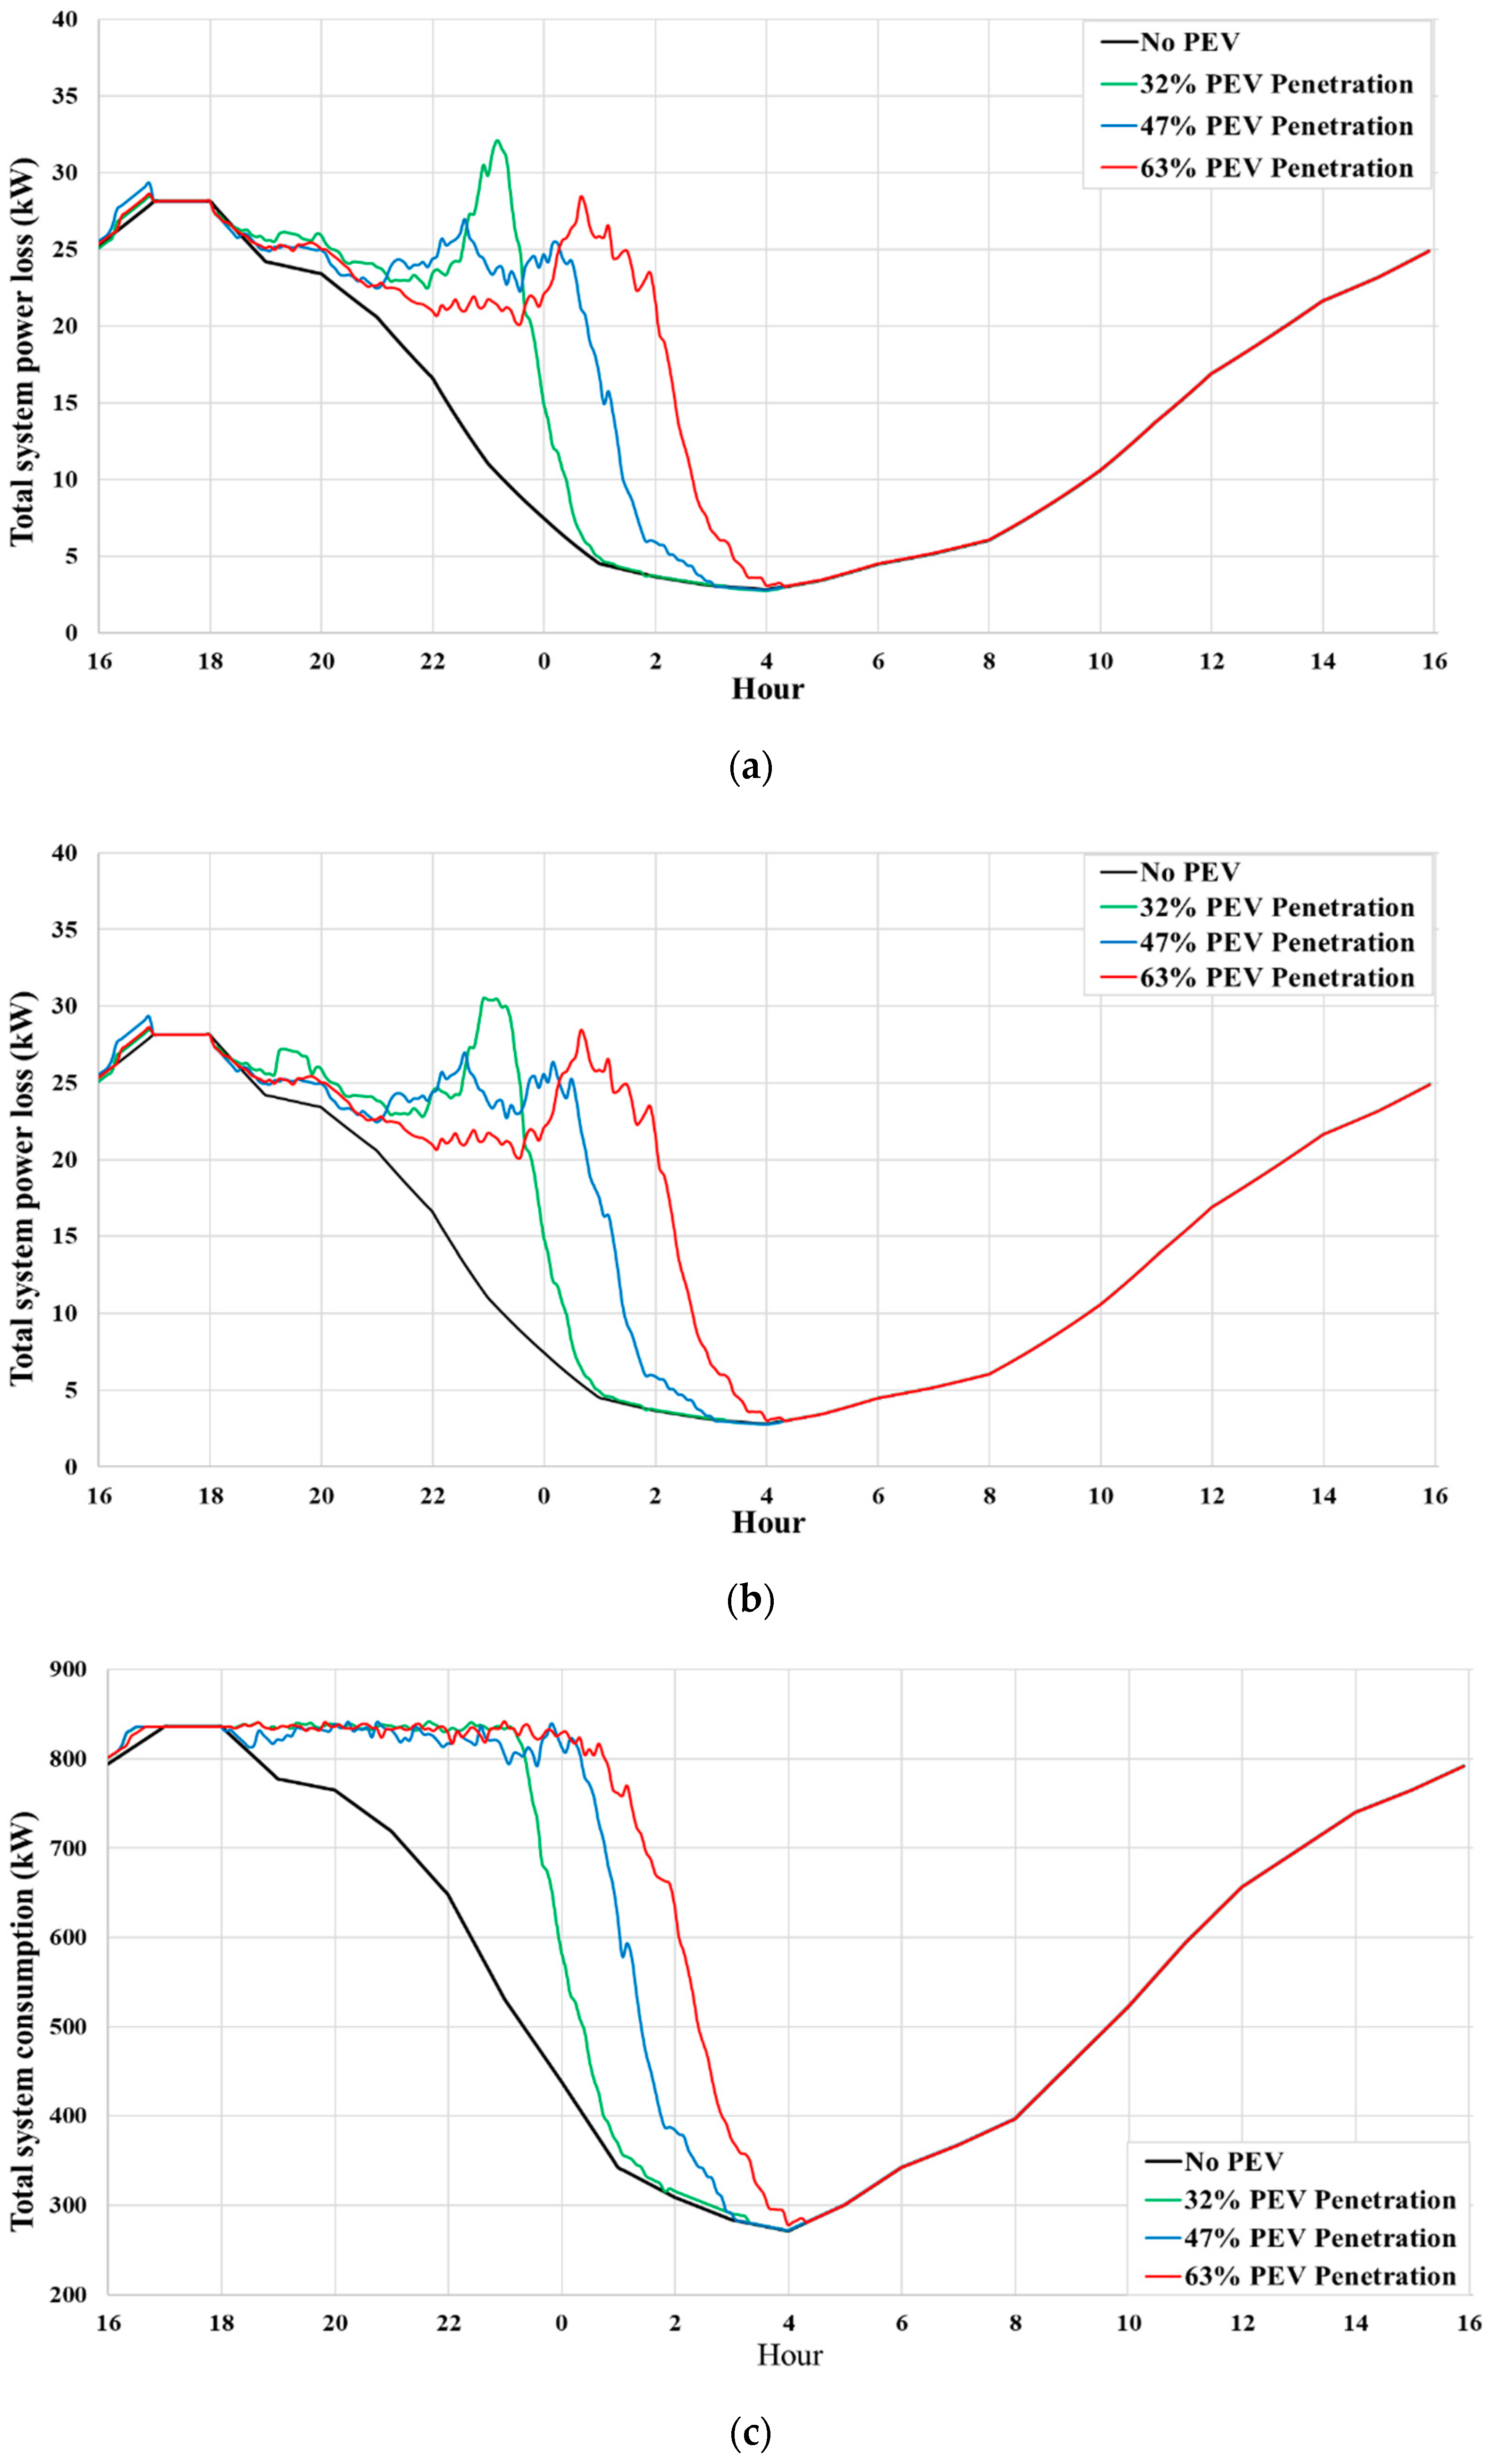
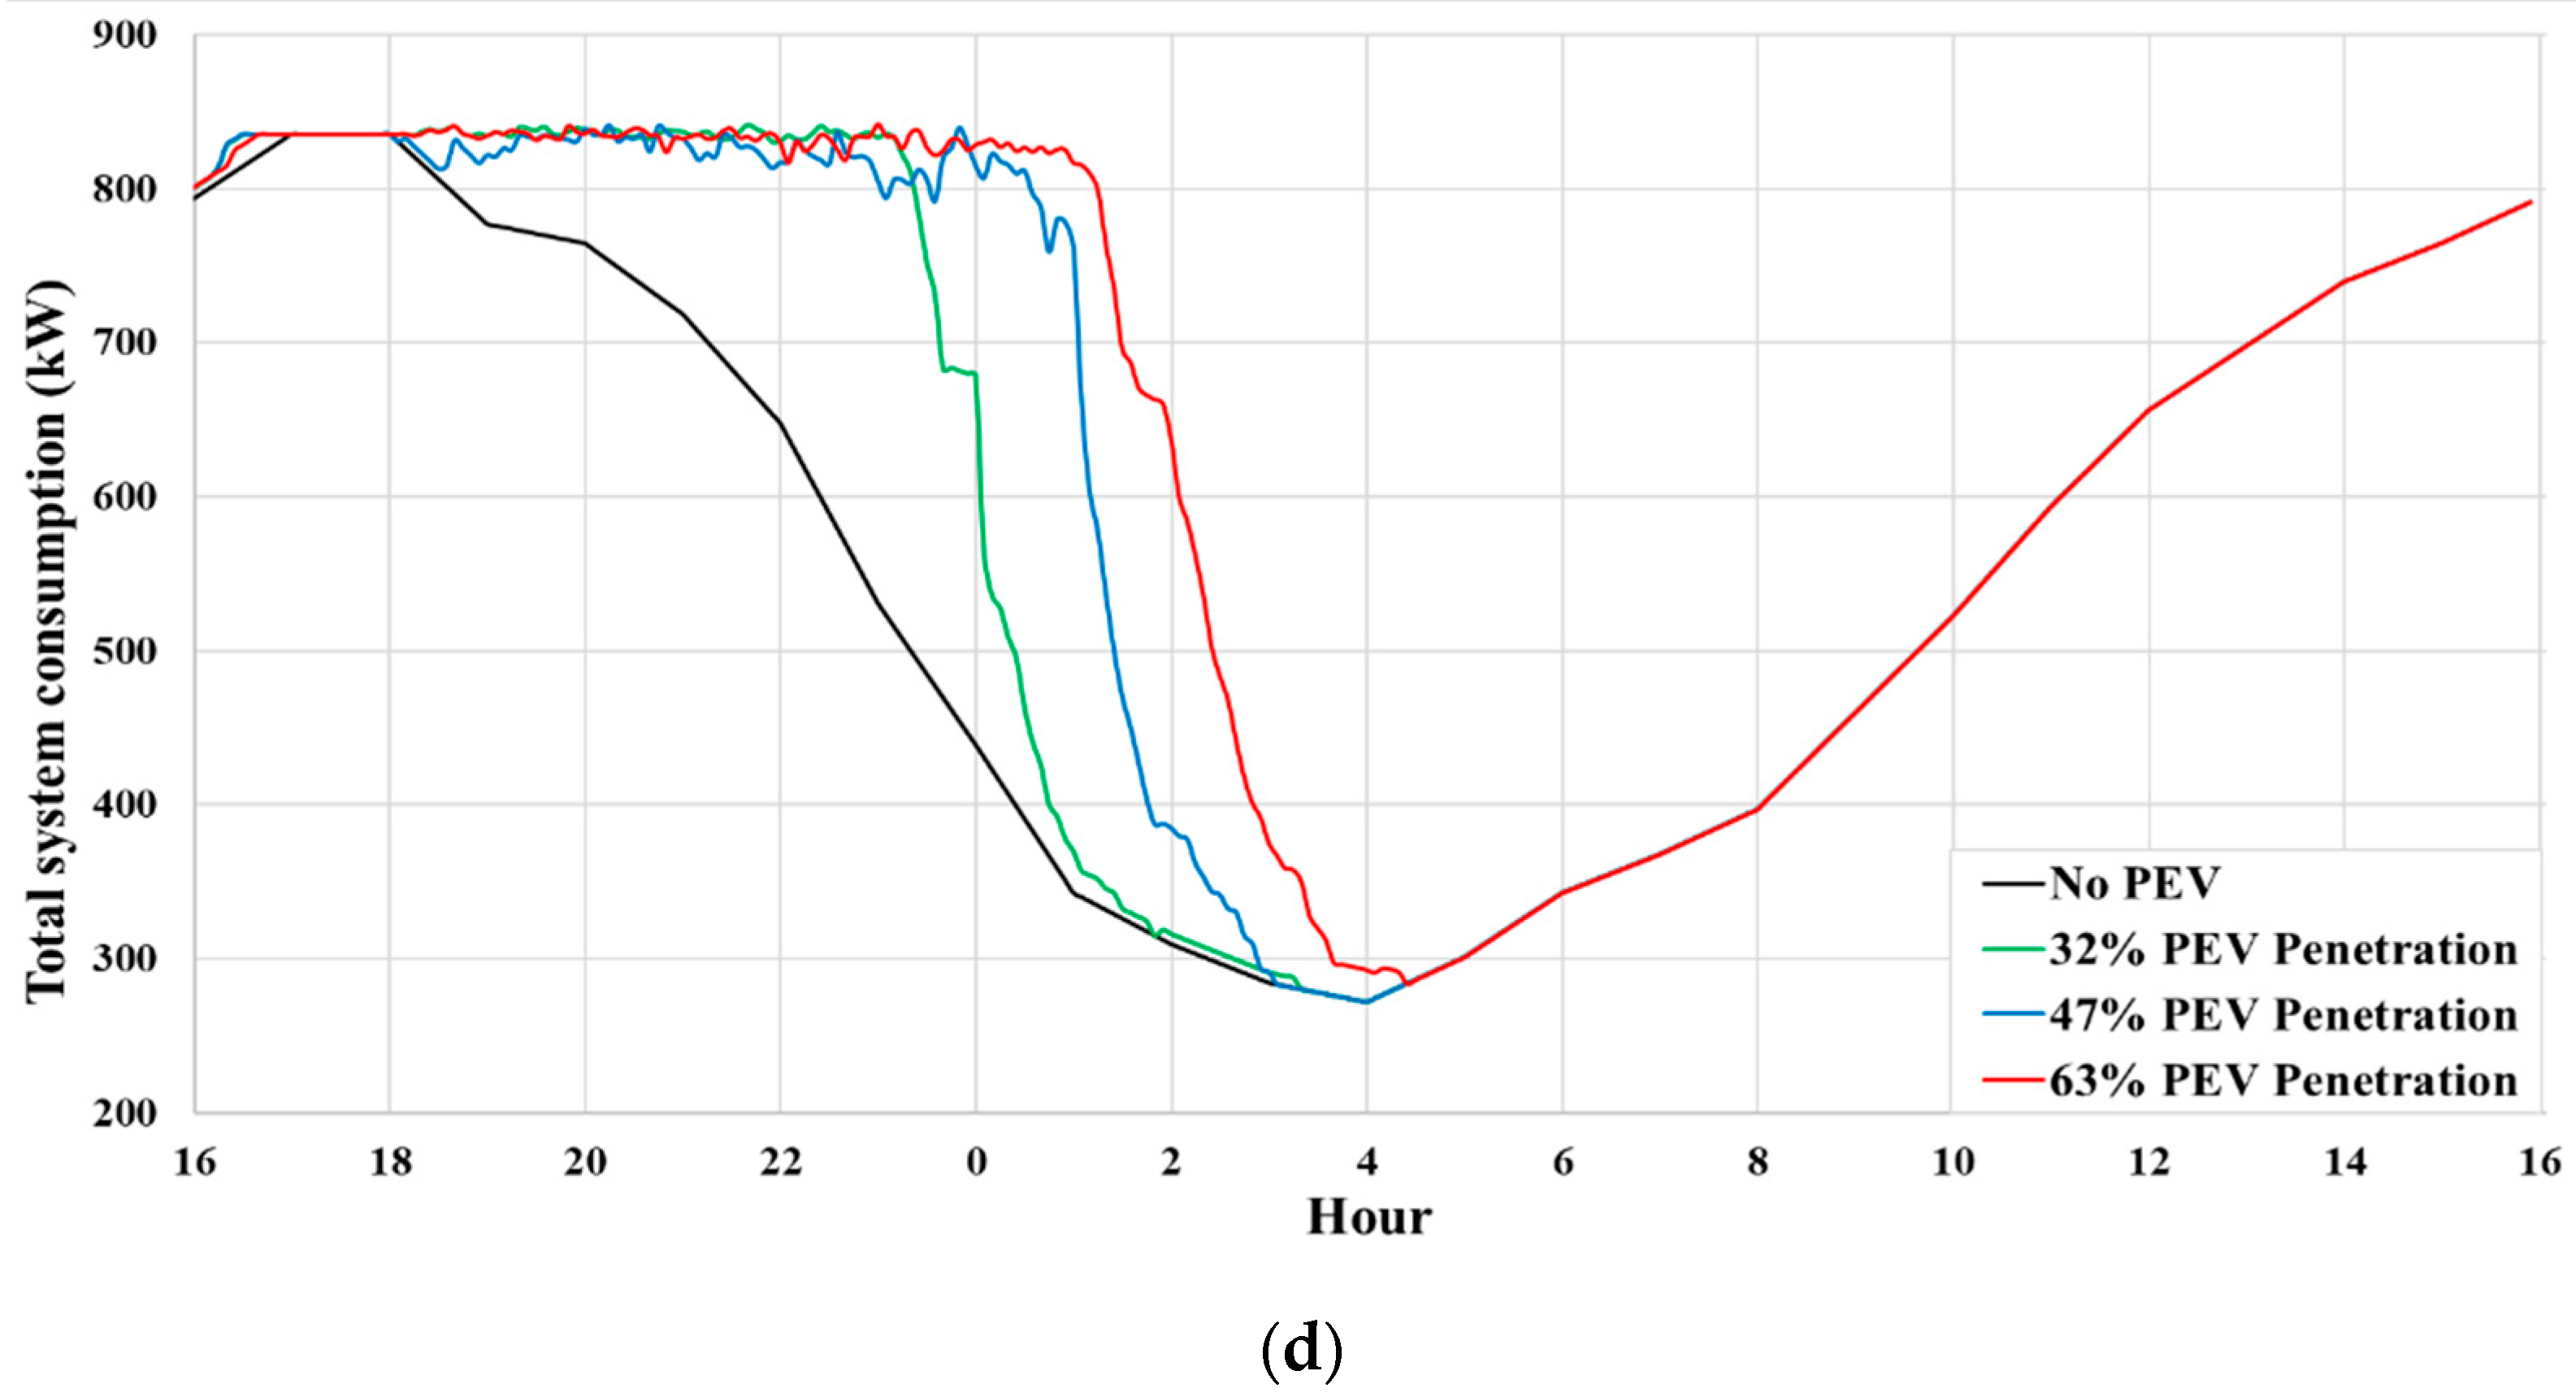
3.1. Objectives
3.2. Constraints
3.2.1. Maximum Capacity
3.2.2. Bus Voltage
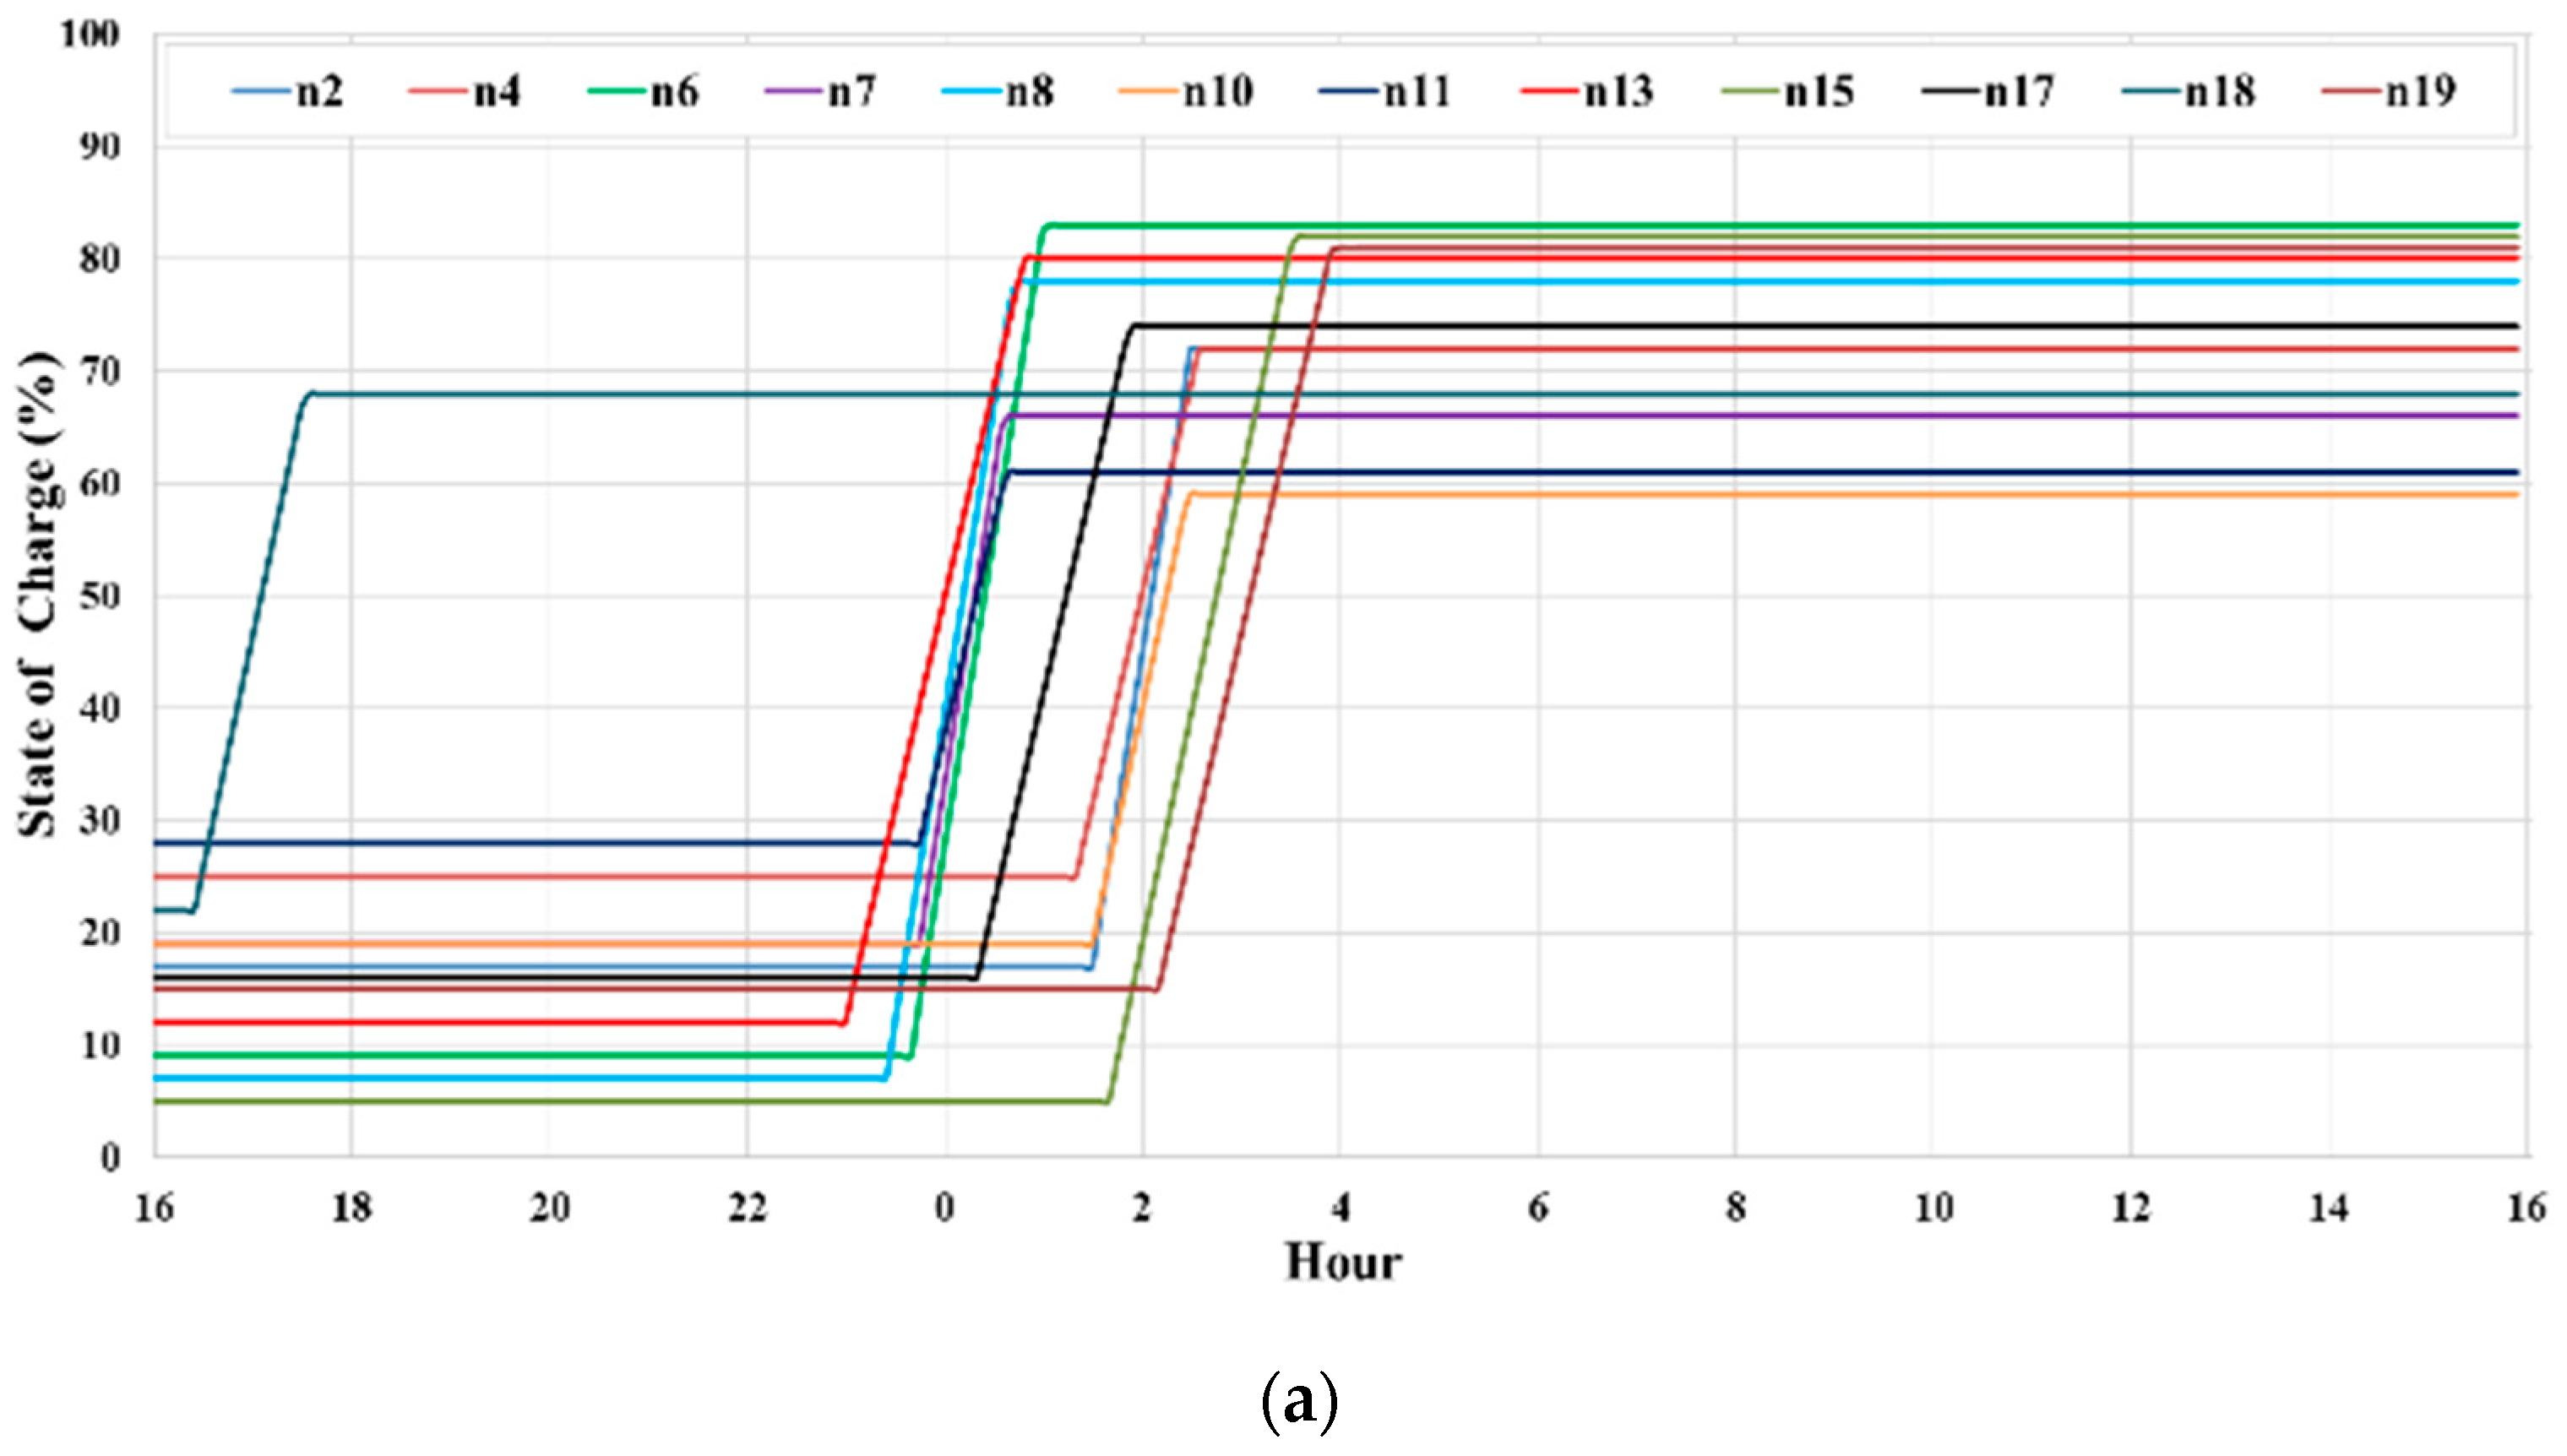
3.2.3. State of Charge (SOC)
3.2.4. Daily Switching of Capacitor
3.2.5. Daily Switching of OLTC
4. Proposed Method
4.1. Optimal PEV Charging Coordination
- All the input data were inserted in the program. This data were network data, bus data, line data, residential load data, and a set of PEV data. The PEV data consisted of the arrival time to the charging point with charger capacity, battery size, battery initial state of charge (SOC), and requested SOC by the users.
- In the optimization process, the initial population was determined by selecting the random PEV charger to be turned on. In this case, only the arrived PEVs at the charging point were considered. The population represented the status of PEV charger where digit “1” corresponds to a PEV being charged while digit “0” indicated the charging had not started or had already finished.
- Employing the initial population, a fitness function was calculated using Equation (1). In the fitness function, a backward–forward load flow method was executed to determine the power loss and voltage.
- The optimization procedure selected the best combination of PEV chargers, which provided the minimum power loss and voltage deviation. This iterative process was continued until the optimal result was obtained.
- Once the optimization process had converged or the maximum iteration number was reached, it updated each PEV switching status and prepared for the next timeslot.
- In each Δt timeslot, the algorithm took the input of a new arrival PEV to the charging point. The algorithm always checked the fully charged PEVs and eliminated them from the queue. Only the new arrival PEVs or left over PEVs to be charged were considered in the optimization process.
4.2. Optimal Capacitor and OLTC Operation
- All the input data were inserted in the program. The data were the size of the capacitor, their locations, bus data, and line data. The numbers of tap changer position with their respective voltages were taken as input as well. A residential load data was also considered over 24 h integrating the PEV load of the previous day from the historical data.
- The algorithm initialized the random population by selecting when the capacitor turned on and off. The population represented the status of capacitor operation where digit “1” corresponded to a capacitor being turned on while digit “0” indicated the capacitor was turned off. Moreover, the tap position of the OLTC was set to “0” as the initialization.
- The fitness function was calculated based on the initial population using Equation (1). Here, backward–forward load flow was employed to determine the total power loss and voltage at each bus.
- The tap changer operation took place simultaneously with the capacitor switching. The optimum tap changer position was determined based on the fitness function. For instance, 1.0499 p.u. was adjusted to 1.05 p.u.
- The optimization continued the iterative process until it converged or reached the maximum iteration number.
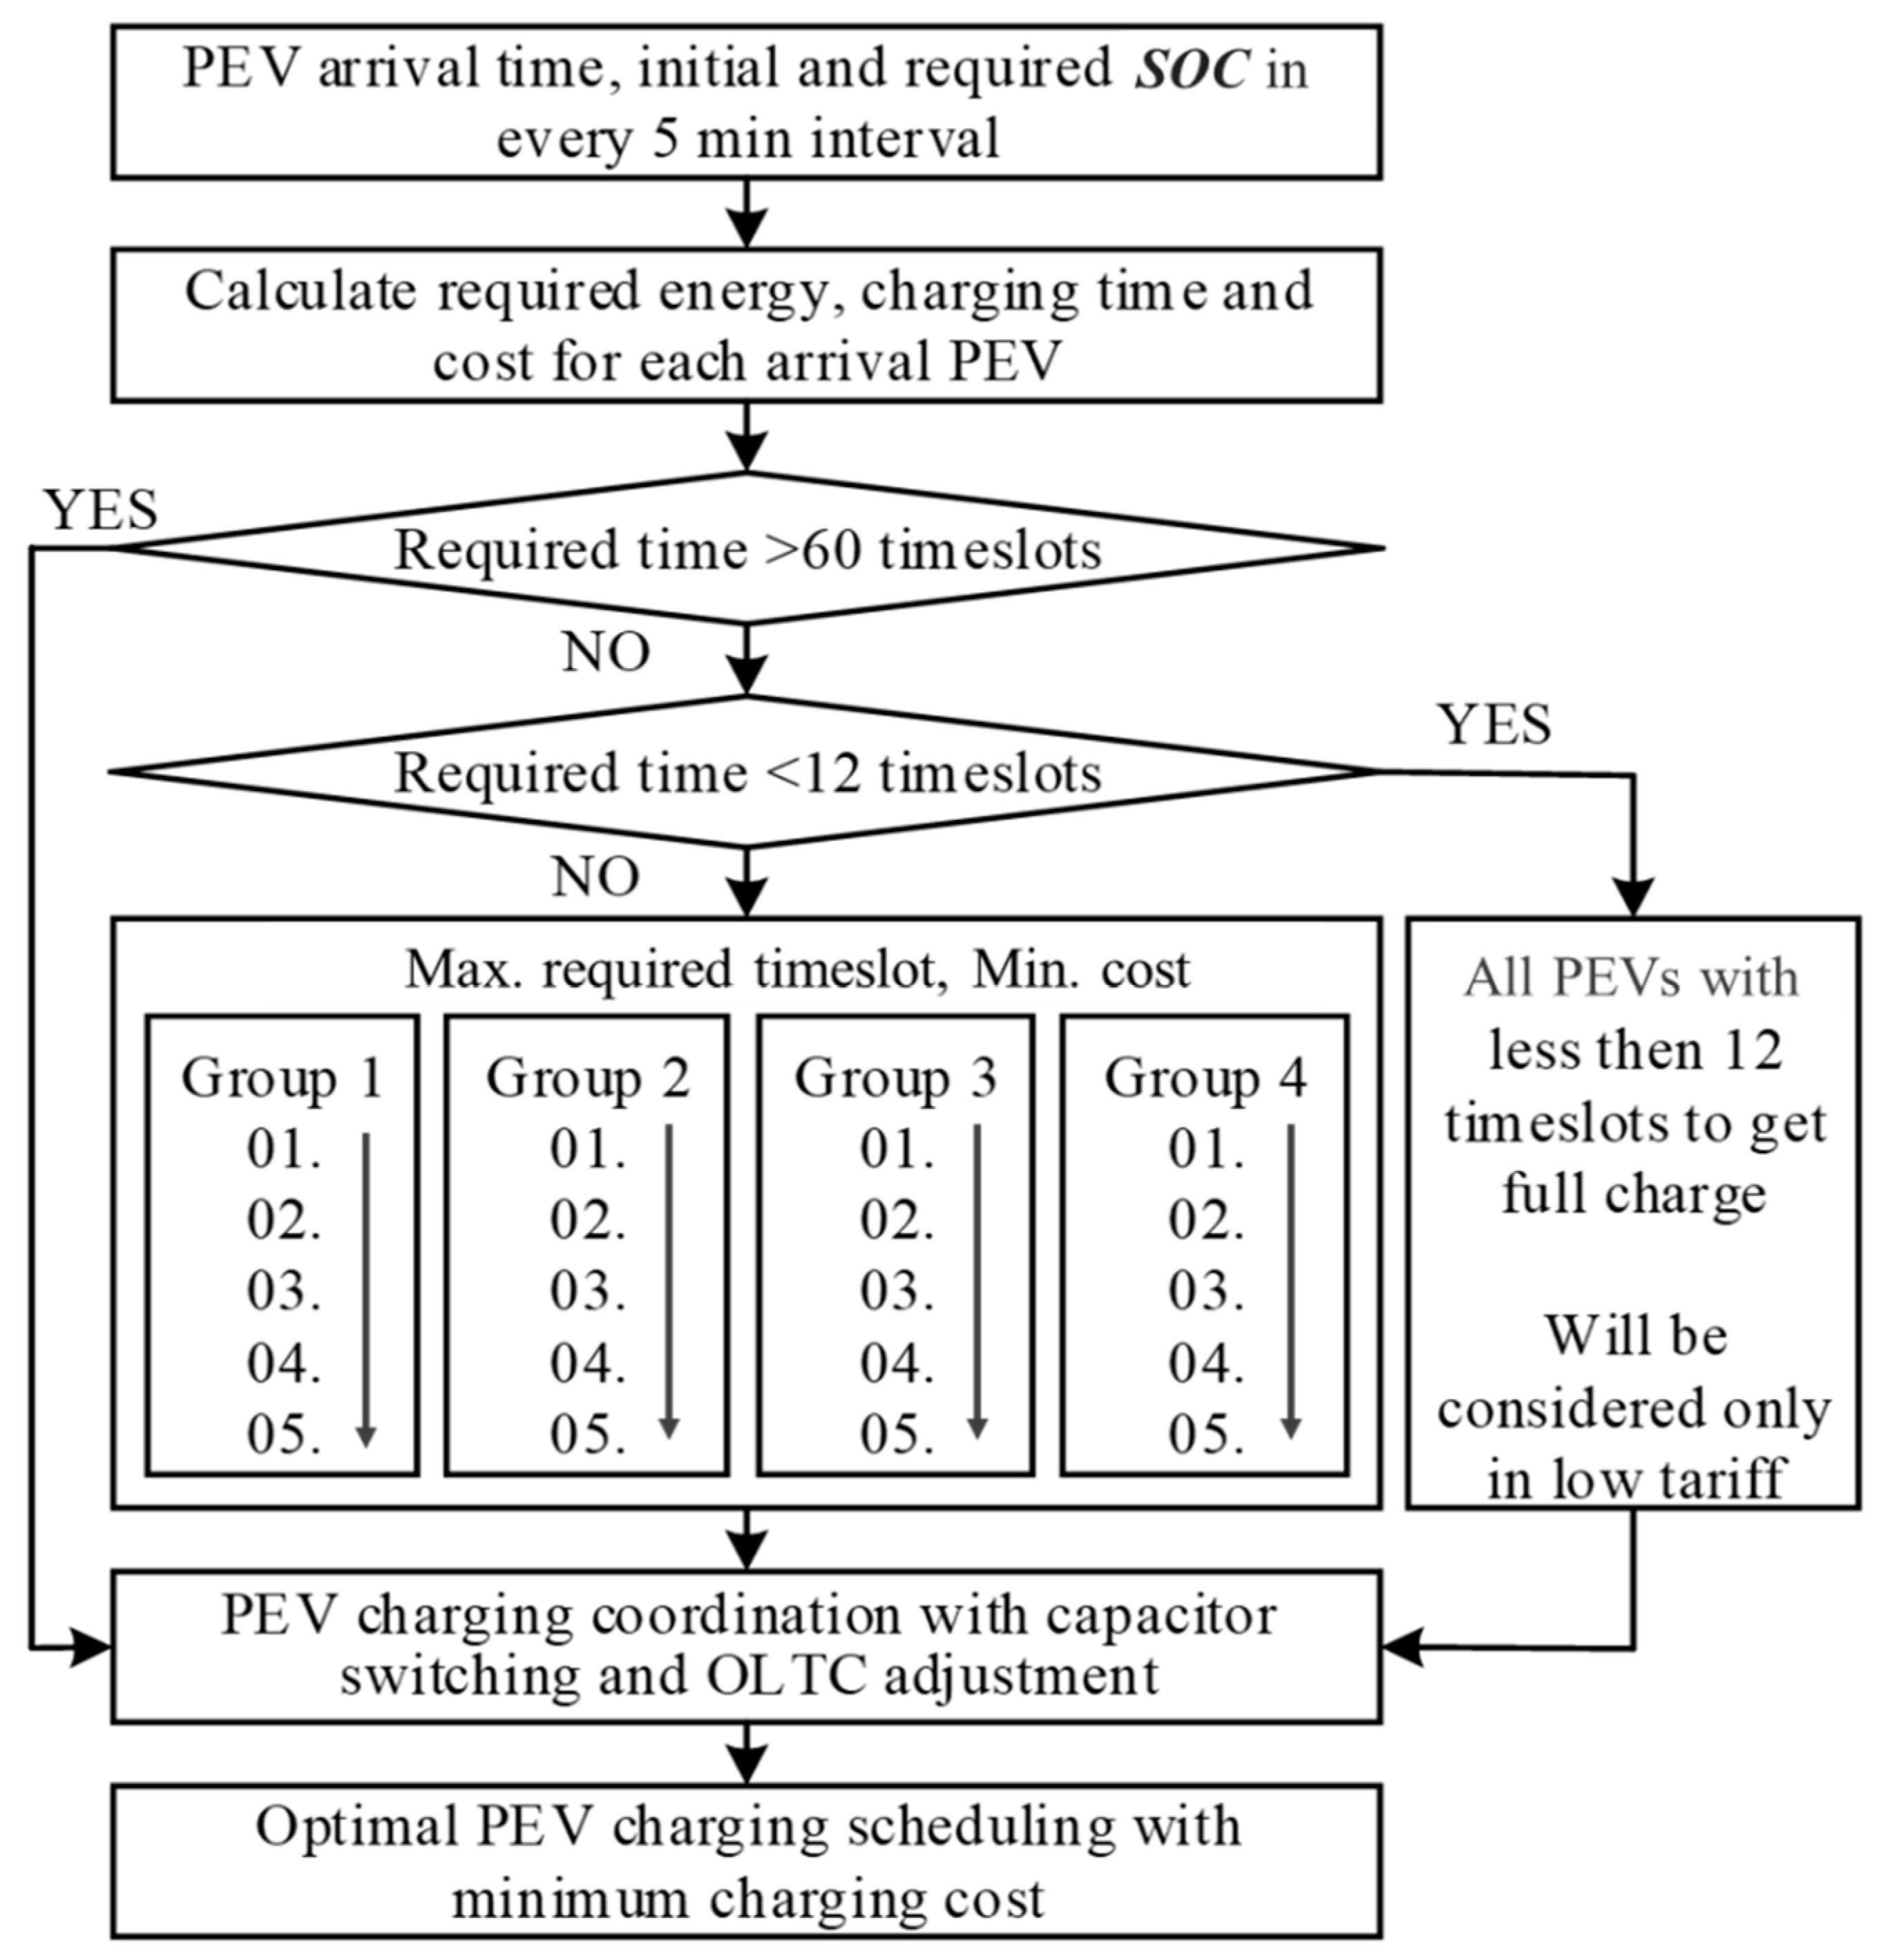
4.3. Cost Minimization Including ToU Electricity Tariff
- All the input data were inserted in the program. The data were PEV charger capacity, battery current and required state of charge, and electricity tariff at each time slot.
- The required energy and timeslot to reach the required SOC of the arrived PEV in the charge points were calculated. Then, a queue table of the PEV base was developed for the time required to get the required state of charge.
- The queue table was categorized into three sub-sections: which PEV need (i) more than 60 timeslots, (ii) less than 12 timeslots, and (iii) timeslots in between 12 and 60.
- PEVs that needed more than 60 timeslots were considered in the optimization process immediately when arriving at the charging point.
- Then, the PEVs that needed less than 12 timeslots were postponed; they were considered in the optimization process when the tariff was lowest.
- During the moderate rate of electricity tariff, only those PEVs that needed 12 to 60 timeslots were considered for charging.
5. Algorithms and Implementation
5.1. Binary Particle Swarm Optimization (BPSO)
5.2. Binary Grey Wolves Optimization (BGWO)
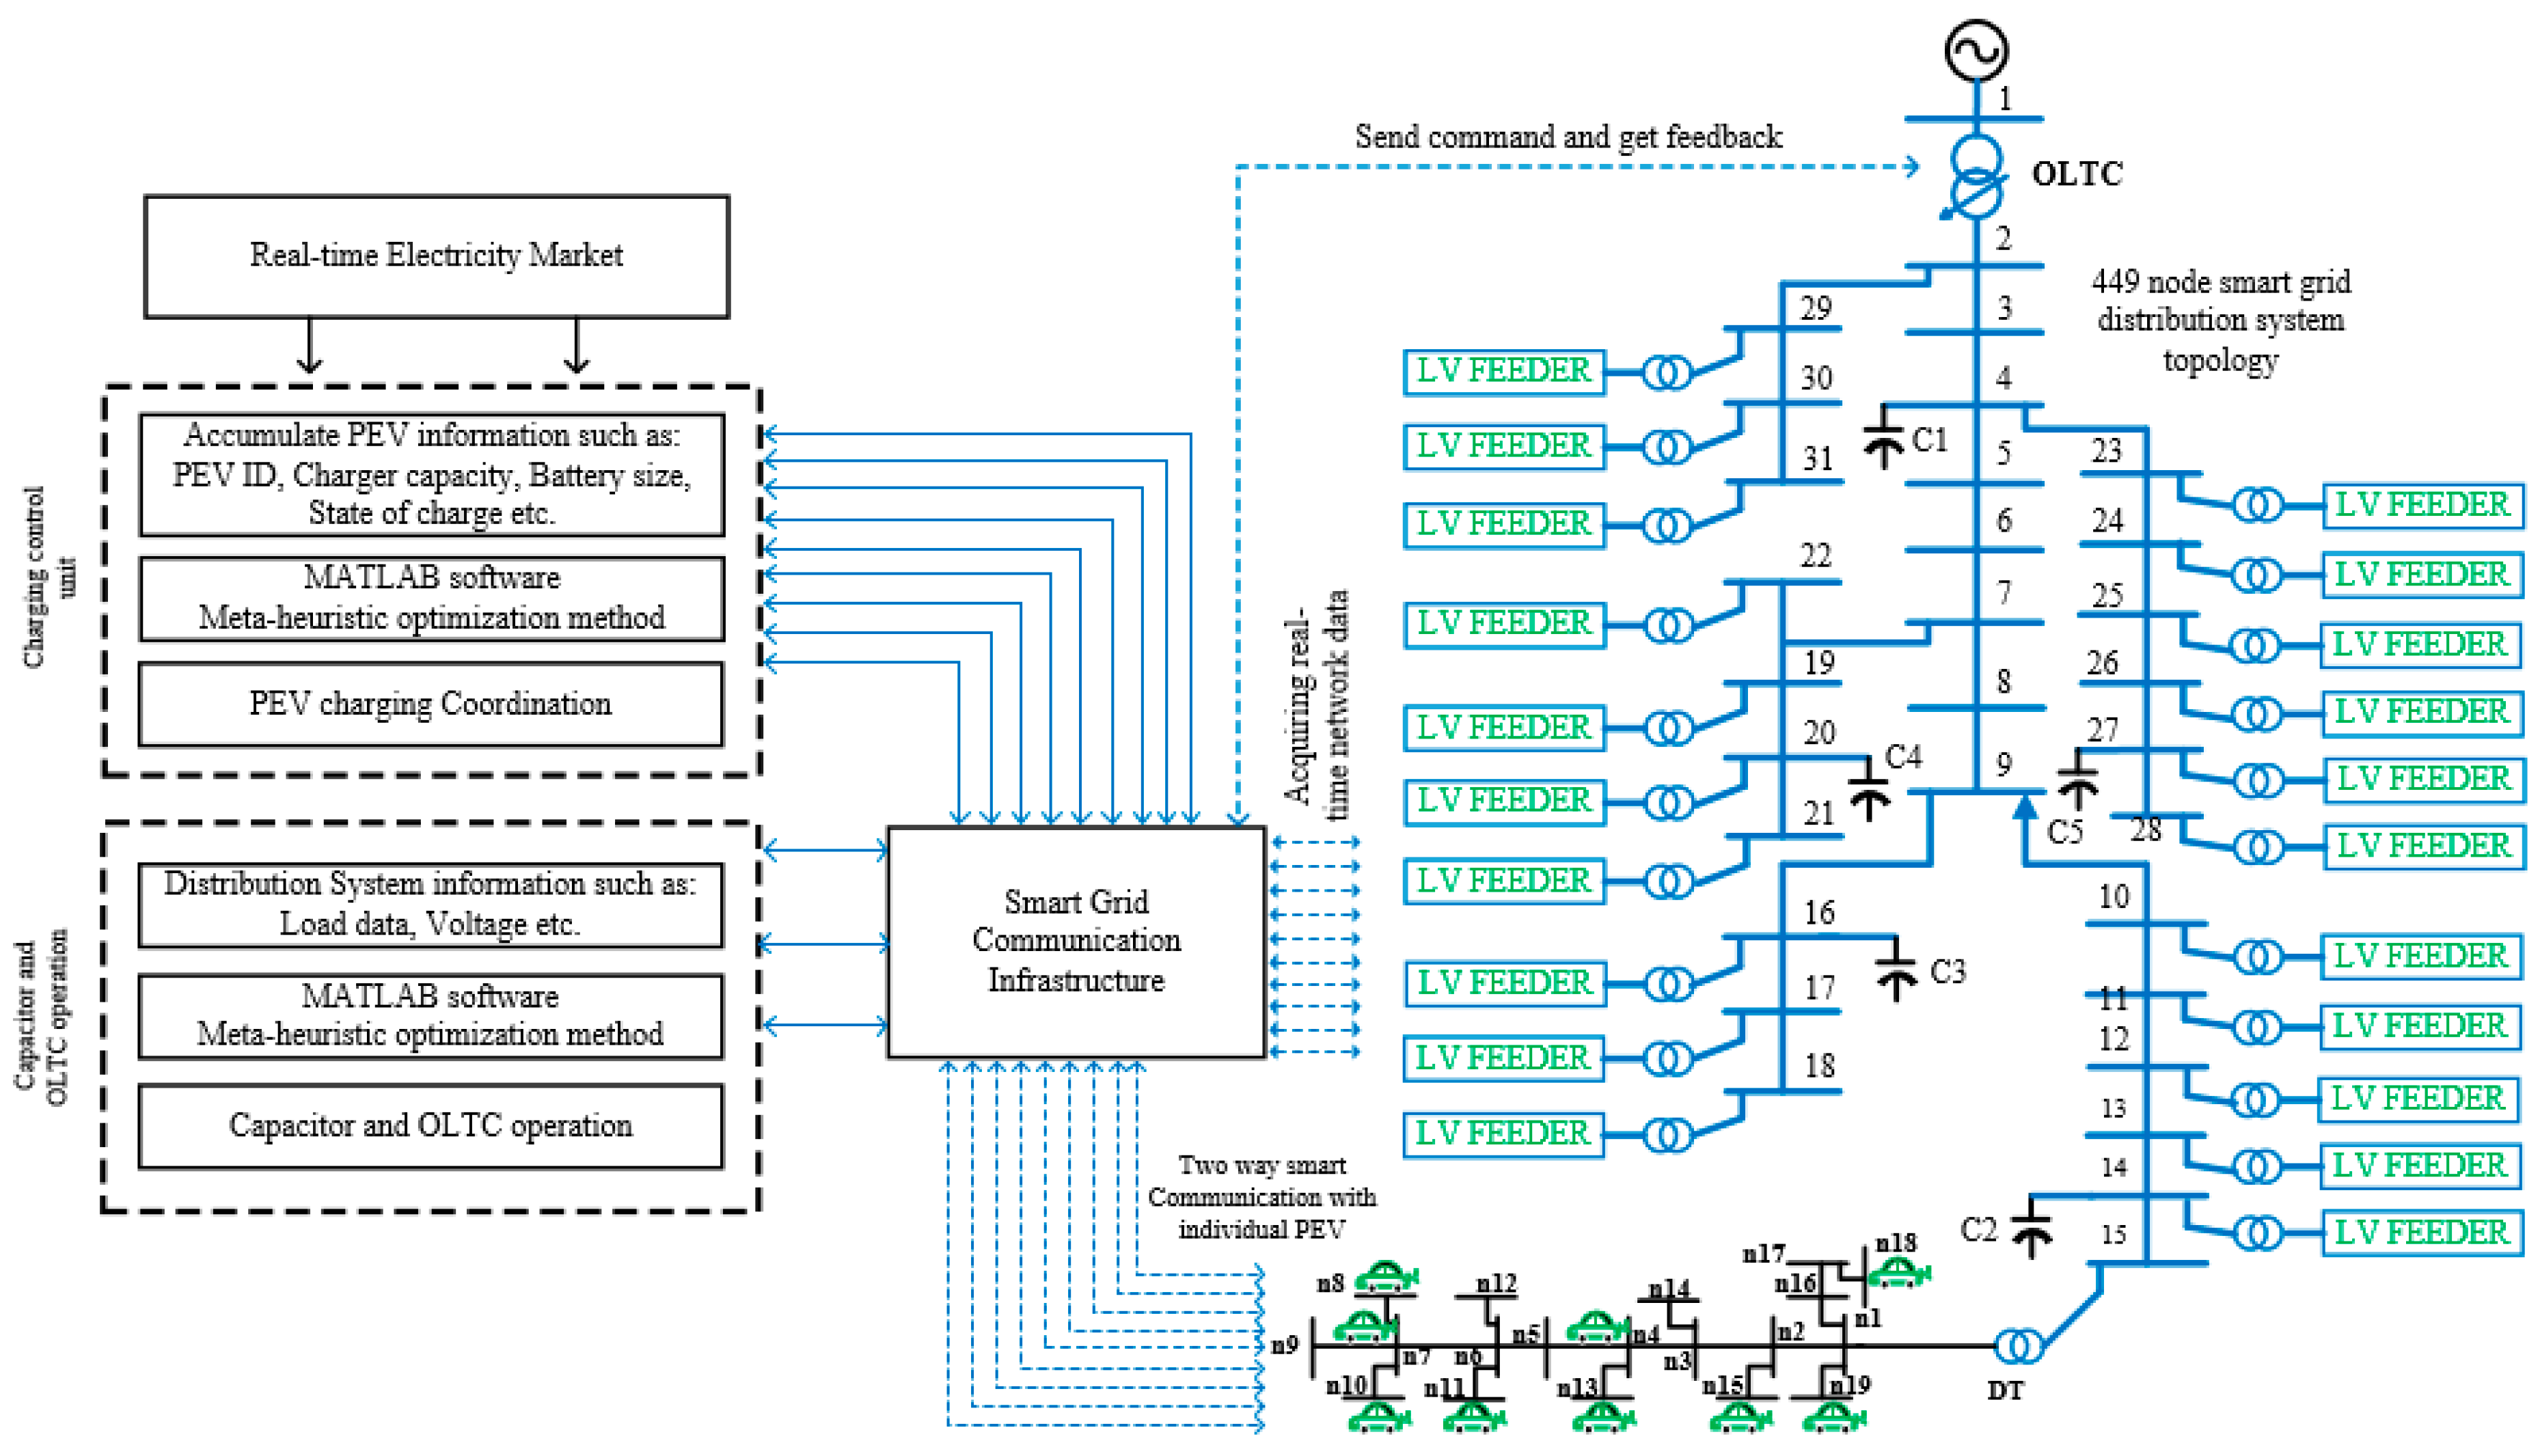
6. System Modelling
6.1. Test System
6.2. Capacitor
6.3. Online Tap Changer
6.4. PEV Charger and Battery
- Level 1: Generally, an electric outlet in a residential house is 115 VAC, 15 A or 230 VAC, 6A single-phase. This connection can deliver around 1.5 kW, and the charge time varies between 7 and 30 h based on battery size.
- Level 2: A mid-sized PEV can be charged in 4–5 h through a 230 VAC, 30 A with two poles. This type of chargers is mostly used at home and public charging stations. It delivers 7 kW to feed the 6.6 kW onboard PEV charger.
- Level 3: The ultra-fast PEV charging utilizes 400–600 VDC, up to a 300 A connection. The onboard charger is bypassed and feeds the power directly to the battery. It produces up to 120 kW to charge a Li-ion battery to 80% in about 30 minutes.
6.5. Smart Grid Communication Infrastructure
6.6. Time-of-Use Electricity Tariff
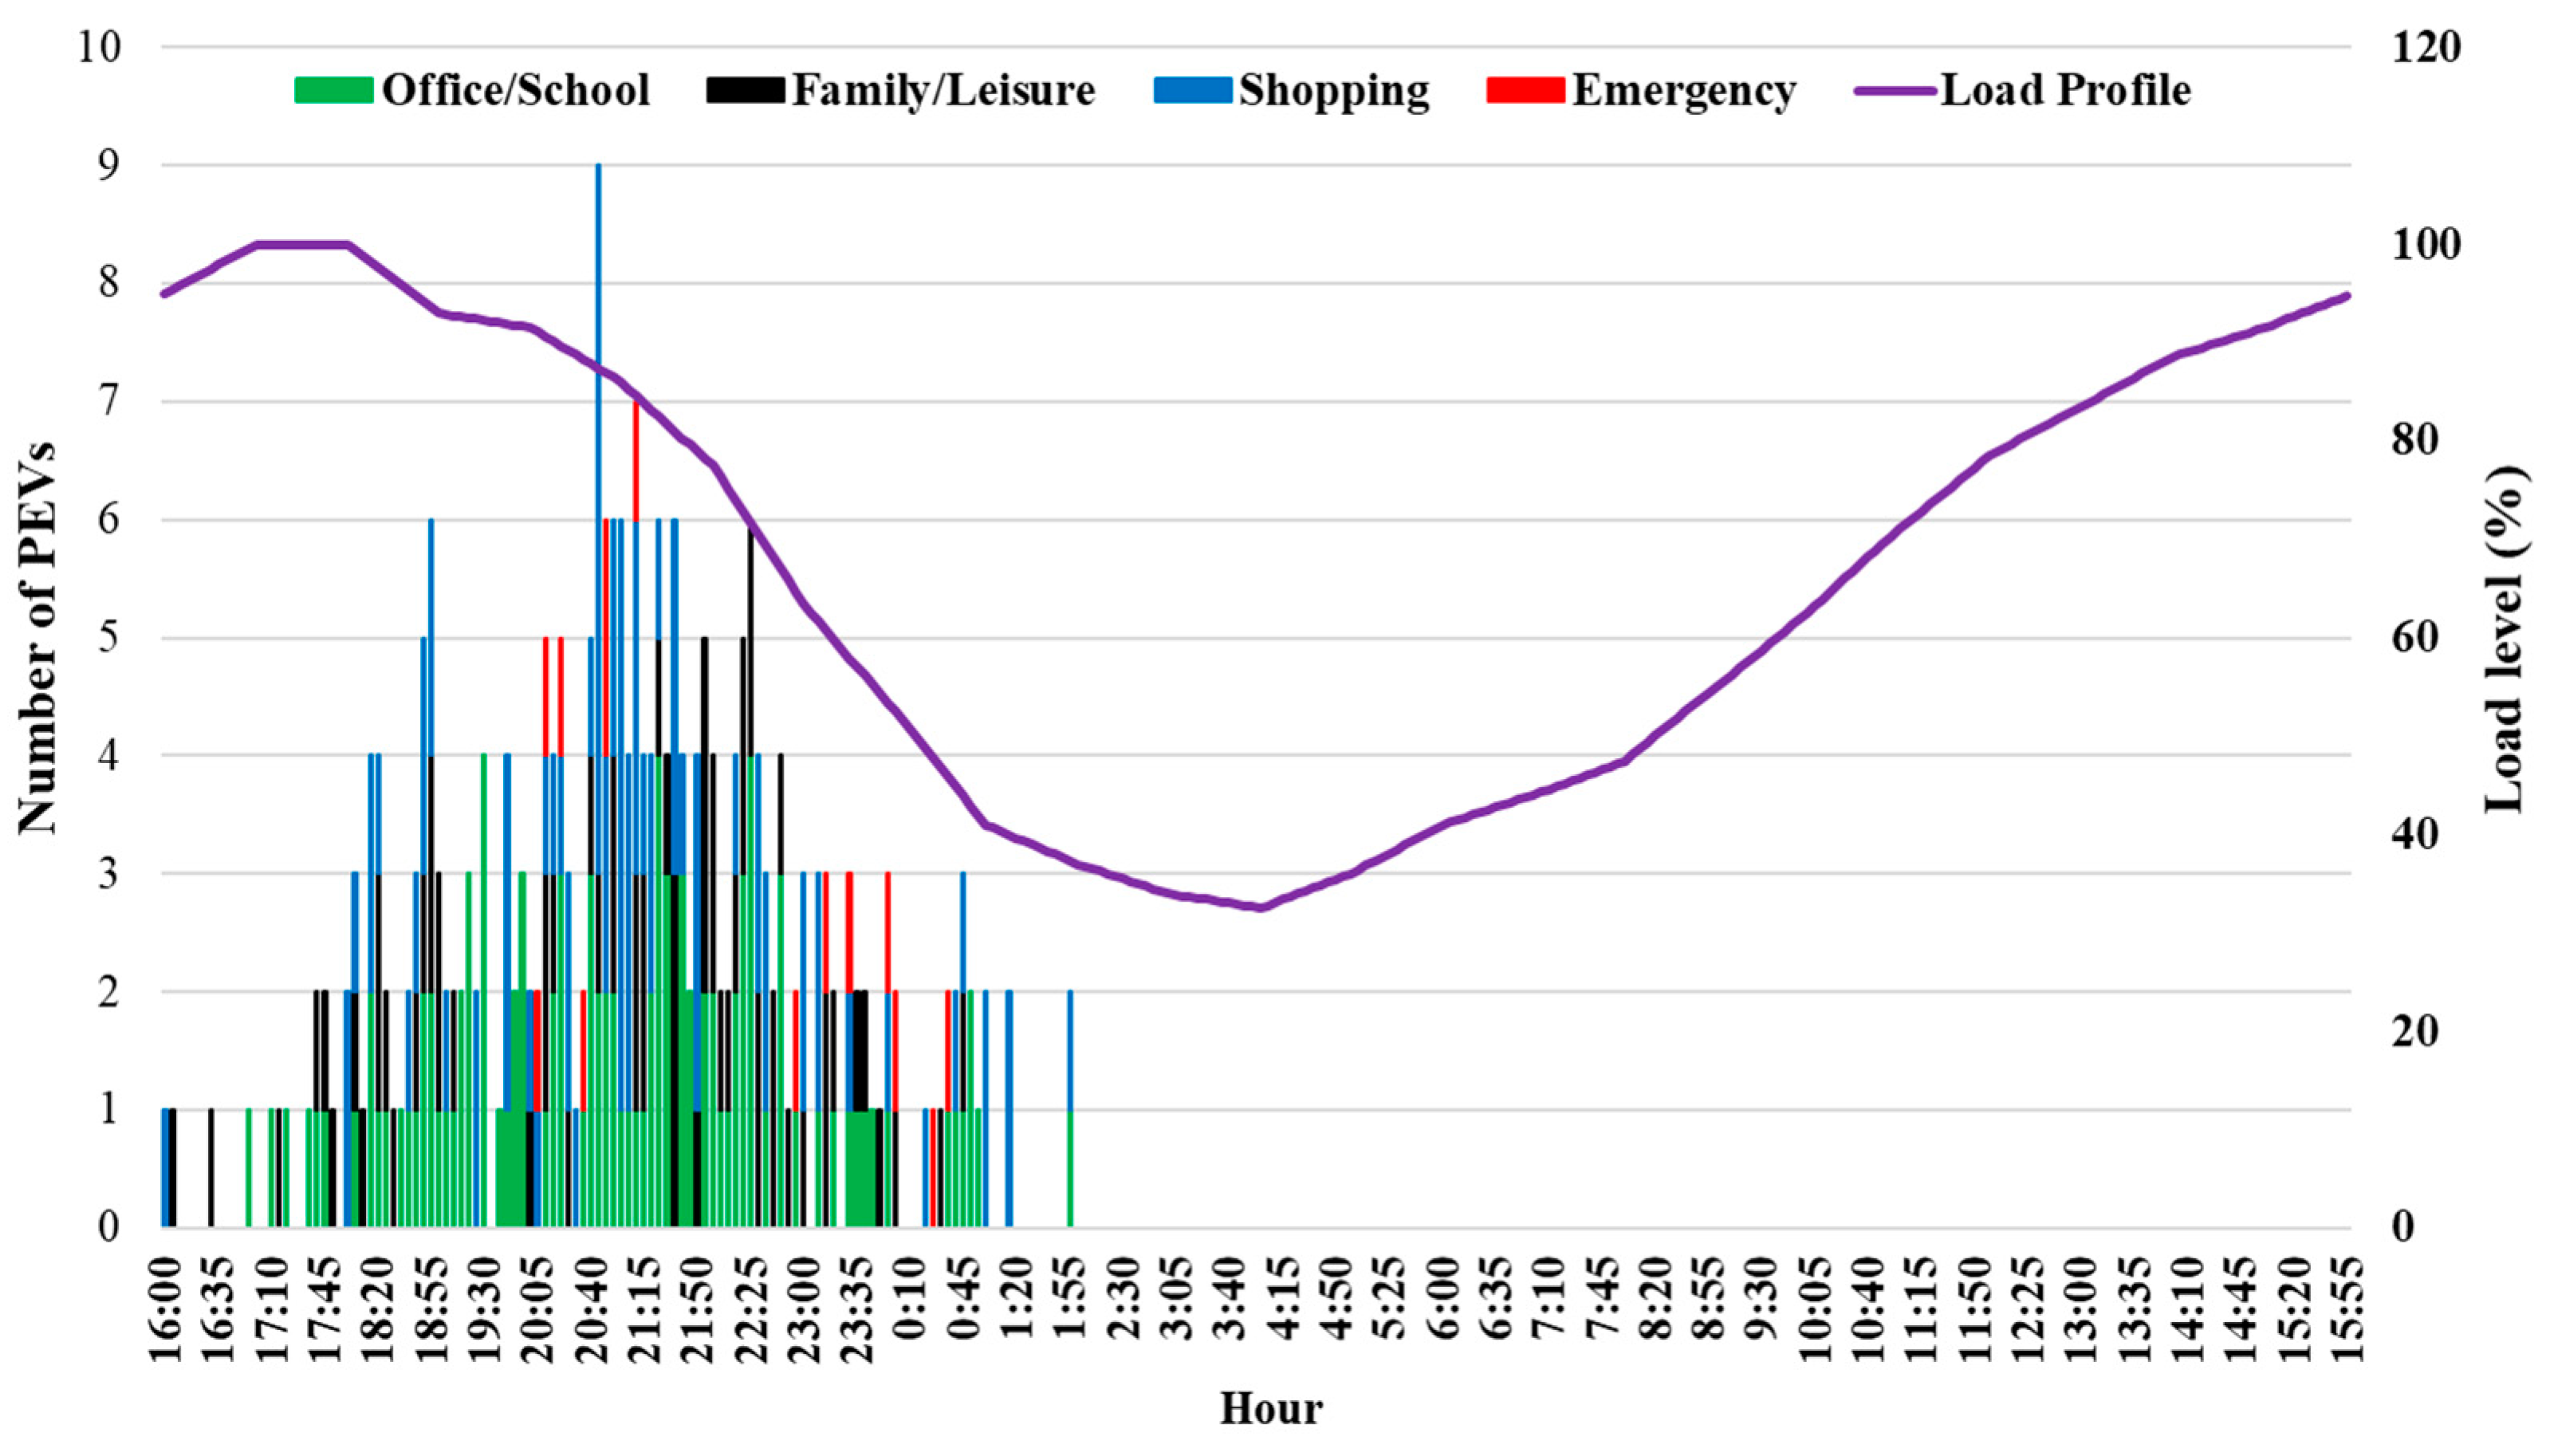
6.7. Electric Vehicle Driving Pattern
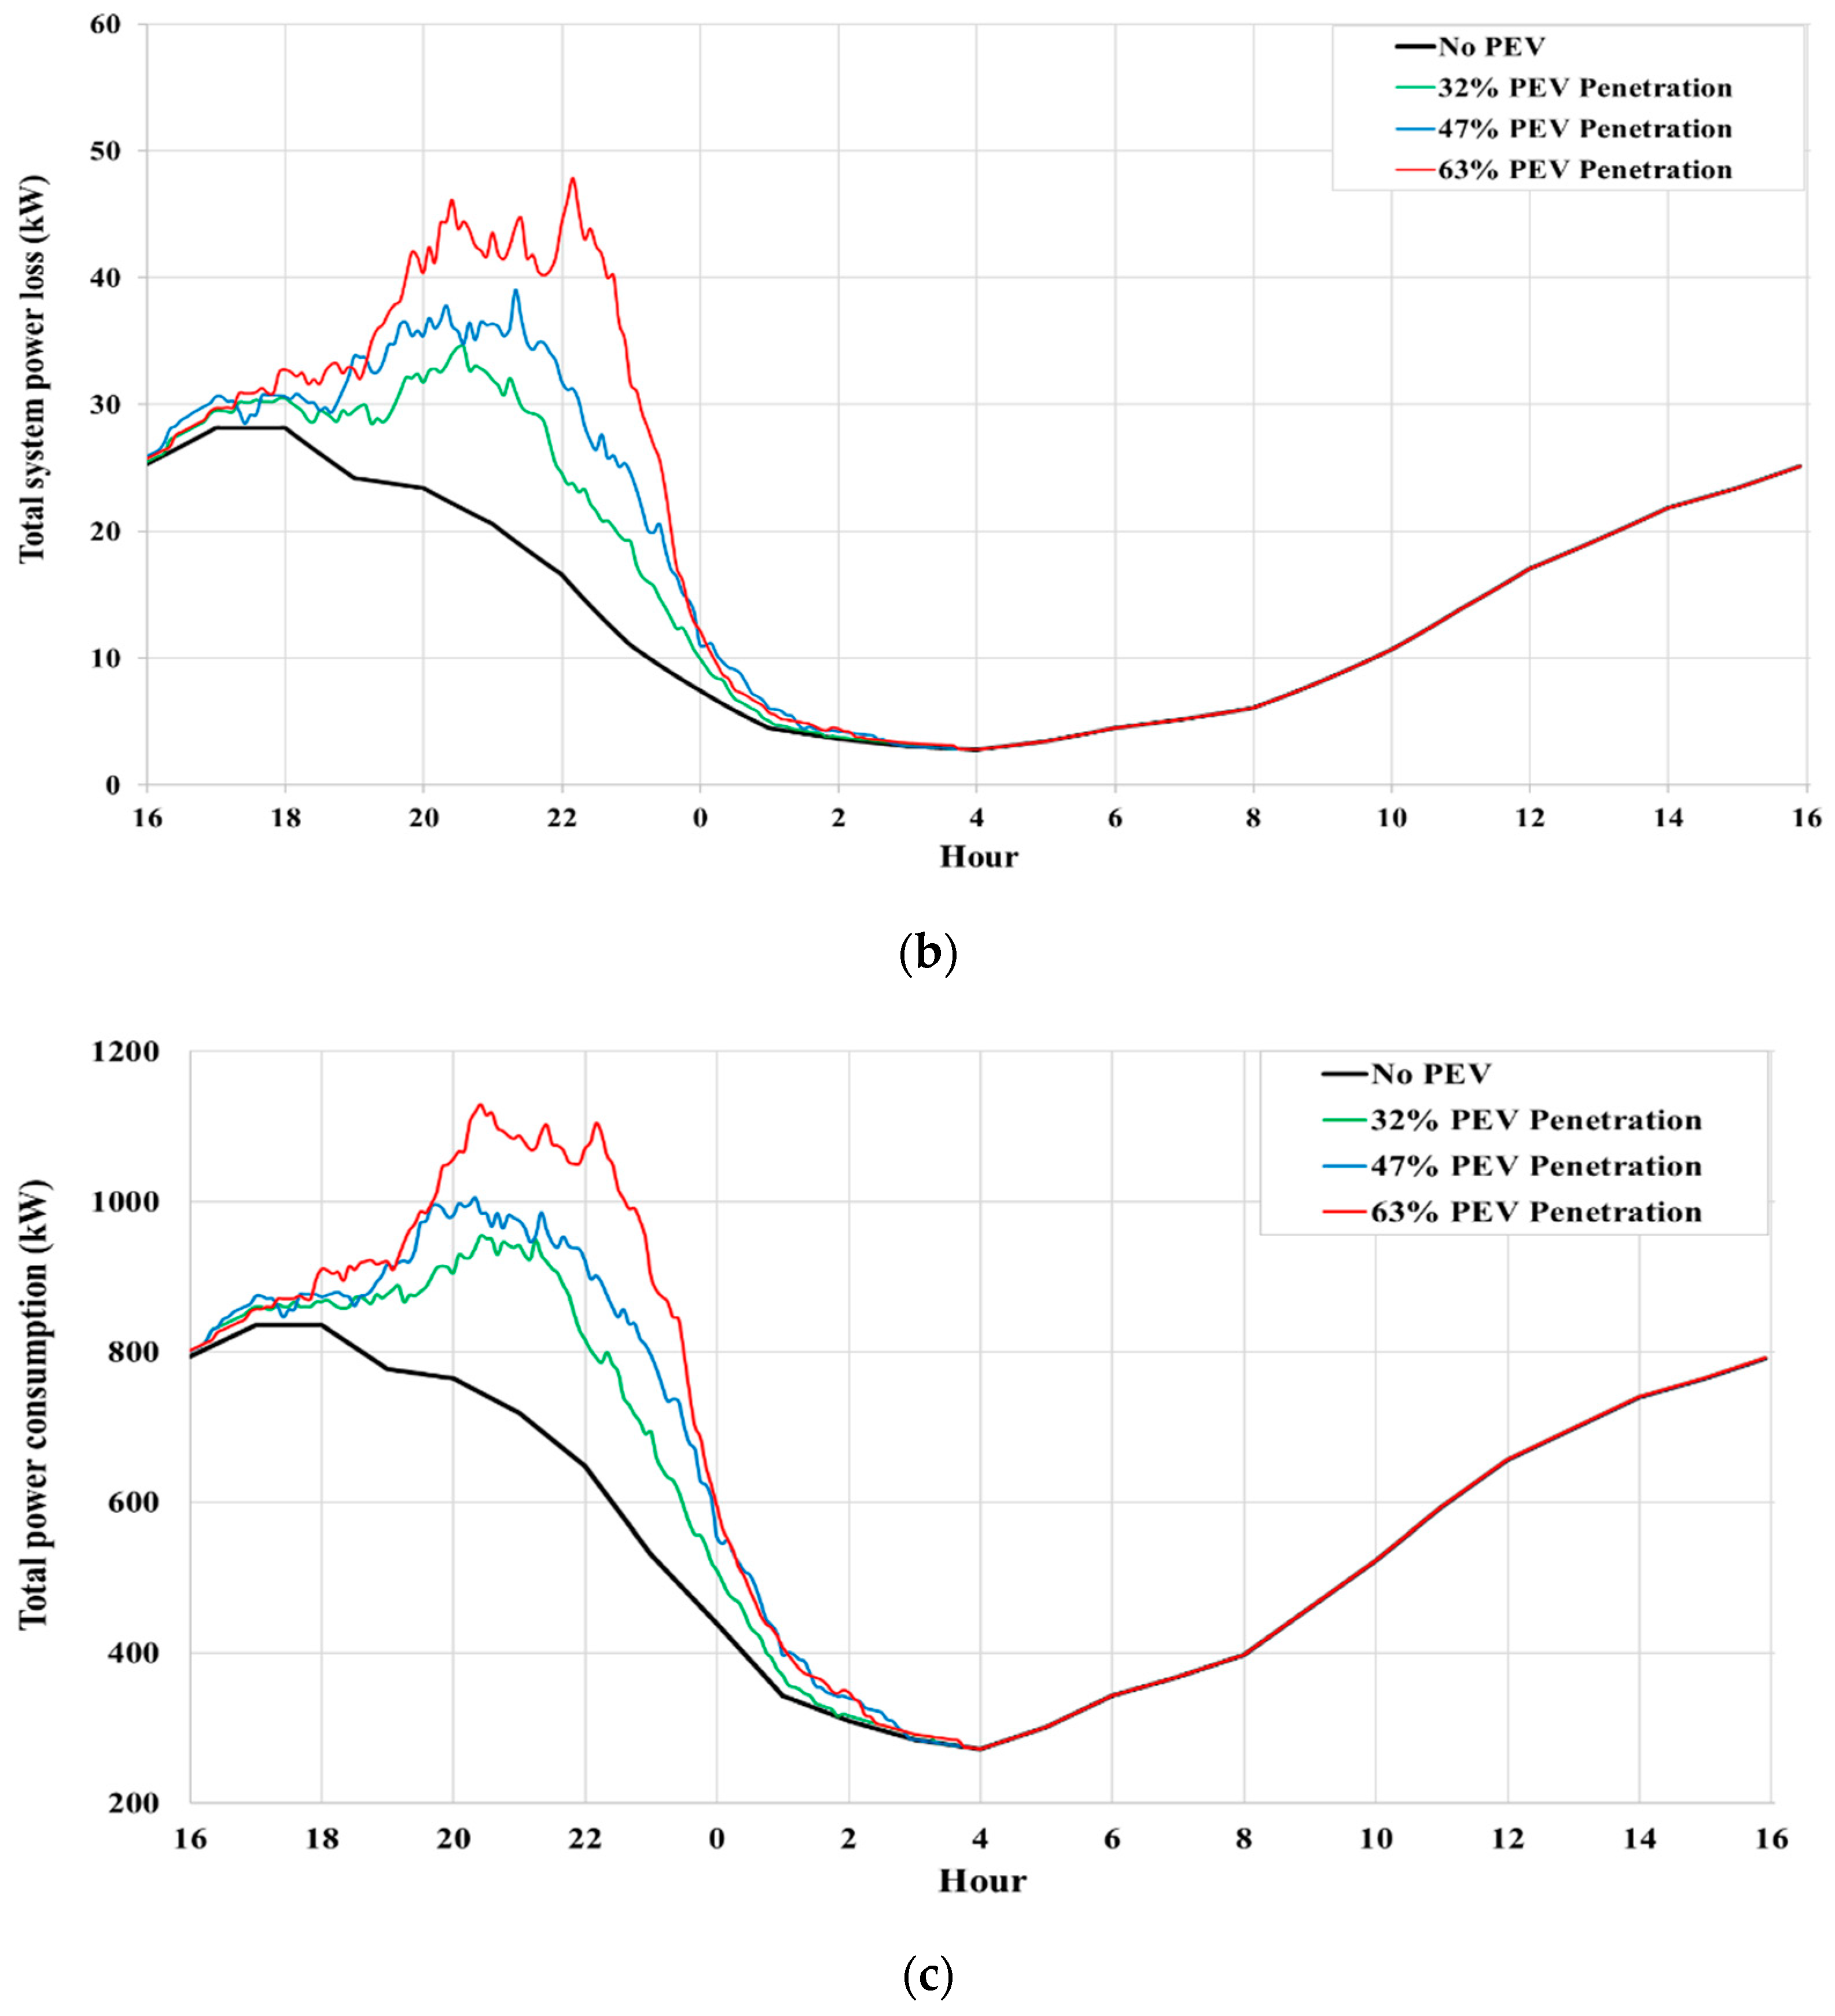
7. Analysis and Discussion
7.1. Further Improvements in System Performances
7.2. Impacts on Economic
8. Conclusions
Author Contributions
Funding
Conflicts of Interest
Nomenclature
| PEV | Plug-in electric vehicle |
| SOC | State of charge in percentage |
| OLTC | On-load tap changer |
| ToU | Time-of-use electricity tariff in AU$ (Australian dollar) |
| CHG | Charger capacity in kW |
| I | Brunch current flow in A |
| R | Brunch resistance in Ω |
| RE | Required energy to get desired SOC in kWh |
| Tr | Total required timeslot to get desired SOC in hour |
| Tc | Current timeslot when the PEV arrived to get charge |
| Pload | Residential load in kW |
| PPEV | Load created by PEV |
| Vrated | Node voltage at nominal condition in per unit |
| Vi | Actual voltage at node in per unit |
| Cs,h | Capacitor switching status |
| Csm | Maximum allowable number of capacitors switching in a day |
| Taph | OLTC tap position |
| Tapmax | Maximum allowable switching operation of OLTC |
| Vd | Voltage deviation in per unit |
| Ratio of total power loss of after and before PEV coordination is made | |
| Power loss when the PEV coordination is made in per unit | |
| Power loss during the uncoordinated PEV charging activities in per unit | |
| Maximum power demand of the distribution system in kW |
References
- García-Villalobos, J.; Zamora, I.; San Martín, J.; Asensio, F.; Aperribay, V. Plug-in electric vehicles in electric distribution networks: A review of smart charging approaches. Renew. Sustain. Energy Rev. 2014, 38, 717–731. [Google Scholar] [CrossRef]
- Alonso, M.; Amaris, H.; Germain, J.; Galan, J. Optimal charging scheduling of electric vehicles in smart grids by heuristic algorithms. Energies 2014, 7, 2449–2475. [Google Scholar] [CrossRef]
- Clement-Nyns, K.; Van Reusel, K.; Driesen, J. The consumption of electrical energy of plug-in hybrid electric vehicles in Belgium. In Proceedings of the EET-European Ele-Drive Transportation Conference, Brussels, Belgium, 30 May–2 June 2007; p. 10. [Google Scholar]
- Bansal, R.C. Electric vehicles. Electr. Comput. Eng. 2005, 125, 55. [Google Scholar]
- Raskin, A.; Shah, S. The Emerge of Hybrid Electric Vehicles; Alliance Bernstein: New York, NY, USA, 2006. [Google Scholar]
- Clement-Nyns, K.; Haesen, E.; Driesen, J. The impact of charging plug-in hybrid electric vehicles on a residential distribution grid. IEEE Trans. Power Syst. 2010, 25, 371–380. [Google Scholar] [CrossRef]
- Rahman, M.T.; Rahim, N.B.A.; Othman, M.; Mokhlis, H. Plug-in Electric Vehicle Charging Coordination Considering Distribution Protection System. In Proceedings of the 2018 IEEE PES Asia-Pacific Power and Energy Engineering Conference (APPEEC), Kota Kinabalu, Malaysia, 7–10 October 2018; pp. 51–55. [Google Scholar]
- Deb, S.; Tammi, K.; Kalita, K.; Mahanta, P. Impact of electric vehicle charging station load on distribution network. Energies 2018, 11, 178. [Google Scholar] [CrossRef]
- Sheikhi, A.; Bahrami, S.; Ranjbar, A.; Oraee, H. Strategic charging method for plugged in hybrid electric vehicles in smart grids; a game theoretic approach. Int. J. Electr. Power Energy Syst. 2013, 53, 499–506. [Google Scholar] [CrossRef]
- Zhang, K.; Xu, L.; Ouyang, M.; Wang, H.; Lu, L.; Li, J.; Li, Z. Optimal decentralized valley-filling charging strategy for electric vehicles. Energy Convers. Manag. 2014, 78, 537–550. [Google Scholar] [CrossRef]
- Ma, Z.; Zou, S.; Ran, L.; Shi, X.; Hiskens, I.A. Efficient decentralized coordination of large-scale plug-in electric vehicle charging. Automatica 2016, 69, 35–47. [Google Scholar] [CrossRef]
- Dallinger, D.; Wietschel, M. Grid integration of intermittent renewable energy sources using price-responsive plug-in electric vehicles. Renew. Sustain. Energy Rev. 2012, 16, 3370–3382. [Google Scholar] [CrossRef]
- Valentine, K.; Temple, W.G.; Zhang, K.M. Intelligent electric vehicle charging: Rethinking the valley-fill. J. Power Sour. 2011, 196, 10717–10726. [Google Scholar] [CrossRef]
- Vayá, M.G.; Andersson, G. Centralized and decentralized approaches to smart charging of plug-in vehicles. In Proceedings of the 2012 IEEE Power and Energy Society General Meeting, San Diego, CA, USA, 22–26 July 2012; pp. 1–8. [Google Scholar]
- Zakariazadeh, A.; Jadid, S.; Siano, P. Multi-objective scheduling of electric vehicles in smart distribution system. Energy Convers. Manag. 2014, 79, 43–53. [Google Scholar] [CrossRef]
- Oliveira, D.; de Souza, A.Z.; Delboni, L. Optimal plug-in hybrid electric vehicles recharge in distribution power systems. Electr. Power Syst. Res. 2013, 98, 77–85. [Google Scholar] [CrossRef]
- Deilami, S.; Masoum, A.S.; Moses, P.S.; Masoum, M.A. Real-time coordination of plug-in electric vehicle charging in smart grids to minimize power losses and improve voltage profile. IEEE Trans. Smart Grid 2011, 2, 456–467. [Google Scholar] [CrossRef]
- Hu, Z.; Wang, X.; Chen, H.; Taylor, G. Volt/VAr control in distribution systems using a time-interval based approach. IEE Proc.Gener. Transm. Distrib. 2003, 150, 548–554. [Google Scholar] [CrossRef]
- Liang, R.-H.; Cheng, C.-K. Dispatch of main transformer ULTC and capacitors in a distribution system. IEEE Trans. Power Deliv. 2001, 16, 625–630. [Google Scholar] [CrossRef]
- Azimi, R.; Esmaeili, S. Multiobjective daily Volt/VAr control in distribution systems with distributed generation using binary ant colony optimization. Turk. J. Electr. Eng. Comput. Sci. 2013, 21, 613–629. [Google Scholar]
- Kennedy, J.; Eberhart, R.C. A discrete binary version of the particle swarm algorithm. In Proceedings of the 1997 IEEE International Conference on Systems, Man, and Cybernetics, Computational Cybernetics and Simulation, Orlando, FL, USA, 12–15 October 1997; pp. 4104–4108. [Google Scholar]
- Shi, Y.; Eberhart, R.C. Empirical study of particle swarm optimization. In Proceedings of the 1999 Congress on Evolutionary Computation-CEC99, Washington, DC, USA, 6–9 July 1999; pp. 1945–1950. [Google Scholar]
- Emary, E.; Zawbaa, H.M.; Hassanien, A.E. Binary grey wolf optimization approaches for feature selection. Neurocomputing 2016, 172, 371–381. [Google Scholar] [CrossRef]
- Aman, M.M.; Jasmon, G.B.; Bakar, A.H.A.; Mokhlis, H.; Karimi, M. Optimum shunt capacitor placement in distribution system—A review and comparative study. Renew. Sustain. Energy Rev. 2014, 30, 429–439. [Google Scholar] [CrossRef]
- Rahman, M.T.; Othman, M.; Mokhlis, H.; Muhammad, M.A.; Bouchekara, H.R. Optimal fixed charge–rate coordination of plug-in electric vehicle incorporating capacitor and OLTC switching to minimize power loss and voltage deviation. IEEJ Trans. Electr. Electron. Eng. 2018, 13, 963–970. [Google Scholar] [CrossRef]
- Masoum, A.S.; Deilami, S.; Moses, P.; Masoum, M.; Abu-Siada, A. Smart load management of plug-in electric vehicles in distribution and residential networks with charging stations for peak shaving and loss minimisation considering voltage regulation. IET Gener. Trans. Distrib. 2011, 5, 877–888. [Google Scholar] [CrossRef]
- Wang, H.; Dusmez, S.; Khaligh, A. Design and Analysis of a Full-Bridge LLC-Based PEV Charger Optimized for Wide Battery Voltage Range. IEEE Trans. Veh. Technol. 2014, 63, 1603–1613. [Google Scholar] [CrossRef]
- Fang, X.; Misra, S.; Xue, G.; Yang, D. Smart grid—The new and improved power grid: A survey. IEEE Commun. Surv. Tutor. 2012, 14, 944–980. [Google Scholar] [CrossRef]
- Gungor, V.C.; Sahin, D.; Kocak, T.; Ergut, S.; Buccella, C.; Cecati, C.; Hancke, G.P. Smart grid technologies: Communication technologies and standards. IEEE Trans. Ind. Inform. 2011, 7, 529–539. [Google Scholar] [CrossRef]
- Siano, P. Demand response and smart grids—A survey. Renew. Sustain. Energy Rev. 2014, 30, 461–478. [Google Scholar] [CrossRef]
- Aigner, D. The residential electricity time-of-use pricing experiments: What have we learned? In Social Experimentation; University of Chicago Press: Chicago, IL, USA, 1985; pp. 11–54. [Google Scholar]
- Shaaban, M.F.; El-Saadany, E. Accommodating high penetrations of PEVs and renewable DG considering uncertainties in distribution systems. IEEE Trans. Power Syst. 2014, 29, 259–270. [Google Scholar] [CrossRef]
- Sang, Y.-N.; Bekhet, H.A. Modelling electric vehicle usage intentions: An empirical study in Malaysia. J. Clean. Prod. 2015, 92, 75–83. [Google Scholar] [CrossRef]


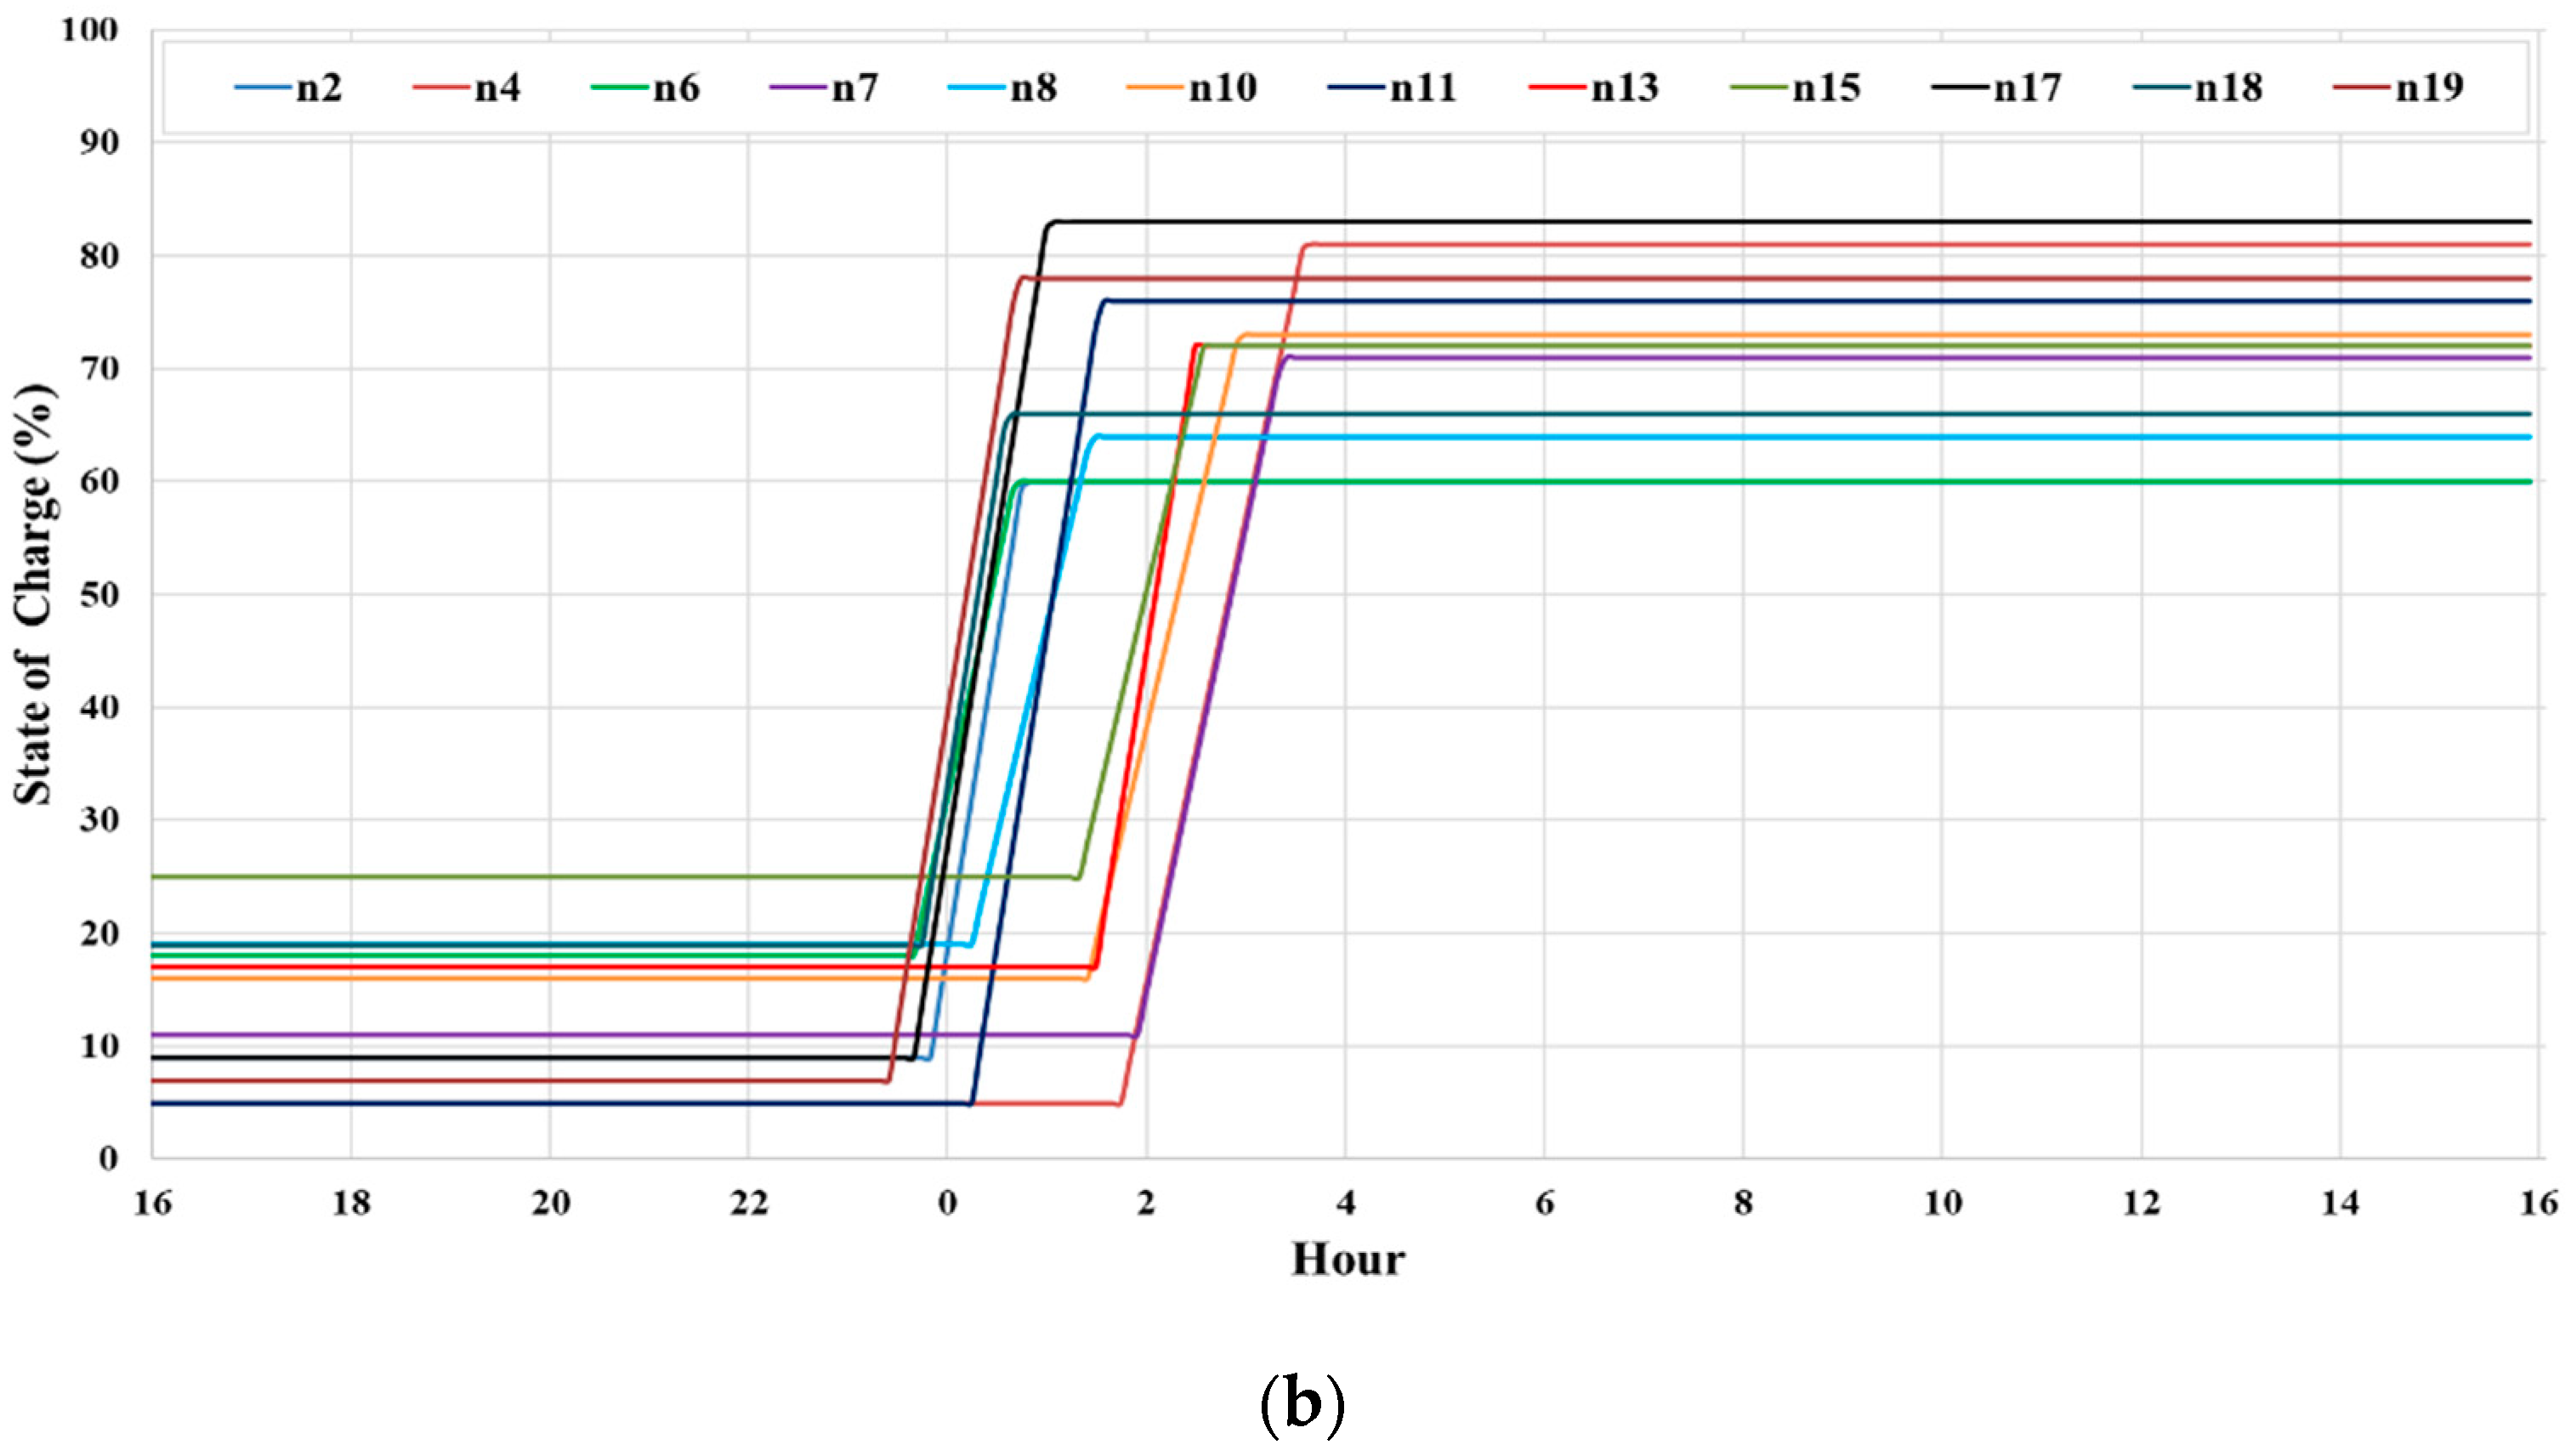
| Node Number | n2 | n4 | n6 | n7 | n8 | n10 | n11 | n13 | n15 | n17 | n18 | n19 |
|---|---|---|---|---|---|---|---|---|---|---|---|---|
| Charger capacity (kW) | 3.3 | 7.2 | 7.2 | 3.3 | 6.6 | 3.3 | 7.2 | 7.2 | 3.3 | 6.6 | 7.2 | 6.6 |
| Battery size (kWh) | 6 | 19.2 | 19.2 | 6 | 16 | 6 | 19.2 | 19.2 | 6 | 16 | 19.2 | 16 |
| Initial SOC (%) | 42 | 36 | 39 | 45 | 33 | 29 | 41 | 33 | 52 | 25 | 31 | 37 |
| Requested SOC (%) | 69 | 60 | 61 | 80 | 55 | 74 | 68 | 82 | 86 | 65 | 71 | 75 |
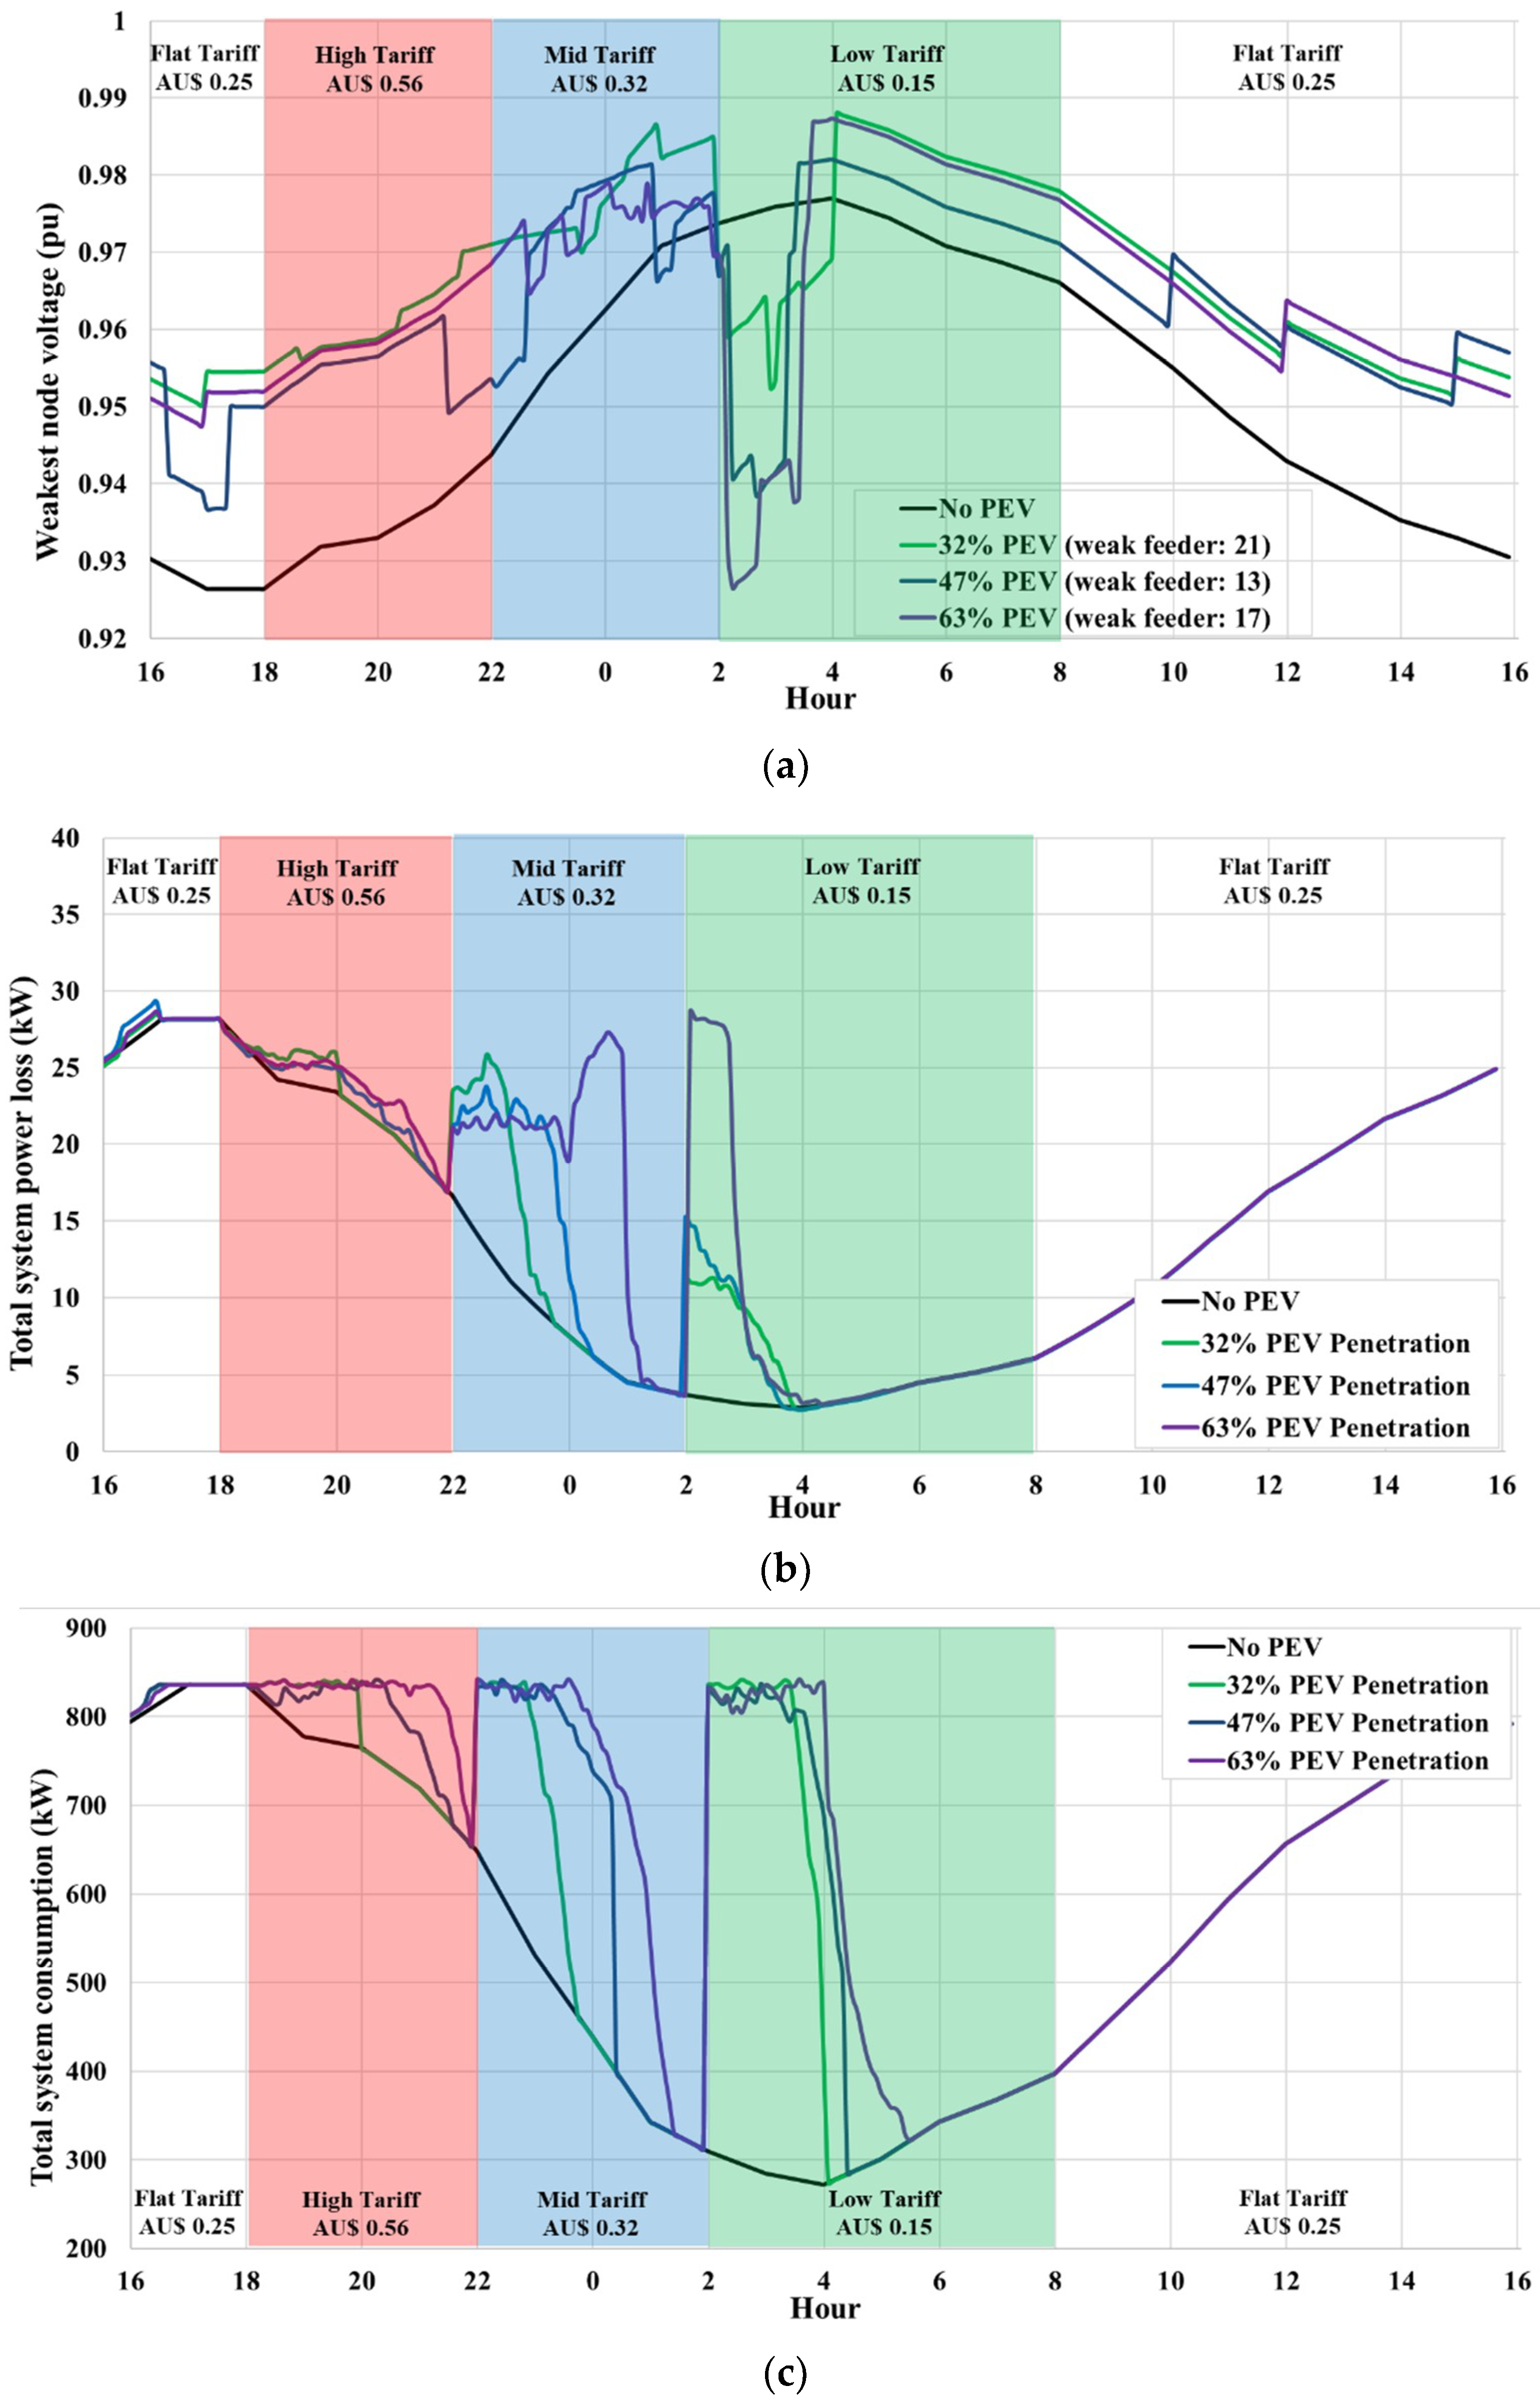
| Scenarios | PEV (%) | ΔV (%) | Increase in Loss * (%) | Satisfaction Ratio ** | |||
| No PEV | 0 | 7.35 | 0 | - | |||
| Uncoordinated PEV charging | 32 | 8.95 | 14.59 | - | |||
| 47 | 17.27 | 23.08 | - | ||||
| 63 | 19.16 | 33.85 | - | ||||
| Algorithm | BPSO | BGWO | BPSO | BGWO | BPSO | BGWO | |
| Coordinated PEV charging with the capacitor and OLTC adjustment | 32 | 4.99 | 4.99 | 11.86 | 11.91 | 22/0 | 22/0 |
| 47 | 6.32 | 6.51 | 17.28 | 17.32 | 22/0 | 22/0 | |
| 63 | 7.34 | 7.89 | 23.03 | 23.23 | 22/0 | 22/0 | |
| Charging Scenario | PEV (%) | Increase in Power Loss (kW) | Generation Cost/day ($) | Total Cost/day ($) | Increase in Cost (%) |
|---|---|---|---|---|---|
| No PEV | 0 | 0 | 802.5 | 818.1 | - |
| Uncoordinated charging | 32 | 14.59 | 927.5 | 952.4 | 16.41 |
| 47 | 23.08 | 967.5 | 1008.0 | 23.21 | |
| 63 | 33.85 | 1008.5 | 1089.2 | 33.13 | |
| Proposed method | 32 | 11.86 | 909.5 | 922.1 | 12.71 |
| 47 | 17.28 | 942.5 | 956.1 | 16.86 | |
| 63 | 23.03 | 982.6 | 997.1 | 21.87 |
| Charging Scenario | PEV Penetration (%) | Decrease in PEV Charging Cost (%) |
|---|---|---|
| Uncoordinated PEV charging | 32 | - |
| 47 | - | |
| 63 | - | |
| Coordinated PEV charging without considering the tariff | 32 | 3.56 |
| 47 | 7.14 | |
| 63 | 11.45 | |
| Proposed method including the ToU electricity tariff | 32 | 5.45 |
| 47 | 9.42 | |
| 63 | 15.89 |
© 2019 by the authors. Licensee MDPI, Basel, Switzerland. This article is an open access article distributed under the terms and conditions of the Creative Commons Attribution (CC BY) license (http://creativecommons.org/licenses/by/4.0/).
Share and Cite
Suyono, H.; Rahman, M.T.; Mokhlis, H.; Othman, M.; Illias, H.A.; Mohamad, H. Optimal Scheduling of Plug-in Electric Vehicle Charging Including Time-of-Use Tariff to Minimize Cost and System Stress. Energies 2019, 12, 1500. https://doi.org/10.3390/en12081500
Suyono H, Rahman MT, Mokhlis H, Othman M, Illias HA, Mohamad H. Optimal Scheduling of Plug-in Electric Vehicle Charging Including Time-of-Use Tariff to Minimize Cost and System Stress. Energies. 2019; 12(8):1500. https://doi.org/10.3390/en12081500
Chicago/Turabian StyleSuyono, Hadi, Mir Toufikur Rahman, Hazlie Mokhlis, Mohamadariff Othman, Hazlee Azil Illias, and Hasmaini Mohamad. 2019. "Optimal Scheduling of Plug-in Electric Vehicle Charging Including Time-of-Use Tariff to Minimize Cost and System Stress" Energies 12, no. 8: 1500. https://doi.org/10.3390/en12081500
APA StyleSuyono, H., Rahman, M. T., Mokhlis, H., Othman, M., Illias, H. A., & Mohamad, H. (2019). Optimal Scheduling of Plug-in Electric Vehicle Charging Including Time-of-Use Tariff to Minimize Cost and System Stress. Energies, 12(8), 1500. https://doi.org/10.3390/en12081500