Article

Analyzing Carbon Emissions Embodied in Construction Services: A Dynamic Hybrid Input–Output Model with Structural Decomposition Analysis

1
State Key Laboratory of Power Systems, Department of Energy and Power Engineering, Tsinghua-BP Clean Energy Research & Education Centre, Tsinghua University, Beijing 100084, China
2
Tsinghua-Rio Tinto Joint Research Centre for Resources, Energy and Sustainable Development, Laboratory for Low Carbon Energy, Tsinghua University, Beijing 100084, China
*
Author to whom correspondence should be addressed.
Energies 2019, 12(8), 1456; https://doi.org/10.3390/en12081456
Submission received: 8 March 2019 / Revised: 11 April 2019 / Accepted: 13 April 2019 / Published: 17 April 2019
(This article belongs to the Special Issue Assessment of Energy–Environment–Economy Interrelations)

Abstract

:
The energy embodied in construction services consumed by industrial sectors used to increase capacities has led to massive energy-related carbon emissions (ERCE). From the perspective of consumer responsibility, ERCE embodied in construction services is driven by technological changes and the increases in final demand of various sectors, including final consumption, fixed assets investment, and net export. However, little attention has been paid to decomposing sectoral responsibilities from this perspective. To fill this research gap, we propose a dynamic hybrid input–output model combined with structural decomposition analysis (DHI/O-SDA model). We introduce DHI/O modeling into the estimation of ERCE embodied in construction services from the perspective of consumer responsibility and introduce SDA into DHI/O models to improve the resolution of the estimate. Taking China as a case study, we verified the DHI/O-SDA model and present the bilateral relationships among sectoral responsibilities for ERCE embodied in construction services. A major finding is that the “Other Tertiary Industry” sector is most responsible for ERCE embodied in construction services and strongly influences other sectors. Therefore, controlling the final demand increase of the service industry will be the most effective policy to reduce the ERCE embodied in construction services.

1. Introduction

The Intergovernmental Panel on Climate Change (IPCC) has pointed out that reducing greenhouse gas emissions can help mitigate global greenhouse effects [1]. According to the Fifth Assessment Report of the IPCC [2], the energy-related carbon emissions (ERCE) of industrial processes accounted for approximately 65% of anthropogenic greenhouse gas emissions worldwide in 2010. To reduce ERCE, energy conservation remains an important task in addition to the development of low-carbon energy sources.
Energy conservation not only includes improving technological efficiency (such as reducing energy consumption per unit of energy services provided), but also reducing demand for energy services. Energy services can be categorized as “operation services” and “construction services” [3]. The former indicates the services required by an economy to maintain current living standards with existing infrastructure and energy devices, and the latter indicates the services required for expanding the capacities of various industrial sectors. Construction services normally involve investments in infrastructure and energy devices, which cause direct and indirect energy consumption and ERCE. Therefore, the conservation of construction services (for example, by avoiding the insufficient use of infrastructure and production capacities caused by overcapacity or frequent construction and demolition) must not be neglected in energy conservation analysis and planning.
The conservation of construction services is especially important in developing countries that are experiencing rapid industrialization, and in those whose demands for energy services are far from saturated, as exemplified by China after 2000. Using fixed assets investment as an indicator of construction services, two previous studies [4,5] verified that energy consumed for construction services accounted for a large proportion in China, and found that a considerable amount of potential energy savings can be captured by conserving construction services. In existing work related to estimating energy consumption and ERCE embodied in construction services [4,5,6,7,8], the responsibility for energy consumption and ERCE embodied in construction services was mainly attributed to the sectors that directly provide construction services. Therefore, the policy implication was mainly to control the investments in the construction and manufacturing sectors to reduce energy consumption and ERCE embodied in construction services. However, much of the construction services in these two sectors are not due to their own needs, but to the increase in other sectors’ final demand, including final consumption, fixed assets investment, and net export. The increase in the final demand of various sectors is the deeper reason for the need for construction services, and for energy consumption and ERCE embodied in construction services. Therefore, restricting the final demand increase of the sectors that mainly consume construction services may be more effective. Accordingly, we needed to clarify the drivers of construction services from the perspective of each sector’s final demand increase, meaning from the perspective of consumer responsibility. This approach involves the redistributing the investment responsibility of each sector based on the final demand increases. To this end, we must introduce the dynamic hybrid input–output (DHI/O) method, because there are limitations in the static hybrid input–output method applied in previous studies.
This paper introduces the DHI/O model into the decomposition of sectoral responsibility for energy consumption and the ERCE embodied in construction services from the perspective of consumer responsibility. Moreover, structural decomposition analysis (SDA) is combined with the DHI/O model to further improve the resolution of the model, and shapes a dynamic hybrid input–output model combined with structural decomposition analysis (DHI/O-SDA model). Being the largest ERCE emitter in the world, China is used as a case study to demonstrate the model.
This paper provides two key contributions. First, this is an early attempt to introduce the DHI/O model into the analysis of energy consumption and the ERCE embodied in construction services. We also firstly introduce SDA into the DHI/O model to differentiate the energy consumption and the ERCE embodied in construction services caused by technology changes from those caused by final demand increases. Such a model is essential for formulating energy conservation policies in developing countries that are experiencing rapid industrialization to reduce energy consumption and the ERCE embodied in construction services. Second, using the DHI/O-SDA model, we present the sectoral responsibilities for the ERCE embodied in the construction services consumed by China from 2007 to 2012. Based on these outcomes, we discussed the policy implications of reducing ERCE embodied in construction services in China. These policies are presented from a new perspective that emphasizes more control of the final demand increase of the sectors that mainly consume construction services.
The rest of this paper is organized as follows: Section 2 reviews the related literature, Section 3 introduces the methodology and data, Section 4 presents the results, uncertainties, and discussions of our study, and Section 5 provides our conclusions and policy implications.

2. Literature Review

Construction services directly consumed by various sectors can be quantified as a proportion of fixed assets investment. Generally, fixed assets are invested in sectors for two reasons: primarily to increase the production capacities for meeting the increasing demand on production, and to compensate for the loss in the existing production capacities of the sectors [9]. The former reason can be regarded as the demand for construction services, or construction services-related fixed assets investment (CSFAI), whereas the latter as the demand for operation services. Therefore, as an assumption, estimating the energy consumption and ERCE embodied in construction services consumed by various sectors is equivalent to calculating the energy consumption and the ERCE embodied in the CSFAI of various sectors.
The total quantities of direct and indirect energy consumed by various sectors to produce final demands (including CSFAI) are usually estimated using embodied energy analysis. The concept of embodied energy analysis, which was initially called vertical analysis, was introduced by Bullard and Herendeen [10] to describe both direct and indirect primary energy invested in production. Some studies applied embodied energy analysis to estimate the energy consumption or ERCE embodied in the fixed assets investment of various economies. For example, Fu et al. [5] estimated the embodied energy and the ERCE of various types of final demand products in China. Acquaye et al. [6] calculated the ERCE of the Irish construction sector in 2005. Liu et al. [7] calculated the energy consumption embodied in the final demand products of China’s economic sectors and found that considerable amounts of energy were consumed in the “Construction” and “Other Service Activities” sectors. Huang et al. [8] estimated the ERCE embodied in the construction activities of 40 countries in 2009, which accounted for 23% of the total ERCE embodied in the global economic activities. Most of these studies applied static hybrid input–output models, which assumed fixed assets investment as a given exogenous variable rather than a result of output increases. Therefore, the responsibilities for energy consumption and the ERCE embodied in fixed assets investment were often taken by the sectors mainly providing fixed assets investment, such as the construction and manufacturing sectors.
To treat fixed assets investment as an endogenous variable and establish the relationship between fixed assets investment and the final demand increase of each sector, we decided to adopt a DHI/O method for this study. Because in the dynamic input–output model, which was developed by Leontief [11], the fixed assets investment in various sectors is represented as a set of coefficients related to the increase in each sector’s output between time series [12]. Therefore, the responsibilities of fixed assets investment are allocated to various sectors based on the total output increases. By establishing the relationship between the final demand increase and the total output changes, the fixed assets investment can be estimated from the final demand increase. To this end, Pauliuk et al. [13] built a dynamic input–output model with a comprehensive set of life cycle inventories to analyze the influence of final demand increase on fixed assets investment, and differentiated the fixed assets investment caused by construction and operation services. This is the only study we found that tried to analyze the connection between CSFAI and final demand increase. However, that study did not calculate the energy consumption and the ERCE embodied in the CSFAI.
In the field of energy analysis, the DHI/O model was introduced by Rhoten [14]. Researchers have applied DHI/O models in predicting the total energy consumption or energy consumption of different energy sources (such as coal, oil, gas, and non-fossil electricity) under multiple optimization objectives [15,16,17,18]. The DHI/O models have also been adopted for analyzing the development of renewable energy [19] and bioenergy [20]. However, decomposing the responsibilities for the energy and the ERCE embodied in the fixed assets investment (especially the CSFAI) of each sector according to the final demand increase of each sector has received little attention. We speculate that this is mainly because scholars in the field of dynamic input–output modeling have not paid enough attention to the energy consumption and the ERCE embodied in the construction services sectors in developing countries. Therefore, the application of the DHI/O method in the decomposition of sectoral responsibility for energy consumption and ERCE embodied in construction services from the perspective of each sector’s final demand increase is still an open field for research.
In addition to the increase in the final demand of each sector, technological changes may also lead to increases in the total output of various sectors, which may lead to CSFAI and energy consumption and ERCE embodied in construction services. Several previous studies have shown that technological changes can result in changes in the total output as the final demand increases of various sectors [21,22,23]. Therefore, by distinguishing the total output changes caused by technological changes and that caused by final demand increase, we can further improve the accuracy of the decomposition of CSFAI responsibility and improve the resolution of the calculation. This improvement can be achieved by using SDA, which was first proposed by Chenery et al. [24] to identify the influence of each factor (including the final demand increase of each sector and technological changes) on the total output change. Subsequently, many studies applied SDA to identify the contributions of the final demand increase of each sector and technological changes on the output change for various economies [25,26,27,28,29,30,31]. By introducing SDA into the dynamic input–output model, we can further separate the CSFAI responsibilities of each sector into one part caused by the final demand increase and the other part caused by technological changes. To the best of our knowledge, this type of study has not been conducted because previous SDA studies have overlooked energy consumption and the ERCE embodied in construction services.
Our literature review indicates that the energy consumption and the ERCE embodied in construction services can be estimated by calculating the energy consumption and the ERCE embodied in the CSFAI of various sectors. To redistribute the responsibilities for energy consumption and the ERCE embodied in CSFAI to sectors that consume the CSFAI for increasing their final demand, the DHI/O method must be introduced. Furthermore, SDA can be introduced to differentiate the output increase caused by the final demand increase from that caused by technological changes. The combination of SDA and the DHI/O model marks a new direction in dynamic input–output analysis that can improve the resolution of estimates of energy consumption and the ERCE embodied in construction services from the perspective of consumer responsibility.

3. Methodology and Data Preparation

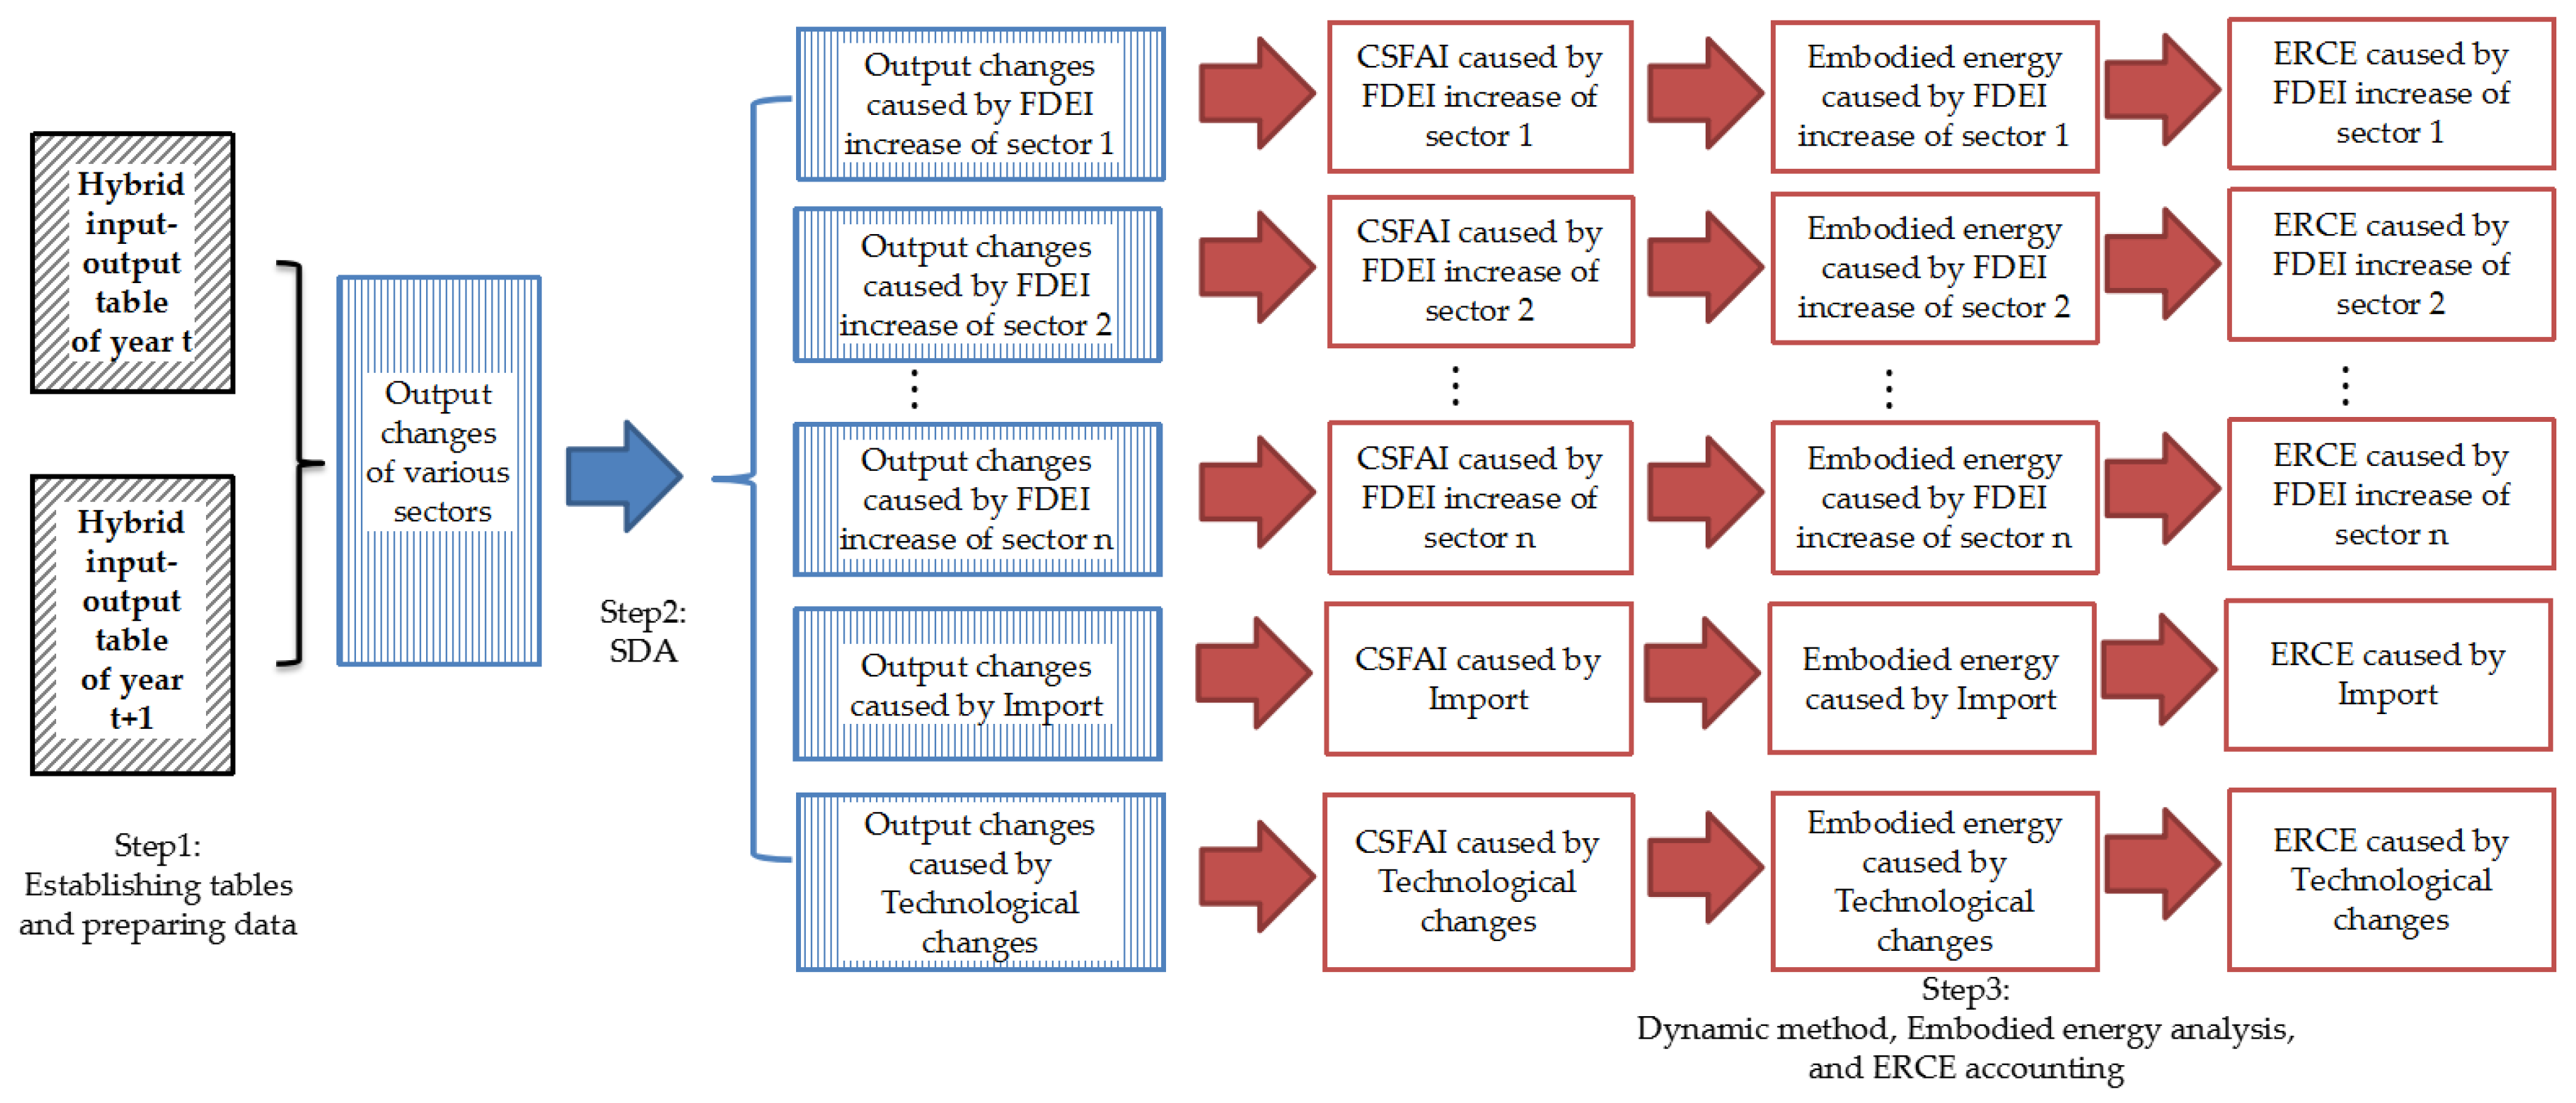
3.1. DHI/O-SDA Model

This section describes the development of a DHI/O-SDA model for estimating the energy consumption and the ERCE embodied in CSFAI from the perspective of consumer responsibility. Given the strong correlation between ERCE and energy consumption, the results are displayed in terms of ERCE only. The three steps for establishing a DHI/O-SDA model are illustrated in Figure 1.
The first step (Step 1; the dark blocks with slanting lines on the left side of Figure 1) involves establishing the hybrid input-output tables and preparing the data for further decomposition and estimation. Using the energy balance tables and input–output tables for different years, a set of energy-economy hybrid input–output tables are built.
The second step (Step 2; the blue blocks with vertical lines in the middle of Figure 1) involves using SDA to distinguish the output changes caused by the final demand increase of various sectors from those caused by technological changes. The changes in total output of various sectors are calculated by comparing the hybrid input–output tables from different years. The results of Step 2 are the changes in the output of various sectors caused by final demand increases of various sectors and by technological changes.
The last step (Step 3; the red blocks on the right side of Figure 1) involves estimating the energy consumption and ERCE embodied in CSFAI. Step 3 includes three parts: (1) estimating the CSFAI quantities by the dynamic input–output method based on the output changes caused by the final demand increases of various sectors and the technological changes; (2) estimating the energy consumption embodied in the CSFAI using embodied energy analysis; and (3) calculating the ERCE caused by energy consumption using the IPCC-recommended carbon accounting method [32].

3.1.1. Establishment of Energy-Economic Hybrid Tables

The energy-economy hybrid input–output table is obtained by replacing the economic value of the energy sector in the conventional economic input–output table with the physical quantity of various types of energy. The final demands of each sector can be classified into final demand excluding import (FDEI) and import. The reason why import is separated from final demand is that import values are negative relative to other final demands. Therefore, in sectors with large amounts of imports, the total final demand including import may be negative, which prevents the analysis of how many CSFAI are needed in those sectors.
The direct input coefficient of sector i to sector j, aijt, can be defined as the ratio of the economic value produced by sector i and consumed by sector j to the total output of sector j in year t. If sector i or sector j is an energy sector, the economic value should be replaced by the quantity of energy product. The Leontief inverse matrix of year t can be calculated by:
Lt = (IAt)−1
where Lt represents the Leontief inverse matrix of year t, I represents the identity matrix, At is the direct input matrix composed of aijt, and (IAt) must be a non-singular matrix. At least two hybrid input–output tables for two consecutive years must be established for further analysis.

3.1.2. SDA

Comparing the hybrid input–output tables of years t and t + 1, the changes in some parameter matrices from t to t + 1 can be estimated by Equations (2)–(4):
Lt = Lt+1Lt
xt = xt+1xt
ft = ft+1ft
where ∆Lt is the change in the Leontief inverse matrix between the two years, xt = (x1t,x2t,…,xnt)T stands for the total output of year t, ∆xt is the change in the outputs between the two years, ft = (f1t,f2t,…,fnt)T represents the final demands of year t including FDEI and import, and ∆ft is the change in the final demands between the two years. The physical meaning of xt can be considered as the outputs of all sectors embodied in the final demand. Carbon emissions embodied in the outputs of all primary energy sectors in xt is the ERCE.
In SDA, the change in the outputs between the two years consists of two parts: changes due to the final demand increase and changes due to technological changes. We assumed that the weight of the two parts are equal. Thus, the output changes from year t to t + 1 year can be described as:
Δ x t = 1 2 Δ L ( f t + f t + 1 ) + 1 2 ( L t + L t + 1 ) Δ f
Equation (5) produces a decomposition of the total change in outputs into two parts. The first part is attributable to technological changes and can be defined as ∆xtbyL, as shown in Equation (6). The second part represents the contribution of the final demand increase to the output changes and can be defined as ∆xtbyf, as shown in Equation (7):
Δ x b y L t = 1 2 Δ L ( f t + f t + 1 )
Δ x b y f t = 1 2 ( L t + L t + 1 ) Δ f t
xtbyf can be further decomposed into the changes in the outputs caused by the FDEI increase of each sector and the change in the outputs caused by the change of import, as shown in Equation (8):
Δ x b y f t = i Δ x b y F D E I , i t + Δ x b y i m p o r t s t = i 1 2 ( L t + L t + 1 ) Δ f b y F D E I , i t + 1 2 ( L t + L t + 1 ) Δ f b y i m p o r t s t
The change in the outputs between the two years is decomposed into three categories: the change due to technological changes, the changes due to the FDEI increase of each sector, and the change due to the change of import. A more detailed derivation process can be found in Miller et al. [12].

3.1.3. CSFAI Estimation, Embodied Energy Analysis and ERCE Calculation

In the traditional DHI/O model, fixed assets investment is taken as the endogenous variable of the output changes between two consecutive time instances. As discussed by Holz et al. [9], fixed assets investment is produced for both CSFAI and operation services-related fixed assets investment. We assumed that the ratio of the CSFAI to the total fixed assets investment in various sectors is pcsfait.
In the conventional dynamic input–output model, the capital coefficient btij is defined as the ratio of “the value of the output of sector i that is held by sector j as stock” [12] to the total output increase of sector j in year t. However, only the CSFAI rather than the total fixed assets investment can be taken as the result of changes in output. This capital coefficient is meaningful only when the total output increases of sector i are positive. To solve these two problems, a similar coefficient, called “positive capital coefficient” ctij, is proposed in this paper. This coefficient is defined as the ratio of the CSFAI in sector i that is held by sector j to the sum of the positive output increases.
The definition of ctij is based on the assumption that the CSFAI is only caused by positive output increase, and negative output changes have no effect on the CSFAI in various sectors. As energy consumption and the ERCE embodied in the CSFAI occur during the installation of fixed assets and cannot be recycled even if the fixed assets are either idle or retired, only the CSFAI caused by a positive demand increase leads to new energy consumption and ERCE. Otherwise, energy consumption and the ERCE embodied in the CSFAI in a sector with a decreasing demand is zero, but not negative. Therefore, the aforementioned assumption is reasonable when analyzing historical data because the fixed assets have been installed. ctij can be calculated with historical CSFAI data and energy-economy hybrid input–output tables.
Because CSFAI is correlated with positive changes in outputs corresponding to the decomposition of the change in the outputs, CSFAI can also be decomposed into three categories: CSFAI due to technological changes, CSFAI due to the FDEI increase of each sector, and CSFAI due to the change in imports. The CSFAI caused by various factors can be estimated, as shown in Equations (9)–(11):
C S F A I b y L , i j t = c i j t Δ x b y L , j t
C S F A I b y F D E I , i j t = c i j t Δ x b y F D E I , j t
C S F A I b y i m p o r t s , i j t = c i j t Δ x b y i m p o r t s t
The output embodied in the CSFAI can be calculated by:
x C S F A I t = L t C S F A I t
where xtCSFAI is the output embodied in CSFAI. The output of the primary energy sector represents the embodied energy of CSFAI.
The method we adopted for estimating ERCE from energy consumption is recommended by the IPCC [32]. As carbon dioxide (CO2) is the most important greenhouse gas, the ERCE in this paper only focuses on CO2. The ERCE resulting from the embodied energy can be estimated by Equation (13) as follows:
E R C E = E E Q E E × L H V E E × f C O 2 , E E
where QEE is the quantity of one type of embodied energy, LHVEE represents the low heat value of the embodied energy, and fCO2,EE is the CO2 emission factor of the embodied energy. ERCE is the sum of the CO2 emissions of all types of embodied energy, and fCO2,EE is determined by the carbon content of the embodied energy and the carbon oxidation rate.
The basic assumptions of DHI/O models still apply, such as energy supply equals energy consumption, and there is only one type of product in most sectors. There are three other assumptions. First, the installation process of fixed assets begins and ends within the same time series. Second, the fixed assets invested in the last time series play a role in the industrial production of the next time series. Third, each sector operates on a certain activity in each time series.

3.2. Data Preparation

As a rapidly developing country, China is the largest carbon emitter in the world. From 2008 to 2010, the Chinese government spent a lot of money to promote economic development, a large part of which were used for construction services, including infrastructure construction and expansion of industrial capacity [33]. This period is special and important for the analysis of China’s construction services. The energy embodied in construction services constitutes a large part of the total energy consumption in China [4,5], which has led to a massive ERCE. Estimating the ERCE embodied in construction services and identifying which sector is key to reducing the ERCE embodied in construction services consumed by China are necessary. Therefore, taking China from 2007 to 2012 as an example can demonstrate this model, and can also provide some data support for China to create and change relevant policies.
In this study, we adopted the input–output tables for China for 2007 [34], 2010 [35], and 2012 [36] published by the National Bureau of Statistics (NBS) of China. To be consistent with the sectors settings in the energy balance tables published by NBS, the input–output tables for each year were merged into 21 sectors for the DHI/O-SDA model, as shown in Appendix A. By replacing the economic value of the original input–output tables with the energy quantities in the energy balance tables for China and the final energy consumption by industrial sector tables for China for 2007, 2010, and 2012 [37], the hybrid input–output tables for China for 2007, 2010, and 2012 were established, respectively. Because the statistical data of energy balance tables published by NBS are not high enough in resolution, it is difficult to separate the specific energy utilization data of some sectors from their merged sectors, such as other tertiary industry. Due to lack of input–output tables for China for 2008, 2009, and 2011, we linearly expanded the HI/O tables for these three years according to the ratio of gross domestic product. The tables of investment in fixed assets by industry for China from 2007 to 2012 [38] were adopted to set the proportion of fixed assets invested by each sector. The pcsfai of sector 04 in 2007, 2010, and 2012 and related assumptions were obtained from the study of Zhang et al. [39]. Due to lack of pcsfai data, we set other sectors’ pcsfai to the same value as that of Sector 04 (Electric Power). This assumption is reasonable as discussed by Zhang et al. [39].
For simplicity, we assumed the carbon oxidation rate to be 100%. We also adopted a low heat value and CO2 emission factor of each primary fossil energy source from IPCC [32], as shown in Table 1.

4. Results, Uncertainties and Discussions

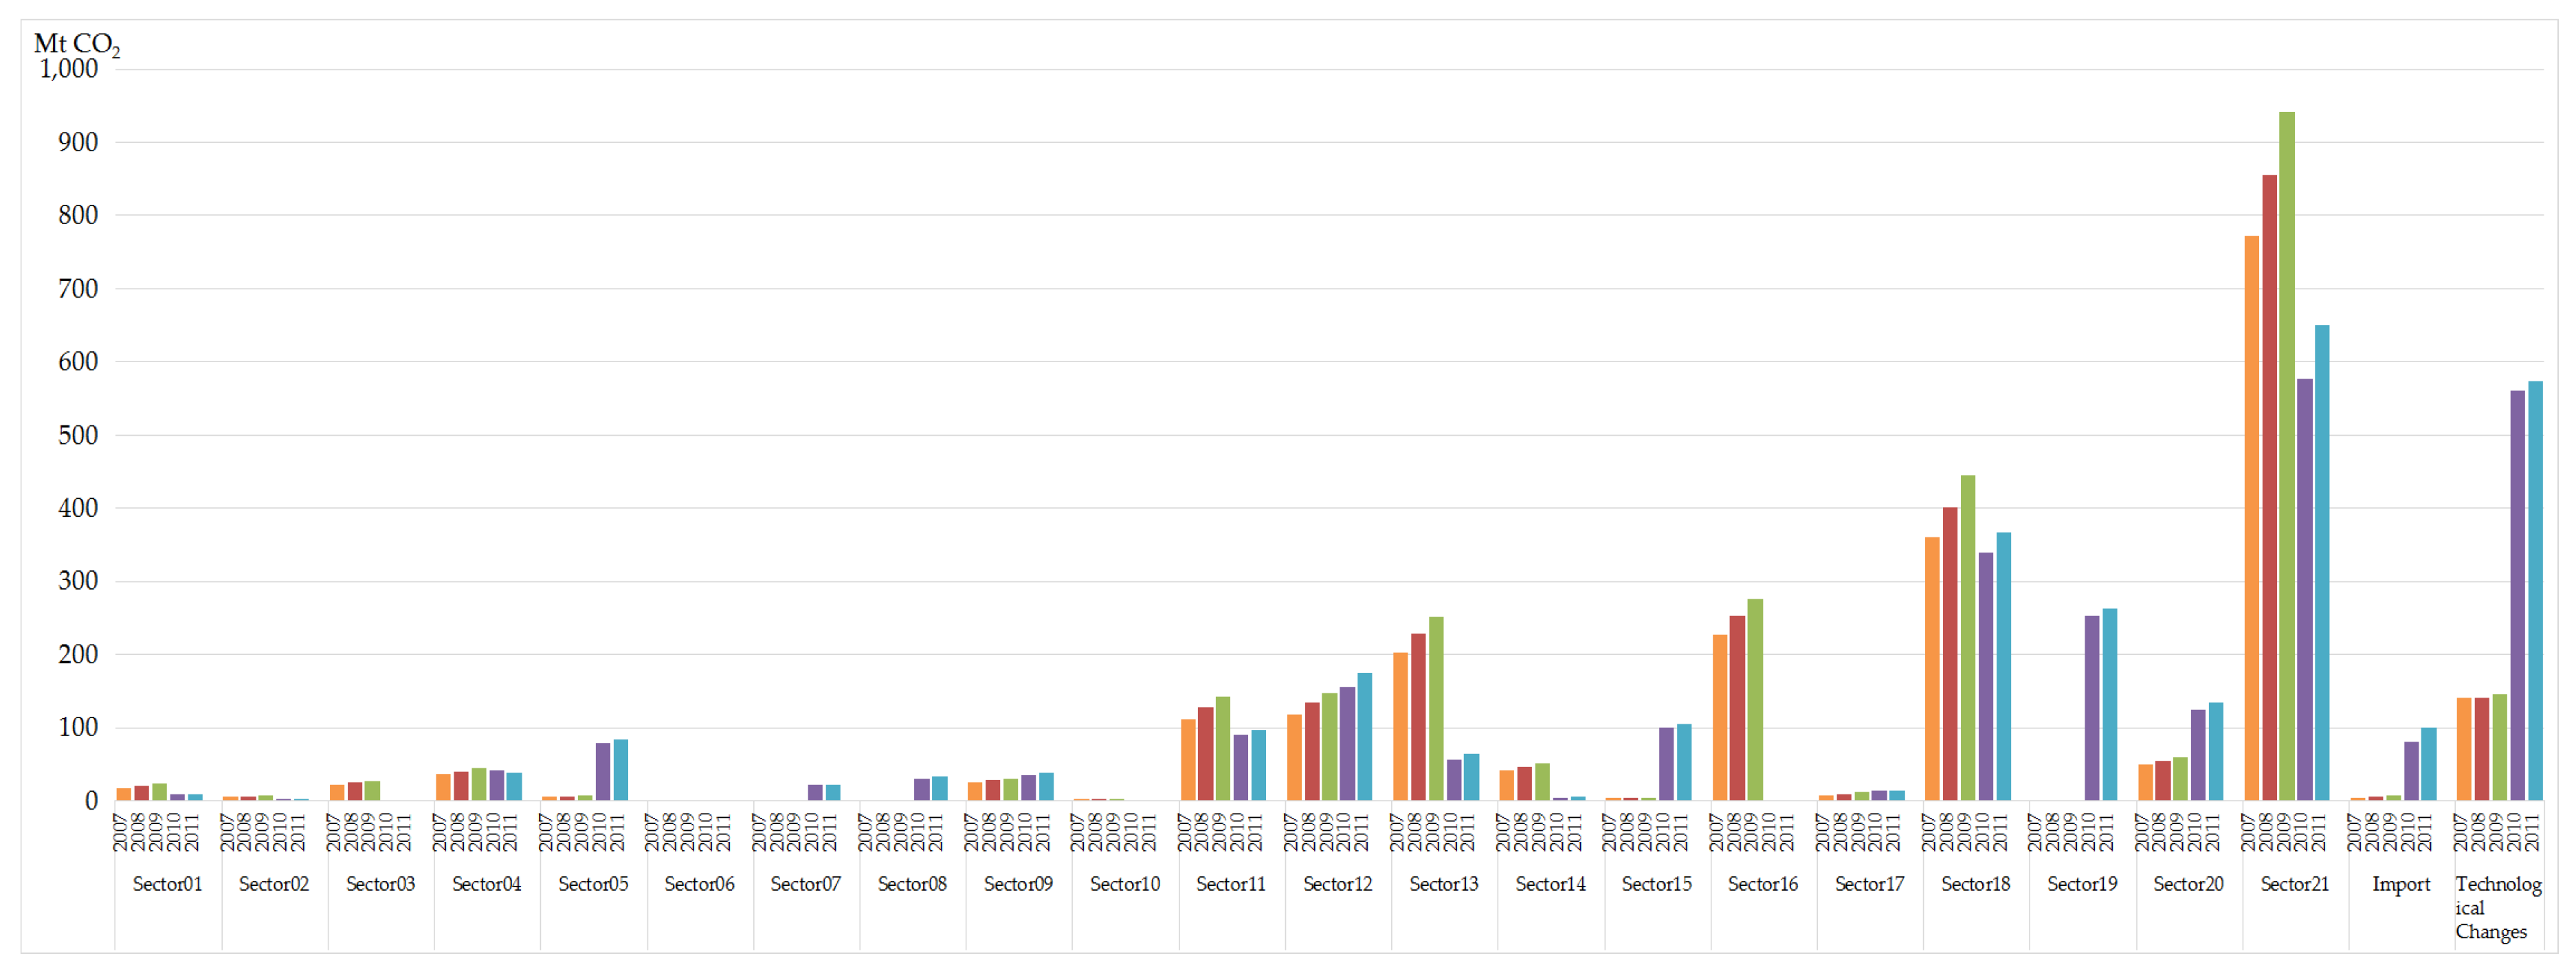
4.1. ERCE Embodied in CSFAI Caused by Each Sector

The ERCE embodied in the CSFAI caused by the final demand increase of each sector (including FDEI increases and import) and technological changes is shown in Figure 2. From 2007 to 2011, the FDEI increase of sector 21 (Other Tertiary Industry) always caused the most ERCE embodied in CSFAI in China. From 2007 to 2009, sector 18 (Construction) caused the second most ERCE embodied in CSFAI, followed by sector 16 (Other Manufacture). From 2010 to 2011, Tech (technological changes) overtook sector 18 (Construction) as the second largest cause of ERCE embodied in CSFAI, while sector 18 (Construction) was third. Sectors 21 (Other Tertiary Industry) and 18 (Construction) made large sectoral contributions to the ERCE embodied in CSFAI from 2007 to 2011 because the FDEI increases in these two sectors were the largest among all the sectors. Therefore, the policy implication is that these sectors should receive priority for reducing the ERCE embodied in construction services.
Import and Tech (technological changes) have been causing the ERCE embodied in CSFAI during each time period. Classically, the overall effect of technological changes should be to reduce the ERCE of an economy. However, based on the assumptions in this paper, Import and Tech (technological changes) may cause the ERCE emitted. Because technological changes also increase the demand of some sectors, which causes an increase in construction services; in turn, energy consumption and ERCE embodied in CSFAI increase. In this study, technological changes mainly caused output increases in sector 21 (Other Tertiary Industry), sector 04 (Electric Power), and five other sectors. The increase in the output demand of sector 21 (Other Tertiary Industry) is because many tertiary industries related to technology development, such as technical services and scientific research, are included in sector 21 (Other Tertiary Industry). More high-tech products were powered by electricity, which resulted in the output demand increase of sector 04 (Electric Power). The ERCE embodied in the CSFAI caused by technological changes was greater after 2010, which may be related to China’s technological innovation policy. The Chinese government paid more attention to scientific and technological innovation after 2010. At the 18th National Congress of the Communist Party of China in 2012, innovation was considered an important development strategy for China [40].
Based on the distribution of sectoral responsibility from the perspective of consumer responsibility, the responsibilities for energy consumption and the ERCE embodied in construction services undertaken by some sectors were different than those reported in previous studies. For example, sectors 06 (Ferrous Metals) and 08 (Non-metallic) were considered to be responsible for the huge energy consumption and the ERCE embodied in the construction services, as argued in this paper. These two sectors consumed huge amounts of energy to provide fixed assets investment (11% and 5% of the total intermediate energy consumption by all the sectors in 2012, respectively). However, the ERCE embodied in the CSFAI caused by the FDEI increase in sectors 06 (Ferrous Metals) and 08 (Nonmetallic) only accounted for less than 1% of all the ERCE embodied in CSFAI in all sectors. This occurred because the huge quantities of energy consumption and ERCE in these two sectors for producing CSFAI was attributable to the final demand increase of other sectors, especially sectors 21 (Other Tertiary Industry) and 18 (Construction). This result reflects the necessity of redistributing sectoral responsibilities for ERCE embodied in construction services energy consumption from the perspective of consumer responsibility. Unlike previous studies, the result of this paper clarify the importance of sector 21 (Other Tertiary Industries), instead of manufacturing sectors, in reducing ERCE embodied in construction services.

4.2. ERCE Embodied in CSFAI Caused by Sectoral a Unit of FDEI Increase

Based on the DHI/O-SDA model, the ERCE embodied in the CSFAI consumed by each sector caused by a unit of FDEI increase of each sector were estimated. Table 2 shows the format of the results obtained.
In the table, ERij represents the ERCE embodied in the CSFAI consumed by sector j and caused by a unit of FDEI increase of sector i. The results table can be analyzed in the horizontal and vertical directions. In the horizontal direction, there are three indicators: (1) ER, which is the ERCE embodied in the CSFAI consumed by each sector caused by a unit of FDEI increase in any specific sector; (2) TE, which is the sum of the ER in each sector caused by a unit of FDEI increase in any specific sector; and (3) PEC, which is the proportion of ER in the TE caused by a unit of FDEI increase in any specific sector.
ERij is an element of the results table. The ER in each sector represents the ERCE embodied in the CSFAI consumed by each sector when the FDEI in any specific sector increases by one unit (meaning the increase in one sector leads to ER in n sectors). By analyzing ER, we can determine which sector will produce the most ERCE embodied in construction services because of a unit of FDEI increase in any specific sector.
TE is sum of ERij in a row, which can be estimated by Equations (14). The TE caused by sector i represents the total influence of a unit of FDEI increase in sector i on the total ERCE embodied in the CSFAI. By analyzing TE, we evaluated the efficiency of reducing the ERCE embodied in the CSFAI by restricting the FDEI increase of sector i:
T E i = j E R i j
PEC is the proportion of ERii to the TE of sector i, which can be estimated by Equation (15). PEC represents the driving influence of sector i’s unit FDEI increase on the CSFAI in various sectors. The higher the PEC, the less the FDEI increase of the sector results in the CSFAI in other sectors:
P E C i = E R i i j E R i j
In the vertical direction, the results demonstrate the influence of each sector’s unit FDEI increase on the ER in one sector (meaning the increase in n sectors leads to ER in one sector). The results can be used to identify the sector for which the FDEI increase would be most influential in causing ER in the target sector.
Appendix B provides the full results of the ERCE embodied in the CSFAI consumed by each sector caused by a unit of final demand increase of a specific sector in China in 2007–2008, 2008–2009, 2009–2010, 2010–2011, and 2011–2012.

4.2.1. Analysis in the Horizontal Direction

ER 

For most sectors (20 of 21 in 2007–2010 and 19 of 21 in 2010–2012), a unit FDEI increase in one sector caused the most ER in the sector itself. However, sector 18 (Construction) was an exception in that a unit FDEI increase in this sector resulted in the most ER in sectors 21 (Other Tertiary Industry), 19 (Transport), 04 (Electric Power), 08 (Nonmetallic), and 06 (Ferrous Metals) because these sectors are important in supporting the production of sector 18 by providing materials, transportation, assistant services, and energy supply.
A unit FDEI increase in most sectors caused a relatively high ER in sector 21 (Other Tertiary Industry), which indicates that the increase in the FDEI in various sectors requires a large increase in products from sector 21. The products of sector 21 provide important support for the CSFAI caused by the FDEI increase in various sectors. Therefore, although not directly providing most of the construction services, sector 21 is key to conserving construction services from the perspective of consumer responsibility.

TE 

The TE caused by each sector’s FDEI increase is shown in Figure 3.
In 2007–2012, a unit FDEI increase in sector 14 (Textile) caused the most TE. The strong influence of a unit FDEI increase in sector 14 (Textile) on the TE is because the total ERCE embodied in the CSFAI caused by the FDEI increase in sector 14 was small (less than 2% of all the ERCE for fixed assets investment in 2007–2012), but the total increase in FDEI of sector 14 was much smaller.
In 2007–2012, the TEs caused by a unit increase in FDEI in sector 14 (Textile), sector 21 (Other Tertiary Industry), and sector 04 (Electric Power) remained high and were always more than 6t CO2. Therefore, an increase in the FDEIs of these three sectors would lead to the fastest increase in the ERCE embodied in the CSFAI in China. However, as the total quantity of the ERCE embodied in the CSFAI caused by sector 14 (Textile) and sector 04 (Electric Power) was small, policy makers might not focus on these two sectors to reduce the ERCE embodied in construction services. Sector 21 (Other Tertiary Industry) was in the top five sectors on the TE list in 2007–2012. The total quantity of ERCE embodied in the CSFAI caused by the FDEI increase in sector 21 was also the largest. Thus, to reduce the energy consumption and ERCE embodied in construction services, the most efficient approach would be to restrict the FDEI of sector 21.

PEC 

The PEC of each sector is shown in Figure 3. In 2007–2012, the PEC of some sectors, such as sectors 21 (Other Tertiary Industry), 14 (Textile), and 04 (Electric Power), were more than 50%. Therefore, an increase in the FDEI of these three sectors would cause most of the ERCEs embodied in CSFAI in their own sectors, which has relatively little impact on the ERCEs embodied in the CSFAI of other sectors. When the FDEI of these three sectors increases, other sectors consume only a little of the ERCEs embodied in CSFAI.

4.2.2. Analysis in the Vertical Direction

Two sectors in 2010–2011 were selected as target sectors to illustrate the vertical analysis. Sector 04 (Electric Power) is adopted as a common case, and sector 06 (Ferrous Metals) is adopted as a special case.
The result of sector 04 (Electric Power) is relatively common for most sector, because a unit FDEI increase in sector 04 (Electric Power) caused the most ER in this sector. Besides sector 04 (Electric Power), a unit FDEI increase in sector 07 (Non-ferrous Metals), followed by sector 09 (Chemical) and sector 08 (Non-metallic), caused the most ER in sector 04 (Electric Power). The production of these sectors requires a huge amount of electricity. To produce more FDEI in these sectors, sector 04 (Electric Power) needs to expand production capacity to provide more electricity, which results in more ER. Therefore, to restrict the energy consumption and the ERCE embodied in the CSFAI consumed by sector 04 (Electric Power), reducing the FDEI increase in sector 04 (Electric Power) would be the most efficient strategy, whereas decreasing the FDEI of sector 07 (Non-ferrous Metals), sector 09 (Chemical), and sector 08 (Non-metallic) would be less efficient.
The result for sector 06 (Ferrous Metals) is a special case because the FDEI in sector 06 (Ferrous Metals) decreased in 2010–2011. The most ER in sector 06 (Ferrous Metals) was caused by a unit FDEI increase in sector 12 (Machinery), followed by sector 13 (Automobiles) and sector 18 (Construction). Sector 06 (Ferrous Metals) provides the main materials for the production of these three sectors, so it is reasonable for a large increase in ER in sector 06 (Ferrous Metals) to be caused by a unit of FDEI increase of these sectors. Therefore, instead of continuously reducing the FDEI in sector 06 (Ferrous Metals), restricting the FDEI in sector 12 (Machinery), followed by sector 13 (Automobiles) and sector 18 (Construction) would be most efficient to reduce the energy consumption and the ERCE embodied in CSFAI consumed by sector 06 (Ferrous Metals). This result could be a reference case for policy makers to eliminate capacity expansion in sector 06 (Ferrous Metals), which is an important task stipulated by the State Council of China [41].
The results of vertical analysis are useful for policy makers to reduce energy consumption and ERCE embodied in construction services consumed by a specific sector. From the vertical analysis of the results, it can be found that the energy consumption and ERCE embodied in construction services consumed by a specific sector is affected by the FDEI increase of several sectors, or even all the sectors, in the economy to varying degrees. Therefore, to reduce energy consumption and ERCE embodied in construction services consumed by a specific sector more efficiently, policy makers need to consider not only the restriction of the FDEI of the specific sector itself, but also the impact of the FDEI increase of each sector on the specific sector, and make a systematic policy. To this end, it is necessary to adopt the vertical analysis proposed in this paper, which can provide quantitative data support.

4.3. Uncertainties and Discussions

4.3.1. Verification of the Model Result

To verify the validity of our model and estimation, we compare ERCE embodied in the final demands of various sectors of China in 2007 estimated separately in our paper with those of Fu’s work. In this paper, the result of the total ERCE responsibility of China in 2007 was 5.9 Gt. The results of this paper are reasonable in comparison to those of Fu et al. [5], where the total ERCE of China in 2007 was reported as 6.3 Gt. The total ERCE result of these two papers are close, with the main reasons for the difference are the different processing methods for system errors in the energy balance tables and the input–output tables and different carbon emission factors.

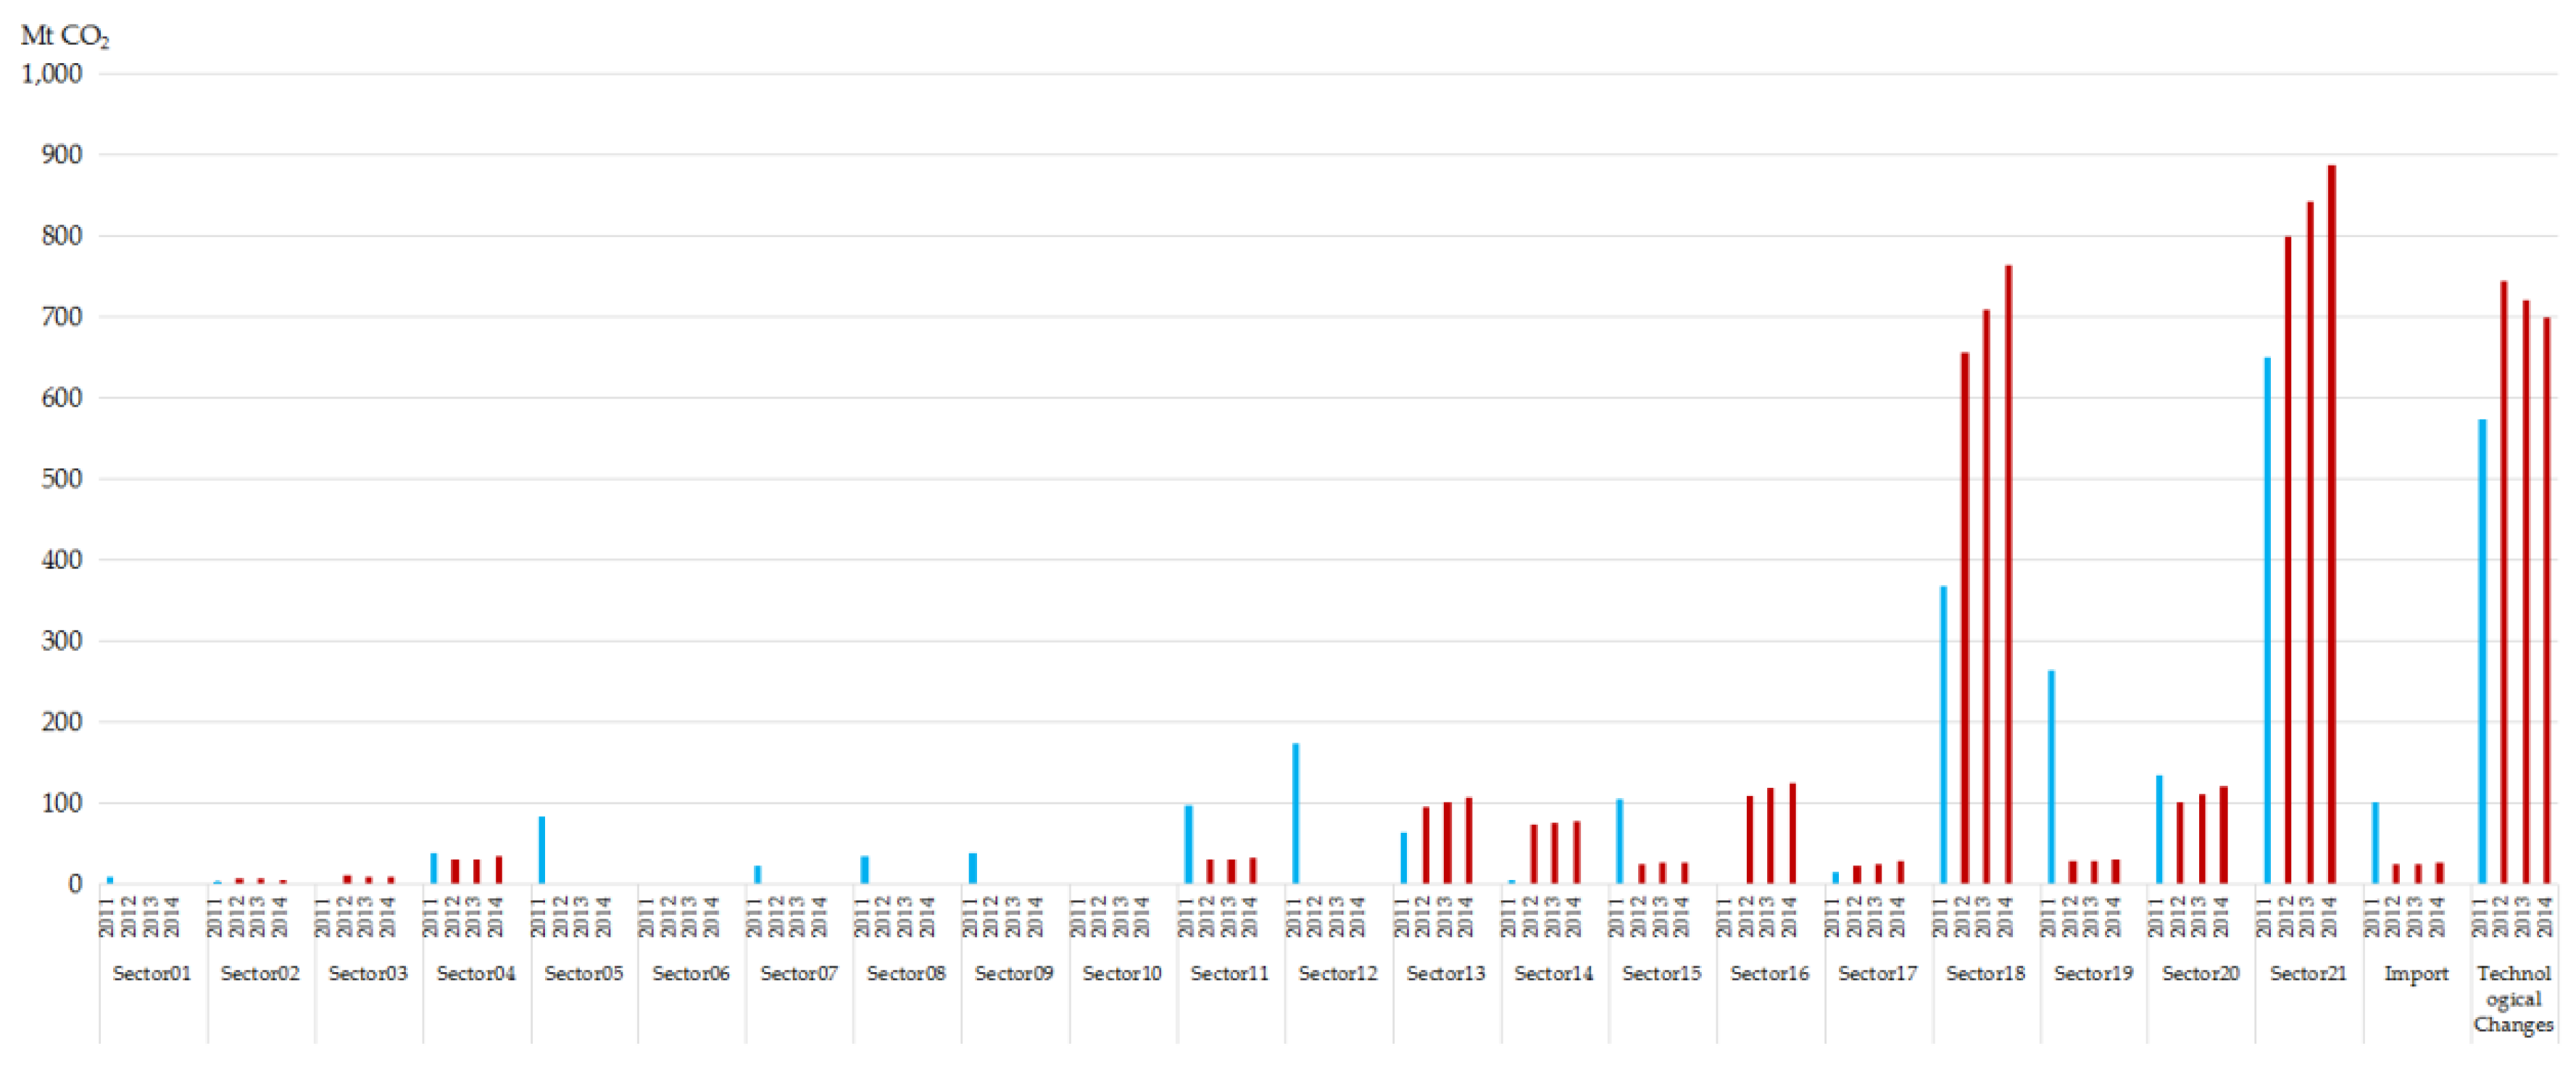
4.3.2. Comparisons with the Results from 2012 to 2015

To compare with the new development in China, we update the analysis results of decomposing ERCE embodied in CSFAI to various sectors from the perspective of consumer responsibility from 2012 to 2015, as shown in Figure 4.
After 2012, the main reasons for China’s ERCE embodied in CSFAI are the increase in the FDEI of sector 21 (Other Tertiary Industry), the increase in the FDEI of sector 18 (Construction) and technological changes. The proportion of ERCE embodied in CSFAI caused by these three factors in total ERCE embodied in CSFAI increases from 57% in 2011–2012 to 79% in 2014–2015. This shows that restricting the increase of FDEI in sector 18 (Construction) and 21 (Other Tertiary Industry) is more important for reducing ERCE embodied in CSFAI in 2012 to 2015.
Compared with the results of 2011–2012, the changes of ERCE embodied in CSFAI caused by the increase of FDEI in five sectors were more than 100 Mt in 2012 to 2015, which were sector 12 (Machinery), 16 (Other Manufacture), 18 (Construction), 19 (Transport) and 21 (Other Tertiary Industry), respectively. The ERCE embodied in CSFAI caused by the increase of FDEI in sector 12 (Machinery) and 19 (Transport) in 2012 to 2015 is less than it in 2011–2012, whereas the ERCE embodied in CSFAI caused by the increase of FDEI in sector 16 (Other Manufacture), 18 (Construction) and 21 (Other Tertiary Industry) increases in 2012 to 2015. Although the results have changed, the main conclusion of distributing the responsibilities of ERCE embodied in consumption services from the perspective of consumer responsibility in 2012 to 2015 is basically consistent with those in 2007 to 2012, which is that sector 18 (Construction) and 21 (Other Tertiary Industry) bear the highest responsibility for China’s ERCE embodied in construction services, and should be given priority attention in reducing ERCE embodied in construction services.

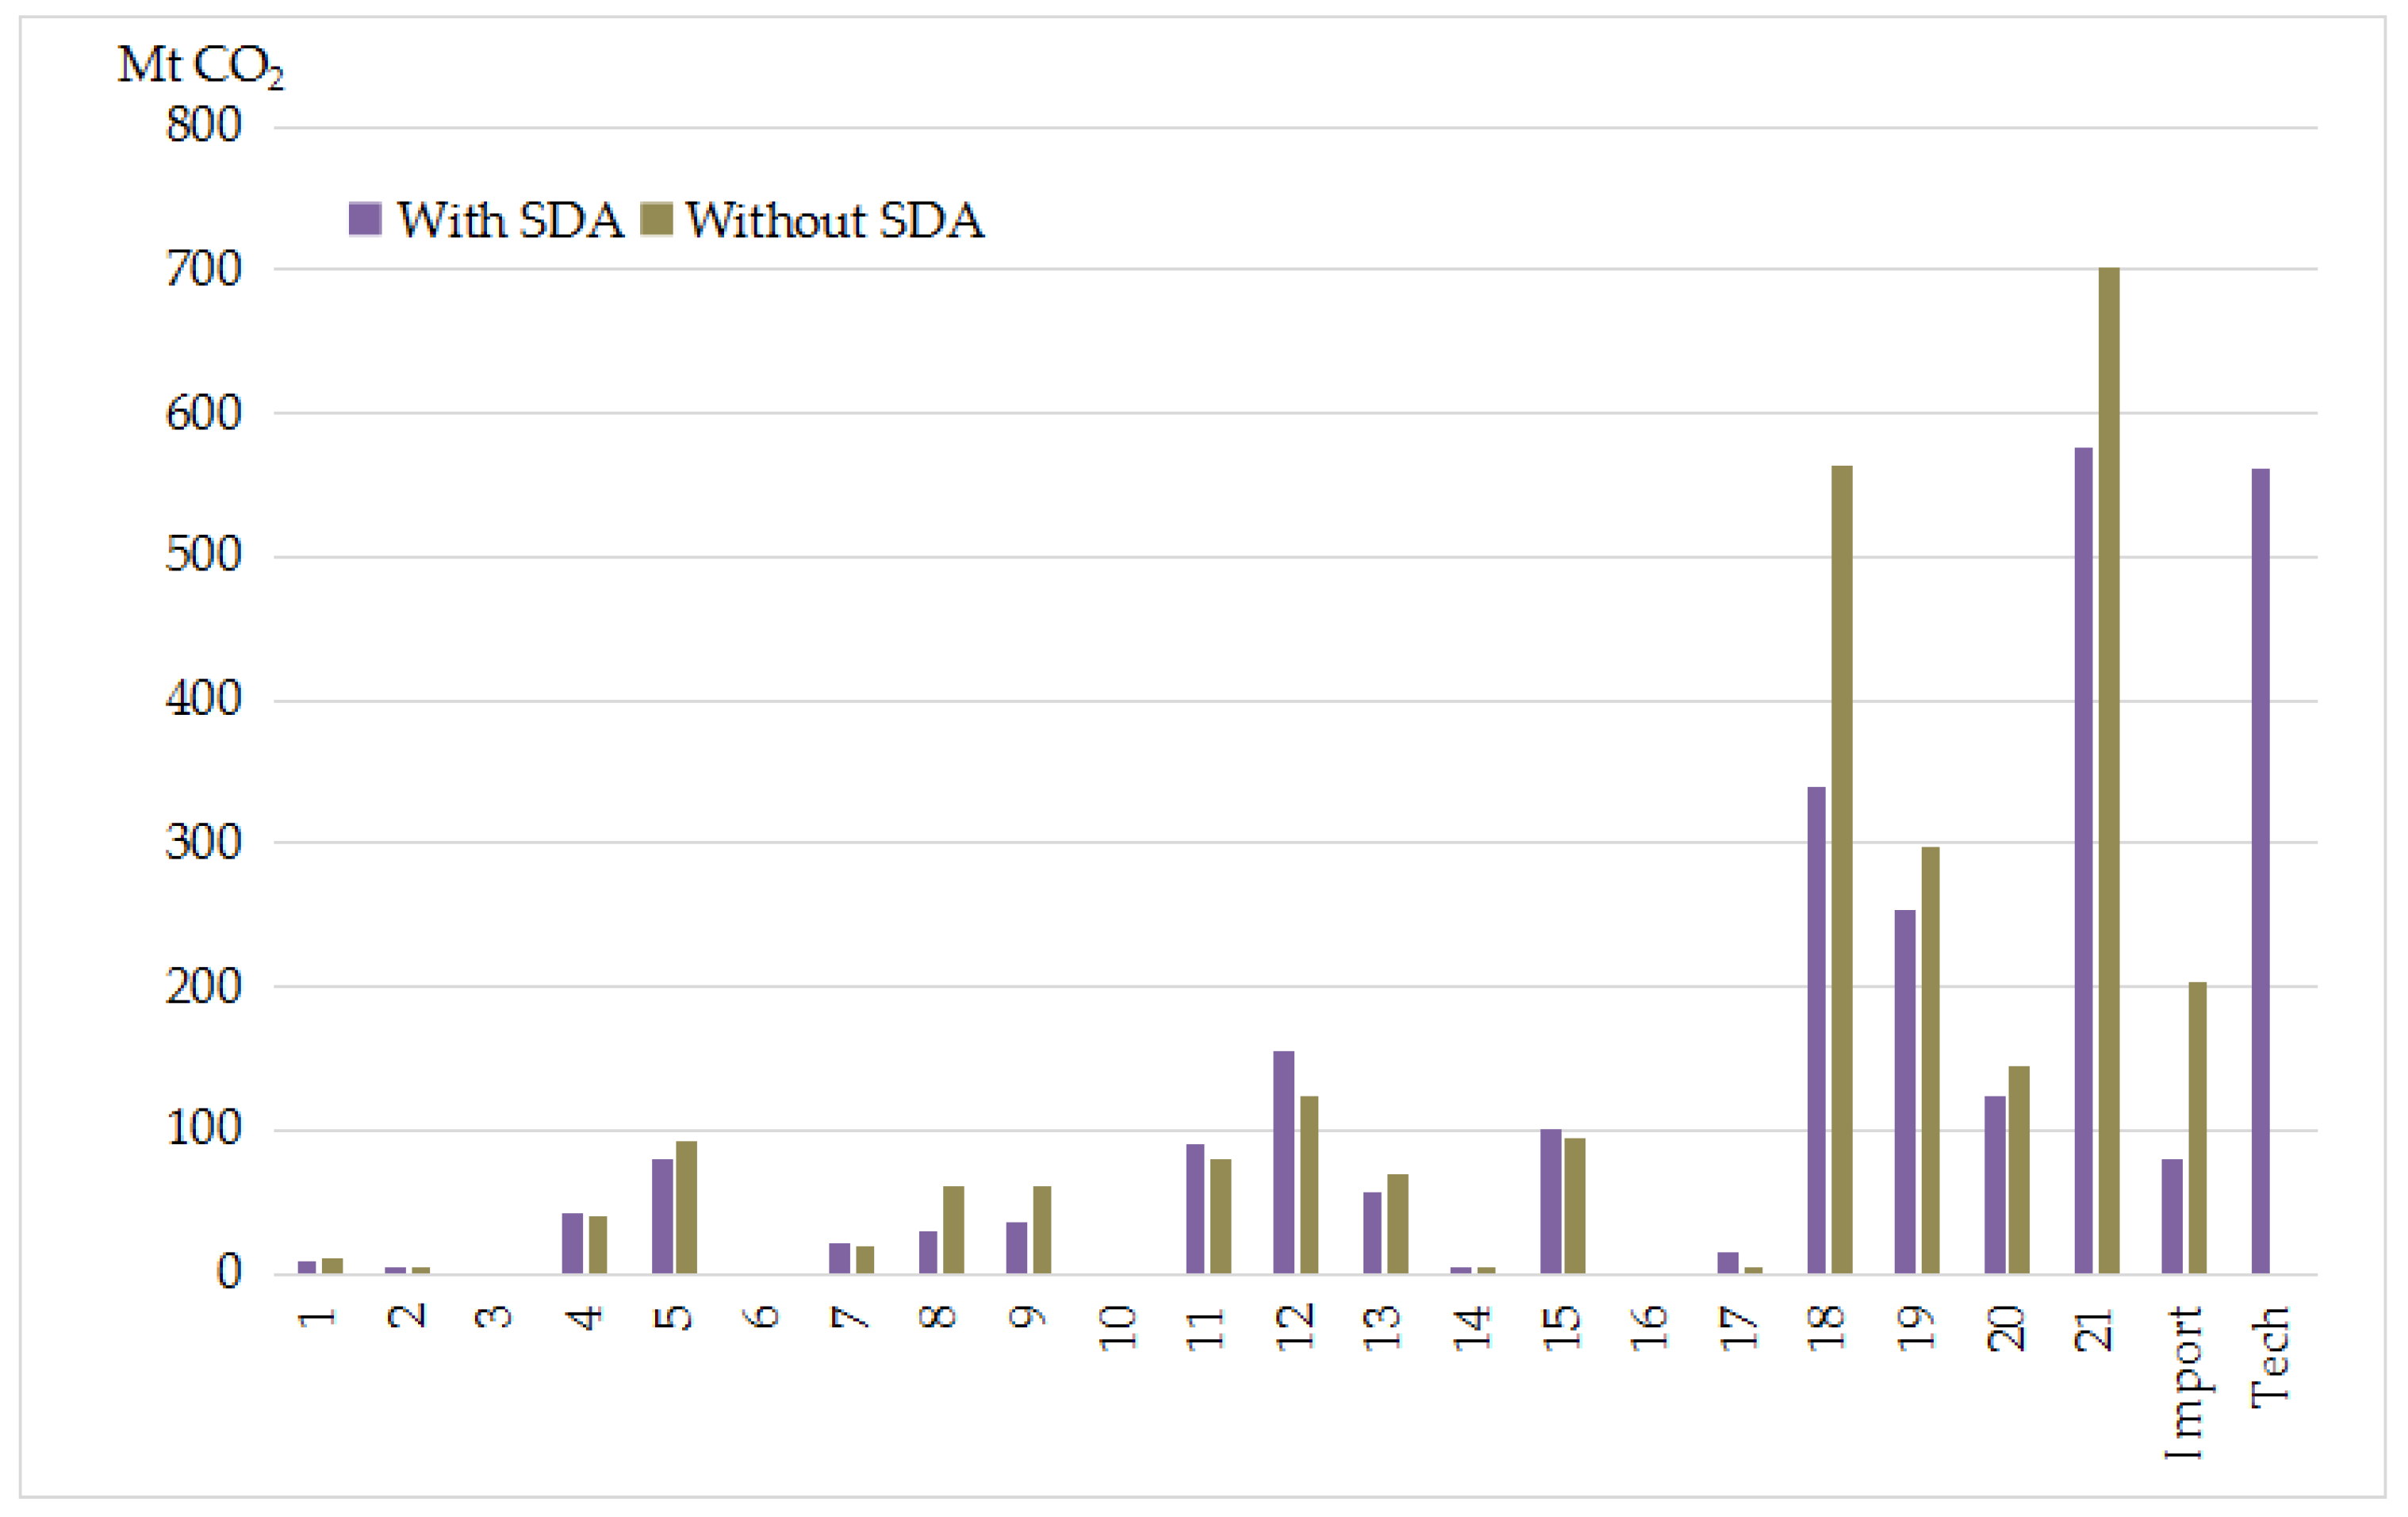
4.3.3. Comparison of DHI/O and DHI/O-SDA Models

The purpose of our paper is to observe the responsibility of ERCE embodied in CSFAI caused by the final demand increase of each sector. However, the construction services will be caused by technological changes and the increase of sectoral final demand at the same time. Therefore, it is necessary to remove the impact of technological changes on construction services. SDA was used to remove the impact of technological changes by distinguishing the output increase caused by the final demand increase of various sectors and the output increase caused by technological changes. Without the SDA, the total output increase caused by technological changes would be apportioned to the total output increase caused by the change in final demand, and the ERCE embodied in the CSFAI caused by final demand increase would contain an uncertain proportion of influence due to technological changes. This coupling of impacts would prevent policymakers from analyzing the impact of the increased final demand of each sector on construction services and the ERCE caused by construction services.
We used China in 2010–2011 as an example to illustrate the difference between with and without SDA in the DHI/O model to estimate the ERCE embodied in the CSFAI, as shown in Figure 5. Here, the results of most sectors are affected by the SDA method. Without SDA, the estimation of ERCE embodied in the CSFAI of sector 08 (Non–metallic), sector 09 (Chemical), sector 18 (Construction), sector 21 (Other Tertiary Industry), and Import are significantly higher, and the impact of technology changes cannot be analyzed.

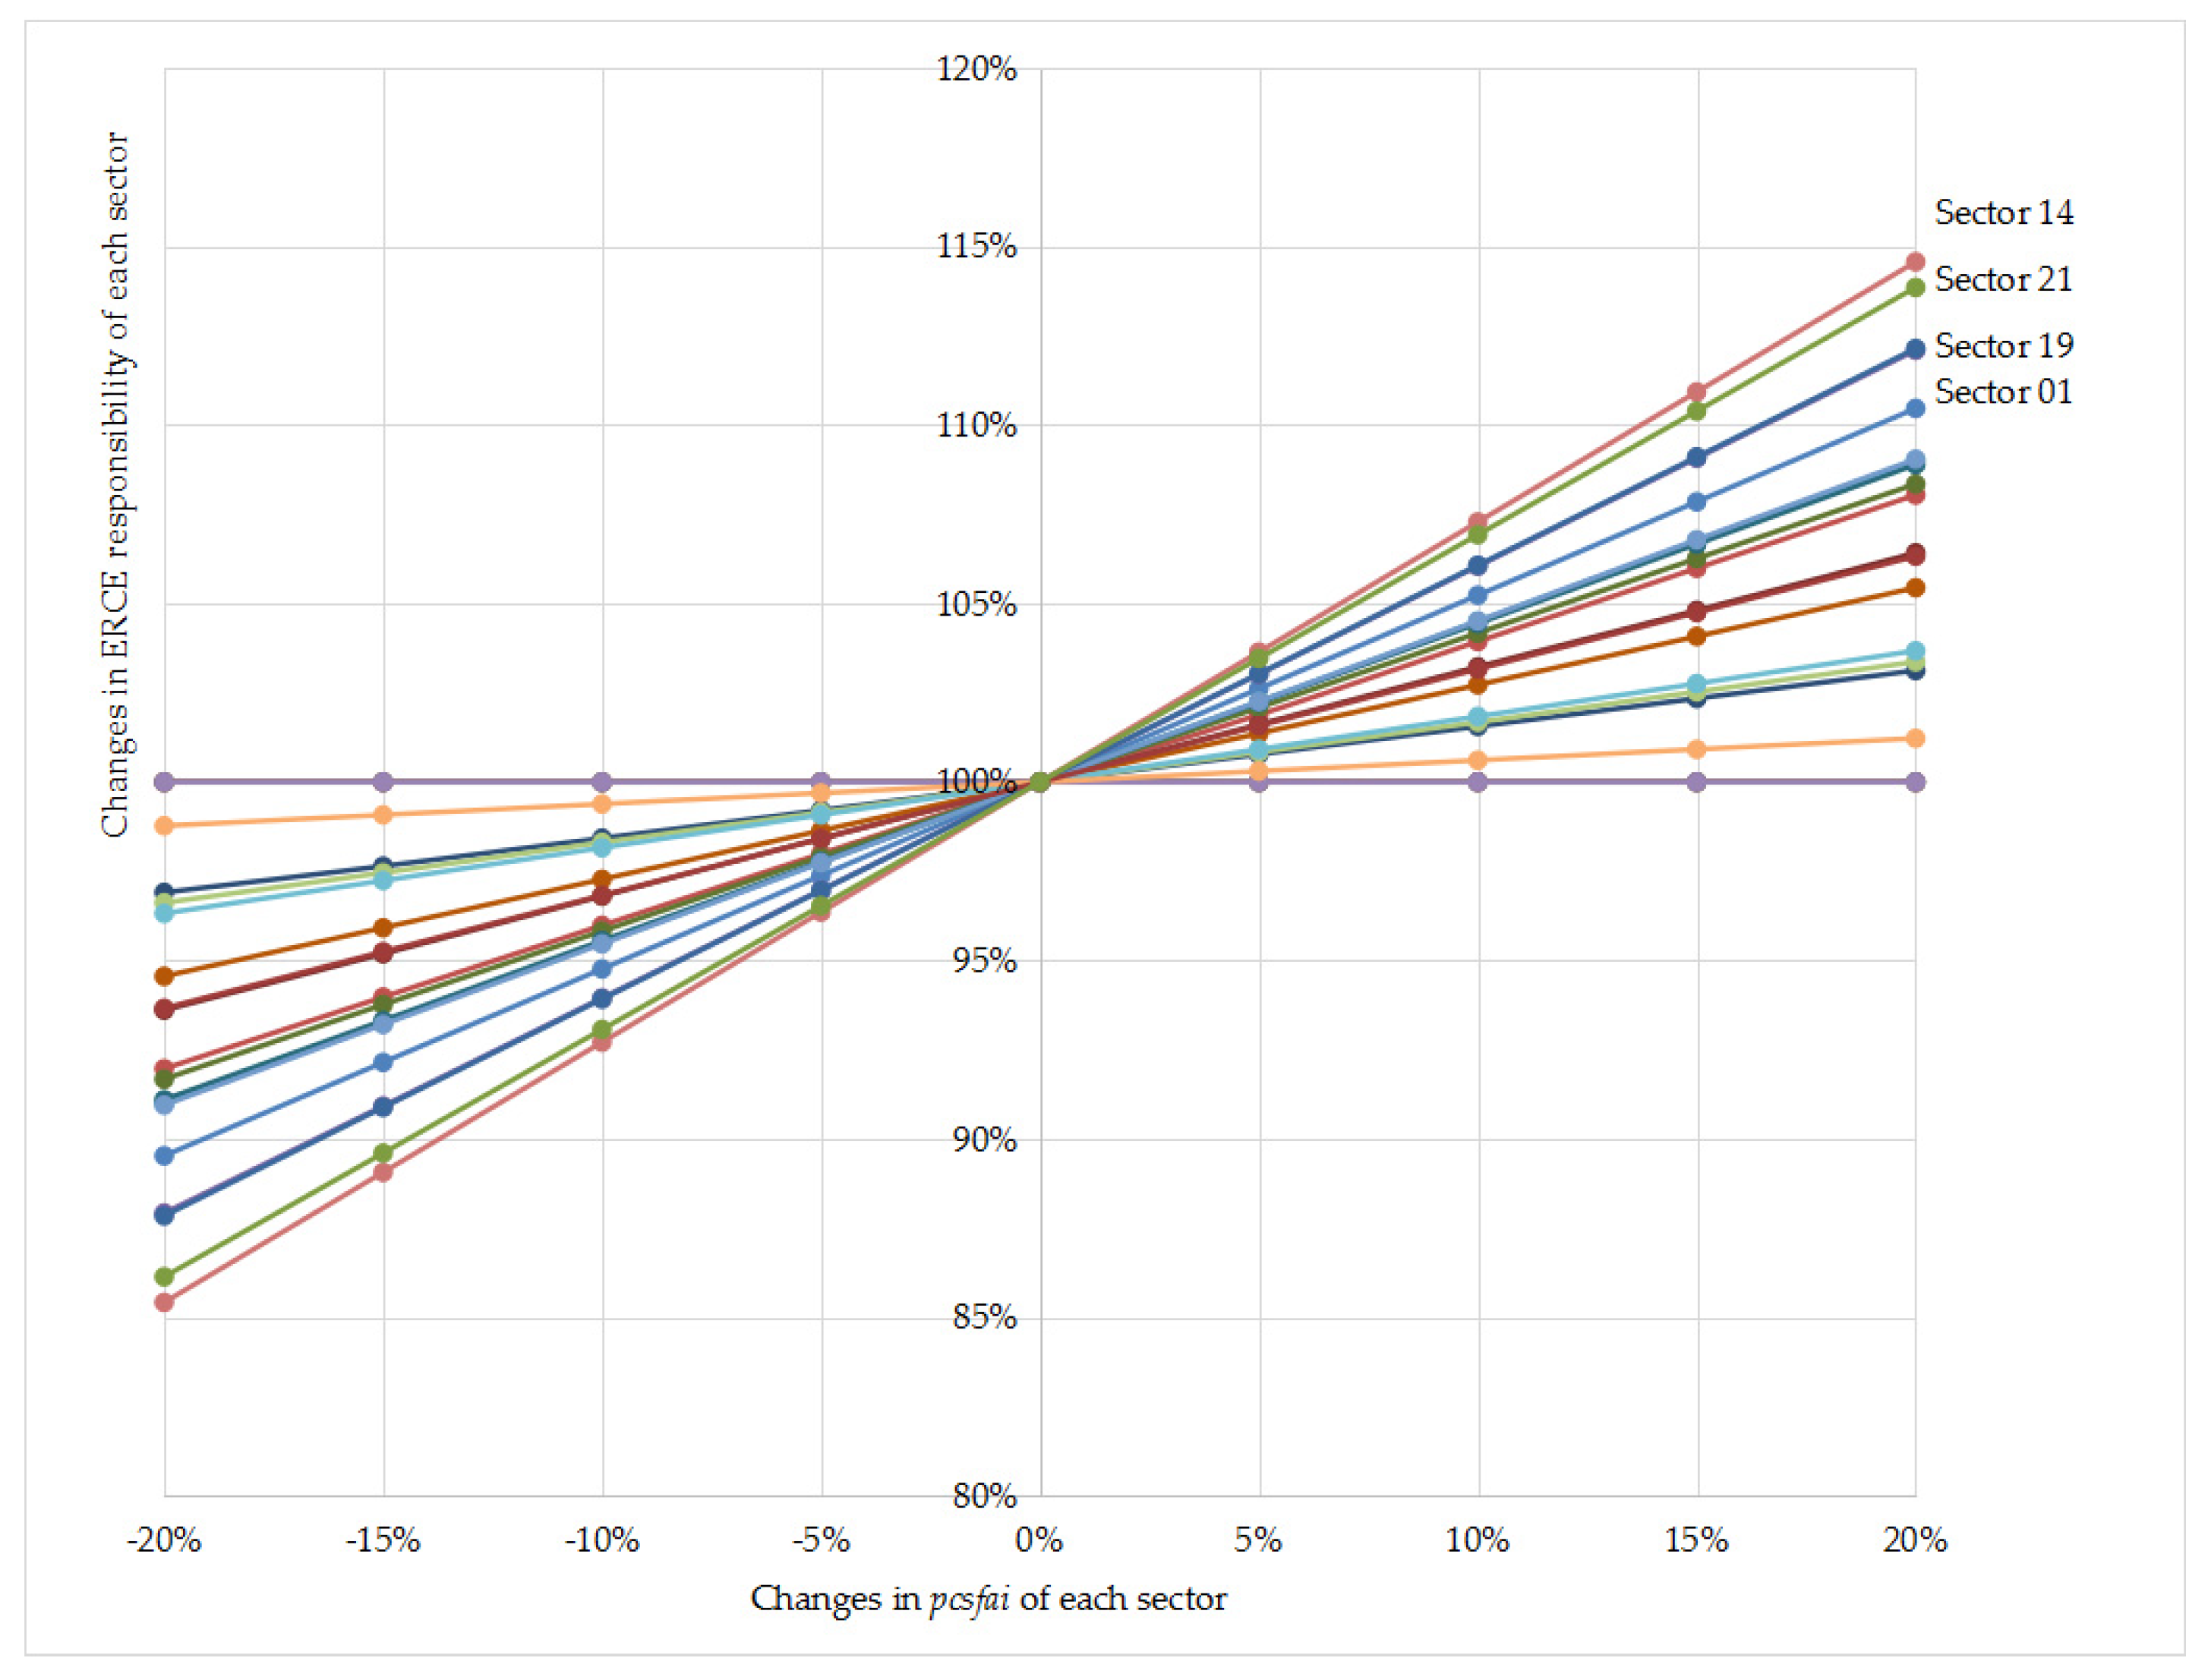
4.3.4. Sensitivity Analysis of pcsfait

The pcsfait of various sectors was assumed to be the same as that of sector 04 (Electric Power), which is a relatively common sector that directly influences the CSFAI. We analyzed the sensitivity of each sector’s pcsfait to the ERCE embodied in the CSFAI caused by the sector in 2010–2011, which is the ERCE responsibility of each sector from the consumer side, as shown in Figure 6.
The influence is linear and the ERCE embodied in the CSFAI increases with pcsfait. The results show that an influence of a 20% change in pcsfait in most sectors will cause changes of less than 10% in the ERCE responsibility of the sector. The ERCE embodied in the CSFAI caused by sectors 14 (Textile), 21 (Other Tertiary Industry), 19 (Transport), and 01 (Coal) are most affected by changes in pcsfait. Therefore, for some sectors, pcsfait has an impact on their ERCE responsibilities, so we should estimate the pcsfait of each sector as accurately as possible. For 9 of the 21 sectors, the changes in pcsfait have little effect on their ERCE responsibilities (changes less than 5%), so they can be said to be insensitive to changes in pcsfait.

4.3.5. Statistical Error Analysis

The statistical errors in this paper mainly come from the errors of input–output tables and energy balance tables published by NBS. The errors of input–output tables are mainly caused by the unequal total input and output of each sector in the table, whereas the errors of energy balance tables are mainly caused by the difficulty in accurately measuring losses in energy conversion, utilization and transportation. In this paper, we deal with the errors as one of the final demands in the DHI/O-SDA model. There are two advantages of this treatment. First, it guarantees the balance of input and output in the input-output tables and energy balance tables. Second, the position of the errors in this model is consistent with it in the original input–output tables and energy balance tables, without introducing new assumptions and errors. However, this will inevitably lead to some errors in the intermediate production of some sectors to be calculated as errors in the final demand, which will result in the inaccurate estimation of the direct input matrix A. The calculation based on matrix A will have different degrees of errors. Because there is a strong correlation between the input and output of each sector in the input–output model, statistical errors of any sector may affect the calculation results of all sectors in the model.

4.3.6. Limitations of the DHI/O-SDA Model

In addition to the common limitations of the hybrid input–output model, the DHI/O-SDA model has two main limitations, corresponding to its main assumptions. The first limitation is that some of the fixed assets may not be installed in one time step, as assumed in this study. Some fixed assets are invested to meet the final demand increases of the next several time steps. To simulate this phenomenon, it is necessary to set a construction delay in the fixed assets and to classify the CSFAI into several categories caused by the final demand increase in various time steps. This approach requires using a ratio to determine the quantities in each CSFAI category. With more detailed data and longer time series data, these multiple time step influences on CSFAI could be analyzed by a multiple time delay model, which would give a full view of the energy consumption and ERCE embodied in the CSFAI from time series. The development and testing of multiple time delay models could be the subject of future research work.
The second limitation is that the DHI/O-SDA model does not take into account the changes in capacity utilization rate in various sectors. We assume that the capacity utilization rate of each sector has always been constant, so when the production demand increases, sectors need to consume construction services to meet the higher production demand. However, there is another way for sectors to meet higher production demand, which is to maintain the existing production capacities but increasing capacity utilization rate. To introduce the influence of capacity utilization rate on the quantities of construction services consumed by various sectors in the model, it is necessary to establishing mathematical relations between the capacity utilization rate of each sector and its production demand gap. The model with these relations can better reflect the changes in energy consumption and ERCE embodied in construction services of the economy caused by the increase of sectoral final demand. This will also be another subject direction of improving this DHI/O-SDA model.

5. Conclusions and Policy Implications

A DHI/O-SDA model was proposed in this paper. Using this model, the ERCE of construction services (or CSFAI) due to the final demand increase in various sectors and technological changes can be estimated, and the key sector for reducing the ERCE embodied in construction services can be identified. The ERCE embodied in construction services consumed by each sector caused by a unit of development in each sector can be analyzed in the horizontal and vertical directions. This analysis can reveal several sectoral interrelationships.
China in 2007–2012 was used as a case study to demonstrate our DHI/O-SDA model. The main findings by the DHI/O-SDA model, which can’t be revealed by previous models, are: (1) the final demand increase in sector 21 (Other Tertiary Industry) was the main cause of the ERCE embodied in construction services. (2) For most sectors in China, a FDEI increase in one sector causes the greatest ERCE embodied in construction services consumed by the same sector. A FDEI increase in most sectors causes a relatively high ERCE embodied in construction services consumed by sector 21 (Other Tertiary Industry). (3) The vertical analysis of model results for a target sector provide data support for formulating policies for reducing the ERCE embodied in construction services.
The Chinese government has realized the importance of reducing construction services for energy conservation and ERCE reduction. It has published extremely strict policies to restrict capacity expansion in the major industries providing construction services (such as the steel industry and the cement industry) in order to restrict the continued consumption of construction services in these industries. For example, China’s State Council has issued two policies that strictly prohibit new production capacity in the steel industry [41] and cement industry [42]. These policies are reasonable in China, because the capacity utilization rate of these industries is not saturated. However, if China continues to build infrastructure and let the tertiary industries such as real estate develop at a rapid pace as in recent years, it is debatable whether it is appropriate to continue to implement these policies. First, after the capacity utilization rate of the steel industry and the cement industry has reached saturation, these two industries must consume construction services to provide more products to meet the increased final demand of other sectors. Second, the effect of simply preventing the steel industry and the cement industry from consuming construction services to reduce energy consumption and ERCE embodied in construction services may not be as effective as controlling the increase in final demand of tertiary industries such as real estate. Our paper can provide quantitative data support for this debate. The DHI/O-SDA model can estimate the amount of construction services that the steel industry and the cement industry must consume as final demand increases in other sectors after capacity utilization rate is saturated, and the energy consumption and carbon emissions embodied in the construction services. The results show that for reducing the ERCE embodied in construction services consumed by one specific sector, we must analyze all the sectors that affect the specific sector and implement a systematic control policy, rather than just restrict the FDEI of the specific industry itself.
Considering the significant regional disparity in energy and industry development across the world, future application of the DHI/O-SDA model in other developing regions would be insightful. The model can be modified to include a multiple time delay function. Another potential future study would involve building mathematical relations between the capacity utilization rate of each sector and its production demand gap in the model. The model can also be used in forecasting energy consumption and the ERCE embodied in construction services caused by various influencing factors.

Author Contributions

Data curation, X.Z.; Methodology, X.Z., Z.L., and L.M.; Writing—original draft, X.Z. and L.M.; Writing—review & editing, X.Z., Z.L., L.M., C.C., and W.N.

Funding

This work was supported by the National Natural Science Foundation of China (Project No. 71690245).

Acknowledgments

The authors gratefully acknowledge financial support from BP Company in the context of the Phase II and III collaboration between BP and Tsinghua University.

Conflicts of Interest

The authors requested to avoid reviewers who are not familiar with China’s energy and economic development situation.

Abbreviations

CO2Carbon dioxide
CSFAIConstructive Services-related Fixed Assets Investment
DHI/ODynamic Hybrid Input–output
DHI/O-SDA modelDynamic Hybrid Input–output model combined with Structural Decomposition Analysis
ERERCE embodied in CSFAI consumed by each sector caused by a unit of final demand increase in any specific sector
ERCEEnergy-related Carbon Emission
FDEIFinal Demand Excluding Import
IPCCIntergovernmental Panel on Climate Change
NBSNational Bureau of Statistics
pcsfaiRatio of CSFAI to the total fixed assets investment
PECProportion of ER in the TE caused by a unit of final demand increase of any specific sector
SDAStructural Decomposition Analysis
TESum of ER in each sector caused by a unit of final demand increase of any specific sector

Appendix A

The original input–output tables for 2007, 2010, and 2012 have 135, 42, and 139 sectors respectively. However, the sectors in the original input–output table do not match those in the energy balance table. Thus, in this study, the sectors were merged into 21 sectors to match the energy balance table, as shown in Table A1.
Table A1. Sector setting.
Sector (Full Name)Sector (Abbreviation)Code in This PaperCode in I/O Table, 2007Code in I/O Table, 2010Code in I/O Table, 2012
Mining and Washing of CoalCoal010060206006
Extraction of Petroleum and Natural GasPetroleum and Natural Gas020070307007
Processing of Petroleum, Coking, and Processing of Nuclear FuelPetroleum Processing030371125039
03825040
Production and Supply of Electric Power, Heat Power, and GasElectric Power040922344096
0932445097
Agriculture, Forestry, Animal Husbandry, and FishingAgriculture050010101001
00202002
00303003
00404004
Smelting and Pressing of Ferrous MetalsFerrous Metals060571431059
31060
31061
058
059
060
062 32063
Manufacture of Raw Chemical Materials and Chemical ProductsChemical090391226041
04026042
04126043
04226044
04326045
04426046
04526047
04627048
04728049
04829050
04929051
Non-Energy MiningMining of Non-energy1000804
05
08008
00909009
01010010
Manufacture of Foods, Drinks, and TobaccoFoods110110613012
01213013
01313014
01413015
01513016
01613017
01713018
01814019
01914020
Manufacture of MachineryMachinery12064
065
066
067
068
069
070
071
072
1634065
34066
34067
34068
34069
34070
35071
35072
35073
35074
Manufacture of Automobiles, Railway, Ship, Aerospace, and Other EquipmentAutomobiles13073
074
075
076
1736075
36076
37077
37078
37079
Manufacture of Textile, Apparel, Accessories, Leather, Fur, Feather, and Related Products, and FootwearTextile14025
026
027
028
029
030
031
07
08
17026
17027
17028
17029
17030
18031
19032
19033
Manufacture of Paper; Paper Products; Articles for Culture, Education, and Arts and Crafts; and Printing and Reproduction of Recording MediaPaper150341022036
03523037
03624038
Wholesale, Retail Trade, and Hotel, RestaurantsWholesale2010830
31
51103
10961112
11062113
122 77126
12378127
12479128
12580129
12682130
12783131
12884132
12985133
13086134
13187135
13288136
13389137
13493138
13590139

Appendix B

The results of the ERCE embodied in the CSFAI consumed by each sector caused by a unit of final demand increase of a specific sector of China are provided in Table A2.
Table A2. The ERCE embodied in the CSFAI consumed by each sector caused by a unit of final demand increase in a specific sector in China.
2007–2008
Sector010203040506070809101112131415161718192021
Caused by sector 012.280.070.070.470.050.170.060.030.160.050.030.140.030.090.030.230.050.000.520.110.85
Caused by sector 020.051.640.070.340.030.150.040.020.140.040.020.120.030.080.030.160.030.000.270.080.57
Caused by sector 030.311.241.490.600.040.150.050.030.210.040.040.150.030.090.040.200.040.000.480.130.83
Caused by sector 040.440.090.074.940.030.080.050.020.110.030.030.070.030.080.030.260.030.000.280.080.87
Caused by sector 050.040.050.050.241.540.030.020.010.280.020.210.040.020.040.030.070.020.000.250.080.60
Caused by sector 060.000.000.000.000.000.000.000.000.000.000.000.000.000.000.000.000.000.000.000.000.00
Caused by sector 070.000.000.000.000.000.000.000.000.000.000.000.000.000.000.000.000.000.000.000.000.00
Caused by sector 080.000.000.000.000.000.000.000.000.000.000.000.000.000.000.000.000.000.000.000.000.00
Caused by sector 090.120.140.110.810.130.080.060.032.430.080.080.090.030.170.090.190.050.000.490.140.99
Caused by sector 100.070.070.070.510.040.090.060.040.281.480.030.160.040.100.040.220.040.000.550.110.76
Caused by sector 110.050.050.050.320.760.040.020.020.270.021.720.040.020.070.090.100.030.000.410.130.79
Caused by sector 120.090.130.150.570.060.470.200.040.310.140.051.590.050.130.060.530.090.000.530.181.01
Caused by sector 130.080.120.120.540.070.370.160.040.380.110.060.281.260.210.060.430.090.000.500.201.08
Caused by sector 140.080.060.060.580.330.050.030.020.530.030.140.070.026.320.090.150.040.000.450.141.12
Caused by sector 150.090.080.070.670.170.090.070.020.620.050.070.090.040.332.390.270.200.000.480.160.99
Caused by sector 160.090.100.110.610.080.280.320.050.420.130.060.150.040.190.082.230.090.000.500.181.14
Caused by sector 170.050.050.050.370.210.090.040.020.340.030.060.060.020.230.060.161.830.000.380.110.74
Caused by sector 180.090.130.140.490.060.360.100.290.300.140.050.140.040.130.060.350.090.290.840.171.02
Caused by sector 190.000.000.000.000.000.000.000.000.000.000.000.000.000.000.000.000.000.000.000.000.00
Caused by sector 200.040.050.050.240.170.030.020.010.140.020.220.040.030.120.060.110.030.000.531.901.23
Caused by sector 210.040.040.050.250.060.050.040.020.240.020.050.050.030.140.110.200.040.000.330.157.23
2008–2009
ERCE of Sector010203040506070809101112131415161718192021
Caused by sector 012.240.070.070.410.060.170.060.030.170.050.030.150.030.090.030.230.050.000.510.110.84
Caused by sector 020.051.830.070.340.030.160.040.020.160.050.030.140.030.080.030.170.030.000.280.090.59
Caused by sector 030.341.381.620.580.050.160.050.030.220.050.050.160.040.100.040.210.040.000.470.130.86
Caused by sector 040.490.110.084.960.040.090.050.020.130.030.030.080.030.080.030.280.030.000.290.090.94
Caused by sector 050.040.050.050.231.920.030.020.010.300.020.230.040.020.050.030.070.020.000.270.090.60
Caused by sector 060.000.000.000.000.000.000.000.000.000.000.000.000.000.000.000.000.000.000.000.000.00
Caused by sector 070.000.000.000.000.000.000.000.000.000.000.000.000.000.000.000.000.000.000.000.000.00
Caused by sector 080.000.000.000.000.000.000.000.000.000.000.000.000.000.000.000.000.000.000.000.000.00
Caused by sector 090.120.150.120.770.170.080.060.032.610.090.090.100.030.180.090.210.050.000.520.161.08
Caused by sector 100.070.070.080.490.050.110.060.040.301.620.040.190.040.100.040.240.040.000.560.130.81
Caused by sector 110.050.050.050.310.970.040.030.020.290.021.860.050.020.080.100.110.030.000.440.150.85
Caused by sector 120.100.150.160.570.080.520.220.050.330.160.061.700.060.140.060.580.080.000.560.201.11
Caused by sector 130.090.130.130.530.090.400.180.040.410.130.060.301.350.220.060.460.080.000.530.221.17
Caused by sector 140.080.070.060.560.440.060.040.020.560.030.160.080.036.760.100.160.040.000.470.151.14
Caused by sector 150.110.090.080.670.220.110.080.030.670.060.080.100.040.362.620.350.190.000.520.181.10
Caused by sector 160.090.110.110.600.110.300.340.060.440.150.070.160.040.200.092.380.080.000.520.201.23
Caused by sector 170.060.060.060.410.300.100.050.030.400.040.070.070.030.270.080.192.260.000.440.130.88
Caused by sector 180.100.140.150.470.080.370.100.320.320.150.060.150.040.140.060.370.090.290.890.191.09
Caused by sector 190.000.000.000.000.000.000.000.000.000.000.000.000.000.000.000.000.000.000.000.000.00
Caused by sector 200.040.050.050.230.220.030.020.010.140.020.240.040.030.120.060.100.030.000.512.061.20
Caused by sector 210.040.050.050.240.070.050.040.020.260.030.050.060.030.150.110.210.040.000.350.167.62
2009–2010
Sector010203040506070809101112131415161718192021
Caused by sector 011.660.060.060.340.050.140.050.020.140.040.030.120.030.070.030.190.040.000.500.100.71
Caused by sector 020.041.490.060.300.030.130.040.020.140.040.020.120.020.070.020.140.020.000.280.080.52
Caused by sector 030.271.121.380.510.050.130.040.030.190.040.040.140.030.080.030.170.030.000.460.120.74
Caused by sector 040.390.090.074.500.040.070.040.020.110.030.030.070.030.070.030.230.020.000.300.080.85
Caused by sector 050.030.040.040.191.770.020.010.010.250.010.200.030.010.040.030.060.010.000.270.080.50
Caused by sector 060.000.000.000.000.000.000.000.000.000.000.000.000.000.000.000.000.000.000.000.000.00
Caused by sector 070.000.000.000.000.000.000.000.000.000.000.000.000.000.000.000.000.000.000.000.000.00
Caused by sector 080.000.000.000.000.000.000.000.000.000.000.000.000.000.000.000.000.000.000.000.000.00
Caused by sector 090.100.110.100.670.170.070.060.032.190.070.080.090.030.150.080.180.030.000.530.150.98
Caused by sector 100.060.060.060.420.050.100.060.040.251.300.030.170.040.090.030.210.030.000.560.120.71
Caused by sector 110.040.040.040.270.910.030.020.020.250.021.570.040.020.060.080.100.020.000.450.140.75
Caused by sector 120.080.120.130.510.070.450.190.040.280.140.051.430.050.120.050.490.050.000.580.191.00
Caused by sector 130.070.100.110.480.080.340.150.040.340.110.050.251.140.190.050.390.060.000.540.211.06
Caused by sector 140.060.050.050.490.430.050.030.020.460.030.140.060.025.670.080.140.030.000.480.140.97
Caused by sector 150.090.070.070.600.210.100.080.020.560.050.070.090.040.302.250.350.120.000.550.171.01
Caused by sector 160.070.090.090.530.100.250.280.050.370.130.060.140.030.170.071.990.050.000.530.191.11
Caused by sector 170.060.060.060.410.310.100.040.030.380.040.070.070.030.260.080.192.210.000.510.140.89
Caused by sector 180.080.120.130.410.080.300.090.270.260.120.050.120.030.110.050.310.070.250.920.170.97
Caused by sector 190.000.000.000.000.000.000.000.000.000.000.000.000.000.000.000.000.000.000.000.000.00
Caused by sector 200.030.040.040.200.200.030.020.010.110.010.210.030.020.090.050.080.020.000.471.870.98
Caused by sector 210.030.040.040.210.060.040.030.010.220.020.040.040.030.120.090.170.030.000.360.156.68
2010–2011
ERCE of Sector010203040506070809101112131415161718192021
Caused by sector 012.520.050.060.270.040.150.020.030.140.060.040.130.070.100.010.300.010.000.320.050.45
Caused by sector 020.121.440.070.270.030.140.020.030.150.060.030.140.060.100.010.240.010.000.200.040.43
Caused by sector 030.000.000.000.000.000.000.000.000.000.000.000.000.000.000.000.000.000.000.000.000.00
Caused by sector 040.650.090.094.070.030.080.020.020.110.040.040.070.070.100.010.410.010.000.220.050.54
Caused by sector 050.050.030.050.171.440.030.010.010.290.020.290.040.040.060.010.100.000.000.200.050.31
Caused by sector 060.000.000.000.000.000.000.000.000.000.000.000.000.000.000.000.000.000.000.000.000.00
Caused by sector 070.180.080.100.880.050.120.830.070.280.660.060.140.090.150.020.450.030.000.380.080.66
Caused by sector 080.230.100.130.530.060.140.031.900.380.250.070.140.100.190.040.450.020.000.480.090.62
Caused by sector 090.160.110.120.600.140.080.030.052.480.110.130.100.080.260.030.310.010.000.410.090.65
Caused by sector 100.000.000.000.000.000.000.000.000.000.000.000.000.000.000.000.000.000.000.000.000.00
Caused by sector 110.070.040.050.230.730.040.010.030.270.032.240.040.050.100.030.160.010.000.350.090.48
Caused by sector 120.130.110.160.460.060.520.100.070.320.230.071.790.150.180.020.920.020.000.450.110.70
Caused by sector 130.120.100.130.430.070.380.080.070.380.180.080.283.830.300.020.720.020.000.430.120.73
Caused by sector 140.100.050.060.440.340.050.010.030.510.040.200.070.069.070.030.230.010.000.370.100.63
Caused by sector 150.140.070.080.530.170.100.050.040.620.090.100.100.100.540.920.570.040.000.420.100.67
Caused by sector 160.000.000.000.000.000.000.000.000.000.000.000.000.000.000.000.000.000.000.000.000.00
Caused by sector 170.090.060.070.380.250.110.020.040.430.060.110.080.080.410.030.360.820.000.400.080.59
Caused by sector 180.130.110.150.370.060.370.040.450.300.200.070.140.100.180.020.570.030.310.640.090.69
Caused by sector 190.110.200.280.240.070.090.020.030.180.050.070.100.340.170.020.250.010.004.760.080.77
Caused by sector 200.050.030.040.170.150.030.010.010.120.020.270.030.060.130.020.140.010.000.321.040.66
Caused by sector 210.050.040.050.190.050.050.020.020.240.040.070.050.090.190.040.320.010.000.280.084.21
2011–2012
ERCE of Sector010203040506070809101112131415161718192021
Caused by sector 013.110.050.080.290.040.180.020.040.170.070.050.140.060.120.010.340.020.000.270.060.70
Caused by sector 020.261.730.070.280.030.160.020.030.180.060.050.140.060.110.010.280.010.000.200.060.84
Caused by sector 030.000.000.000.000.000.000.000.000.000.000.000.000.000.000.000.000.000.000.000.000.00
Caused by sector 040.810.110.114.520.030.100.020.030.140.050.050.080.060.100.010.530.010.000.220.060.75
Caused by sector 050.060.040.060.171.770.030.010.010.380.020.380.040.040.070.010.100.000.000.190.060.42
Caused by sector 060.000.000.000.000.000.000.000.000.000.000.000.000.000.000.000.000.000.000.000.000.00
Caused by sector 070.220.090.120.920.070.131.090.090.360.710.080.120.080.190.020.410.080.000.370.090.92
Caused by sector 080.270.120.160.560.070.160.042.550.480.320.090.160.110.260.040.490.020.000.480.110.88
Caused by sector 090.200.130.160.620.190.080.030.053.210.110.190.100.070.370.030.320.010.000.430.130.91
Caused by sector 100.000.000.000.000.000.000.000.000.000.000.000.000.000.000.000.000.000.000.000.000.00
Caused by sector 110.070.050.060.230.870.040.010.030.320.032.860.050.050.120.030.160.010.000.360.130.62
Caused by sector 120.150.130.190.470.070.610.130.080.410.260.102.400.190.230.031.190.030.000.470.151.05
Caused by sector 130.140.110.160.440.080.450.120.090.470.210.100.305.170.370.020.890.030.000.480.171.06
Caused by sector 140.120.060.080.460.390.050.020.030.640.040.240.070.0611.620.030.240.010.000.380.180.90
Caused by sector 150.150.070.100.530.210.100.100.040.740.110.130.090.080.801.180.450.070.000.430.140.92
Caused by sector 160.000.000.000.000.000.000.000.000.000.000.000.000.000.000.000.000.000.000.000.000.00
Caused by sector 170.100.060.080.350.280.100.030.050.490.060.130.090.070.480.030.411.000.000.380.110.74
Caused by sector 180.160.120.190.390.080.500.060.560.400.240.090.140.100.230.030.710.040.410.520.121.06
Caused by sector 190.140.240.380.260.080.110.020.030.220.050.100.110.460.180.020.300.010.015.180.111.18
Caused by sector 200.050.030.040.160.150.030.010.010.130.020.290.030.060.130.020.180.010.000.291.380.99
Caused by sector 210.060.040.060.190.070.060.020.030.280.040.090.050.110.240.050.420.010.010.290.115.47

References

  1. Intergovernmental Panel on Climate Change. Climate Change 2018: Global Warming of 1.5 °C. Available online: https://www.ipcc.ch/sr15/ (accessed on 28 March 2019).
  2. Intergovernmental Panel on Climate Change. Climate Change 2014: Mitigation of Climate Change. Available online: https://www.ipcc.ch/report/ar5/wg3/ (accessed on 29 December 2018).
  3. Ma, L.; Liu, P.; Fu, F.; Li, Z.; Ni, W. Integrated energy strategy for the sustainable development of China. Energy 2010, 36, 1143–1154. [Google Scholar] [CrossRef]
  4. Fu, F.; Pan, L.Y.; Ma, L.W.; Li, Z. A simplified method to estimate the energy–saving potentials of frequent construction and demolition process in China. Energy 2013, 49, 316–322. [Google Scholar] [CrossRef]
  5. Fu, F.; Ma, L.; Li, Z.; Polenske, K.R. The implications of China’s investment–driven economy on its energy consumption and carbon emissions. Energy Convers. Manag. 2014, 85, 573–580. [Google Scholar] [CrossRef]
  6. Acquaye, A.A.; Duffy, A.P. Input–output analysis of Irish construction sector greenhouse gas emissions. Build. Environ. 2010, 45, 784–791. [Google Scholar] [CrossRef] [Green Version]
  7. Liu, Z.; Geng, Y.; Lindner, S.; Zhao, H.; Fujita, T.; Guan, D. Embodied energy use in China’s industrial sectors. Energy Policy 2012, 49, 751–758. [Google Scholar] [CrossRef]
  8. Huang, L.; Krigsvoll, G.; Johansen, F.; Liu, Y.; Zhang, X. Carbon emission of global construction sector. Renew. Sustain. Energy Rev. 2018, 81, 1906–1916. [Google Scholar] [CrossRef]
  9. Holz, C.A. New capital estimates for China. China Econ. Rev. 2006, 17, 142–185. [Google Scholar] [CrossRef] [Green Version]
  10. Bullard, C.W.I.; Herendeen, R.A. Energy Impact of Consumption Decisions. Proc. IEEE 1975, 63, 484–493. [Google Scholar] [CrossRef]
  11. Leontief, W. The Dynamic Inverse. In Contributions to Input-Output Analysis; Carter, A.P., Brody, A., Eds.; North Holland: Amsterdam, The Netherlands, 1970. [Google Scholar]
  12. Miller, R.E.; Blair, P.D. Input-Output Analysis: Foundations and Extensions; Cambridge University Press: New York, NY, USA, 2009. [Google Scholar]
  13. Pauliuk, S.; Wood, R.; Hertwich, E.G. Dynamic Models of Fixed Capital Stocks and Their Application in Industrial Ecology. J. Ind. Ecol. 2015, 19, 104–116. [Google Scholar] [CrossRef]
  14. Rhoten, R.P. Dynamic input-output analysis of the economics of energy. In Proceedings of the Energy ’78 IEEE 1978 Region V Annual Conference, Tulsa, OK, USA, 16–18 April 1978. [Google Scholar]
  15. Tamura, H.; Ito, K. Application of dynamic input–output analysis to evaluating trade–offs between environmental pollution and energy consumption. Syst. Control 1984, 28, 529–535. [Google Scholar]
  16. Song, J.; Yang, W.; Higano, Y.; Wang, X.E. Dynamic integrated assessment of bioenergy technologies for energy production utilizing agricultural residues: An input–output approach. Appl. Energy 2015, 158, 178–189. [Google Scholar] [CrossRef]
  17. Yu, S.; Zheng, S.; Ba, G.; Wei, Y.M. Can China realise its energy-savings goal by adjusting its industrial structure? Econ. Syst. Res. 2016, 28, 273–293. [Google Scholar] [CrossRef]
  18. Pan, L.; Liu, P.; Li, Z.; Wang, Y. A dynamic input–output method for energy system modeling and analysis. Chem. Eng. Res. Des. 2018, 131, 183–192. [Google Scholar] [CrossRef]
  19. Dobos, I.; Tallos, P. A dynamic input-output model with renewable resources. Cent. Eur. J. Oper. Res. 2013, 21, 295–305. [Google Scholar] [CrossRef]
  20. Cruz, J.B., Jr.; Tan, R.R.; Culaba, A.B.; Ballacillo, J.A. A dynamic input-output model for nascent bioenergy supply chains. Appl. Energy 2009, 861, S86–S94. [Google Scholar] [CrossRef]
  21. Nie, H.; Kemp, R.; Vivanco, D.F. Véronique Vasseur. Structural decomposition analysis of energy–related CO2 emissions in China from 1997 to 2010. Energy Effic. 2016, 9, 1351–1367. [Google Scholar] [CrossRef]
  22. Wang, C.; Wang, F.; Zhang, X.; Zhang, H. Influencing mechanism of energy–related carbon emissions in Xinjiang based on the input–output and structural decomposition analysis. J. Geogr. Sci. 2017, 27, 365–384. [Google Scholar] [CrossRef]
  23. Wood, R. Structural decomposition analysis of Australia’s greenhouse gas emissions. Energy Policy 2009, 37, 4943–4948. [Google Scholar] [CrossRef]
  24. Chenery, H.; Shishido, S.; Watanabe, T. The pattern of Japanese Growth, 1914–1954. Ecomometrica 1962, 30, 98–139. [Google Scholar] [CrossRef]
  25. Gould, B.; Kulshreshtha, S. An interindustry analysis of structural change and energy use linkage in the Saskatchewan economy. Energy Econ. 1986, 8, 186–196. [Google Scholar] [CrossRef]
  26. Rose, A.; Chen, C.Y. Sources of change in energy use in the US economy, 1972–1982. Resour. Energy 1991, 13, 1–21. [Google Scholar] [CrossRef]
  27. Lee, C.F.; Lin, S.J. Structural decomposition of CO2 emissions from Taiwan’s petrochemical industries. Energy Policy 2001, 29, 237–244. [Google Scholar] [CrossRef]
  28. Zhang, Y. Structural decomposition analysis of sources of decarbonizing economic development in China; 1992–2006. Ecol. Econ. 2009, 68, 2399–2405. [Google Scholar] [CrossRef]
  29. Butnar, I.; Llop, M. Structural decomposition analysis and input–output subsystems: Changes in CO2 emissions of Spanish service sectors (2000–2005). Ecol. Econ. 2011, 70, 2012–2019. [Google Scholar] [CrossRef]
  30. Yamakawa, A.; Peters, G.P. Structural Decomposition Analysis of Greenhouse Gas Emissions in Norway 1990–2002. Econ. Syst. Res. 2011, 23, 303–318. [Google Scholar] [CrossRef]
  31. Tian, X.; Chang, M.; Tanikawa, H.; Shi, F.; Imura, H. Structural decomposition analysis of the carbonization process in Beijing: A regional explanation of rapid increasing carbon dioxide emission in China. Energy Policy 2013, 53, 279–286. [Google Scholar] [CrossRef]
  32. Intergovernmental Panel on Climate Change. 2006 IPCC Guidelines for National Greenhouse Gas Inventories; IGES: Prefecture, Japan, 2006. [Google Scholar]
  33. State Council of People’s Republic of China. Measures for Expanding Domestic Demand and Promoting Economic Growth Deployed at the Standing Meeting of the State Council. 9 November 2008. Available online: http://www.gov.cn/ldhd/2008-11/09/content_1143689.htm (accessed on 28 February 2019).
  34. National Bureau of Statistics. The Input-Output Table of CHINA 2007. Available online: http://data.stats.gov.cn/ifnormal.htm?u=/files/html/quickSearch/trcc/trcc01.html&h=740 (accessed on 28 February 2019).
  35. National Bureau of Statistics. The Input-Output Table of CHINA 2010. Available online: http://data.stats.gov.cn/ifnormal.htm?u=/files/html/quickSearch/trcc/trcc01.html&h=740 (accessed on 28 February 2019).
  36. National Bureau of Statistics. The Input-Output Table of CHINA 2012. Available online: http://data.stats.gov.cn/ifnormal.htm?u=/files/html/quickSearch/trcc/trcc01.html&h=740 (accessed on 28 February 2019).
  37. National Bureau of Statistics. China Energy Statistical Yearbook 2013; China Statistics Press: Beijing, China, 2014.
  38. National Bureau of Statistics. China Statistical Yearbook 2016; China Statistics Press: Beijing, China, 2017.
  39. Zhang, X.; Li, Z.; Ma, L.; Chong, C.; Ni, W. Forecasting the Energy Embodied in Construction Services Based on a Combination of Static and Dynamic Hybrid Input-Output Models. Energies 2019, 12, 300. [Google Scholar] [CrossRef]
  40. Hu, J. Hu Jintao’s Report at the Eighteenth National Congress of the Communist Party of China. People’s Daily. 18 November 2012. Available online: http://politics.people.com.cn/n/2012/1118/c1001-19612670.html (accessed on 28 February 2019).
  41. State Council of People’s Republic of China. About the Steel Industry to Resolve Excess Production Capacity. 4 February 2016. Available online: http://www.gov.cn/zhengce/content/2016-02/04/content_5039353.htm (accessed on 28 February 2019).
  42. State Council of People’s Republic of China. Opinions on Enhancing the Protection of Ecological Environment in an All-Round Way and Fighting the Strong Battle of Pollution Prevention and Control. 24 June 2018. Available online: http://www.gov.cn/zhengce/2018-06/24/content_5300953.htm (accessed on 28 February 2019).
Figure 1. Three steps for establishing a dynamic hybrid input–output combined with structural decomposition analysis (DHI/O-SDA) model.
Energies 12 01456 g001
Figure 2. Energy-related carbon emission (ERCE) embodied in the constructive services-related fixed assets investment (CSFAI) caused by the final demand increase of each sector and technological changes.
Energies 12 01456 g002
Figure 3. TE (left coordinate axis, bar) and the PEC (right coordinate axis, point) caused by a unit increase of sectoral FDEI.
Energies 12 01456 g003
Figure 4. ERCE embodied in CSFAI caused by the final demand increase of each sector and technological changes from 2011 to 2015.
Energies 12 01456 g004
Figure 5. Comparing DHI/O modeling with and without SDA for estimating ERCE embodied in CSFAI.
Energies 12 01456 g005
Figure 6. Sensitivity analysis of pcsfait.
Energies 12 01456 g006
Table 1. Low heat value and CO2 emission factor.
Primary Fossil FuelLow Heat Value (TJ/t)CO2 Emission Factor (kg/TJ)
Coal0.029398,300
Crude oil0.042373,300
Natural gas0.04856,100
Table 2. Format of DHI/O–SDA model results table.
The Cause of ERCE Embodied in CSFAI ERCE Embodied in CSFAI Consumed by Sector 1ERCE Embodied in CSFAI Consumed by Sector jERCE Embodied in CSFAI Consumed by Sector n
Unit FDEI increase of sector 1ER11ER1jER1n
Unit FDEI increase of sector iERi1ERijERin
Unit FDEI increase of sector nERn1ERnjERnn

