Article

A Current Reconstruction Strategy Following the Operation Area in a 1-Shunt Inverter System

1
Department of Electrical and Computer Engineering, Pusan National University; Busan 46241, Korea
2
LG Electronics, Changwon 51544, Korea
3
Department of Mechanical Facility Control Engineering, Korea University of Technology and Education, Cheonan, Chungnam 31253, Korea
*
Author to whom correspondence should be addressed.
Energies 2019, 12(8), 1423; https://doi.org/10.3390/en12081423
Submission received: 15 March 2019 / Revised: 8 April 2019 / Accepted: 11 April 2019 / Published: 13 April 2019

Abstract

:
To reduce the cost of the inverter system in home appliances, a method using a shunt resistor at the DC-link can be substituted for a method using two current sensors at the inverter output. However, the minimum time of the active vector is required to sample the accurate current using a 1-shunt resistor. Therefore, many studies have been conducted investigating current reconstruction methods in the unmeasurable region of the current. The conventional methods using voltage injection have some problems such as high THD (Total Harmonic Distortion) and acoustic noise, because the PWM pattern is shifted. In addition, the current reconstruction is inaccurate in a low modulation region. In this paper, the cause of the noise in conventional methods is analyzed and a simple current reconstruction method based on an average current estimation and a current reference is utilized for reducing acoustic noise. In an immeasurable area, especially a low modulation region, an intermittent PWM shift method is proposed to enhance the accuracy of the reconstructed current. Therefore, a control strategy that combines all of the mentioned methods is implemented for the entire operating range. The effectiveness of the proposed methods is verified through the experimental results and the results of sound measurement in an anechoic chamber are included to compare with the acoustic noise.

1. Introduction

Phase current information is required to control the torque and speed of an AC motor. A method using hall-effect current sensors is the most accurate for obtaining the current. However, most appliances use shunt resistors for measuring the phase current to reduce costs [1,2,3]. The current measurement method using one shunt resister (shown in Figure 1) further reduces the cost because the information of two phase currents can be acquired in one switching period through the DC link shunt resistor, R s h u n t [4,5].
The phase current information that can be measured through the shunt resistor depends on the voltage vector applied, as shown in Table 1. Since two different active vectors are applied in a switching period, two phase currents can be sampled from the shunt resistor and the other phase current is calculated using the following equation:
i a + i b + i c = 0
However, when the currents are measured from the shunt resistor, the currents contains the ringing component caused by the transient response. Thus, a minimum time T min is required to sample the accurate current when the active voltage is applied. T min includes other factors, as follows:
T min = T d e a d + T s e t t l i n g + T a d
where T d e a d is the dead time used to prevent short-circuiting, T s e t t l i n g is the settling time for the stabilization of the current, and T a d is the conversion delay of the AD converter [6]. Figure 2 shows the unmeasurable area of the current caused by the insufficient time of applied voltage when the phase current is measured through a 1-shunt resister. The unmeasurable areas can be divided into two parts according to the number of currents available from the shunt resistor. First, the region defined as the bar area in the hexagon of the space vector plane can measure only one phase current from the shunt resistor, as shown in Figure 2a. Second, the region called the star area in the hexagon cannot measure any phase current because the applied voltage time of both two phases is shorter than T min , as shown in Figure 2b. In Figure 2, the voltage magnitude Δ V , which represents the boundary of the area, is calculated as follows (Equation (3)):
Δ V = 2 T min 3 T s V d c
where V d c is the DC-link voltage and T s is the sampling time.
In order to precisely control the motor in the 1-shunt inverter system, a reconstruction method of the phase current is required when the voltage reference passes through the unmeasurable area. To restore the phase current, the conventional methods move the voltage reference to the measurable area by shifting the PWM pattern to compensate for the distorted voltage [4,5,6,7,8,9,10,11,12]. These methods can restore the current in all operation regions, but a distorted current is caused by the PWM shift. Another method is current estimation by observer [13,14]. Furthermore, in [15,16], the single current sensor is arranged in a new position to sample the current during a zero-voltage vector without the PWM shift.
In our previous work, the current estimation method is proposed by using a voltage equation and the last information on the sampled current in the measurable region [17]. This method is available in the Bar area, but the current reconstruction is impossible because the initial current cannot be measured in the Star area. Thus, an additional reconstruction method is required in the low modulation region [18]. In this paper, depending on a pre-defined region, the current reconstruction methods using the average currents and the current references and the intermittent PWM shift are used for all operation region. Experiments are executed to reduce both the THD of the phase current and the acoustic noise compared with the conventional method using PWM shift [7].

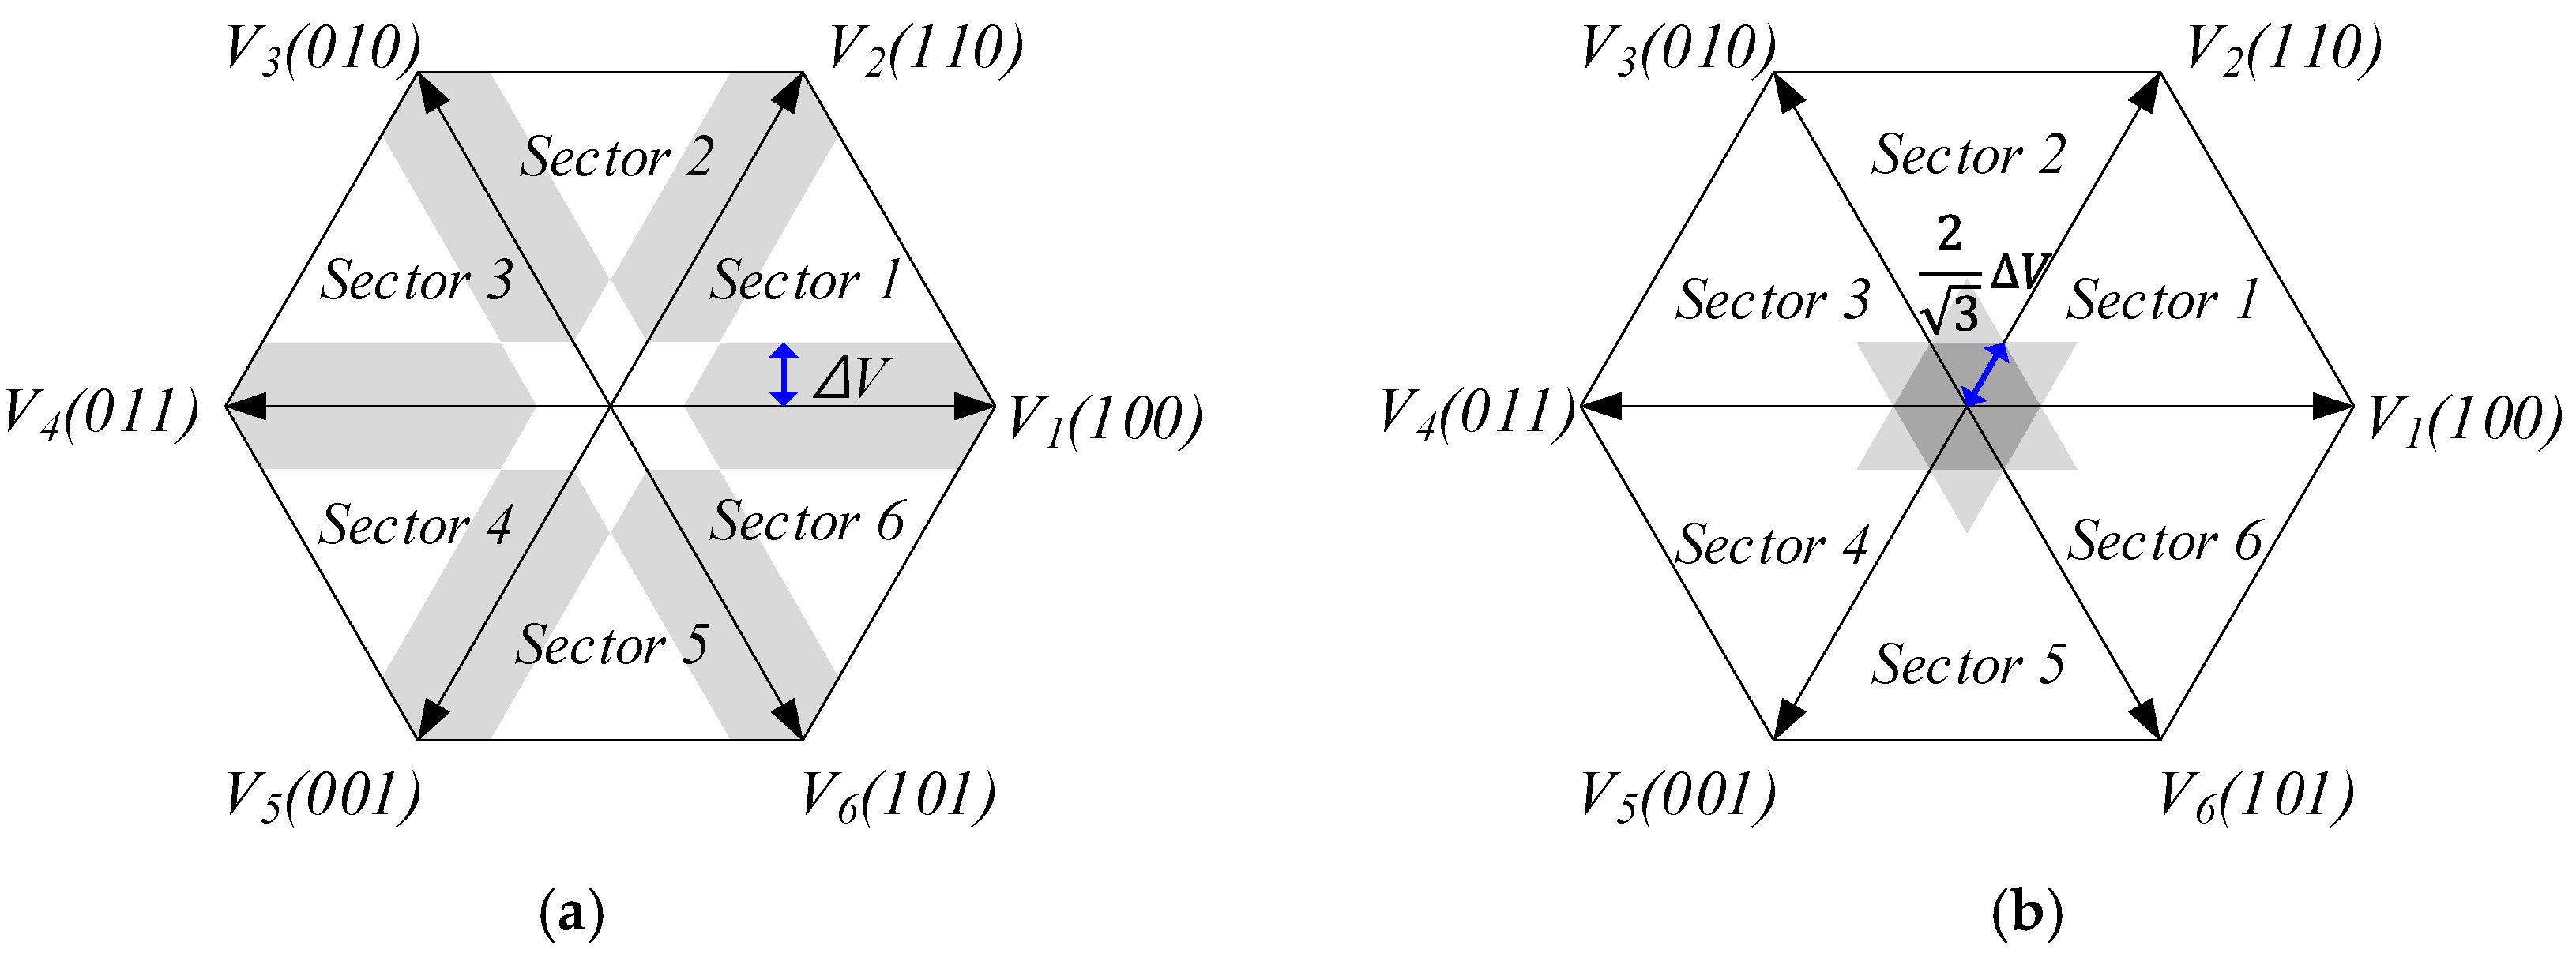
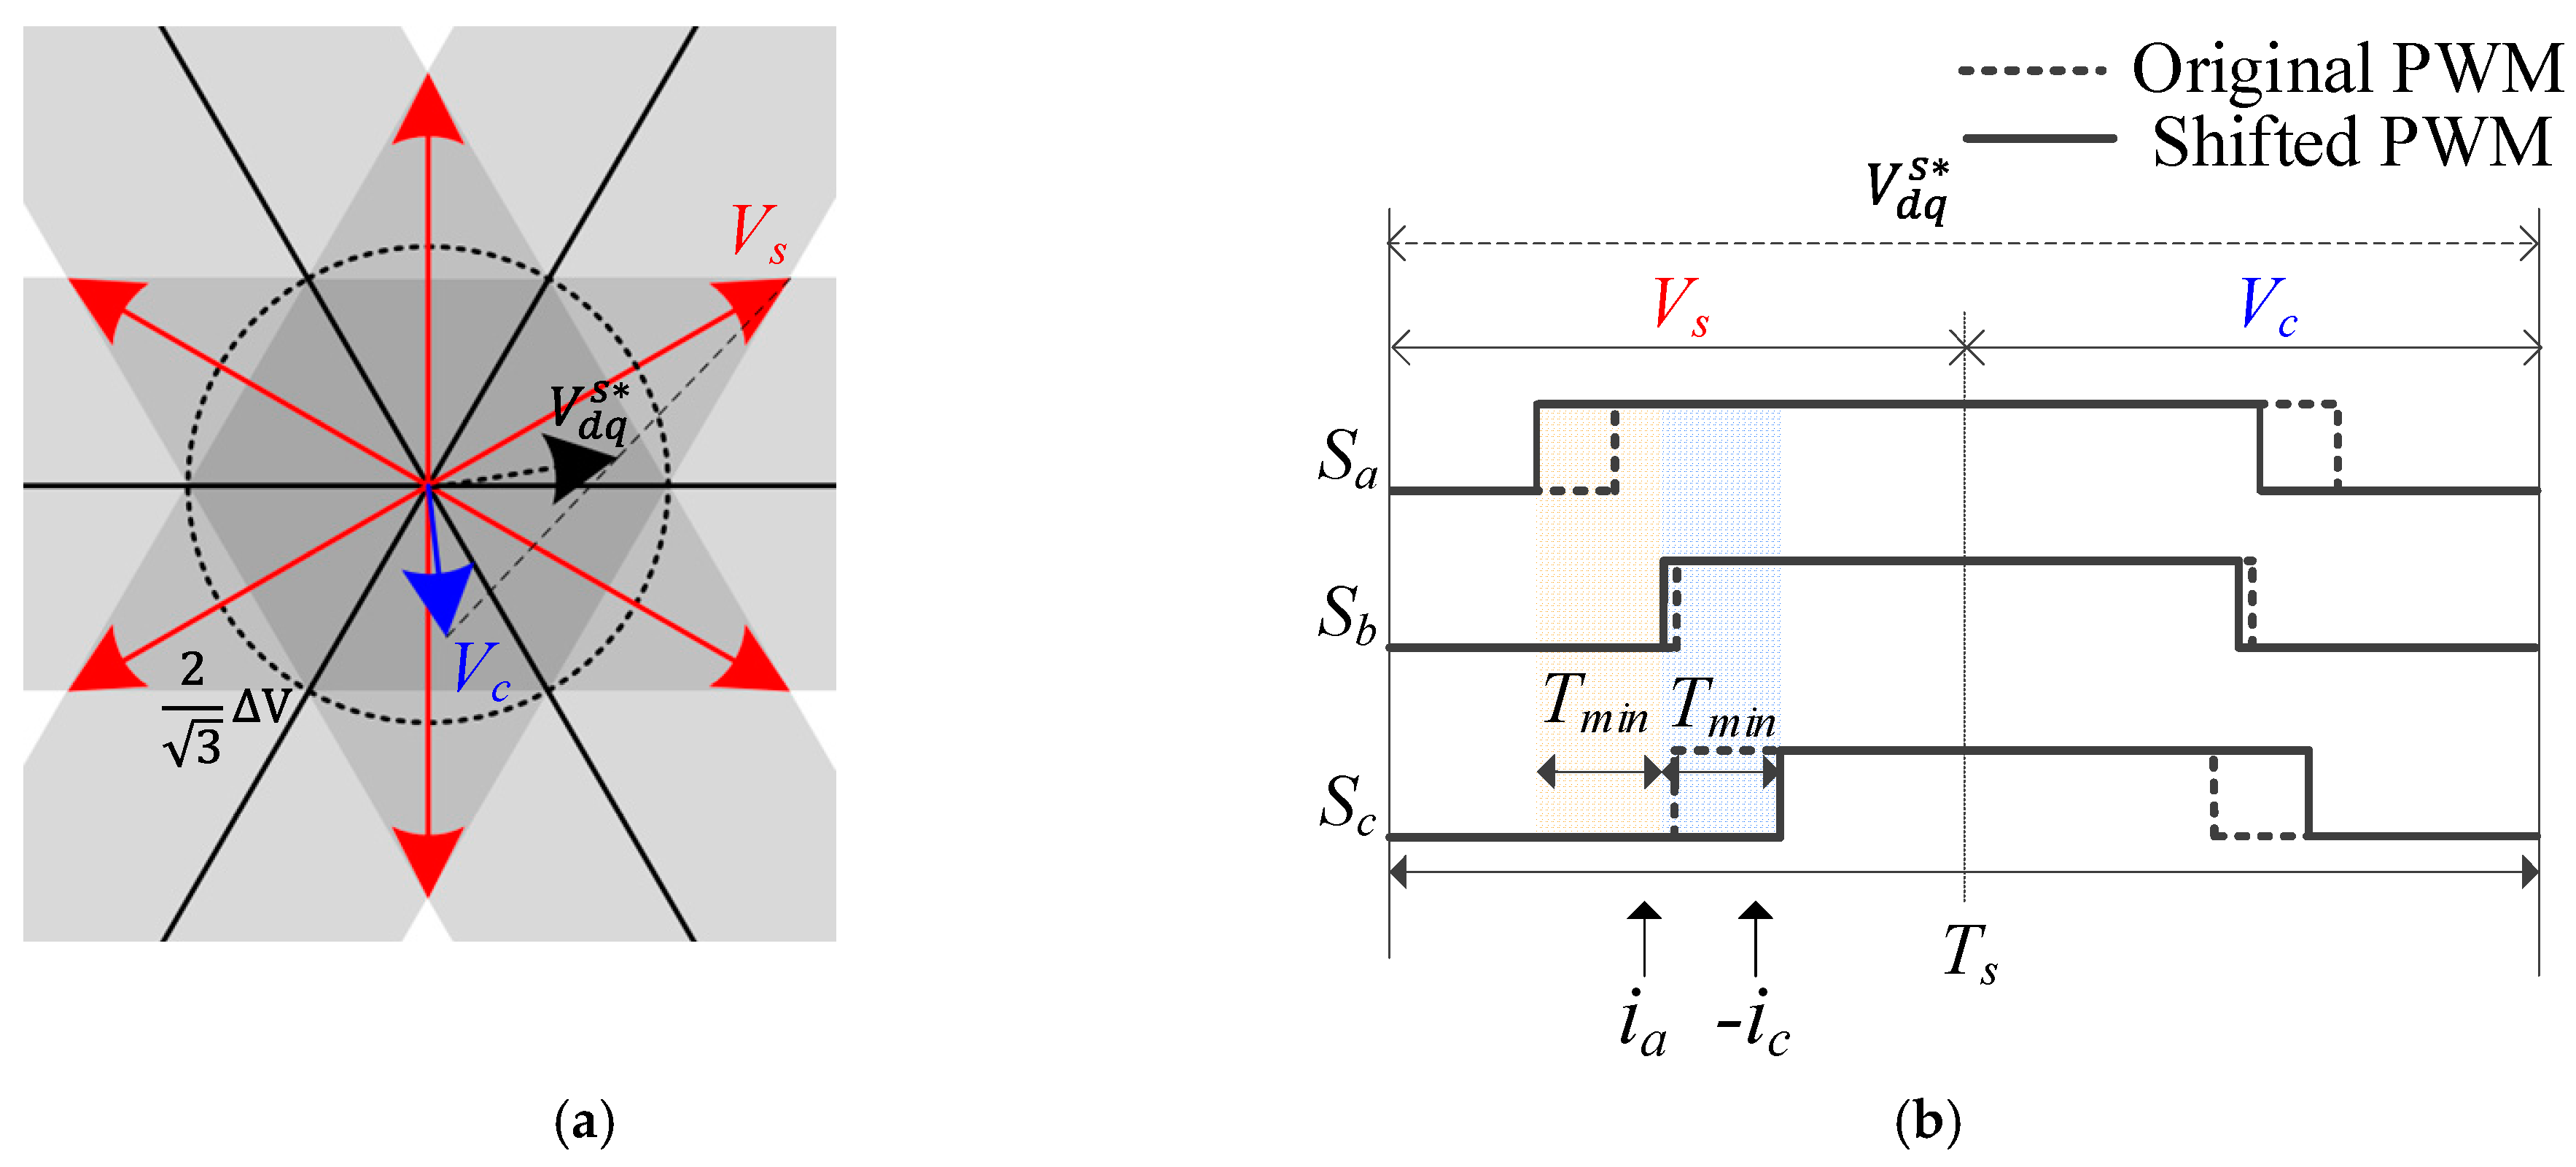
2. The Conventional Method Using PWM Shift

The conventional PWM shifting method secures the measuring time by shifting the PWM pattern when the voltage reference passes the unmeasurable region, as shown in Figure 3 [4,5,6,7,8,9]. To shift the PWM pattern, the sampling voltage vector V s is located outside the Star area and then the compensation voltage vector V c is applied as shown in Figure 3a. The average voltage output of V s and V c is equal to the voltage reference vector V d q s * , so it has no effect on the control. Since V s is placed in the measurable region, two-phase currents can be measured through the shunt resistor during the first half cycle, as shown in Figure 3b, and the compensation voltage vector V c is applied in the other half period. V c can be expressed as in Equation (4) to meet the average voltage vector:
V d q S * = 1 2 ( V s + V c ) V c = 2 V d q s * V s
In order to examine the magnitude of the injected voltage through the PWM shift method, it can be calculated as in Equation (5):
V i = V s V d q s *
Since the PWM pattern should be shifted in the low modulation region during every switching period, a voltage injection also occurs. In addition, as the voltage reference is generated in the lower modulation region, the magnitude of the injection voltage increases. These factors cause the distortion of the current and make acoustic noise.

3. The Proposed Reconstruction Method of the Phase Current

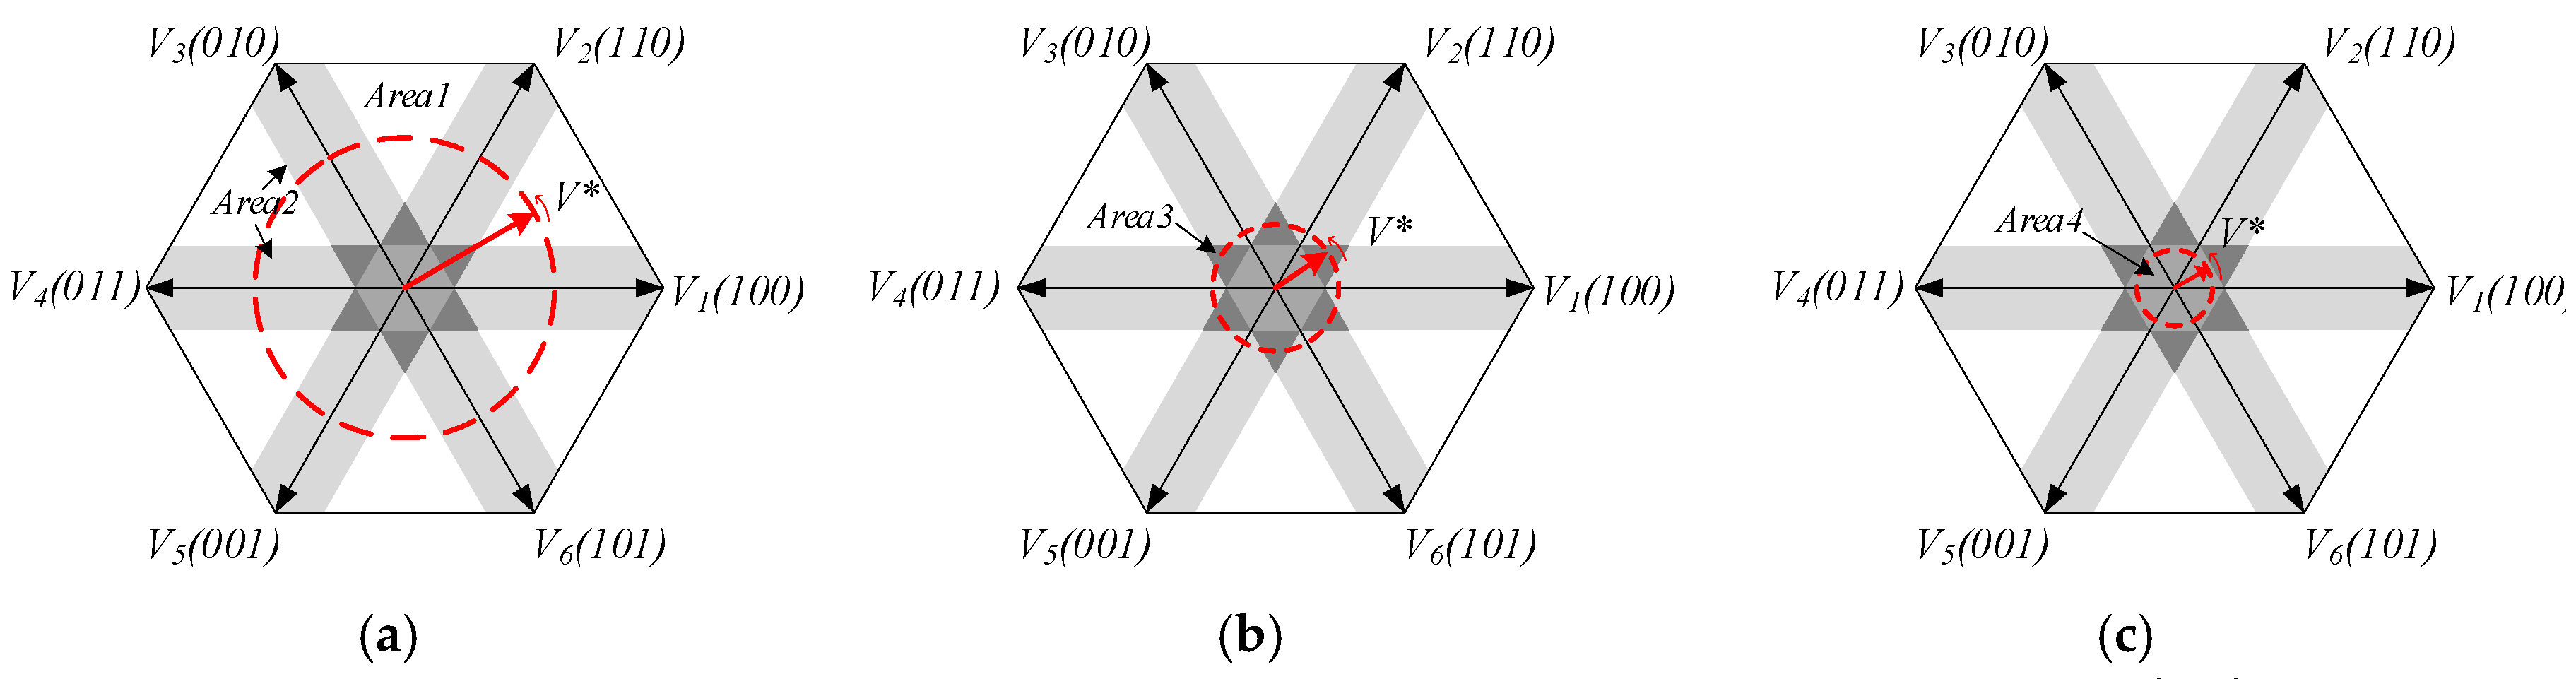
3.1. The Division of Operation Area for the Current Reconstruction

The number and phase of the measurable current vary depending on the magnitude of the voltage reference and the rotation angle in Figure 2. Thus, the control region is classified into four areas in this paper. The voltage reference passes through the normal and bar area, when the magnitude of voltage reference vector is larger than 2 Δ V , as shown in Figure 4, In this case, the Normal area is defined as Area 1, where two phase currents can be sampled by the shunt resistor. The Bar area of Figure 4a is defined as Area 2, which can sample only one phase current. When 2 3 Δ V < | V * | < 2 Δ V in Figure 4b, the voltage reference vector is placed on the Bar or Star area. The triangular part of the star outline is defined as Area 3 and none of the currents can be sampled. Lastly, Area 4 is the region in which the magnitude of the voltage reference is lower than 2 3 Δ V , as shown in Figure 4c. Area 4 also cannot sample all phase currents.

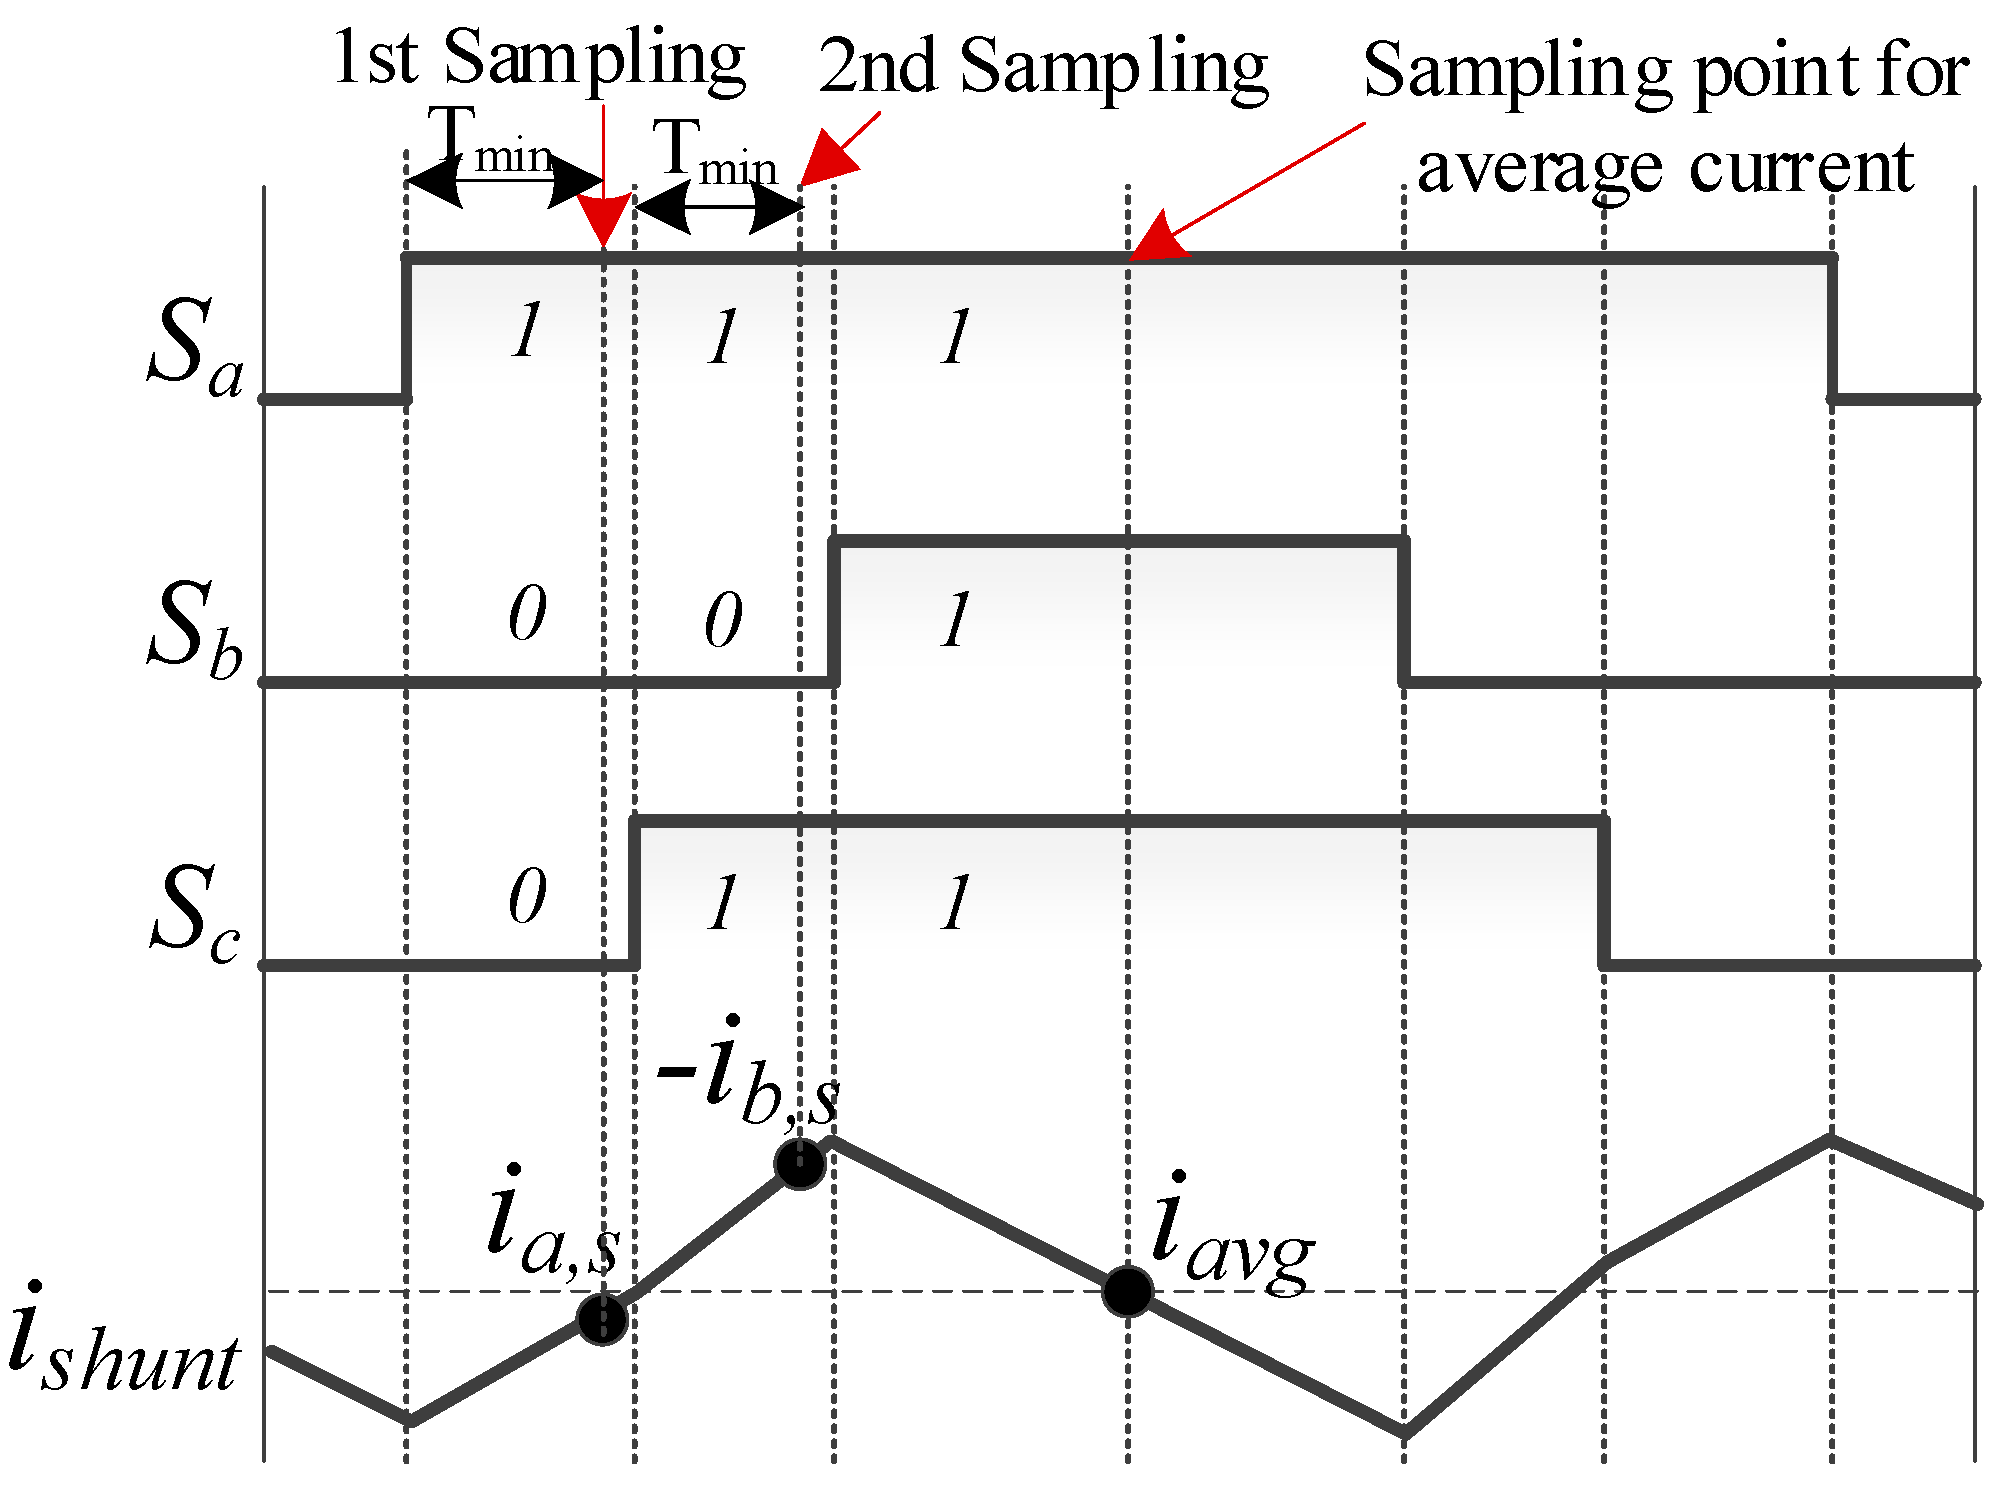
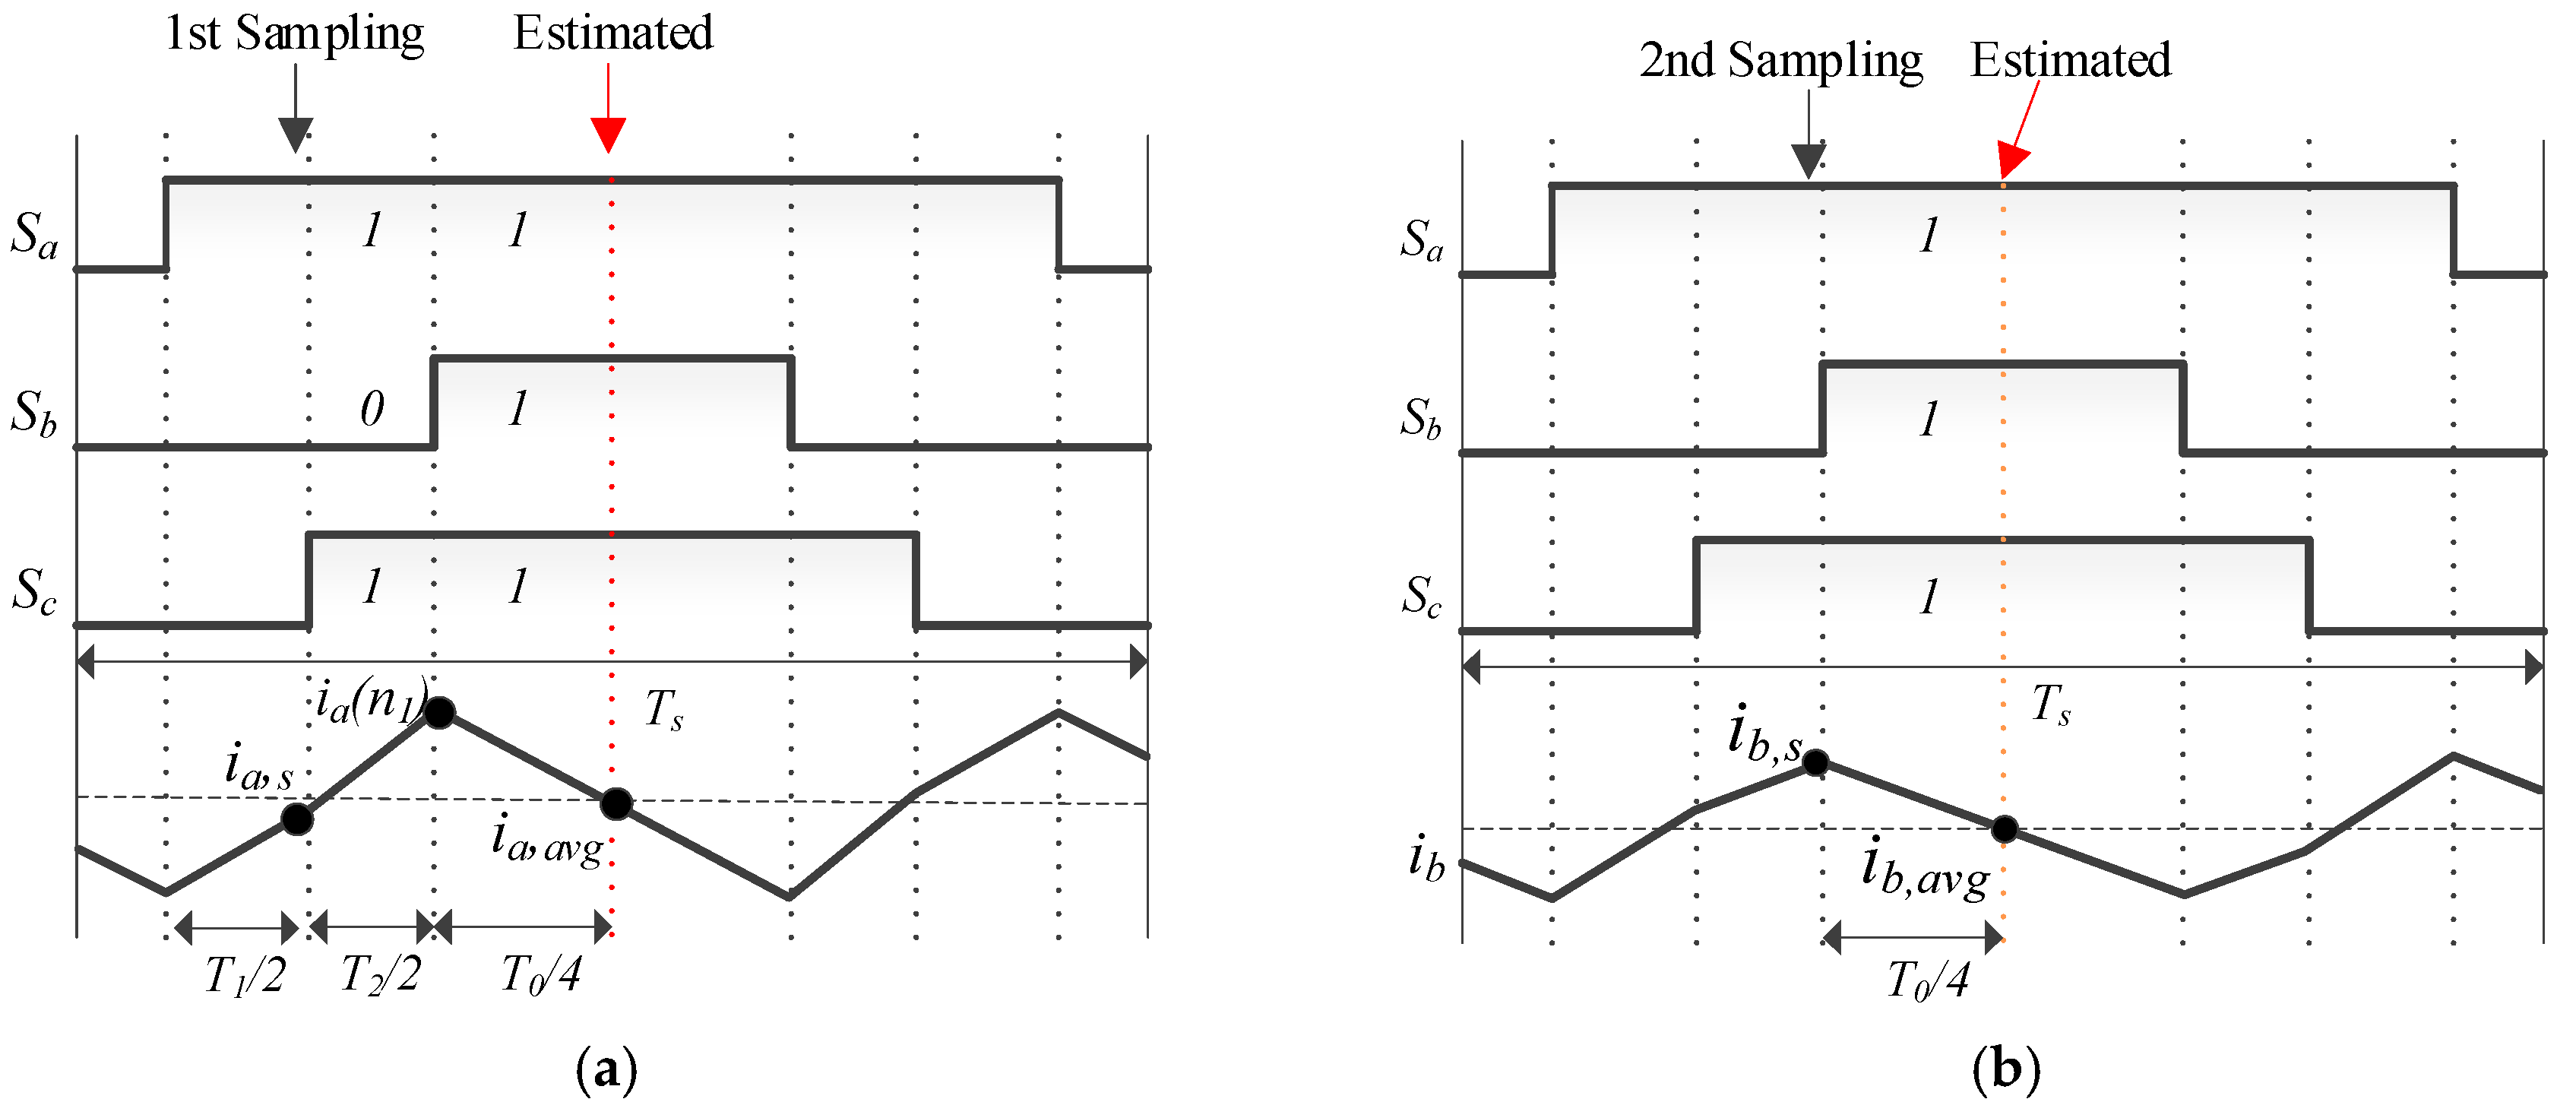
3.2. The Average Current Estimation Method from the Shunt Resistor in Area 1

In this paper, the current reconstruction method is applied differently depending on the area. In Area 1, the information of two phase currents can be directly measured from the shunt resistor. However, the sampling point considering T min is different from the average phase current when the current sensor is used as shown in Figure 5. Therefore, the harmonic component is included when the measured current from the shunt resistor is directly used.
In a previous work, the average phase current estimation method is proposed by using the voltage equation of the motor [17]. The current slope can be expressed as in Equation (6) by ignoring the resistance component, because the voltage applied to resistance is lower than that of the inductance.
d i x d t = V x n E x L x = { a , b , c }
where V x n is the pole voltage, which varies according to the switching state, and E x is the back-Emf of the each phase. The current slopes according to the switching states are arranged in Table 2.
The average current estimation method estimates the average current by adding the amount of current change from the current obtained from the shunt resistor when the effective voltage vector is applied. In Figure 6, the current i a ( n 1 ) can be obtained from the measured current i a , s by using Equation (7) when the effective voltage vector V 6 is applied:
i a ( n 1 ) = 3 E a + V d c 3 L × T s 2 + i a , s .
From i a ( n 1 ) the average phase current i a , a v g can be calculated by using Equation (8) when the switching state V 0 is applied:
i a , a v g = E a L × T 0 4 + i a ( n 1 )
In addition, the switching duration time T 0 , T 1 , and T 2 can be calculated from Equations (9) to (11) by using SVPWM calculation [18]:
T 0 = T s [ 1 1 V d c ( V a s V b s ) ]
T 1 = T s V d c ( V a s V c s )
T 2 = T s V d c ( V c s V b s )
By inserting Equation (7) and the time equation into Equation (8), the estimated average current can be obtained via Equation (12):
i a , a v g = T s L [ 1 6 ( V c s V b s ) E a 4 ( 1 + 3 V c s V d c ) ] + i a , s
The average current of “b” phase also can be derived from Equation (13) from the “b” phase current, which is measured at the second sampling time:
i b , a v g = E b T s 4 L [ 1 1 V d c ( V a s V b s ) ] + i b , s
In this manner, the generalized Equations (14) and (15) can be applied to all rotating sectors, where 1st, 2nd, and 3rd are the magnitude orders of the voltage reference of the three phases. By following Equations (14) and (15), the phase current with the largest voltage reference can be obtained at the 1st sampling point and the phase current with the lowest voltage reference can be estimated at the 2st sampling point.
i 1 s t , a v g = T s L [ 1 6 ( V 2 n d V 3 n d ) ] E 1 s t 4 ( 1 + 3 V 2 n d V d c ) ] + i 1 s t , s
i 3 r d , a v g = E 3 r d T s 4 L [ 1 1 V d c ( V 1 s t V 3 r d ) ] + i 3 r d , s

3.3. The Current Estimation Method Using Current Reference in the Unmeasurable Region

The current reconstruction method, using average current estimation, is not applicable in Area 2 to Area 4. The proposed current estimation method, by using the current reference [19], is a reconstruction method for the current that cannot be obtained from the shunt resistor in the unmeasurable region of the 1-shunt inverter. The estimated current can be simply obtained by using the electrical model of the motor. Figure 7 shows the block diagram of the current controller composed of a PI (Proportional‒Integral) regulator and the motor in the synchronous frame, where R s , L s , ω e are the stator resistor, inductance, and electrical angular speed, respectively [20]. Through the coordinate transformation of the synchronous coordinate system, the AC current is changed to the DC components. At this time, if the back-EMF and mutual component generated by d‒q transform are compensated for by the feed-forwarding estimation value, and if the current PI regulator is designed as in Equation (16), the pole of the motor can be canceled out by the zero of the PI current controller. As a result, we get the open-loop transfer function G o ( s ) , which is derived as in Equation (17):
K p = L s ω c c , K i = R s ω c c
G o ( s ) = ( K p + K i s ) × ( 1 R s + s L s ) = ω c c s
where ω c c is the bandwidth of the current controller [21].
The closed-loop transfer function G c ( s ) of the current response is calculated as follows:
G c ( s ) = I d q e ( s ) I d q e * ( s ) = G o ( s ) 1 + G o ( s ) = ω c c s 1 + ω c c s = ω c c s + ω c c
Equation (18) is equal to the transfer function of the first-order low-pass filter (LPF), of which the cutoff frequency is ω c c . As the input of the LPF is the current reference i d q e * , the output of the LPF is the estimated current i ^ d q e in the synchronous frame.
The average current estimation method and current estimation method based on Equation (18) is shown in Figure 8. When the voltage reference is generated in Area 1, the current reconstruction method using average current estimation is used for current control. Then the voltage reference goes through the unmeasurable region, and the current reconstruction method is substituted to current estimation method using LPF. In Area 2, one phase current is reconstructed by the shunt resistor and the average current estimation method. Another without enough Tmin is estimated by the current estimation method using the current reference. In Areas 3 and 4, all three phase currents are obtained by the current estimation method using the current reference. The phase reconstruction method using the current estimation method has the advantage that a PWM shift is not required. As a result, the THD of the phase current and the level of the acoustic noise are lower than in the conventional methods.

3.4. Intermittent PWM Shift Method

In Area 4, described in Section 3.1, the motor is continuously controlled without acquiring any current information. Thus, all phase currents should be reconstructed by the proposed current estimation method. However, continuous control using estimation currents cause increasing the estimation error. Therefore, it is necessary to update the estimated currents by intermittently using the measured current through the shunt resistor. Thus, the intermittent PWM shift method is proposed to improve the accuracy of the reconstructed currents in the low modulation region.
The intermittent PWM shift method intermittently uses the PWM shift to newly update phase current information from the shunt resistor. In this paper, the sampling voltage vector V s is applied on the boundary of the star area, as shown in Figure 9a. As a result, one phase current can be updated to the measured current through the shunt resistor. The reason for this is to reduce the magnitude of the injection voltage as compared with the conventional PWM shift method [7]. In this case, since only one phase current can be sampled from the shunt resistor, other currents should be reconstructed by using the proposed current estimation method.
As shown in Figure 9b, the phase angle θ of the sampling voltage vector V s is equal to that of the voltage reference vector V d q s * in the x‒y coordinate system. The line of the sampling voltage V s is derived as in Equation (19), line 1. As the angle of the border line of star area is 60° where 0° ≤ θ ≤ 30° and the x-intercept of this line is 2 Δ V 3 , line 2 is derived as in Equation (20) in Figure 9b.
l i n e 1 : y = tan θ x
l i n e 2 : y = 3 ( x 2 3 Δ V )
The intersection point ( α , β ) of lines 1 and 2 is as follows:
α = | V s | cos θ , β = | V s | sin θ
By substituting the point from Equation (21) into Equation (20), the magnitude of the sampling voltage vector V s is calculated as follows:
| V s | = 2 Δ V 3 cos θ sin θ
As the PWM pattern is intermittently shifted in Area 4, the estimation error can be compensated for by using the electrical model. In addition, the frequency and average magnitude of the injected voltage are much lower than that of the conventional method. Moreover, the harmonics of the phase current is also less than that of the conventional method.

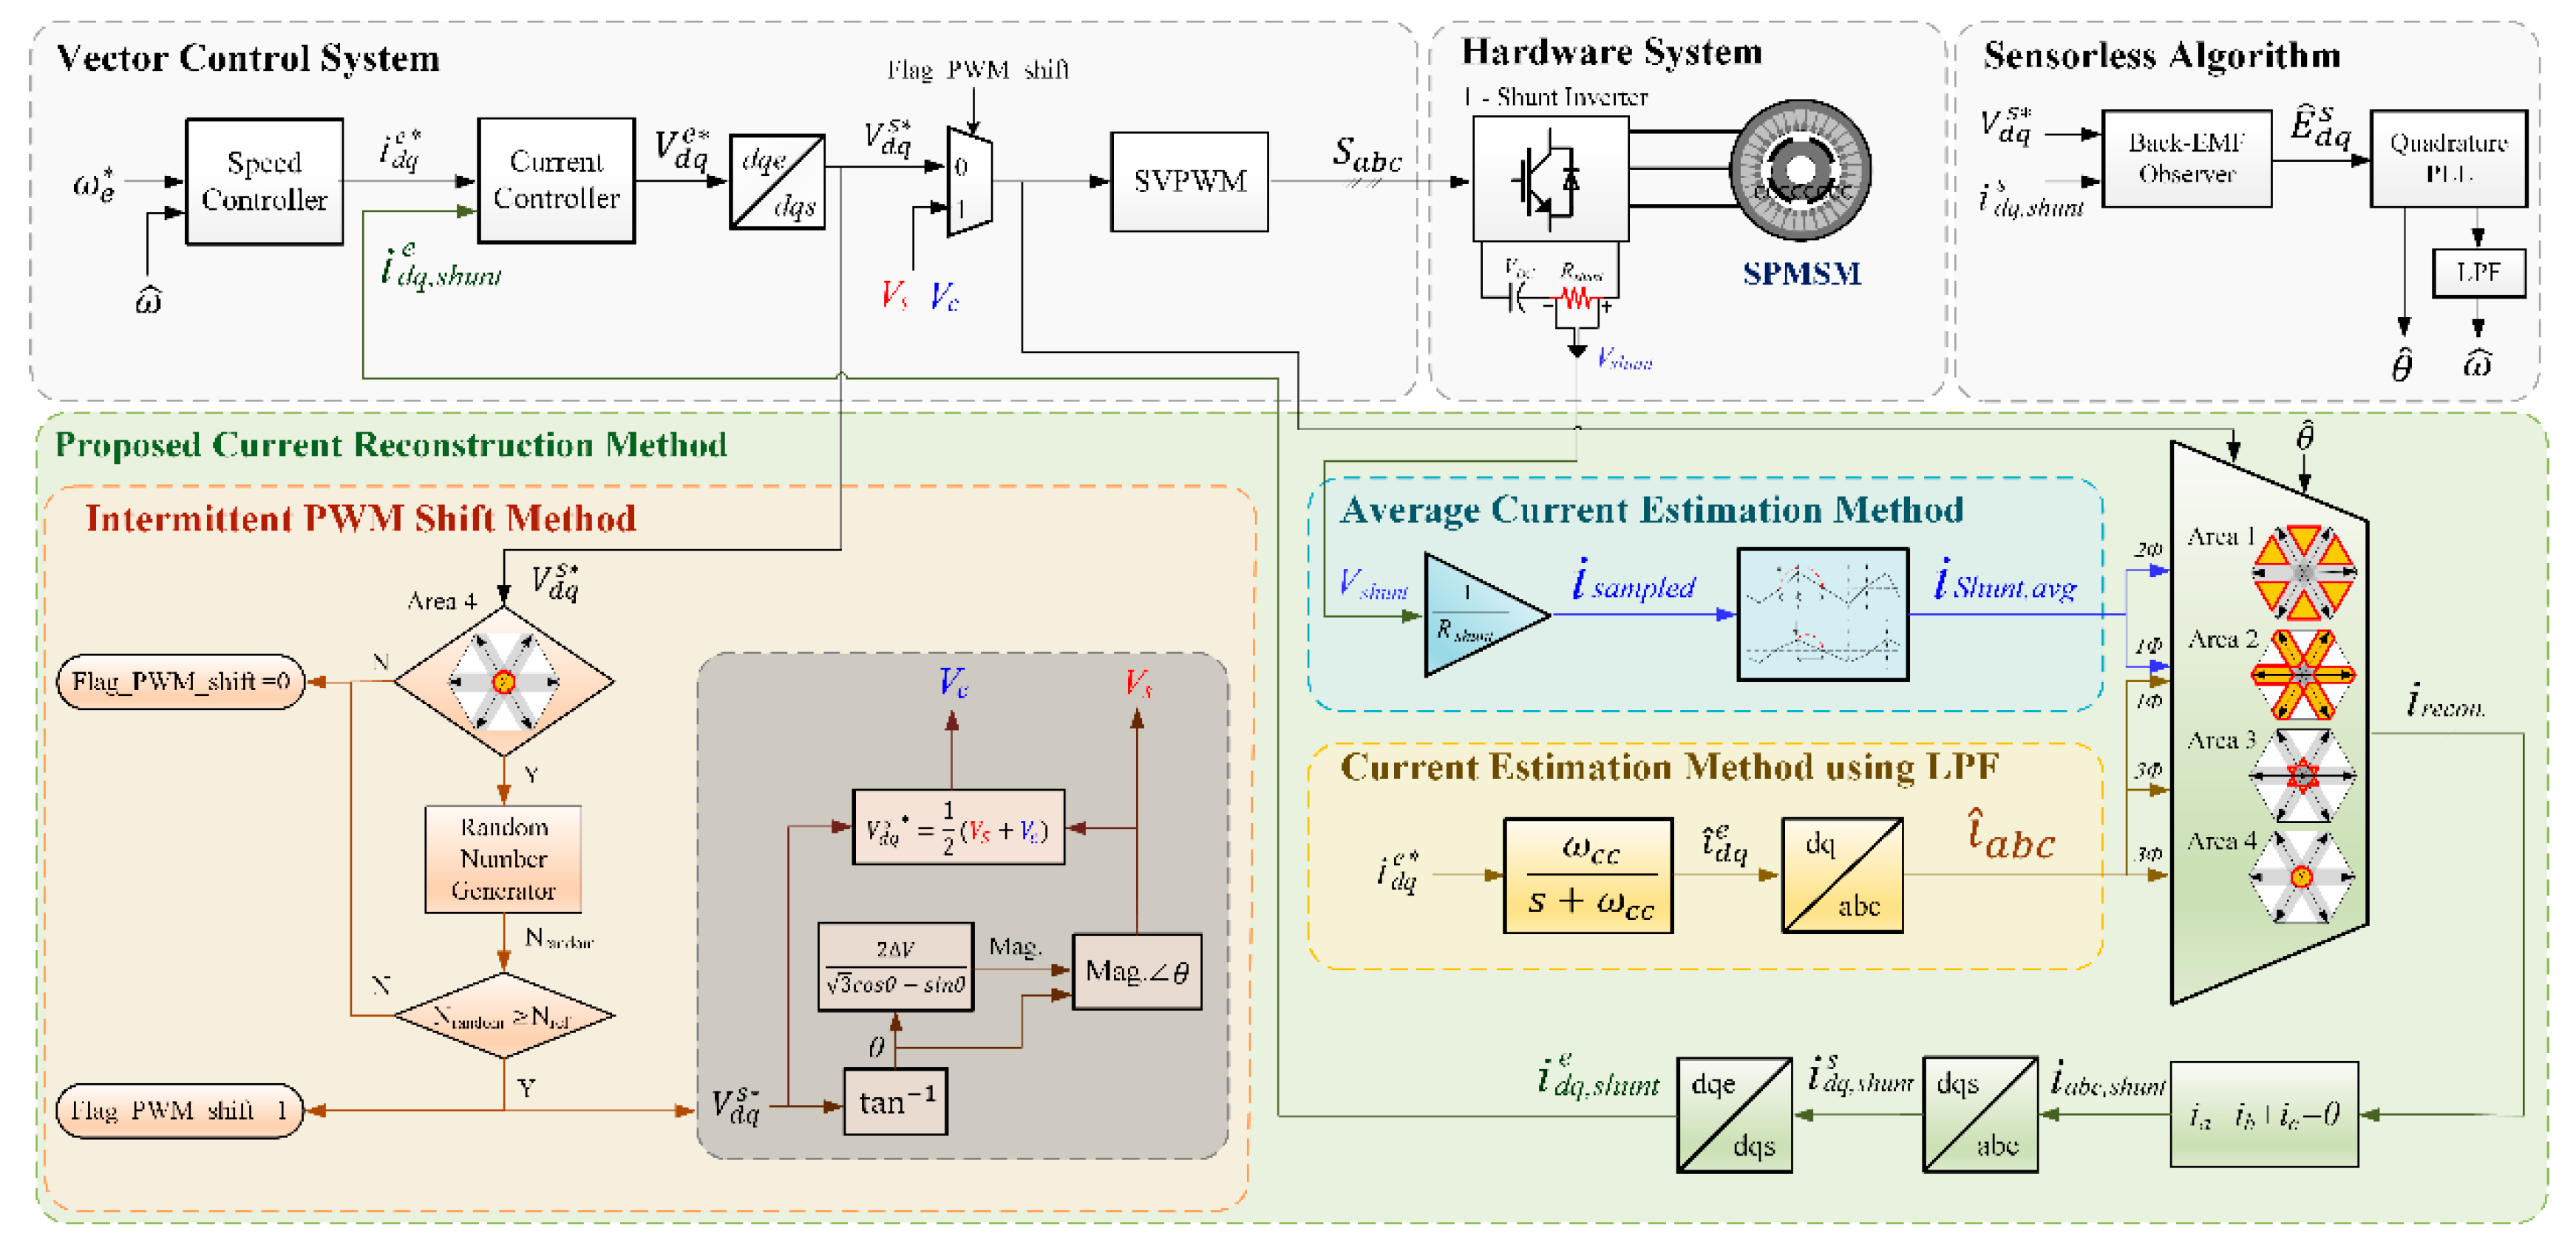
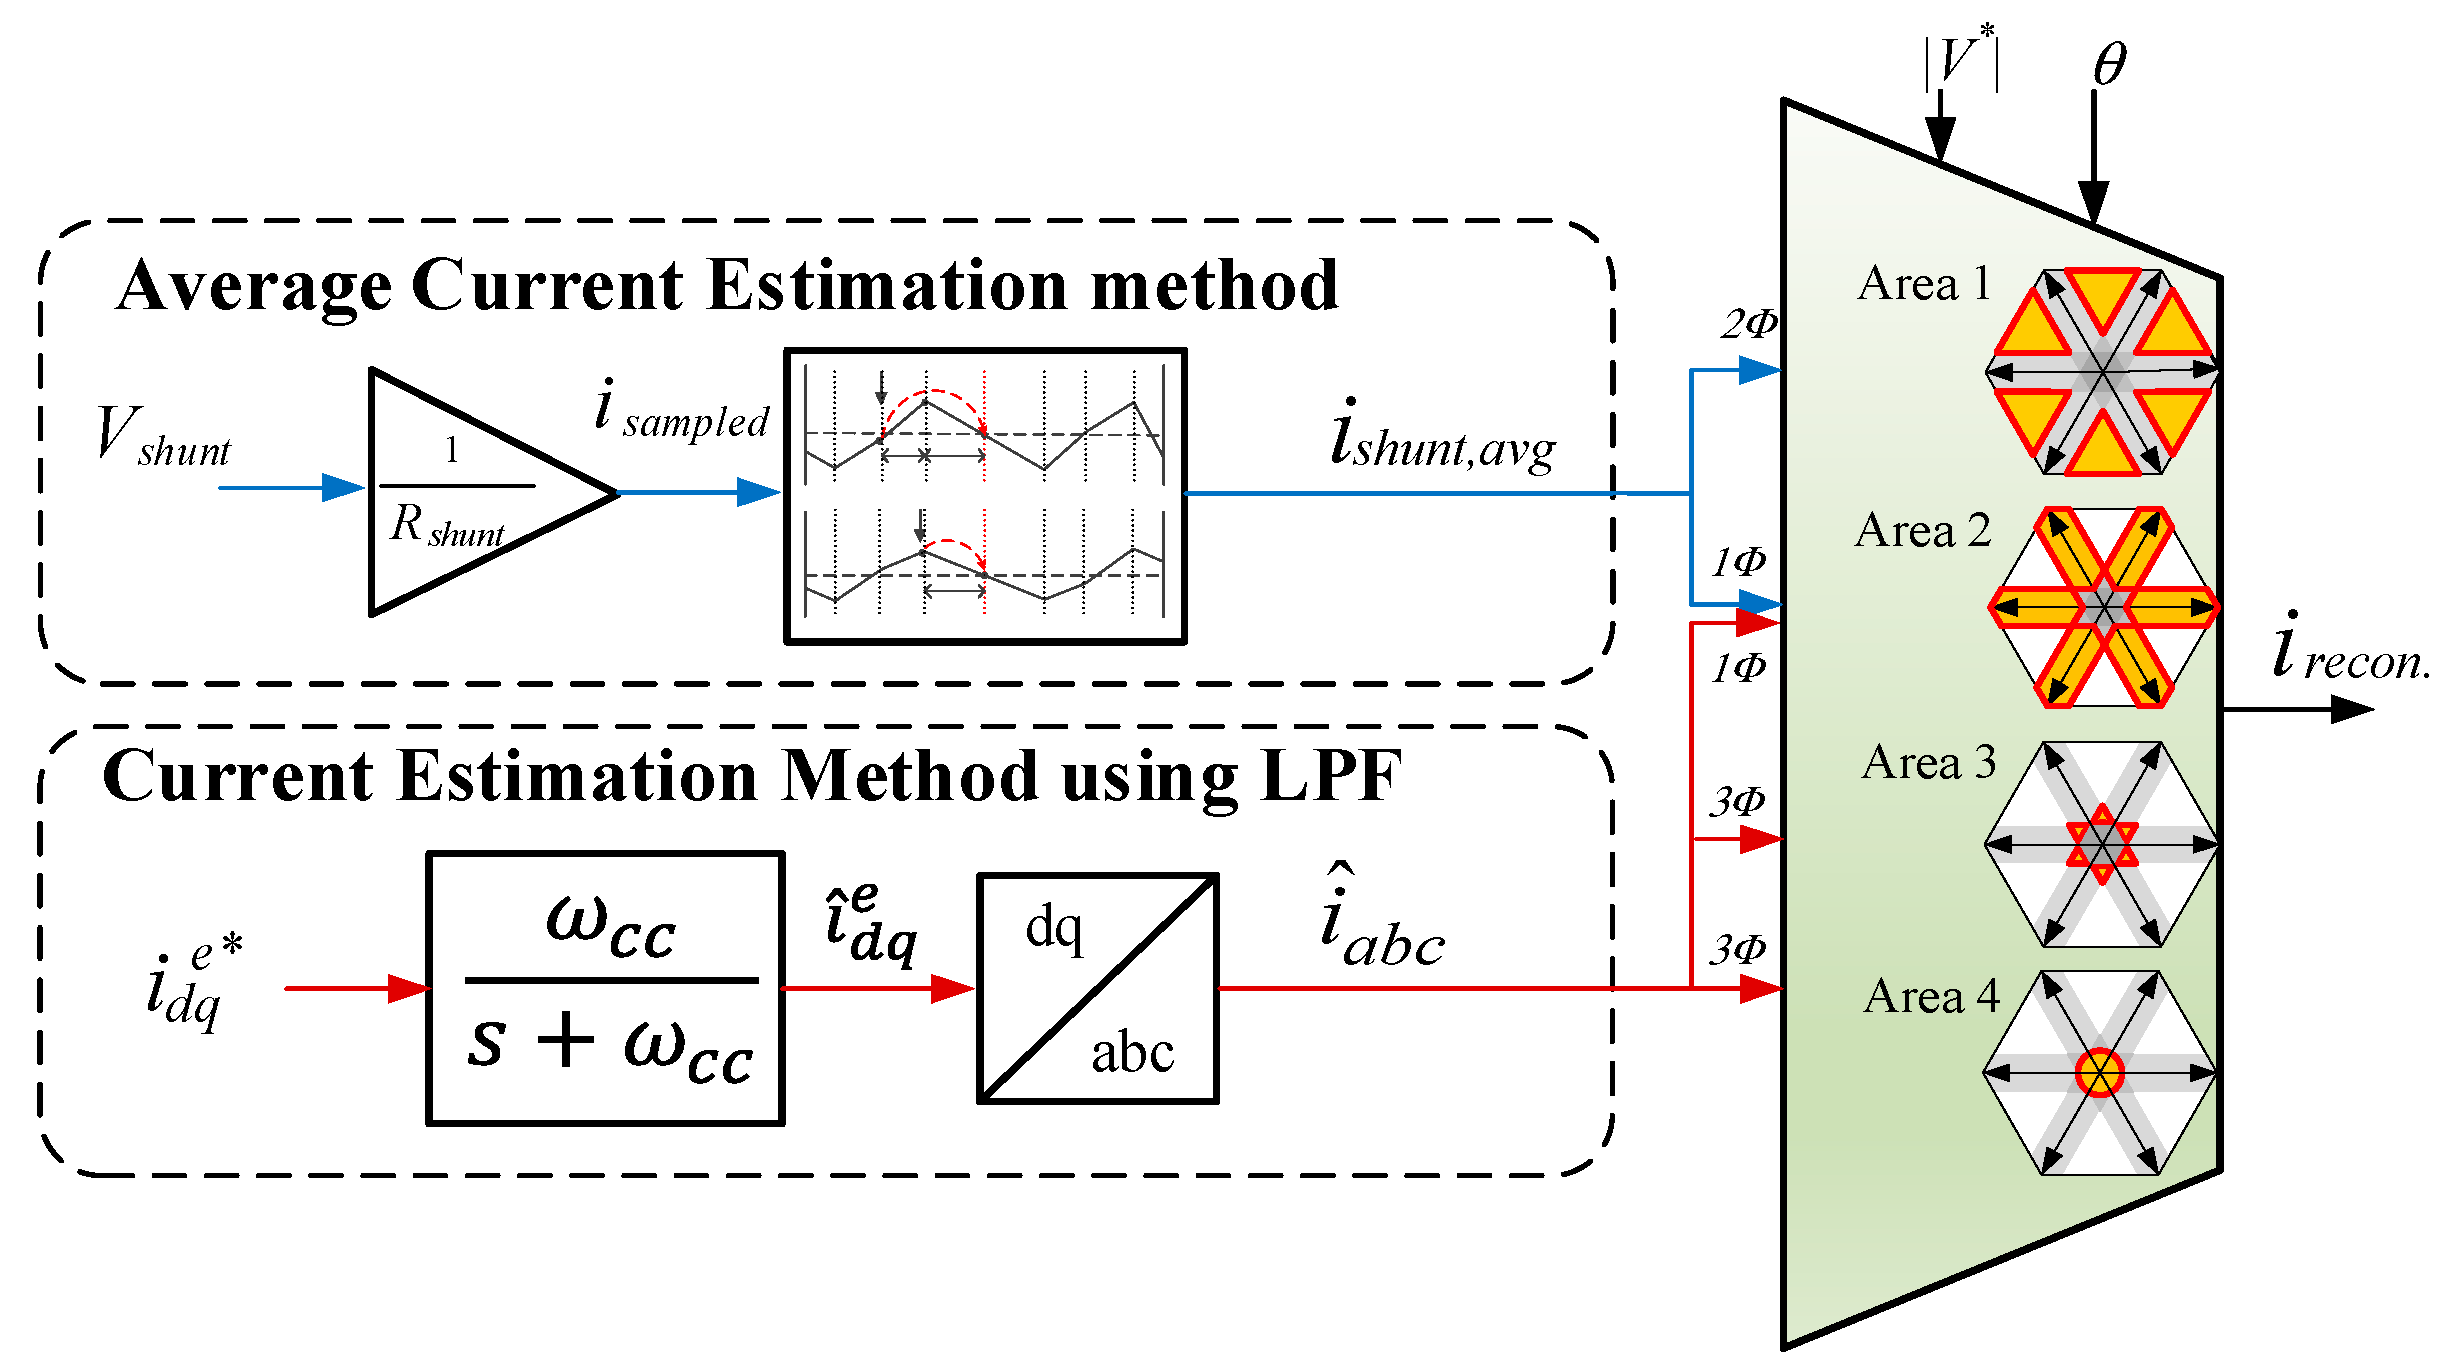
3.5. Overall Control Scheme

Figure 10 shows the overall control block diagram including one shunt inverter and the AC motor. In this system, the sensorless algorithm, which is based on Back-EMF observer, is implemented for the speed control [22]. According to the position of the voltage reference calculated from the information of both the input of SVPWM and the estimated theta from the sensorless algorithm, the reconstructed currents, i r e c o n . , are selected from either the average current estimation method or the current estimation method using LPF. Then, using both the reconstructed currents and Equation (1), the input of the current controller, i d q , s h u n t e , is estimated and used for the current controller. However, when the voltage reference is located on Area 4, the intermittent PWM shift method is used to move the voltage reference to the measurable region. In the intermittent PWM shift method, a random number N r a n d o m between 0 and 100 is generated, and N r a n d o m is compared to the reference value N r e f , which is decided on experimentally as 94. When N r a n d o m is greater than N r e f , the Flag_PWM_shift is set to 1 and the injection voltage V s and compensation voltage V c are calculated. The sampling vector V s is applied to Area 3. In other cases, the original voltage reference V d q s * is applied and the control currents are selected according to the area.

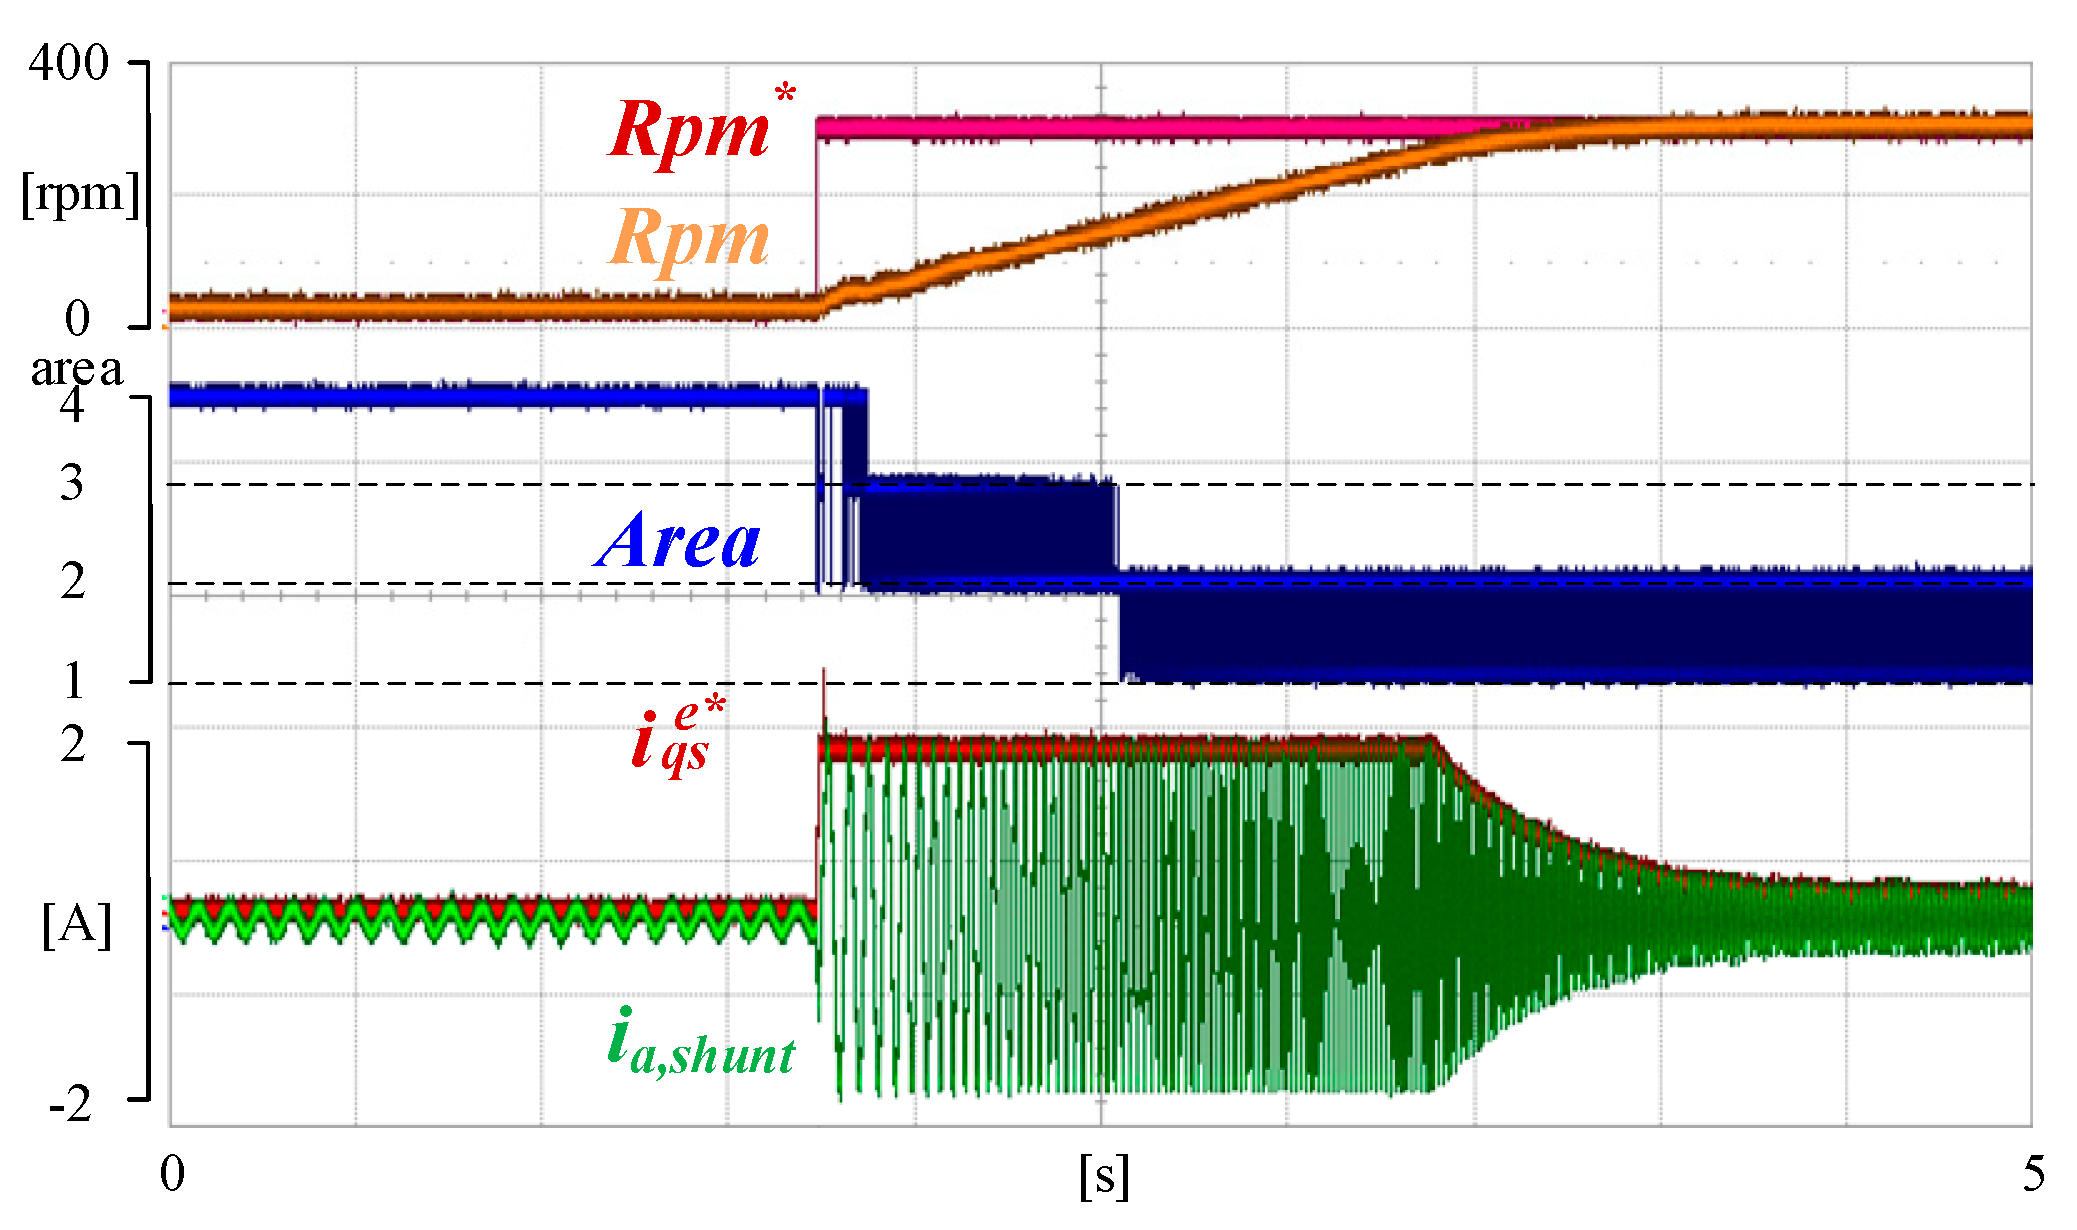
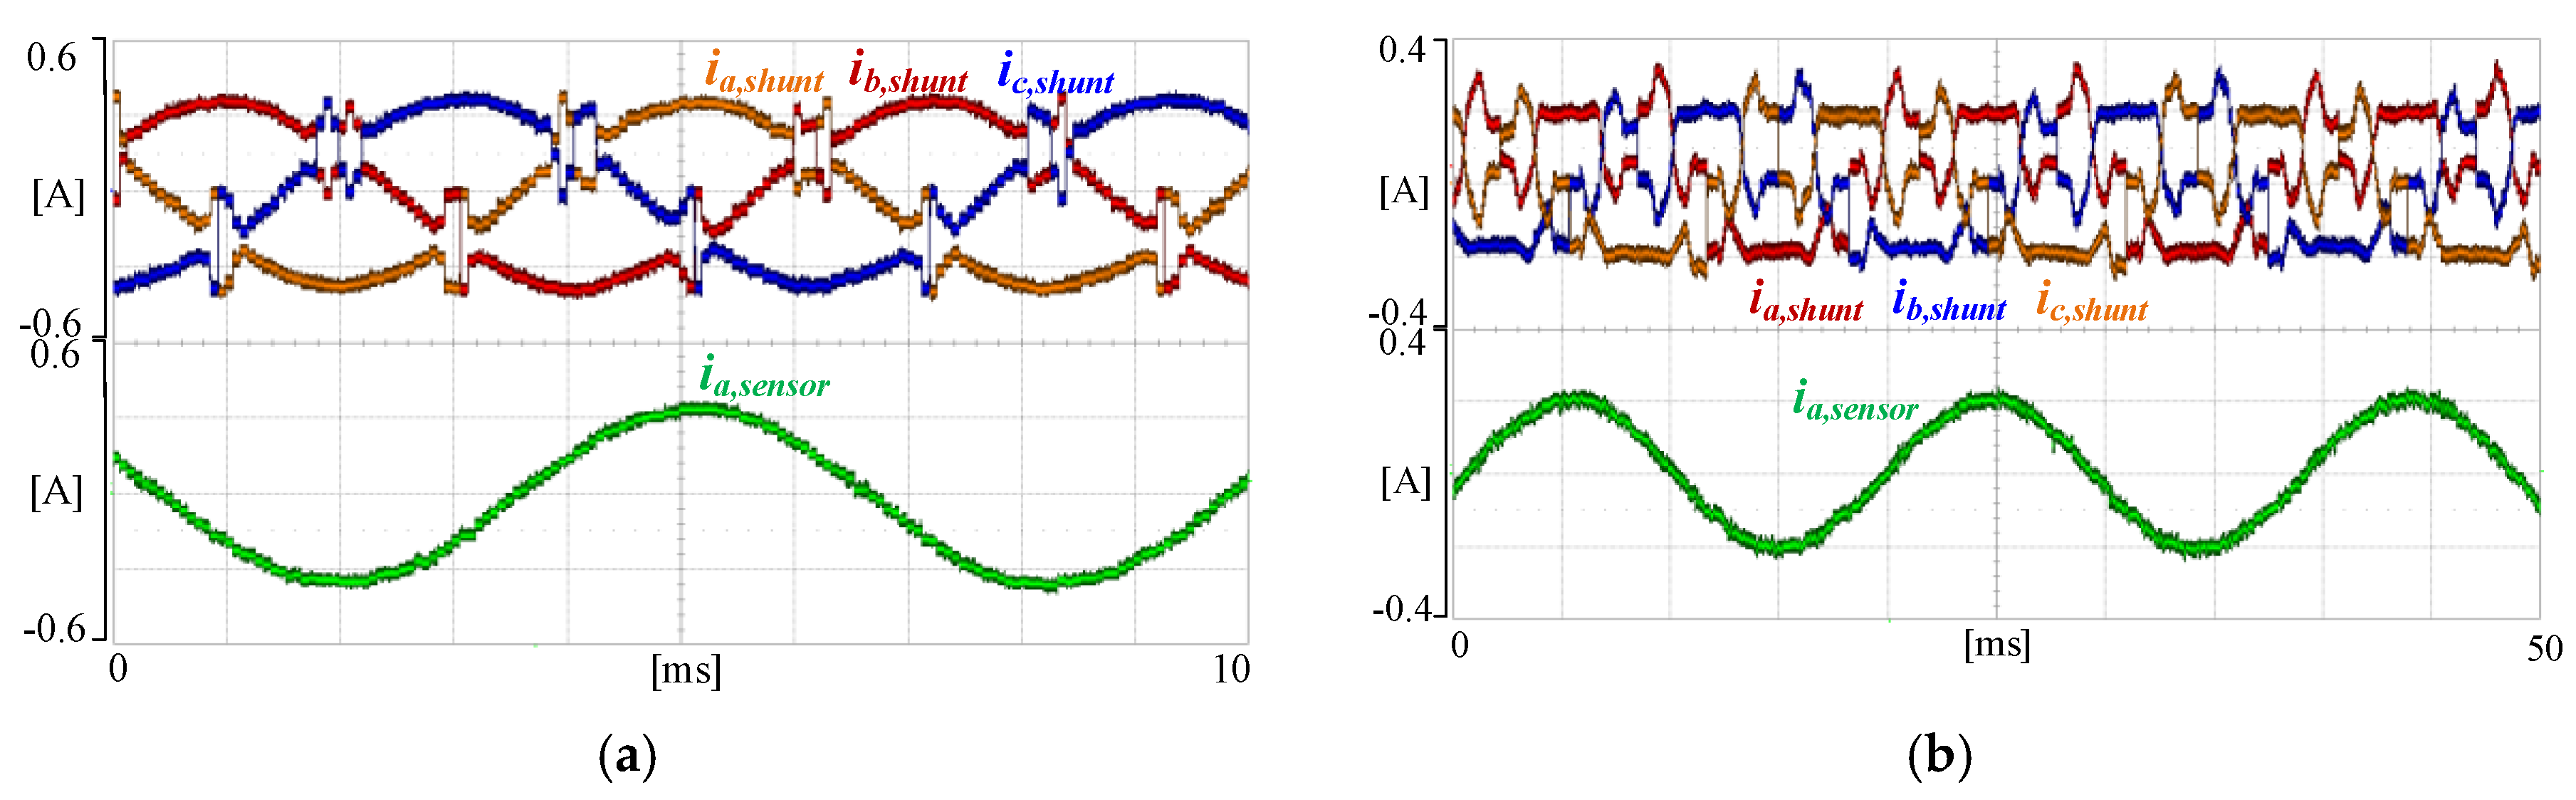
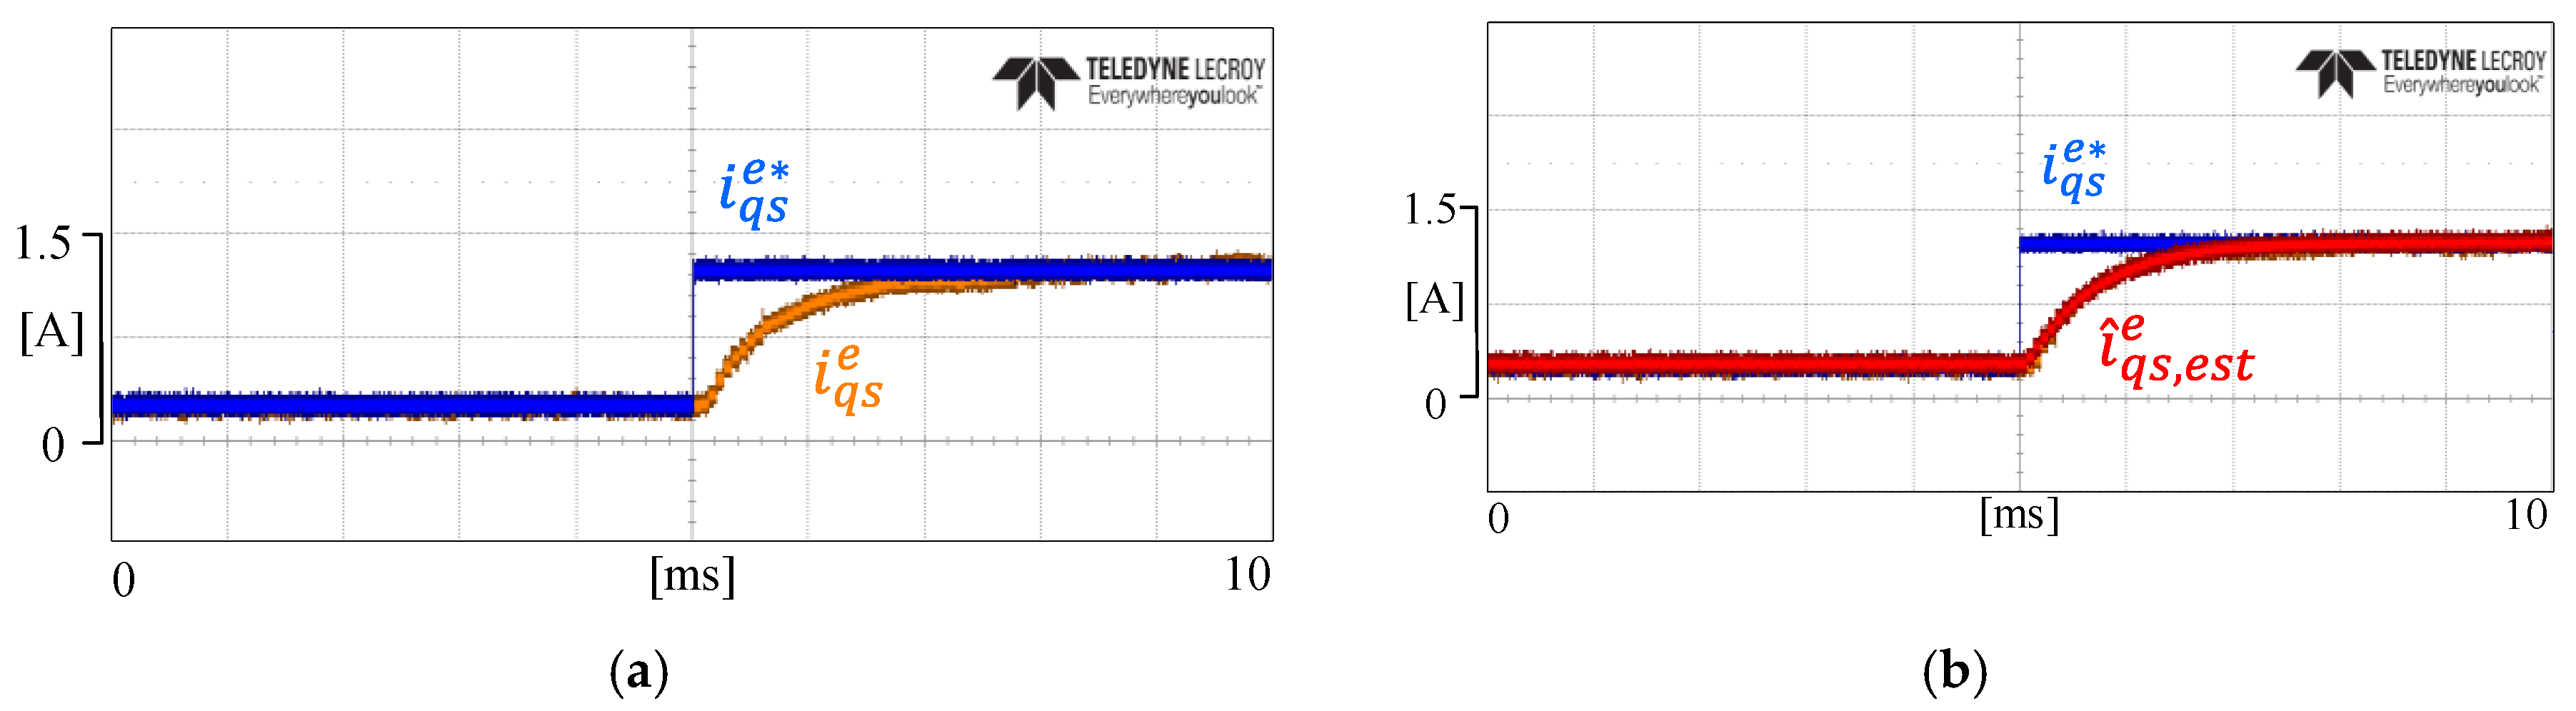
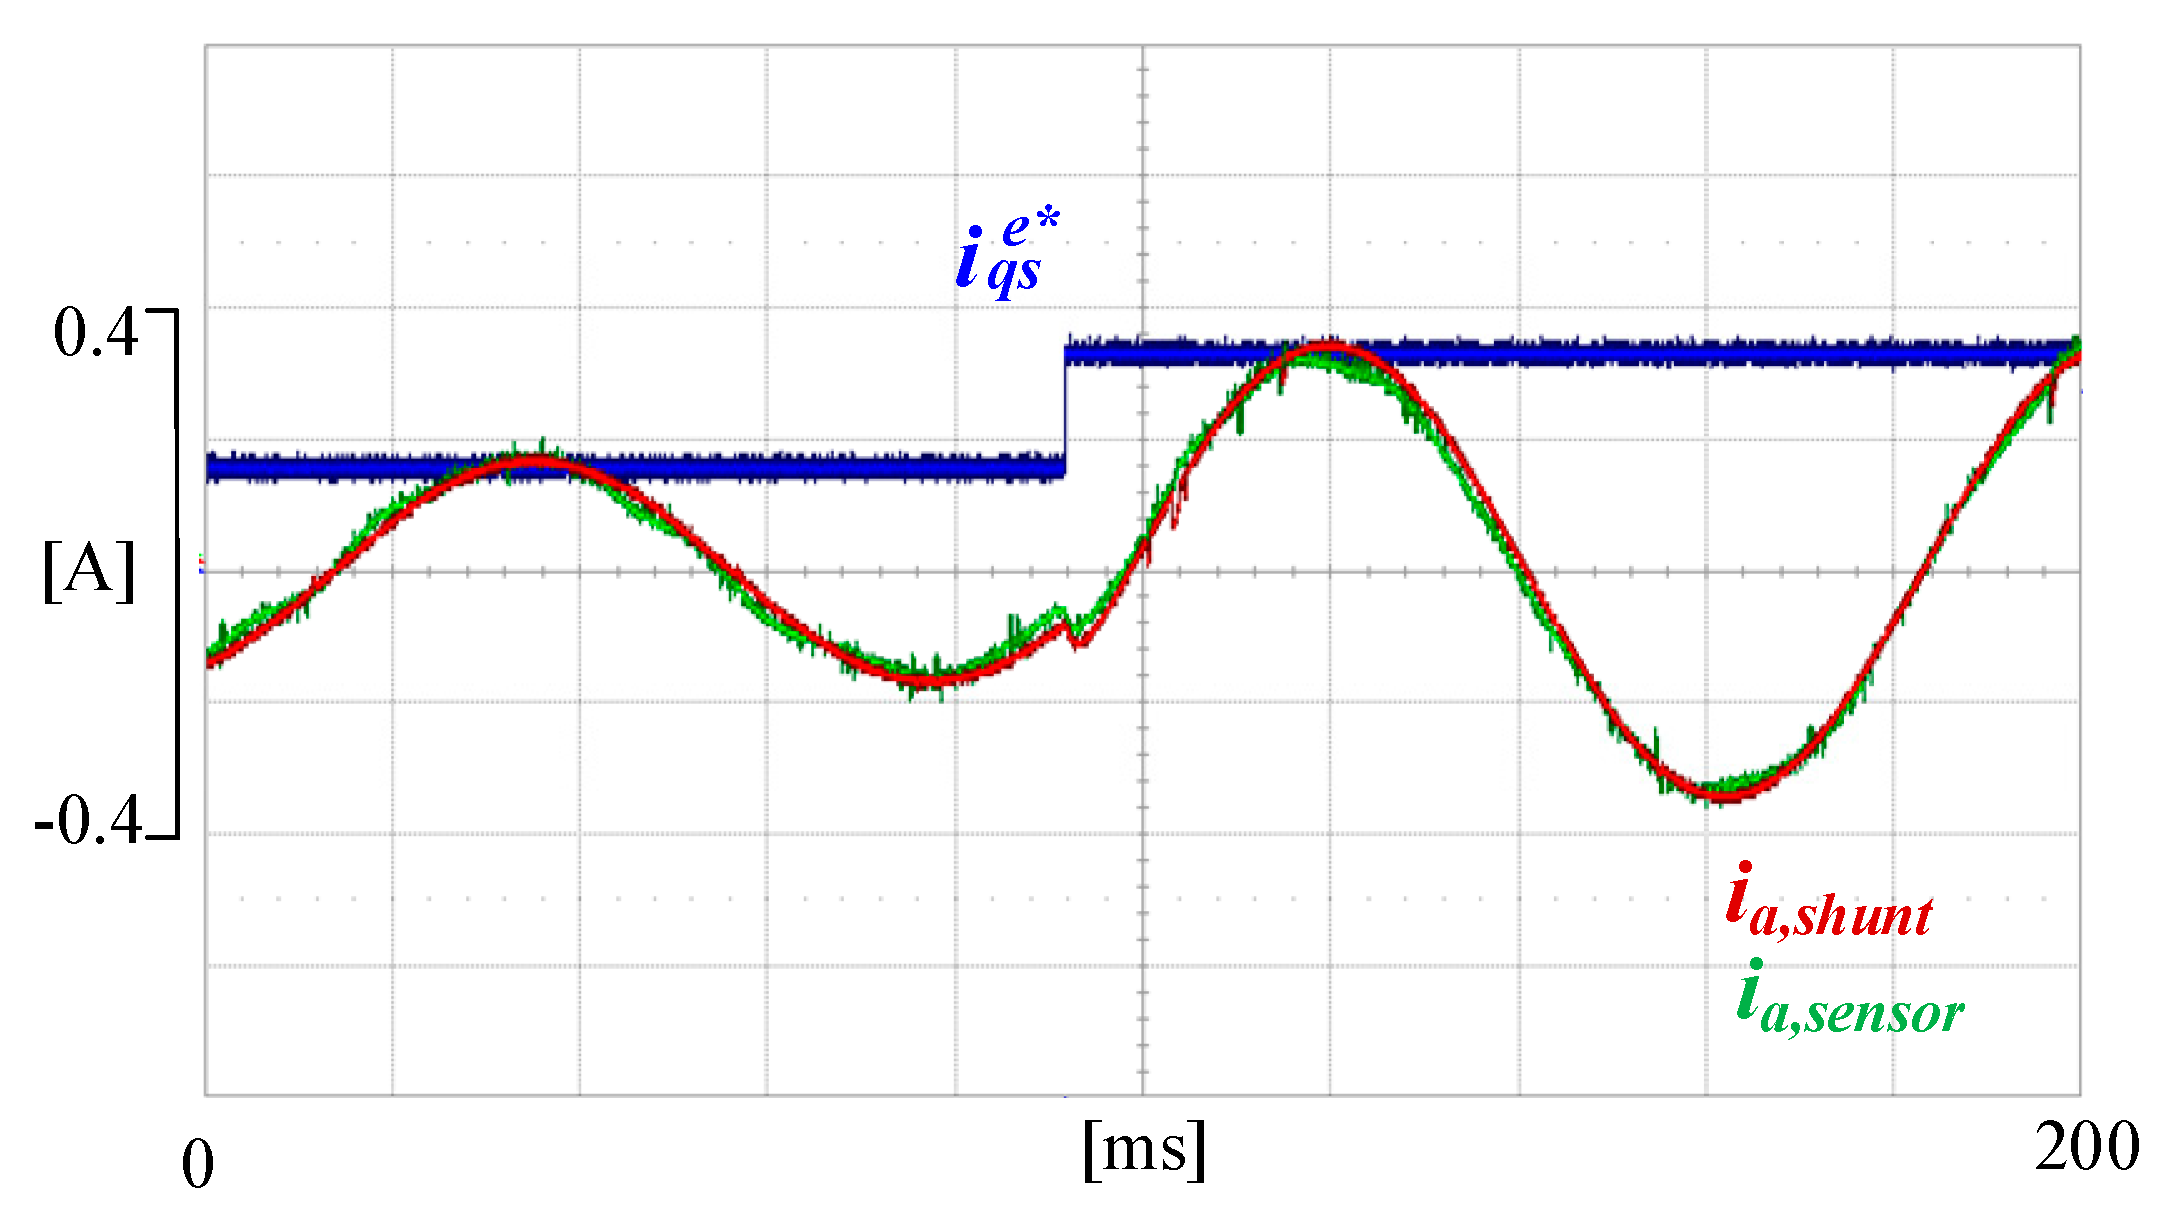
4. Experimental Results

In order to verify the proposed method, the experimental setup is implemented for a washing machine drive system with a DC link shunt resistor. The washing machine (TH19VD) was provided by LG Electronics (Changwon-si, Gyeongsangnam-do, Republic of Korea). The type of motor is SMPMSM (Surface-Mounted PMSM). The parameters of the motor and the inverter system are specified in Table 3. Figure 11 shows a block diagram of the hardware system. The inverter system is composed of a single-phase diode bridge and there is a DC-link capacitor whose capacity is 4700 [uF]. The IPM package (PS21A79) made by MITSUBISHI Inc. (Mitsubishi Electric Corporation, Chiyoda, Tokyo, Japan) is used for the inverter. The was TI 32-bit TMS320C28346 and a 12-bit AD converter was used.
To verify the current reconstruction in Areas 1, 2, 3, and 4, the motor is operated at 30 rpm, 130 rpm, and 400 rpm, respectively. When the motor is operated at 400 rpm, which is the rated speed, the voltage reference is repeated in Areas 1 and 2. For Areas 2 and 3, the operation speed is 130 rpm. At this speed, the proposed reconstruction method can be verified using current estimation. In addition, the motor is operated at 30 rpm to verify the intermittent PWM shift method in Area 4. Figure 12 shows the reconstructed phase current with and without the average current estimation method. As the estimated phase current, i a , s h u n t , is obtained by the average current estimation method in Figure 12b, the distortion of i a , s h u n t is much lower than i a , s h u n t without the average current estimation method in Figure 12a. Figure 13 shows the waveforms of the 1-shunt current when the motor is operated using the current sensor. In Figure 13a,b, the operating speed of the motor is 400 rpm or 130 rpm, respectively. From Figure 13, the reconstruction of the current is essential for precise control. Figure 14 shows the reconstructed current using the proposed current estimation method under the same conditions as in Figure 13. In this case, the control currents are reconstructed currents and the real current sampled by the current sensor is shown for comparison. The reconstructed current is equal to the current measured by the current sensor in Figure 14.
In Figure 15, the real q-axis current is compared with the estimated q-axis current when the step response is applied. In Figure 15a, the real q-axis current i q s e has the step response of first-order LPF as derived in Equation (17) and the estimated q-axis current i ^ q s e has the same response of the real q-axis current in Figure 15b. Figure 16 shows the phase current for the transient response. Although the reference of the q-axis current increases when the voltage reference vector passes through Areas 1 and 2, the estimated current is almost equal to the real current.
Figure 17 show the phase current and FFT result when the motor is operated in Area 4. The proposed intermittent PWM shift method is compared with the conventional MVI (minimum voltage injection) method. Figure 17a shows the reconstructed “a” phase current and real “a” phase current measured by the current probe when the motor is operated by using the conventional MVI method. The “a” phase current obtained by the current probe shows that the current pulsation is large due to the PWM shift. On the other hand, the proposed intermittent PWM shift method can reduce the pulsation, as shown in Figure 17b. Figure 17c shows the phase FFT result of the phase current. The conventional method has the harmonics near the frequency of 4 kHz, 11 kHz, and 15 kHz. On the other hand, the proposed method can reduce the harmonics.
Figure 18 shows the step response in Area 4. The current reconstructed by the proposed reconstruction method is controlled well, even though Area 4 is the region that cannot sample any current. Figure 19 shows the speed control of the full operation range. The operating speed of the motor is from 30 rpm to 250 rpm. Both Figure 18 and Figure 19 show the area change and the phase current while the actual speed reaches the speed reference.

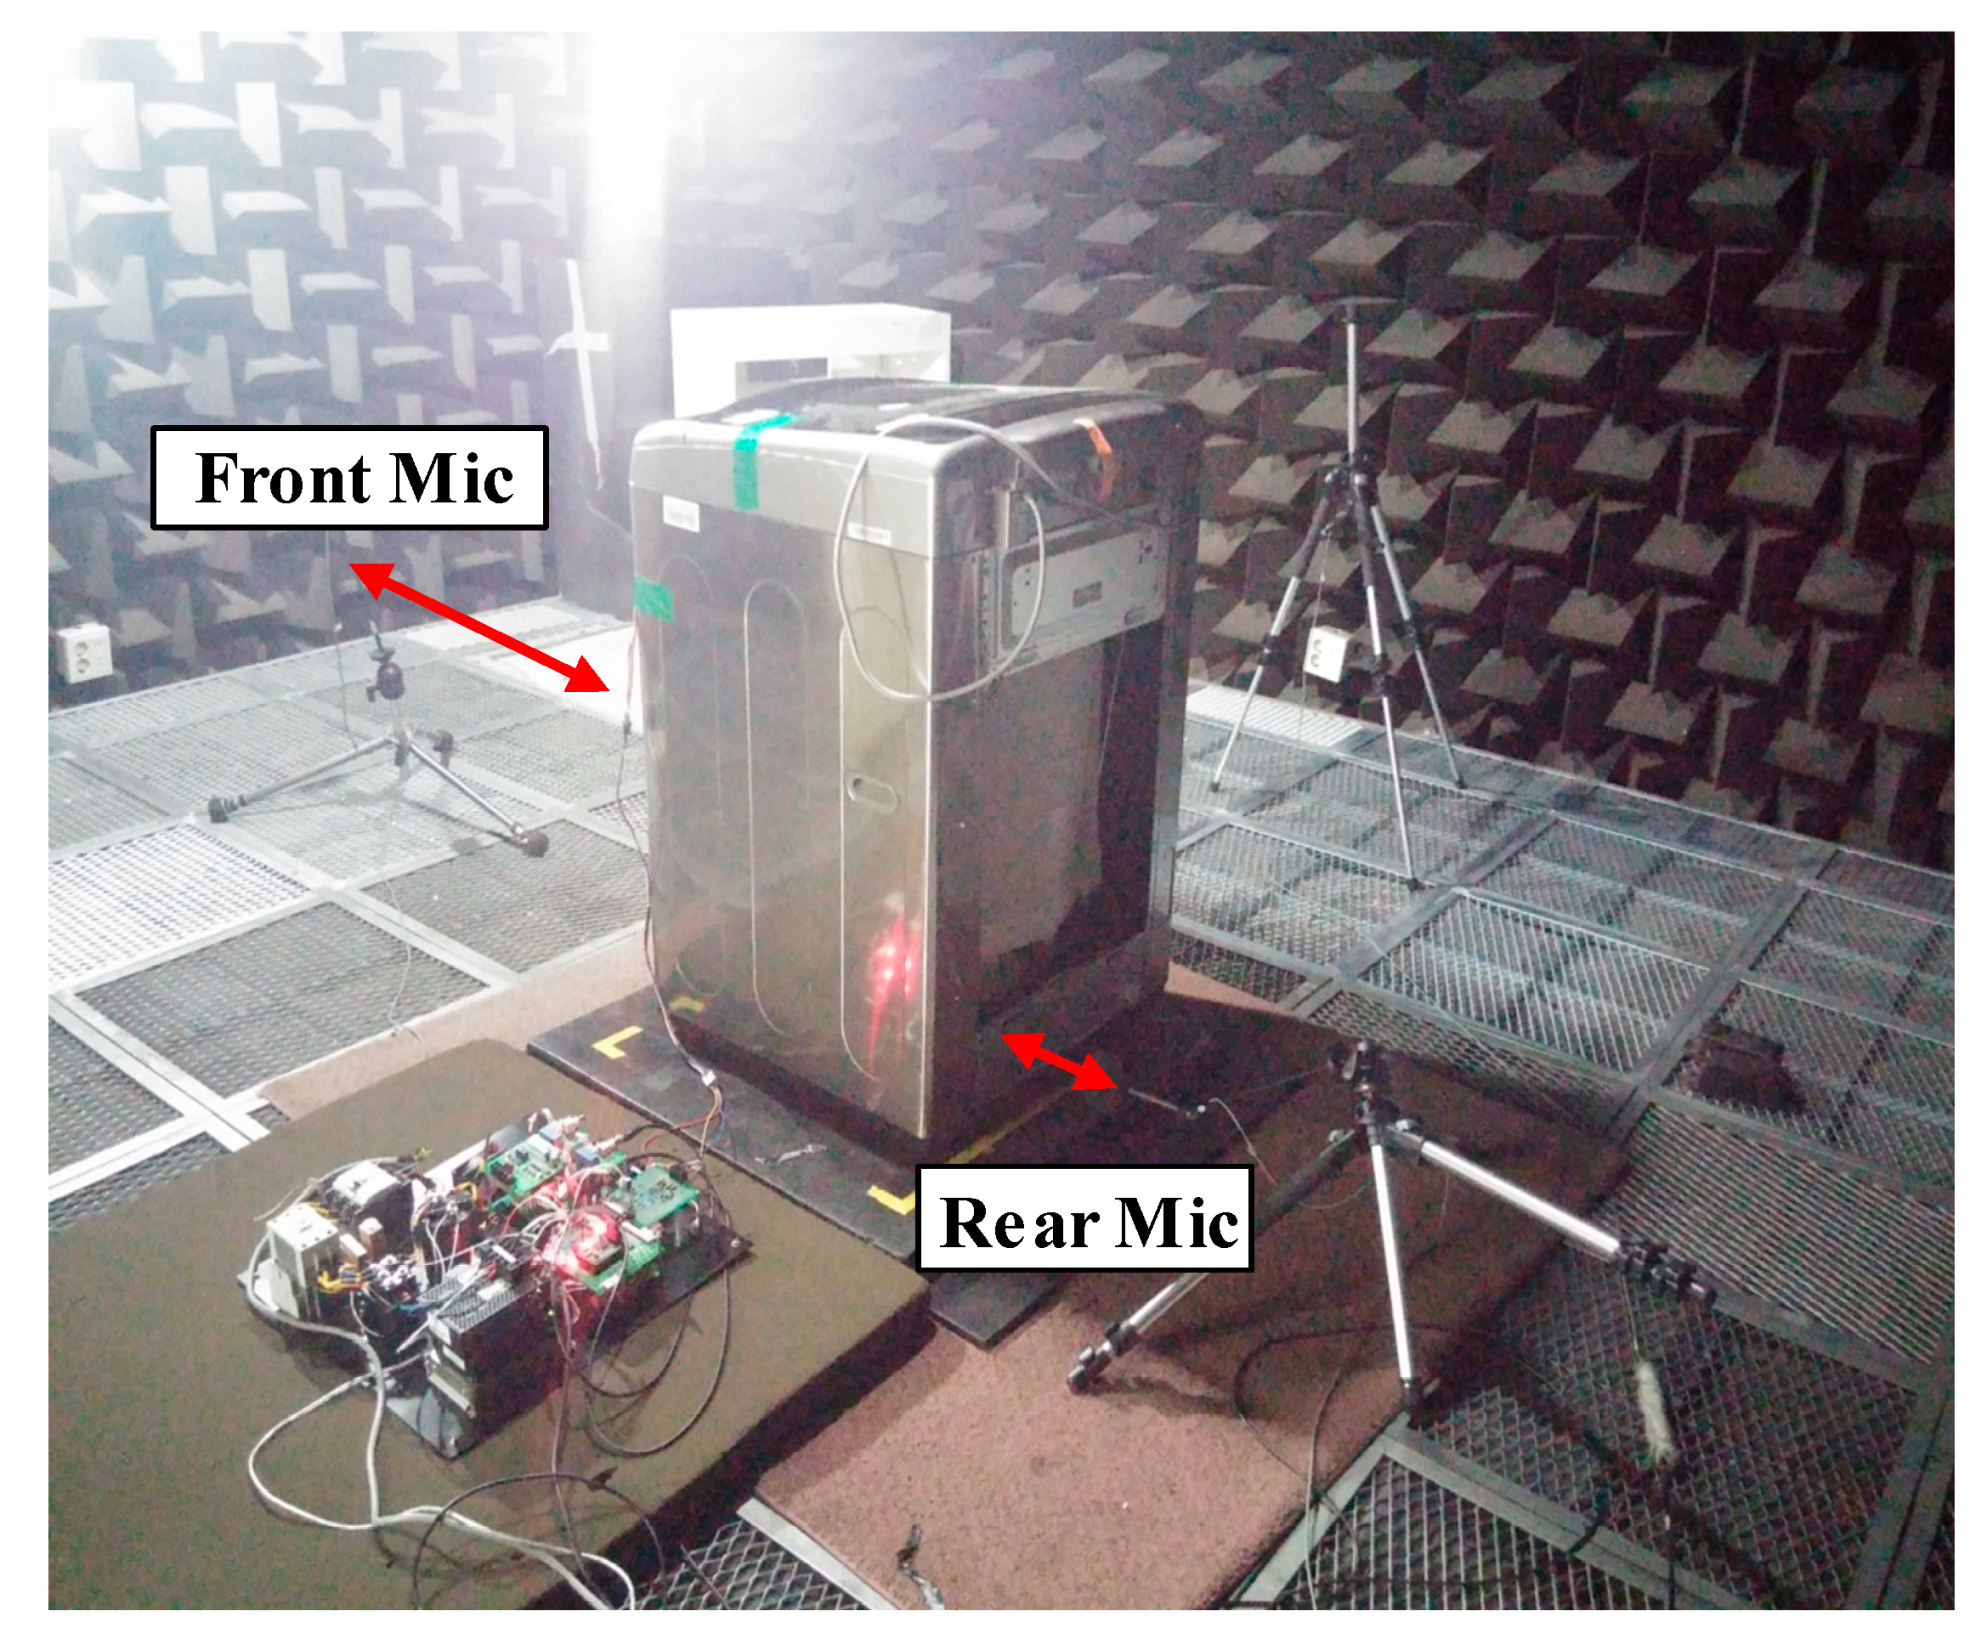
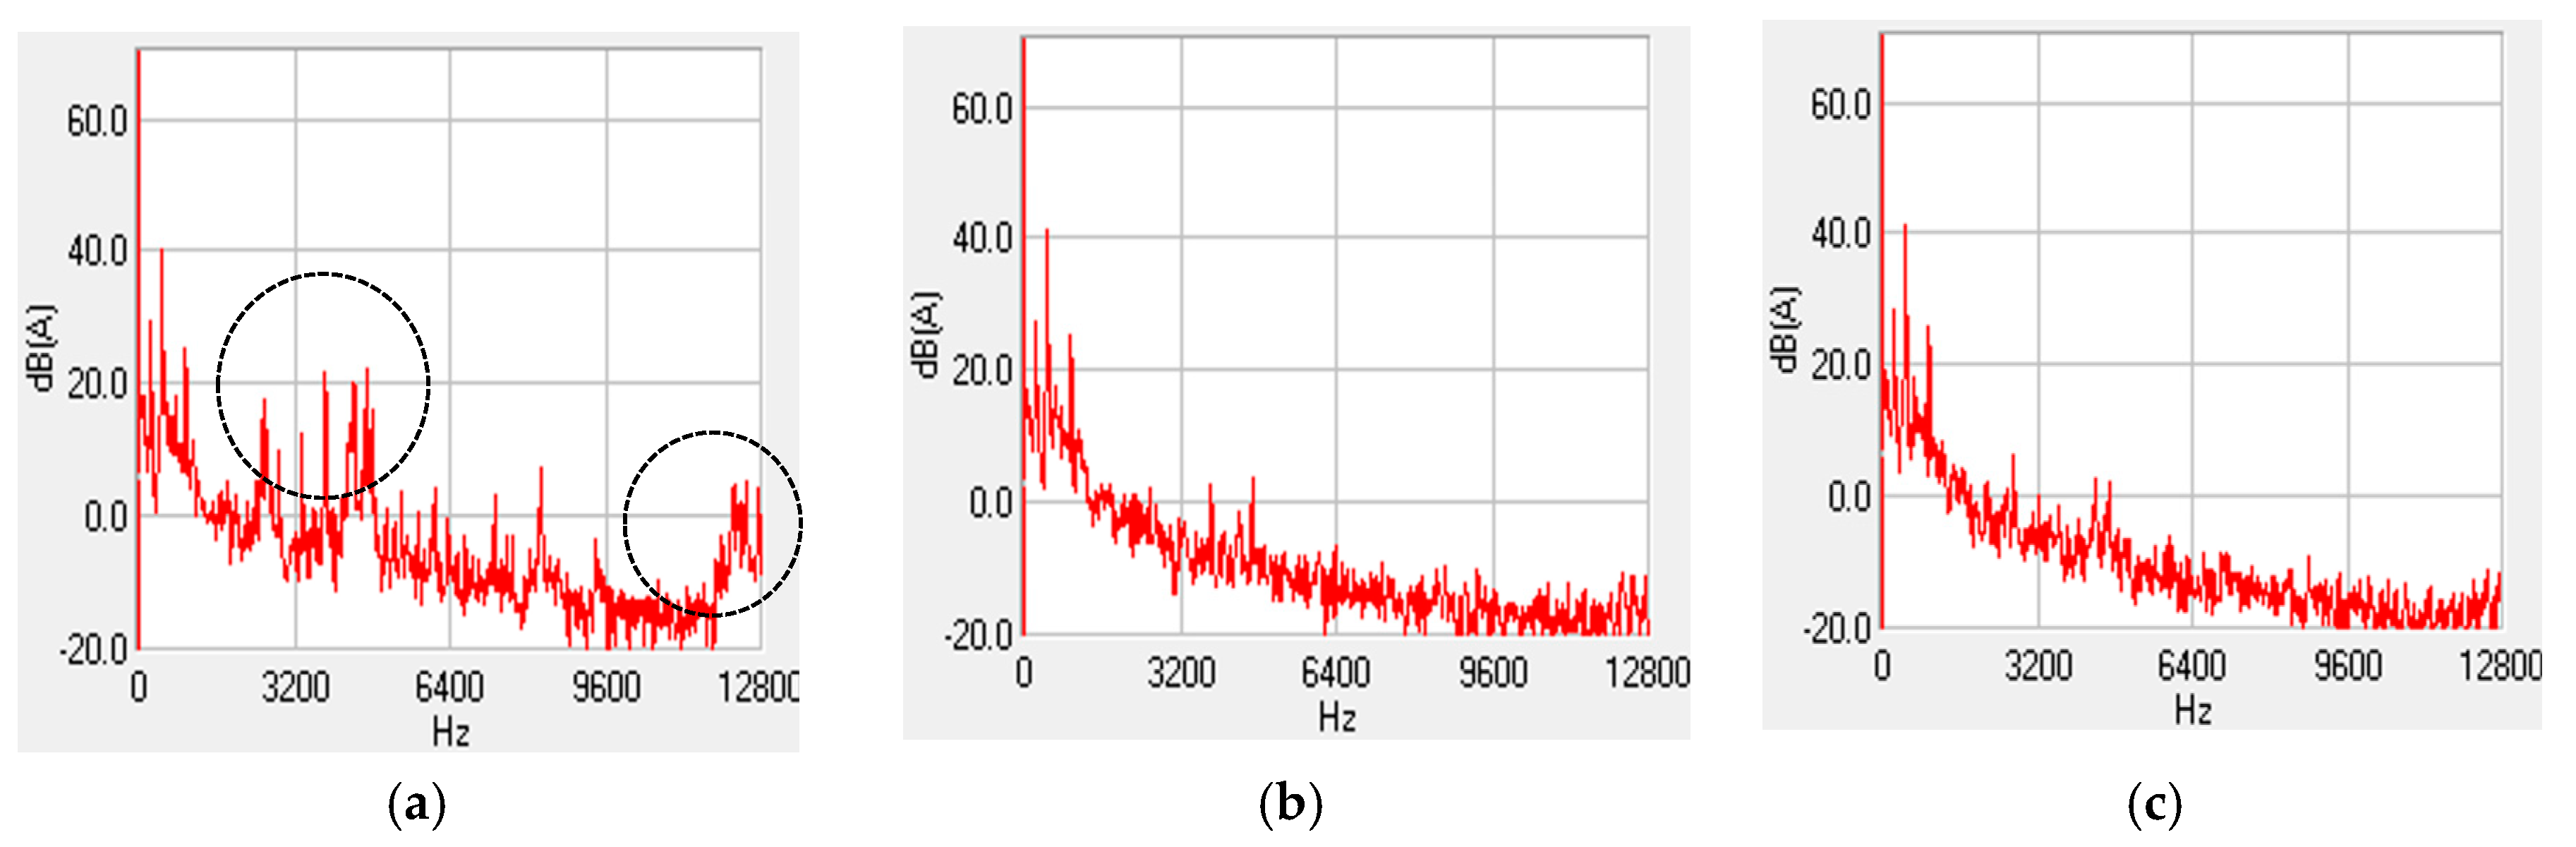
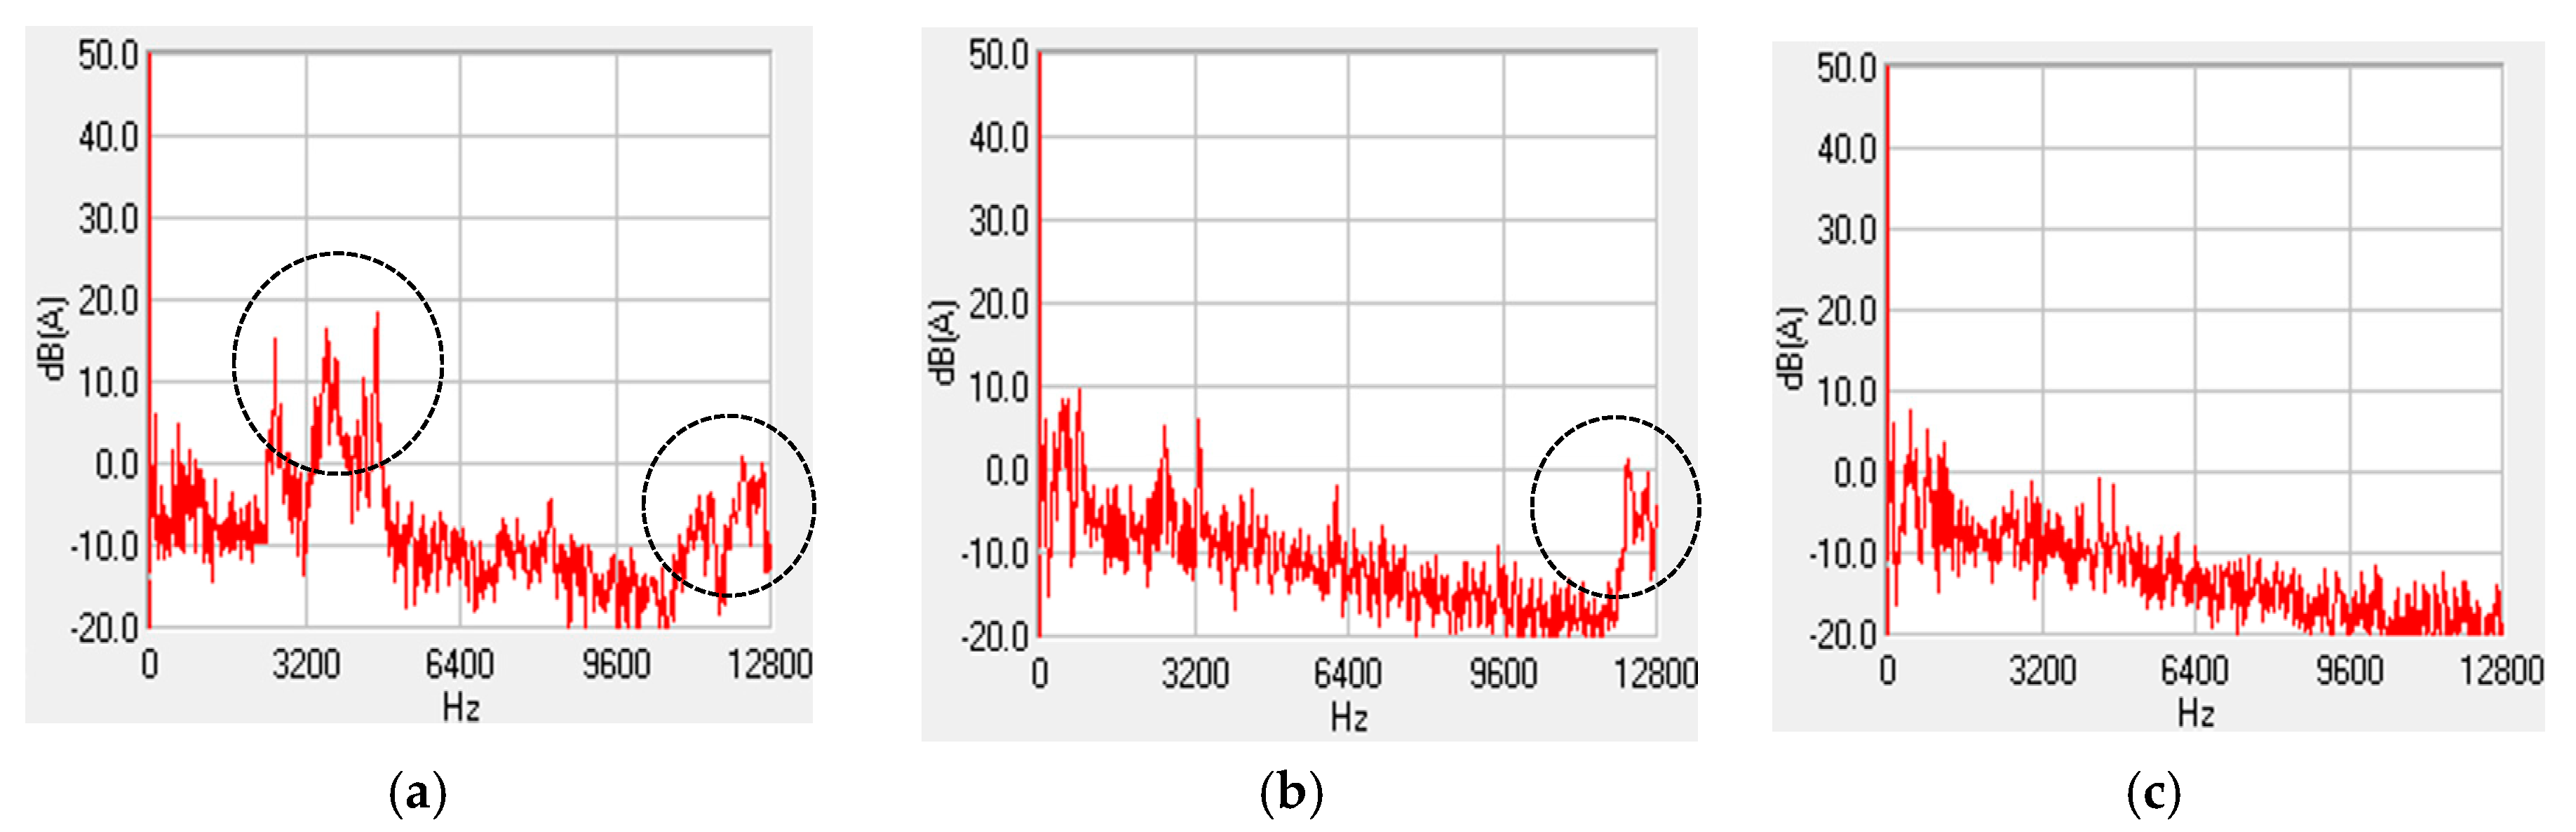
5. Measurement of the Acoustic Noise

As shown in Figure 20, the sound is measured at the anechoic chamber provided by LG Electronics and the washing machine is in the center of the room. The first mike for measuring the noise (front mic in Figure 20) is placed 70 cm from the floor and the distance between the washing machine and Front Mic is 1 m. The second mike (rear mic in Figure 20) is installed at the same height as the motor and is 10 cm away from the washing machine, and a rubber pad is installed to eliminate the fricative noise caused by the vibration of the washing machine.
Figure 21 and Figure 22 show the average noise results at 30 rpm and 400 rpm, respectively. The conventional method is compared with the proposed method and current sensor method. When comparing with Figure 21, the proposed intermittent PWM shift method moves the PWM pattern less than the conventional method, so that the noise near 4 kHz is smaller than in the conventional method. However, the noise near the switching frequency is larger than the control using a current sensor. Figure 22 show the results of the acoustic noise measurements of the conventional and the proposed method at 400 rpm. Since the proposed method reconstructs phase currents using the estimation method, not shifting the PWM pattern, the conventional method has higher noise, especially at 3–5 kHz, than the proposed method.

6. Conclusions

In this paper, current reconstruction methods using one shunt resistor are proposed. The proposed reconstruction method can be classified in two ways. First is using the electrical model of the motor. The current estimation is simply implemented by using the LPF. It can greatly reduce the acoustic noise and THD of the phase current. The second method is used in low modulation regions. This method can compensate for the accumulation of error when the current estimation method is continuously used in a low modulation region. To compensate for the error, an intermittent PWM shift is used to update the estimation current in the measurable region. In this case, the frequency of the injected voltage is not fixed, unlike in the conventional method, and the magnitude of the injected voltage is lower than in the conventional method. As a result, the proposed current reconstruction method has better performance for the THD of the phase current and acoustic noise. The validity of the proposed method is proven by the experimental results, which involve sound measurement in an anechoic chamber.

Author Contributions

C.H.P. and D.Y.K. contributed to the research design and to manuscript writing. H.B.Y. performed the experiments and software writing. Y.D.S. and J.M.K. provided technical feedback and supervision of the overall work.

Funding

This research received no external funding.

Acknowledgments

This work was supported by BK21PLUS, Creative Human Resource Development Program for IT Convergence.

Conflicts of Interest

The authors declare no conflict of interest.

References

  1. Cho, B.G.; Ha, J.I.; Sul, S.K. Voltage Injection Method for Boundary Expansion of Output Voltages in Three Shunt Sensing PWM Inverters. In Proceedings of the 8th International Conference on Power Electronics-ECCE Asia, Jeju, Korea, 30 May–3 June 2011; pp. 411–415. [Google Scholar]
  2. Nannan, Z.; Bihe, Y.; Jiangbo, Q.; Gaolin, W.; Guoijiang, Z.; Diangu, X. Three-Phase Current Reconstruction Applying Constant Power Voltage Injection Method Using Three Shunt Resistors. In Proceedings of the 8th IEEE International Power Electronics and Motion Control Conference, Hefei, China, 22–26 May 2016. [Google Scholar]
  3. Jang, Y.H.; Kim, D.Y.; Ko, A.Y.; Won, I.K.; Kim, Y.R.; Won, C.Y. Three phase current reconstruction method using predictive current in three shunt sensing PWM inverter. In Proceedings of the IEEE Transportation Electrification Conference and Expo, Busan, Korea, 1–4 June 2016; pp. 436–440. [Google Scholar]
  4. Lee, J.S.; Im, W.S.; Kim, J.M. An over modulation method for space vector PWM inverters with dc-link shunt resistor. In Proceedings of the 8th International Conference on Power Electronics-ECCE-Asia, Jeju, Korea, 30 May–3 June 2011; pp. 1997–2004. [Google Scholar]
  5. Gu, Y.; Ni, F.; Yang, D.; Liu, H. Switching-State Phase Shift Method for Three-Phase-Current Reconstruction with a Single DC-Link Current Sensor. IEEE Trans. Ind. Electron. 2011, 58, 5186–5194. [Google Scholar]
  6. Lee, W.C.; Hyun, D.S.; Lee, T.K. A Novel Control Method for Three-Phase PWM Rectifiers Using a Single Current Sensor. IEEE Trans. Power Electron. 2000, 15, 861–870. [Google Scholar]
  7. Ha, J.I. Voltage Injection Method for Three-Phase Current Reconstruction in PWM Inverters Using a Single Sensor. IEEE Trans. Power Electron. 2009, 24, 767–775. [Google Scholar]
  8. Blaabjerg, F.; Pedersen, J.K. An ideal PWM-VSI inverter using only one current sensor in the DC-link. In Proceedings of the Fifth International Conference on Power Electronics and Variable-Speed Drives, London, UK, 26–28 October 1994; pp. 458–464. [Google Scholar]
  9. Haifeng, L.; Xiaomeng, C.; Wenlong, Q.; Shuang, S.; Yituo, L.; Zhengyu, W. A Three-Phase Current Reconstruction Technique Using Single DC Current Sensor Based on TSPWM. IEEE Trans. Power Electron. 2014, 29, 1542–1550. [Google Scholar] [CrossRef]
  10. Simeng, X.; Chong, C. Random PWM Technique Based Induction Motor Phase Current Reconstruction from DC-link Current of Inverters. In Proceedings of the 5th IEEE Conference on Industrial Electronics and Application, Taichung, Taiwan, 15–17 June 2010; pp. 749–752. [Google Scholar]
  11. Lin, Y.K.; Lai, Y.S. PWM Technique to Extend Current Reconstruction Range and Reduce Common-Mode Voltage for Three-Phase Inverter using DC-link Current Sensor Only. In Proceedings of the IEEE Energy Conversion Congress and Exposition, Phoenix, AZ, USA, 17–22 September 2011; pp. 1978–1985. [Google Scholar]
  12. Moynihan, J.F.; Bolognani, S.; Kavanagh, R.C.; Egan, M.G.; Murphy, J.M.D. Single sensor current control of AC servo drives using digital signal processors. In Proceedings of the Fifth European Conference on Power Electronics and Applications, Brighton, UK, 13–16 September 1993; pp. 415–421. [Google Scholar]
  13. Li, Y.; Nesimi, E. An Observer-Based Three-Phase Current Reconstruction using DC Link Measurement in PMAC Motors. In Proceedings of the CES/IEEE 5th International Power Electronics and Motion Control Conference, Shanghai, China, 14–16 August 2016; pp. 1–5. [Google Scholar]
  14. Saritha, B.; Janakiraman, P.A. Sinusoidal Three-Phase Current Reconstruction and Control Using a DC-Link Current Sensor and a Curve-Fitting Observer. IEEE Trans. Ind. Electron. 2006, 54, 2657–2664. [Google Scholar] [CrossRef]
  15. Xu, Y.; Yan, H.; Zou, J.; Wang, B.; Li, Y. Zero Voltage Vector Sampling Method for PMSM Three-Phase Current Reconstruction Using Single Current Sensor. IEEE Trans. Power Electron. 2016, 32, 3797–3807. [Google Scholar] [CrossRef]
  16. Yan, H.; Xu, Y.; Zou, J. A phase Current Reconstruction Approach for Three-Phase Permanent-Magnet Synchronous Motor Drive. Energies 2016, 9, 853. [Google Scholar] [CrossRef]
  17. Kim, K.S.; Yeom, H.B.; Ku, H.K.; Kim, J.M. Current reconstruction method with single DC-link sensor based on the PWM inverter and AC motor. In Proceedings of the IEEE Energy Conversion Congress and Exposition (ECCE), Pittsburgh, PA, USA, 14–18 September 2014; pp. 250–256. [Google Scholar]
  18. Chun, D.-W.; Kim, J.-S.; Sul, S.-K. Unified voltage modulation technique for real-time three-phase power conversion. IEEE Trans. Ind. Appl. 1998, 34, 374–380. [Google Scholar] [CrossRef]
  19. Yeom, H.B.; Ku, H.K.; Kim, J.M. Current Reconstruction Method for PMSM Drive System with a DC Link Shunt Resistor. In Proceedings of the IEEE Energy Conversion Congress and Exposition (ECCE), Milwaukee, WI, USA, 18–22 September 2016; pp. 1–6. [Google Scholar]
  20. Briz, F.; Degner, M.W.; Lorenz, R.D. Dynamic Analysis of Current Regulators for AC Motors Using Complex Vectors. IEEE Trans. Ind. Appl. 1999, 35, 1424–1432. [Google Scholar] [CrossRef]
  21. Sul, S.K. Control of Electric Machine Drive Systems; Wiley: New York, NY, USA, 2011; pp. 173–175. [Google Scholar]
  22. Silverio, B. Design Issues and Estimation Errors Analysis of Back-EMF-Based Position and Speed Observer for SPM Synchronous Motors. IEEE Trans. Power Electron. 2014, 2, 159–170. [Google Scholar]
Figure 1. 1-shunt inverter with SPMSM.
Energies 12 01423 g001
Figure 2. Unmeasurable area in the hexagon of the space vector: (a) Bar area; (b) Star area.
Energies 12 01423 g002
Figure 3. Conventional PWM shift method to reconstruct the current: (a) Example of V d q s * , V s , V c ; (b) switching pattern.
Energies 12 01423 g003
Figure 4. Operation area depending on the voltage reference vector V * : (a) | V * | > 2 Δ V ; (b) 2 3 Δ V < | V * | < 2 Δ V ; (c) | V * | < 2 3 Δ V .
Energies 12 01423 g004
Figure 5. Switching patterns and current wave form of shunt resistor in sector 6.
Energies 12 01423 g005
Figure 6. The estimation of the average phase current in sector 6: (a) The estimation method of “a” phase current at the 1st sampling time; (b) the estimation method of “b” phase current at the 2nd sampling time.
Energies 12 01423 g006
Figure 7. Block diagram of the PI current controller and the motor.
Energies 12 01423 g007
Figure 8. The proposed current estimation method by using the LPF.
Energies 12 01423 g008
Figure 9. Trajectory of the voltage reference vector and the proposed sampling voltage in Area 4: (a) Trajectory of V d q s * and V s ; (b) V s and the border line.
Energies 12 01423 g009
Figure 10. Block diagram of the proposed current reconstruction method in all operation regions.
Energies 12 01423 g010
Figure 11. Configuration of the hardware system.
Energies 12 01423 g011
Figure 12. The reconstructed phase current using the shunt resistor method in Areas 1 and 2 (Figure 4a): (a) without the average current estimation method; (b) with the average current estimation method.
Energies 12 01423 g012
Figure 13. The phase current sampled through shunt resistor without the current reconstruction method at 400 rpm (Figure 4a) and 130 rpm (Figure 4b): (a) Current waveform from shunt resistor at 400 rpm; (b) current waveform from the shunt resistor at 130 rpm.
Energies 12 01423 g013
Figure 14. The phase current sampled through shunt resistor with the proposed current estimation method at 400 rpm (Figure 4a) and 130 rpm (Figure 4b): (a) Current waveform from shunt resistor at 400 rpm; (b) current waveform from the shunt resistor at 130 rpm.
Energies 12 01423 g014
Figure 15. The phase current sampled through shunt resistor with the proposed current estimation method: (a) Reference q-axis current and real current; (b) reference q-axis current and estimated current.
Energies 12 01423 g015
Figure 16. Step response of the real and estimated q-axis current.
Energies 12 01423 g016
Figure 17. The phase current sampled through shunt resistor when the motor is operated at 30 rpm: (a) Conventional voltage injection method; (b) proposed intermittent PWM shift method; (c) FFT result of the phase current.
Energies 12 01423 g017
Figure 18. The phase current sampled through the shunt resistor when the step response is induced in Area 4.
Energies 12 01423 g018
Figure 19. The transient response of speed control through all operation regions.
Energies 12 01423 g019
Figure 20. Anechoic chamber provided by LG Electronics.
Energies 12 01423 g020
Figure 21. Results of the acoustic noise measurements at 30 rpm: (a) Conventional method; (b) proposed method; (c) current sensor.
Energies 12 01423 g021
Figure 22. Results of the acoustic noise measurements at 400 rpm: (a) Conventional method; (b) proposed method; (c) current sensor.
Energies 12 01423 g022
Table 1. DC link current according to voltage sectors.
Voltage Vector i shunt
V 1 ( 100 ) i a
V 2 ( 110 ) i c
V 3 ( 010 ) i b
V 4 ( 011 ) i a
V 5 ( 001 ) i c
V 6 ( 101 ) i b
V 0 ( 000 ) , V 7 ( 111 ) 0
Table 2. Current slope according to the switching states.
Switching StateCurrent Slope of i a Current Slope of i b Current Slope of i c
V 1 ( 100 ) 3 E a + 2 V d c 3 L 3 E b V d c 3 L 3 E c V d c 3 L
V 2 ( 110 ) 3 E a + V d c 3 L 3 E b + V d c 3 L 3 E c 2 V d c 3 L
V 3 ( 010 ) 3 E a V d c 3 L 3 E b + 2 V d c 3 L 3 E c V d c 3 L
V 4 ( 011 ) 3 E a 2 V d c 3 L 3 E b + V d c 3 L 3 E c + V d c 3 L
V 5 ( 001 ) 3 E a V d c 3 L 3 E b V d c 3 L 3 E c + 2 V d c 3 L
V 6 ( 101 ) 3 E a + V d c 3 L 3 E b 2 V d c 3 L 3 E c + V d c 3 L
V 0 ( 000 ) , V 7 ( 111 ) E a L E b L E c L
Table 3. Parameters of the system.
V d c 310 [V]Poles48
T s 66.67 [us] R s 5.9 [ Ω ]
T min 7 [us] L s 537.5 [mH]
Rated speed400 [rpm] K e 0.1528 [Vˑs/rad]
Rated power430 [W] R shunt 0.2 [ Ω ]

