Article

Study on Powder Coke Combustion and Pollution Emission Characteristics of Fluidized Bed Boilers

1
Key Laboratory of Low-Grade Energy Utilization Technologies and Systems, Chongqing University, Ministry of Education, Chongqing 400030, China
2
School of Energy and Power Engineering, Chongqing University, Chongqing 400030, China
3
Science and Technology on Reactor System Design Technology Laboratory, Nuclear Power Institute of China, Chengdu 610213, China
*
Author to whom correspondence should be addressed.
Energies 2019, 12(8), 1424; https://doi.org/10.3390/en12081424
Submission received: 22 February 2019 / Revised: 6 April 2019 / Accepted: 9 April 2019 / Published: 13 April 2019
(This article belongs to the Special Issue Cleaner Combustion)

Abstract

:
The fluidized reactor is widely used in a number of chemical processes due to its high gas-particle contacting efficiency and excellent performance on solid mixing. An improved numerical framework based on the multiphase particle-in-cell (MP-PIC) method has been developed to simulate the processes of gas–solid flow and chemical reactions in a fluidized bed. Experiments have been carried out with a 3-MW circulating fluidized bed with a height of 24.5 m and a cross section of 1 m2. In order to obtain the relationship between pollutant discharge and operating conditions and to better guide the operation of the power plant, a series of tests and simulations were carried out. The distributions of temperature and gas concentration along the furnace from simulations achieved good accuracy compared with experimental data, indicating that this numerical framework is suitable for solving complex gas–solid flow and reactions in fluidized bed reactors. Through a series of experiments, the factors affecting the concentration of NOx and SOx emissions during the steady-state combustion of the normal temperature of powder coke were obtained, which provided some future guidance for the operation of a power plant burning the same kind of fuel.

1. Introduction

The fluidized reactor is widely used in a number of chemical processes (e.g., circulating fluidized bed boiler combustion, biomass pyrolysis, catalytic reaction, and conceptual fluidized bed nuclear reactor [1,2,3,4]) due to its high gas-particle contacting efficiency, wide fuel adaptability, and excellent performance on solid mixing. Powder coke, which is also called semicoke or coke powder, was used as fuel in this fluidized bed boiler research. The powder coke used in the experiment was a high-quality Jurassic coal block produced in China’s Shenfu coalfield, which was carbonized and burned in an internally heated vertical retort. Its structure is blocky and its color is light black. It is a fuel and reducing agent for ferroalloys, fertilizers, calcium carbide, blast furnace injection, and other applications. As a new type of fluidized bed boiler fuel, it has a relatively high fixed carbon content; low ash, aluminum, and sulfur contents; and its specific resistance and chemical activity are high. With the slowdown of China’s domestic thermal power market growth, higher requirements for energy savings and emissions reductions for new power plants are required. Thus, vigorous development of circulating fluidized bed (CFB) boiler combustion technology for special fuels has important strategic significance for broadening the future circulating fluidized bed market.
In order to study the fuel combustion and emission characteristics of fluidized bed boilers, a large number of experiments have been implemented over the past years to optimize the operating parameters of these fluidized bed boilers to achieve higher performance and lower costs. Further, extensive mathematical models of multiphase flow and reaction have been developed to explore the gas–solid flow reaction characteristics in fluidized bed boiler furnaces.
With the development of technology, the computing power of large computers continues to increase, and numerical methods have become a powerful tool to study the phenomenon of gas-solid fluidized flow reaction. Two theoretical approaches have been proposed to simulate the complex physical and chemical processes in a fluidized reactor, namely, the Eulerian-Eulerian method, also called the two-fluid model (TFM), and the hybrid Eulerian-Lagrangian model (HEL) [5,6,7]. The two-fluid model treats the solid phase as a pseudocontinuum; an analogy is made between the kinetic theory of granular flow with the molecular kinematic theory of dense gas. The macroscopic characteristics of fluidized reactors can be calculated with relatively small computational cost. This approach has been developed since it was first applied in the simulation of gas–solid flow in a riser by Sinclair and Jackson [8]. However, important parameters, such as particle size distribution and size variation due to reaction or collision, are very hard to describe with this method. Many unclosed terms are also generated during the solid particle averaging procedure, and methods to couple gas-phase turbulence with particle fluctuation still have their limits [9].
The hybrid Eulerian-Lagrangian approach, in which a particle is treated as a discrete element [10,11], is a good way to solve the gas–solid fluidized bed reaction. For the HEL model, each particle, composed of physical (size, temperature, and density) and chemical (reactive) properties, can be tracked individually, and detailed microscopic properties (particle trajectory and transient forces acting on a specific particle), which are extremely difficult to acquire by the TFM method, can also be obtained at the particle level. In this model, the computational cost increases rapidly when the number of particles calculated increases. Therefore, it is very difficult to achieve greater accuracy of the gas-particle flow field by simply adding the number of particles simulated. In order to overcome the contradiction of accuracy and computational cost, the multiphase particle-in-cell (MP-PIC) method is proposed to calculate the properties of particles in dense particle flow [12]. In the MP-PIC method, the solid phase is treated as both a continuum and a discrete phase, the particle stress gradient is calculated on the grid, and the particle properties are mapped from the Lagrangian coordinates to a Eulerian grid by the use of interpolation functions. This approach can attain a good equilibrium between CPU cost and the accuracy of results when simulating industrial-scale fluidized reactors.
Based on the MP-PIC method, Snider and Banerjee simulated a heterogeneous catalytic chemistry process in fluidized ozone decomposition and made a comparison between it with experimental results [13]. Abbsabi et al. simulated the 2D physical and chemical performance of the feeding section of a fast fluidized bed steam gasifier [14]. Xie et al. developed a 3D numerical model and used it to simulate coal gasification in a fluidized bed gasifier [11]. Ryan et al. used this method to investigate the performance of a carbon capture fluidized bed reactor [15]. Adamczyk et al. used this approach to model particle transport and combustion in an industrial-scale CFB boiler [16]. Loha et al. made a 3D kinetic simulation of fluidized bed biomass gasification by coupling the chemical reactions with the hydrodynamic calculation of gas–solid flow [17]. Zhong et al. modeled the olive cake combustion process in CFB with the gas flow solved by large eddy simulation [18]. In these studies, the calculated particles were treated as being of spherical shape, which is impossible in reality. Further, the variations of particles during the chemical process, such as fragmentation, shrink, and aggregation, were also neglected in these studies.
In this study, an improved numerical framework based on the MP-PIC method was developed to simulate the processes of gas–solid flow and chemical reactions in a fluidized bed. Experiments were carried out on a 3-MW circulating fluidized bed with a height of 24.5 m and a cross section of 1 m2. Simulations and experiments were carried out under different operation conditions.

2. Mathematical Model/Numerical Method

2.1. Gas-Solid Hydrodynamics

2.1.1. Gas Phase

The gas-phase mass and momentum equations are as follows.
Gas-phase continuum equation:
( ε g ρ g ) t + ( ε g ρ g u g ) = i = 1 N g S g i
where i = 1 N g S g i is the sum of the mass changes of each component due to the chemical reaction, and i is the number of gas-phase species.
Momentum equation:
( ε g ρ g u g ) t + ( ε g ρ g u g u g ) = - ε g p + ( ε g τ g ) + ε g ρ g g + β ( u s u g )
where β is the gas–solid drag coefficient [19].
β = { 150 ε s 2 μ g ε g 2 d s 2 + 1.75 ε s ρ g ε g d s | u g u s | ε g < 0.8 3 4 C d ε s ρ g d s | u g u s | ε g 2.65 ε g 0.8
C d = { 24 R e ( 1 + 0.15 R e s 0.687 ) R e < 1000 0.44 R e 1000
R e = 2 ρ f | u g u s | r s μ g
where μ g is the molecular gas viscosity.
Energy equation:
( ε g ρ g h g ) t + ( ε g ρ g u g h f ) = ε g ( p t + u g p ) + Φ [ ε g ( λ g T g ) ] + Q ˙ + S h + q ˙ D
where Φ represents the viscous dissipation term, Q ˙ represents the energy source term, and λ g represents gas fluid thermal conductivity.
q ˙ D represents enthalpy diffusion, written as
q ˙ D = i = 1 N g ( h i ε g ρ g D Y g , i )

2.1.2. Solid Phase

Each component solid-phase particle was mapped to a discrete form by statistical weighting, and the m-th component particle having the same particle diameter D m and density ρ m was replaced by N m calculated particles (i.e., parcels). For the M groups of fuel particles, the number of real particles N was calculated by; the spatial distribution of the parcels over time was f { X p ( i ) ( t ) , u p ( i ) ( t ) , D p ( i ) , ρ p ( i ) , W p ( i ) , i = 1 , ... , N } ; and X p ( i ) ( t ) , u p ( i ) ( t ) , D p ( i ) , ρ p ( i ) , and W p ( i ) were the position, velocity, diameter, density, and statistical weight of a parcel. For the description of parcel motion, Newtonian mechanics was used for analysis. To simplify the discussion process, the superscript i indicating the i-th parcel was omitted.
The position equation of the parcel:
d X p ( t ) d t = u p ( t )
Equation of motion:
m p d u p ( t ) d t = m p g + F p , drag ( t ) + F p , coll ( t )
where g is gravity, F p , drag ( t ) is the drag force of the parcel (divided into solid-phase pressure gradient field drag force and gas–solid phase drag force), and F p , coll ( t ) is the interaction force between the parcels.
Since the calculated particles use the same particle size as the actual particles, it was necessary to consider the interaction of W p particles in the calculation of the drag force of the particles. For the i-th calculated particle of the m-th solid particle within the k-th calculation grid, the drag force was
F p , drag ( t ) = P g , k V p + β m V p ε s m [ u g ( X p ) u p ]
where P g , k is the solid-phase pressure gradient within the k-th calculation grid, u g ( X p ) is the average velocity of the gas phase at the coordinate X p , V p = W p π D p 3 6 is the volume of the parcels, and β m is the gas–solid phase energy transfer coefficient.
The gas–solid phase energy exchange of the m-th component in the k-th cell:
I g m k = 1 V k [ W p ( i ) F p , drag ( i ) ( t ) ]
where V k is the volume of the k-th cell.
The frictional stress between the particles is [20,21]
F p , coll ( t ) = V p ε s τ
where τ is the interparticle pressure. The continuous particle corresponding force model based on Harris and Crighton [22] was selected to calculate the τ :
τ = P s ε s β max [ ε s , c p ε s β , ε ( 1 ε s ) ]
where P s is a pressure constant (usually 1–100 Pa), ε s , c p is the close packing state volume fraction, β is a constant ( 2 β 5 is recommended), and ε is generally 10−7, which was used to eliminate the singularity of the numerical calculation [23].

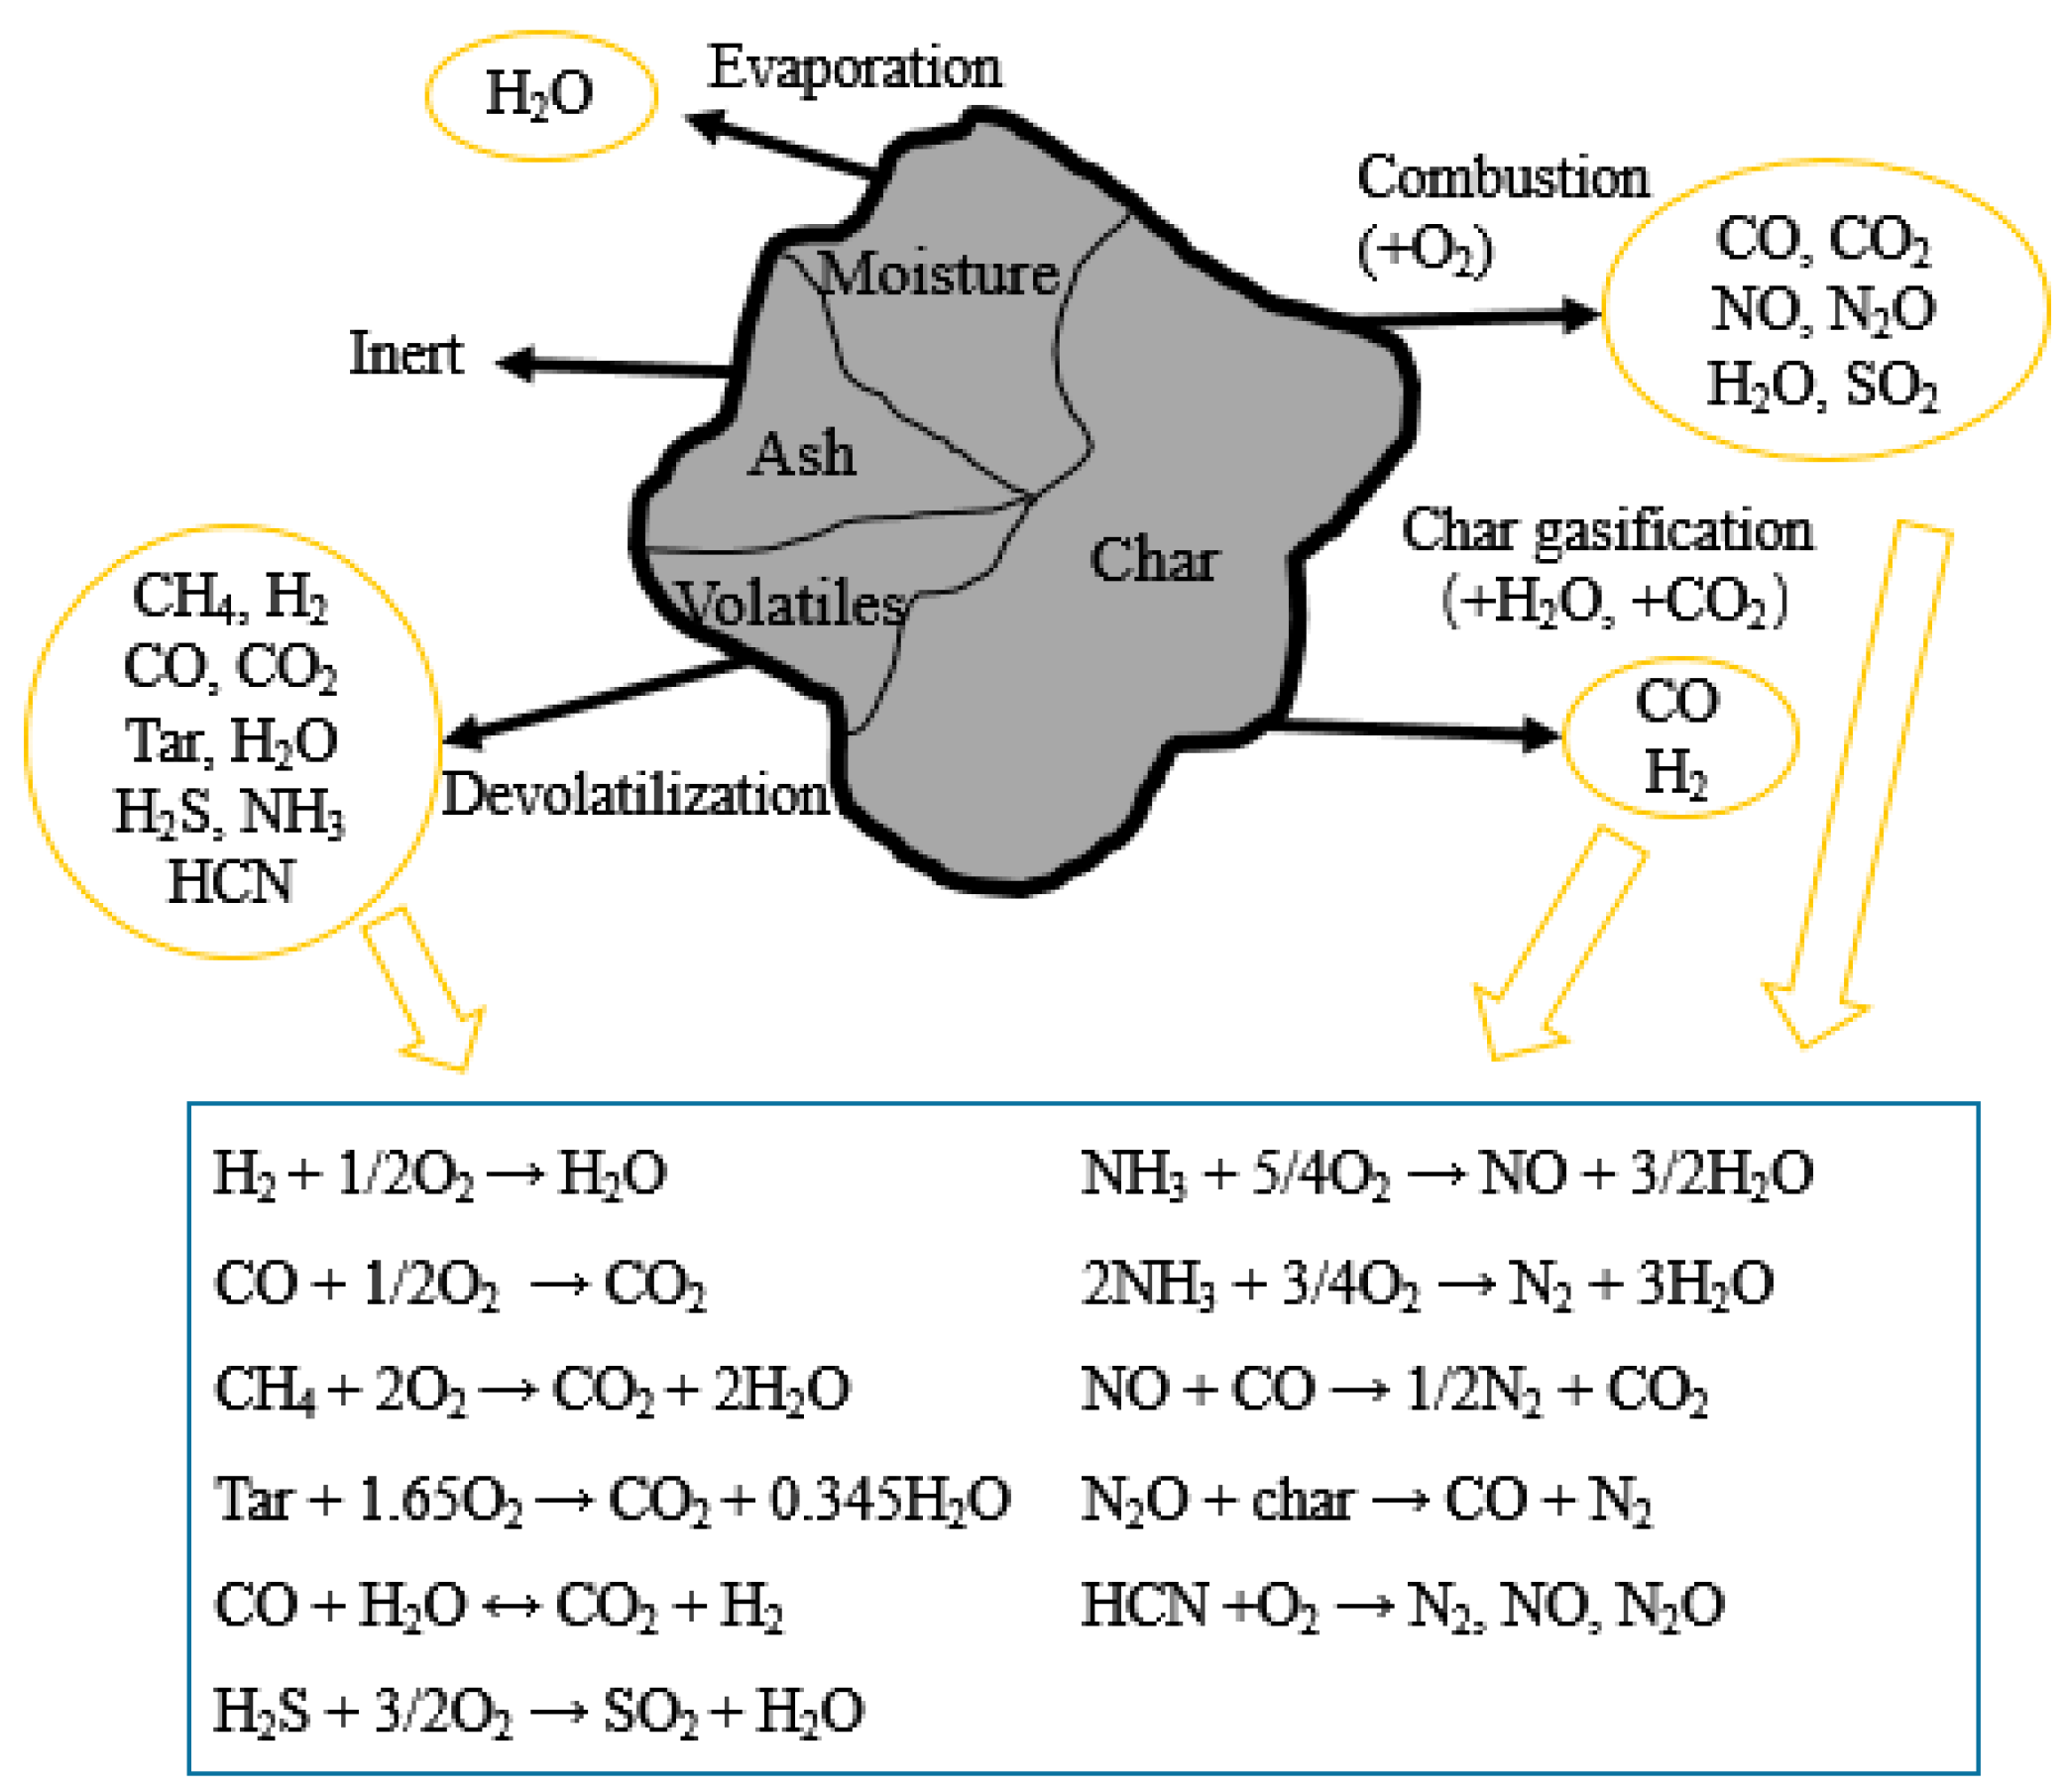
2.2. Chemical Reactions

Gas-solid fluidized combustion is a process containing a series of complex chemical reactions. The main components of the fuel in the fluidized bed are fixed carbon, volatiles, moisture, and inert ash. After the fuel enters the furnace, the water evaporates rapidly, the fuel particles are heated and volatilized, and the remaining coke particles react with oxygen or water vapor to burn. Ash stays longer in the furnace than other components, so the calculation of ash can be handled separately. The combustible gases of different compositions generated during the coke combustion and volatilization analysis processes are burned in oxygen. The combustion process of powder coke is shown in Figure 1.
In order to calculate the gas–solid phase heterogeneous reaction (such as coke combustion, limestone decomposition, desulfurization, denitration reaction, etc.), the average cell chemistry method was selected. In this method, the parameters of the discrete solid-phase particles are converted into intragrid parameters before the chemical reaction is calculated, and the consumption and generation of each component are calculated separately in each calculation grid.
There are thousands of reactions in a circulating fluidized bed boiler. It is almost impossible to calculate every reaction that occurs in the furnace. In order to simulate those reactions, such as devolatilization, volatile and char combustion, desulfurization, NOx formation, and denitration, only the major reactions have been taken into consideration. The corresponding reaction rates were given in our previous research [24].

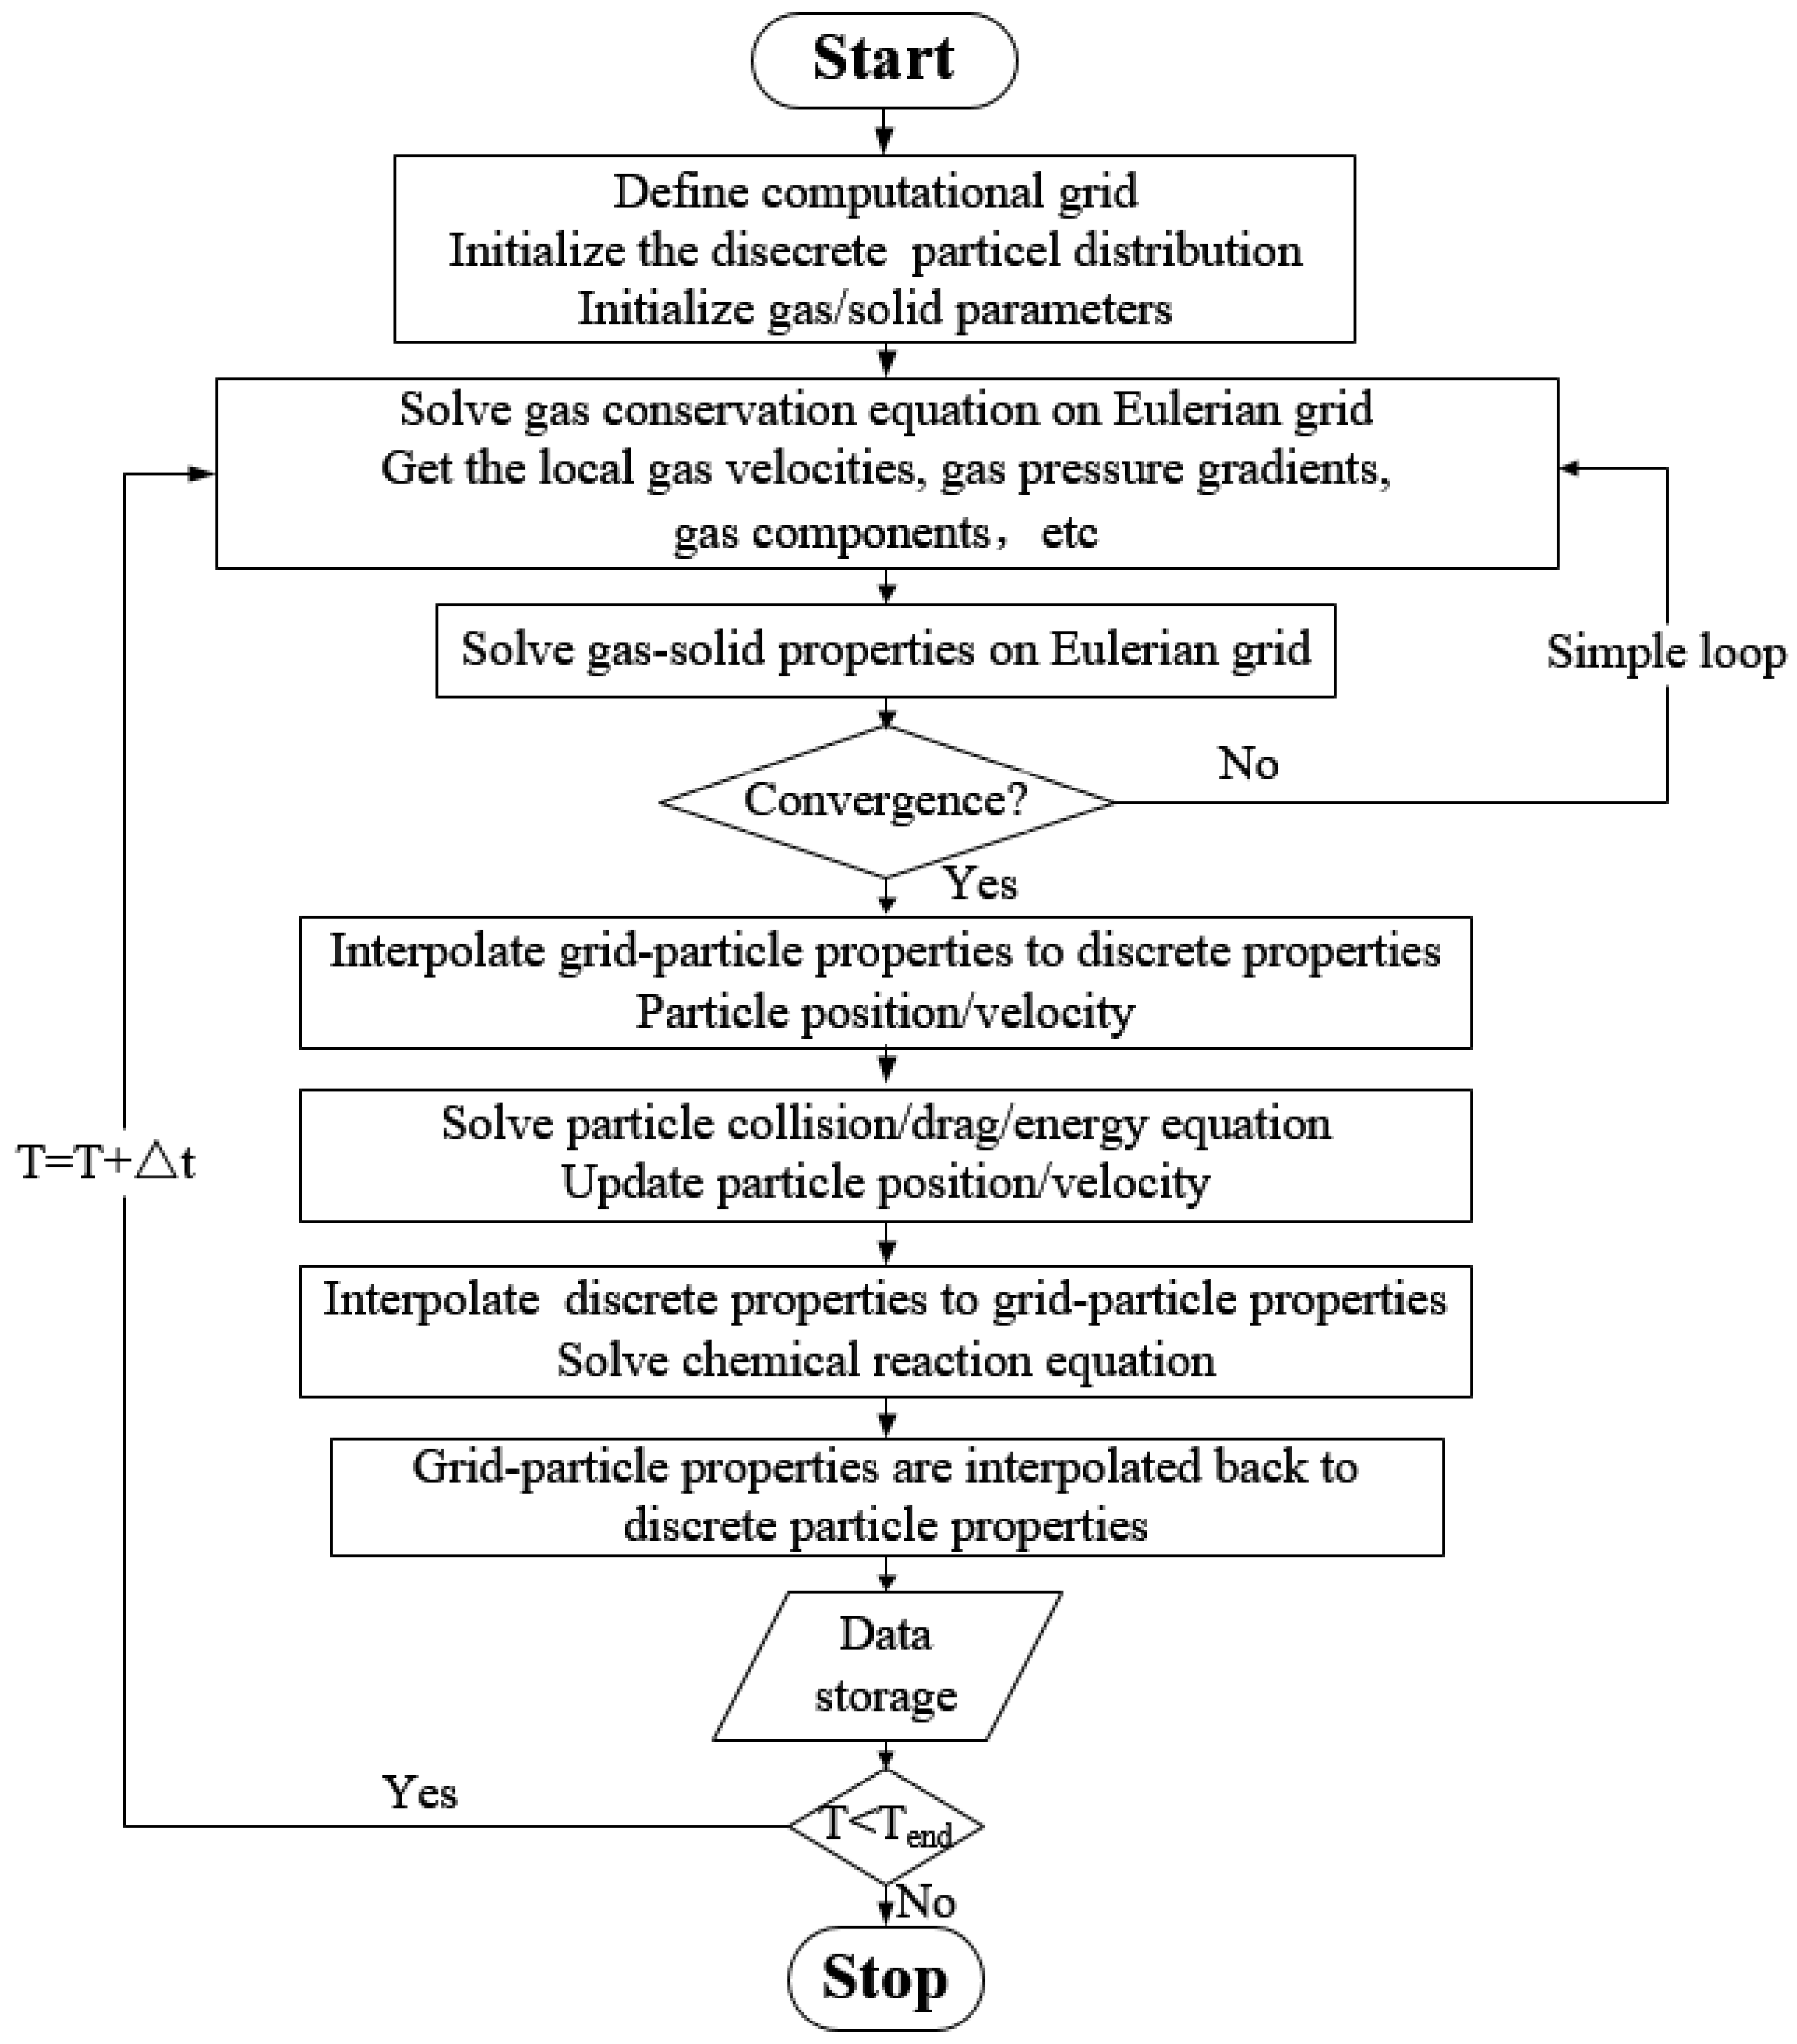
3. Numerical Solution

In the MP-PIC method, the discretization of the solid phase is a major advantage over the two-fluid method. This statistical average and rediscrete processing balance the time consumption of the chemical reaction calculation while maintaining the accuracy of solid-phase flow simulation. In the actual operation process, when selecting the appropriate N m , one can not only maintain the same calculation accuracy as the discrete element method (DEM) but also adapt to large-scale industrial simulation applications. The calculation process is shown in Figure 2 below.
After the calculation starts, the data is first initialized. Initialization includes not only initialization of the gas-phase velocity field, pressure field, density field, and temperature field but also the calculation of particle discretization. The velocity and pressure distribution of the gas phase are calculated by the SIMPLE algorithm [25]. For the calculation of the solid phase, the force and motion are analyzed for every parcel separately. After the gas–solid flow calculation is completed, the information on the discrete particle phase is then averaged inside the grid. A series of heterogeneous chemical reactions, such as particle combustion and gasification, are calculated based on the averaging treatment, and the homogeneous reactions of the gas phase are also calculated. After the chemical reaction calculation is completed, the updated grid information is rediscretized into a discrete distribution of calculated particles, and then the next gas–solid flow calculation is completed.

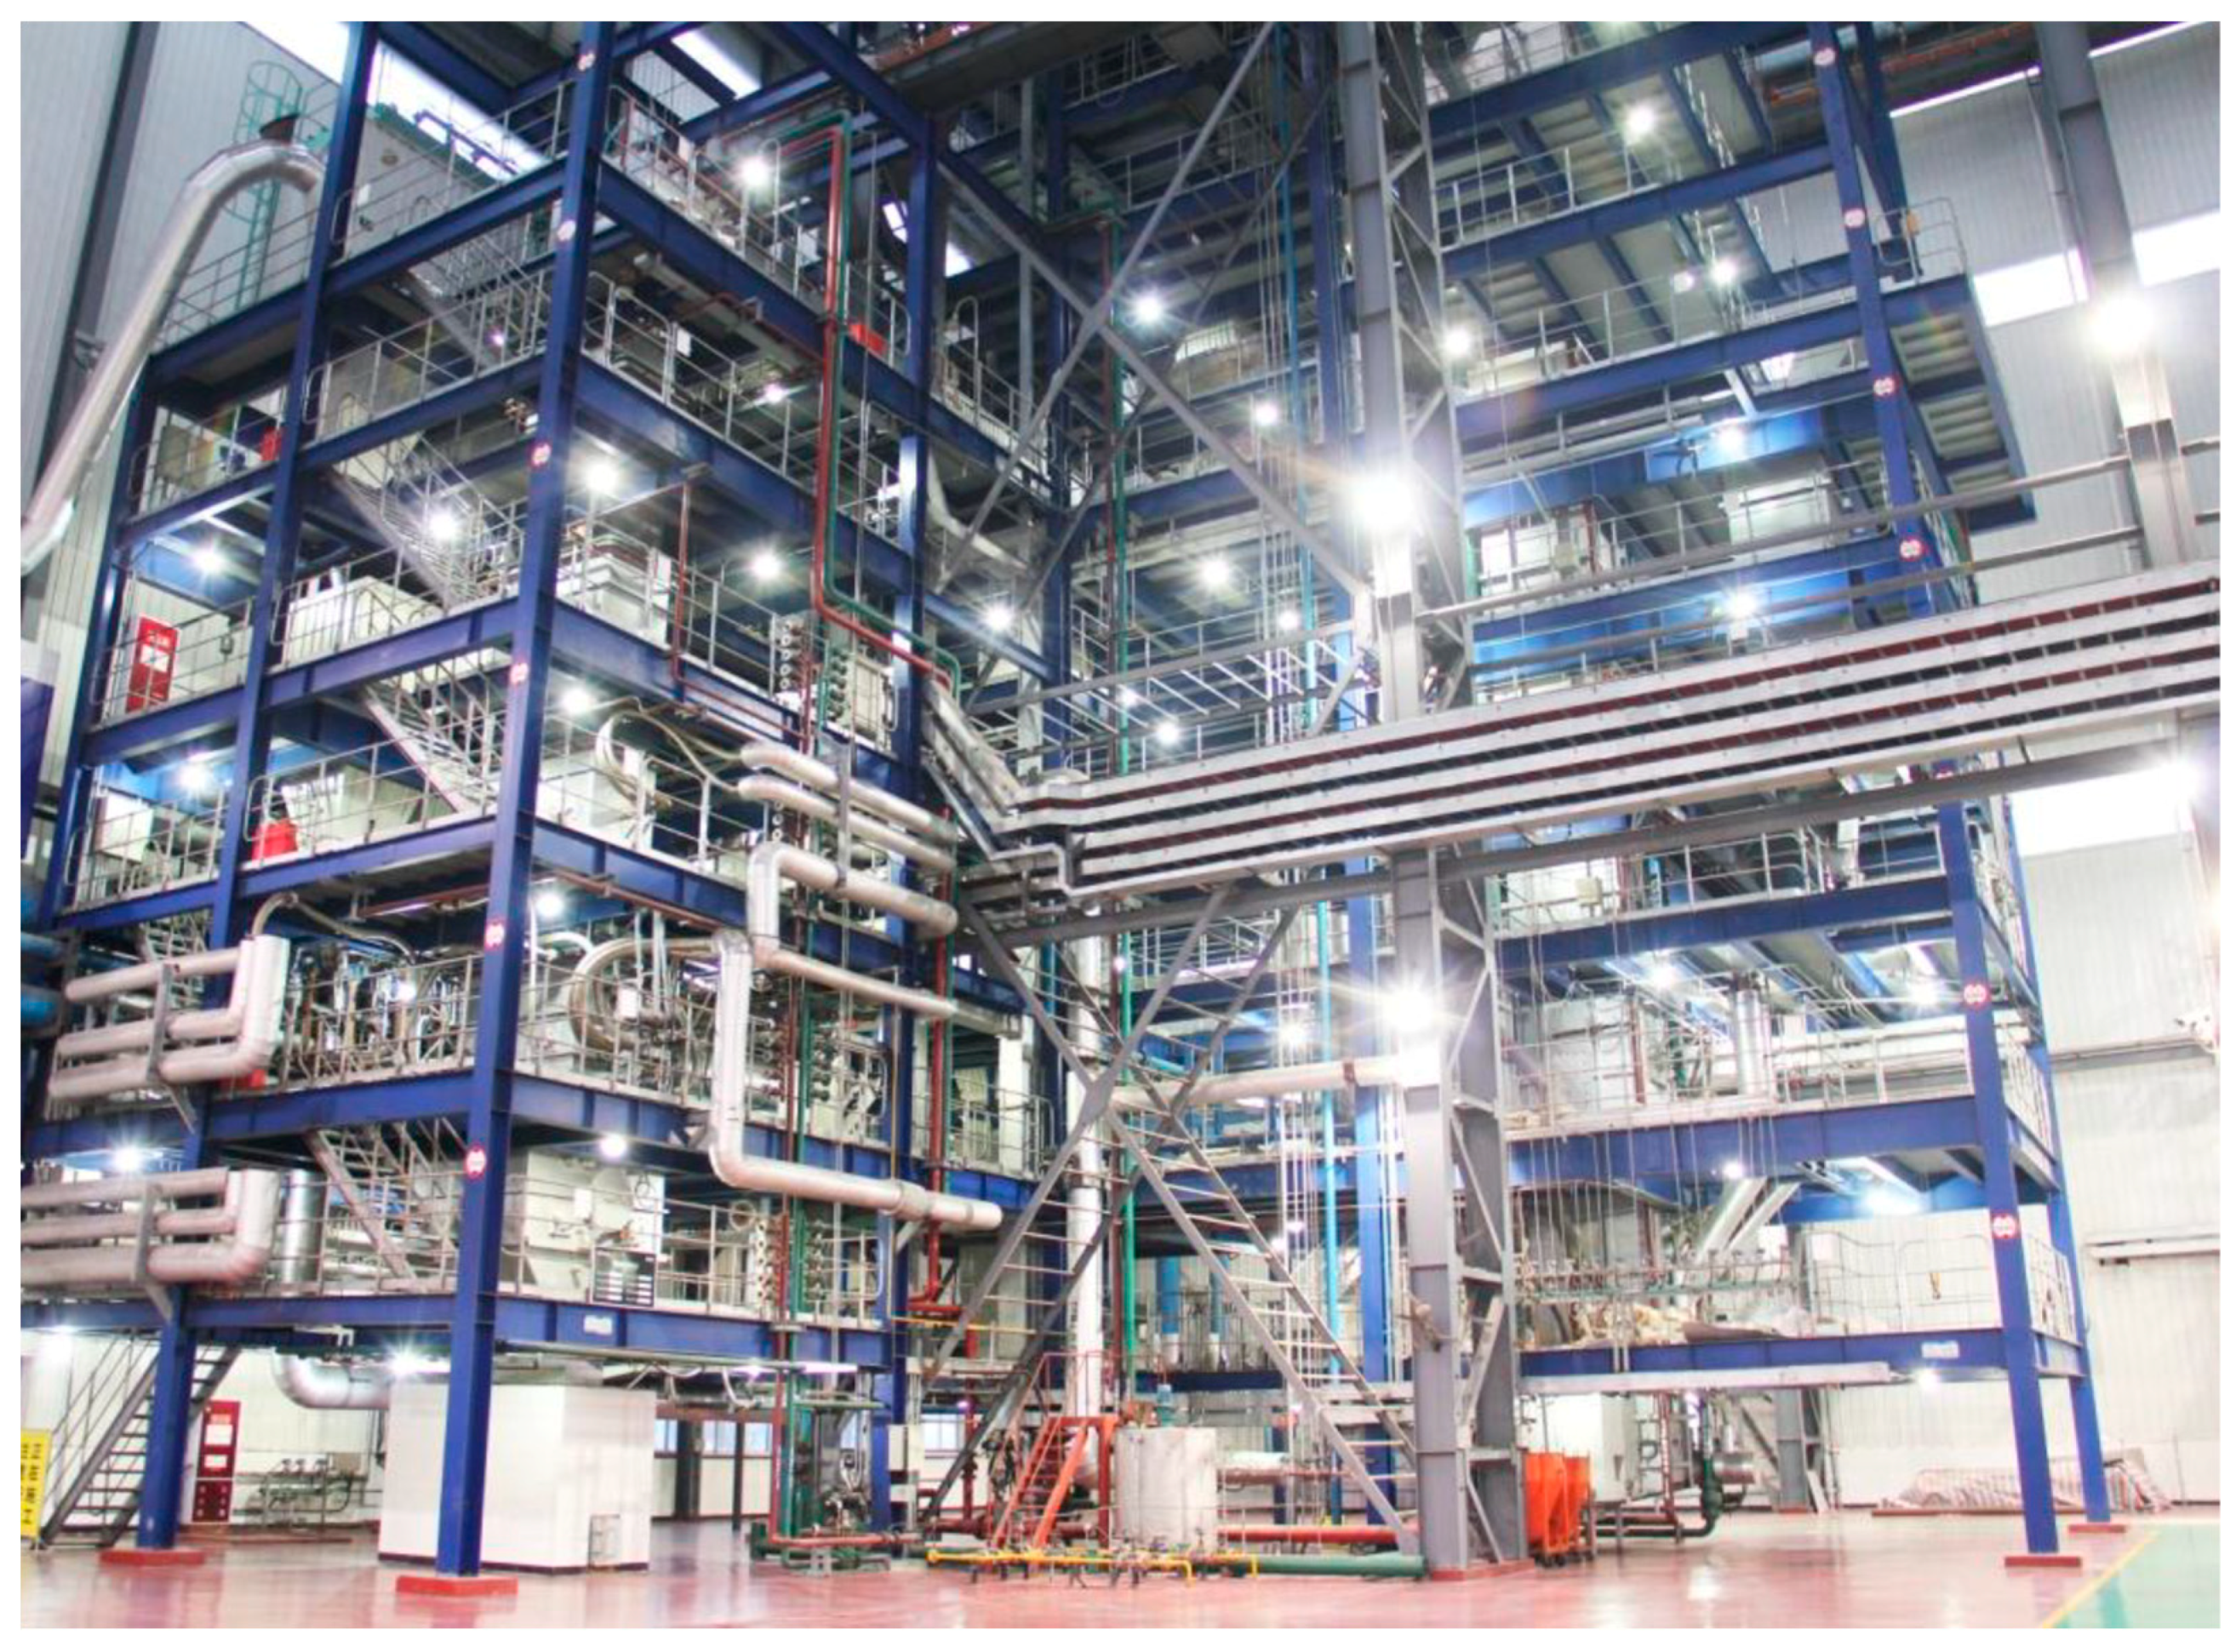
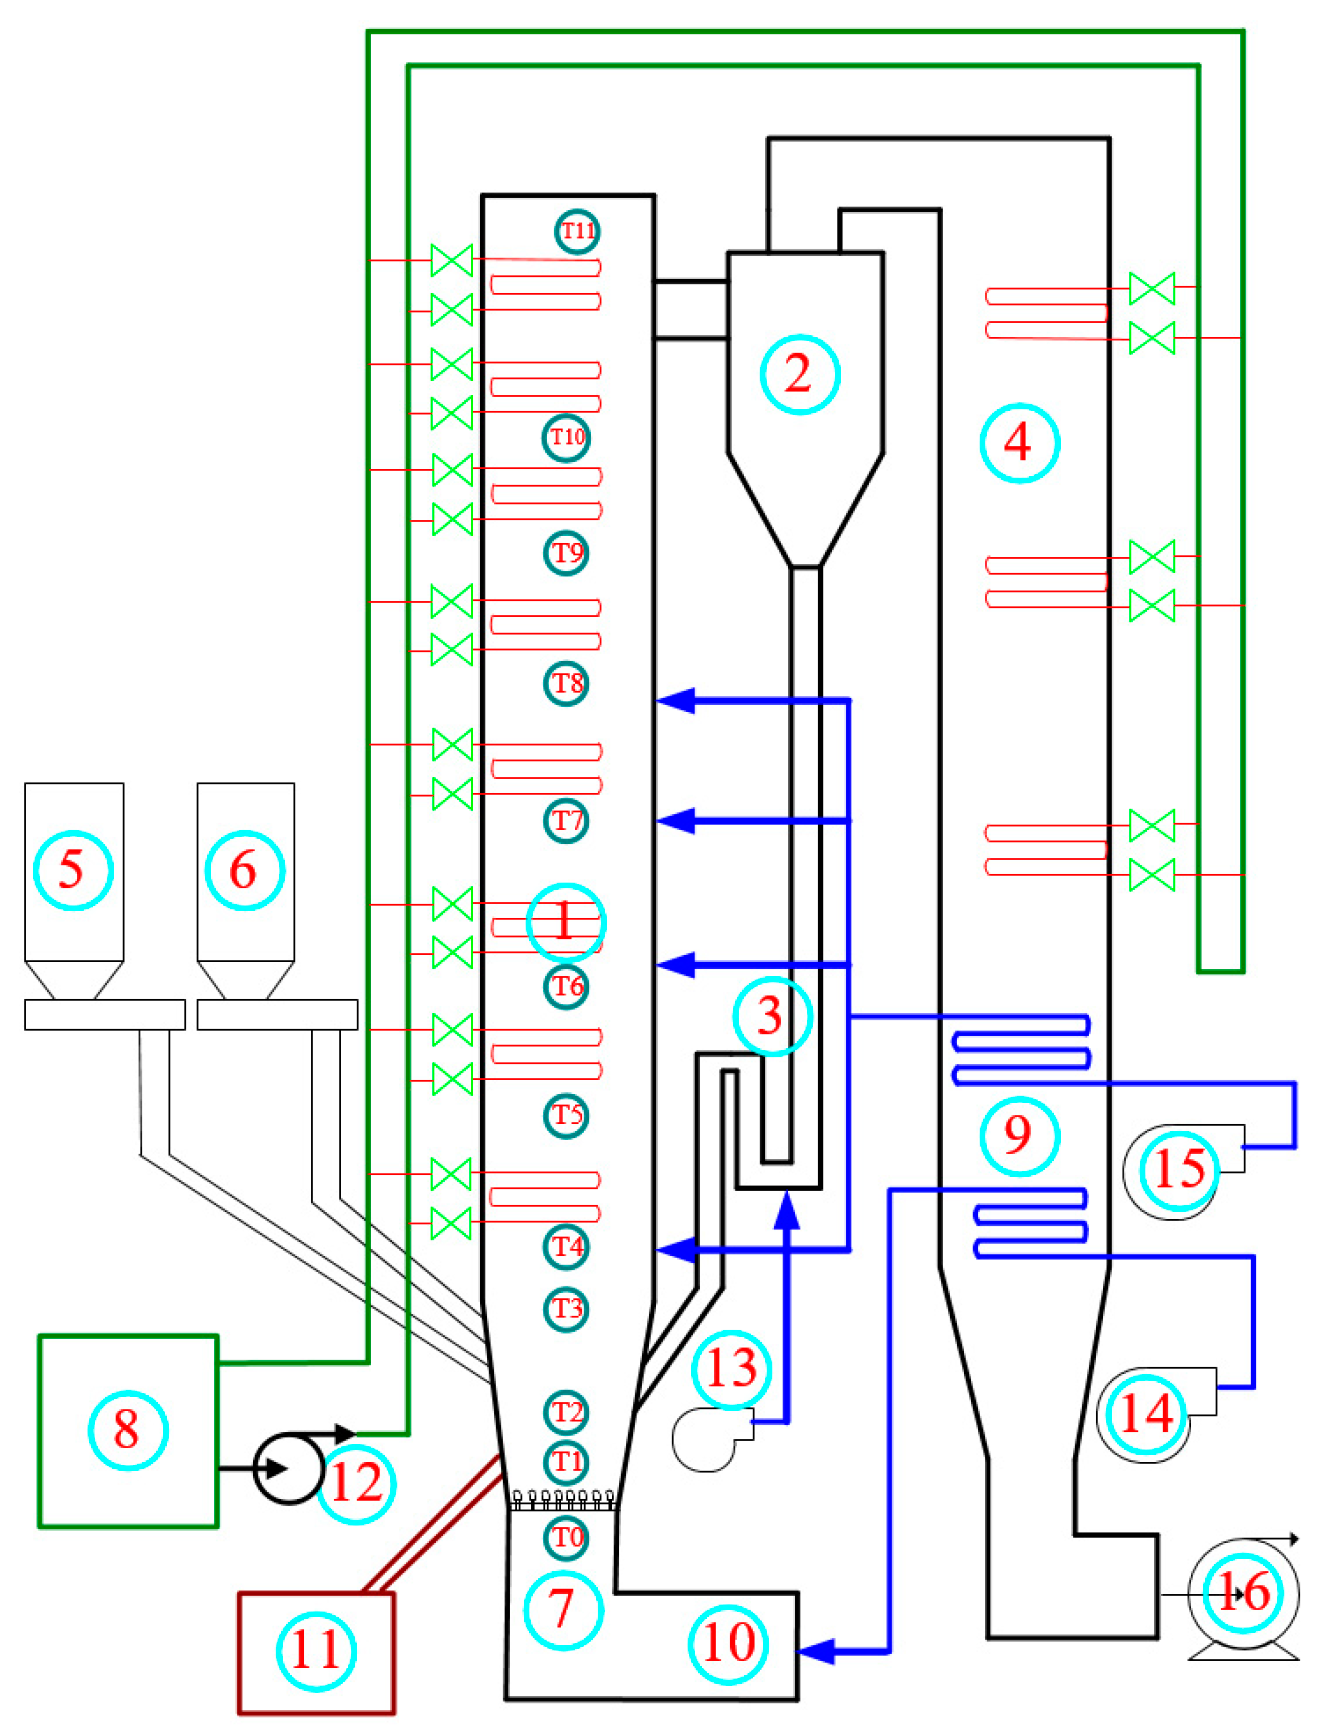
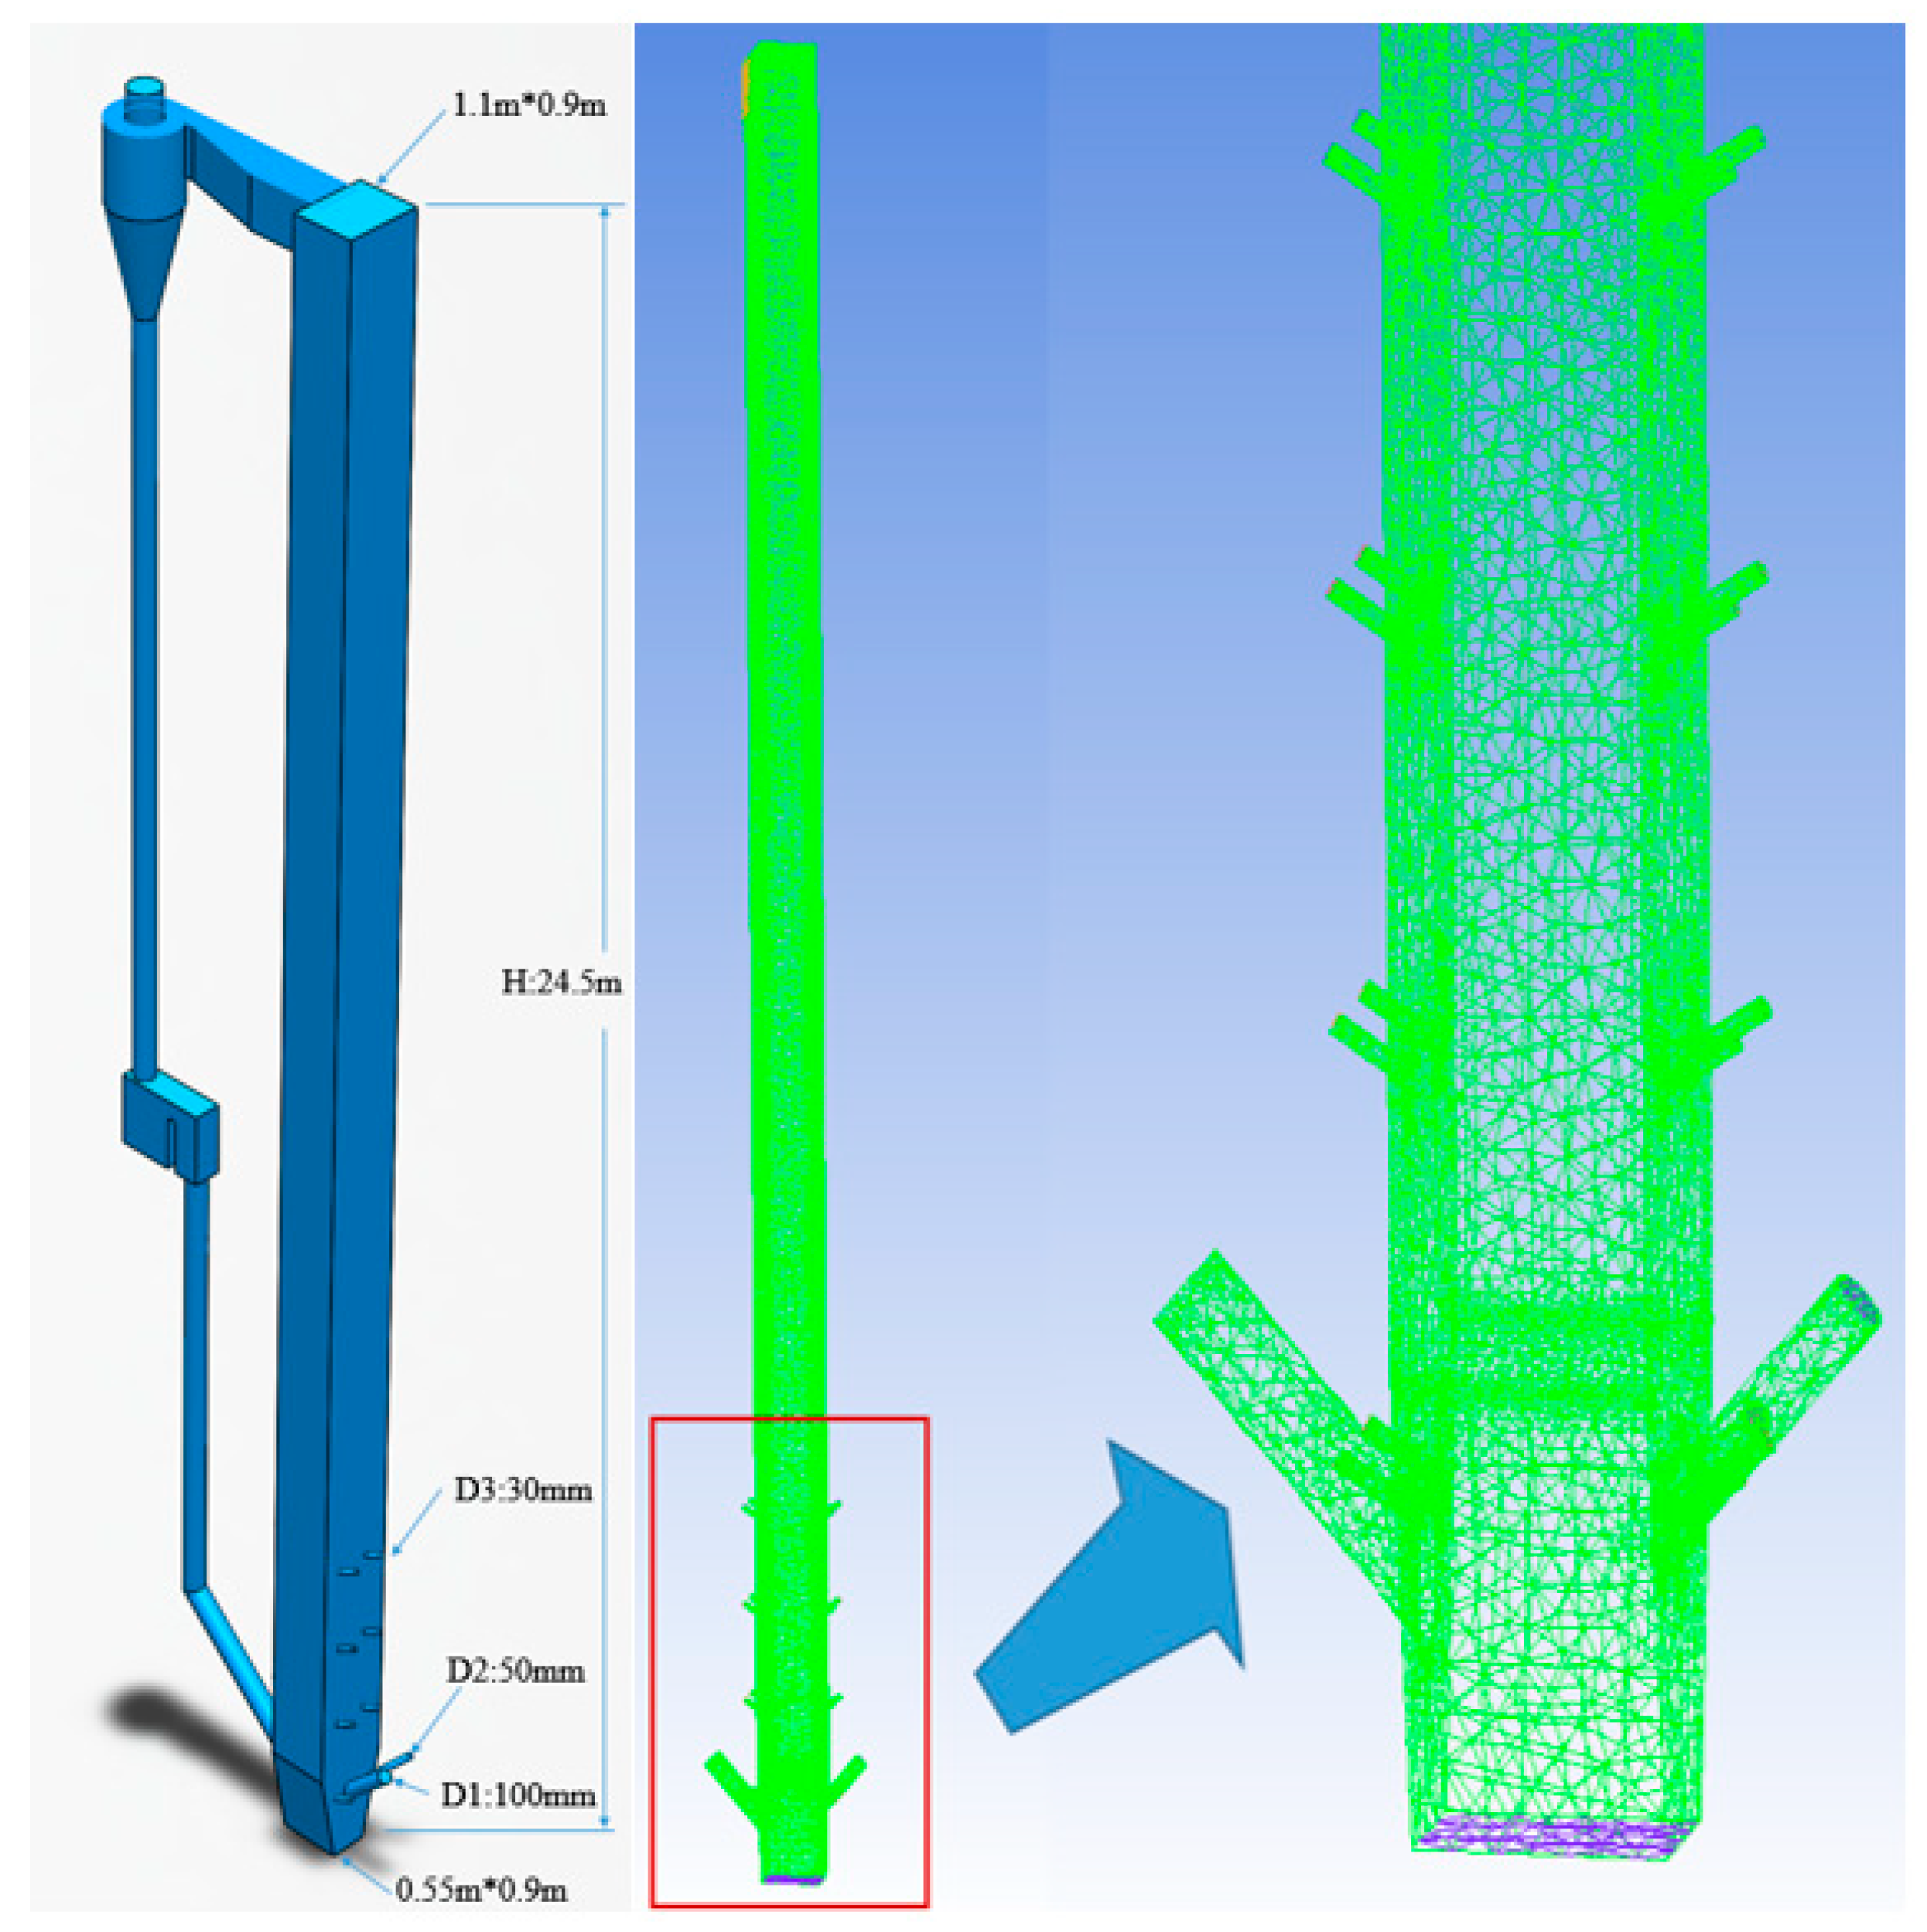
4. Simulation Object and Model Setup

Figure 3 shows the Dongfang boiler’s experimental equipment. Figure 4 illustrates a schematic diagram of the experimental system, which contains a 24.5-m tall furnace, a cyclone, a recirculation bed, powder coke, and limestone feeding system. The main part of the fluidized bed system and the 3D grid of the furnace are shown in Figure 5. Detailed descriptions of the experiments can be found in Table 1. Table 2 is the elemental analysis of the powder coke used in the experiment. The particle size distribution of the powder coke is shown in Figure 6.
To investigate the impact of the operating parameters on the pollutant discharge characteristics of powder coke, this experiment used the L9 (34) type orthogonal test method. The main design and operating parameters closely related to the fluidized bed combustion process (bed temperature, oxygen, and grading combustion) were investigated to provide important scientific guidance for managing and optimizing a powder coke CFB boiler.

5. Results and Discussion

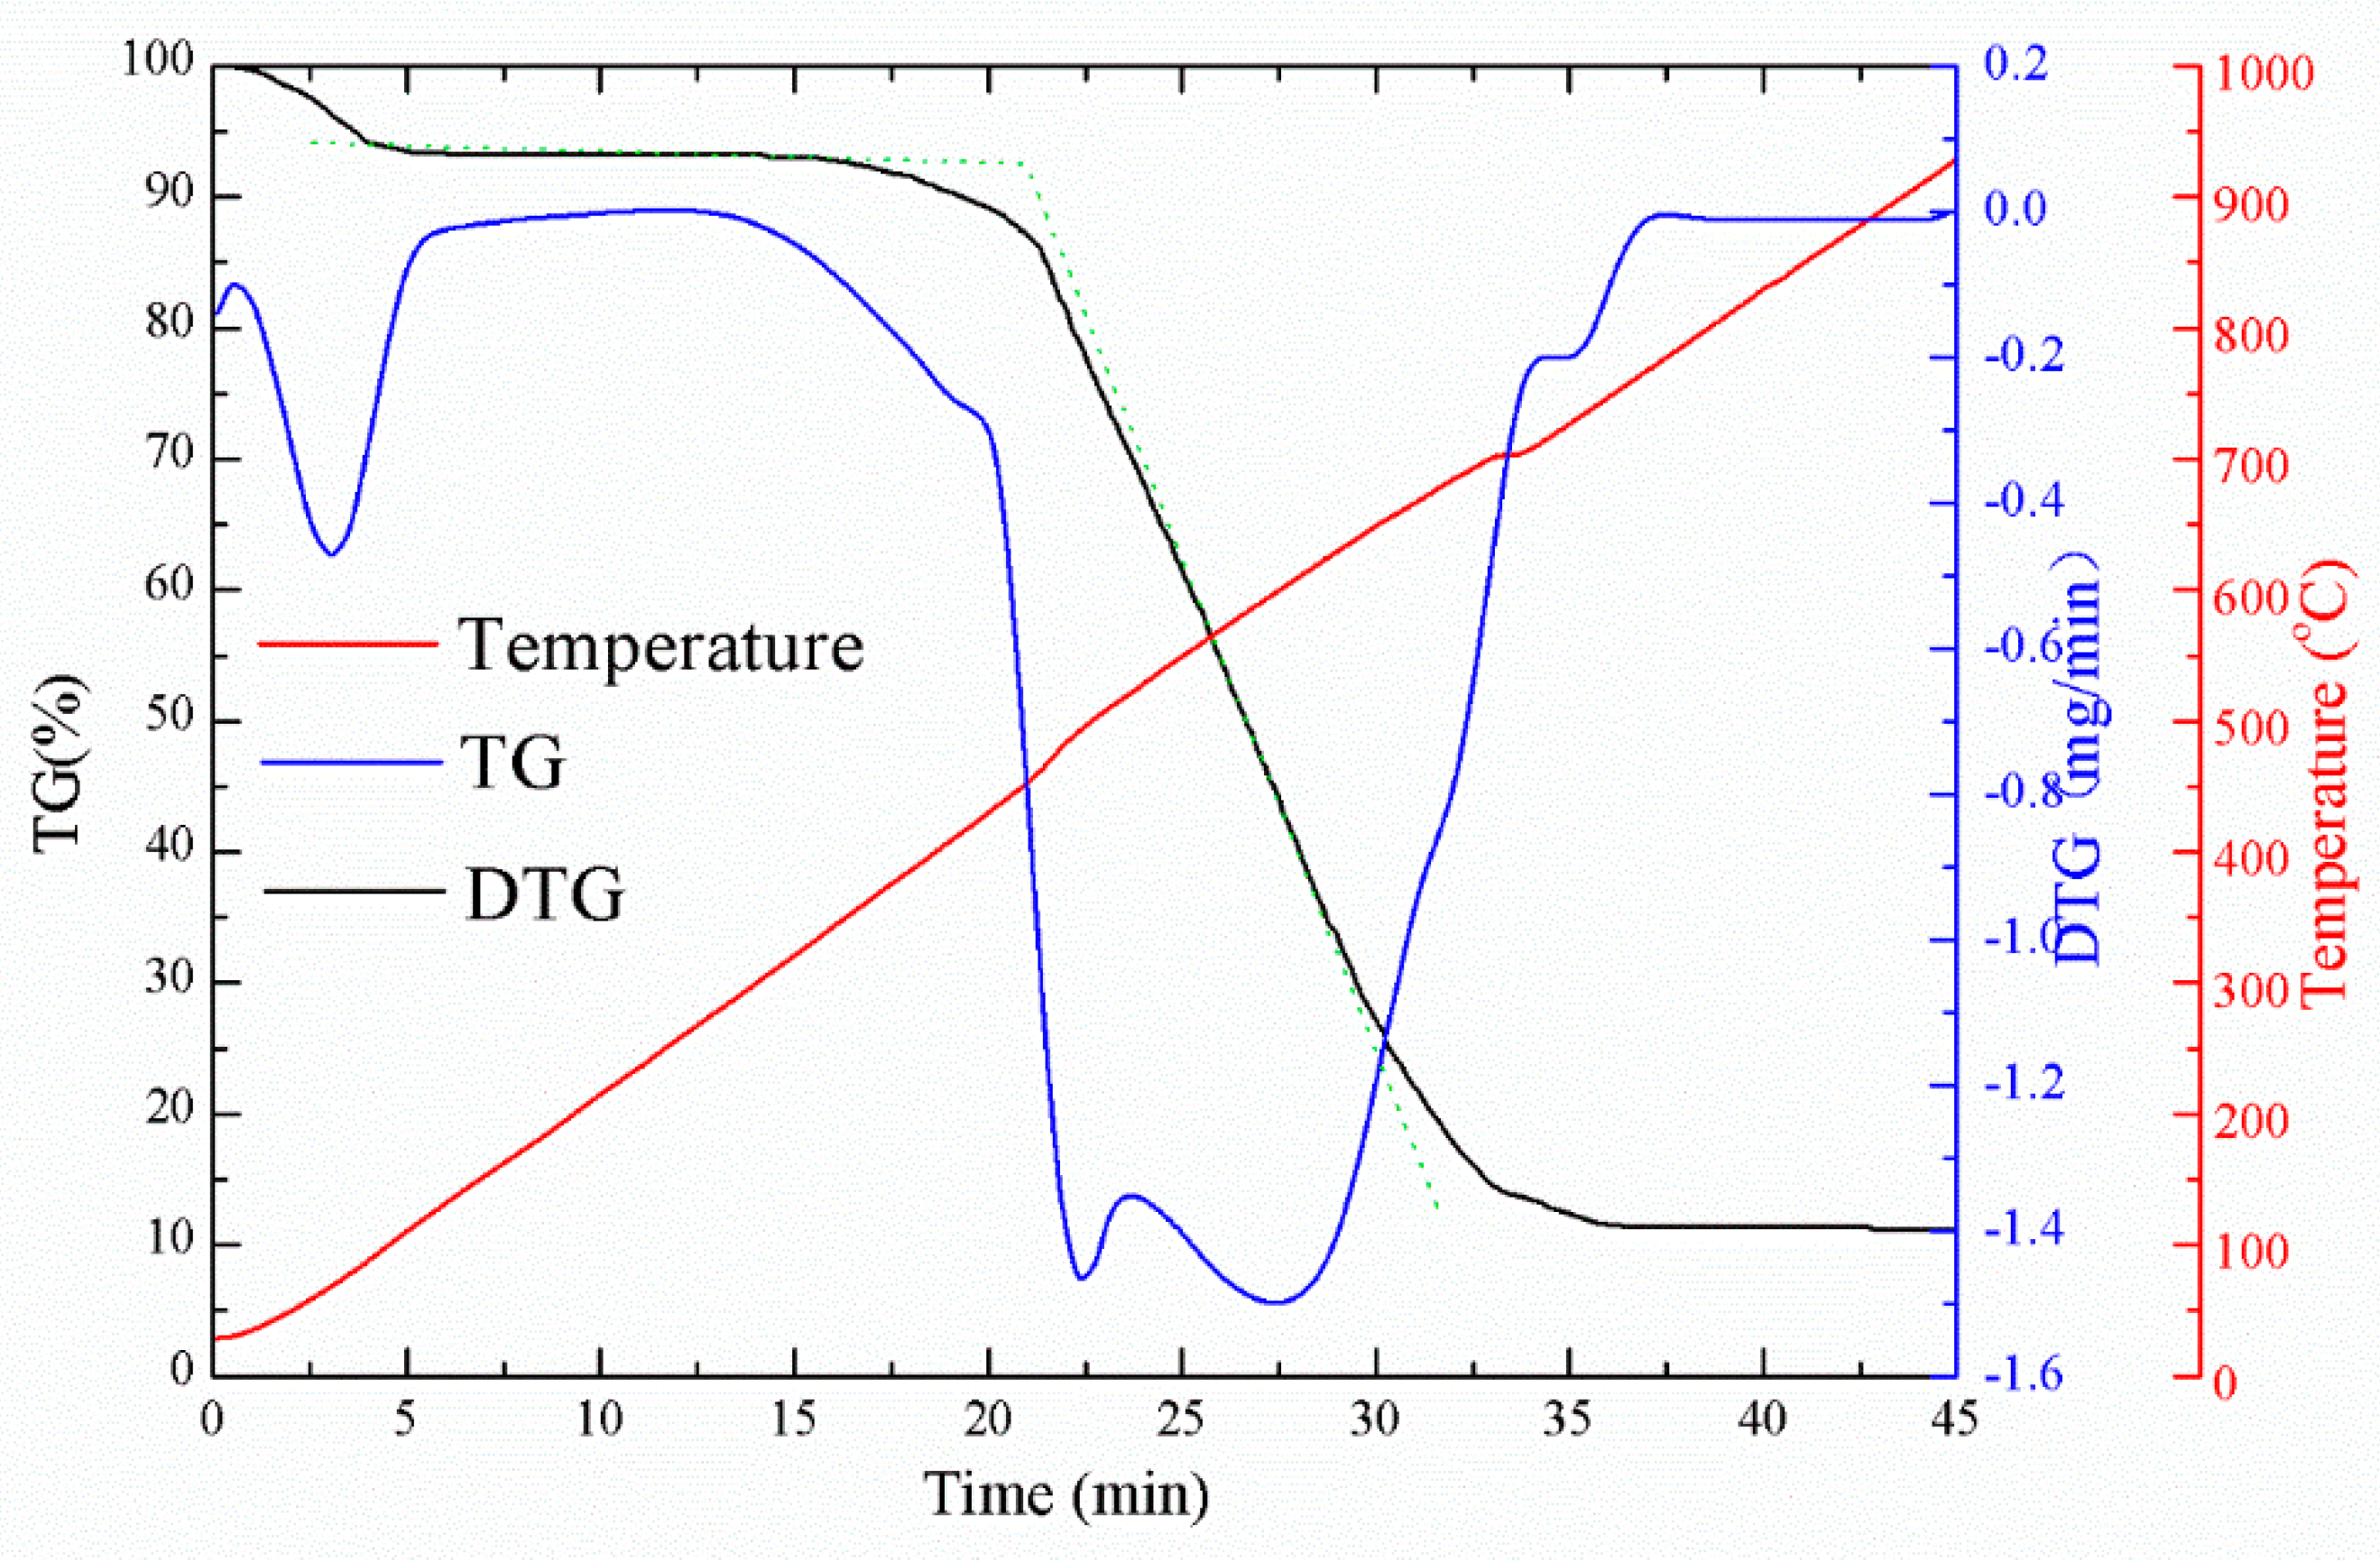
5.1. Determination of Fuel Ignition Point by TG-DTG Method

After the fuel particles were ground and subjected to thermogravimetric analysis on the US Perkin Elemer STA6000 instrument, the temperature–weightlessness–weight loss rate curve of the sample was obtained (Figure 7). The ignition point was determined by the thermal gravity-differential thermal gravity (TG-DTG) joint definition method. It can be seen from Figure 7 that with the increase in temperature, the TG curve below 120 °C had a rapidly declining trend, which was the rapid evaporation process of moisture. When the temperature exceeded 260 °C, the TG curve showed a second downward trend, which corresponded to the precipitation of volatiles, while some low-flammable volatiles began to ignite. The turning point of the TG curve was the ignition temperature, which was about 470 °C. As the temperature rose to 780 °C, the TG curve became a straight line, indicating that the fuel had burned out.

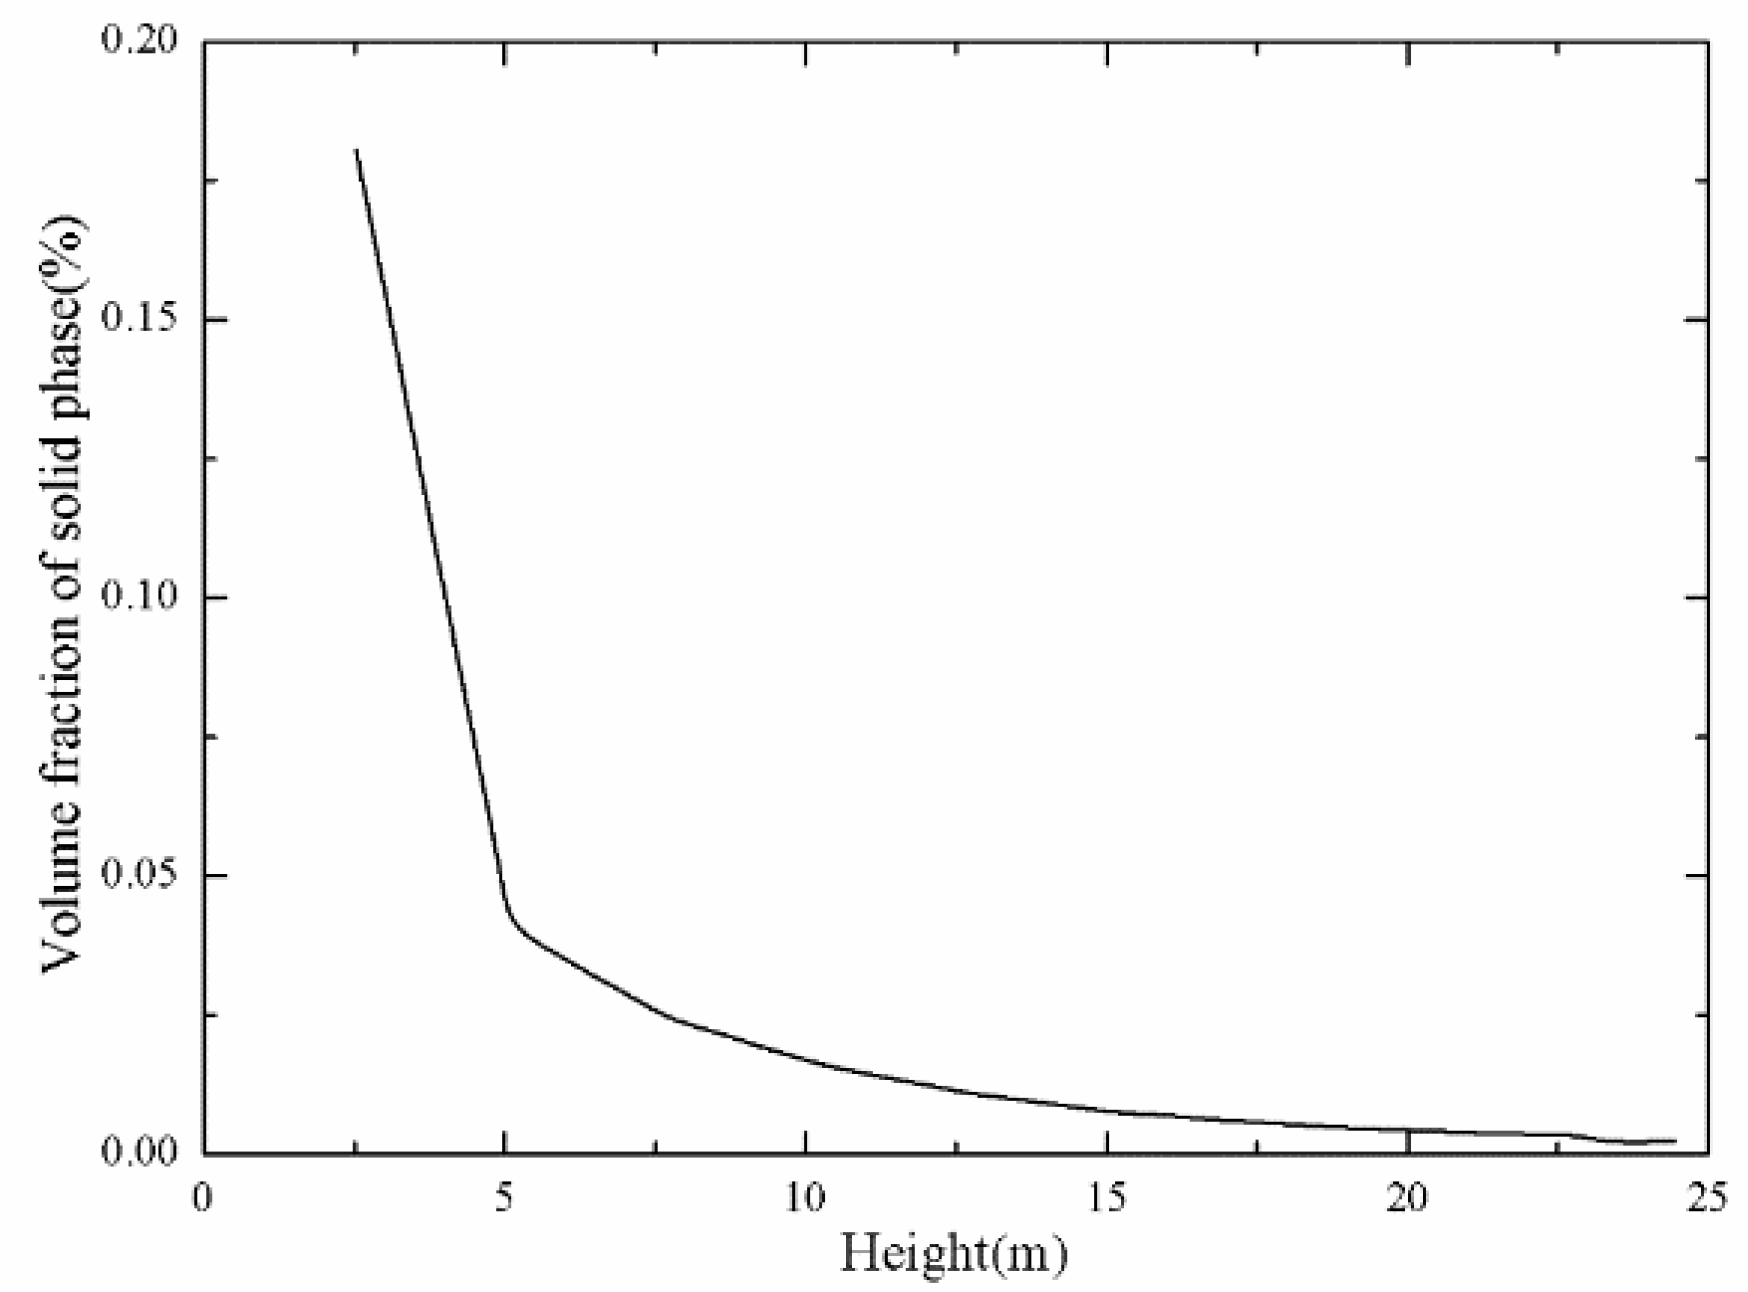
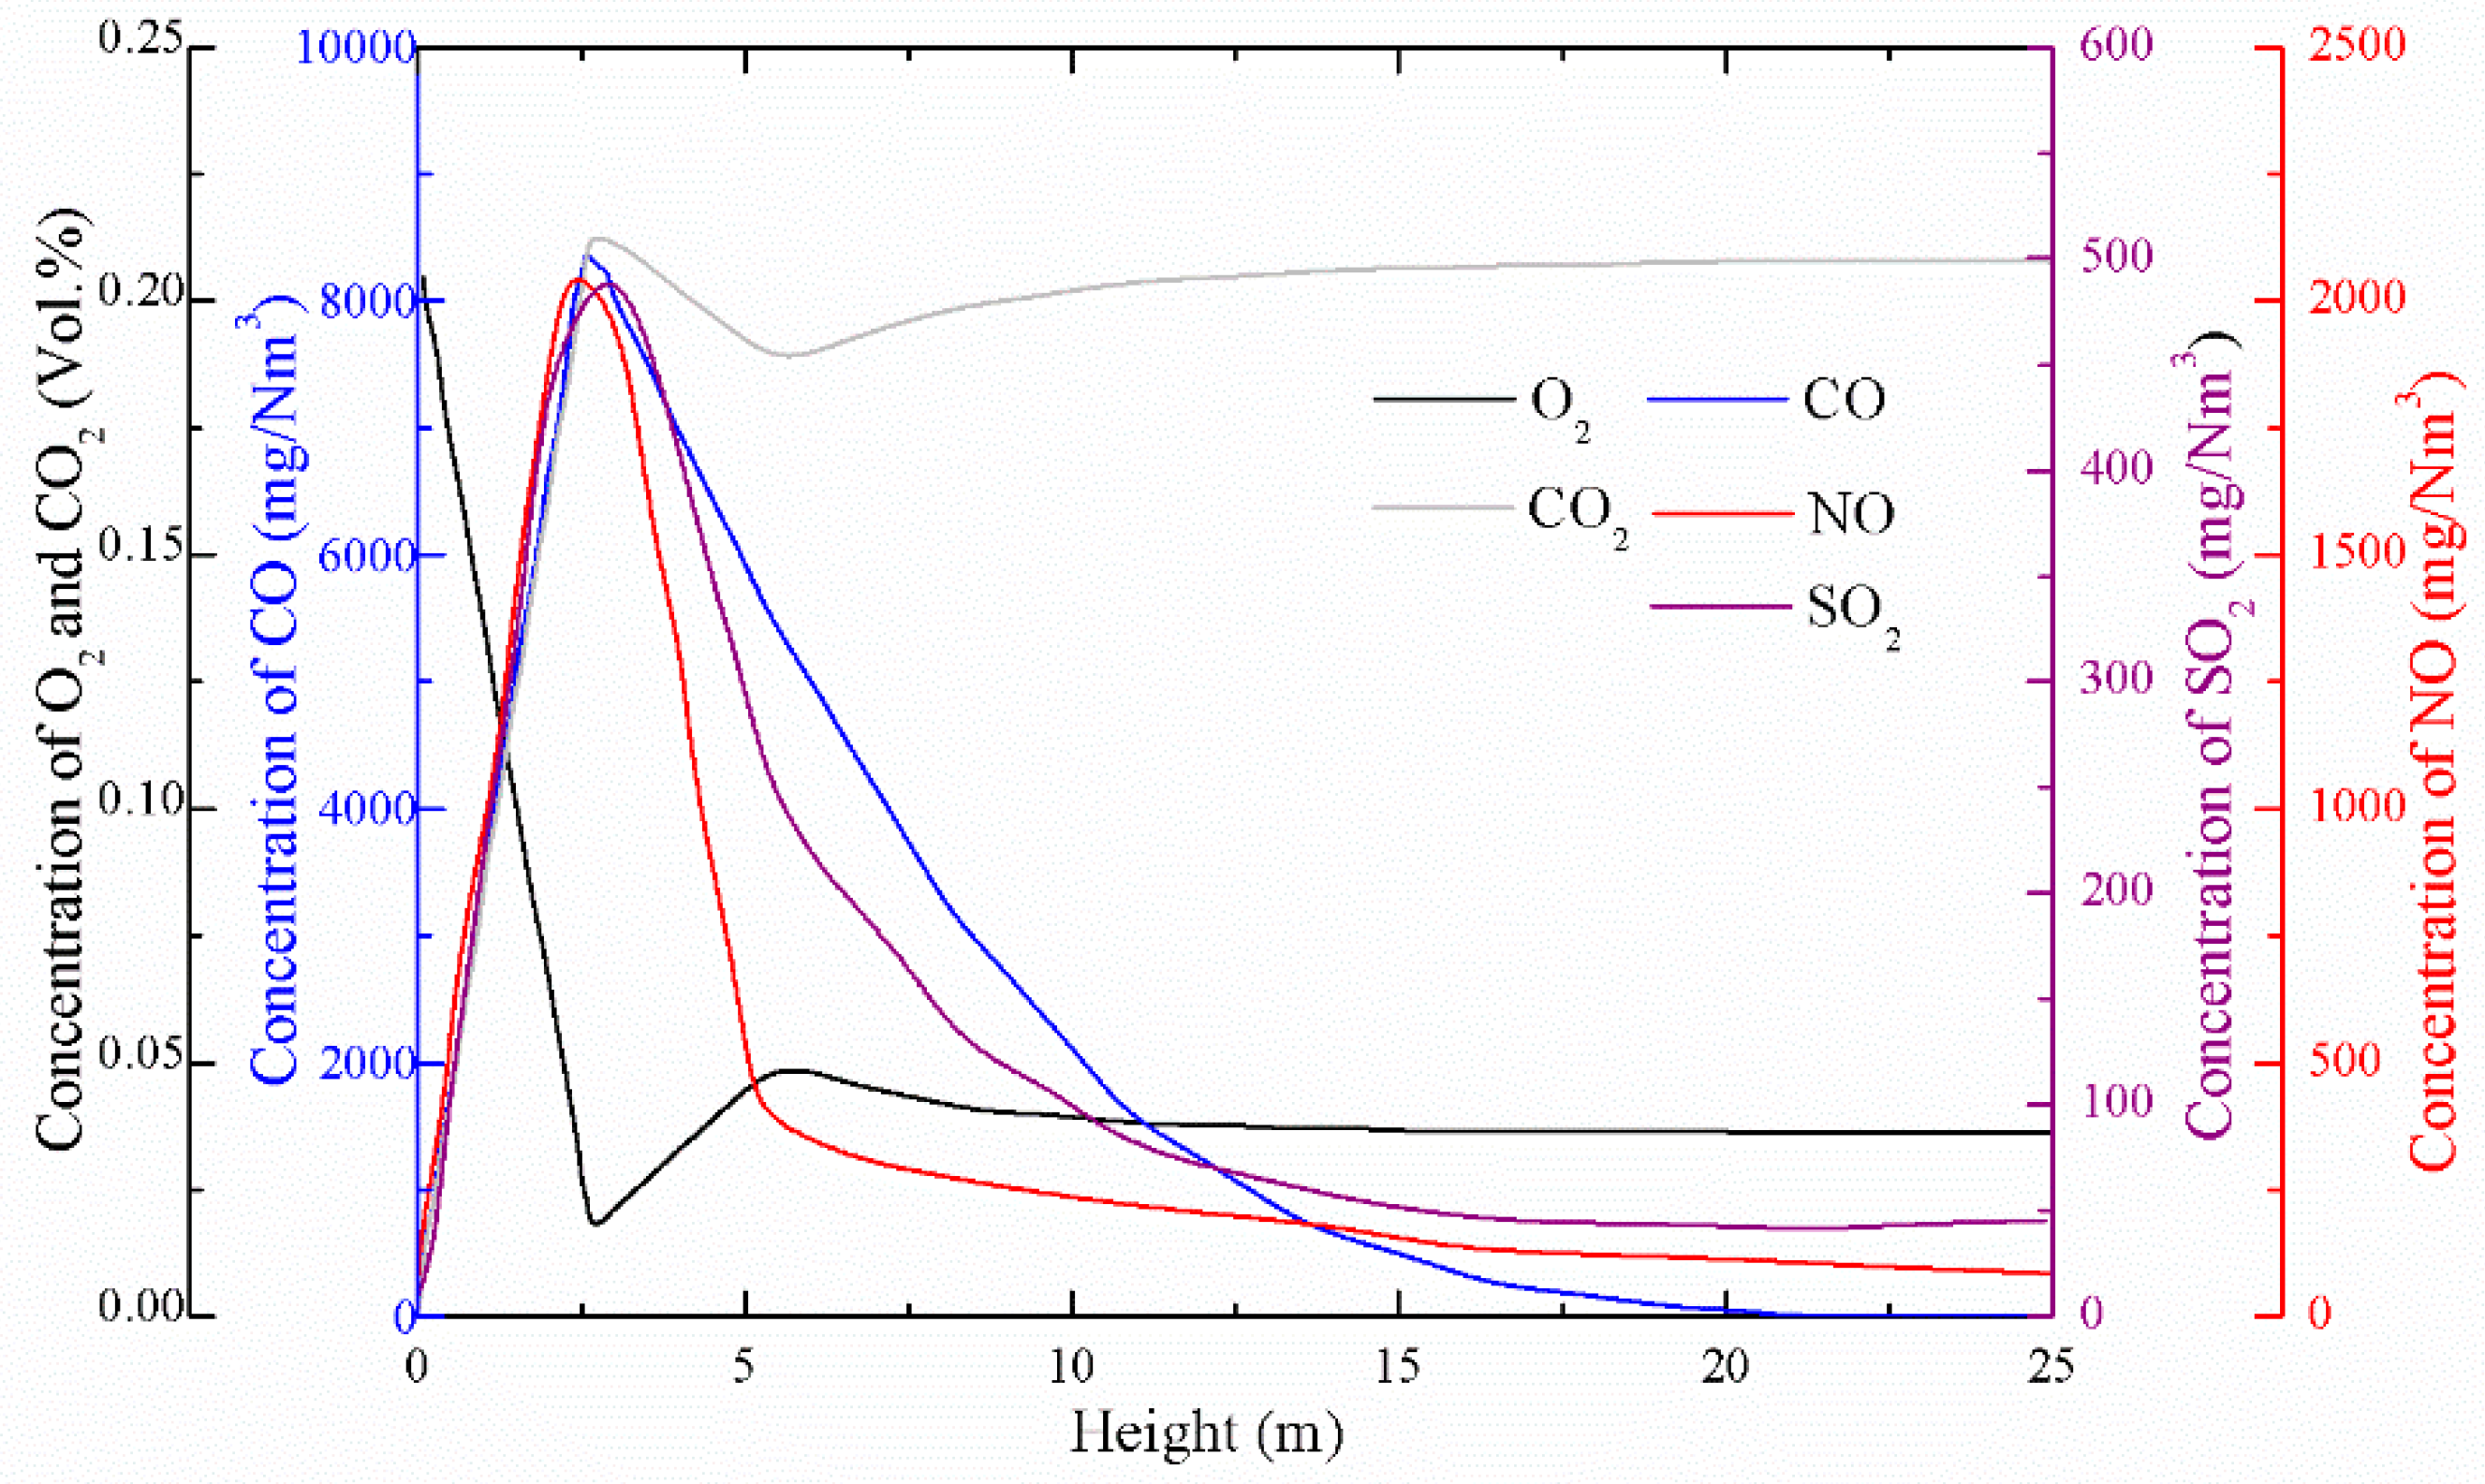
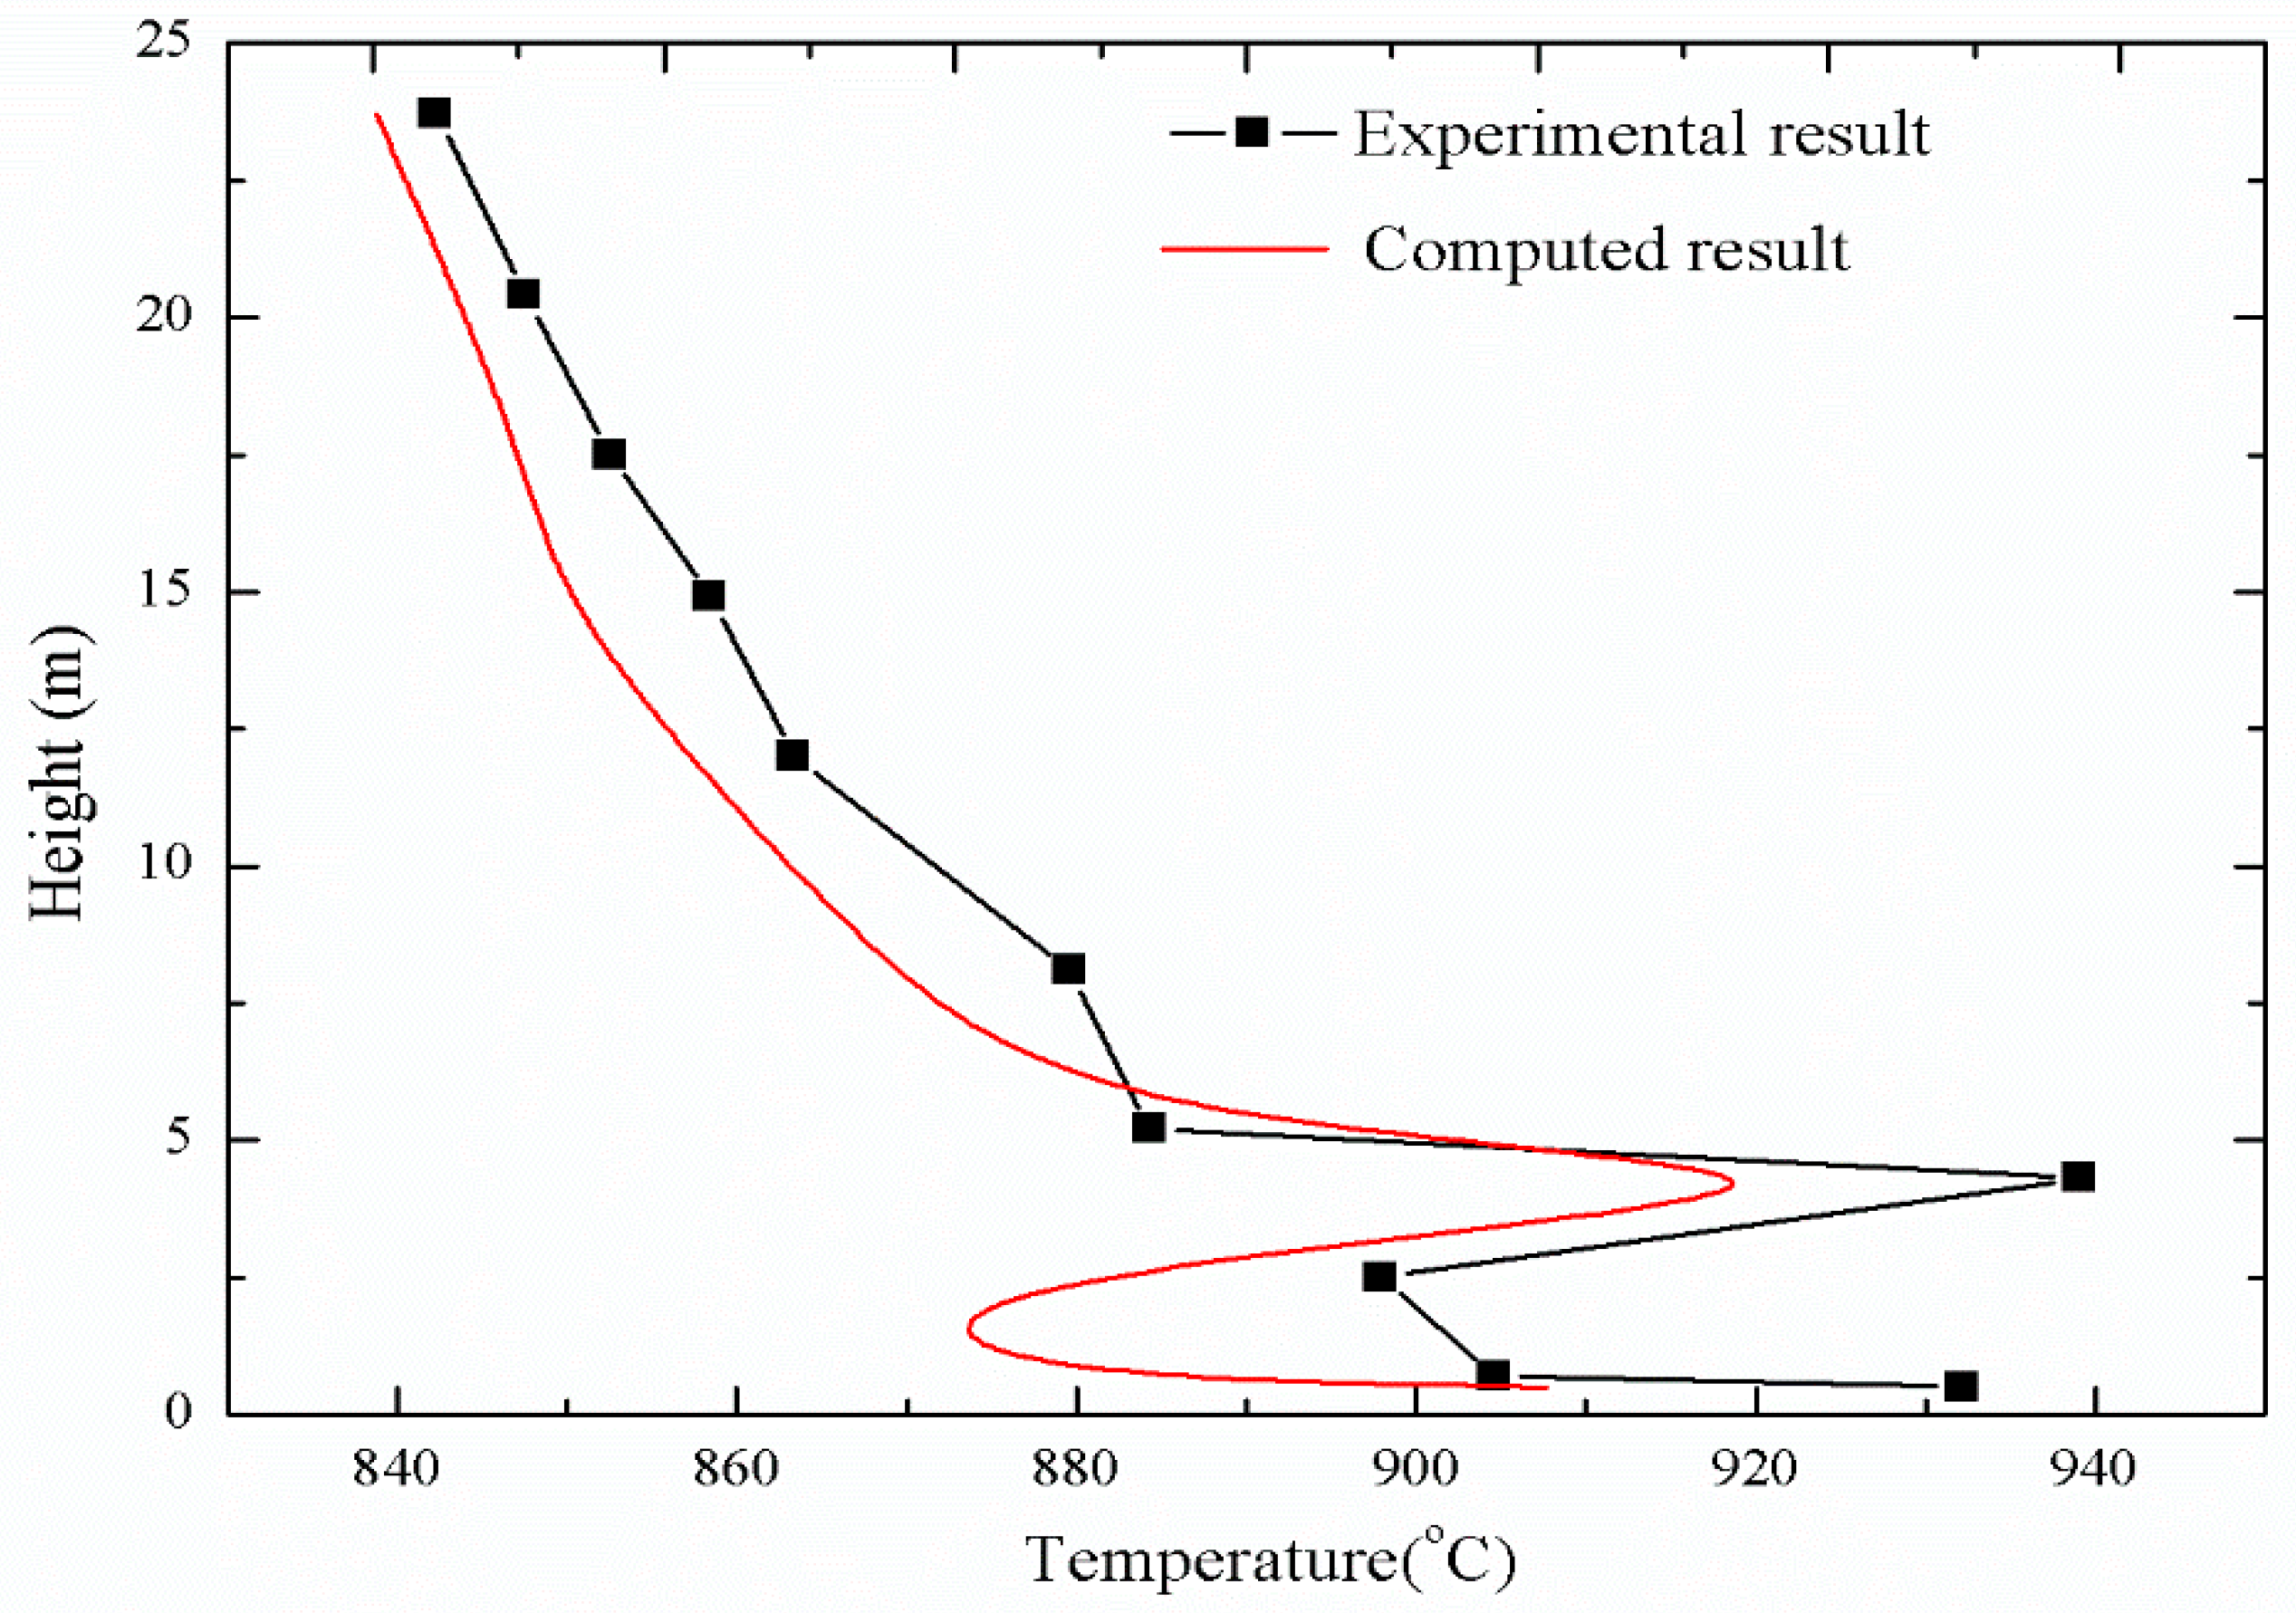
5.2. Simulation Results of the First Set of Experimental Conditions

For the sake of verifying the accuracy of the 3D computational fluid dynamics (CFD) model based on the MP-PIC method, a set of stable operating conditions were selected for simulation. The main operating parameters of this working conditions are shown in Table 3. The calculated results were compared with the experimental results to verify the accuracy of the model.
Figure 8, Figure 9 and Figure 10 show the main gas–solid parameters obtained by simulation. It can be seen from Figure 8 that there was a general tendency to move downward due to the injection of fuel particles and the backmixing of the large particle size from the return port at the bottom of the furnace. As the height increased, the fuel particles underwent a drying and crushing action, and the particle size gradually decreased. The movement of the particles in the 2.5-m dense phase region was complicated. When the height reached about 5 m, particles in the core area had an overall upward trend, but the particles near the wall moved downward along the water wall, showing a typical “core-annulus” shape. The particles in the core area flowed upward under the action of drag. Some of the particles continuously migrated to the vicinity of the wall. When the height exceeded 10 m, reaching the dilute phase region of the furnace, the backmixing between the core rings was gradually weakened, and the small particles in the dilute phase region tended to move upward. Figure 9 shows the distribution of the solid-phase volume fraction along the height. It can also be seen that the region below about 5 m was a dense phase region, and the solid-phase fraction was gradually reduced at 5 m or more.
The curves A–E in Figure 10 are distributions of the particle size distributions of the solid particles at heights of 0.3, 5, 15 and 20 m, respectively, in the furnace. As the height of the furnace increased, the proportion of small-sized particles became larger and larger due to the influence of solid particle precipitation and backmixing, while the proportion of large-sized particles became smaller and smaller. After some of the particles entered the cyclone with the flue gas, the particles that had undergone cyclone separation were returned to the furnace through the return sealing device. Large-sized particles were mostly concentrated in the dense phase region at the bottom of the furnace.
Figure 11 shows the comparison of temperature distribution under stable operating conditions between experiments and simulation. The temperature distributions obtained by simulation and experiment were quite close. After the coke was rapidly separated into volatiles after entering the furnace, the remaining coke was burned in the lower layer of the furnace to release a large amount of heat, resulting in the temperature of the lower layer of the furnace being relatively high. With the increase in furnace height, the oxygen concentration decreased with the consumption in the area below the secondary tuyere, and the temperature of the upper dense phase zone decreased with the addition of low-temperature fuel and limestone particles. At about 5 m, the fresh air brought from the secondary tuyere caused an increase of oxygen concentration, and the volatile combustion increased, forming a locally higher temperature. The temperature gradually decreased due to the cooling of the furnace wall above the secondary air vent.
As can be seen from Figure 12, the concentration of oxygen contained in the primary air at the inlet of the furnace gradually decreased after the gas–solid phase heterogeneous reaction occurred with the fuel particles in the dense phase region. The oxygen brought about by the secondary air caused a transient rise in the oxygen concentration near the secondary tuyere, and then the oxygen concentration gradually decreased as the gas-phase reaction proceeded. The changing trend of CO2 concentration was just opposite to that of O2, and it had been increasing after a short decline near the secondary air outlet. From the trend of CO concentration, it can be seen that in the dense phase region at the bottom of the furnace, the rate of CO formation was much larger than the consumption rate. Due to the insufficient oxygen concentration and the high concentration of combustibles in the dense phase region, the combustion was inadequate and a large amount of CO was generated. In the dilute upper phase of the furnace, the concentration of CO was gradually reduced, mainly because the consumption of combustibles was exhausted, and the remaining O2 in the flue gas reacted with CO to form CO2.
Generally, sulfur in coal can be divided into two parts: organic sulfur and pyrite sulfur, in addition to a small amount of sulfate sulfur. Since the fluidized bed combustion temperature was generally controlled below 1000 °C, the sulfur present in the fuel as sulfate was not SO2, so the amount of SO2 produced by fluidized bed combustion was lower than that of a pulverized coal furnace. At the same time, the coal minerals in the fluidized bed boiler could absorb the SO2 released by the combustion process. This characteristic of the fluidized bed combustion process is called the inherent desulfurization capacity of coal (i.e., the self-desulfurization capacity). Due to the low-temperature combustion characteristics of the fluidized bed combustion process, the addition of a desulfurizing agent (e.g., an alkaline earth metal oxide such as CaO) in the furnace absorbed SO2 to form a stable sulfate compound, thereby realizing the possibility of efficient desulfurization. The main factors affecting the desulfurization efficiency of a CFB boiler include the Ca/S molar ratio, operating bed temperature, fuel particle size, operating oxygen, staged combustion (primary air rate and secondary air ratio), SO2 residence time in the furnace, circulation material quantity, and load change [26]. It can be seen from Figure 12 that the concentration of SO2 gradually increased with the increase of the height in the dense phase region, mainly because the sulfur element in the fuel in the bottom region of the furnace was gradually released, and a large amount of SO2 was formed. Since powdered coke fuel has a molar ratio of calcium to sulfur of 5.66, the powder coke had strong self-desulfurization performance. As the height increased, a large amount of SO2 was absorbed by the fuel’s own CaO to form CaSO4. When no additional desulfurizer was added, the SO2 concentration at the exit of the furnace was only 45 mg/Nm3.
There are two main NOx generation pathways. One is that the nitrogen element in the air reacts with oxygen at a high temperature to form NOx, that is, thermal NOx. The other is that the nitrogen element in the fuel is thermally decomposed and oxidized to form NOx, that is, fuel-type NOx. The NO formed by fuel nitrogen accounts for more than 95% of the total NOx emission of the fluidized bed combustion mode [27]. It was assumed that the main component of NOx is NO, and the effect of N2O on NOx emissions was ignored in these simulations. When the coal was burned, part of the combustion was analyzed by volatilization (i.e., volatile nitrogen), and the other part remained on coke (i.e., coke nitrogen). Studies have shown that the main factors affecting the NOx emissions of circulating fluidized bed boilers are operating temperature, excess air coefficient, staged combustion, desulfurizer, fuel properties, cycle rate, selective noncatalytic reduction (SNCR), and ammonia injection [26]. It also can be seen from Figure 12 that after entering the furnace, the fuel particles rapidly generated a large amount of fuel-type NOx in a high-temperature environment, and then the NOx concentration gradually decreased with the reduction of CO and the dilution of the secondary air. The NOx concentration at the exit of the furnace was only about 90 mg/Nm3.
The highest concentration of pollutants occurred near the fuel feed point. When there was no limestone desulfurization and SCR/SNCR denitrification, the total discharge of pollutants from the furnace outlet was only about 135 mg/Nm3, which shows that the CFB boiler has a relatively low rate of pollutant emissions.

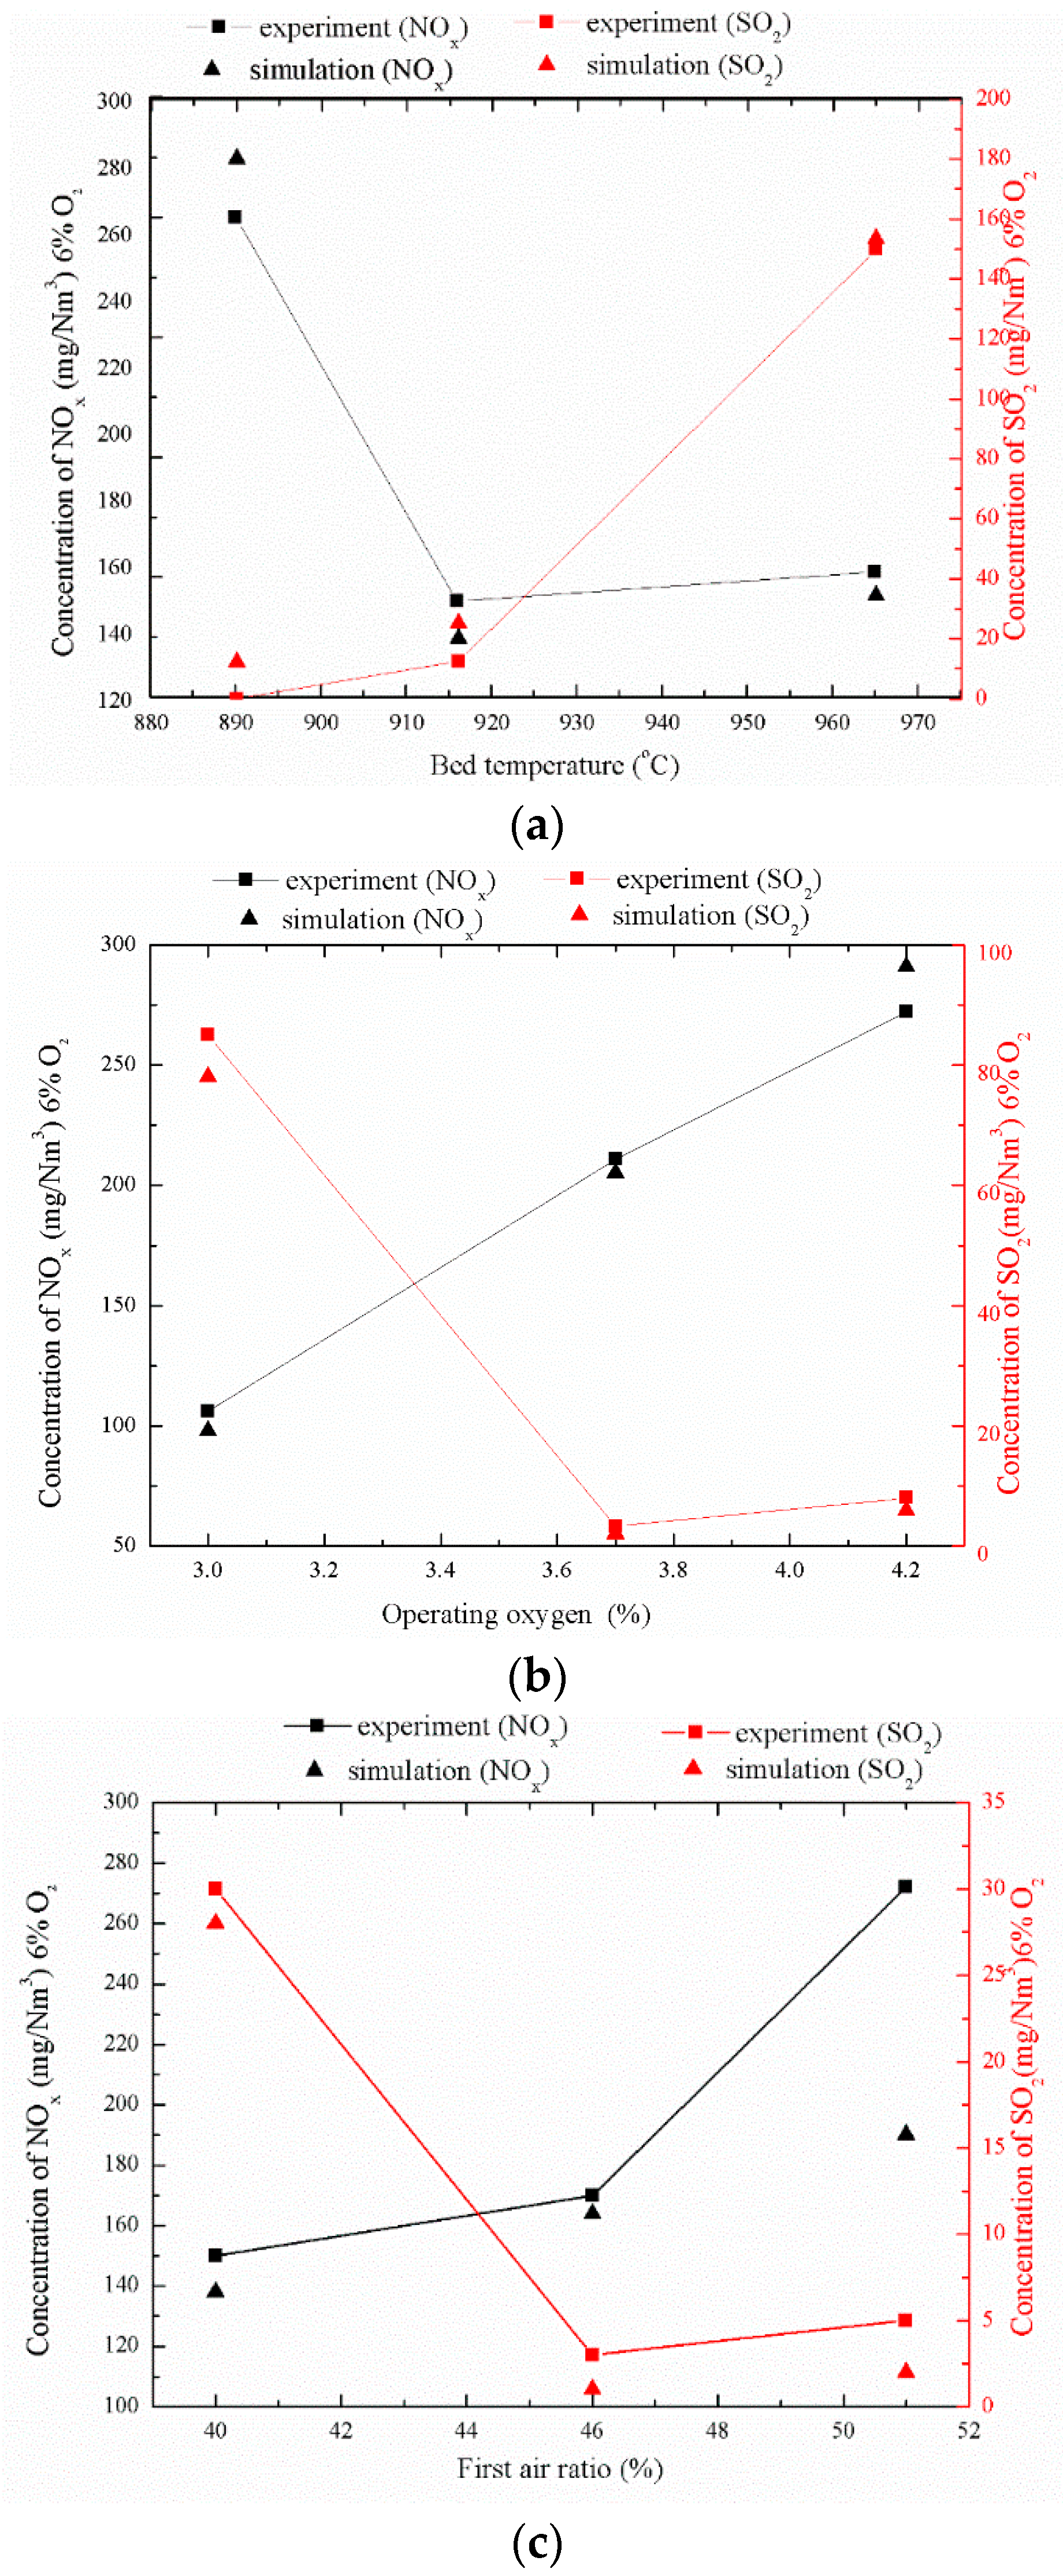
5.3. Factors Affecting Pollutant Emissions

Based on the above experiments and simulation results, it can be found that the flow combustion parameters’ distribution in the test bench was very similar to that of the actual power plant fluidized bed. Therefore, a series of studies on the factors affecting the actual power plant emissions were carried out on this test bench. Table 4 shows the powder coke burning test conditions.
Figure 13a–c shows three factors affecting the discharge of pollutants, which are operating bed temperature, operating oxygen, and primary air rate. Because the temperature, pressure, and moisture in the flue gas of different fuels and boilers are different, for the convenience of horizontal comparison, the concentrations of pollutants were converted to 6% O2, and dry flue gas concentration under standard conditions was used (1 atm and 0 °C).
It can be seen in Figure 13a that the increase of bed temperature will significantly affect the emission of SO2. As the bed temperature increases, the self-desulfurization ability of the fuel decreases, resulting in a sharp rise in SO2 emission concentration. The relationships between SO2 emission, operating oxygen, and primary air rate are shown in Figure 13b,c. The change trends of these two curves are quite similar. When the operating oxygen is 3.0% and the primary air rate is 40%, the SO2 emission is the highest. With the increase of operating oxygen and primary air rate, SO2 emissions are gradually reduced. After the operating oxygen exceeds 3.6% and the primary air rate exceeds 46%, the changes of the two have little effect on SO2 emissions.
It also can be seen from Figure 13 that the factors affecting the NOx emission concentration during the normal bed temperature and stable combustion of the powdered coke fuel are from large to small in the order of operating oxygen > operating bed temperature > primary air rate. After the bed temperature exceeds 916 °C, the generation of NOx does not change substantially. Similarly, the amount of NOx generated during the increase of primary air rate from 40% to 46% is also small, but the change of NOx emission and operating oxygen quantity is linear. The NOx emission concentration value of the powdered coke fuel under normal bed temperature and stable combustion conditions increases with the increase of oxygen content and primary air rate. Considering the influence of bed temperature on SO2 emissions, high temperatures (such as 965 °C) and low temperatures (such as 890 °C) are not conducive to reduce pollutant discharge in fluidized bed powder coke combustion; the optimal operating bed temperature is about 916 °C. After the L9 (34) type orthogonal table test data processing, it was found that the optimal test conditions for making the NOx emission concentration the lowest are a bed temperature of 916 °C, an oxygen content of 3.0%, and a primary air rate of 40%.
The comparison between the simulation results of these nine test conditions and the experimental results shows that the grid-based average chemical reaction calculation and the MP-PIC-based gas–solid flow simulation have relatively high precision for powder coke fluidized bed combustion and pollutant discharge. However, when the primary air rate was 51%, the NOx emission in the simulation results showed a certain error compared with the experimental results, but the overall change trend was basically correct, which indicates that the calculation model still has room for improvement.

6. Conclusions

As a new type of fluidized bed fuel, powder coke, which is carbonized by coal, has been studied in this paper for its fluidized combustion and pollutant emission characteristics. The factors affecting the stability and pollutant emission of powder coke in the furnace combustion of a fluidized bed boiler have been studied through a series of experiments. At the same time, a 3D CFD model of the furnace based on the MP-PIC method has been developed. The particle size distribution of the particles was taken into consideration in this model. The particle packing form was used to describe the solid phase to reduce the quantity of calculations. The discrete gas–solid heterogeneous reactions were averaged in the grid cell. The simulated results were compared with the experimental results. The calculated temperature distribution in the furnace was similar to the experimental results, the maximum error was less than 25 °C, and the porosity distribution and solid-phase velocity distribution in the furnace were correct. The distribution of gases was similar to that of other fluidized bed boilers [24]. The results show that the model has fairly high precision and can be used for further research.
The NOx pollutant emission value of the normal bed temperature stable combustion test conditions ranged from 70.5 to 507.9 mg/Nm3 (dry flue gas, 6% oxygen). The analysis of NOx emission characteristics of multiple test conditions showed that CFB was used. The NOx emission value was affected by various factors, such as operating bed temperature, oxygen volume, and primary air rate, during combustion. The self-desulfurization characteristics in the CFB furnace were mainly affected by fuel type, self-calcium ratio of calcium to sulfur, and boiler operation mode. For powder coke fuel fluidized combustion, operating oxygen (≤3.0%) and primary air rate (≤40%) were low and the average operating bed temperature was high (≥960 °C), which seriously affected the self-desulfurization capacity of the powder coke fuel and led to an increase in SO2 emission concentration in the operation of oxygen from high to low (such as from 4.2% to 3.0% or less.) Since the SO2 emission concentration is highly likely to rise sharply, it is therefore recommended to avoid the above operating conditions during CFB boiler operation and to design a process to improve the powder coke fuel furnace. The self-desulfurization ability in the internal combustion process enables the implementation of desulfurization agents such as limestone and an SO2 emission value that meets the current strict SO2 emission standards.
This article mainly introduced the combustion and pollutant emission test of powder coke in the fluidized bed boiler test bench. At the same time, we developed a 3D CFD model based on the MP-PIC method for a fluidized bed boiler fluidization reaction system to investigate the internal gas–solid flow and reactions. As a special fluidized bed boiler fuel, powder coke has a different linearity of composition and pollutant emissions than traditional coal. In future research, we will try to extend this method to the application of a large-scale commercial 600-MW circulating fluidized bed. In the near future, we will combine the research results of the core-annulus cell model to simulate the Baima Demonstration Power Station, further verify the accuracy and stability of the MP-PIC method, and provide technical guidance for future plant design, operation, and operations based on the calculation results.

Author Contributions

Conceptualization, H.W.; Formal analysis, L.S.; Funding acquisition, C.Y.; Investigation, H.W.; Methodology, H.W.; Project administration, C.Y.; Resources, H.H.; Supervision, C.Y.; Visualization, K.D.; Writing—original draft, H.W.; Writing—review & editing, H.W.

Funding

This research was funded by the National Natural Science Foundation of China, grant numbers 51576020 and 51876011.

Conflicts of Interest

The authors declare no conflicts of interests.

Nomenclature

ε Void fraction
h Height of furnace (m)
ρ Density (kg/m3)
g Gravity (m/s2)
S Mass changes of each component due to the chemical reaction (kg/m3/s)
u Velocity of gas and solid phase (m/s)
dDiameter of particle (m)
hConvective heat transfer coefficient (W/(m2·K))
t Time (s)
pPressure (Pa)
C p Specific heat capacity (J/kg∙K)
T Temperature (K)
μ Viscosity (Pa∙s)
λ Thermal conductivity (W/(m·K))
C Mole concentration of each species
ReReynolds number
S h Sherwood number
ΦViscous dissipation
Q ˙ Energy source
q ˙ D Enthalpy diffusion term
mMass (kg)
F p , drag ( t ) Drag force of the parcel
F p , coll ( t ) Interaction force between the parcels
P g , k Solid-phase pressure gradient
β m Gas–solid phase energy transfer coefficient
VVolume
X Position
Subscripts
iNumber of gas-phase species
hHeight
gGas phase
sSolid phase
kk-th cell
cpClose packing state
pProperties of parcel

References

  1. Zhuang, Y.-Q.; Chen, X.-M.; Luo, Z.-H.; Xiao, J. CFD–DEM modeling of gas–solid flow and catalytic MTO reaction in a fluidized bed reactor. Comput. Chem. Eng. 2014, 60, 1–16. [Google Scholar] [CrossRef]
  2. Gerber, S.; Behrendt, F.; Oevermann, M. An Eulerian modeling approach of wood gasification in a bubbling fluidized bed reactor using char as bed material. Fuel 2010, 89, 2903–2917. [Google Scholar] [CrossRef]
  3. Leckner, B.; Gómez-Barea, A. Oxy-fuel combustion in circulating fluidized bed boilers. Appl. Energ. 2014, 125, 308–318. [Google Scholar] [CrossRef]
  4. Agung, A.; Lathouwers, D.; van der Hagen, T.H.; van Dam, H.; Pain, C.C.; Goddard, A.J.; Eaton, M.D.; Gomes, J.L.; Miles, B.; de Oliveira, C.R. On an improved design of a fluidized bed nuclear reactor-I: Design modifications and steady-state features. Nucl. Technol. 2006, 153, 117–131. [Google Scholar] [CrossRef]
  5. Gidaspow, D. Hydrodynamics of fiuidizatlon and heat transfer: Supercomputer modeling. Appl. Mech. Rev. 1986, 39, 1–23. [Google Scholar] [CrossRef]
  6. Chen, S.; Fan, Y.; Yan, Z.; Wang, W.; Lu, C. CFD simulation of gas–solid two-phase flow and mixing in a FCC riser with feedstock injection. Powder Technol. 2016, 287, 29–42. [Google Scholar] [CrossRef]
  7. Liu, D.; Chen, X.; Zhou, W.; Zhao, C. Simulation of char and propane combustion in a fluidized bed by extending DEM–CFD approach. Proc. Combust. Inst. 2011, 33, 2701–2708. [Google Scholar] [CrossRef]
  8. Sinclair, J.; Jackson, R. Gas-particle flow in a vertical pipe with particle-particle interactions. AlChE J. 1989, 35, 1473–1486. [Google Scholar] [CrossRef]
  9. Pita, J.A.; Sundaresan, S. Gas-solid flow in vertical tubes. AIChE J. 1991, 37, 1009–1018. [Google Scholar] [CrossRef]
  10. Snider, D.M.; Clark, S.M.; O’Rourke, P.J. Eulerian–Lagrangian method for three-dimensional thermal reacting flow with application to coal gasifiers. Chem. Eng. Sci. 2011, 66, 1285–1295. [Google Scholar] [CrossRef]
  11. Xie, J.; Zhong, W.; Jin, B.; Shao, Y.; Huang, Y. Eulerian–Lagrangian method for three-dimensional simulation of fluidized bed coal gasification. Adv. Powder Technol. 2013, 24, 382–392. [Google Scholar] [CrossRef]
  12. Snider, D.M.; O’Rourke, P.J.; Andrews, M.J. Sediment flow in inclined vessels calculated using a multiphase particle-in-cell model for dense particle flows. Int. J. Multiph. Flow 1998, 24, 1359–1382. [Google Scholar] [CrossRef]
  13. Snider, D.; Banerjee, S. Heterogeneous gas chemistry in the CPFD Eulerian–Lagrangian numerical scheme (ozone decomposition). Powder Technol. 2010, 199, 100–106. [Google Scholar] [CrossRef]
  14. Abbasi, A.; Ege, P.E.; De Lasa, H.I. CPFD simulation of a fast fluidized bed steam coal gasifier feeding section. Chem. Eng. J. 2011, 174, 341–350. [Google Scholar] [CrossRef]
  15. Ryan, E.M.; DeCroix, D.; Breault, R.; Xu, W.; Huckaby, E.D.; Saha, K.; Dartevelle, S.; Sun, X. Multi-phase CFD modeling of solid sorbent carbon capture system. Powder Technol. 2013, 242, 117–134. [Google Scholar] [CrossRef]
  16. Adamczyk, W.P.; Węcel, G.; Klajny, M.; Kozołub, P.; Klimanek, A.; Białecki, R.A. Modeling of particle transport and combustion phenomena in a large-scale circulating fluidized bed boiler using a hybrid Euler–Lagrange approach. Particuology 2014, 16, 29–40. [Google Scholar] [CrossRef]
  17. Loha, C.; Chattopadhyay, H.; Chatterjee, P.K. Three dimensional kinetic modeling of fluidized bed biomass gasification. Chem. Eng. Sci. 2014, 109, 53–64. [Google Scholar] [CrossRef]
  18. Zhong, W.; Xie, J.; Shao, Y.; Liu, X.; Jin, B. Three-dimensional modeling of olive cake combustion in CFB. Appl. Therm. Eng. 2015, 88, 322–333. [Google Scholar] [CrossRef]
  19. Gidaspow, D. Multiphase Flow and Fluidization: Continuum and Kinetic Theory Descriptions; Academic Press: Cambridge, MA, USA, 1994. [Google Scholar]
  20. O’Rourke, P.J.; Snider, D.M. An improved collision damping time for MP-PIC calculations of dense particle flows with applications to polydisperse sedimenting beds and colliding particle jets. Chem. Eng. Sci. 2010, 65, 6014–6028. [Google Scholar] [CrossRef]
  21. O’Rourke, P.J.; Zhao, P.P.; Snider, D. A model for collisional exchange in gas/liquid/solid fluidized beds. Chem. Eng. Sci. 2009, 64, 1784–1797. [Google Scholar] [CrossRef]
  22. Harris, S.; Crighton, D. Solitons, solitary waves, and voidage disturbances in gas-fluidized beds. J. Fluid Mech. 1994, 266, 243–276. [Google Scholar] [CrossRef]
  23. Auzerais, F.; Jackson, R.; Russel, W. The resolution of shocks and the effects of compressible sediments in transient settling. J. Fluid Mech. 1988, 195, 437–462. [Google Scholar] [CrossRef]
  24. Wu, H.; Yang, C.; He, H.; Huang, S.; Chen, H. A hybrid simulation of a 600 MW supercritical circulating fluidized bed boiler system. Appl. Eng. 2018, 143, 977–987. [Google Scholar] [CrossRef]
  25. Patankar, S. Numerical Heat Transfer and Fluid Flow; CRC Press: Boca Raton, FL, USA, 1980. [Google Scholar]
  26. Scala, F. Fluidized Bed Technologies for Near-Zero Emission Combustion and Gasification; Elsevier: Amsterdam, The Netherlands, 2013. [Google Scholar]
  27. Wang, Q.; Luo, Z.; Li, X.; Fang, M.; Ni, M.; Cen, K. Modeling of NO and N2O formation and decomposition in circulating fluidized bed boiler. J. Fuel Chem. Technol. 1998, 26, 108–113. [Google Scholar]
Figure 1. Main reactions of the powder coke combustion process.
Energies 12 01424 g001
Figure 2. Calculation flow chart.
Energies 12 01424 g002
Figure 3. Dongfang boiler 3-MW circulating fluidized bed combustion test bench.
Energies 12 01424 g003
Figure 4. Schematic diagram of main equipment of the circulating fluidized bed (CFB) test bench. (1) Combustion chamber; (2) Cyclone separator; (3) Loop-seal recycle device; (4) Tail flue; (5) Fuel feeder; (6) Limestone feeder; (7) Fluidization air chamber; (8) Cooling water system (9) Air preheater; (10) Ignition unit; (11) Ash discharge system; (12) Feed pump; (13) High-pressure fluidized blower; (14) Primary fan; (15) Secondary air fan; (16) Draught fan.
Energies 12 01424 g004
Figure 5. (Left) schematic of the CFB rig; (right) numerical grid of the furnace.
Energies 12 01424 g005
Figure 6. Particle size distribution of powder coke.
Energies 12 01424 g006
Figure 7. Diagram of ignition point determined by the powder coke thermal gravity-differential thermal gravity (TG-DTG) combined method.
Energies 12 01424 g007
Figure 8. Radial distribution of particle velocities at different heights.
Energies 12 01424 g008
Figure 9. Distribution of solid volume fraction along the height.
Energies 12 01424 g009
Figure 10. Particle size distributions at different heights.
Energies 12 01424 g010
Figure 11. Comparison of temperature distribution under stable operating conditions.
Energies 12 01424 g011
Figure 12. Distribution of gas concentrations along the height from the simulation.
Energies 12 01424 g012
Figure 13. Three factors affecting pollutant emissions. (a) Effect of bed temperature on pollutant emissions; (b) Effect of operating oxygen on pollutant emissions; (c) Effect of first air ratio on pollutant emissions.
Energies 12 01424 g013
Table 1. Descriptions of the experiments.
UnitsValue
Thermal power (LHV)MWth3.0
Apparent velocitym/s~5
Cross-section area of dense phasemm2550 × 900
Cross-section area of dilute phasemm21100 × 900
Height of the furnacemm24,500
Table 2. Analysis of powder coke.
Proximate Analysis
Moisture (%)19.92
Volatile matter (%)8.83
Ash (%)10.74
Fixed carbon (%)60.51
Ultimate Analysis (Dry Ash Free)
Carbon (%)90.68
Hydrogen (%)1.92
Oxygen (%)5.83
Nitrogen (%)1.11
Sulfur (%)0.46
Lower calorific value (MJ/kg)21.89
Table 3. Experimental and modeling conditions.
UnitsValue
Fluidized air flowm3/s0.42
Fluidized air pressurePa110,955
Fluidized air temperature°C243.4
Second air flowm3/s0.416
Second air pressurePa106,325
Second air temperature°C198.8
Feed powder cokeKg/s0.03
LimestoneKg/s0
Average bed temperature°C916
Table 4. Powder coke burning test condition.
Average Bed Temperature (°C)Operating Oxygen (%)Primary Air Ratio (%)
19163.051
29163.746
39164.240
48903.046
58903.740
68904.251
79653.040
89653.751
99654.246

