Optimal Bidding/Offering Strategy for EV Aggregators under a Novel Business Model


Abstract
:1. Introduction
- A novel business model is proposed for the EVA, distinguished by the idea that the PEV owners’ charging demands are considered to be elastic. Instead of being a binding constraint, the charging demands of PEVs are optimized according to the owners’ demand curves and marketing conditions.
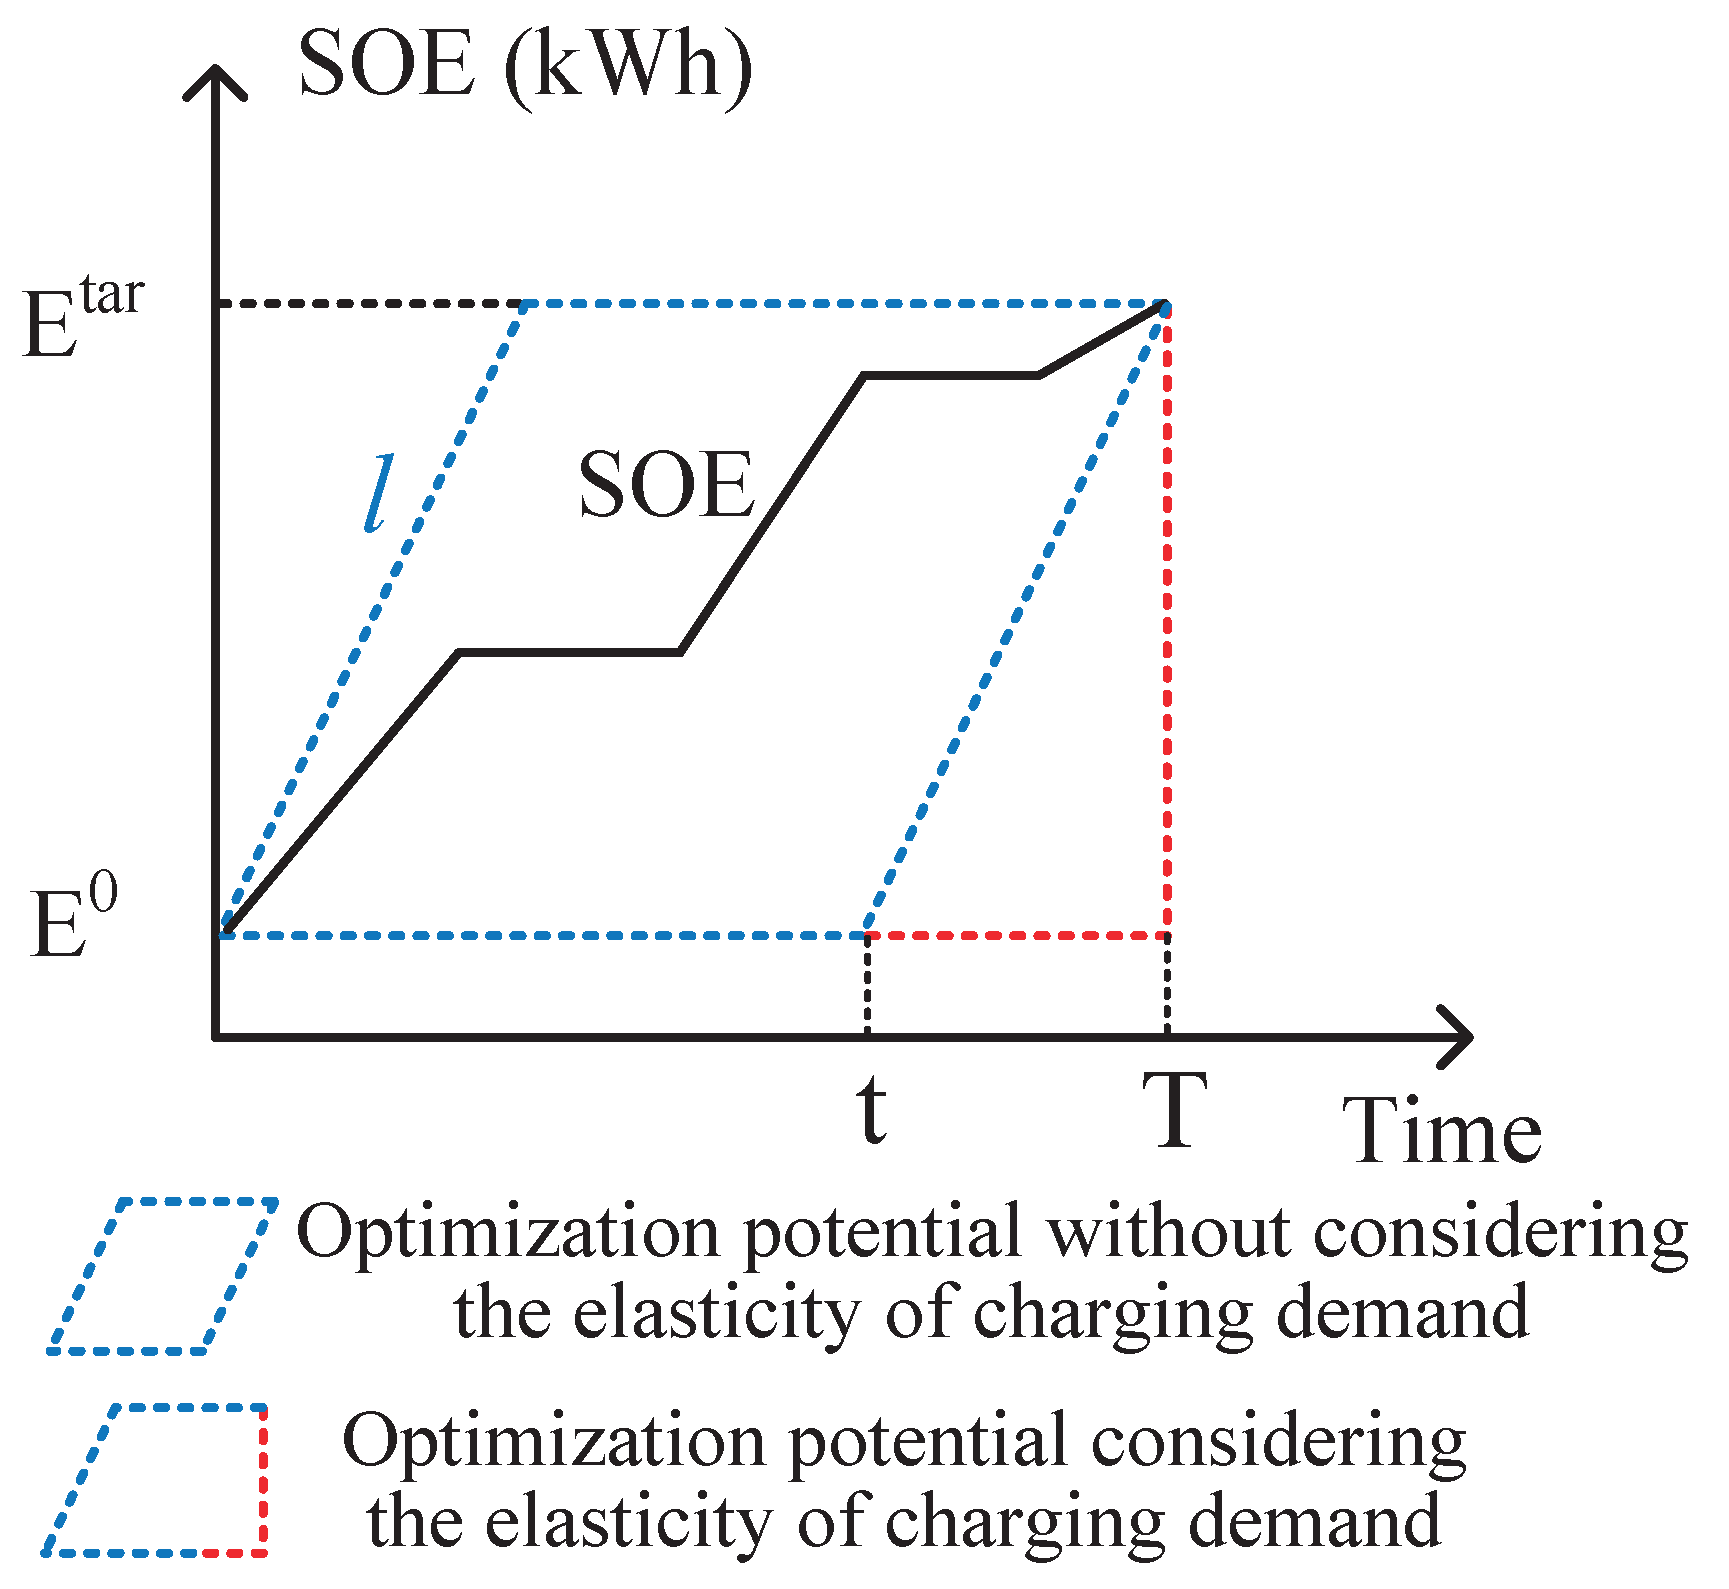
- We demonstrate that (1) the optimization potential under this business model is greater than that under the traditional one; (2) the proposed business model can realize the full potential of the PEVs as a demand-response resource; (3) the proposed business model is incentive-compatible.
- The optimal bidding/offering strategy is proposed for the EVA in the energy and regulation market, formulated as a two-stage stochastic optimization model. A risk-constrained profit term is added in the objective function to regularize the expected profits and optimize the charging schedules of PEVs.
2. A Novel Business Model for EVA
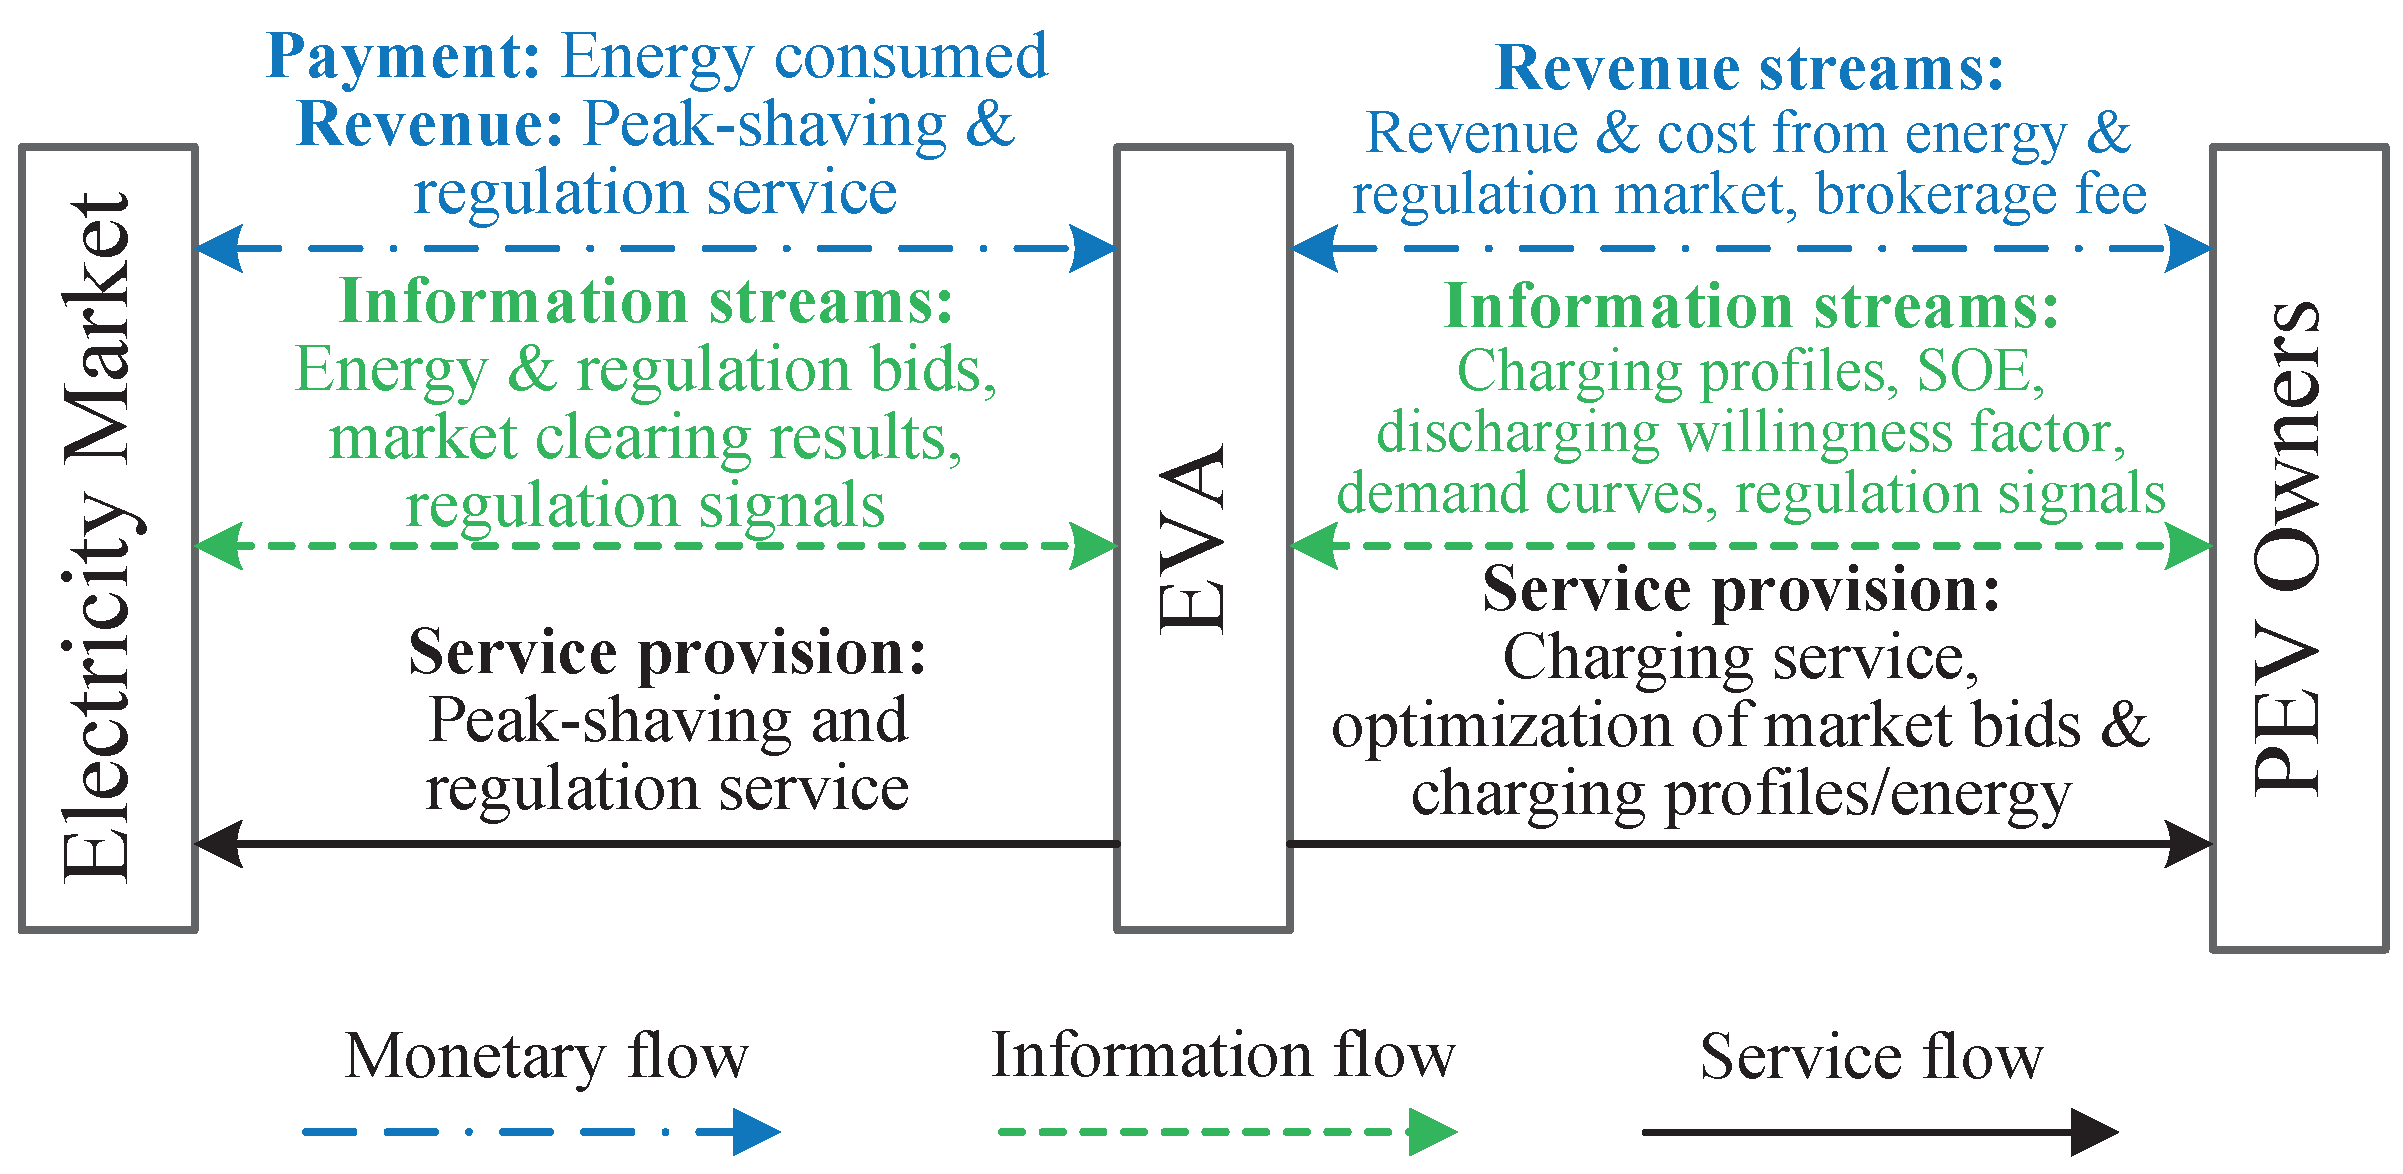
2.1. Business Model Structure
2.2. The Improvement of the Proposed Business Model
2.3. Practicability of the Proposed Business Model
3. Optimal Bidding/Offering Strategy under the Traditional and Proposed Business Model
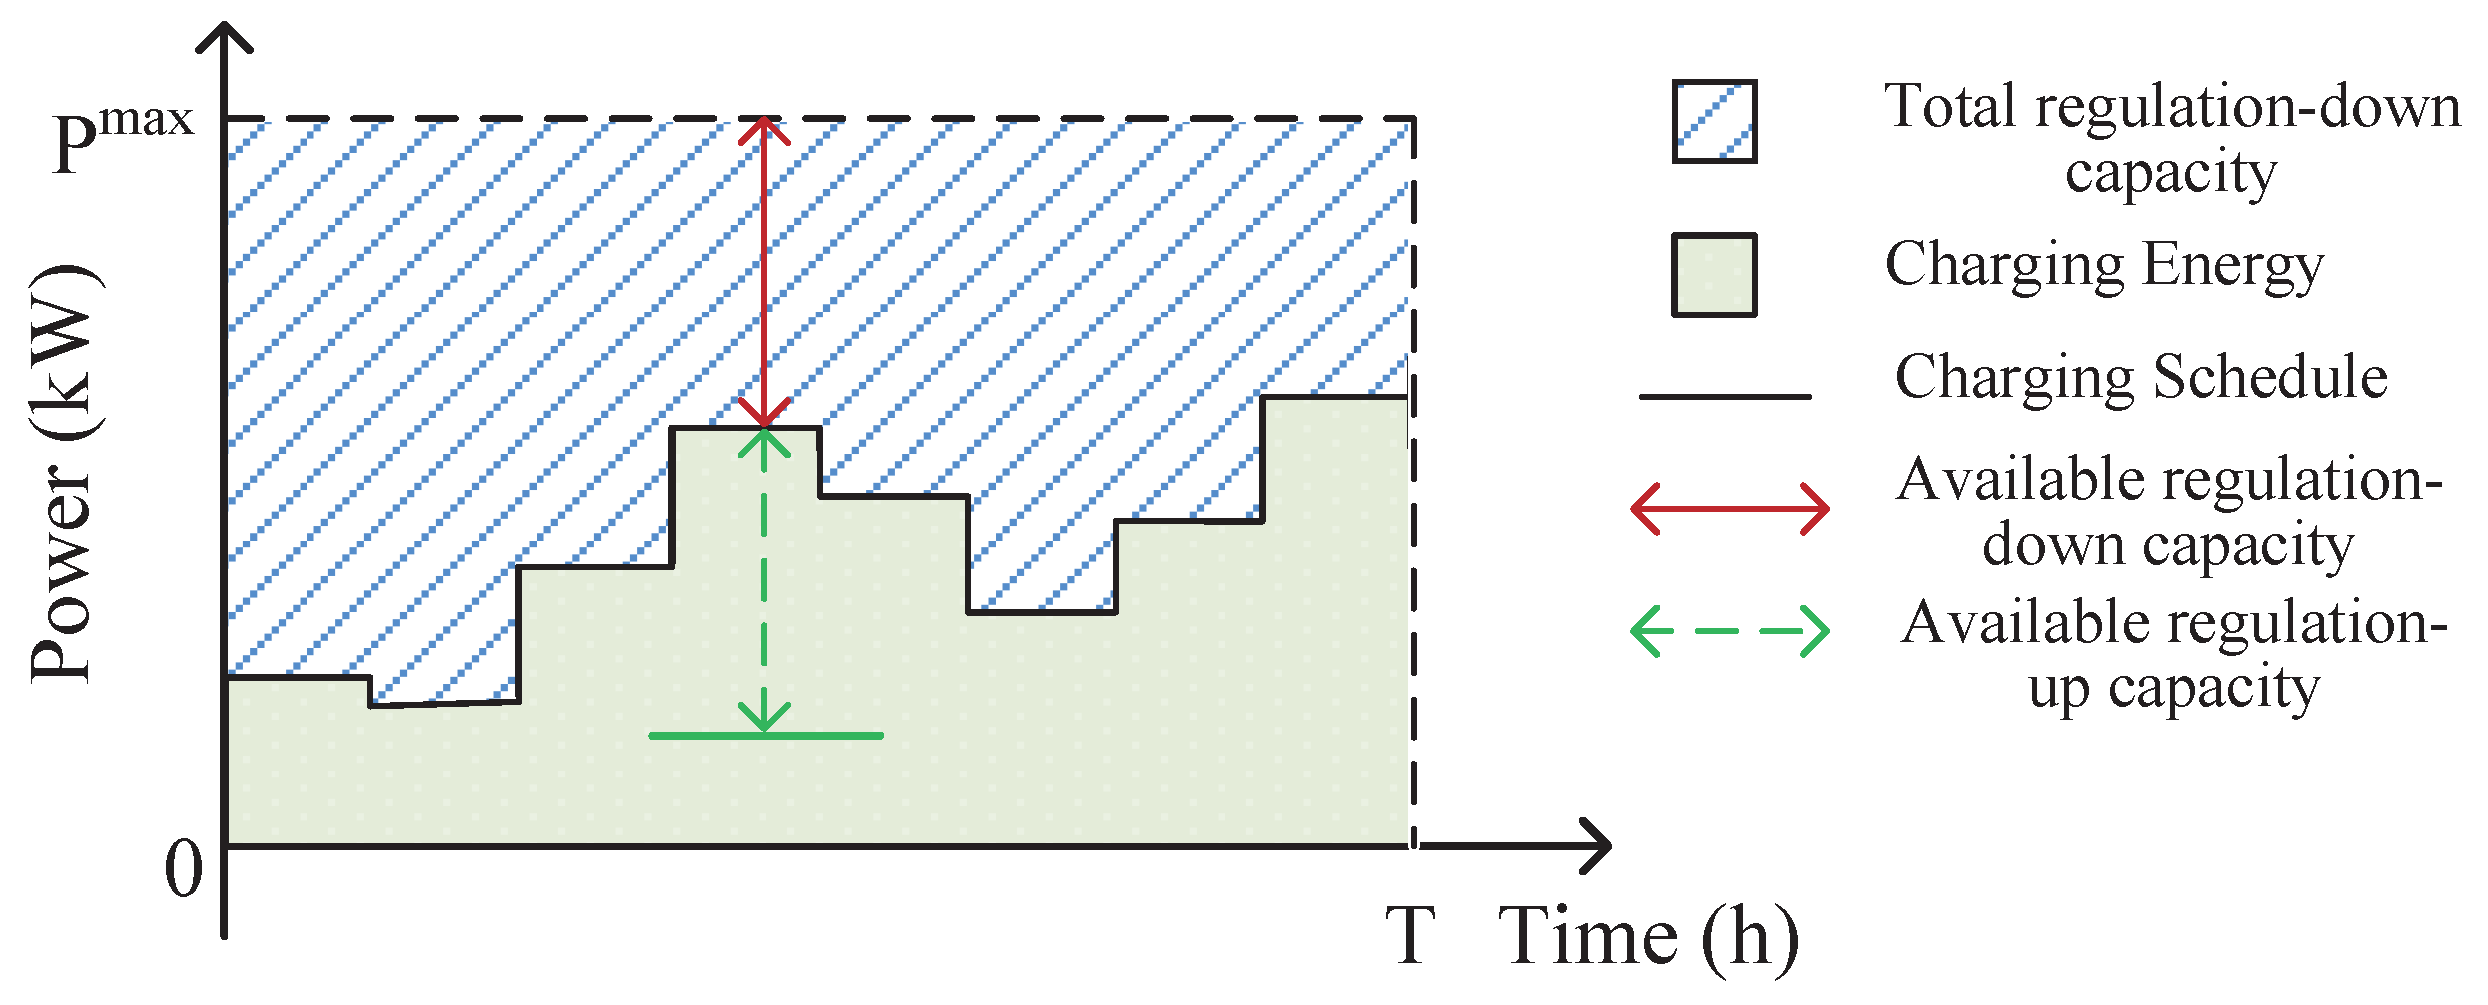
3.1. Regulation Revenue Modeling
3.2. The Proposed Strategy under the Traditional Business Model
3.3. The Proposed Strategy under the Novel Business Model
3.3.1. The Optimal Bidding/Offering Model
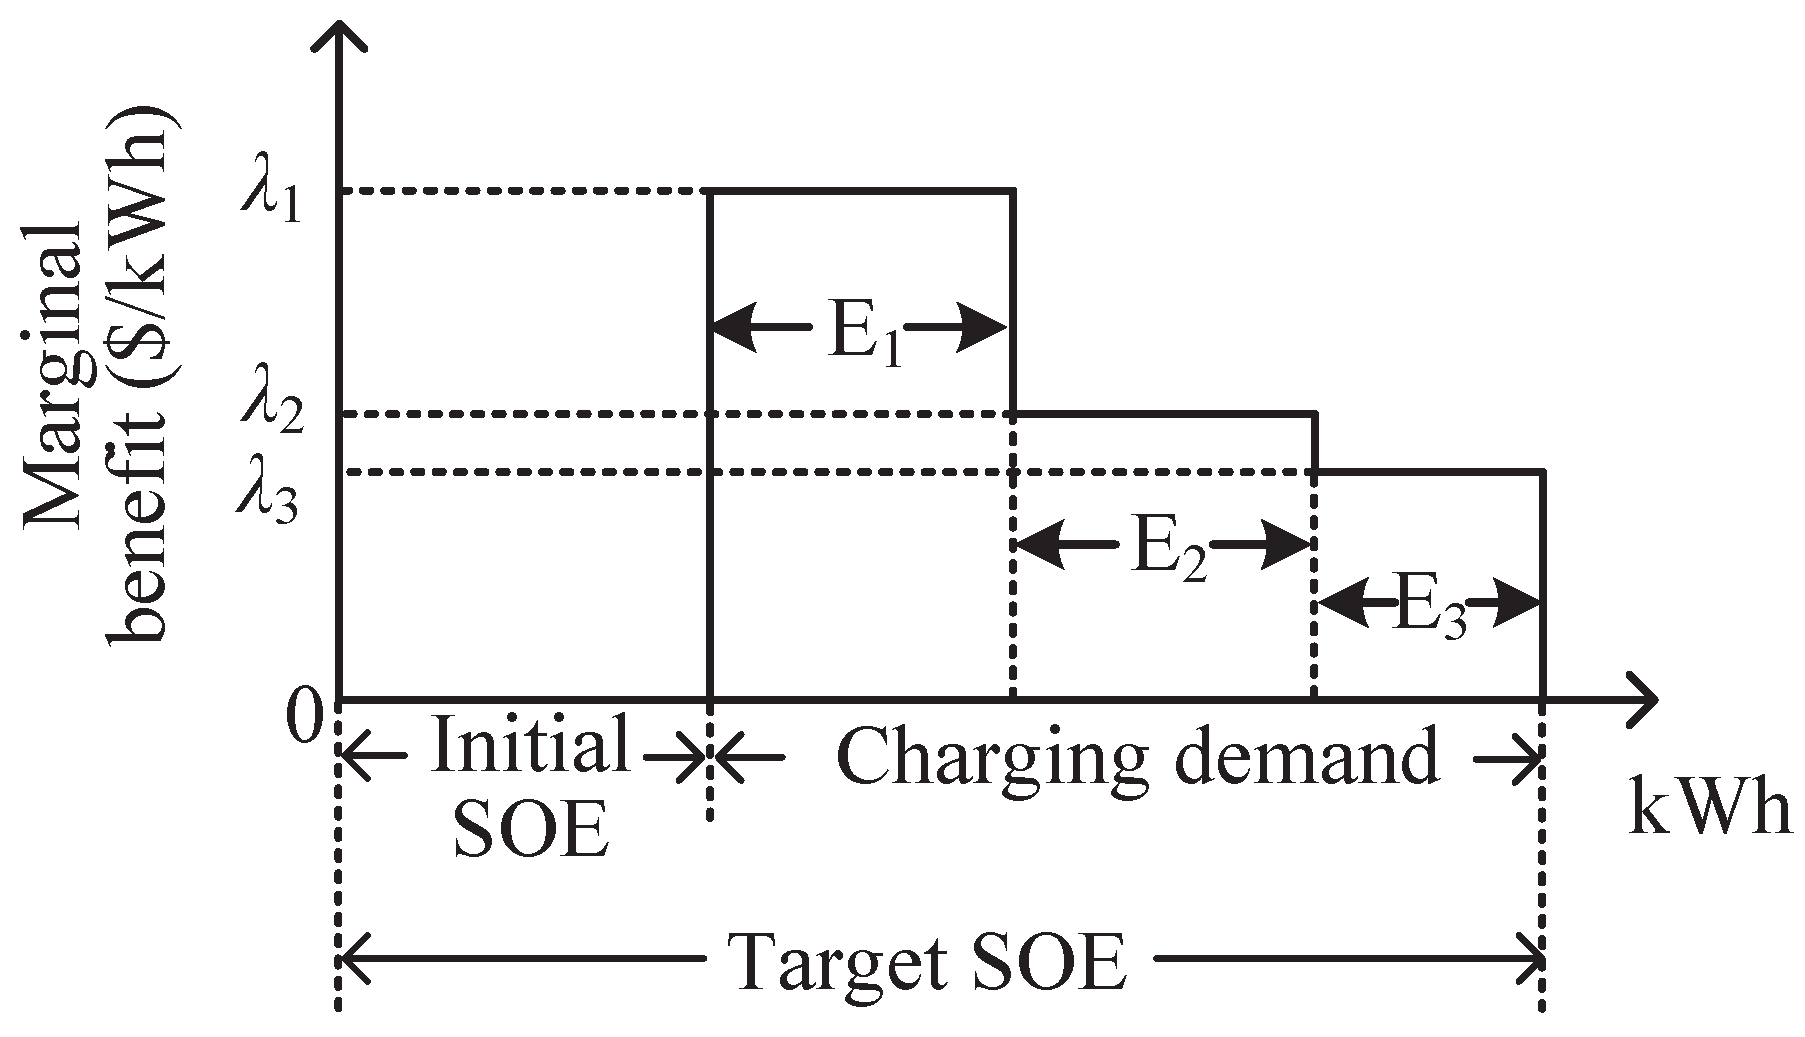
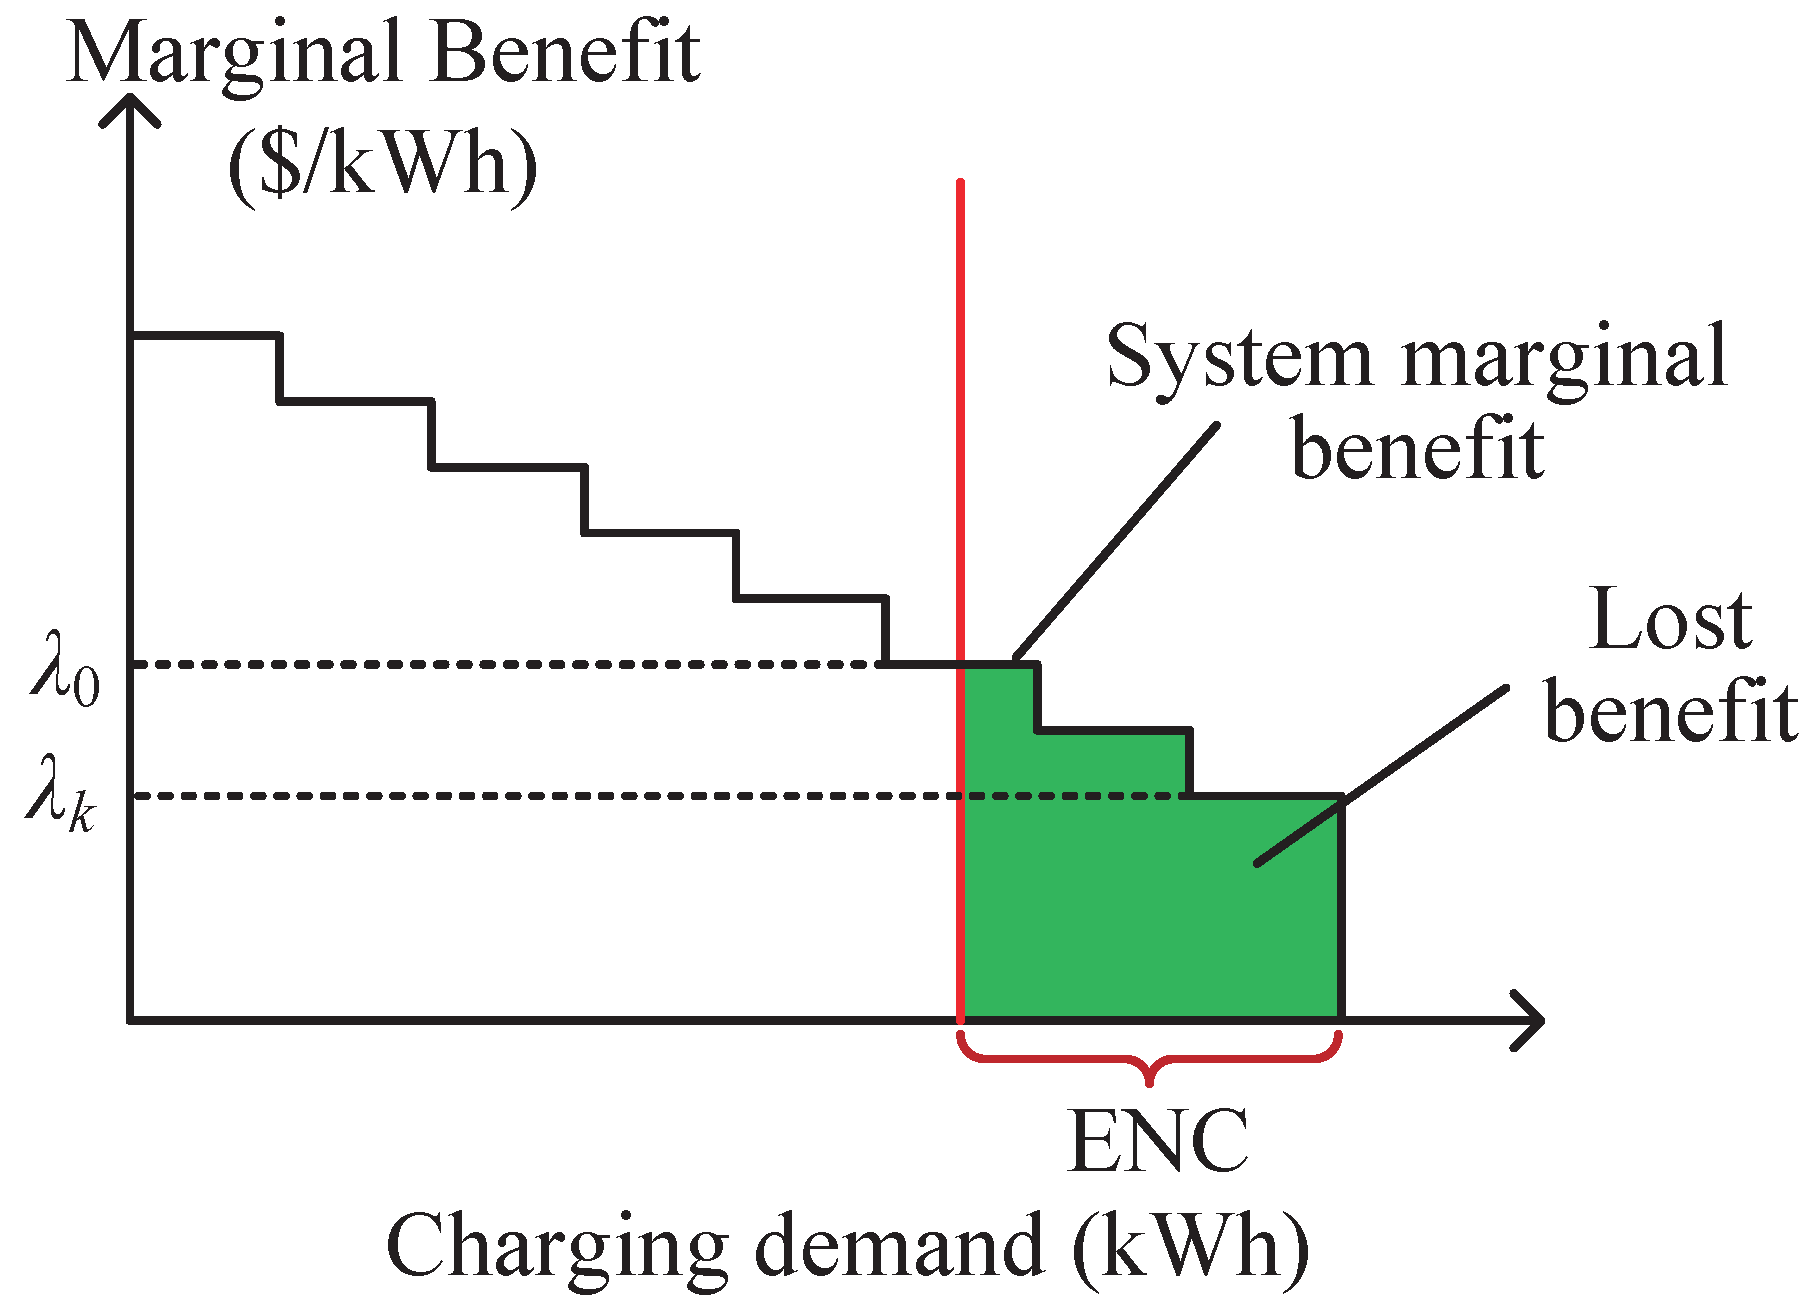
3.3.2. Profit Modeling of PEV Owners
4. Case Study
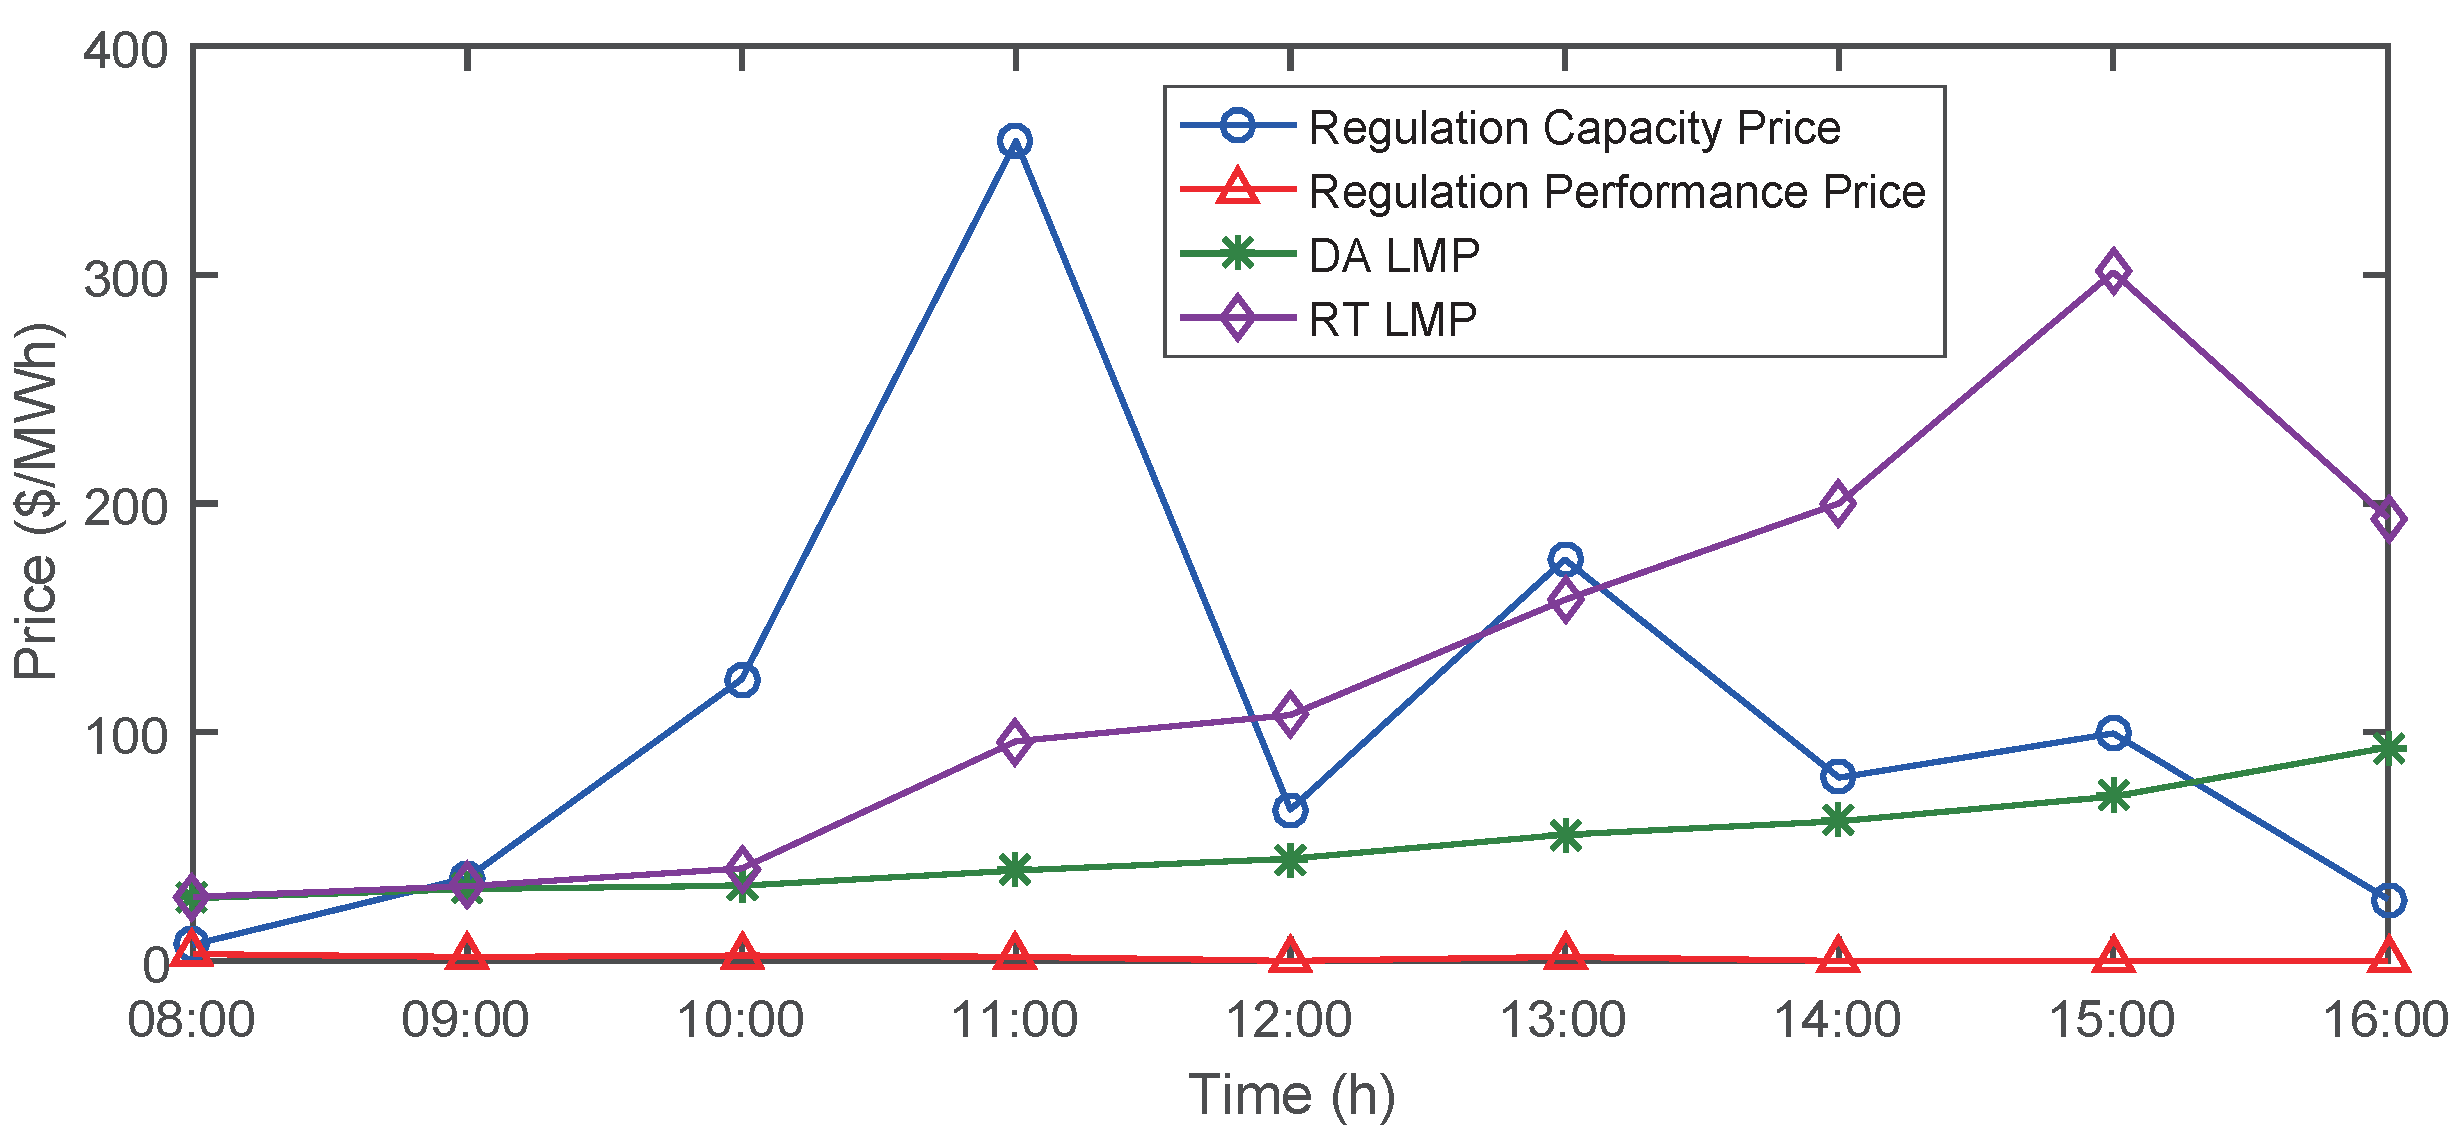
4.1. Parameters
4.2. Comparison between M1 and M2
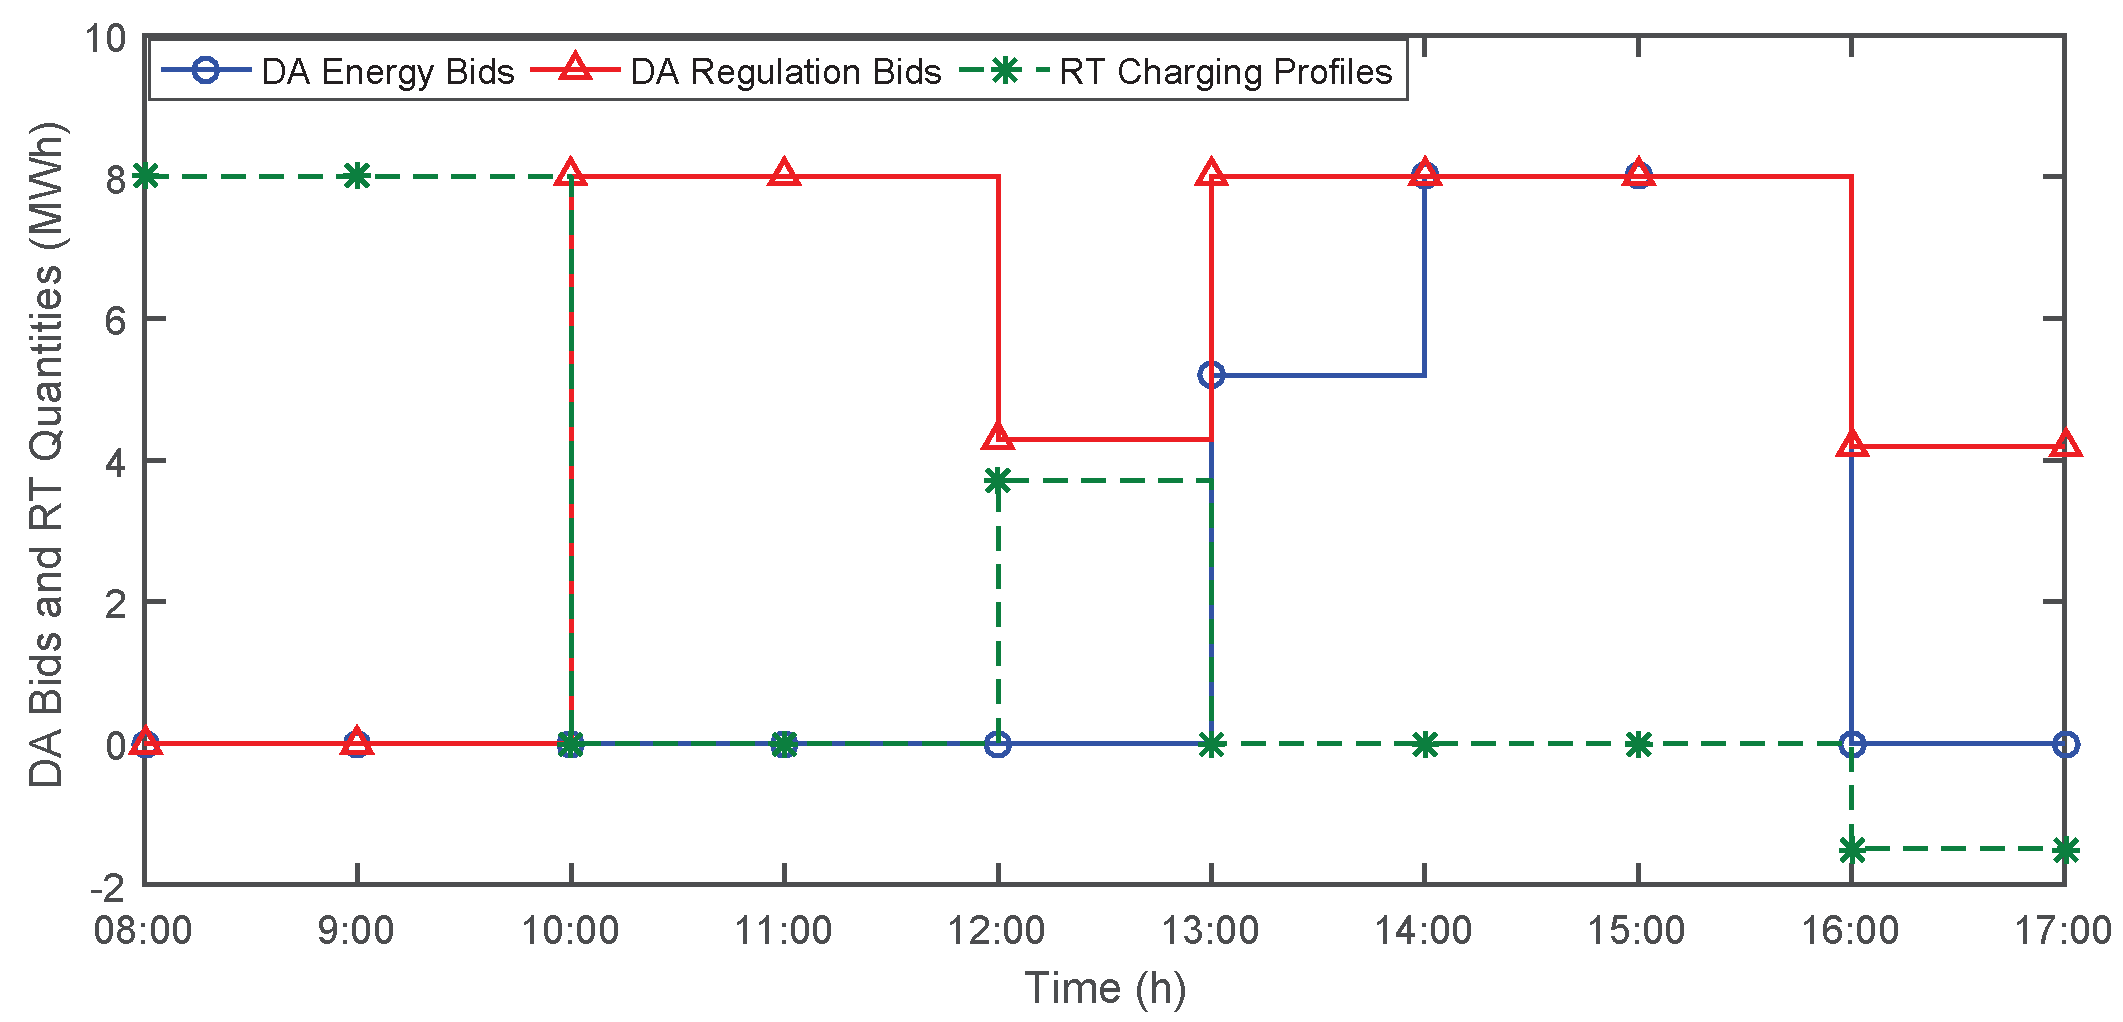
4.2.1. Comparison of the Optimal DA Bids and Total Profits
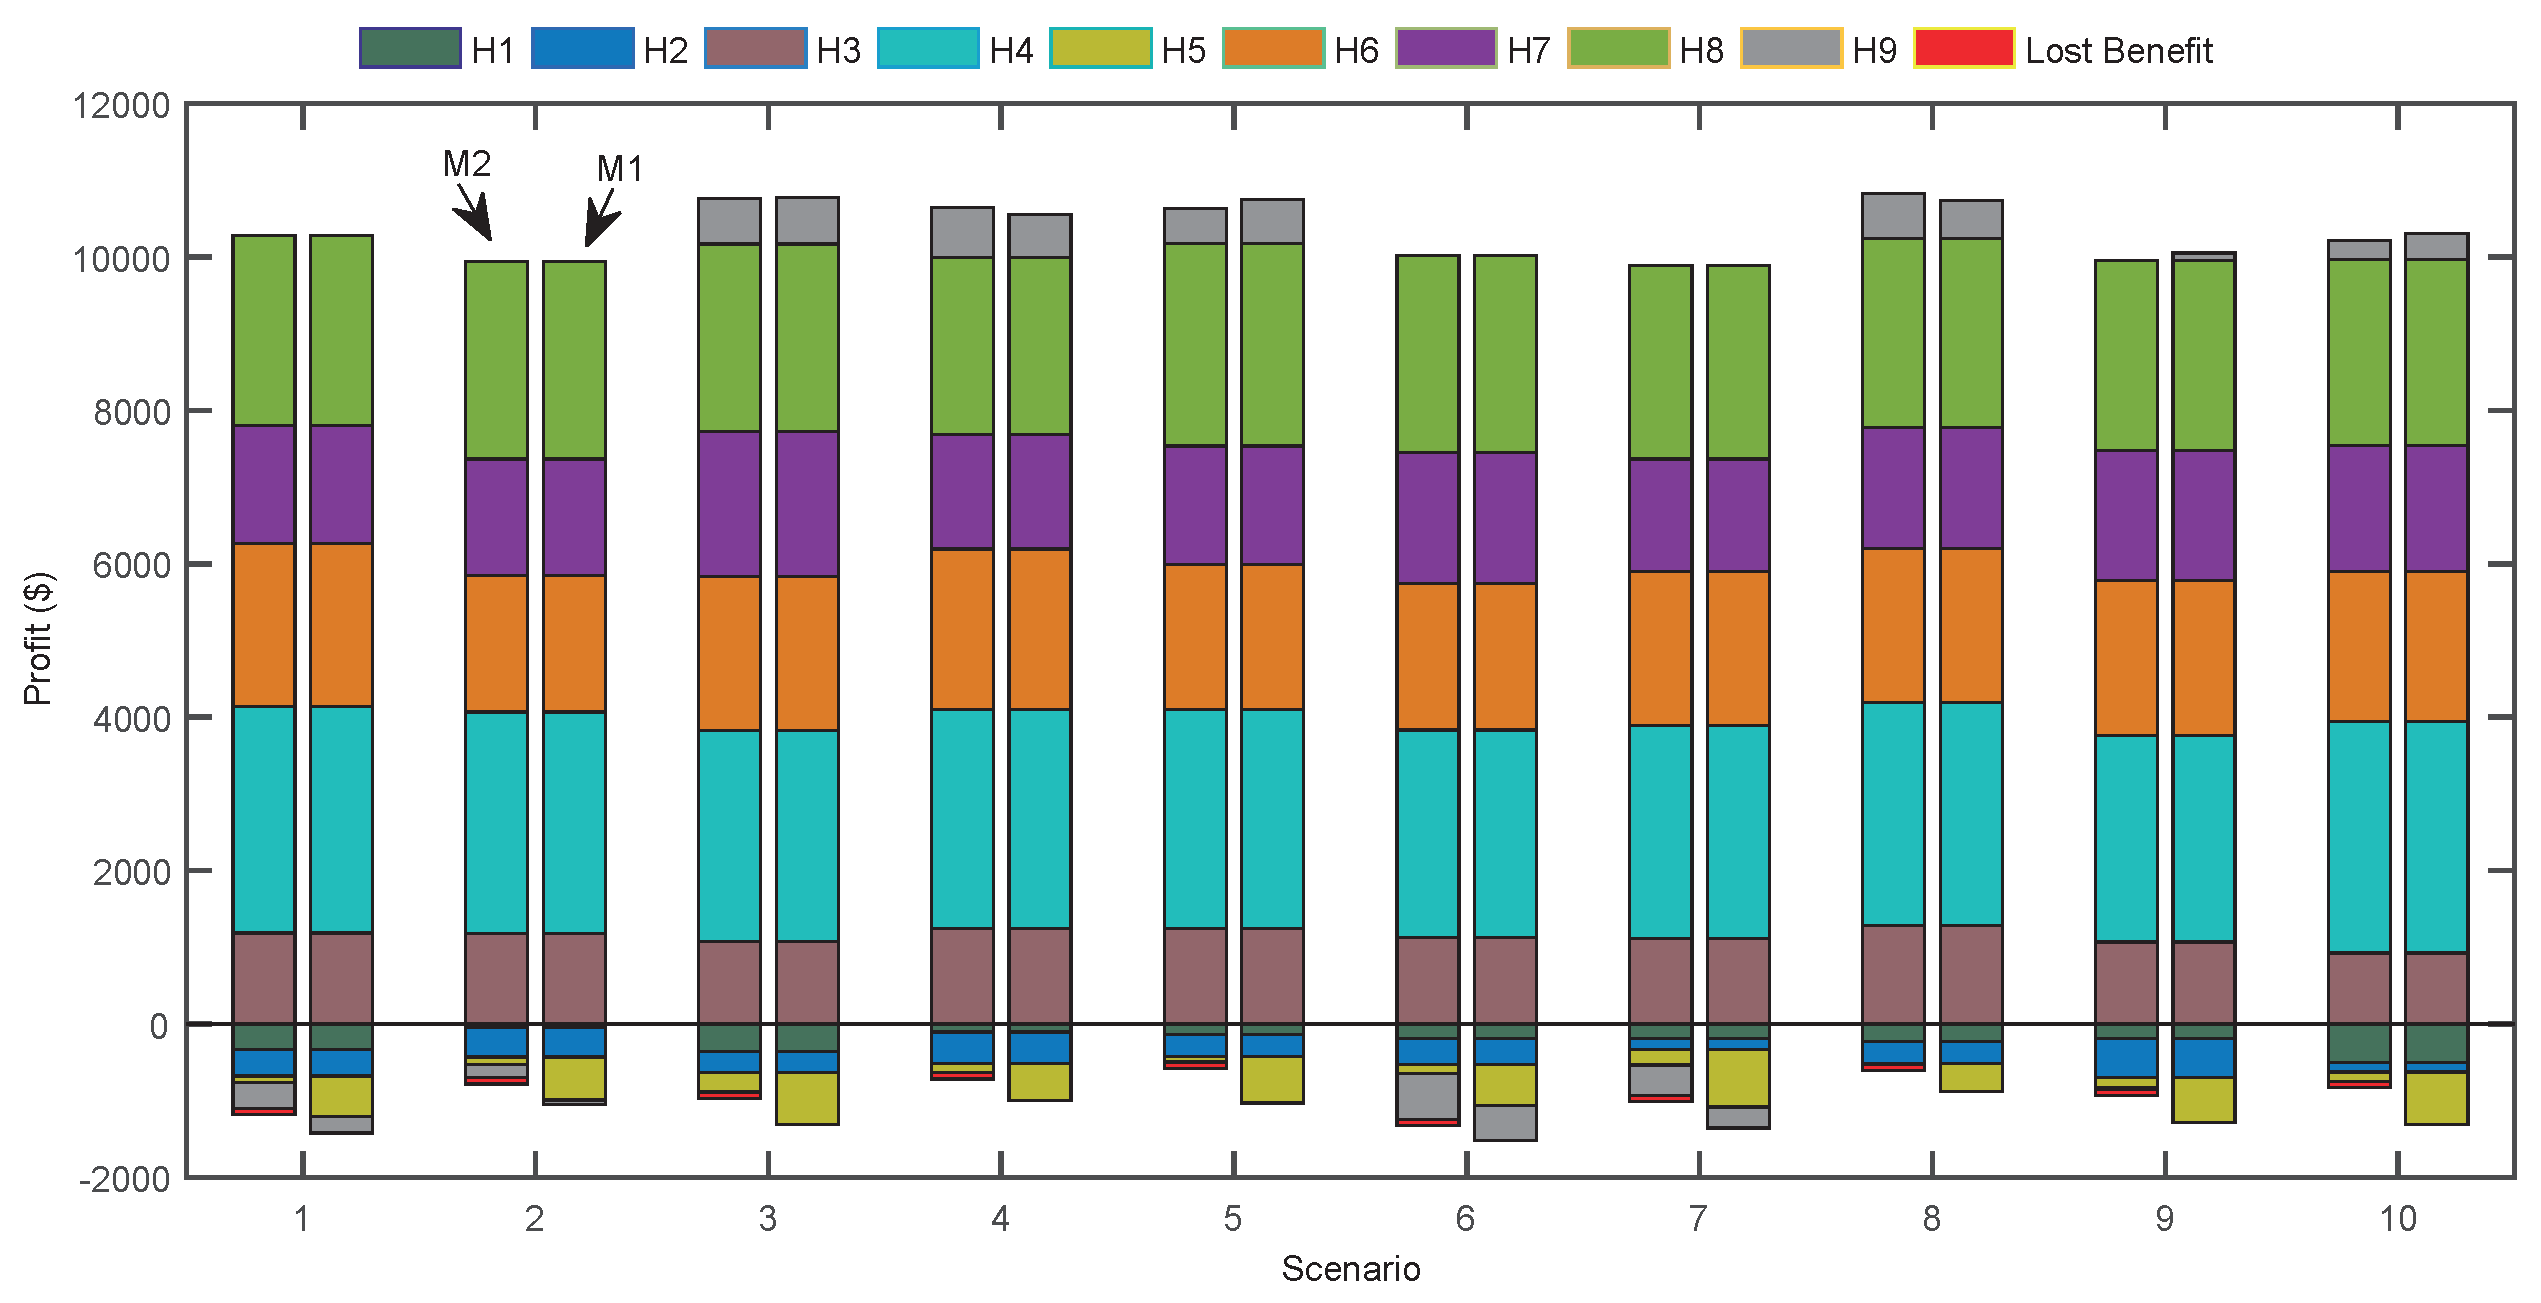
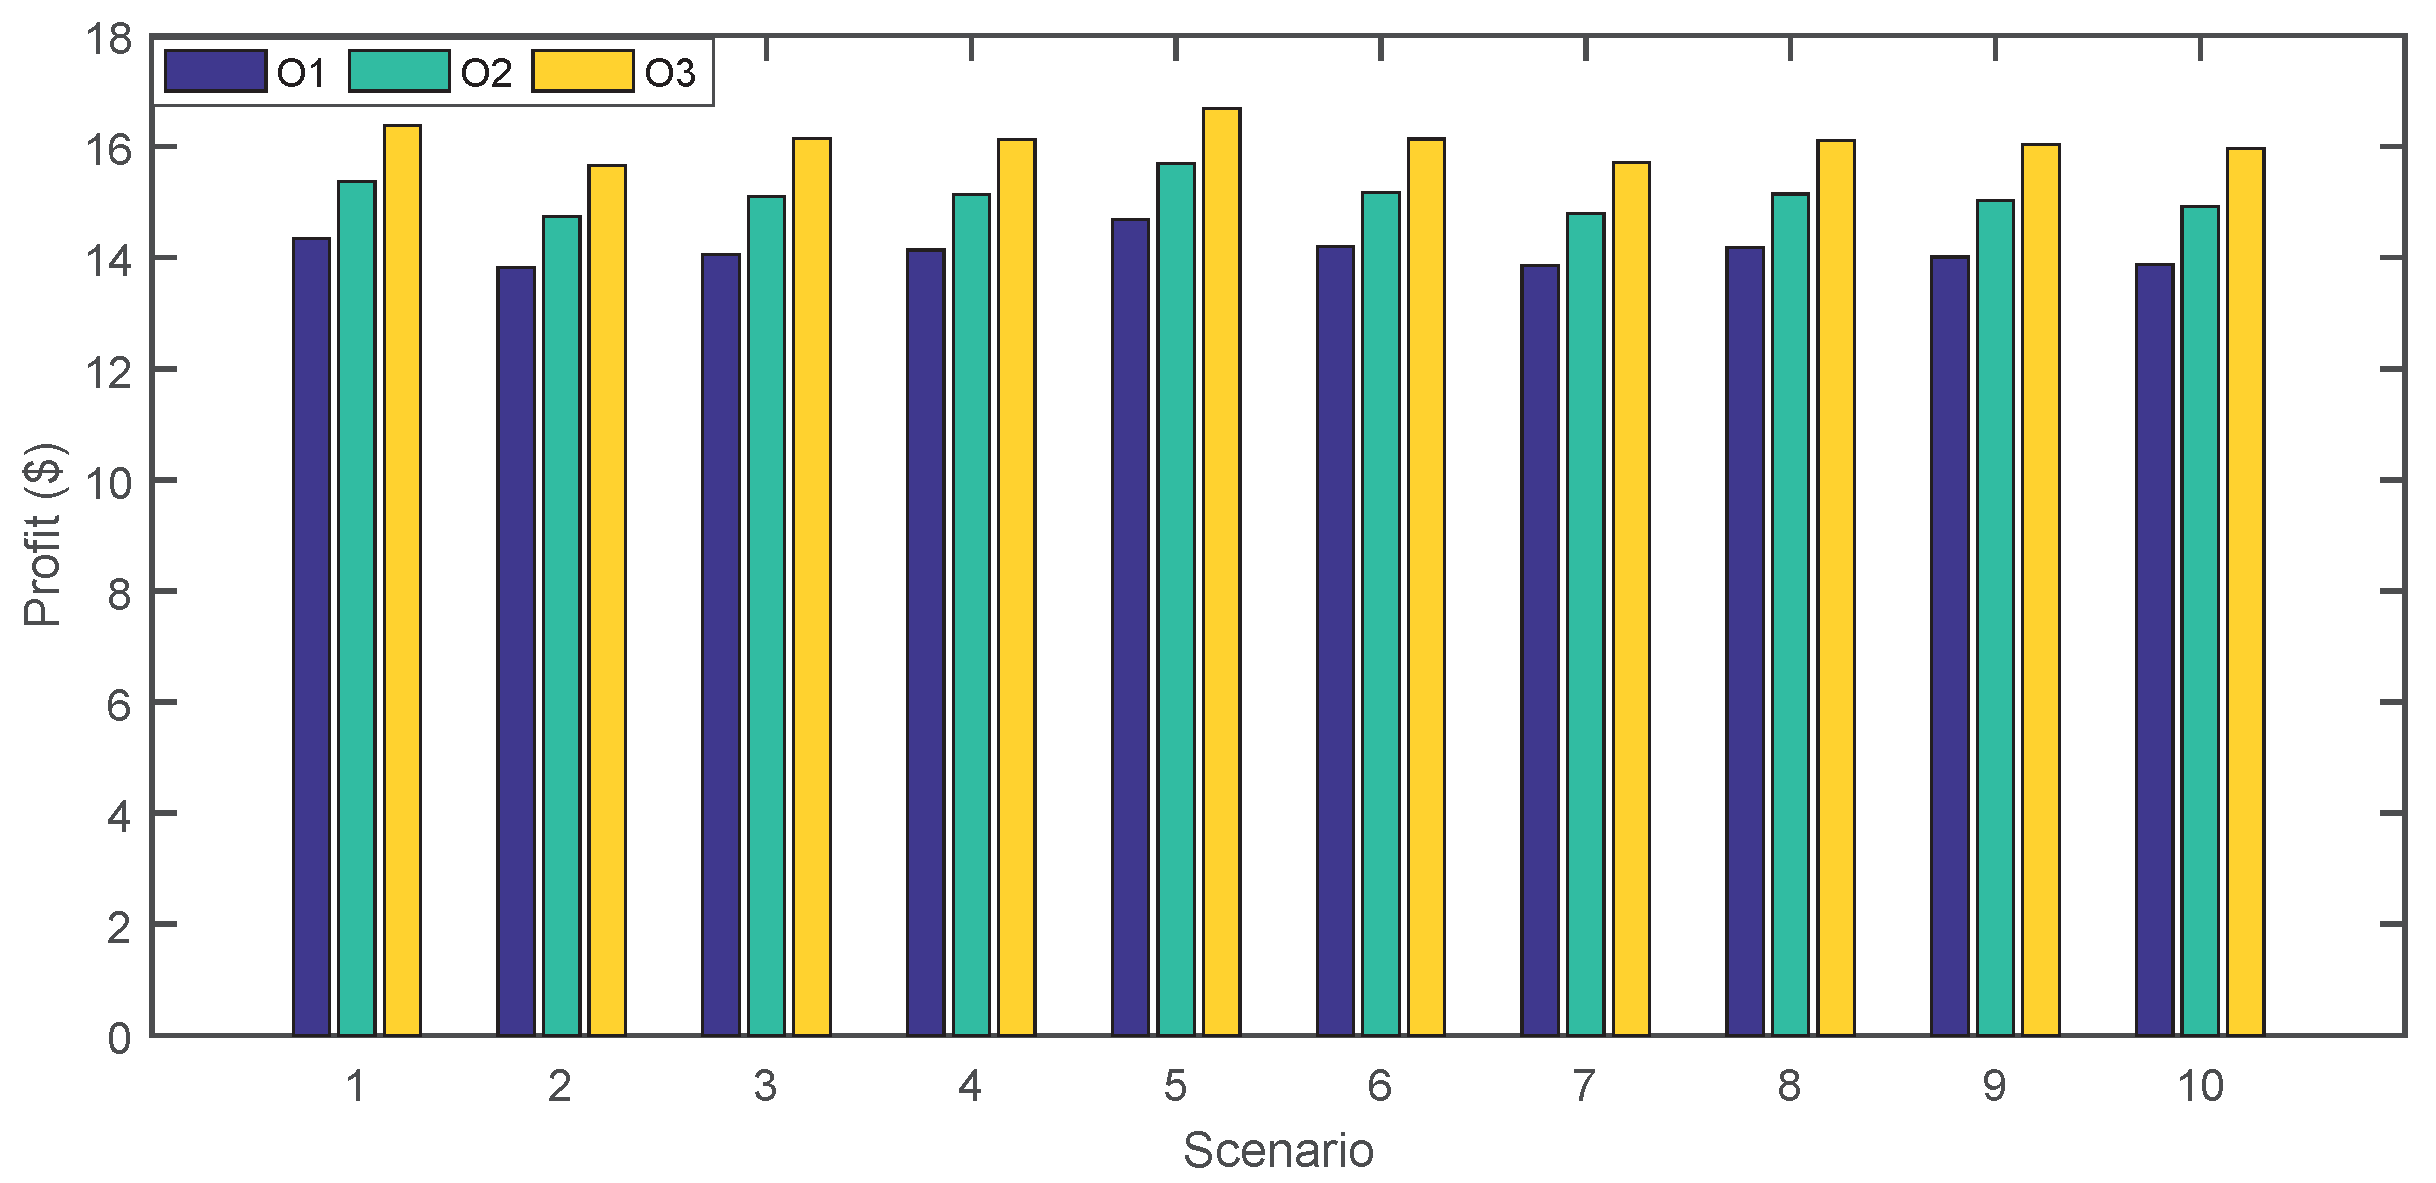
4.2.2. Comparison of Profits of PEV Owners
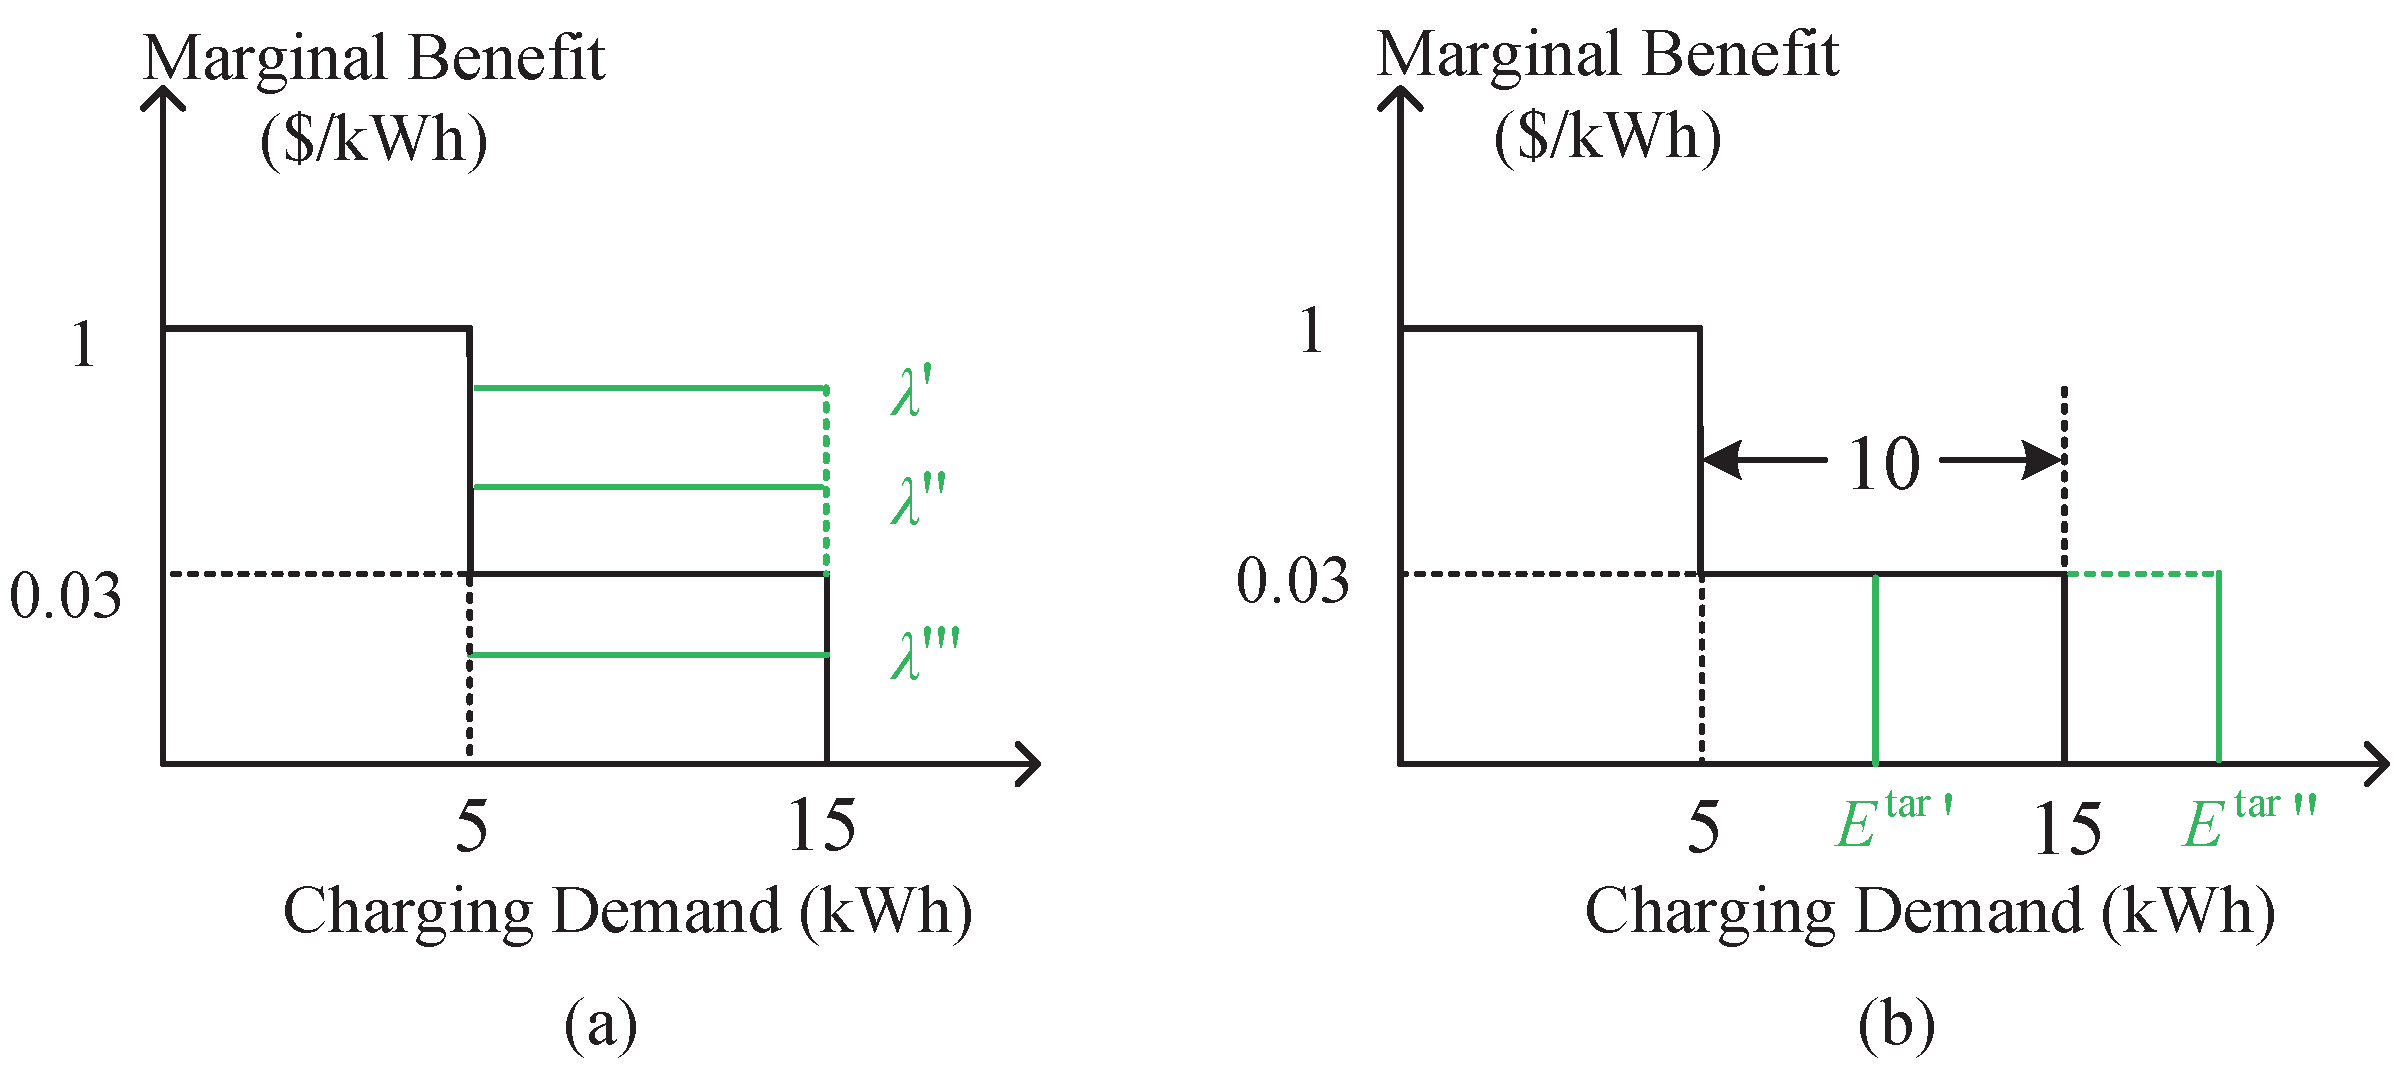
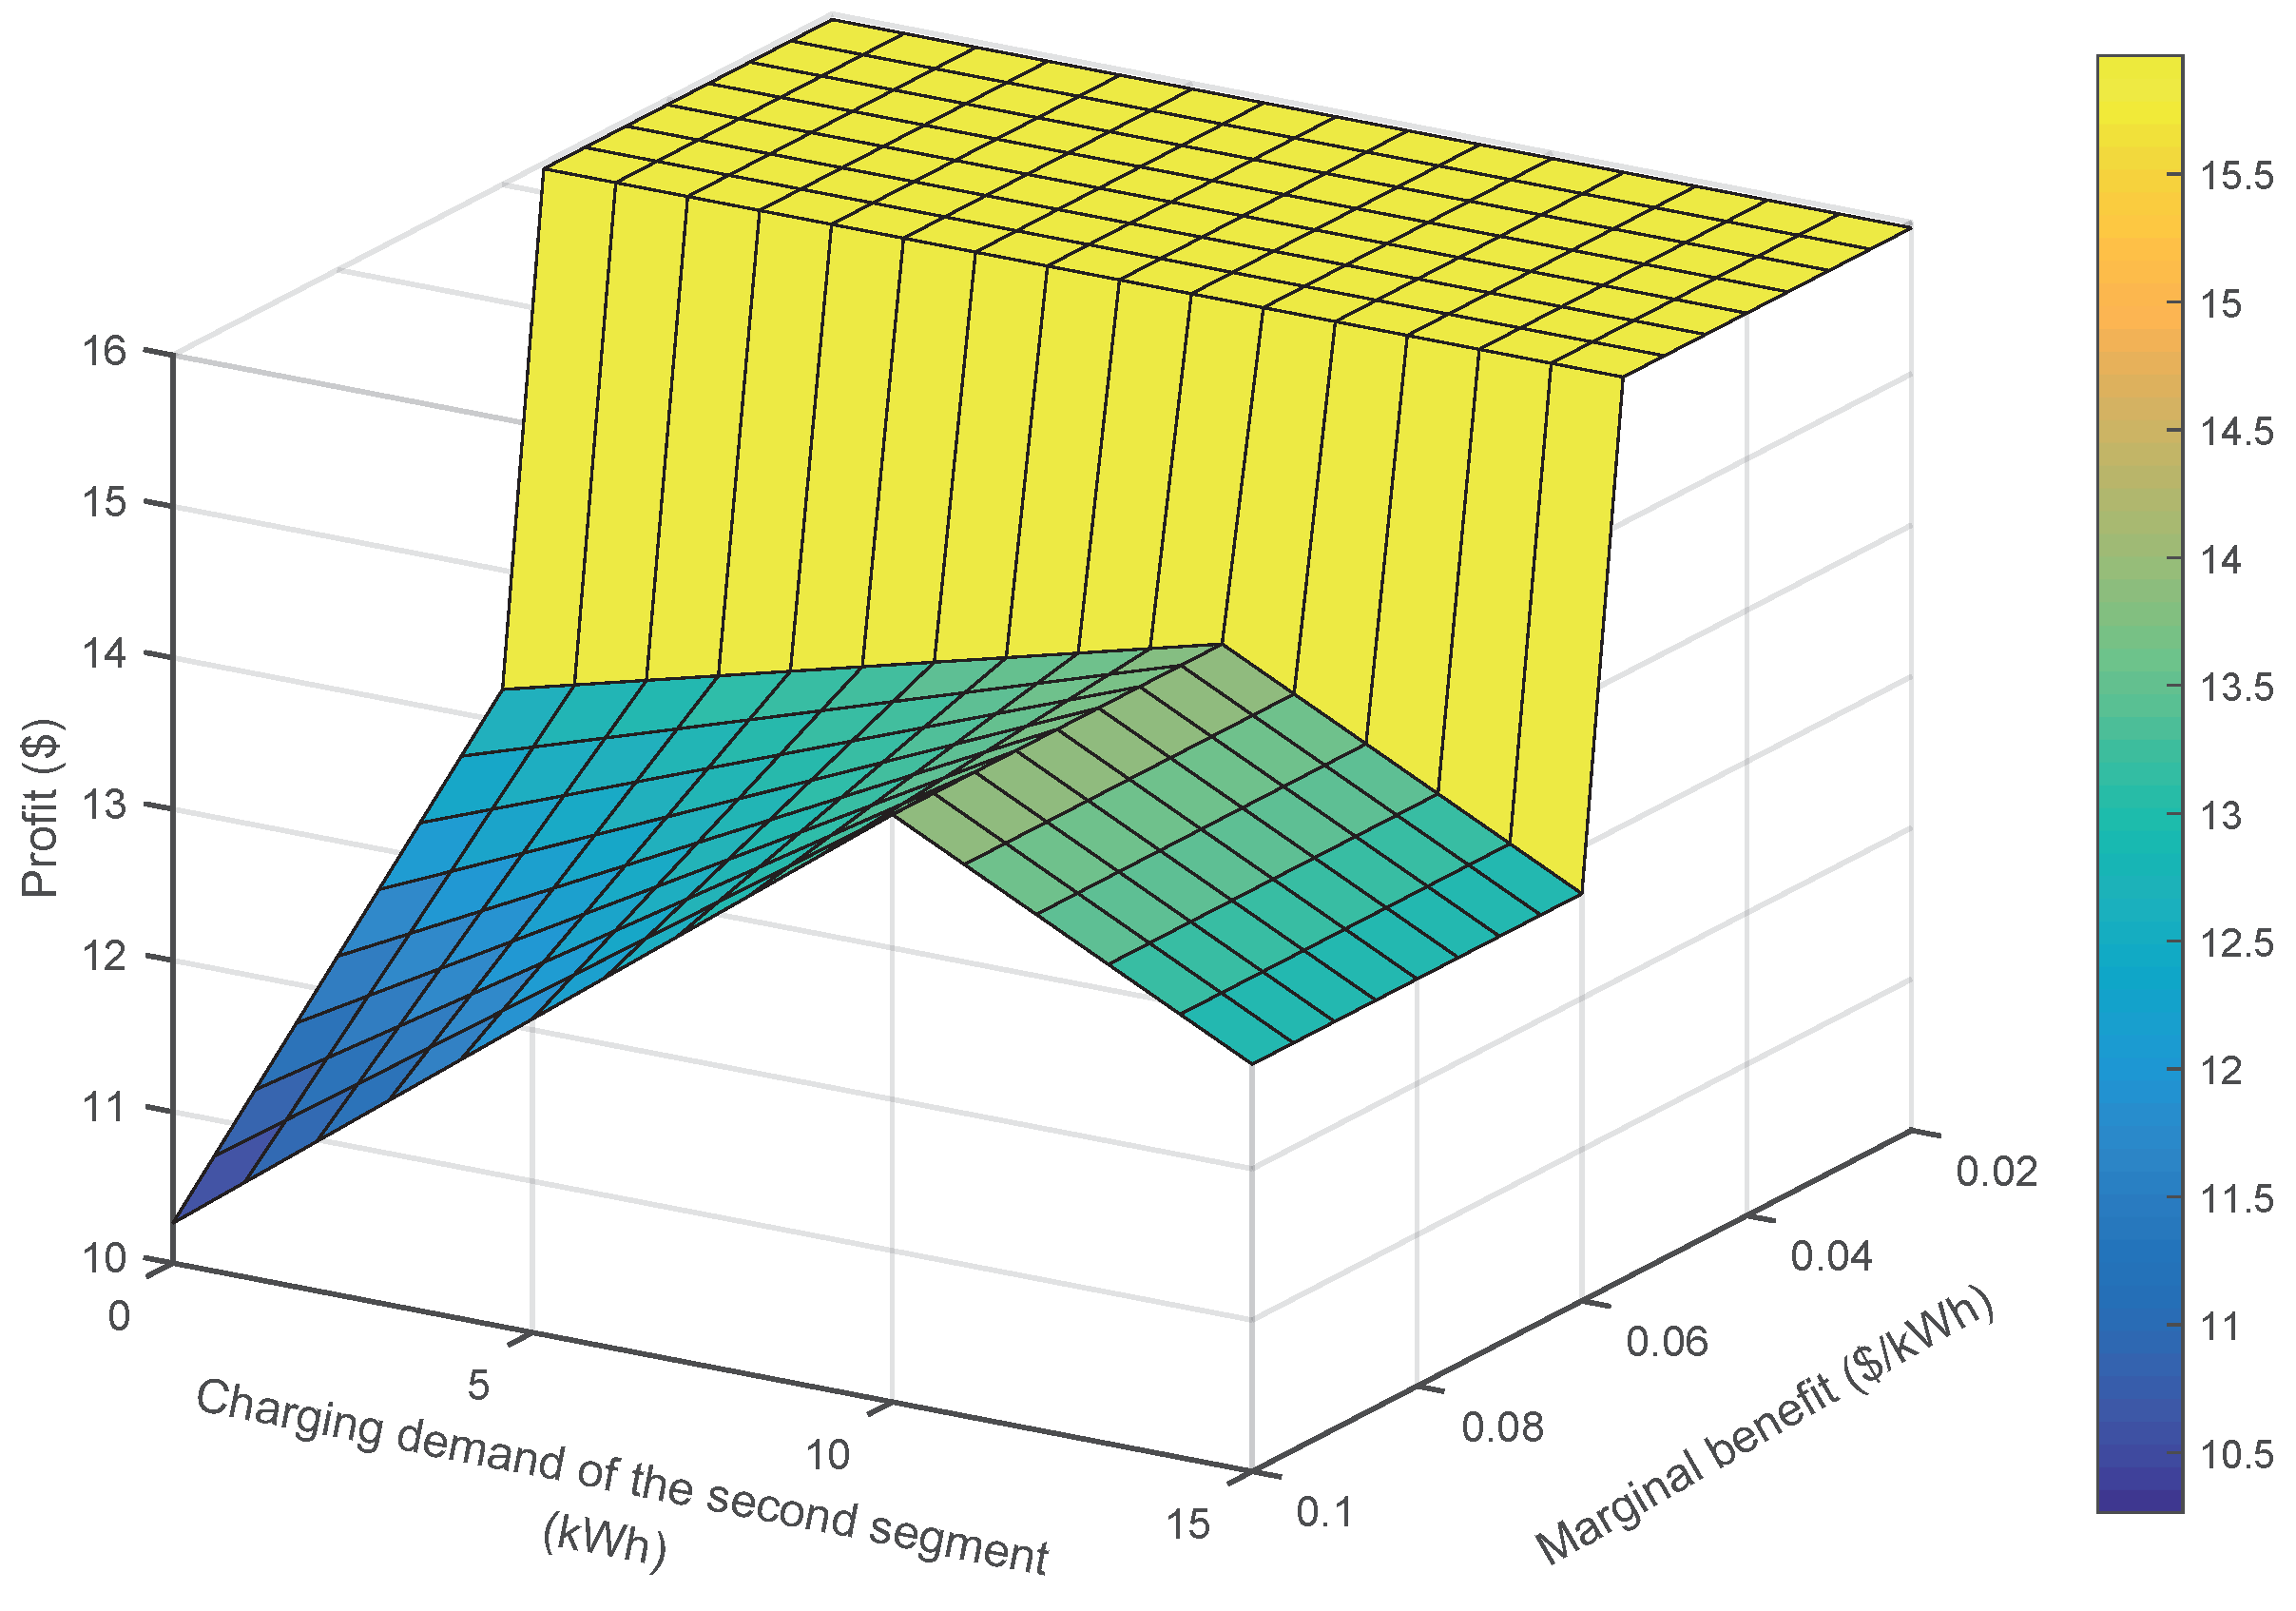
4.3. Impact of Marginal Benefit and Charging Demand
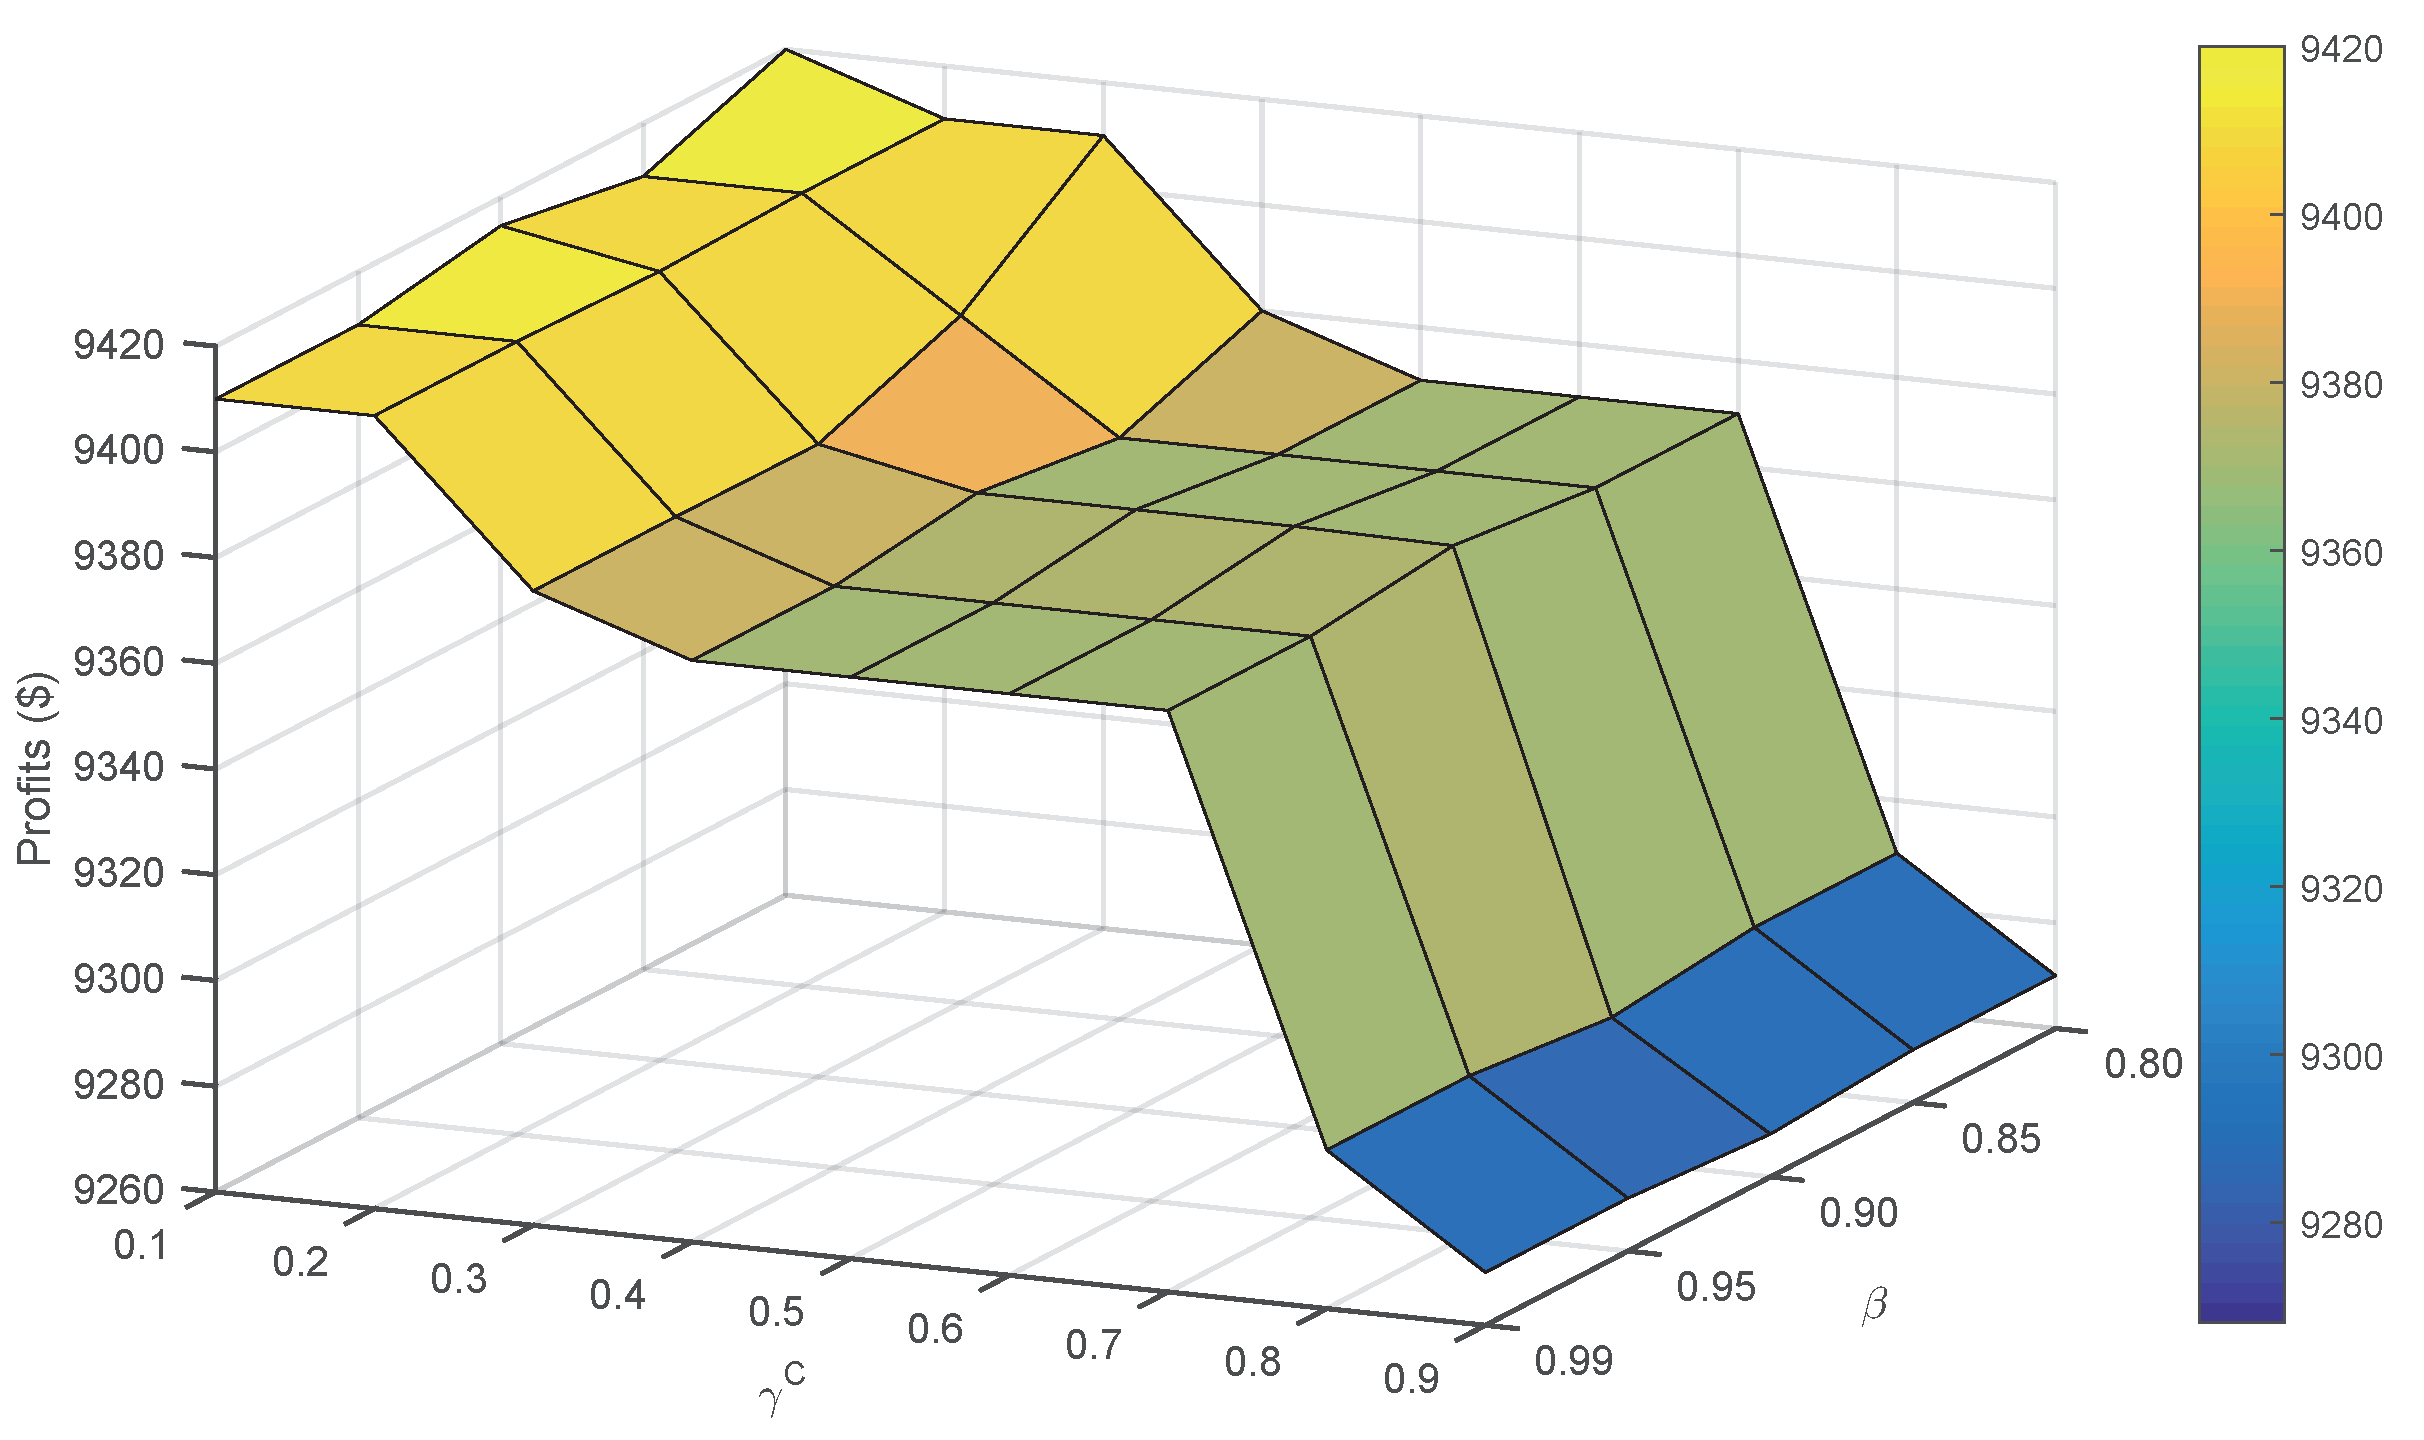
4.4. Impact of Confidence Levels and Weight Factors
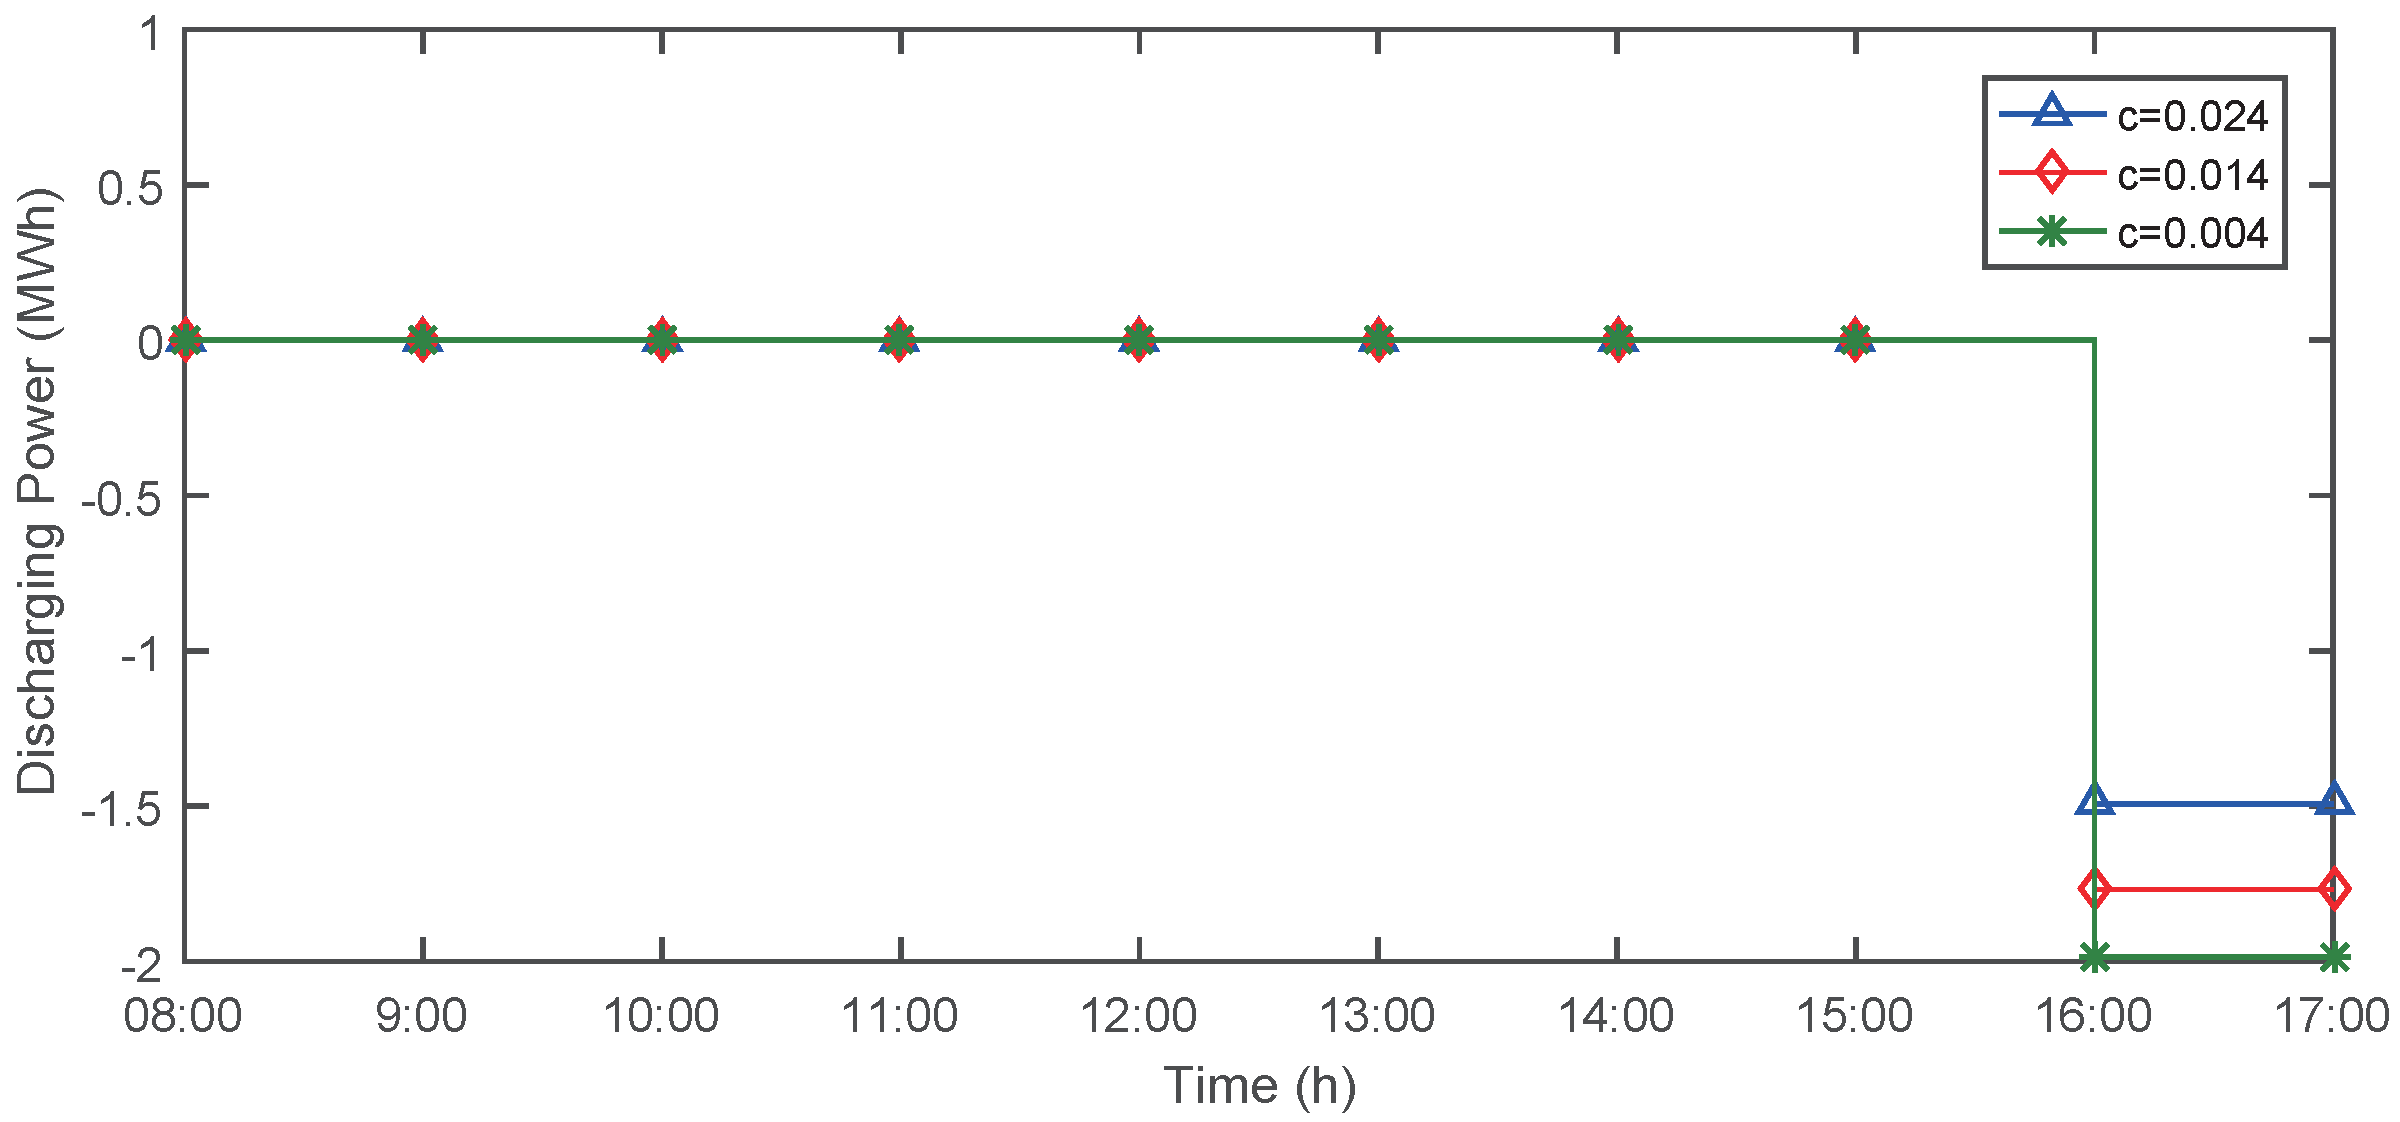
4.5. Impact of Degradation Cost
5. Conclusions
Author Contributions
Funding
Conflicts of Interest
References
- Habib, S.; Kamran, M.; Rashid, U. Impact analysis of vehicle-to-grid technology and charging strategies of electric vehicles on distribution networks—A review. J. Power Sources 2015, 277, 205–214. [Google Scholar] [CrossRef]
- Luo, Z.; Hu, Z.; Song, Y.; Xu, Z.; Lu, H. Optimal coordination of plug-in electric vehicles in power grids with cost-benefit analysis—Part I: Enabling techniques. IEEE Trans. Power Syst. 2013, 28, 3546–3555. [Google Scholar] [CrossRef]
- Luo, Z.; Hu, Z.; Song, Y.; Xu, Z.; Lu, H. Optimal coordination of plug-in electric vehicles in power grids with cost-benefit analysis—Part II: A case study in China. IEEE Trans. Power Syst. 2013, 28, 3556–3565. [Google Scholar] [CrossRef]
- Moon, S.K.; Kim, J.O. Balanced charging strategies for electric vehicles on power systems. Appl. Energy 2017, 189, 44–54. [Google Scholar] [CrossRef]
- Han, S.; Han, S.; Sezaki, K. Development of an optimal vehicle-to-grid aggregator for frequency regulation. IEEE Trans. Smart Grid 2010, 1, 65–72. [Google Scholar]
- Liu, H.; Hu, Z.; Song, Y.; Wang, J.; Xie, X. Vehicle-to-grid control for supplementary frequency regulation considering charging demands. IEEE Trans. Power Syst. 2015, 30, 3110–3119. [Google Scholar] [CrossRef]
- Sarabi, S.; Davigny, A.; Courtecuisse, V.; Riffonneau, Y.; Robyns, B. Potential of vehicle-to-grid ancillary services considering the uncertainties in plug-in electric vehicle availability and service/localization limitations in distribution grids. Appl. Energy 2016, 171, 523–540. [Google Scholar] [CrossRef]
- DeForest, N.; MacDonald, J.S.; Black, D.R. Day ahead optimization of an electric vehicle fleet providing ancillary services in the Los Angeles Air Force Base vehicle-to-grid demonstration. Appl. Energy 2018, 210, 987–1001. [Google Scholar] [CrossRef]
- Perez-Diaz, A.; Gerding, E.; McGroarty, F. Coordination and payment mechanisms for electric vehicle aggregators. Appl. Energy 2018, 212, 185–195. [Google Scholar] [CrossRef]
- Burger, S.P.; Luke, M. Business models for distributed energy resources: A review and empirical analysis. Energy Policy 2017, 109, 230–248. [Google Scholar] [CrossRef]
- Bessa, R.J.; Matos, M.A.; Soares, F.J.; Lopes, J.A.P. Optimized bidding of a EV aggregation agent in the electricity market. IEEE Trans. Smart Grid 2012, 3, 443–452. [Google Scholar] [CrossRef]
- Guille, C.; Gross, G. A conceptual framework for the vehicle-to-grid (V2G) implementation. Energy Policy 2009, 37, 4379–4390. [Google Scholar] [CrossRef]
- Moreira, R.; Ollagnier, L.; Papadaskalopoulos, D.; Strbac, G. Optimal multi-service business models for electric vehicles. In Proceedings of the 2017 IEEE Manchester PowerTech, Manchester, UK, 18–22 June 2017; pp. 1–6. [Google Scholar]
- Alvaro-Hermana, R.; Fraile-Ardanuy, J.; Zufiria, P.J.; Knapen, L.; Janssens, D. Peer to peer energy trading with electric vehicles. IEEE Intell. Transp. Syst. Mag. 2016, 8, 33–44. [Google Scholar] [CrossRef]
- Guo, Y.; Liu, W.; Wen, F.; Salam, A.; Mao, J.; Li, L. Bidding Strategy for Aggregators of Electric Vehicles in Day-Ahead Electricity Markets. Energies 2017, 10, 144. [Google Scholar] [CrossRef]
- Ayón, X.; Moreno, M.Á.; Usaola, J. Aggregators’ Optimal Bidding Strategy in Sequential Day-Ahead and Intraday Electricity Spot Markets. Energies 2017, 10, 450. [Google Scholar] [CrossRef]
- Baringo, L.; Amaro, R.S. A stochastic robust optimization approach for the bidding strategy of an electric vehicle aggregator. Electr. Power Syst. Res. 2017, 146, 362–370. [Google Scholar] [CrossRef]
- Yang, H.; Zhang, S.; Qiu, J.; Qiu, D.; Lai, M.; Dong, Z.Y. CVaR-Constrained Optimal Bidding of Electric Vehicle Aggregators in Day-ahead and Real-time Markets. IEEE Trans. Ind. Inform. 2017, 13, 2555–2565. [Google Scholar] [CrossRef]
- Škugor, B.; Deur, J. A bi-level optimisation framework for electric vehicle fleet charging management. Appl. Energy 2016, 184, 1332–1342. [Google Scholar] [CrossRef]
- Momber, I.; Wogrin, S.; San Román, T.G. Retail pricing: A bilevel program for PEV aggregator decisions using indirect load control. IEEE Trans. Power Syst. 2016, 31, 464–473. [Google Scholar] [CrossRef]
- Frederick, S.; Novemsky, N.; Wang, J.; Dhar, R.; Nowlis, S. Opportunity cost neglect. J. Consum. Res. 2009, 36, 553–561. [Google Scholar] [CrossRef]
- Greenberg, A.E.; Spiller, S.A. Opportunity cost neglect attenuates the effect of choices on preferences. Psychol. Sci. 2016, 27, 103–113. [Google Scholar] [CrossRef]
- Tomić, J.; Kempton, W. Using fleets of electric-drive vehicles for grid support. J. Power Sources 2007, 168, 459–468. [Google Scholar] [CrossRef]
- Sortomme, E.; El-Sharkawi, M.A. Optimal scheduling of vehicle-to-grid energy and ancillary services. IEEE Trans. Smart Grid 2012, 3, 351–359. [Google Scholar] [CrossRef]
- Sarker, M.R.; Dvorkin, Y.; Ortega-Vazquez, M.A. Optimal participation of an electric vehicle aggregator in day-ahead energy and reserve markets. IEEE Trans. Power Syst. 2016, 31, 3506–3515. [Google Scholar] [CrossRef]
- Vagropoulos, S.I.; Bakirtzis, A.G. Optimal Bidding Strategy for Electric Vehicle Aggregators in Electricity Markets. IEEE Trans. Power Syst. 2013, 28, 4031–4041. [Google Scholar] [CrossRef]
- PJM Manual 12: Balancing Operations. Available online: http://www.pjm.com/~/media/documents/manuals/m12.ashx (accessed on 25 August 2016).
- NYISO Manual 14: Accounting and Billing Manual. Available online: http://www.nyiso.com/public/webdocs/marketsoperations/documents/Manuals and Guides/Manuals/Administrative/acctbillmnl.pdf (accessed on 5 December 2014).
- CAISO Business Requirements Specification: Pay for Performance Regulation. Document Version: 1.4. Available online: http://www.caiso.com/Documents/BusinessRequirementsSpecification-Pay-Performance.pdf (accessed on 14 May 2013).
- MISO Market Settlements Calculation Guide, MS-OP-029-r23. Available online: https://www.misoenergy.org/Library/Repository/Tariff%20Documents/BPM%20005%20-%20Market%20Settlements.zip (accessed on 12 November 2016).
- Ko, K.; Han, S.; Dan, K.S. Performance-Based Settlement of Frequency Regulation for Electric Vehicle Aggregators. IEEE Trans. Smart Grid 2016, 9, 866–875. [Google Scholar] [CrossRef]
- Yao, E.; Wong, V.W.; Schober, R. Robust frequency regulation capacity scheduling algorithm for electric vehicles. IEEE Trans. Smart Grid 2017, 8, 984–997. [Google Scholar] [CrossRef]
- Momber, I.; Wogrin, S.; Gómez, T. An MPEC for electricity retail alternatives of plug-in electric vehicle (PEV) aggregators. In Proceedings of the Power Systems Computation Conference (PSCC), Wroclaw, Poland, 18–22 August 2014; pp. 1–7. [Google Scholar]
- PJM Manual 28: Operating Agreement Accounting. Available online: http://www.pjm.com/~/media/documents/manuals/m28.ashx (accessed on 18 November 2016).
- Uryasev, S. Conditional value-at-risk: Optimization algorithms and applications. In Proceedings of the IEEE/IAFE/INFORMS Conference on Computational Intelligence for Financial Engineering, New York, NY, USA, 28 March 2000. [Google Scholar]
- Wang, M. A mixed 0-1 LP for index tracking problem with CVaR risk constraints. Ann. Oper. Res. 2012, 196, 591–609. [Google Scholar] [CrossRef]
- Wang, Y.; Dvorkin, Y.; Fernandez-Blanco, R.; Xu, B.; Qiu, T.; Kirschen, D. Look-Ahead Bidding Strategy for Energy Storage. IEEE Trans. Sustain. Energy 2017, 8, 1106–1117. [Google Scholar] [CrossRef]
- PJM Manual 11: Energy & Ancillary Services Market Operations. Available online: http://www.pjm.com/~/media/documents/manuals/m11.ashx (accessed on 1 February 2017).
- PJM Power Market Data. Available online: http://www.pjm.com (accessed on 1 April 2019).
- Escudero-Garzás, J.J.; García-Armada, A.; Seco-Granados, G. Fair design of plug-in electric vehicles aggregator for V2G regulation. IEEE Trans. Veh. Technol. 2012, 61, 3406–3419. [Google Scholar] [CrossRef]
- Dinger, A.; Martin, R.; Mosquet, X.; Rabl, M.; Rizoulis, D.; Russo, M.; Sticher, G. Batteries for Electric Cars: Challenges, Opportunities, and the Outlook to 2020; Boston Consulting Group: Boston, MA, USA, 2010. [Google Scholar]
- Nguyen, D.T.; Le, L.B. Optimal Bidding Strategy for Microgrids Considering Renewable Energy and Building Thermal Dynamics. IEEE Trans. Smart Grid 2014, 5, 1608–1620. [Google Scholar] [CrossRef]
- Sahin, C.; Shahidehpour, M.; Erkmen, I. Allocation of Hourly Reserve Versus Demand Response for Security-Constrained Scheduling of Stochastic Wind Energy. IEEE Trans. Sustain. Energy 2013, 4, 219–228. [Google Scholar] [CrossRef]
- Wu, L.; Shahidehpour, M.; Li, T. Stochastic Security-Constrained Unit Commitment. IEEE Trans. Power Syst. 2007, 22, 800–811. [Google Scholar] [CrossRef]


| Abbreviations | |
| SOE | State of energy. |
| ENC | Energy not charged, defined as the part of charging demands that are not satisfied. |
| Indices | |
| i | Index of PEVs, running from 1 to N. |
| k | Index of segments of demand curves, running from 1 to K. |
| s | Index of scenarios of uncertain factors, running from 1 to S. |
| t | Index of time intervals, running from 1 to T. |
| Parameters | |
| A | Accuracy performance in the regulation market. |
| Charging demand of segment k of PEV i in scenario s. | |
| Maximum SOE of PEV i. | |
| Minimum SOE of PEV i. | |
| Initial SOE of PEV i in scenario s. | |
| Target SOE of PEV i in scenario s. | |
| Historic mileage ratio (historical mileage per unit capacity) | |
| Daily demand bid limit. | |
| Maximum charging power of PEV i. | |
| Maximum discharging power of PEV i. | |
| Unit degradation cost of PEV i. | |
| Forecast day-ahead (DA) LMP in scenario s at period t. | |
| Forecast real-time (RT) LMP in scenario s at period t. | |
| Forecast price of regulation capacity in scenario s at period t. | |
| Forecast price of regulation mileage in scenario s at period t. | |
| Regulation dispatch ratio of up (/down) capacity in scenario s at period t. | |
| Time-step duration. | |
| / | Charging/Discharging efficiency of PEV i. |
| System marginal benefit in scenario s, defined as the highest marginal benefit among all ENC. | |
| Marginal benefit of segment k of the demand curve of PEV i in scenario s. | |
| Probability of scenario s. | |
| Weight factor for the risk position. | |
| Confidence level for risk calculation. | |
| Variables | |
| Discharging cost in scenario s at period t. | |
| Regulation bids at period t. | |
| Available regulation capacity of PEV i in scenario s at period t. | |
| SOE of PEV i in scenario s at period t. | |
| Energy deviation due to regulation service of PEV i in scenario s at period t. | |
| ENC of charging demands in segment k of PEV i in scenario s. | |
| Down regulation deployment in real time of PEV i in scenario s at period t. | |
| Up regulation deployment in real time of PEV i in scenario s at period t. | |
| DA bid power of the EVA at period t. | |
| RT charging power of PEV i in scenario s at period t. | |
| RT discharging power of PEV i in scenario s at period t. | |
| Energy revenue in the energy market in scenario s at period t. | |
| Regulation revenue in scenario s at period t. | |
| Binary variables (1 if PEV i is charged/discharged at period t in scenario s and 0 otherwise). | |
| Conditional value-at-risk (CVaR) of the expected profits. | |
| V | Value-at-risk of the expected profits. |
| Auxiliary variables to compute . | |
| Net profit in scenario s. |
| Business Models | ENC (kWh) | Lost Benefit ($) | Energy Revenue ($) | Regulation Revenue ($) | Total Profit ($) |
|---|---|---|---|---|---|
| M1 | 0 | 0 | 1970.84 | 7024.31 | 8995.15 |
| M2 | 2021.40 | −81.98 | 2233.53 | 7235.78 | 9387.33 |
| PEV Owner | λk ($/kWh) | ENC (kWh) | Lost Benefit ($) | Energy Revenue ($) | Regulation Revenue ($) | Total Profit ($) |
|---|---|---|---|---|---|---|
| O1 | +∞ | 0 | 0 | 2.91 | 10.97 | 13.88 |
| O2 | 1, 0.03 | 5 | −0.15 | 3.27 | 11.80 | 14.92 |
| O3 | 1, 0.03 | 10 | −0.30 | 3.63 | 12.63 | 15.96 |
© 2019 by the authors. Licensee MDPI, Basel, Switzerland. This article is an open access article distributed under the terms and conditions of the Creative Commons Attribution (CC BY) license (http://creativecommons.org/licenses/by/4.0/).
Share and Cite
Chen, D.; Jing, Z.; Tan, H. Optimal Bidding/Offering Strategy for EV Aggregators under a Novel Business Model. Energies 2019, 12, 1384. https://doi.org/10.3390/en12071384
Chen D, Jing Z, Tan H. Optimal Bidding/Offering Strategy for EV Aggregators under a Novel Business Model. Energies. 2019; 12(7):1384. https://doi.org/10.3390/en12071384
Chicago/Turabian StyleChen, Dapeng, Zhaoxia Jing, and Huijuan Tan. 2019. "Optimal Bidding/Offering Strategy for EV Aggregators under a Novel Business Model" Energies 12, no. 7: 1384. https://doi.org/10.3390/en12071384
APA StyleChen, D., Jing, Z., & Tan, H. (2019). Optimal Bidding/Offering Strategy for EV Aggregators under a Novel Business Model. Energies, 12(7), 1384. https://doi.org/10.3390/en12071384