Article

Short-Term Forecasts of DNI from an Integrated Forecasting System (ECMWF) for Optimized Operational Strategies of a Central Receiver System

by
Francis M. Lopes
1,2,*,
Ricardo Conceição
1,2,
Hugo G. Silva
1,2,
Thomas Fasquelle
1,
Rui Salgado
2,3,
Paulo Canhoto
2,3 and
Manuel Collares-Pereira
1,2,3,4
1
Renewable Energy Chair, University of Évora, IIFA, Palácio do Vimioso, Largo Marquês de Marialva, Apart. 94, 7002-554 Évora, Portugal
2
Institute of Earth Sciences, University of Évora, Rua Romão Ramalho 59, 7000-671 Évora, Portugal
3
Department of Physics, School of Sciences and Technology, University of Évora, Rua Romão Ramalho 59, 7000-671 Évora, Portugal
4
Portuguese Solar Energy Institute, IIFA, Palácio do Vimioso, Largo Marquês de Marialva, Apart. 94, 7002-554 Évora, Portugal
*
Author to whom correspondence should be addressed.
Energies 2019, 12(7), 1368; https://doi.org/10.3390/en12071368
Submission received: 11 March 2019 / Revised: 3 April 2019 / Accepted: 4 April 2019 / Published: 9 April 2019
(This article belongs to the Special Issue Renewable Energy Resource Assessment and Forecasting)

Abstract

:
Short-term forecasts of direct normal irradiance (DNI) from the Integrated Forecasting System (IFS) and the global numerical weather prediction model of the European Centre for Medium-Range Weather Forecasts (ECMWF) were used in the simulation of a solar power tower, through the System Advisor Model (SAM). Recent results demonstrated that DNI forecasts have been enhanced, having the potential to be a suitable tool for plant operators that allows achieving higher energy efficiency in the management of concentrating solar power (CSP) plants, particularly during periods of direct solar radiation intermittency. The main objective of this work was to assert the predictive value of the IFS forecasts, regarding operation outputs from a simulated central receiver system. Considering a 365-day period, the present results showed an hourly correlation of ≈0.78 between the electric energy injected into the grid based on forecasted and measured data, while a higher correlation was found for the daily values (≈0.89). Operational strategies based on the forecasted results were proposed for plant operators regarding the three different weather scenarios. Although there were still deviations due to the cloud and aerosol representation, the IFS forecasts showed a high potential to be used for supporting informed energy dispatch decisions in the operation of central receiver units.

1. Introduction

With the simultaneous increase of solar energy conversion units installed worldwide and computational technology, interest has been growing in using direct normal irradiance (DNI) forecasts in the field of solar power, at a regional or global scale, particularly for an efficient production of energy from concentrating solar power (CSP) plants. A strong reason for such an effort is the fact that CSP systems are able to provide high-quality dispatchable power at affordable prices, when compared to photovoltaic storage capacity, using molten salt as heat storage, a cheap, safe, and easily accessible material [1,2]. For a CSP plant operator, information concerning the day-ahead (up to 48 h) DNI values is required for an efficient energy planning and scheduling [3], allowing higher-penetration of commercial solar power, into the electricity market. In particular, it is during periods of direct solar radiation intermittency that CSP technologies demand accurate forecasts of DNI [4], since these periods are characterized by scattered clouds (which can differ in type and dynamic coverage [5]) and aerosols species [6], which are two primary factors that affect the direct solar resource at the ground level.
To accurately characterize DNI, a combination of the state-of-the-art monitoring and assessment techniques, with advanced numerical weather prediction (NWP) modeling is recommended. NWP models are based on the numerical computation of dynamic flow equations that allow solving the state of the atmosphere and its evolution, up to several days-ahead [7]. However, despite being able to provide satisfactory results [8], current models still demand developments towards DNI forecasting, particularly the parameterization of cloud cover [9] and the use of real-time aerosol information, considering that nowadays an aerosol climatology is still used, despite recent advances [10]. Moreover, an accurate conversion of predicted DNI to predicted energy output values from simulated power plant models is also necessary. In this context, user-friendly software such as the System Advisor Model (SAM) can be used to simulate a CSP plant. This method has been carried out by the authors in a previous work [11], where forecasted data from the IFS was used in the simulation of a linear-focus parabolic trough (PT) system, with a configuration similar to the Andasol 3, a 50 MWe power plant [12] located in Granada (Spain). Although the PT technology has dominated the solar thermal power industry in the last decades, central receiver (CR) units have been emerging, due to the potential that these have for higher efficiency and lower cost. This is possible because apart from having higher concentration ratios (300–800 suns versus only 25–30 in conventional linear concentration), modern CR technology uses molten salt as a heat transfer fluid (HTF) and, directly, as heat storage fluid. Most commercial PT solutions operate with thermal oils as HTF and even when heat storage is also performed with molten salts, the overall operating temperature is much lower (≈400 °C contrasting with 540 °C in the CR systems). In CR systems the higher temperatures place more stringent requirements on energy management and control of power block efficiency, than on lower temperature PT system [13].
Taking into account the aforementioned aspects, the present work uses day-ahead (24-h) forecasts of DNI from the Integrated Forecasting System (IFS), the global NWP model of the European Centre for Medium-Range Weather Forecasts (ECMWF) that possesses the highest scores regarding medium-range global weather forecast [14], together with a set of meteorological variables, in the simulation of a CR power plant. Moreover, an advantage in using the IFS, instead of higher resolution models, is that it allows the implementation of the present analysis and proposed method in any region of the world, with high prospects in the installment of CSP units. In this work, in order to convert DNI values to energy output forecasts of the modeled CSP system, the simulation of a CR power plant similarly configured as the 19.9 MWe Gemasolar thermosolar power plant [15] (located in the province of Sevilla (Spain)), was carried out. The obtained energy outputs based on DNI predictions and local measurements of the simulated CR power plant were assessed and then compared with the results obtained for a PT system [11]. This simulation used the same dataset, i.e., input variables (DNI and meteorological data), as for the PT simulation, being related to the same period and location in Southern Portugal, in which it showed substantial improvements towards the prediction of DNI, due to the new operational radiative scheme of the IFS.
The proposed work has been structured as follows. In Section 2, a description is provided regarding the measured and forecasted data, the CSP plant model, and the adopted methodology; results and respective discussions are given in Section 3; operational strategies for the three different weather scenarios are given in Section 4; and in Section 5, conclusions and future work perspectives are summarized.

2. Data and Methodology

2.1. Measurements

Measurements of DNI were used from a ground-based station located in Évora city (38.567686°N, 7.911722°W), from the Institute of Earth Sciences (ICT—Instituto de Ciências da Terra) in Southern Portugal, a semi-arid region [16] with a high frequency of clear sky day occurrences and annual energy maximums around 2100 kWh/m2 [17].
Pyrheliometers (model CHP1) from Kipp and Zonen instruments were used, being calibrated every 2 years. With an estimated daily uncertainty of <1%, these instruments follow the international organization for standardization, the 9059:1990 standard [18], as first-class instruments. To compare with NWP values, hourly mean values were obtained by averaging the sixty 1-min records. The Évora station (denominated EVO station) had a strict and regular code for the maintenance of the instruments, being subjected to quality control tests, prior to the analysis. The DNI at the EVO station showed only 0.003% of missing data for the considered year of continuous measurements. This showed how well-maintained the EVO station is, and why it was used in this work as a reference station. This station allowed us to provide high-quality data, showing only very small gaps that could have resulted from sudden power shut downs. To fill gaps, adopted filters for the location of study were used, including standard data quality filters, the Baseline Surface Radiation Network (BSRN) for Global Network quality check tests V2.0 [19] and gap-filling procedures. The latter, consisted in the use of hourly values from the nearest ground-based measuring station located at Mitra, MIT (38.530522°N, 8.011221°W), installed approximately 9.6 km from EVO, to fill gaps that have more than two hours of missing records. For the gaps with less than two hours of missing records, a linear interpolation between the previous and the next hours was then used to fill the missing periods.
Similarly, as performed in [11], continuous measurements of local atmospheric variables, such as air temperature, relative humidity, wind speed, and atmospheric pressure at ground level, were also acquired by nearby standard meteorological measuring equipment. Since atmospheric pressure was not measured at the EVO station and the local wind was disturbed by existing neighboring buildings, not being representative of the measuring location, hourly data from a nearby station (≈4 km apart)—maintained by the Portuguese Meteorology Service (IPMA—Instituto Português do Mar e da Atmosfera)—was used for the considered period of study.

2.2. Forecasts

The IFS is the atmospheric model and data assimilation system from the ECMWF (which is currently operational) that was used to perform global medium-range weather forecasts. The model is able to provide deterministic predictions of a large set of meteorology-related variables, including DNI. The radiative variables, in both short and longwave spectral bands, were computed using the Rapid Radiative Transfer Model [20]. Operational high-resolution (HRES) deterministic forecasts were set to have an issue time to start at 00:00 or 12:00 UTC (the latter option is used in this work). The current IFS cycle uses a triangular-cubic-octahedral global grid, with a horizontal resolution of 0.125° × 0.125° (≈9 km), 137 terrain-following vertical levels from the surface up to 1 Pa (≈80 km height), and a 7.5-min time step. The radiation scheme is updated every hour, on a grid with 10.24 times fewer columns than the rest of the model [21]. Contrary to the previous versions of the IFS, in which the DNI was not a direct output of the model, the current version was able to directly calculate hourly accumulated direct irradiation values (J/m2), which were then converted to mean power values (W/m2), in order to enable a straight comparison with measurements. The output of the IFS used here as representative of DNI is the dsrp parameter, i.e., the direct solar radiation, incident on a plane perpendicular to the Sun’s beams.
To perform accurate forecasts of DNI, NWP models have to take into account several parameters that can affect such forecasts, for instance the local weather (e.g., air temperature, relative humidity, wind speed and direction, and surface pressure). Along with weather conditions, the forecast horizon can also affect the prediction of DNI, since it has an associated uncertainty that tends to be smaller with the use of shorter time horizons. However, these are closely linked to a high computational cost [22]. Forecast horizons can range from: (i) the intra-hour scale, where persistence models [23] and all-sky imagers [24] are used; to (ii) the intra-day scale, where artificial neural networks [25], and satellite-based and NWP models [26] are used; and (iii) up to several days (i.e., day or week-ahead forecasts) in which NWP models are able to perform [27]. Apart from the weather conditions and forecast horizons, initial conditions implemented in NWP models also play an important role [28]. These include the atmosphere, oceans, and ground surfaces physics, which are composed by a series of complex dynamical processes that comprise the spatial distribution of a large number of atmospheric parameters. Moreover, aside from these aspects that can hinder the prediction of DNI, particular attention has been given towards cloud microphysics and aerosol representation. The former is closely related to the complex parameterization of cloud cover and type [9], mainly during overcast periods, while the latter is usually based on monthly mean aerosol climatologies, which increases the errors of predicted DNI, especially during clear sky conditions. In particular, it is during very clean atmosphere periods that the implemented aerosol climatology affects the prediction of DNI more. This has been previously observed with day-ahead forecasts of DNI from the IFS [11,29], where the radiative effects of clouds and aerosols were, respectively, under- or over-estimated by the model, compared to local measurements. For instance, at the EVO station it was found that the predicted mean annual DNI had an overestimation of ≈7%, compared to local measurements [29], being essentially related to an underestimation of the cloud cover.
To improve DNI forecasts, the radiative schemes of NWP models have been constantly upgraded to new versions. One example is the current ecRad scheme that was recently implemented in the IFS [10], becoming operational in July 2017 (cycle 43R3). A detailed description of the ecRad and its use in the IFS can be found in [21]. Presently, the ecRad is composed of the following IFS atmospheric variables—pressure, temperature, cloud fraction, and the mixing ratios of water vapor, liquid water, ice, and snow. The cloud effective radius was computed diagnostically, using the parameterization stated in [30], for liquid clouds, and that stated in [31], for ice clouds. The optical properties for ice were computed using the scheme stated in [32] and that for liquid water were expressed in terms of a Padé approximation [33]. The mixing ratios for ozone, carbon dioxide, and an arbitrary number of aerosol species were computed from a climatology obtained from the Copernicus Atmospheric Monitoring Service (CAMS), being more realistic than the previous versions, in which the Tegen aerosol climatology [34] was implemented. The optical properties of aerosols were added to those of gases, with the assumption that aerosols were horizontally well-mixed, within each model grid box. Aerosol optical properties were computed off-line, using an assumed size distribution and the Mie theory, for 14 shortwave and 16 longwave bands. Moreover, in addition to an improved code that allowed us to reduce computational costs, ecRad was able to reduce numerical noise in cloudy periods, which enabled better DNI predictions than the previous radiative scheme [21]. A recent analysis [11] has shown that improvements of day-ahead forecasts of DNI from the ecRad were attained, in comparison to the previous version (McRad, cycle 41R2). Hourly and daily correlations of 0.87 and 0.91 between predicted and measured data in EVO were found for the same dataset used in the present work. Although the IFS still overestimated measurements, a relative difference of ≈1.2% was found regarding the annual mean values of DNI in EVO, which was much lower than the previous value obtained with the McRad (≈10.6%).
In this work, day-ahead forecasts produced by the ecRad were used to estimate the energy output from a CR power plant simulated through the SAM. Results were assessed by comparison with those obtained using the local measurements.

2.3. CSP Plant Model

The SAM software [35], version 2017.9.5, developed by the U.S. Department of Energy and National Renewable Energy Laboratory (NREL), was used here to assess the usefulness of DNI forecasts from the IFS, for the energy management of a CR power plant. Regarding the simulation of CSP systems, the SAM uses the transient system simulation (TRNSYS), comprising three components—(i) an interface where the setup of each simulation is performed in detail by the user; (ii) a calculation engine that implements discretization procedures in each simulation, and (iii) a programming interface. The power plant model calculates hourly performance values corresponding to a wide range of output parameters, providing an annual performance and financial metrics summary at the end of each run. DNI and other atmospheric variables (air temperature, relative humidity, wind speed, and surface pressure) were the necessary input parameters for the power plant model to generate local hourly performance data. The resulting hourly outputs represent a full year of annual electricity production of the considered CR power plant.
To simulate a CR power plant, it is important to know all the design and control parameters that are characteristic of such a system. A CR system, also known as a solar power tower, uses sun-tracking mirrors (heliostats) to focus the Sun’s direct beam onto a receiver installed at the top of the tower. Within the receiver, a HTF was then heated, reaching temperatures up to 565 °C, allowing the generation of water steam, through a heat exchanger. The latter was then used by conventional turbine-generators, to produce electricity (Rankine cycle). Due to the higher temperatures of use and superior heat transfer and energy storage capabilities than other CSP systems, such as PT systems, current CR plants used molten salt, such as HTF. One example of this kind of power system is the 19.9 MWe Gemasolar thermosolar plant located in the Sevilla province (Spain), which has been operational since April 2011. This type of CR power plant possesses a 15-h storage capacity and is surrounded by 2650 heliostats (Figure 1), within an area less than 200 hectares. The Gemasolar was intended to produce 110,000 MWeh/year [15], however, probably due to technical issues created by the new challenges that were addressed during the operation of the power plant, an annual generation of 80,000 MWeh/year was reached [36]. In this work, in order to study the behavior of a CR solar power plant, a simulation with a similar configuration, such as the Gemasolar, was carried out. The criterion for selecting this power plant resulted from the fact that Gemasolar is considered to be a typical CR system, with the advantage of having considerable information available regarding the power plant operation input parameters, thus allowing to establish a case study for the CR power plants. Under Évora’s conditions, this study used the same weather dataset as the SAM input parameters from the EVO station that were previously used for the simulation of a 50 MWe PT system [11], with configurations similar to the Andasol 3 located in Granada (Spain). Due to privacy reasons, full access to the complete configuration of the Gemasolar was not possible. Consequently, several design and control input parameters needed for the simulation were not provided by NREL, creating a limitation to the present analysis. However, in order to obtain the best performance results that corresponded close to the actual performance outputs of the Gemasolar power plant, some input parameters were needed for the simulation result from research-based assumptions made by the authors, regarding the operation of the CR systems. For more detailed information concerning the configuration input parameters used in the SAM simulation, see Appendix A.

3. Results and Discussion

In this analysis, electrical and thermal output parameters generated by the SAM simulations using forecasted and measured hourly values of DNI and meteorological variables. The outputs were selected according to their importance for the power generation and management of a CR power plant since the plant operator should analyze these parameters on a daily basis. In that sense, the total electric energy to the grid, EP (MWeh), and the stored thermal energy, TES (MWth), charge and discharge energies were analyzed for a 365 day-period (from 1st July 2017 to 30th June 2018) with the study location centered at the EVO station.
In Table 1, a statistical summary for the EP and the respective TES charge and discharge energies, based on forecasts and measurements of DNI and meteorological variables, is shown. As expected, due to the IFS underestimation of cloud cover [29], the obtained results using the simulated hourly values showed a general overestimation of the IFS forecasts towards measurements. A total of ≈115,992 MWeh/year and ≈121,668 MWeh/year was obtained, respectively, for the EP based in DNI measurements and forecasts, with a correlation coefficient (r) of ≈0.78, between both outputs. The representation of clouds performed by the IFS, significantly influenced the forecasted DNI values at the Earth’s surface and, consequently, the respective EP output from the CR power plant. Taking into account the parasitic power consumption during non-production hours and a constant derating (i.e., a decrease of the power plant output due to unusual environmental conditions, for instance, higher ambient temperature than design set point, or excess power within the electrical grid) value of 4%, for the simulated plant, the SAM results showed an annual energy generation of ≈111,353 MWeh/year and ≈116,801 MWeh/year, regarding measurements and predictions, respectively, i.e., a relative difference of ≈4.9%. Despite the fact that the objective of the present work was not a direct comparison with the Gemasolar’s actual production values, the obtained annual values through the SAM simulations could differ from the values that would be obtained if an actual Gemasolar was operating in Évora, due to several reasons: (i) DNI and meteorological data from Évora was being used for a different period, comprising different inter-annual variations; (ii) lack of data regarding design and control parameters for the simulation of Gemasolar; (iii) start-up time (0.5 h) and stop operations of the simulated plant together with the internal temporal discretization, considered by the SAM; and (iv) daily operational strategies adopted for the plant power management.
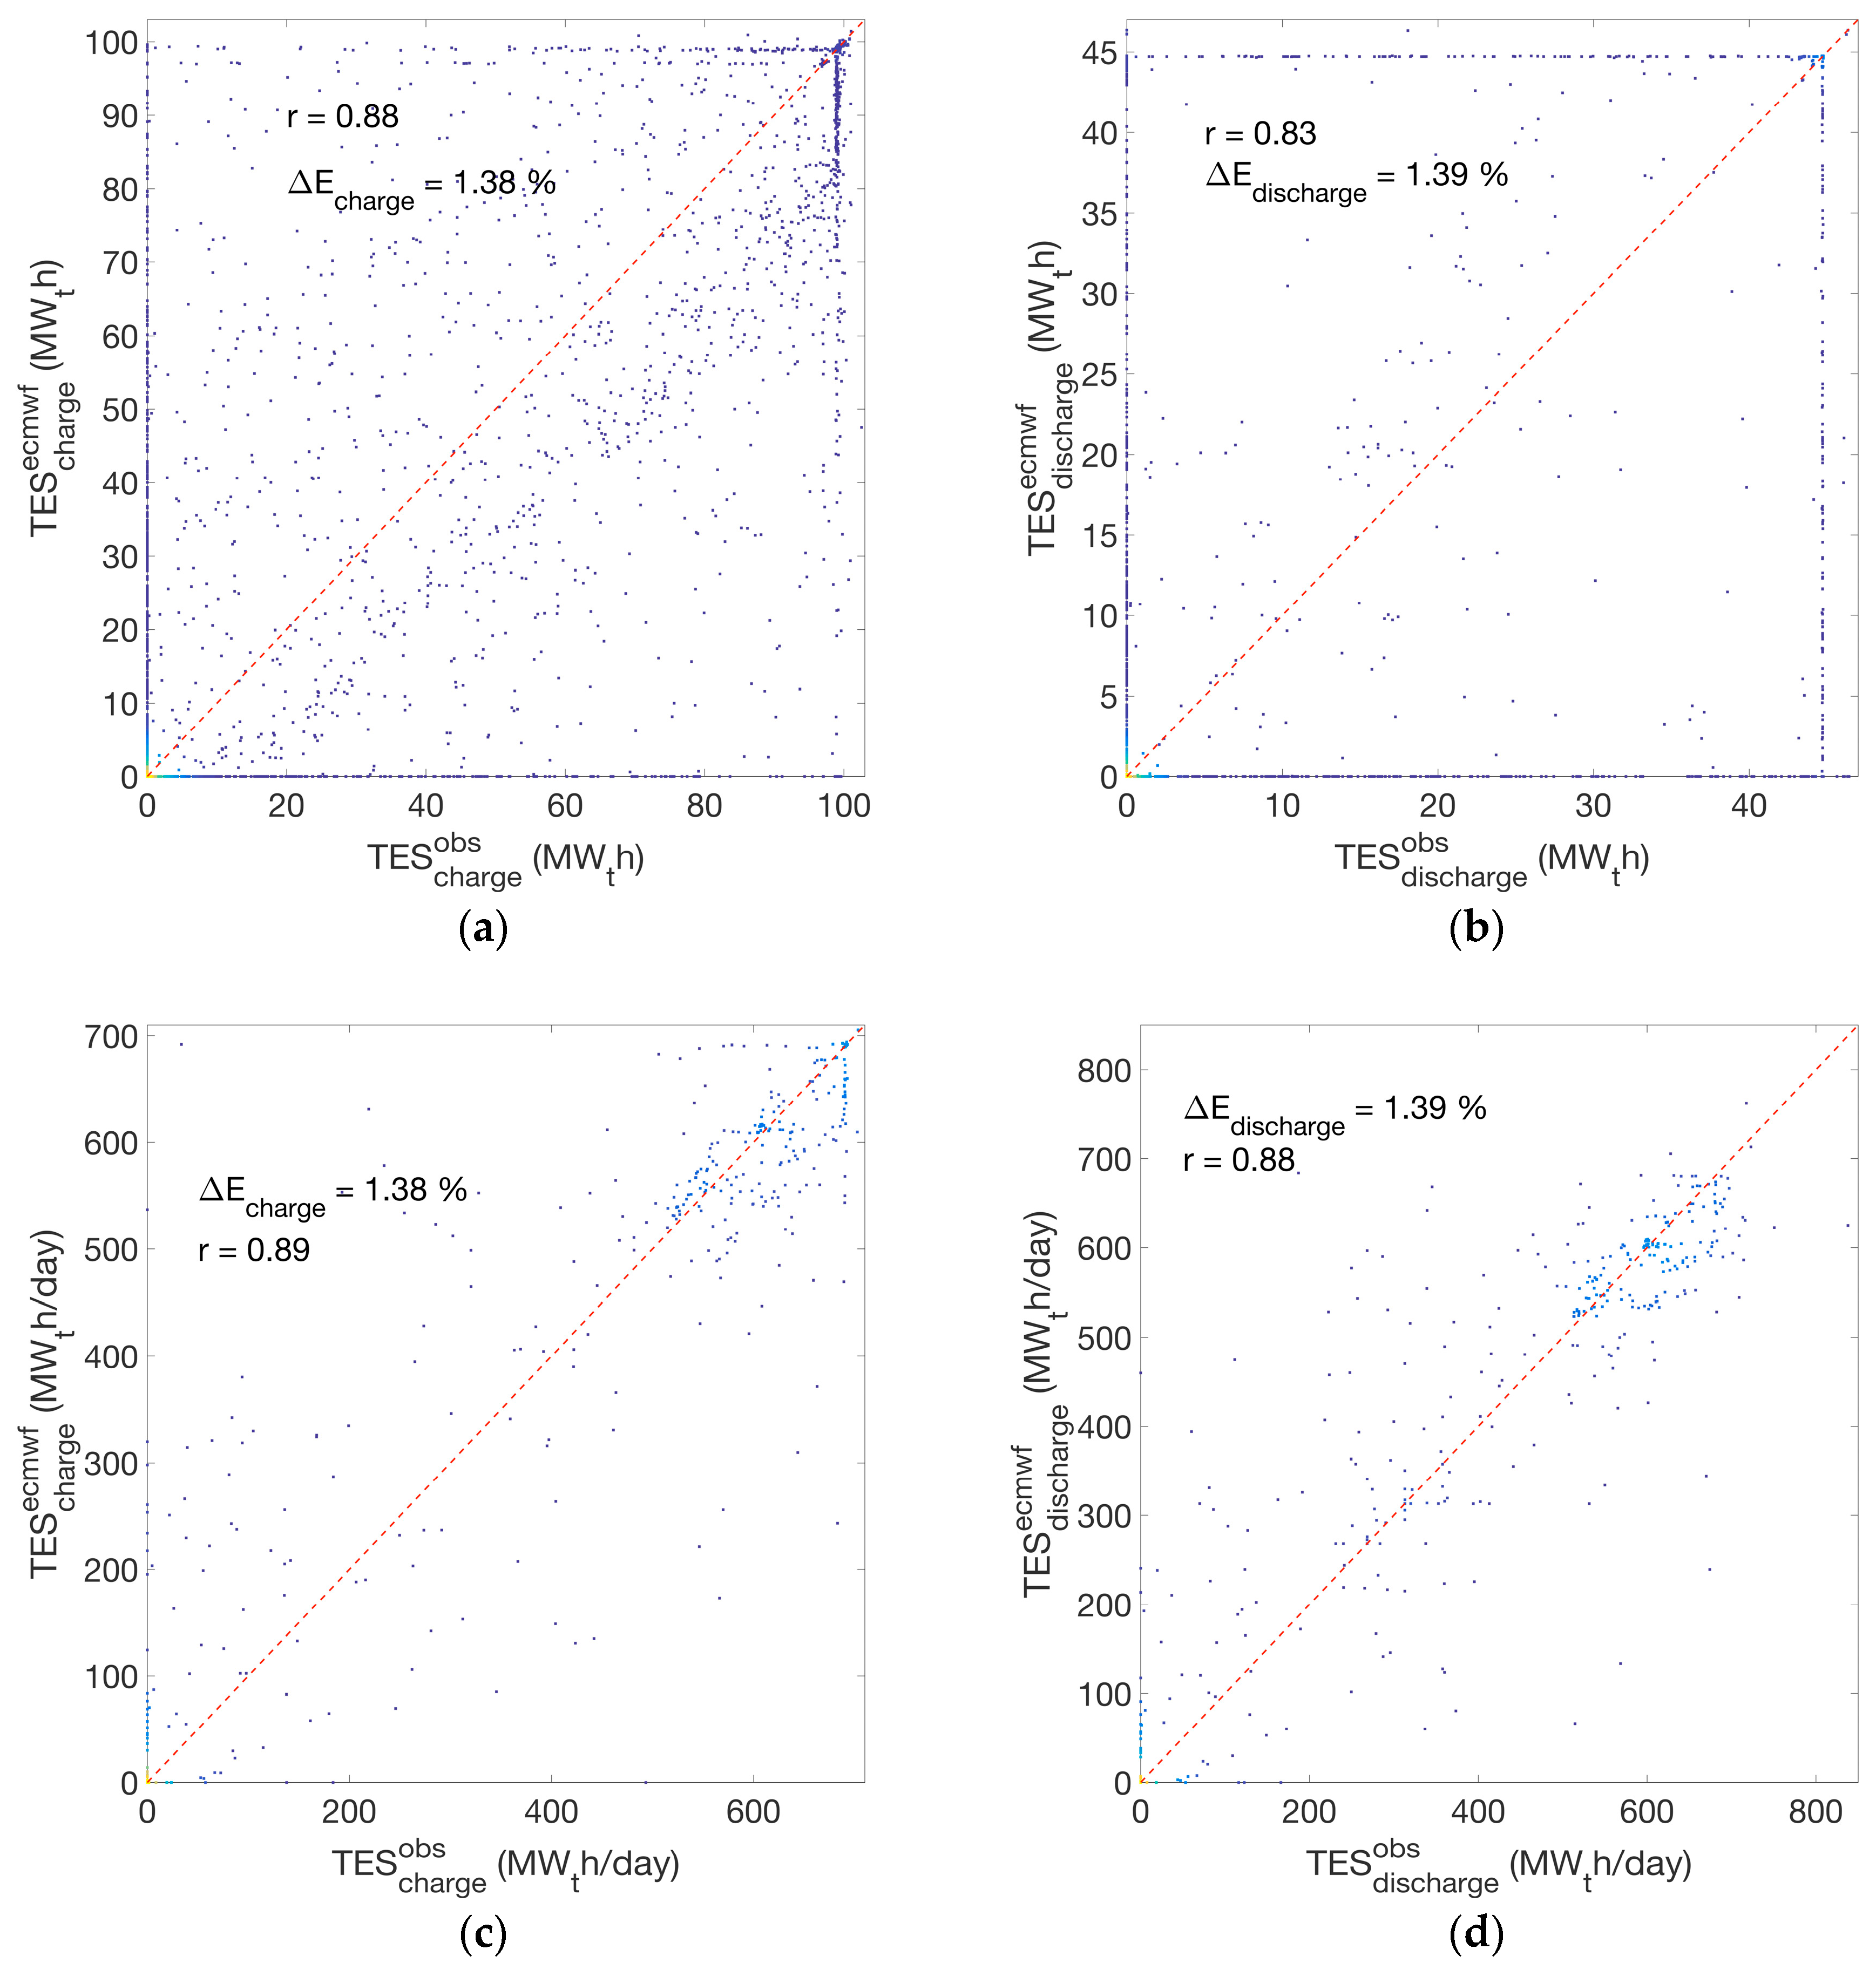
The charge and discharge powers also showed an overestimation when using the forecasted inputs, in comparison with those obtained when using measurements, although with higher correlations. Simulation results showed annual charge and discharge energies of ≈151,104 MWth/year and ≈148,399 MWth/year, based on measurements, while ≈153,187 MWth/year and ≈150,465 MWth/year were obtained for the forecast-based outputs. Although the discharge energy had a lower r than the charge-hourly values (≈0.83), it was shown to possess less deviations between the measured and forecasted outputs.
A closer look at the hourly outputs generated by the SAM, based on the forecasted and measured DNI values, was presented in the scatter plots of Figure 2a, and Figure 3a,b, respectively, for the EP and TES charge and discharge energies. In these plots, the red dashed line represents the identity line (y = x), in which the dots that are closer to the line depict higher correlations than the ones that deviate from it. Two green dashed–dotted lines (Figure 2a) bound an interval in which the predicted and measured EP values had an absolute error (AE) less than the obtained mean absolute error (MAE) of ≈2.31 MWeh. The total number of hourly values of EP, within the established high and low thresholds corresponded to ≈85.94%.
A few features that were characteristic of CSP systems were observed. Most of the values were centered on the high values of EP, between 18 and 21 MWeh, which took place during periods of clear sky conditions. Outside these limits were the EP values (including negative ones) that corresponded to the non-production hours in which electricity for parasitic power consumption needed to be purchased from the grid. During these periods, deviations between the forecasted and measured EP values occurred, in particular for—EP (obs) > 0 and EP (ecmwf) = 0; EP (obs) = 0 and EP (ecmwf) > 0. During cloudy days with short periods of unobstructed solar beam radiation, predicted and measured EP values also had deviations. If only non-negative hourly values of EP were considered, the correlation between the forecasted and measured values would drop significantly to 0.37, showing the importance that non-production hours have in the correlations, since these periods correspond to shut-down and start-up operations carried out by the power plant. This meant that the predictions have a good correspondence with the measurements, during such periods. The respective probability density function (PDF) in Figure 2b clearly depicted the two observed features, as highlighted by the two peaks—the higher frequency of occurrence around the non-production hours (zero values), particularly by the EP based in measurements; and the high frequency of occurrence for the higher values of EP. Moreover, the hourly TES charge and discharge energies (Figure 3a,b) showed a slight improvement in correlation, for the charge periods (≈0.88), in comparison to the discharge ones (≈0.83), as these correlations were closely linked to the non-production (close to zero) and the high production periods (≈100 MWth). Relative differences of ≈1.38% and ≈1.39% were found for the charge and discharge outputs, respectively. The hourly TES charge values depicted a tendency line (below the identity line), demonstrating that, less storage was gained with the forecasted based output, in comparison to the measured one. This was a consequence of the IFS underestimation towards measurements during days with very clean atmospheric conditions, in which the aerosol concentration was less than that in the prescribed climatology.
Daily values (i.e., calculated through the 24-h sum of each day) yielded higher correlations, as shown by the results in Table 2, despite overestimations from the forecasts, as depicted by the negative mean bias error (MBE) values. An r ≈0.89 was obtained for the daily EP values (Figure 2c), with ≈70.14% of the total number of daily values having an AE below an MAE of ≈46.88 MWeh. The respective daily PDF (Figure 2d) showed the same pattern as that for the hourly results, but with less frequency of occurrence, with two peaks, one for the non-production hours and another for the high values of EP. Correlations of ≈0.89 and ≈0.88 were found between the daily TES charge and discharge energies, based on the measurements and forecasts (Figure 3c,d), respectively.
Since the same dataset (DNI and meteorological variables) from EVO station were used in both, the CR and the PT simulations, the performance of the 24-h predictions from the IFS in the operation of different CSP systems has been depicted in Table 3. The coefficient of variation regarding the RMSE and MAE, i.e., the normalized RMSE and MAE (nRMSE and nMAE, respectively), were obtained for the electric energy to grid outputs, from both Gemasolar and Andasol 3 simulations (EP and EG, respectively). The calculation of both nRMSE and nMAE are given in Equations (A1) and (A2) in Appendix A. The obtained hourly values of EP and EG show that forecasted data in the simulation of the Gemasolar power plant generates higher deviations than the ones obtained from the Andasol 3, with an increase of ≈7.3% for the nRMSE and ≈2.8% for the nMAE. Deviations were lower from the hourly to daily values, showing an increase of ≈2.9% for the nRMSE and ≈0.7% for the nMAE. These results indicated that the PT power plant considered (based on Andasol 3) was less sensitive to the DNI prediction than the CR one (based on Gemasolar). However, it must be taken into account that the considered PT system had less storage than the CR system, resulting in a larger number of non-production hours (i.e., zero values) for both forecasted and measured simulations, contributing to an apparent reduction of differences between them.

4. Operational Strategies for Typical Days

In order to maximize the energy efficiency of CSP plants, it is essential to adopt appropriated operational strategies, in accordance to the different weather scenarios (i.e., clear sky, partly cloudy, and overcast days), which could differently affect the CR power plant performance. For instance, for the CR systems, the advantage of knowing the energy availability for the day-ahead, allowed the operator to estimate the electricity generation in advance and sell it at the premium tariff [37], as an alternative to the fixed tariff option, thus, allowing the operator to have a direct role on the electricity market instead of being subjected to flat-rate prices.
As demonstrated in the previous study regarding solar assessment influence on a linear focus PT power plant operational strategies and production [11], the forecast model was able to generate satisfactory results for the days with clear sky conditions. However, results showed that such forecasts were hindered due to aerosol representation, particularly under very clean atmosphere conditions, in which the forecasts underestimated the DNI, or during overcast conditions, in which the IFS overestimated the DNI. The latter behavior can also be a result of extreme dust events, as shown by [38] and [39]. For cloudy days, the IFS was also reliable in predicting clouds, although temporal and spatial phase errors exist in the current cloud forecasting. For the case of the conventional 50 MWe PT power plant, results have led to three different operational strategies related to specific meteorological scenarios: a clear sky, a partly-cloudy, and an overcast period. An example of the implemented global strategy is to avoid power block start-up and shutdown, allowing to maintain the plant at a nominal power and a maximum efficiency. Another aspect is the possible full state of charge of the storage tank, during the day. In this scenario, the operator is advised to perform a partial charge in the early morning to handle a possible cloud passing over, except for predicted clear sky days, in which production is to be started as soon as possible. For the present case study, the high storage capacity of the CR power plant allows the easing of the operator decision algorithm.

4.1. Clear Sky Days

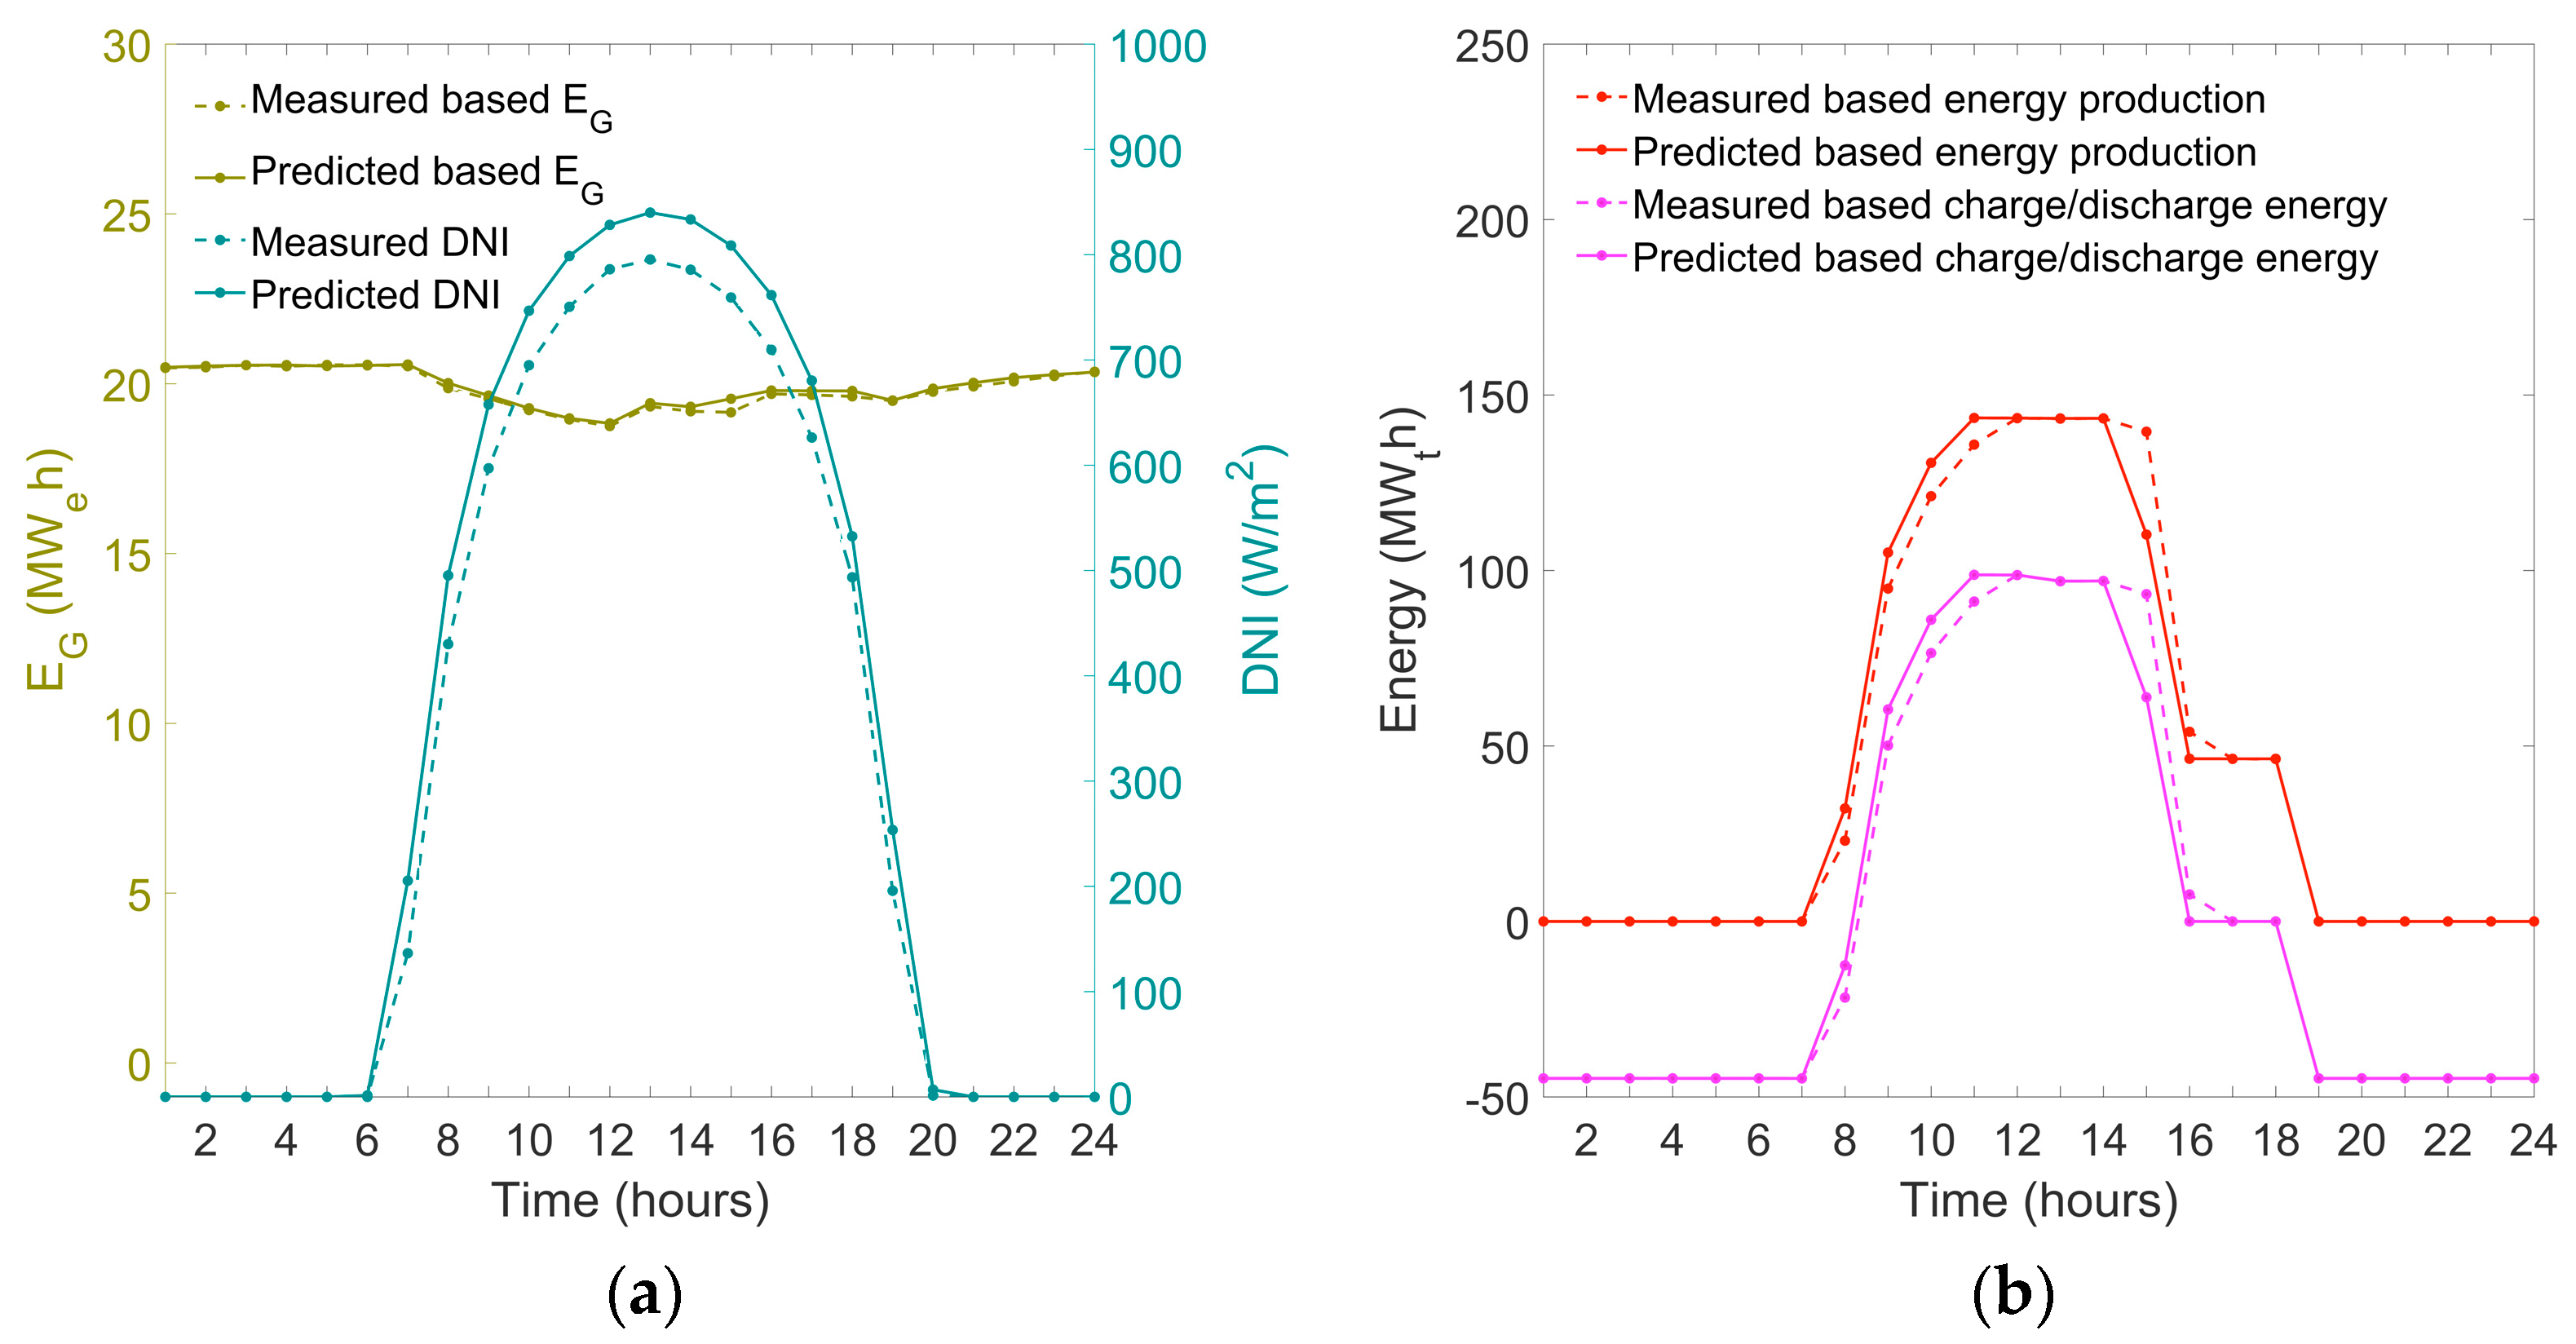
Full charge for a 15-h storage system can only be encountered during days that have very high solar irradiation levels. For such days, the best strategy is to maximize electricity production by starting the power block at the earliest moment. An example of this scenario is shown in Figure 4, where a constant power production is observed, due to the huge storage capacity and higher availability. Here, defocusing of the solar field is also shown, leading to a lower receiver output power after 14 h (production with predicted DNI) or 15 h (production with measured DNI).

4.2. Cloudy Days

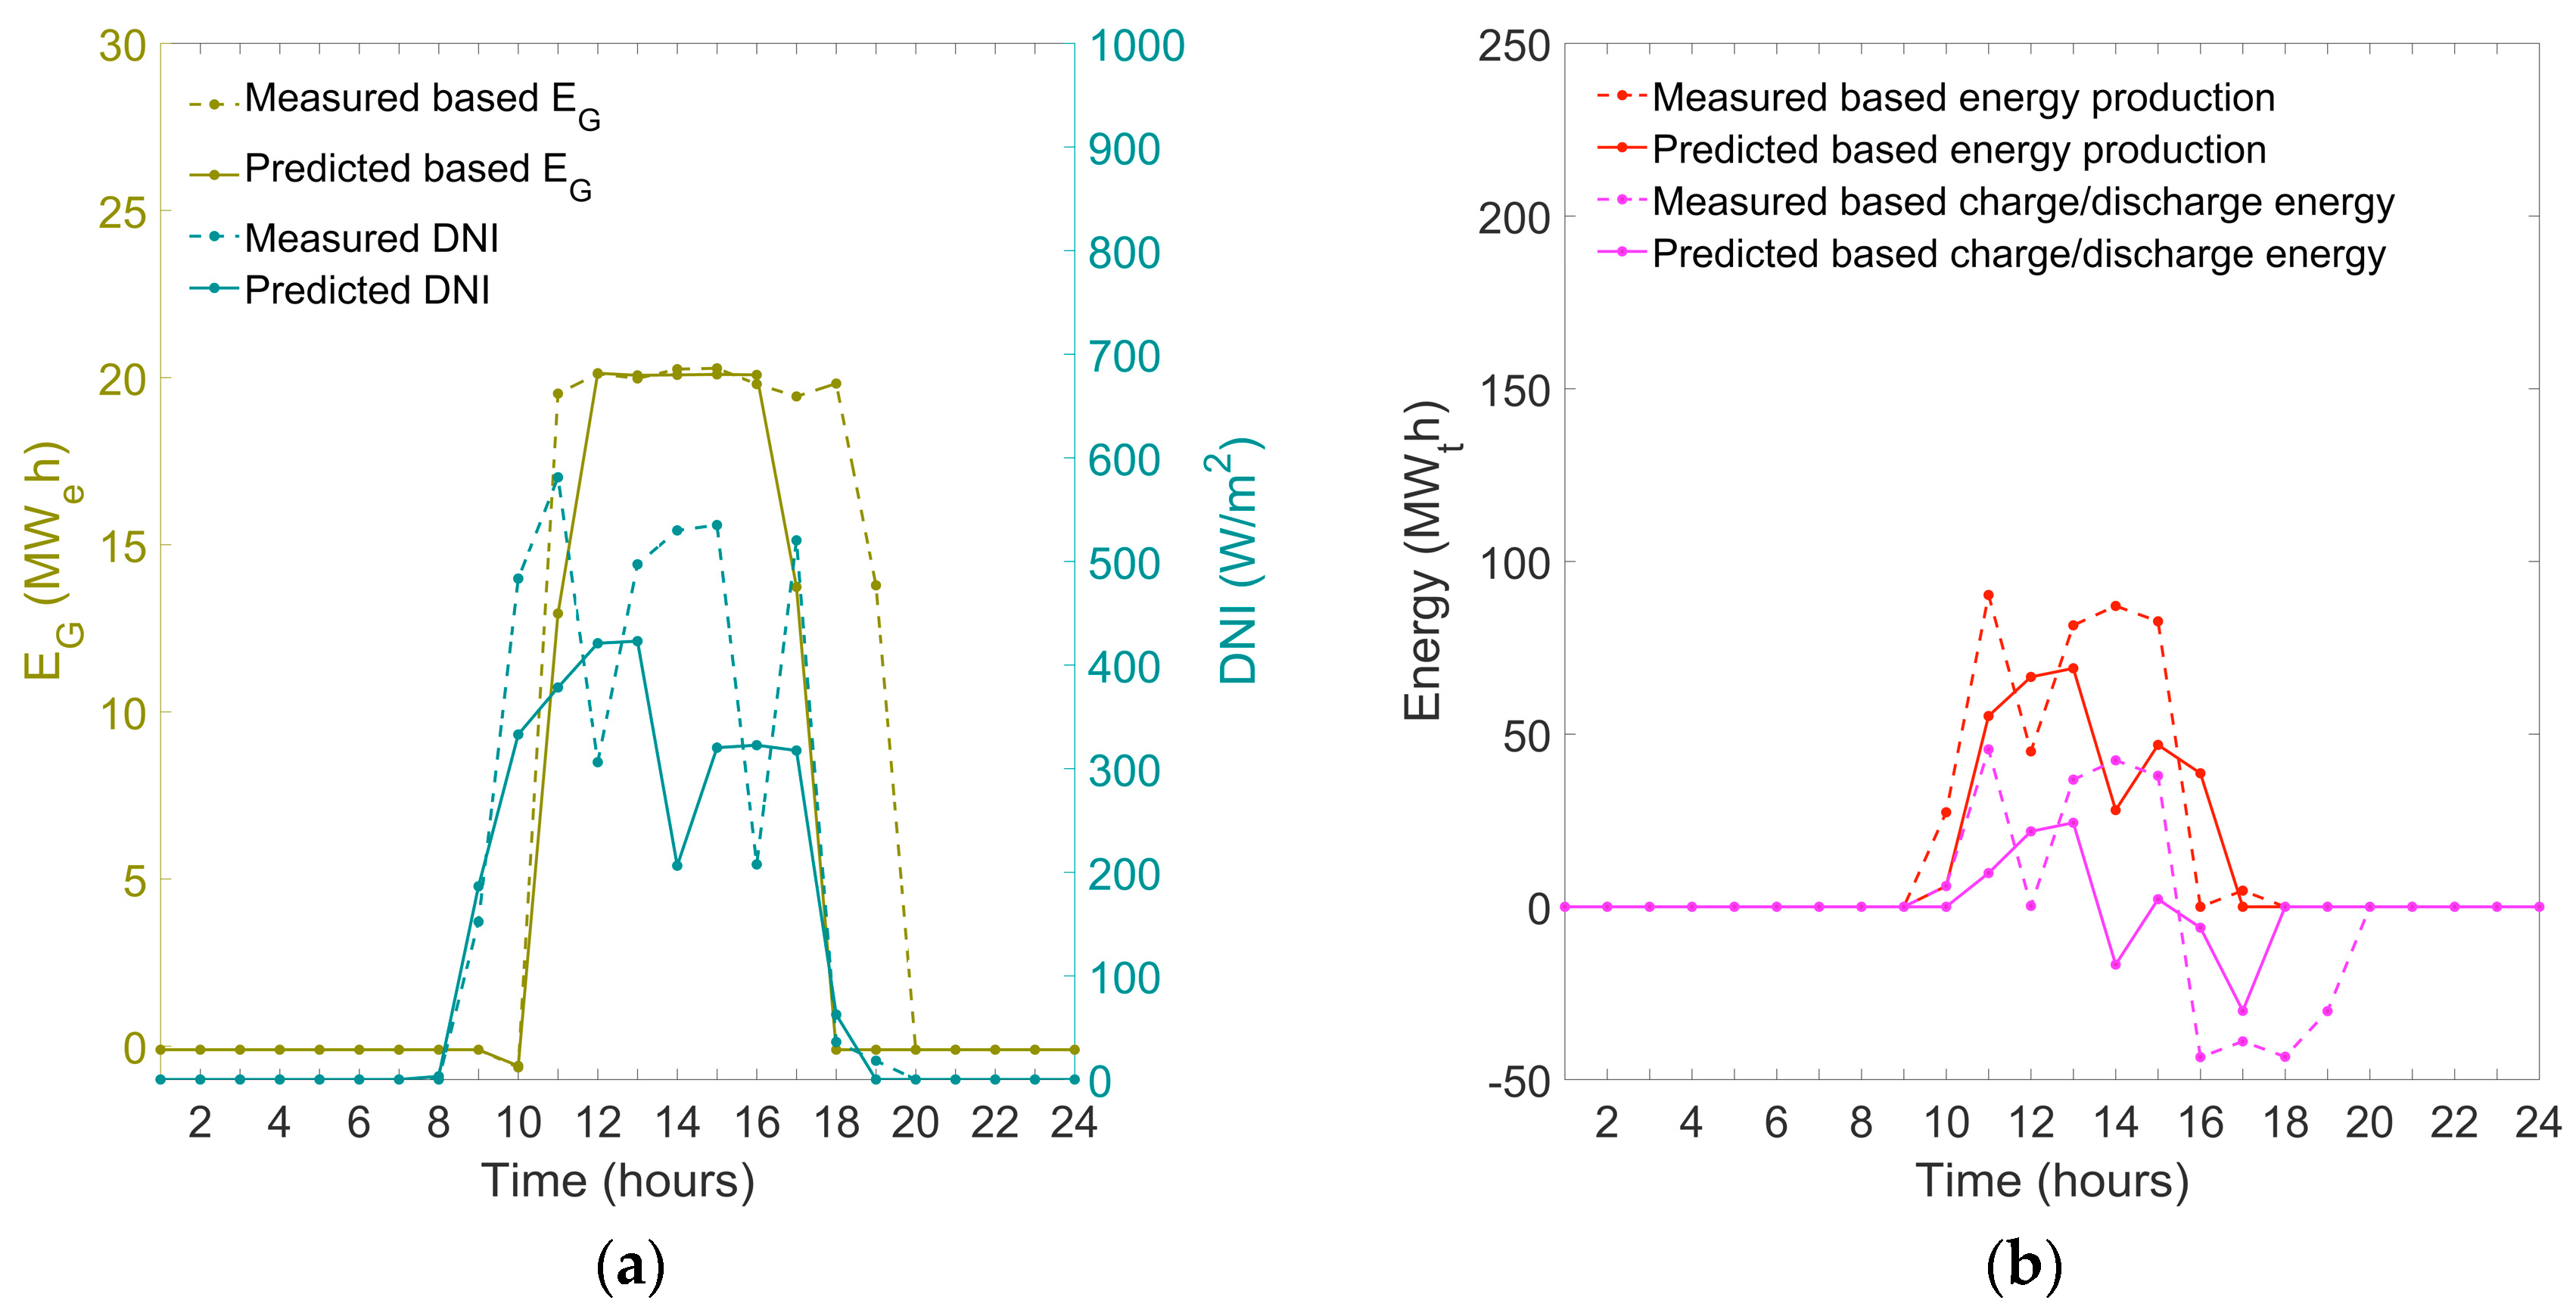
On cloudy days, different types of strategies can be applied—full shifting of the solar production to the evening, constant power generation during the entire day, among others. Since a solar power generation is easily higher than what the power block requires, this leads to a high amount of energy surplus in the system, even during the early morning periods. Under such conditions, in order to increase the safety of the power block continuous production, a small partial charge can be performed in the early morning. This partial charge does not lead to potential defocusing because the available energy is not sufficient to reach a 100% state of charge, during the day. Figure 5 shows an example of such an operation scenario, for a day, with low irradiation levels, because of passing clouds. Since the power block production can be started with a DNI higher than 300 W/m2, a high amount of energy is charged during the morning hours. For the case of observed DNI, it drops to 300 W/m2 after 12 h, due to the presence of clouds, leading to a stop of the charging process. After 16 h, DNI drops below 300 W/m2 because of a second cloud and discharge is performed to maintain electricity production to a constant value.
In this example, the forecast model predicted only one long period of cloud obstruction, during the afternoon, with both forecasted and measured systems responding well, in terms of power production. It should be noted that this type of scenario tends to degrade the correlation between the forecasted and measured EP, particularly under the hourly time scale, although for larger time scales, the differences between both outputs estimates are not so significant.
Other particular strategies can be given for the receiver protection of a CR system regarding thermal stress. For instance, avoiding periodic or sudden strong increases and decreases of the receiver temperature, due to a passing cloud. In such cases, the forecast model is by itself sufficient to warn the power plant operator that variations will take place but with a lower accuracy in the time of occurrence. Nonetheless, the available predicted information is already useful to apply thermal protection strategies on the receiver, or to strategize the energy management of the power plant for one day.

4.3. Overcast Days

For operational purposes, the analysis of a specific day without any, or near null, DNI income is also relevant, simply because when there is no DNI to be collected, then there is no production, consequently the power plant should be running at the lowest power generation possible (or in stand-by mode to keep the equipment warm and the salt in liquid state), depending on the available storage. In that sense, it is important to anticipate such long periods of no production, and the impact that these have on the energy management, and to accordingly implement the necessary strategies. During such periods, and in the case of no available storage, the power plant has negative production values, since the system needs to consume energy, in order to maintain the continuous function of basic equipment. For that reason, in this last section, the success that the IFS has in predicting periods of negative production, using the simulated values, is analyzed. In such a scenario, a dichotomous analysis is performed with the use of a contingency table (Table 4) created to evaluate the forecasts of EP values. Moreover, as described in [40], an equitable threat score (ETS) skill score is calculated through Equations (A3) and (A4) (Appendix A) to measure the fraction of the forecasted and observed EP events that were accurately predicted. The ETS is usually used in the NWP models to evaluate other meteorological variables, such as rainfall [41], since it allows us to equitably compare the obtained scores across different regimes.
Considering together, the daily values of the forecasted or measured production values, it was found that there were 41 days (in a total of 365 days) with partial or complete cloudy (overcast) conditions, i.e., depicting negative production values (consumption). Results showed that the forecast model predicts a total of 16 days of negative production, which coincided with the measurements, following the condition EP (ecmwf) < 0 and EP (obs) < 0, which denominated the ‘Hits’. For cloudy days with short periods of no production, where the model predicted overcast, but that was not observed, i.e., when EP (ecmwf) < 0 and EP (obs) > 0 (which denominated ‘False alarms’), a number of 6 days were found. The opposite occurred when the IFS did not predict overcast which was observed, i.e., when EP (ecmwf) > 0 and EP (obs) < 0 (which denominated ‘Misses’), with a number of 19 days being found in such conditions. The latter was a clear result of the IFS general overestimation, due to cloud representation, as previously discussed in detail [29]. Moreover, the number of days in which the IFS and measurements did not show the occurrence of negative production values was 324, denominated here as the ‘correct rejections’. Thus, the obtained ETS (Equation (A3)) for the occurrence of negative production forecasted by the IFS was ≈36%. Considering such a rate, the power plant operator was advised to not proceed with the electrical energy generation, when the forecast model predicted negative production (EP (ecmwf) <0). In the case of a wrong prediction, if solar energy was available for collection during the day, then production was to be started but without spending any storage. If a success rate of ≈90% was to be found, then the operator would simply be advised not to produce during that day.

5. Conclusions

In this work, it was confirmed that the use of DNI forecasts and the implementation of control strategies could contribute to a more efficient energy management of a CSP plant, improving the local energy distribution from a solar tower system. Hourly and daily correlations of ≈0.78 and ≈0.89, respectively, were found for the SAM predictions of the total electric energy injected into the grid, based on forecasted and measured DNI and meteorological conditions, an important variable for the power plant operator to handle on a daily basis. In the case of the power plant stored thermal energy, charge correlations of ≈0.88 and ≈0.89 were found for the hourly and daily values, respectively, while ≈0.83 and ≈0.88 were found for the hourly and daily discharge values, respectively. Regarding the performance of the forecast model in the simulations of the two different types of CSP plants enforced with the same datasets, results showed higher deviations in the case of a CR system than in the previous simulated PT. Increases of ≈7.3% and ≈2.8% were found, respectively, for the hourly and daily normalized RMSE values of the generated electric energy. To improve the energy efficiency of CR plants, operational strategies have been proposed for the three different scenarios. Although there were still deviations due to the cloud and aerosol representation, the present analysis has shown that the IFS predictions are a valuable tool to be used in the daily energy dispatch operations of a CR power plant, potentially the main type of CSP systems to be used in the future, due to its advantages. With the continuous improvements that the NWP models have demonstrated in recent years, for the prediction of DNI, future versions of the IFS should also demonstrate an enhancement of the predicted production values from a power plant and, consequently, the energy management during solar intermittency periods.

Author Contributions

The concept of this work was made by F.M.L. and H.G.S. The applied methodology was implemented by F.M.L, H.G.S., R.C., R.S., and P.C. The use of the SAM software was carried out by F.M.L. and T.F. Analysis, validation, investigation, resources, data curation, writing, and editing procedures were done by F.M.L. All authors have reviewed the article prior to submission. H.G.S., R.S., and M.C.-P. have supervised this work.

Funding

F.M.L. and R.C. are thankful to the FCT scholarships SFRH/BD/129580/2017 and SRFH/BD/116344/2016, respectively. T.F. acknowledges the New StOrage Latent and sensible Concept for high efficient CSP Plants, the NewSOL (H2020, GA: 720985) project, and H.G.S. at the Integrating National Research Agendas on Solar Heat for Industrial Processes, INSHIP (H2020, GA: 731287) project. Co-funding from the European Union through the European Regional Development Fund was also provided, being included in the COMPETE 2020 (Operational Program Competitiveness and Internationalization), through the ICT (UID/GEO/04683/2013, POCI-01-0145-FEDER-007690), DNI-A (ALT20-03-0145-FEDER-000011), ALOP (ALT20-03-0145-FEDER-000004) projects.

Acknowledgments

Available measured data provided by Afonso Cavaco (Instituto Português de Energia Solar, IPES) and Jorge Neto (Instituto Português do Mar e da Atmosfera, IPMA), as well as the forecasts from the ECMWF, is acknowledged.

Conflicts of Interest

The authors declare no conflict of interest. The funders had no role in the design of the study; in the collection, analyses, or interpretation of data; in the writing of the manuscript, or in the decision to publish the results.

Appendix A

To calculate the normalized error metrics (i.e., the nRMSE and nMAE) of EP (%), the following equations were used:
nRMSE = RMSE/(EPmax − EPmin),
nMAE = MAE/(EPmax − EPmin),
where the RMSE and MAE between measured and forecasted EP was divided by the difference between the maximum and minimum values of the measured EP.
To evaluate the performance of the forecast model in predicting negative production values, the equitable threat score (ETS) could be calculate through:
ETS = (Hits − Hitsrandom)/(Hits + Misses + False alarms − Hitsrandom),
with
Hitsrandom = [(Hits + False alarms) × (Hits + Misses)]/Total,
where ‘Hits’ represents the number of occurrences (i.e., number of days) with forecasted and observed negative EP values, ‘Misses’ represents the number of days in which the forecast model did not predict the EP values when these were actually observed, ‘False alarms’ corresponds to the predicted occurrences of EP values that were not observed. ‘Total’ is the total number of occurrences, which also took into account the number of days of ‘correct rejections’ (i.e., when the forecast model did not predict the EP values that were not actually observed). A perfect forecast (i.e., a perfect score of 1) would be characterized only by ‘Hits’ and ‘correct rejections’, without ‘Misses’ and ‘False alarms’.
A detailed description regarding the input parameters for the SAM software for the simulation of a CSP power plant designed to run a CR system has been given in this section. For the Gemasolar thermosolar plant (Figure A1) case study, the available online information from NREL [36], was complemented with the default SAM inputs characteristic from this type of tower power plant, together with the research carried out by the authors, towards a few parameters that were taken into account, as presented in Table A1.
Figure A1. Schematic of the simulated Gemasolar thermosolar power plant in the SAM. The different components of a central receiver system are depicted. (© System Advisor Model Version 2017.9.5, SAM 2017.9.5).
Energies 12 01368 g0a1
Table A1. Input parameters for the SAM simulation of the Gemasolar thermosolar power plant during one year (from 1 July, 2017 to 30 June, 2018).
General
NameValueReference
Single heliostat net area115.7 m²[42]
Ratio of reflective area0.9642[42]
Field gross collecting area315,000 m22625 heliostats generated by SAM, 2650 according to [42]
Irradiation at design700 W/m2Chosen by authors
HTFSolar Salt[36]
Design loop inlet temperature290 °C[36]
Design loop outlet temperature565 °C[36]
Full load hours of TES15 h[36]
Storage HTF fluidSolar Salt (direct storage)[36]
Receiver
NameValueReference
Tower height140 m[36]
Receiver height10 m[42]
Receiver diameter9 m[42]
Number of panels14Chosen by authors
Tube outer diameter4 × 10−2 mSAM standard value
Minimum receiver turndown fraction0.25SAM standard value
Maximum receiver operation fraction1.2SAM standard value
Receiver startup delay time0.25 hChosen by authors
Estimated receiver heat loss30 kW/m2Calculated by authors (Equation (A5))
Piping length360 mEstimated by authors
Piping heat loss coefficient1000 Wt/mCalculated by authors (Equation (A7))
Power block
NameValueReference
Design gross output19.9 MWe[36]
Gross to net conversion factor1[36]
Rated cycle conversion efficiency0.445Calculated from storage and receiver capacities
Fraction of thermal power needed for standby0.2SAM Standard value
Power block start-up time0.5 hSAM Standard value
Fraction of thermal power for start-up0.5SAM Standard value
Maximum turbine over design operation (ratio)1.05SAM Standard value
Minimum turbine operation (ratio)0.2SAM Standard value
Boiler operating pressure105 bars[43]
Turbine inlet pressure controlFixed-pressureSAM Standard value
Heat losses from the receiver are due to radiation to the environment and convection. The equation of heat losses per square meter of a receiver is, therefore, given by the following equation:
P rec = ϵ rec σ T rec 4 T ext 4 + h conv , ext T rec T ext
Using a receiver temperature (Trec) of 565 °C (or 838.15 K), an external temperature (Text) of 20 °C (or 293.15 K), a receiver emittance (єrec) of 0.88 (input for the SAM), and a convection coefficient (hconv,ext) of 10 W.m−2.K−1, Equation A5 can be solved as:
P rec = 0.88 × 5.67 × 10 8 838.15 4 293.15 4 + 10 × 838.15 293.15 ,
where the Stefan–Boltzman constant (σ = 5.67 × 10⁻⁸) is used. The obtained result can be approximated to 30 kW/m2.
To calculate the heat loss from the pipes, the pipe loss coefficient is written as follows:
P loss , pipe W . m 1 = T f T ext ln r ext , p + e ins r ext , p 2 × π k ins + 1 h ext × 2 × π r ext , p
Assuming a pipe with an internal diameter of 800 mm and an external diameter of 812.8 mm, an external convection coefficient of 15 W/m²·K and 15 cm of insulation (kins = 0.08 W·m−1·K−1), Equation (A7) can be solved as:
P loss , pipe W . m 1 = 565 20 ln 0.4064 + 0.15 0.4064 2 × π × 0.08 + 1 15 × 2 × π × 0.4064 = 837   W . m 1
Since pipe losses should take into account all heat bridges due to sensors, valves, etc., it has been decided to approximate the value to 1000 W·m−1.

References

  1. Mendelshon, M.; Lowder, T.; Canavan, B. Utility-Scale Concentrating Solar Power and Photovoltaics Projects: A Technology Market Overview; Technical report NREL/TP-6A20-51137; NREL U.S. Department of Energy: Washington, DC, USA, 2012.
  2. Kearney, D.; Kelly, B.; Herrmann, U.; Cable, R.; Pacheco, J.; Mahoney, R.; Price, H.; Blake, D.; Nava, B.; Potrovitza, N. Engineering aspects of a molten salt heat transfer fluid in a trough solar field. Energy 2004, 29, 861–870. [Google Scholar] [CrossRef]
  3. Coimbra, C.; Kleissl, J.; Marquez, R. Overview of solar forecasting methods and a metric for accuracy evaluation. In Solar Resource Assessment and Forecasting; Elsevier: Waltham, MA, USA, 2013; ISBN 9780123971777. [Google Scholar]
  4. Schroedter-Homscheidt, M.; Benedetti, A.; Killius, N. Verification of ECMWF and ECMWF/MACC’s global and direct irradiance forecasts with respect to solar electricity production forecasts. Meteor. Zeitschrift 2017, 26, 1–19. [Google Scholar] [CrossRef]
  5. Stull, R.B. An Introduction to Boundary Layer Meteorology, Chapter 13; Atmospheric Science Programme: Dordrecht, The Netherlands, 1999; ISBN 9027727686. [Google Scholar]
  6. Conceição, R.; Silva, H.G.; Collares-Pereira, M. CSP mirror soiling characterization and modelling. Sol. Energy Mater. Sol. Cells 2018, 185, 233–239. [Google Scholar] [CrossRef]
  7. Tyagi, H.; Agarwal, A.K.; Chakraborty, P.R.; Powar, S. Advances in solar energy research. Energy Environ. Sustain. 2019, 1, 48–50. [Google Scholar]
  8. Troccoli, A.; Morcrette, J.-J. Skill of direct solar radiation predicted by the ECMWF global atmospheric model over Australia. Am. Meteor. Soc. 2014, 53, 2571–2587. [Google Scholar] [CrossRef]
  9. Tompkins, A.M. The Parametrization of Cloud Cover; European Centre for Medium-Range Weather Forecasts (ECMWF): Reading, UK, 2005. [Google Scholar]
  10. Bozzo, A.; Remy, S.; Benedetti, A.; Flemming, J.; Bechtold, P.; Rodwell, M.J.; Morcrette, J.-J. Implementation of a CAMS-Based Aerosol Climatology in the IFS; European Centre for Medium-Range Weather Forecasts (ECMWF): Reading, UK, 2017; Volume 801. [Google Scholar]
  11. Lopes, F.M.; ConceiçÃo, R.; Fasquelle, T.; Silva, H.G.; Salgado, R.; Canhoto, P.; Collares-Pereira, M. ECMWF forecasts of DNI for optimized operation strategies of linear focus parabolic-trough systems. Appl. Energy 2019. In revision. [Google Scholar]
  12. The Parabolic Trough Power Plants Andasol 1 to 3. The Largest Solar Power Plants in the World—Technology Premier in Europe. Solar Millenium AG. 2008. Available online: http://large.stanford.edu/publications/power/references/docs/Andasol1-3engl.pdf (accessed on 28 March 2019).
  13. Rinaldi, F.; Binotti, M.; Giostri, A.; Manzolini, G. Comparison of linear and point focus collectors in solar power plants. Energy Proc. 2014, 49, 1491–1500. [Google Scholar] [CrossRef]
  14. Haiden, T.; Janousek, M.; Bidlot, J.; Ferranti, L.; Prates, F.; Vitart, F.; Bauer, P.; Richardson, D.S. Evaluation of ECMWF Forecasts, Including the 2016 Resolution Upgrade; European Centre for Medium-Range Weather Forecasts (ECMWF): Reading, UK, 2016; Volume 792. [Google Scholar]
  15. Burgaleta, J.; Arias, S.; Ramirez, D. Gemasolar, the first tower thermosolar commercial plant with molten salt storage. In Proceedings of the 17th SolarPACES Conference, Granada, Spain, 20–23 September 2011. [Google Scholar]
  16. Salgado, R.; Miranda, P.M.A.; Lacarrère, P.; Noilhan, J. Boundary layer development and summer circulation in Southern Portugal. Tethys 2015, 12, 33–44. [Google Scholar] [CrossRef]
  17. Cavaco, A.; Silva, H.G.; Canhoto, P.; Osório, T.; Collares-Pereira, M. Progresses in DNI measurements in Southern Portugal. AIP Conf. Proc. 2018, 2033, 1–7. [Google Scholar] [CrossRef]
  18. International Organization for Standardization. Solar Energy. Calibration of Field Pyrheliometers by Comparison to a Reference Pyrheliometer; ISO 9059:1990(E.); International Organization for Standardization: Genève, Switzerland, 1990. [Google Scholar]
  19. Long, C.N.; Dutton, E.G. BSRN Global Network Recommended QC Tests 2002, V2.0. Available online: 10013/epic.38770 (accessed on 20 February 2019).
  20. Mlawer, E.; Clough, S. Shortwave and longwave radiation enhancements in the rapid radiative transfer model. In Proceedings of the 7th Atmospheric Radiation Measurement (ARM) Science team Meeting. U.S. Department of Energy ARM-CONF-970365, San Antonio, TX, USA, 3 March 1997; pp. 409–413. [Google Scholar]
  21. Hogan, R.J.; Bozzo, A. A flexible and efficient radiation scheme for the ECMWF model. J. Adv. Modell. Earth Syst. 2018, 10, 1990–2008. [Google Scholar] [CrossRef]
  22. Lara-Fanego, V.; Ruiz-Arias, J.A.; Pozo-Vázquez, A.D.; Gueymard, C.A.; Tovar-Pescador, J. Evaluation of DNI forecast based on the WRF mesoscale atmospheric model for CPV applications. AIP Conf. Proc. 2012, 1477, 317–322. [Google Scholar]
  23. Voyant, C.; Notton, G. Solar irradiation nowcasting by stochastic persistence: A new parsimonious, simple and efficient forecasting tool. Renew. Sustain. Energy Rev. 2018, 92, 343–352. [Google Scholar] [CrossRef]
  24. Richardson, W.; Krishnaswami, H.; Vega, R.; Cervantes, M. A low cost, edge computing, all-sky imager for cloud tracking and intra-hour irradiance forecasting. Sustainability 2017, 9, 482. [Google Scholar] [CrossRef]
  25. Lauret, P.; Voyant, C.; Soubdhan, T.; David, M.; Poggi, P. A benchmarking of machine learning techniques for solar radiation forecasting in an insular context. Sol. Energy 2015, 112, 446–457. [Google Scholar] [CrossRef]
  26. Aguiar, L.M.; Pereira, B.; Lauret, P.; Díaz, F.; David, M. Combining solar irradiance measurements, satellite-derived data and a numerical weather prediction model to improve intraday solar forecasting. Renew. Energy 2016, 97, 599–610. [Google Scholar] [CrossRef]
  27. Larson, D.P.; Nonnenmacher, L.; Coimbra, C.F.M. Day-ahead forecasting of solar power output from photovoltaic plants in the American Southwest. Renew. Energy 2016, 91, 11–20. [Google Scholar] [CrossRef]
  28. Smagorinsky, J.; Miyakoda, K.; Stickler, R.F. The relative importance of variables in initial conditions for dynamical weather prediction. Tellus 1970, 22, 141–157. [Google Scholar] [CrossRef]
  29. Lopes, F.M.; Silva, H.G.; Salgado, R.; Cavaco, A.; Canhoto, P.; Collares-Pereira, M. Short-term forecasts of GHI and DNI for solar energy systems operation: Assessment of the ECMWF integrated forecasting system in Southern Portugal. Sol. Energy 2018, 170, 14–30. [Google Scholar] [CrossRef]
  30. Martin, G.M.D.; Johnson, D.W.; Spice, A. The measurement and parameterization of effective radius of droplets in warm stratocumulus. J. Atmos. Sci. 1994, 51, 1823–1842. [Google Scholar] [CrossRef]
  31. Sun, Z.; Rikus, L. Parameterization of effective sizes of cirrus-clouds particles and its verification against observations. Q. J. R. Meteorol. Soc. 1999, 125, 3037–3055. [Google Scholar] [CrossRef]
  32. Fu, Q.; Yang, P.; Sun, W.B. An accurate parameterization of the infrared radiative properties of cirrus clouds of climate models. J. Climate Atmos. Sci. 1994, 11, 2223–2237. [Google Scholar] [CrossRef]
  33. Edwards, J.M.; Slingo, A. Studies with a flexible new radiative code: 1. Choosing a configuration for a large-scale model. Q. J. R. Meteorol. Soc. 1996, 122, 689–719. [Google Scholar] [CrossRef]
  34. Tegen, I.; Hollrig, P.; Chin, M.; Fung, I.; Jacob, D.; Penner, J. Contribution of different aerosol species to the global aerosol extinction optical thickness: Estimates from model results. J. Geophys. Res. 1997, 102, 895–915. [Google Scholar] [CrossRef]
  35. Blair, N.; Dobos, A.; Freeman, J.; Neises, T.; Wagner, M.; Ferguson, T.; Gilman, P.; Janzou, S. System Advisor Model, SAM 2014.1.14: General Description; National Renewable Energy Laboratory: Golden, CO, USA, 2014. [CrossRef]
  36. NREL, Concentrating Solar Power Projects-Gemasolar Thermosolar Plant. Available online: https://solarpaces.nrel.gov/gemasolar-thermosolar-plant (accessed on 27 March 2019).
  37. Wittmann, M.; Breitkreuz, H.; Schroedter-Homscheidt, M.; Eck, M. Case studies on the use of solar irradiance forecast for optimized operation strategies of solar thermal power plants. IEEE J. Sel. Top. Appl. Earth Obs. Remote Sens. 2008, 1, 18–27. [Google Scholar] [CrossRef]
  38. Kosmopoulos, P.G.; Kazadzis, S.; Taylor, M.; Athanasopoulou, E.; Speyer, O.; Raptis, P.I.; Amiridis, V. Dust impact on surface solar irradiance assessed with model simulations, satellite observations and ground-based measurements. Atmos. Meas. Tech. 2017, 10, 2435–2453. [Google Scholar] [CrossRef]
  39. Mukkavilli, S.K.; Prasad, A.A.; Taylor, R.A.; Troccoli, A.; Kay, M. Mesoscale simulations of Australian direct normal irradiance, featuring an extreme dust event. Am. Meteorol. Soc. 2018, 57, 493–515. [Google Scholar] [CrossRef]
  40. WWRP/WGNE Joint Group on Forecast Verification Research Website on Forecast Verification. Issues, Methods and FAQ. Available online: http://www.cawcr.gov.au/projects/verification (accessed on 28 March 2019).
  41. Salgado, R. Interacção Solo—Atmosfera em Clima Semi-Árido. Ph.D. Thesis, University of Évora, Évora, Portugal, 2005. [Google Scholar]
  42. Collado, F.; Guallar, J. A review of optimized design layouts for solar power tower plants with campo code. Renew. Sustain. Energy Rev. 2013, 20, 142–154. [Google Scholar] [CrossRef]
  43. SIEMENS. Steam Turbines for CSP Plants. 2011. Available online: http://m.energy.siemens.com (accessed on 28 March 2019).
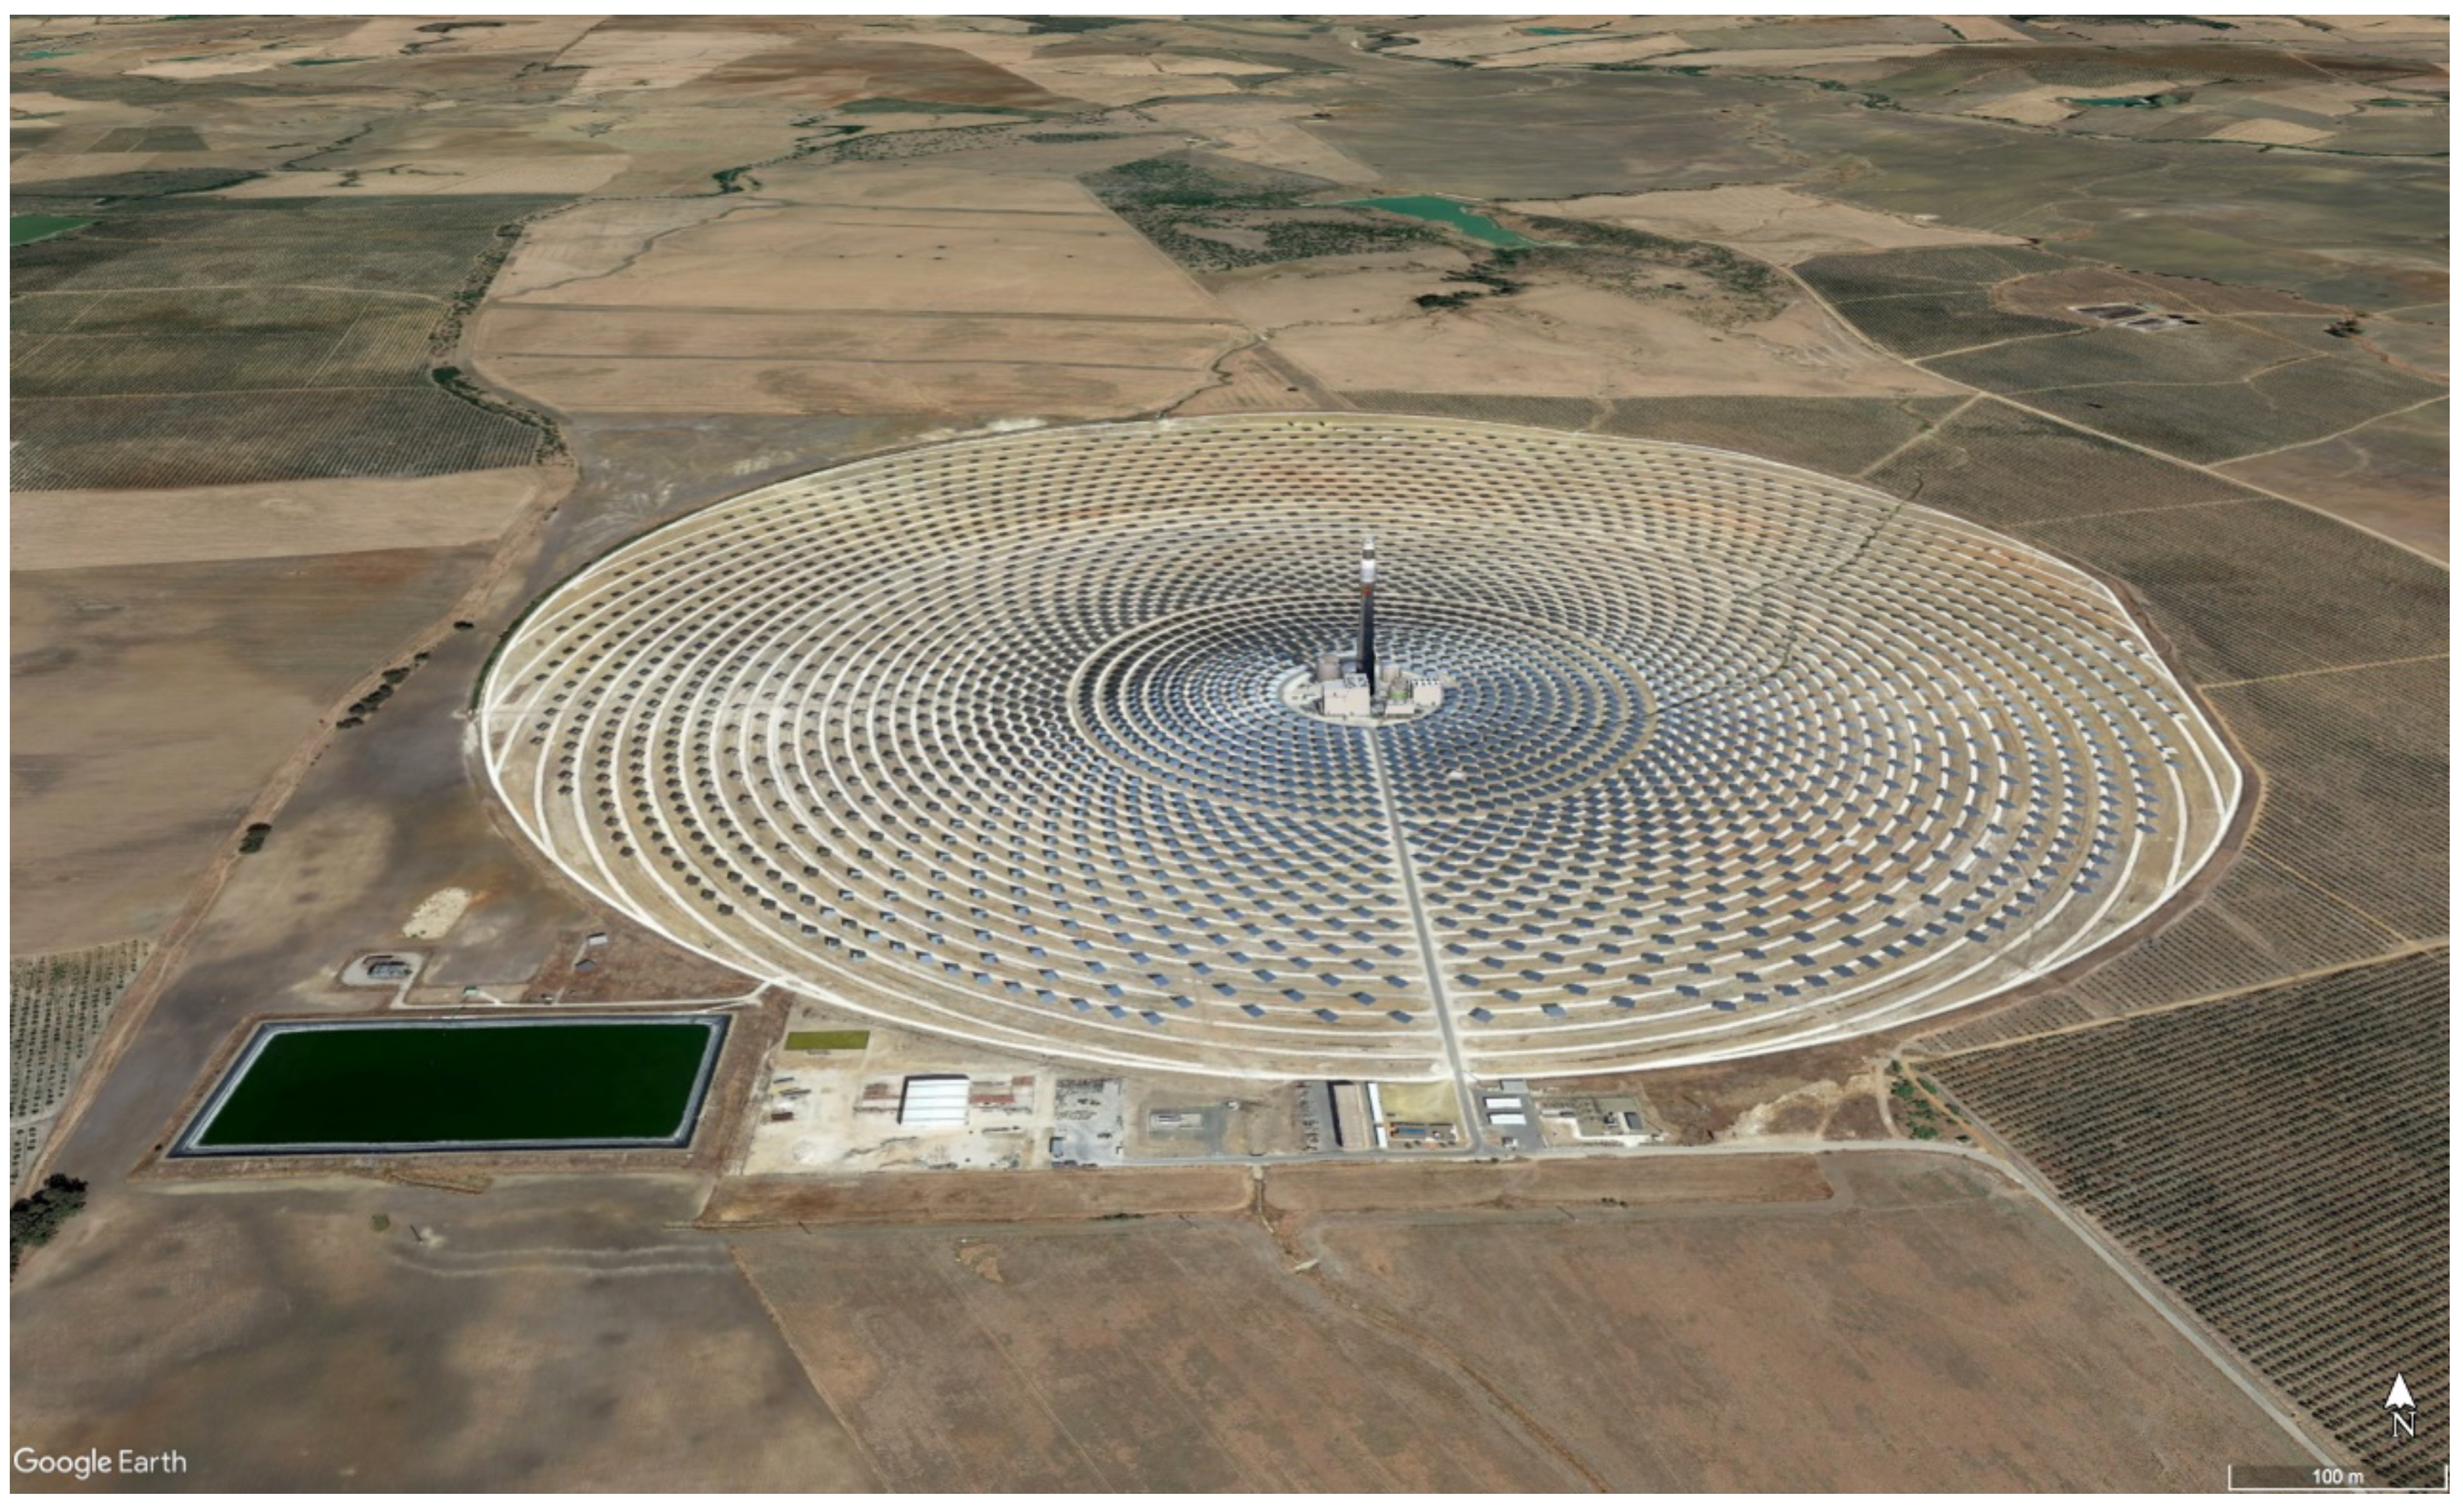
Figure 1. Gemasolar thermosolar power plant located in the province of Sevilla, Spain (37.560613°N, 5.331508°W). All rights reserved (© Google Earth 2019).
Energies 12 01368 g001
Figure 2. Estimated hourly (a, b) and daily (c, d) values of electric energies into the grid, EP (MWeh), and respective probability density functions (PDF), computed from forecasted (ecmwf) and measured (obs) data at Évora. Hourly values of direct normal irradiance (DNI) were used in the SAM to simulate the EP from a central receiver (CR) power plant with configuration similar to the Gemasolar plant (Sevilla, Spain). In the scatter plots, identity lines (red dashed lines), corresponding correlation coefficients, r, and an interval defined by the calculated MAE (≈2.31 MWeh), given by two green dashed–dotted lines, are shown. The period of study corresponds to one year, from 1 July, 2017 to 30 June, 2018.
Energies 12 01368 g002
Figure 3. Estimated hourly values of stored thermal energy into the grid, TES (MWth)—(a) charge and (b) discharge energies, computed from forecasted (ecmwf) and measured (obs) data at Évora, while corresponding daily values are presented in (c) and (d). Hourly values of DNI were used in the SAM to simulate the TES from a CR power plant, with a configuration similar to the Gemasolar plant (Sevilla, Spain). Identity lines (red dashed lines), the corresponding correlation coefficients, r, and relative differences, ∆E, are shown. The period of study corresponded to one year, from 1 July, 2017 to 30 June, 2018.
Energies 12 01368 g003
Figure 4. Comparison between the results of the SAM simulation for 21 August 2017 (prediction of high energy without clouds), with predicted and measured (a) hourly mean DNI (W/m²) values (blue) and produced electrical energy EG (MWeh) values (green); and (b) thermal energy (MWth) of charge/discharge values (purple) and produced solar energy (red).
Energies 12 01368 g004
Figure 5. Comparison between results of the SAM simulation results for 11 January (prediction of low energy with clouds), with predicted and measured (a) hourly mean DNI (W/m²) values (blue) and produced electrical energy EG (MWeh) values (green); and (b) thermal energy (MWth) of charge/discharge values (purple) and produced solar energy (red).
Energies 12 01368 g005
Table 1. Statistical and descriptive analyses for the hourly values of electric energies into the grid, EP (MWeh), and stored thermal energy, TES (MWth), charge and discharge energies based on measurements (obs) and forecasts (ecmwf). The sum of the hourly values (Total) of EP and TES corresponded to one year of data (from 1st July 2017 to 30th June 2018), produced by a central receiver power plant with configuration similar to the Gemasolar thermal power plant (Sevilla province, Spain), simulated through the System Advisor Model (SAM). Hourly statistical error metrics for the correlation coefficient (r), root mean square error (RMSE), and mean absolute error (MAE) are presented.
EnergyTotal obs (MWe,th)Total ecmwf (MWe,th)rRMSE (MWe,th)MAE (MWe,th)
EP115,992121,6680.786.302.31
TES charge 151,104153,1870.8816.465.97
TES discharge 148,399150,4650.8312.324.09
Table 2. Statistical analysis of the daily values (i.e., the sum of each 24-h values) of the estimated electric energy to the grid, EP (MWeh), and stored thermal energy, TES (MWth) charge and discharge energies computed from measurements (obs) and forecasts (ecmwf). Hourly values of EP and TES correspond to one year of data (from 1 July, 2017 to 30 June, 2018) produced by a CR power plant with a configuration similar to the Gemasolar plant (Sevilla, Spain) simulated through the SAM. Daily statistical error metrics such as the correlation coefficient (r), root mean square error (RMSE), mean absolute error (MAE), and mean bias error (MBE) are presented.
EnergyrRMSE (MWe,th)MAE (MWe,th)MBE (MWe,th)
EP0.8979.4346.88−15.55
TES charge0.89119.9674.25−5.70
TES discharge0.88111.6671.37−5.66
Table 3. Hourly and daily values of normalized root mean square error (nRMSE) and mean absolute error (nMAE) for the estimated total electric energy to the grid outputs, obtained from the 19.9 MWe Gemasolar and the 50 MWe Andasol 3 SAM simulations (EP and EG, respectively). The EP and EG simulated values are based on the same hourly dataset (DNI and meteorological data) of forecasted and measured input parameters acquired for Évora, for the same period of study (from 1 July 2017 to 30 June 2018).
Power PlantnRMSE (%)nMAE (%)
HourlyDailyHourlyDaily
Gemasolar28.4815.8810.439.37
Andasol 321.1813.027.658.68
Table 4. Dichotomous analysis for the total number of forecasted (ecmwf) and measured (obs) occurrences and non-occurrences of daily negative electrical production values (EP) for the Gemasolar power plant simulation through the SAM. The obtained EP simulated values were based on hourly DNI and meteorological data (forecasted and measured) input parameters acquired for Évora for the same period of study (from 1 July, 2017 to 30 June, 2018). Four different events of negative EP values occurrences and non-occurrences have been depicted—‘Hits’ (EP (ecmwf) < 0 and EP (obs) < 0), ‘False alarms’ (EP (ecmwf) < 0 and EP (obs) > 0), ‘Misses’ (EP (ecmwf) > 0 and EP (obs) < 0) and the ‘correct rejections’ (EP (ecmwf) > 0 and EP (obs) > 0).
Electrical ProductionEP (obs) < 0EP (obs) > 0
EP (ecmwf) < 0166
EP (ecmwf) > 019324